main report of labour force survey 2002-2003
TRANSCRIPT

NATIONAL STATISTICAL OFFICE OF MONGOLIA
MAIN REPORT OF LABOUR FORCE SURVEY 2002-2003
Survey Report Of
All Four Survey Rounds Conducted During October 2002 – September 2003
Ulaanbaatar 2004

Contents LIST OF TABLES AND GRAPHS iv FOREWORD viii ACKNOWLEDGEMENT xi ABBREVIATION x Chapter 1. Executive Summary
Introduction Structure of the Report Population of Mongolia
Economically Active and Inactive Population Employed Population Seasonality Unemployed Population Usually Active Population Current Economic Activities Non-economic activities Informal Sector Child Activities
Chapter 2. Survey Design and Organization Introduction
Survey Objectives General Objectives Specific Objectives Scope and Coverage of the Survey Survey timing
Survey Design Survey Questionnaire Field Testing of Questionnaire Tabulation Plan Confidentiality of Information Survey Organization
Training of Field Staff Data Collection Data Processing
Chapter 3. Survey Results
Introduction Demographic Characteristics Geographic Distribution of Population Age-Sex Distribution Dependency Ratio Marital Status Household Composition Female Headed Households Education and Training Current School Attendance Literacy
Chapter 4. Current Activities Current Activities of Household Members
Average Number of Hours Engaged in Economic Activities
Current Non-Economic Activities (housekeeping activities) Average Number of Hours Spent on housekeeping activities Fetching Water and Fuel for Household Use
Chapter 5. Labour Supply Labour Supply Labour Supply Estimates Labour Force Participation Rates Age Specific Participation Rates Economically Inactive Population
Chapter 6. Currently Employed Population Employment Quarterly Employment Estimates Industrial Attachment Main Occupation of Currently Employed Population Employment Status Sector of Employment
Occupational Distribution of Employment by Industrial Sector
Secondary Employment Underemployed Population
Chapter 7. Unemployment Unemployed Population Sectoral Distribution Unemployment Rates Age-Sex Distribution of Unemployed Duration of Unemployment Educational Level of the Unemployed Occupational Preferences Steps Taken to Find Work Reasons for Not Seeking Work
Chapter 8 Usual Activity Introduction Age Specific Participation Rates Industrial Distribution Occupational Distribution Unemployed Relationship between Current and Usual Activity Status Child Labour
Chapter 9 Informal Sector Employment Introduction Concept Exclusion of Agricultural Employment

Agricultural and Non-Agricultural Employment Enterprises by Number of Employees Definition of the Informal Sector
Employment Estimate Distribution by Sex and Sector
Occupational Distribution Educational Attainment of Employed
Chapter 10 Child Activities Introduction School Avoidance Economic Activities Non-Economic Activities Child Labour
Occupational Distribution of Child Workers Employment Status Child Labour Estimates based on Usually Active Concept
Chapter 11 Seasonal Variations in Labour Supply and Demand Introduction
Population Economically Active Population Employed Population Unemployed Population
Current Activities Hours Worked
Chapter 12 Sampling Errors of Estimates
Annex 1 Additional Tables Annex 2 Concepts and Definitions Annex 3 Sampling Design and Estimation Annex 4 Survey Questionnaire Annex 5 List of participants of the survey

FOREWORD
There is an increasing demand for reliable data on labour force, employment and
unemployment following the major and rapid changes in living standards and lifestyles as well as
employment of the population in the years of transition to market economy relations in Mongolia.
The existing data sources of annual employment survey based on administration
registration and monthly records of unemployment based on data of employment services are
insufficient to capture comprehensive patterns of employment hence to fully meet the data needs.
As a result, a requirement duly arose to improve the methodology of estimating labour force and
unemployment rate, to conduct a comprehensive national survey on for provision of reliable
information on employment pattern and to regularly update the data of the survey on a quarterly
and annual basis.
In response to this requirement, a national labour force survey was carried out by the
National Statistical Office of Mongolia as one of the main activities of Technical Assistance:
“Improving Social Statistics” with financial and technical support of Asian Development Bank.
And it is our great pleasure to present the main results of this survey which have captured all four
quarters starting from October 2000.
Labour force survey (LFS), the nucleus of social statistical information is a first large scale
survey that has measured the economic activities and employment of the population by two
methods (“current” and “usual status” approaches) in conformity with common concepts and
definitions and methodologies recommended by International Labour Organization. The survey
presents the useful results for state and government organizations, researchers and academia since
it has captured the seasonality over all four quarters and utilized the internationally accepted
methodology.
Labour force survey is especially important in a sense that it elicits comprehensive data on
employment patterns and unemployment and provides new and reliable data sources which are
useful in addressing the pressing issues in the lives of a society and citizens. We believe that the
survey provides the essential information useful not only for partial solution to transition related
problems but also for addressing the core developmental challenges and policy development.
Besides, LFS has made a significant step in identifying the pattern and trend of employment in the
informal sector hence paving the road for further in-depth analysis of issues and consequences
related to the informal sector that duly deserves the attention in Mongolia wherein nomadic and
sedentary lifestyles are co-existent.
LFS is specific in a way that at its early stage, a child activities module was incorporated

to have collected a comprehensive and rich source of data on child economic activities and scope
and pattern of child work and child labour.
Another distinguishing feature of the labour force survey is that it has elicited information
on primary employment and income opportunities and on status of mobilization of human
resources and capital.
The survey offers a wealth of data which has important implications for the updating and
enriching the baseline information of labour statistics, development of labour market, further
improvement of indicators, rationalization of frequency and methodology of the survey as well as
criteria for measuring the efficiency in mobilization of labour force. Therefore, we deeply hope
that data and information of LFS and child activities module will be extremely useful and valuable
for policy and decision makers, administrators, researchers and business people.
P.BYAMBATSEREN
CHAIRMAN OF THE NATIONAL STATISTICAL OFFICE OF MONGOLIA

FOREWORD
According to the Poverty Partnership Agreement signed by the Asian Development Bank
and the Government of Mongolia, “growth in the economy has not reduced the level of poverty,
which is mainly the result of lack of employment and income opportunities”. In view of the policy
and social relevance of employment in Mongolia, the conduct of a labour force survey was
included as one of the principal activities of the Asian Development Bank (ADB) financed TA No.
3684 – Improving Social Statistics that is implemented by the National Statistical Office (NSO) of
Mongolia.
The Labour Force Survey (LFS) 2002-2003 is the first in a series of nationally
representative household based sample surveys on employment conducted in Mongolia. The LFS
was conducted in four quarterly rounds from October 2002 through September 2003 to capture
seasonal variations in labour supply and demand. The questionnaire was designed to elicit data on
labour supply and demand under both currently active and usually active concepts based on a short
reference period of one week before the survey and a long reference period of one year considering
the large proportion of the working population that was engaged in agriculture and livestock
production activities. From the point of view of the sample size of 12,800 households and
sampling design that had provided for the preparation of estimates for nine domains including
Ulaanbaatar, and the urban and rural stratifications of the four geographic regions into which the
country is divided, this survey can be considered as a major statistical undertaking of the NSO in
recent times.
At the design stage of the survey, a module on child activities was added and the survey
was co-sponsored by the International Labour Organization (ILO). ADB appreciates the
contribution of ILO in successfully undertaking the labour force survey. This is an excellent
example of collaboration between ADB and ILO.
I appreciate the dedication and enthusiasm of the staff of the National Statistical Office
both at headquarters and in the regional administration who contributed to the successful
completion of the survey. I wish to place on record my deep appreciation of the cooperation and
assistance extended to me by the Chairman NSO, Mr. P. Byambatseren and his predecessor Ms.
Ch. Davaasuren that had made my task of overseeing the implementation of the technical
assistance both fruitful and pleasant.

My sincere thanks are due to Mr. Raja B. M. Korale, ADB Labour Force Survey and
Sampling Consultant for assisting the NSO in designing the survey including its sampling design,
preparing the draft report of the survey and for training Mongolian statisticians in survey taking. I
am also thankful to Ms. B. Munkhjargal who has served as the Project Coordinator for successfully
and competently liasing with the national staff and the ADB, and for providing administrative
support in executing the survey and the technical assistance project.
It is my pleasure and privilege to write this foreword to the Main Report on the Labour
Force Survey 2002-2003. The findings of the survey were presented at a very well attended
Seminar on 29 July 2004 at the Government House, Ulaanbaatar where representatives from the
government, non-government organizations, international organizations and researchers
participated at which I was also present. The survey findings are especially important now when
the country is giving greater emphasis on employment creation and poverty reduction programmes.
The government policymakers, planners and researchers will find in this report useful data, indices
and indicators on labour supply and demand for planning and programming employment and
analyzing and monitoring poverty in Mongolia.
BISHNU DEV PANT
PRINCIPAL STATISTICIAN DEVELOPMENT INDICATORS AND POLICY RESEARCH DIVISION (ERDI)
ASIAN DEVELOPMENT BANK

ACKNOWLEDGMENT
A 2002-2003 Labour Force Survey with Child Activities Module is a first national survey
that ever conducted in Mongolia which captures all four quarters in order to elicit information on
the seasonality in labour supply and demand. Particularly, the survey aimed at collection of
comprehensive data on employment, underemployment, unemployment and child labour to enable
the estimate of the related indicators by regions, sectors and social and economic categories. The
overall objective of the survey was to build the national capacity for conducting employment and
other household based socio-economic surveys and provide the data to benefit the policy making
and planning for the national development and social welfare.
These large scale surveys are treated as relatively costly and labour as well as time
consuming in the international practice. In the same time these surveys require high expertise and
professional skills. Accordingly, some countries can’t afford these surveys on their own.
It should be mentioned that Mongolia being inadequate in expertise and experience as well
as financial resources was unable to carry out a labour force survey on its onw in spite of its needs
and wishes.
However, Asian Development Bank agreed to this need and extended technical and
financial assistance to conduct a labour force survey in accordance with the international
methodology which was of essential importance in the complicated situation of the transition
period in the country. The survey was completed successfully due to the close cooperation, flexible
coordination and assistance with high expertise and methodology guidance on the side of Asian
Development Bank. Thus, it is my great pleasure to extend my deepest thanks to ADB, ADB
Resident Mission in Mongolia, ADB Principal Statistician Bishnu Dev Pant and ADB Consultant
Raja Korale for their tremendous and timely support and cooperation.
In the meantime I sincerely appreciate International Labour Organization and its
International Programme of Eradication of Child Labour for financial and technical assistance in
conducting a child activities module which was incorporated into LFS.
I would like to emphasize dedication and enthusiasm of LFS working group members who
have borne a major load of work in the successful conduct of the survey, namely, Ms
B.Davaakhuu (Seniour Statistician of PSSD of the NSO) Ms Z.Nansalmaa, Ms N.Doljinsuren, Mr
Ts. Garid, Mr D.Nasandelger, Mr M.Luvsan and Ms B.Munkhjargal (Project Coordinator). My
thanks are due to members of steering committee and members of NSO Chairman’s Council who
have contributed valuable comments and inputs to development of the questionnaire and report of

the survey and to all the staff of the NSO and regional statistical offices and administration who
exerted their devotion and support to data collection and processing stages of the survey.
Finally, I want to thank Mr R,Oidovdanzan, Honoured Economist and Leading Statistician
of Mongolia and Mr Ch.Dagvadorj, PhD in Economics for their input to analysis of the data of the
survey and editing of the report.
With my wish for prosperity of good deeds
P.BYAMBATSEREN
CHAIRMAN OF THE NATIONAL STATISTICAL OFFICE OF MONGOLIA

ABBREVIATIONS
ADB Asian Development Bank
CAM Child Activities Module
DPSDD Data Processing and Software Development Department
ERO Employment Registration Office
ILO International Labour Organizations
ILO/IPEC International Labour Organization’s International Programme
for Eradchication of Child Labour
IMPS Integrated Microcomputer Processing System
LFS Labour Force Survey
LFPR Labour force participation rate
MEBSD Macroeconomic and Business Statistics Department
NGO Non-Governmental Organization
NSO National Statistical Office
SNA System of National Accounting
UN United Nations
PHC Population and Housing Census
PSSD Population and Social Statistics Department PSU Primary Sampling Unit
SSU Secondary Sampling Unit
Survey rounds
1st quarter October-December, 2002
2nd quarter January-March, 2003
3rd quarter April-June, 2003
4th quarter July-September, 2003
List of tables and graphs Page
Table 1. Activity Status of the Population: Quarterly Estimates Table 2. Selected employment indicators-Quarterly Estimates Table 3. Selected unemployment indicators-Quarterly estimates Table 4. Selected employment indicators based on the usually active population
concept-Quarterly estimates Table 5. Number and percentage of persons who had engaged in current
economic activities -Quarterly estimates Table 6. Total number of persons who had engaged in current economic
activities during reference week
Table 7. Total number of persons who had engaged in current non-economic activities during reference week
Table 8. Currently employed population in the informal sector by sector of employment, primary and secondary occupation
Table 9. Allocation of Sample to Strata Table 10. Distribution of Enumeration Areas and Households Surveyed in the
1st Quarter of the Survey: October-December 2002 Table 11. Distribution of Enumeration Areas and Households Surveyed in the
2nd Quarter of the Survey: January - March 2003 Table 12. Distribution of Enumeration Areas and Households Surveyed in the
3rd Quarter of the Survey: April - June 2003
Table 13. Distribution of Enumeration Areas and Households Surveyed in the 4th Quarter of the Survey: July - September 2003
Table 14. Distribution of Enumeration Areas and Households Surveyed in the all 4 Rounds of the Survey: October 2002 - September 2003
Table 15. Total Household Population Table 16. Households that had household members living away from the
household for more than 6 months by sector and region Table 17. Distribution of population enumerated in households by sector and
region Table 18. Distribution of the population by age and sex Table 19. Age dependency ratio by sector and region Table 20. Percentage distribution of the population by marital status, sector and
sex Table 21. Percentage distribution of households by household size Table 22. Distribution of female headed households by household size Table 23. Percentage distribution of educational attainments of the population
aged 15 years and over Table 24. Current school enrolment rates of children aged 07-19 years by sector
and sex Table 25. Adult literacy rates by sector and region Table 26. Adult literacy rates by age and sector Table 27. Number and percentage of persons who had engaged in any current
economic activity during the reference week by sex and sector Table 28. Average number of hours the persons had engaged in current economic

activities during the last 7 days by age, sector and sex Table 29. Number and percentage of persons who had engaged in non-economic
activities in the reference period of 7 days before the survey Table 30. Average number of hours engaged in current non-economic activities
during the last 7 days by age, sex and sector Table 31. Percentage of persons aged 15 years over who performed household
duties grouped by number of hours spent, sex and sector Table 32. Number of persons who fetched water for drinking purposes grouped
by their employment status as employed, unemployed, inactive, age and sex
Table 33. Number of persons who fetched fuel and prepared firewood grouped by their employment status as employed, unemployed, inactive, age and sex
Table 34. Labour Force Status of the Population aged 15 years and over by sector and sex
Table 35. Labour force status of the population aged 15 years and over from recent statistical inquiries
Table 36. Age Specific labour Force Participation Rates of Population aged 15 years and over
Table 37. Age specific labour force participation rates of children aged 5-17 years Table 38. Reasons for being not economically active by sex and by sector of the
population aged 15 years and over Table 39. Currently employed population by sector, region and sex Table 40. Currently employed population by sector, region and sex Table 41. Currently employed population classified by main industry tabulation
categories of main occupation Table 42. Currently employed population classified by major occupation group
of the main occupation Table 43. Currently employed population aged 15 years and over by sector of
employment and region Table 44. Population currently employed by main economic activity tabulation
categories cross classified with major groups of primary occupations Table 45. Employed population classified by major occupation group of the
secondary occupation Table 46. Sectoral and regional distribution of the underemployed population Table 47. Underemployed classified by employment status of the employed
population in their main occupation Table 48. Sectoral and Regional Distribution of the unemployed population by
sex Table 49. The number of unemployed persons and unemployment rate by
sectors, regions and sex Table 50. Age Distribution of Unemployed Table 51. Duration of unemployment by sector and sex Table 52. Unemployed population by the highest grade/level successfully
completed Table 53. Percentage distribution of occupations desired by unemployed persons
by major occupation group Table 54. Steps taken to find employment by unemployed persons Table 55. Main reasons for unemployed persons not seeking work during the 30
days preceding the survey by sector and sex

Table 56. Usually active population aged 15 years and over by sector and sex Table 57. Age Specific participation rates of usually active population aged 15
years and over by sex and sector Table 58. Usually active employed population aged 15 years and over classified
by industry tabulation categories of main occupation Table 59. Usually active employed population aged 15 years and over classified
by major occupation group Table 60. Age specific unemployment rates of usually active population Table 61. Relationship between current and usual activity status of the
population aged 15 years and over Table 62. Activity status of children aged 5-17 years based on currently active
and usually active concepts Table 63. Currently employed agricultural and non-agricultural population aged
15 years and over by sector, region and sex Table 64. Currently employed agricultural and non-agricultural population aged
15 years and over by age and sex Table 65. Currently employed population aged 15 years and over by sector of
employment and number of employees in the enterprise Table 66. Currently employed population aged 15 years and over by sector of
employment and number of employees in the enterprise Table 67. Currently employed population in the informal sector by sector of
employment, primary and secondary occupation Table 68. Occupational distribution of employed in the informal sector by sector
of employment Table 69. Currently employed population aged 15 years and over by sector of
employees in the enterprise and education Table 70. Main reason for not attending school by age and sex Table 71. Number and percentage of persons aged 5-17 who had engaged in
current economic activity during the reference week by sex and sector Table 72. Percentage of persons aged 5-17 years who had engaged in household
economic activities in the reference period of 7 days before the survey Table 73. Labour force status of working children aged 05 - 17 years Table 74. Employment status of child workers aged 5-17 years by sex and sectors Table 75. Employment status of children aged 5-17 years based on currently
active and usually active concepts Table 76. Employment status of children aged 5-17 years based on currently
active and usually active concepts Table 77. Distribution of the population of private households: Quarterly
estimates Table 78. Activity status of the population : Quarterly estimates Table 79. Employment Indicators based on the currently active population :
Quarterly estimates Table 80. Employment indicators based on the usually active population :
Quarterly estimates Table 81. Unemployment condition of the population under the currently active
and usually active concepts : Quarterly estimates Table 82. Number of persons who had engaged in any current economic activity
during the reference week by sex and sector Table 83. Average number of hours engaged in current economic activities by age
and quarter

Table 84. Estimate of Standard error Graph 1 Age distribution of the population, by 1979, 1989 and 2000 PHC and
LFS Graph 2 Percentage distribution of population aged 15 and over that had
engaged in current economic activities, by number of hours spent Graph 3 Quarterly Estimates of Labour Force Participation Rate Graph 4 Labour Force Participation Rate by age and sex Graph 5 Labour Force Participation Rate by age and sector Graph 6 Economically inactive population of 15 years and over classified by
reasons Graph 7 Quarterly Estimates of Employed Population Graph 8 Employment status of the currently employed population in their main
occupation Graph 9 Quarterly Estimates of Unemployment Rates Graph 10 Age and sex specific unemployment rates Graph 11 Main reasons for unemployed persons not seeking work during the last
30 days preceding the survey Graph 12 Relationship between current and usual activity statuses of the
population aged 15 years and over Graph 13 Employees in the informal sector, by sector Graph 14 Education attainment of employed in the informal sector Graph 15 Percentage of employed children aged 5-17 by occupation distribution Graph 16 Quarterly Estimates of Employed by industrial activity Graph 17 Quarterly Estimates of Unemployment Rates Graph 18 Composition of persons who had engaged in current economic activity
during the reference week

& &
&
&
&
&
&
&
&&
&
&
& &
&
&
&
&
&
&
&
&
ª ì í º ãî âü
Äî ðí î ä
Ò º â
Óâ ñ
Õî âä
à î â ü - À ë ò à é
Äî ðí î ãî âü
Õº âñ㺠ë
Ç à â õ àí
Áàÿí õî í ãî ð
Õýí òèé
Äóí ä ã î â ü
Ñ¿õáààòàð
ÁóëãàíÀðõàí ãàé
ª ⺠ðõàí ãàé
Ñýëýí ã ý Á
à ÿ í - ª ë ãèé
à î âüñ¿ì áýð
Óëààí á à à ò àð
Î ðõî í Äàðõ à í
Õ
ÇÁ ª
Á¿ñ¿¿äÁàðóóíÕàí ãàéÇ¿¿íÓëààí áààò à ð Òº â
& Àéì ãèéí ò º â
Ì Î Í ÃÎ Ë ÓËÑÛ Í ÃÀÇÐÛ Í ÇÓÐÀÃ , Á À ÉÐØ ËÀÀÐÌ Î Í ÃÎ Ë ÓËÑÛ Í ÃÀÇÐÛ Í ÇÓÐÀÃ, ÁYÑÝÝÐ

MAIN REPORT OF LABOUR FORCE SURVEY October 2002- September 2003
Chapter 1
EXECUTIVE SUMMARY
Introduction 1.1 Labour Force Survey is the first sample survey undertaken in Mongolia that has produced quarterly estimates of employment and unemployment in the country. 1.2 In order to capture seasonal variations in labour supply and demand a two stage stratified random sampling design was adopted to enable the preparation of estimates for 9 strata comprising the capital city of Ulaanbaatar, and the urban and rural sectors of the 4 geographic regions into which the country is divided. The survey sampled 3,200 households or more than 12000 persons in each quarter that was sufficiently large for the preparation of statistically reliable estimates on key variables based on the data from the 4 quarterly rounds. The questionnaire was designed to capture labour supply and demand under both currently active and usually active concepts based on a short reference period of 1 week before the survey and a long reference period of one year considering the large proportion of the working population that was engaged in agriculture and livestock production activities. 1.3 The survey sampled 12,800 households out of which 12787 responded to the questionnaire, thus achieving a response rate of 99.9%. The sample population enumerated through the survey was 49,948. 1.4 The field work on the survey was conducted between October 2002 and September 2003 in 4 quarterly rounds. The 3 month period from October to December 2002 during which field work was carried out was treated as the 1st quarter; the 2nd and 3rd quarters were conducted in the following 6 months and field work on the 4th and final quarter was undertaken during July to September 2003 Structure of the Report 1.5 The report is structured as follows. Chapter 2 provides a brief description of the survey design and implementation. Chapter 3 gives a summary of the main demographic characteristics of the Mongolian population. Chapter 4 sets out the main findings on current activity of the population based on participation in identified economic and non-economic activities in the 7 day reference period immediately preceding the survey. Chapter 5 focuses on the labour supply with estimates on labour force characteristics based on the currently active population concept that used the week preceding the survey as the short reference period. Chapter 6 examines the employment condition of the population in some detail using industrial, occupational, and employment status distributions, and extent of underemployment and participation in a secondary occupation. Chapter 7 dwells on characteristics of the unemployed population providing disaggregated estimates and summarizes the main findings in some detail. Chapter 8 provides estimates of the usually active and usually inactive population based on the long reference period of 1 year for a comparison with the estimates from the currently active method. Chapter 9 describes the current concepts and definitions used in the measurement of informal sector in
1

some detail and establishes overall and disaggregated estimates of informal employment providing break downs by sector, age, occupational background of persons in informal employment. Chapter 10 provides an overview of the main findings relating to child activities and child labour. Chapter 11 provides an overview of survey results including estimates on key labour force indicators based on the 4 quarterly rounds and examines the seasonal variations in labour supply and demand. Chapter 12 sets out the sampling errors of estimates in respect of a number of national and sub-national level labour force measures. 1.6 The scope and coverage of the survey described in Chapter 2 Survey Design and Implementation and the concepts and definitions provided in Appendix 1 may be consulted in using the estimates provided in the report and in the comparison of survey estimates with those from other sources. Population of Mongolia 1.7 LFS estimated the household population of Mongolia as 2.4 million, including the household population that had resided away from their households for a period in excess of 6 months. The population estimate had excluded the population that resided in institutional households such as boarding houses, hospitals, military barracks, prisons etc. 1.8 30.9% of the population were children aged 0-14 years; 65.3% were between 15-64 years; and 3.8% were aged 65 years and over. The dependency ratio which is defined as the total of the population aged below 15 years and the population aged 65 years and over taken together as a percentage of population aged 15-64 years is 53.3% for Mongolia. 1.9 There were more females than males in Mongolia. The sex ratio which is the number of males for every hundred females was 98.5 for the whole country and 95.8 for urban sector. In the rural sector there were more males and the sex ratio amounted to 101.9. 1.10 Married population constituted 56.2% of the total population aged 15 years and over, never married 33.3% and widowed persons amounted to 6.7%. There were more widowed females than males in Mongolia and in both the urban and rural sectors. 1.11 The number of private households was estimated as 568,800. The average household size was 4.2. The average household size was lower in the urban sector and in Ulaanbaatar compared with four regions. The inclusion of household members who were absent for periods exceeding 6 months increases the regional variation in household size from 3.9 in Ulaanbaatar to 4.8 in the Western Region (see Table 15). 1.12 16.4% of households in Mongolia were female headed. Female headed households had fewer household members. Nearly 1 out of 2 one-person households and about 1 out of 3 two-person households were headed by females. 1.13 545,500 children or 79% of children from a total population of 689,800 in the age group 7-19 years were currently attending school. This school going population was made up of 76.7% male and 81.6% female children in the age group 7-19 years. Female school enrolment rates were higher than that of males in respect of all age groups. In rural areas the male school enrolment was 4 points lower in the age group of 10 and this difference widens further to 14 points at age 16 years. 1.14 97% of adult population( aged 15 years and over) were able to read and write. Males and females had nearly equal adult literacy rates in both urban and rural sectors.
2
Economically Active and Inactive Population 1.15 The labour force or economically active population 15 years and over is estimated as 1.004, 800 comprising 523,500 males (52.1%) and 481,300 females (47.9%). The economically active population or the labour force is made up of employed and unemployed. The labour force had varied only slightly over the 4 quarters which could be due to sampling errors in the estimates. 1.16 The labour force participation rate (LFPR) is defined as the economically active population expressed as the percentage of the population of working age. LFPR for Mongolia which amounted to 65.3% was substantially higher in the rural sector at 76% which declined to 56% in the urban sector. The higher school enrolment rates in the urban areas had depressed the participation rate. 1.17 534,400 or 34.7% of the total population of 1,539,200 aged 15 years and over were not economically active, of whom 227,400 were males and 307,000 were females. There were 207,000 students, 152,000 who had retired from employment; 54,300 who were engaged in housework; 27,000 disabled among the economically, 24,500 who looked after children and 15,300 temporary ailment/sickness, 11,800 not available for work, 5,900 person below working age, 36,600 others.
Table 1 : Activity Status of the Population : Quarterly Estimates All 4 Quarters Quarter 1 Quarter 2 Quarter 3 Quarter 4 Topic/ Item Oct 02- Sep 03 Oct-Dec Jan- Mar Apr-Jun Jul – Sep
Labour Force 15+ 1,004,800 1,002,600 986,800 1,020,000 1,014,100 Male 523,500 527,700 514,500 526,800 525,900 Female 481,300 474,900 472,300 493,200 488,200 LFPR 15+ 65.3 66.6 65.1 64.9 65.0 Male 69.7 72.2 69.4 68.9 68.7 Female 61.1 61.4 60.9 61.0 61.4 LFPR 15+ Urban 56.4 59.9 55.8 55.3 55.1 Rural 76.3 75.1 77.1 76.8 76.8 Economically Inactive 534,400 502,200 529,300 552,400 546,100
1.18 The economically inactive population had ranged from 502,200 in the 1st quarter to 552,400 in the 3rd quarter, partly seasonal changes in labour demand and sampling errors in the estimates had contributed to these variations. 1.19 The high overall activity rates in the rural sector had lowered the currently inactive population to less than half that of the urban sector. Higher LFPR in rural areas can be explained by nomadic household herding lifestyle and relatively lower access to education and training. Currently Employed Population 1.20 The total currently employed population of Mongolia was estimated at 897,100 including 34,600 persons who were temporarily absent from their households. 1.21 This estimate did not include the population that resided in institutional households such as boarding houses, army barracks, hospitals etc. The Census of Population 2000 enumerated the total employed population as 779,100 and the Annual Employment Survey 2003 estimated the
3

number of employed persons as 926,500. These estimates include the institutional population excluded from the LFS. Seasonal Variations 1.22 The estimated employed population had increased from 822,300 in the 1st quarter to 906,000 in the 4th quarter by 83,700. This increase had arisen mainly in the rural sector. The number of employed had increased from 428,600 in the 1st quarter to 510,100 in the 4th quarter.
Table 2: Selected employment indicators-Quarterly Estimates All 4 Quarters Quarter 1 Quarter 2 Quarter 3 Quarter 4 Topic/ Item Oct 02- Sep 03 Oct-Dec Jan- Mar Apr-Jun Jul - Sep
Currently employed 15+ 862,500 822,300 838,700 885,600 906,000 Male 448,900 433,900 435,000 455,900 471,000 Female 413,600 388,400 403,700 429,700 435,000 Urban 392,300 393,700 384,700 393,500 395,900 Rural 470,200 428,600 454,000 492,100 510,100 Employed by Sector Agriculture 402,700 363,300 382,100 424,500 445,400 Production 102,900 106,300 102,800 98,100 104,100 Services 356,900 352,700 353,800 363,000 356,500 Employment Status Paid Employee 338,600 350,000 343,400 339,400 321,800 Employer 5,500 5,400 6,100 5,600 5,000 Own account worker 303,400 271,600 276,100 313,900 350,500 Unpaid Family Worker 215,000 195,300 213,100 226,700 228,700 Secondary occupation Total 23,900 24,700 21,100 24,000 27,200 Male 14,600 14,100 13,400 14,100 17,600 Female 16,300 10,800 13,900 17,800 24,300 Underemployed: Both 58,200 78,500 53,100 58,900 42,400 Male 34,400 46,100 30,700 37,000 23,900 Female 23,800 32,400 22,400 21,900 18,500
Industrial attachment
1.23 Of the total employed 46.7% or 402,700 (of them 216,500 male and 186,200 female) worked in agriculture, hunting and forestry. 1.24 The number of employment in agriculture had increased by 82000 between the first and fourth quarters. Table 2 also shows that there had been no such seasonal variations in employment in production and services sectors. 1.25 392,000 persons or 45.0% of the total employed population were skilled agricultural workers, 12.0% or 103,300 professionals or 3.9% 33,300 legislators, senior officials and managers. 1.26 Of the employed 39.3% were paid employees, 35.0% were own account workers and
24.8% were unpaid family workers. There were more female unpaid family workers (61.3%) in the labour force.
1.27 Only about 3% of the employed population had worked on a second occupation. There had been hardly any seasonal variations in the demand for labour in secondary occupations which had ranged from 21,100 in the 2nd quarter to 27,200 in 4th quarter.Every second person
4

who had a second job were those who had worked in service and skilled agricultural and animal husbandry occupations. 1.28 This profile of persons undertaking multiple jobs shows that at present the demand for work in a secondary occupation is rather limited and any programmes geared for raising the employment incomes of the population should take note of this position. Yet, with labour supply exceeding labour demand, a policy which is targeted at increasing overall employment and income rather than individual based versions. 1.29 The total number of employed who were available for more work or had sought a second occupation amounted to 58,200 persons. Thus, only seven out of 100 employed persons were available for more work and of them 18,000 or 1 out of 3 were paid employees in their main occupation. Unemployed Population 1.30 An estimated 142,300 persons comprising 74,600 males and 67,700 females were unemployed. The unemployment rate from all 4 quarters was 14.2% for both sexes with 14.2% and 14.1% as male and female rates(See Table 3). The unemployment numbered at 164,900 according to 2000 Population and Housing Census with the national average at 17.5%. 1.31 The unemployed population was unevenly distributed with higher incidence of unemployment in urban area. It is 19.3% for male and 18.1% for female in urban areas as against 9.7% and 10.3% for males and females in the rural sector. 1.32 The unemployment rate for both sexes had declined from 18.0% in the 1st quarter to 10.7% in the 4th quarter. The seasonal variations in the demand for labour had contributed to the unemployment rate to vary by quarters.
Table 3: Selected unemployment indicators-Quarterly estimates Topic/ Item All 4
Quarters Quarter 1 Quarter 2 Quarter 3 Quarter 4
Unemployed 15+ 142,300 180,300 148,100 134,400 108,100 Male 74,600 93,800 79,500 70,900 54,900 Female 67,700 86,500 68,600 63,500 53,200Unemployment Rate % 14.2 18.0 15.0 13.2 10.7 Male 14.2 17.8 15.4 13.5 10.4 Female 14.1 18.2 14.5 12.9 10.9 Urban 18.7 22.0 19.4 18.3 15.1 Rural 10.0 14.0 10.8 8.6 6.9
1.33 The age distribution of the unemployed revealed that unemployment is a phenomenon that afflicts primarily persons in youth age groups particularly those who were new entrants to the workforce. 57.4% of the unemployed were in the youth age groups of 15-34 years and as much as 18.4% of the unemployed were concentrated in the 20-24 year age group in which many were new entrants to the work force. 1.34 Nearly 3 out of 5 unemployed persons were those who had been unemployed only for a duration no more than 1 month. But there is a had core of unemployed comprising 22.8% or nearly one fourth of all unemployed who had been unemployed for 3 or more years.
5

1.35 The survey disclosed that unemployment is largely an issue that afflicts educated persons. Only 9% of the unemployed were those with no education or with only a primary level education. Whereas one in twelve unemployed persons had a degree or postgraduate qualifications. 1.36 The occupational preferences of the unemployed persons disclosed through the survey confirm that there is a mismatch between the available opportunities and expectations of the unemployed. Only 4.1% of the unemployed had opted for skilled agricultural and animal husbandry occupations where 47% of the currently employed population worked. The higher educational attainments had raised their aspirations. 1.37 About 1 out of 10 persons had aspirations of securing employment as senior officials,
managers, and professionals. Almost one out of fiver persons were looking for work as service, shop and market sales workers. 61.2% of males sought employment as craft and related trades workers and plant and machinery operators. Thus, the aspirations of the new entrants to the work force would not match with the employment opportunities in the agriculture that arise through retirements and deaths of workers currently in active employment.
Usually Active Population 1.38 In order to obtain more complete information on the labour supply and demand situation in the country, the economic activity status of the population over a long reference period of 12 months based on the usually active population measurement concept was also adopted in the survey. The usually economically active population concept is especially useful where there are large seasonal variations in labour demand and where agriculture and informal sector are domineering in the economy. 1.39 An increase in the economically inactive population through a reduction in the number of employed and unemployed is observed as the distinguishing feature of the employment status distribution under usually active population concept. 1.40 Thus, the participation rate under usually active concept which amounts to 61.2% is lower when compared with 65.3% under the currently active or labour force concept by about 4%. 1.41 The magnitude of the employed which was estimated as 862,500 under the currently active concept had declined marginally to 856,600 while the unemployed population had substantially fallen from 142,300 (14.2%) to 84,900 (9.0%)(See Table 4). 1.42 The number of unemployed had declined from 119,100 in the 1st quarter to 61,900 in the 4th quarter. This estimate of 61,900 in the 4th quarter amounts to only 57% of the unemployed population based on the currently active concept which amounted to 108,100. 1.43 The comparison of the current and usual activity statuses of population shows that the majority of persons had retained the same status under both concepts. For instance, of the unemployed population estimated under the currently active concept as 142,300, the number unemployed under the usually active status is estimated as 73,200 and 10,700 were classified under employed and 58,400 were grouped as economically inactive based on the change in status over the 12 months reference period.
6

Table 4: Selected employment indicators based on the usually active population concept-Quarterly estimates
Topic/ Item All 4 Quarters Quarter 1 Quarter 2 Quarter 3 Quarter 4
Usually Active Population 15+ 941,500 946,300 914,600 959,800 948,900 Employed 856,600 827,200 836,000 877,600 887,000 Unemployed 84,900 119,100 78,600 82,200 61,900 Inactive 597,800 558,500 601,500 612,600 611,300 Usually Active Participation Rate 15+ 61.2 62.9 60.3 61.0 60.8 Male 65.5 68.7 64.1 65.2 64.5 Female 57.0 57.4 56.7 57.1 57.2 Usually Active Unemployment Rate 15+ 9.0 12.6 8.6 8.6 6.5 Male 9.2 12.7 8.6 9.2 6.4 Female 8.8 12.4 8.6 7.9 6.6 Usually Active Employed by Sector Agriculture 396,800 365,100 381,900 416,800 426,900 Production 103,500 108,900 103,300 98,300 103,300 Services 356,300 353,200 350,800 362,500 356,800 Employment Status Paid Employee 340,400 354,200 343,700 338,000 325,900 Employer 8,100 12,200 7,900 7,100 4,900 Own account worker 281,400 232,700 246,400 306,900 339,400 Unpaid Family Worker 226,700 228,100 238,000 225,600 216,800
1.44 The seasonal variations in employment and unemployment are compressed under the usually active concept when compared with the variations observed under the current active concept. Thus, the variation in the number of employed from the 1st quarter to the 4th quarter which amounts to 83,700 under the currently active concept is reduced to 59,800 under the usually active concept while the corresponding values for unemployment are 72,200 and 57,200. Current Economic Activities 1.45 800,500 persons aged 15 years and over had engaged in activities which were designated as work or economic activities in the 7 day reference week before the survey. In the 1st quarter, 748,200 persons had engaged in these activities which number had increased to 761,700 in the 2nd quarter and finally to 856,200 persons in the 4th quarter (See Table 5). Thus, the number engaged in these activities had increased by 108,000 between the winter and summer seasons by 14.4%. 1.46 Wage jobs had not contributed to this increase, and in fact the number engaged in wage jobs had some what declined in the 4th quarter. The self employed persons excluding those engaged in agriculture had shown a modest increase of approximately 12,600 between the 1st and 4th quarters although it’s relative share had decreased marginally. 3
7

Table 5: Number and percentage of persons who had engaged in current economic activities -Quarterly estimates
Q1-4 Q1 Q2 Q3 Q4 Wage job 297,900 309,700 299,500 302,300 279,800 Agricultural activity 385,900 326,100 355,900 420,900 445,600 Self employed 135,000 138,000 119,600 133,700 147,600 All 800,500 748,200 761,700 838,900 856,200 Wage job 37.2 41.4 39.3 36.0 32.7 Agricultural activity 48.2 43.6 46.7 50.2 52.0 Self employed 16.9 18.4 15.7 15.9 17.2 All 100.0 100.0 100.0 100.0 100.0
1.47 The percentage of persons engaged in agriculture had increased by 8.4% from the first quarter to 52.0% in the last quarter. The numerical increase amounts to 119,500. 1.48 The males and females aged 15 years and over had spent 45.7 hours per week on the average on these economic activities. There were only slight variations in the average number of hours worked by those who had engaged in economic activities which ranged from 44.2 hours per week in the 1st quarter to 47.3 hours per week 3rd quarter.
Table 6: Total number of persons who had engaged in current economic activities during reference week
Q1-4 Q1 Q2 Q3 Q4
Number 800,500 748,200 761,700 838,900 856,200 Hours per week 45.7 44.2 45.1 47.3 45.9
1.49 The time spent on work did not vary significantly across the entire age group 20-54 years which ranged from 44.8 hours to 47.8 hours per week. 1.50 Persons in the urban sector had worked about 2 hours more per week than their counterparts in the rural sector. The females had worked on the average 42.3 hours per week. Non-Economic Activities 1.51 An estimated 1.419 million persons or 92% of the population aged 15 years and over had engaged in non-economic activities such as cooking food, cleaning household, looking after children, caring for sick and infirm. Of them 667,800 were males and 751,400 were females. Thus, more women had been engaged in non-economic activities. 1.52 These persons had spent 25 hours per week on the average on housekeeping activities (See
Table 7). While males had spent about 17.5 hours on the average per week, females had spent about 31.8 hours per week on these tasks.
Table 7: Total number of persons who had engaged in current non-economic
activities during reference week Q1-4 Q1 Q2 Q3 Q4
Number 1,419,200 1,379,700 1,399,500 1,442,900 1,451,300 Hours per week 25.0 29.9 25.0 23.5 22.2
8

1.53 The number of persons engaged in non-economic activities had increased from 1,379,700 in the 1st quarter to 1,451,300 in the 4th quarter by 71,600 persons. The number of persons engaged in non-economic activities had increased from the lowest number in winter to the highest number in summer, the number having increased in each quarter from the preceding quarter. 1.54 The average number of hours spent on housekeeping activities had declined from about 29.9 hours per week during winter to about 25 hours in spring and then to about 22.2 hours per week in summer and autumn. Informal Sector 1.55 Of the employed population that worked in private enterprises, partnerships and as self employed there were 125,100 who worked in non-agricultural activities in their primary occupations. Of this number 114,500 worked in enterprises that had no employees or with 1 to 4 employees. 1.56 Similarly, secondary occupations of those who worked in non-agricultural activities as self employed, or in private enterprises and partnerships that had no paid employees or 1-4 employees were extracted. There were 11,500 persons who had secondary occupations that satisfied these conditions. 1.57 Thus, the informal sector consisted of 126,000 work and job opportunities in primary and secondary occupations of which 113,700 were occupations of self employed persons, 11,200 were occupations in private enterprises and 1,100 were occupations in partnerships. Of those working in informal sector 70.9% or 89,300 were in the urban sector and 29.1% or 36,700 were in the rural sector. By sex, 55.2% or 69,600 were male and 44.8% or 56,400 were female. 1.58 56,600 (44.9%) of the employment opportunities in informal sector activities were grouped under service, shop and market sales workers occupational group; 43,900 or 34.8% were under craft and related workers and plant and machinery operators major group. 80% of employment in the informal sector were grouped under these two occupational groups.
Table 8: Currently employed population in the informal sector by sector of employment, primary and secondary occupation
Informal Total Male Female
Number % Number % Number % Total 126,000 100.0 69,500 55.2 56,400 44.8
Primary 114,500 100.0 62,500 54.6 52,000 45.4 Non-Agriculture
Secondary 11,500 100.0 7,100 61.5 4,400 38.5
Primary 10,600 100.0 5,200 49.6 5,400 50.4 Private enterprise Secondary 600 100.0 400 69.0 200 31.0
Primary 900 100.0 400 46.0 500 54.0 Partnership
Secondary 200 100.0 100 49.9 100 50.1
Primary 103,000 100.0 56,900 55.2 46,100 44.8 Self-employed
Secondary 10,700 100.0 6,600 61.3 4,100 38.7
9
1.59 There were 13,500 occupations in which graduates were employed and 17,400 occupations in which persons with technical and diploma level qualifications were employed. And 11,500 had initial vocational education, 46,500 were graduates of complete secondary education schools, 29,200 had incomplete secondary education, 6400 had primary education and 1,500 had not attended schooling or lack education. About 3 out of 10 occupations in the informal sector that were occupied by persons with incomplete secondary or lower educational attainments.
Child Activities 1.60 The survey estimated that there were 679,000 children aged 5-17 years comprising 347,600 males and 331,400 females. Of them 507,200 were enrolled in educational institutions. 1.61 171,200 children aged 5-17 years comprising 94,400 male and 76,800 female children were not attending school. Of them 110,100 or 64.3% had not attended school as they were under-aged. 1.62 24,000 children of schooling age had not attended school as they had to engage in work to supplement household incomes and also to help the family with household chores. A further 8,300 had not attended school because of the cost of school materials, clothing etc. Disability and sickness was the main reason for non-attendance for 8,400 children whereas 14,100 children responded not to have attended schooling because of far distance of school and no interest in studies. 1.63 There were 73,500 children aged 5-17 years who were economically active comprising 44,600 male and 28,900 female children. Of them 10,000 children were in the urban sector and 63,500 were in the rural sector. 1.64 73,500 children who were economically active consisted of 68,600 children who were employed and 4,900 children who were unemployed. 41,900 male and 26,700 female children comprised the employed, hence more males or boys are engaged in work. 1.65 There were 15,300 currently employed children in the age group 5-9 years and another 21,400 child workers were in the age group10-14 years. Furthermore, 31,900 children of 15-17 ages were employed. 1.66 61,700 or 90% of the children who worked had assisted their elders in household economic activities as unpaid family workers. A further 8% had worked as self employed. Thus, the children who had worked had mainly assisted their elders in family or household enterprises. 1.67 Only a small percentage of less than 2% of employed children had worked as paid employees. An estimated 1,154 children of both sexes comprising 575 female and 579 male children had worked as paid employees. There were no children in the age group 05-09 years or 10-14 years who undertook work as paid employees. 1.68 Paid employment appears to be in short supply and in the competition for paid jobs, the likelihood of a significant number of children securing them, is currently not attractive.
10

1.69 90.8% or 62,200 of the employed children comprising 38,000 male and 24,200 female children were engaged in agricultural and animal husbandry occupations. 1.70 About 4.1% of children worked as service and trade workers. 1.71 83.6% or 567,400 of the children aged 5-17 years, comprising 285,500 male and 281,900 female children had engaged in housekeeping activities. Of the children who engaged in household chores 3 out of 4 had spent time on cooking/serving food for household and cleaning house and one out of 5 children had undertaken to shopping. 53.0% of children who helped in housekeeping activities had attended to the tasks of fetching water and 46.7% had engaged in fetching fuel and preparing firewood.
11

Chapter 2
SURVEY DESIGH AND ORGANIZATION
Introduction 2.1 The Labour Force Survey of Mongolia (LFS) with the Child Activities Module (CAM) 2002-2003 is the first in a series of proposed employment surveys in Mongolia. This nationwide large scale sample survey that was conducted by the National Statistical Office (NSO) covered more than 12 thousand households in the country. The survey was planned as a quarterly survey in four rounds to capture the seasonal variations in labour supply and demand with the first quarter of the survey having been conducted in October-December 2002 and the fourth quarter having been completed during July-September 2003. The LFS is the first sample survey on employment to be undertaken in the country, utilizing internationally used concepts and methods of measuring the economically active population.
2.2 LFS would extend the work started through the Census of Population 2000 and sample surveys carried out during the past few years. The survey was primarily aimed at producing data and information needed for employment planning and policy making, monitoring and analyzing employment oriented projects and programmes and in formulating and targeting anti-poverty programmes for the reduction and eventual eradication of poverty in Mongolia. According to the Poverty Partnership Agreement signed by the Asian Development Bank and the Government of Mongolia, “growth in the economy has not reduced the level of poverty, which is mainly the result of lack of employment and income opportunities.” 2.3 In the beginning of the 1990s Mongolia initiated its transformation from a centrally planned to a market oriented economy. The social and economic impact of the political and economic reforms on the people of Mongolia has been sudden and difficult for a society with fairly well-developed social services and infrastructure that was in place which made access to education and health care virtually universal. The impact of economic hardships during the transition has contributed to rising unemployment and declining school enrolment. This together with unstable social safety nets has burdened families and has increasingly led children to work. The government of Mongolia has recognized the problems of unemployment and underemployment, as also of child labour in the country. In this context the conduct of a comprehensive labour force survey including a child activities section was accepted as both timely and essential to fill in data gaps and meet the data needs of planners and administrators.
2.4 Mongolia lacked reliable data on employment and unemployment needed for policy planning, and monitoring employment and the LFS would serve to fill the data gaps. The fact that the estimates on employment and unemployment magnitudes and rates derived from different sources of data produced in the last few years were not comparable and consistent was another consideration. This LFS would he helpful in reducing the gaps in data and providing the detailed data which was collected and estimated by utilizing the standard methodology. The survey data would not only provide useful data for development planning but also for the preparation of the national accounts of Mongolia. The LFS would gather labour force, employment and unemployment data that include among others, age-sex composition, urban and rural sectors, education and training, occupation, industrial attachment and employment status in primary and secondary occupations, under-employment, unemployment, past employment record, and wages and salaries in paid employment. Data from CAM would provide important information on the magnitude, nature and distribution of child labour as well as its determinants and consequences. This should help in identifying the children who are at risk and who require urgent assistance
12

through measures for the protection of working children in the short run and the eventual elimination of the practice in the long run. 2.5 LFS was sponsored by the Asian Development Bank, Manila through the Project TA: 3684 MON: Improving Social Statistics. The International Programme on Elimination of Child Labour of the International Labour Organisation has supported the survey by financing the cost of canvassing the child activities module through the survey. The work on the survey was initiated in March 2002 and a Working Group on LFS was constituted to take responsibility for the organization and supervision of survey operations. Survey Objectives 2.6 The objectives of the LFS could be introduced as general objectives and specific objectives of the survey.
General Objectives 2.7 The principal aim of the survey was to collect important information from urban and rural households on various facets of labour supply and utilization, and data on the employment profile and employment incomes needed for employment planning and policy making for reduction and eventual eradication of poverty in Mongolia. The collection of comprehensive and reliable data needed to produce a wide range of indicators of employment, underemployment and unemployment dimensions and levels of the people in different geographical areas and in different social and economic classes was also an important consideration. A long-term objective of the entire project is to build national capability in Mongolia for conducting employment and other household based socio-economic surveys and for utilizing survey data for planning for national development and social welfare. Specific Objectives: 2.8 Among specific objectives, the following deserve special mention:
1. Obtain data on economic and non-economic activities of persons aged 5 or more years in terms of current activity during the past 7 days, including their labour force status, industrial and occupational attachments, employment status, etc.
2. Compile data on the usual activity status of the population as employed, unemployed, and economically inactive using a long reference period of one year.
3. Obtain data and information on the skills background, prior job experience, duration of unemployment, job and wage expectations of unemployed.
4. Collect information on economic and non-economic activities of children aged 5 to 17 years, including their participation in household chores, age at first employment, employment outside the household, and illness related to work if any.
5. Obtain data on the occupational and industrial composition and employment status of employed population required for national accounts estimation and employment and educational planning.
6. Obtain data on wages and salaries in paid employment.
Scope and Coverage of the Survey 2.9 The scope of the LFS was initially perceived on the basis of data gaps and data needs observed at the time the project was planned. A stand-alone labour force sample survey had not been undertaken previously in Mongolia. The available data on the composition and distribution of the workforce and on employment and unemployment have been assembled from several sources including census type administrative data collection operations, establishment based statistics, social and economic surveys and population censuses, where information on employment and unemployment were also canvassed. Thus, the available statistics were by-
13

products of other inquiries that were undertaken to collect information on other topics. Further, there were wide variations in the unemployment magnitudes and rates that were produced by these inquiries, mainly a result of changes in the concepts and definitions of employment and unemployment used in these surveys. Accordingly, the need for an investigation of employment and unemployment on which major data gaps existed had been a priority area for some time. Further, the diversification of economic activities and increased output from educational and technical training institutions, which had resulted in unemployment and underemployment, had also emerged as issues. Therefore it was considered that the conduct of a labour force survey was essential in the context of rising unemployment and increasing worklessness in the population to elicit information on these different categories to plan employment oriented strategies and programmes. 2.10 The scope of the survey therefore had to be sufficiently wide to meet the objectives mentioned above. The survey was designed to interview a representative national sample of about 12,800 households from Ulaanbaatar and urban and rural areas of 4 regions that was deemed sufficient to collect reliable data on employment and unemployment and child labour. At this level of disaggregation the sample would be sufficient to produce estimates of high levels of precision in respect of selected employment characteristics.
2.11 The proportion engaged in wage employment is not still large and amounts to approximately 40.0% of the work force. The majority is engaged in agriculture and live stock production pursuits and thus, with the use of a long reference period or usual status approach it was aimed to capture comprehensive information on the labour force status of the population and seasonal fluctuations of work availability and supply. For this reason, the LFS used both the current status approach based on the last week preceding the survey and the usual status approach based on the last twelve months preceding the survey were mobilized. 2.12 The survey would gather labour force, employment and unemployment data that include among others age, sex, education and training, occupation, industrial attachment and employment status in primary and secondary occupations, under-employment, past employment record, wages and salaries in paid employment, child labour and child activities. 2.13 The scope of the survey in terms of population coverage was restricted to private households. Accordingly, persons living in collective living quarters, such as hostels, hospitals, boarding houses, army barracks, prisons and religious institutions were excluded. Further, persons who did not have a fixed abode were also excluded. These communal households cannot be treated as the places of usual residence of these persons. The practical problems of constructing frames to include persons who did not have a fixed abode and the difficulties of identifying them, usually result in the exclusion of these categories from the scope of many household surveys.
Survey period 2.14 The survey is a stand alone sample survey that was conducted in four quarters started in October 2002 and ended in September 2003. Accordingly, the first quarter extended from October to December 2002, the second and third quarters covered January-March 2003 and April-June, 2003. Whereas the last or fourth quarter of the survey was in July-September 2003. Since the ADB funded project: Improving Social Statistics was expected to expire on November 2003 in the framework of which the LFS was supported , the data collection started in October 2002 rather than in January 2003. Thus, it should be noted that the survey quarter is different to natural quarters.
14

Survey Design 2.15 The sampling frame derived from the Census of Population 2000 was used in the survey design. The institutional facilities such as hostels, army barracks, boarding houses, etc. were excluded from the frame and a truncated frame comprising ordinary households was prepared. Considering the socio-economic stratification of the main items canvassed through the survey it was considered that Mongolia should be classified into urban, rural and regional stratifications. Accordingly, Mongolia was divided into urban and rural areas and Ulaanbaatar, Central, East, West and Khangai regions. A two stage stratified random sampling design was adopted with baghs (census enumeration areas) as primary sampling units (PSUs) and households as secondary sampling units (SSUs). The frame which had baghs grouped by district and province in effect provided an implicit stratification for the PSUs for the probability proportional to size systematic random sampling procedure adopted in the selection of the PSUs. Considering the socio-economic stratification the sample of baghs and households was allocated as shown in Table 1 below. The details of the sampling design are given in Appendix 3. One fourth of the sample allocated to each stratum was to be taken up for data collection through field visits to the households in each round of the survey. The number of enumeration areas and the number of households surveyed in the 1st, 2nd, 3rd and 4th Rounds of the survey are given in Tables 10-13 and the number of enumeration areas and the number of households surveyed in all 4 rounds of the survey are given in Table 14.
Table 9: Allocation of Sample to Strata
Sector Urban Rural
Total
Sr. No.
Region No. of EA’s
No. of households No. of EA”s No. of
households No. of
villages No. of
households 1. Ulaanbaatar 320 3,200 320 3,200 2. Central 80 800 160 1,600 240 2,400 3. East 80 800 160 1,600 240 2,400 4. West 80 800 160 1,600 240 2,400 5. Khangai 80 800 160 1,600 240 2,400
Total 640 6,400 640 6,400 1,280 12,800 Note: 10 households were to be selected from every sample enumeration area in all strata.
Table 10: Distribution of Enumeration Areas and Households Surveyed in the 1st Quarter of the Survey: October-December 2002
Sector Urban Rural
Total
Sr. No.
Region No. of EA’s
No. of households No. of EA”s No. of
households No. of
villages No. of
households 1. Ulaanbaatar 81 809 81 809 2. Central 20 200 35 347 55 547 3. East 18 178 42 420 60 598 4. West 22 218 39 390 61 608 5. Khangai 22 220 39 390 61 610
Total 163 1,625 155 1,547 318 3,172 Note: 10 households were to be selected from every sample enumeration area in all strata in each Quarter, but due to non-response/ absence of sampled households the enumerated number was less than 10 households in a few enumeration areas.
15

Table 11: Distribution of Enumeration Areas and Households Surveyed in the 2nd Quarter of the Survey: January - March 2003
Sector Urban Rural
Total
Sr. No.
Region No. of EA’s
No. of households No. of EA”s No. of
households No. of
villages No. of
households 1. Ulaanbaatar 81 809 81 809 2. Central 16 158 39 390 55 548 3. East 21 210 40 400 61 610 4. West 16 160 46 458 62 618 5. Khangai 20 200 42 420 62 620
Total 154 1,537 167 1,668 321 3,205
Table 12: Distribution of Enumeration Areas and Households Surveyed in the 3rd Quarter of the Survey: April - June 2003
Sector Urban Rural
Total
Sr. No.
Region No. of EA’s
No. of households No. of EA”s No. of
households No. of
villages No. of
households 1. Ulaanbaatar 80 800 80 800 2. Central 19 190 44 440 63 630 3. East 25 250 36 360 61 610 4. West 18 180 40 400 58 580 5. Khangai 17 170 42 420 59 590
Total 159 1,590 162 1,620 321 3,210
Table 13: Distribution of Enumeration Areas and Households Surveyed in the 4th Quarter of the Survey: July - September 2003
Sector Urban Rural
Total
Sr. No.
Region No. of EA’s
No. of households No. of EA”s No. of
households No. of
villages No. of
households 1. Ulaanbaatar 78 780 78 780 2. Central 21 210 46 460 67 670 3. East 16 160 42 420 58 580 4. West 24 240 35 350 59 590 5. Khangai 19 190 39 390 58 580
Total 158 1,580 162 1,620 320 3,200
Table 14: Distribution of Enumeration Areas and Households Surveyed in the all 4 Rounds of the Survey: October 2002 - September 2003
Sector Urban Rural
Total
Sr. No.
Region No. of EA’s
No. of households No. of EA”s No. of
households No. of
villages No. of
households 1. Ulaanbaatar 320 3198 0 0 320 3198 2. Central 76 758 164 1637 240 2395 3. East 80 798 160 1600 240 2398 4. West 80 798 160 1598 240 2396 5. Khangai 78 780 162 1620 240 2400
Total 634 6,332 646 6,455 1,280 12,787 Note: 10 households were to be selected from every sample enumeration area in all strata in each Quarter, but due to non-response/absence of sampled households the enumerated number was less than 10 households in a few enumeration areas.
16

Survey Questionnaire 2.16 The questionnaire was designed to produce data and information to achieve the objectives, scope and coverage described earlier. In designing a questionnaire, the currently active and usually active concepts were used and child labour and child activities module was integrated as the last section of the questionnaire. The questionnaire was completed by trained interviewers who visited all sampled households to take face to face interviews and collect comprehensive information on the economically active and economically inactive population. A reference period of 7 days preceding the survey was used in the currently active population section of the questionnaire to derive the activity status of the population of working age that was extended to cover children. Considerable attention was paid towards examination and identification of economic activities for an accurate assessment of the economically active population through an inclusion of activities undertaken in a predominantly agricultural subsistence economy.
2.17 Since the animal husbandry plays a dominant role in the economy of Mongolia, a long reference period or the usual status approach of measuring employment with a reference period of 12 months was used in identifying economically active status and recording the employment, unemployment and economically inactive status in the reference period of 12 months preceding the survey.
2.18 ILO/ IPEC had been interested in incorporating a child activities module in the labour force survey and offered to co-finance the cost of the survey. The child activity section was designed to measure the participation of children in economic and non-economic activities within and outside the household and illness and injuries related to work. Accordingly, in this section questions to canvass information on the participation of children aged 5–17 years in household chores, age at first employment outside the household, illnesses and injuries related to work was drafted and included in the questionnaire. Further the age cut off on questions on education and training and economic activity was also lowered to 5 years to enable the collection of comprehensive information on child activities. 2.19 Several drafts of the questionnaires were prepared and internally discussed and revised versions were prepared. The NSO finalized the questionnaire through extensive consultations with Steering Committee, various Ministries of the Government of Mongolia, representatives of trade unions and employers, and international agencies based in Ulaanbaatar. The draft questionnaire was pre-tested twice through field tests and the final version was prepared which is attached(See Annex 4). The following topics and items of information were canvassed through the survey. A. Demographic Characteristics
a. Relationship to household head b. Sex c. Date of birth and age d. School attendance, ever attended, current attendance e. Highest grade/level completed f. Literacy g. Marital status
B. Labour Force Characteristics based on short and long reference periods Current activities performed and time spent on them
a. Participation in identified economic activities during the reference week.
17

b. Total time in hours spent on identified economic activities during the reference week c. Participation in identified non-economic activities during the reference
week. d. Total time spent on activities described in c above. e. Activity status during the last 7 days. f. Primary and secondary occupations under current status. g. Duration of employment in primary and secondary occupations h. Average number of hours spent on primary and secondary occupations under current
status i. Industrial and occupational attachments in primary and secondary occupations j. Employment status in primary and secondary occupations k. Sector of employment of the enterprise l. Average number of hours worked in the primary and secondary occupations m. Number of paid employees in the enterprise in the primary and secondary
occupations n. Earnings from primary and secondary occupations in cash and in kind o. Availability for more work p. Reasons for not working more hours q. Duration of underemployment r. Steps taken to find more work
C. Unemployment s. Availability for work t. Reasons for economically inactive status u. How long had respondent sought work v. Expected kind of work/occupation w. Expected daily wage rate/monthly remuneration x. Whether registered at Employment Registration Office y. Period of registration z. Steps taken to find work aa. Duration of unemployment
D. Usually Active Status bb. Activity status during the last 12 months cc. Primary and secondary occupations during the past 12 months dd. Industrial and occupational attachments in primary and secondary occupations
during the past 12 months ee. Duration of unemployment ff. Steps taken to find work gg. Employment status in primary and secondary occupations hh. Average monthly wages and earnings during the past 12 months from primary and
secondary occupations
E. Past Employment Record a. Occupation, industry and sector in which the respondent last worked b. Duration of employment in last occupation c. Employment status in last occupation d. Last date worked e. Sector to which the industry where the respondent worked belonged
18

f. Main reason for leaving the last job/occupation g. Main source of income support during the period of unemployment
F. Child Activities a. Main types of chores performed in the household. b. Current school attendance. c. Reasons for not attending school full time. d. Participation in any household economic activity. e. Age at which the child first began to work. f. Reasons for participation in economic activity. g. Whether the child had engaged in any work other than in household economic activity and reasons for engaging in such work. h. Whether the child engage in work under supervision by others. i. Whether the child is satisfied with the working conditions. j. Whether the child’s occupation is stressful physically or mentally. k Frequency with which the child had to work during evenings and night. l Whether the child had fallen sick or was injured because of work. m What sickness or injury from work has the child suffered. n. Main items on which the child’s earnings were spent.
o. The number of hours of free time per day available for recreation. Field Testing of Questionnaires 2.20 Before finalizing the survey instruments, two pre-tests of the LFS, questionnaire and instructions for field operations were conducted in April and July 2002 by the WG of the NSO. The results of the pre-tests were discussed with the Working Group and some modifications in the wording and skip instructions were incorporated. The pre-tests were useful in preparing the draft questionnaire that was submitted to the users for their observations. The 2nd field test was conducted after obtaining the observations of the users and incorporating their suggestions. The 2nd test was useful in identifying a number of deficiencies in the questionnaire. The questionnaire was modified on the basis of the findings, modifications related to the wording of questions, changes in skip instructions, changes in response categories and codes.
Tabulation Plan 2.21 A large number of cross tabulations are possible based on the questions that are usually included in a survey questionnaire. The draft tabulation plan of the LFS was prepared at the stage the questionnaire was finalized. A few tables that were needed to check the completeness and reliability of the survey data were also included. In addition, the Working Group also identified additional tables and these two sets constituted the tabulation plan. The users had helped to identify other tabulations of special interest at the stage when the draft survey report of the 1st half of the survey was presented.
Confidentiality of Information 2.22 The survey was conducted under the provisions of the Law on Statistics of Mongolia. Accordingly, all information collected in the survey from sample households was treated as strictly confidential and would be used only for statistical purposes in social and economic planning. Further, the NSO assures that information supplied by any person would not be used against him for taxation, investigation or any other legal purpose. The confidentiality provisions of this law would apply equally to the information supplied to the staff attached to aimag and soum who were engaged by the NSO as survey enumerators and supervisors in data collection and processing. These guarantees and safeguards on confidentiality of information had enabled
19

the NSO to canvass data protecting the rights of the respondents and helped to ensure both improved response and the reliability of the information provided by the households.
Survey Organization 2.23 A Working Group was appointed at the NSO to be responsible for its conduct, and the preparation of the survey design, drafting and testing of questionnaires, preparation of the manual of instructions for field operations, preparation of the sampling design, field testing of questionnaires and training of field staff were undertaken by the Working Group with the assistance of Project Consultants. Day-to-day management, planning, monitoring and all other important matters regarding to smooth implementation of the survey were taken by the ADB Project Coordinator under the overall direction of the Chairman and Vice Chairman. In order to successfully conduct field work it was essential to use staff working at the provincial level as enumerators and supervisors. In addition their services were also needed to check and edit questionnaires and for key entry and verification of data. Training of Field Staff 2.24 Centralized training of field staff was undertaken for the first time in the LFS in any large-scale survey undertaken by the NSO. A comprehensive manual was prepared which embodied detailed instructions on how to admit the questionnaire and conduct the interviews and the concepts and definitions used in the survey were described in the manual. In cooperation with International Consultants, the NSO WG conducted a centralized training for enumerators and supervisors during the 6th October to 13th October, 2002 in Ulaanbaatar. During the training, under the guidance of WG, the enumerators and supervisors field tested the questionnaire in two districts of Ulaanbaatar city: Khan-Uul and Chingeltei. Immediately after the training on data collection, the training on data entry and coding based on IMPS was conducted for data entry persons.
Data Collection 2.25 Trained enumerators and supervisors collected data through face to face interviews from sampled households. The collection of data for the 1st Round of the survey was conducted between October -December 2002. The data collection was conducted on the 2nd Round between January–March 2003 and the 3rd Round during April –June 2003. The data collection on the 4th
and final Round was undertaken during July- September 2003. Considering the workload involved and the time taken to retrieve the completed questionnaires from the field, each interviewer was entrusted with the task of canvassing data from 50 to 60 households in 5 or 6 sampled baghs (EA). As the LFS was designed as a quarterly survey much of the field work on the survey was concentrated in the 2nd month of the quarter. Considering the widespread migration of herdsman in the rural areas, it was decided to visit households 2-3 times. These safeguards made it possible to obtain completed responses from 12,787 sampled households in the all 4 Rounds of the survey. To ensure data quality the LFS and NSO management travelled to 13 aimags and Ulaanbaatar city to monitory the LFS data collection and provide instructions on further proper and due implementation of the survey. The mobilization of NSO staff attached to Provincial Statistical Bureaus had a positive impact as the statistical skills were upgraded through training and exposure to survey methodology including statistical concepts and definitions, classification and coding systems and cartographic work. Data Processing 2.26 The data processing of LFS was organized at two levels. Data editing and validation, computer processing and preparation of tabulations being undertaken centrally at the NSO, while manual editing and coding, key entry and verification were undertaken at the provincial level. Checking the completeness of questionnaires, coding of questionnaires, range edit checks, simple
20

consistency edits and electronic transfer of the keyed in data to the NSO were undertaken at the provincial level. The NSO computer staff were familiar with the IMPS software developed by the US Bureau of the Census and this software had been used both in population census and survey processing. Thus, LFS data entry programmes were prepared using IMPS and for range and consistency checks the CONCOR module was used. After data processing the WG together with the Consultant made statistical analysis on selected indicators, compared some results with the ones of other surveys and census, data consolidation, error corrections etc. were undertaken. The sampling errors of selected estimates were computed using CENVAR module in the IMPS package.
21

Chapter 3 Survey Results
Demographic and Household Characteristics
Introduction 3.1 The results given in the paragraphs that follow are based on all four rounds of the LFS that sampled 12,800 households in 1,280 baghs randomly selected from the whole country where data collection was conducted during the period October 2002 to September 2003 in 4 quarterly rounds. The sampling design provided for sampling 10 households from each sampled enumeration area, and in the four rounds of the survey, 12,787 households had responded to the survey thus achieving a 99.9% response rate. 3.2 LFS is the first sample survey of labour force characteristics undertaken in Mongolia using internationally recommended concepts and definitions. The NSO estimated the indicators and results based on each round, integrated first two rounds and integrated all four rounds. This means that the main report of LFS has been produced as a result of estimating the data and indicators by each round and integrating all four rounds. It contains only the main results of the survey. 3.3 The tables in Annex 1 inserted at the end of the report contain some of the more detailed data of the survey.
Demographic Characteristics 3.4 The LFS elicited data on the basic demographic characteristics of the population including age, sex, household composition, school attendance, educational attainment and marital status. As the survey adopted a two stage stratified random sampling design, the estimates for these demographic characteristics are available separately for the urban and rural sectors, for the capital city of Ulaanbaatar and for the four regions which the country is divided. A sample from all 4 quarters for the survey was considered as adequate to prepare estimates for these different sectors. Thus detailed tables classifying the characteristics by sector and region were prepared based on data from a complete survey. The need to study seasonal variations in important characteristics was a consideration in preparing some detailed tables based on data from quarterly rounds.
Population distribution 3.5 The survey had estimated the total population of Mongolia as 2.403 million including
174,000 persons who had been away from their households for periods exceeding 6 months. This population had resided in 568,800 households. Accordingly the average household size is 4.2 per household. This estimate of the Mongolian population had excluded those that had resided in institutional living quarters such as boarding houses, army barracks, prisons, hospitals, etc. The spatial distribution of population and households by sector and region is presented in Table 15. An estimated 1.256 million or 52.3% of the population had resided in urban areas. The average household size was higher in the rural sector at 4.4 members per household. Nearly 30% of the total households were in Ulaanbaatar but the average household size was lower at 3.9 members per household than the national average. The population was unevenly divided among the regions with only 8.4% of the population residing in the Eastern Region.
22

Table 15: Total Household Population
Sector/ Region Number of Households
Enumerated Population
TemporarilyLiving Away
Total Household Population
Average Household
Size (Number) (%) (Number) (Number) (Number) % Urban 311,000 54.7 1,198,300 57,800 1,256,100 52.3 4.0Rural 257,800 45.3 1,030,500 116,200 1,146,700 47.7 4.4 Central 114,700 20.2 445,300 36,300 481,600 20.0 4.2East 48,500 8.5 173,000 30,000 203,000 8.4 4.2West 97,900 17.2 425,500 40,200 465,700 19.4 4.8Khangai 138,900 24.4 541,800 55,800 597,600 24.9 4.3Ulaanbaatar 168,800 29.7 643,200 11,700 654,900 27.3 3.9
Mongolia 568,800 100.0 2,228,800 174,000 2,402,800 100.0 4.2 3.6 The Census of Population 2000 had enumerated the total population of Mongolia as 2.373 million including those residing in institutional living quarters that was enumerated as 35,855. Thus, according to the Census 2000, the population enumerated in private households had amounted to 2.338 million who had resided in 541,000 private households. The average size of households in the Census 2000 was 4.3 persons per household. The population statistics compiled from administrative sources through aimags had estimated the total population of Mongolia in 2003 at 2.488 million.
3.7 The LFS had excluded the institutional living quarters. The survey also excluded household members who resided away from the household for a period exceeding 6 months. The distribution of the population that had been temporarily residing away from households broken down by sector and region is shown in Table 16. 3.8 Approximately 1 out of 5 households had one or more of their members temporarily residing away from their households.
Table 16: Households that had household members living away from the household for more than 6 months by sector and region
Section/ Region
Number of HH
Number of HH
members
Population who were
living away from HH
Attended school/ training
Employed Other
Urban 36,500 131,400 57,800 32,200 19,100 6,500 Rural 64,600 245,500 116,200 88,800 15,500 11,900 Central 20,800 75,000 36,300 25,000 8,000 3,300 East 15,400 52,000 30,000 21,800 5,400 2,800 West 24,700 106,600 40,200 28,700 5,900 5,600 Khangai 31,600 113,200 55,800 42,200 8,100 5,500 Ulaanbaatar 8,600 30,100 11,700 3,300 7,200 1,200 Mongolia 101,100 376,900 174,000 121,000 34,600 18,400
The inclusion or exclusion of persons who were treated by households as members but who had not resided in the households for durations that exceeded 6 months which amounts to about 7% of the total population have a bearing on the geographical distribution of the population and
23

average household size. The number of persons who were studying in educational and training institutions residing outside their households was estimated at 121,000. And a further 34,600 had been at work residing outside their own households. The survey did not collect information in respect of persons who had resided away from their households for periods exceeding 6 months. Thus, the tables presented in this report are based on the enumerated population that had excluded the persons living in institutional living quarters as well as the population that had resided temporarily away from the households for periods exceeding 6 months. This lowering of the magnitude of the estimated population should be noted in analyzing the survey data. The breakdown of the enumerated population by sector and region is given in Table 17.
Table 17: Distribution of population enumerated in households by sector and region
Number of Households Both Sexes Males Females Sector/Region
Number %
Average Household
Size Number % % % Urban 311,000 54.7 3.9 1,198,300 100,0 48.9 51.1 Rural 257,800 45.3 4.0 1,030,500 100,0 50.5 49.5 Central 114,700 20.2 3.9 445,300 100,0 49.6 50.4 East 48,500 8.5 3.6 173,000 100,0 50.8 49.2 West 97,900 17.2 4.3 425,500 100,0 50.2 49.8 Khangai 138,900 24.4 3.9 541,800 100,0 49.9 50.1 Ulaanbaatar 168,800 29.7 3.8 643,200 100,0 48.7 51.3 Mongolia 568,800 100.0 3.9 2,228,800 100,0 49.6 50.4 Age-Sex Distribution
3.9 The age-sex distribution of the population is shown in Table 18. The percentage of infants and children in the age group 0-14 years was estimated at 30.9% comprising 32.1% male and 29.8% female children. The age distribution of the population by the last three population censuses and LFS is shown in Graph 1. As seen, the major change over the last thirty years has been the stable growth of proportion of working age population of 15-64 years while the decline in the proportion of infants and children of 0-14 years.
Age distribution of the population, by 1979, 1989 and 2000 PHC and LFS Graph 1
44.3 41.935.8
30.9
50.754.1
60.765.3
3.83.54.05.0
0.0
10.0
20.0
30.0
40.0
50.0
60.0
70.0
1979 1989 2000 LFS
% 0-1415-6465 +
The survey had reported the working age population between 15 - 64 years as 65.3% of the total population. As per Table 18, the sex ratio is less than 100 beyond the age group of 20-
24

24(excluding the age group of 60-64). The similar trend was observed in 2000 Population and Housing Census.
Table 18: Distribution of the population by age and sex Both Sexes Male Female Sex RatioAge Group
Number % Number % Number % Number 00 – 04 182,700 8.2 94,100 8.5 88,600 7.9 106.205 – 09 212,100 9.5 109,200 9.9 102,900 9.2 106.110 – 14 294,800 13.2 152,000 13.7 142,800 12.7 106.415 – 19 265,300 11.9 134,700 12.2 130,600 11.6 103.120 – 24 191,500 8.6 96,000 8.7 95,500 8.5 100.525 – 29 178,500 8.0 87,000 7.9 91,500 8.1 95.130 – 34 175,200 7.9 84,100 7.6 91,100 8.1 92.335 – 39 171,000 7.8 79,700 7.2 91,300 8.2 87.340 – 44 161,600 7.2 76,800 6.9 84,800 7.6 90.645 – 49 116,000 5.2 57,000 5.2 59,000 5.2 96.650 – 54 76,600 3.4 35,900 3.2 40,700 3.7 88.255 – 59 58,400 2.6 27,800 2.5 30,600 2.7 90.860- 64 59,700 2.7 31,700 2.9 28,000 2.5 113.265-69 34,200 1.5 16,400 1.5 17,800 1.6 92.170+ 51,200 2.3 23,700 2.1 27,500 2.4 86.2All age groups 2,228,800 100.0 1,106,100 100.0 1,122,700 100.0 98.5
Dependency Ratio
3.10 Dependency ratio is an index that summarizes the age distribution. The dependency ratio, which is defined as the total of the population aged below 15 years and the population aged 65 years and over taken together as a percentage of population aged 15-64 years, is 53.3% for Mongolia. The dependency ratio for urban and rural sectors and for the regions presented in Table 19 shows that this ratio was lowest in Ulaanbaatar at around 44% and highest in the Western Region where it reaches 66.0%. This ratio shows that in the Western Region, for every 66 persons who are too young or too old to work, there are 100 persons in working age groups to support them. As stated earlier, the exclusion of the household population who had been away from home for periods exceeding 6 months had excluded 121,000 young persons who were engaged in education and training which lowered this ratio.
Table 19: Age dependency ratio by sector and region Dependency Ratio Mongolia Urban Rural Central East West Khangai UB
% % % % % % % % Youth Dependency (for 0-14 years) 47.4 42.5 53.6 48.0 45.8 60.0 50.9 37.6Old Age Dependency (for 65+yrs) 5.9 5.9 5.9 6.0 8.0 6.0 4.6 6.2Total Dependency 53.3 48.4 59.5 54.0 53.8 66.0 55.5 43.8
Marital Status 3.11 The question on marital status elicited information to classify persons aged 15 years and over to 6 marital status categories of married, never married, living together, separated, divorced and widowed. Of the population 15 years and over in Mongolia, 56.2% were married 33.3% were
25

never-married and 6.7% were widowed. If marital status is correctly reported, then the number of married males should be nearly equal to the number of married females allowing for some short-term separations. This check revealed that the numbers of married males and females were nearly equal in urban, rural and both sectors confirming that the data on this question has been accurately captured through the survey. The Census of Population 2000 had reported that the percentage of married males and females were 58.5% and 57.1% respectively which are close to the values reported through the survey given in Table 20.
Table 20: Percentage distribution of the population by marital status, sector and sex
Mongolia Urban Rural Both Male Female Male Female Male Female Marital Status
% % % % % % %
Never Married 33.3 36.3 30.4 36.7 31.3 35.9 29.3 Married 56.2 57.4 55.2 55.5 51.8 59.6 59.6 Living together 0.7 0.7 0.7 0.9 0.9 0.4 0.5 Separated 0.9 0.7 1.2 1.0 1.8 0.2 0.4 Divorced 2.2 1.3 2.9 1.9 4.0 0.7 1.5 Widowed 6.7 3.6 9.6 4.0 10.2 3.2 8.7 All statuses (%) 100.0 100.0 100.0 100.0 100.0 100.0 100.0
(Number) 1,539,200 750,800 788,400 408,600 446,500 342,200 341,900 Number Married 865,600 430,700 434,900 226,600 231,100 204,100 203800
Household Composition
3.12 The distribution of households by household size, sector and region is shown in Table 21. The distribution of household size reported through the survey had been lowered by the exclusion of household members who had temporarily absented themselves from the households for different reasons. There were 6.5% one-person households in Mongolia. The percentage of households with 8 or more members is estimated as 2.8% for the country as a whole while this percentage rises to 4 % in the Western Region which had reported the highest average household size of 4.3. The survey shows that large households with 6 or more members had amounted to less than 1 out of 6 households. (Inclusion of household members who were absent for periods exceeding 6 months increases the regional variation in household size from 3.9 in Ulaanbaatar to 4.8 in the Western Region (see Table 15). Regional variation in household size is not very marked ranging from 3.9 n Ulaanbaatar to 4.8 in the Western Region.)
Table 21: Percentage distribution of households by household size Mongolia Urban Rural Central East West Khangai UB Number of Household
Members % % % % % % % % 1 6.5 6.8 6.2 6.5 8.5 4.2 6.8 7.2 2 13.8 13.9 13.7 15.1 18.2 10.6 12.6 14.6 3 21.4 22.5 20.2 21.5 24.3 17.8 21.2 22.9 4 25.4 25.6 25.2 24.8 24.0 22.8 27.6 26.0 5 17.2 17.0 17.1 17.0 14.0 20.7 17.6 15.4 6 8.5 7.9 9.3 7.9 6.2 13.5 7.6 7.5 7 4.4 3.8 5.0 4.1 3.1 6.2 4.2 3.9 8+ 2.8 2.5 3.3 3.1 1.7 4.2 2.4 2.5 All sizes (%) 100.0 100.0 100.0 100.0 100.0 100.0 100.0 100.0
Number 568,800 311,000 257,800 114,700 48,500 97,900 138,900 168,800 Average household size excluding members temporarily absent 3.9 3.9
4.0 3.9 3.6 4.3 3.9 3.8
26
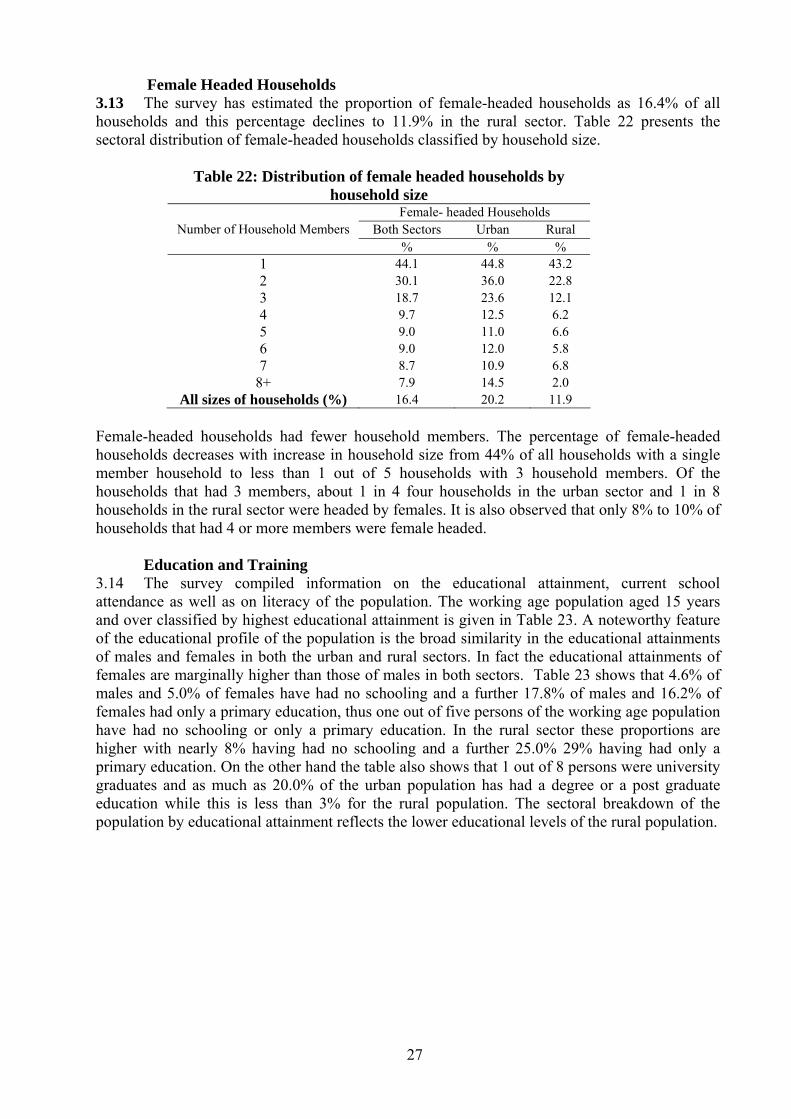
Female Headed Households 3.13 The survey has estimated the proportion of female-headed households as 16.4% of all households and this percentage declines to 11.9% in the rural sector. Table 22 presents the sectoral distribution of female-headed households classified by household size.
Table 22: Distribution of female headed households by household size
Female- headed Households Both Sectors Urban Rural Number of Household Members
% % % 1 44.1 44.8 43.2 2 30.1 36.0 22.8 3 18.7 23.6 12.1 4 9.7 12.5 6.2 5 9.0 11.0 6.6 6 9.0 12.0 5.8 7 8.7 10.9 6.8
8+ 7.9 14.5 2.0 All sizes of households (%) 16.4 20.2 11.9
Female-headed households had fewer household members. The percentage of female-headed households decreases with increase in household size from 44% of all households with a single member household to less than 1 out of 5 households with 3 household members. Of the households that had 3 members, about 1 in 4 four households in the urban sector and 1 in 8 households in the rural sector were headed by females. It is also observed that only 8% to 10% of households that had 4 or more members were female headed.
Education and Training 3.14 The survey compiled information on the educational attainment, current school attendance as well as on literacy of the population. The working age population aged 15 years and over classified by highest educational attainment is given in Table 23. A noteworthy feature of the educational profile of the population is the broad similarity in the educational attainments of males and females in both the urban and rural sectors. In fact the educational attainments of females are marginally higher than those of males in both sectors. Table 23 shows that 4.6% of males and 5.0% of females have had no schooling and a further 17.8% of males and 16.2% of females had only a primary education, thus one out of five persons of the working age population have had no schooling or only a primary education. In the rural sector these proportions are higher with nearly 8% having had no schooling and a further 25.0% 29% having had only a primary education. On the other hand the table also shows that 1 out of 8 persons were university graduates and as much as 20.0% of the urban population has had a degree or a post graduate education while this is less than 3% for the rural population. The sectoral breakdown of the population by educational attainment reflects the lower educational levels of the rural population.
27

Table 23: Percentage distribution of educational attainments of the population aged 15 years and over
Mongolia Urban Rural Both sexes Male Female Male Female Male Female Educational Attainment
% % % % % % % None 4.8 4.6 5.0 2.0 2.6 7.8 8.1 Primary 16.9 17.8 16.2 8.7 9.1 28.6 25.3 Incomplete Secondary 27.7 30.4 25.1 23.4 18.0 38.8 34.3 Completed Secondary 24.3 22.9 25.7 31.1 31.7 13.1 17.8 Initial Tech/Voc 5.1 5.7 4.5 6.5 5.0 4.6 4.0 Tech/Voc/Dip 9.3 7.2 11.2 9.5 13.9 4.5 7.7 University Graduate 11.9 11.4 12.3 18.8 19.6 2.6 2.8 All Attainments % 100.0 100.0 100.0 100.0 100.0 100.0 100.0
Number 1,539,200 750,800 788,400 408,600 446,500 342,200 341,900 Current School Attendance 3.15 The survey had estimated that 79.1% of the population aged 7-19 years comprising 76.7% males and 81.6% females were attending the formal school system. The delay in enrollment of children after reaching the minimum age for entry has depressed these enrollment rates presented in Table 24. A noteworthy feature that is observed in school attendance is the higher enrollment rates of girls over those of boys in both the urban and rural sectors. While the enrolment rates of boys and girls are similar in the first few years of schooling in the urban areas they begin to diverge when they reach 10 years. In the rural sector enrollment rates of girls are higher than that of males from the age of admission through secondary education. In fact the enrollment rates of teenage girls are significantly higher than those of teenage boys in the rural sector which is not usually the case in many developing countries.
Table 24: Current school enrolment rates of children aged 07-19 years by sector and sex
Children Currently Attending School Mongolia Urban Rural
Both sexes Male Female Both
sexes Male Female Both sexes Male Female
Age in completed
years % % % % % % % % %
7 39.4 38.2 40.7 51.3 48.2 54.5 29.5 30.1 28.9 8 81.0 80.2 81.8 88.5 89.3 87.7 73.8 71.4 76.2 9 94.8 94.2 95.5 97.9 99.4 96.3 91.7 89.0 94.6
10 96.8 95.7 97.7 98.7 98.5 98.8 94.6 92.6 96.6 11 95.8 95.2 96.3 97.9 97.5 98.5 92.8 92.2 93.4 12 94.9 93.0 97.2 98.7 98.2 99.3 90.0 85.9 94.6 13 92.1 90.8 93.5 97.0 97.1 97.0 85.2 82.2 88.7 14 90.3 87.9 92.7 96.6 96.2 97.0 81.4 76.9 86.4 15 86.9 83.8 89.8 95.7 94.9 96.5 76.1 70.4 81.6 16 78.3 74.4 82.4 91.9 90.5 93.4 59.7 53.0 66.9 17 70.5 65.4 75.8 87.2 83.2 91.2 50.5 43.8 57.3 18 47.8 43.5 52.2 67.1 62.7 71.4 25.2 22.1 28.5 19 41.3 37.1 46.2 61.2 58.3 64.3 15.6 10.6 21.5
Enrolment rate 07 -19 years 79.1 76.7 81.6 88.6 87.5 89.7 67.6 63.8 71.7
School enrolments No. 545,500 270,400 275,100 333,900 167,900 166,000 211,600 102,500 109,100
Total population 689,800 352,600 337,200 377,100 192,000 185,100 312,700 160,600 152,100
28

The male children dropping out of school to help in livestock farming activities in the rural areas and pressure to find work in a deteriorating unemployment situation among educated youth are said to be the causative factors that contributed to the enrollment patterns reflected in the data. In the urban areas, over 90% of boys and girls of 16 years continue schooling, but this rate is relatively lower in the rural sector confirming high dropping out of school in the late teens of both male and female children. Literacy 3.16 For the purpose of the survey literacy was defined as the ability to read and write a simple message. A person is considered literate if he or she can both read and write a simple message in any language or dialect. A person who is capable of reading only his own name or numbers or can read, but not write and vice versa is not considered literate. The adult literacy rate is defined as the percentage of persons 15 years old and over who could read and write a simple message in any language from the total population 15 years old and over. Both males and females had the same literacy rate of 97%. A marginally higher literacy rate of 97.8% was reported in the Census of Population 2000. This slightly lower survey estimate reported in the survey could have resulted from the exclusion of literate persons who were temporarily residing away from home for periods exceeding 6 months for educational and employment purposes. 3.17 Table 25 shows that the literacy rates in the urban areas are about 3.5 percentage points higher than the literacy rate in the rural areas where it dips to 95% which rate itself is high. Table 26 shows that literacy rates are high among both male and female population with literacy rates exceeding 95% up to 64 year.
Table 25: Adult literacy rates by sector and region Both Sexes Males Females Sector/Region % % %
Urban 98.5 98.7 98.3 Rural 95.0 94.9 95.0 Central 97.1 96.9 97.3 East 95.1 95.5 94.7 West 94.7 94.8 94.6 Khangai 96.4 96.5 96.4 Ulaanbaatar 98.9 99.1 98.7 Mongolia 96.9 97.0 96.9
Table 26: Adult literacy rates by age and sector
Mongolia Urban Rural Age Group Both sexes Male Female Both sexes Male Female Both sexes Male Female
15 – 24 97.3 96.8 97.8 99.3 99.2 99.4 94.8 93.9 95.9 25 – 34 99.0 98.7 99.2 99.6 99.5 99.7 98.2 97.9 98.6 35 – 44 98.9 98.7 99.1 99.5 99.4 99.6 98.0 97.7 98.2 45 – 54 98.3 98.6 98.1 99.4 99.5 99.2 97.0 97.4 96.6 55 – 64 95.3 96.4 94.3 97.7 98.4 96.9 92.1 93.7 90.4 65+ 78.0 81.4 74.9 84.8 88.4 81.9 69.4 73.6 65.2 All age groups 96.9 97.0 96.9 98.5 98.7 98.3 95.0 94.9 95.0
29

Chapter 4
Current Activities
Current Activities of Household Members 4.1 The survey elicited information on both economic and non-economic activities of all household members aged 5 years and over during the short reference period of the last 7 days preceding the survey. Firstly, these questions were expected to provide useful information on the time spent on both economic and non-economic activities by the respondents in respect of a period which is current and when the tasks performed were still fresh in their minds. Secondly, they were expected to facilitate the respondent to make his or her choice of the labour force status objectively having considered the person’s participation in economic and non-economic activities in the week immediately preceding the survey. Thirdly, this being the first labour force survey undertaken in the country adopting internationally used concepts and definitions on the measurement of employment and unemployment it was considered that the field staff would also be able to make well informed decisions having ascertained the type of activities engaged in by the respondents and assist them in making their choice of labour force status and also in obtaining responses to questions that follow on employment and unemployment. Fourthly, these questions were also considered useful to ascertain the employment condition objectively having considered whether the respondent had actually engaged in any work activity and spent time on such work, as the survey was due to commence in October covering the quarter October-December at the onset of a winter where employment in the rural sector was mainly in subsistence livestock farming activities, and where work intensity varies substantially over the seasons. 4.2 In all 13 current economic activities were identified including working for wage or salary, any business including trading activities, animal husbandry and farming activities, to that of engaging in specific services such as provision of private tuition. The total number of hours spent on all identified activities during the reference week that was the 7 days preceding the survey by each person was also ascertained. Table 27 presents information on work activities engaged by persons aged 5 years and over and 15 years and over during the reference period of 7 days. Some persons had engaged in more than one identified activity and most importantly it shows the profile of economic activities undertaken by the working population. 4.3 A total of 800,500 persons aged 15 years and over had engaged in the listed activities and of them 52.3% were males and 47.7% were females. Of the total number of persons that had engaged in any economic activity 297,900 (37.2%) had engaged in wage employment, of them 146,200 were males and 151,700 were females. As expected the animal husbandry, hunting and trapping work activity had engaged the highest number of persons estimated at 368,600 or 46.0 % of the total number that had engaged in any economic activity, comprising 198,800 males and 169,800 females. These two categories of wage employment and animal husbandry, hunting and trapping when taken together comprise as much as 83.2% of total employment.
30

4.4 A total of 79,100 had engaged themselves in assorted business activities including wholesale and retail trade, and provision of different types of business and personal services. Numerically more females had engaged in these business activities compared to the participation of males in them. Of the total number that engaged in economic activities transportation had provided work to 2.6% and a further 1.0% had engaged themselves in handicrafts.
Table 27: Number and percentage of persons who had engaged in any current economic activity during the reference week by sex and sector
Mongolia (5 yrs and over) Mongolia (15 yrs and over) Economic Activity Both
Sexes Male Female Both Sexes Male Female
Wage job 298,000 146,300 151,700 297,900 146,200 151,700 Any business (other than those listed below) 80,700 35,100 45,500 79,100 34,000 45,100
Animal husbandry 400,100 218,200 181,900 368,600 198,800 169,800 Cropping activity 16,300 10,000 6,300 14,700 8,900 5,800 Forestry and logging 2,600 2,200 500 2,600 2,100 500 Transportation 20,800 19,300 1,500 20,800 19,300 1,500 Mining and quarrying 5,800 4,500 1,300 5,300 4,100 1,200 Food processing 2,800 1,300 1,500 2,800 1,300 1,500 Restaurant and hotel 5,200 1,800 3,400 5,000 1,700 3,300 Production, repair and maintenance of articles 6,700 5,400 1,300 6,700 5,400 1,300
Handicrafts 7,900 1,600 6,300 7,800 1,600 6,200 Construction and major repairs 6,400 4,700 1,700 6,400 4,700 1,700 Provision of private tuition, childcare services a fee 1,100 600 500 1,100 600 500
Total number of persons who had engaged in any economic activity
835,600 441,000 394,600 800,500 419,000 381,500
Wage job 298,000 146,300 151,700 297,900 146,200 151,700 Self employed 537,600 294,700 242,900 502,600 272,900 229,800 Economic Activity % % % % % % Wage job 35.7 33.2 38.4 37.2 34.9 39.8 Any business (other than those listed below) 9.7 8.0 11.5 9.9 8.1 11.8
Animal husbandry 47.9 49.5 46.1 46.0 47.4 44.5 Cropping activity 2.0 2.3 1.6 1.8 2.1 1.5 Forestry and logging 0.3 0.5 0.1 0.3 0.5 0.1 Transportation 2.5 4.4 0.4 2.6 4.6 0.4 Mining and quarrying 0.7 1.0 0.3 0.7 1.0 0.3 Food processing 0.3 0.3 0.4 0.3 0.3 0.4 Restaurant and hotel 0.6 0.4 0.9 0.6 0.4 0.9 Production, repair and maintenance of articles 0.8 1.2 0.3 0.8 1.3 0.3
Handicrafts 0.9 0.4 1.6 1.0 0.4 1.6 Construction and major repairs 0.8 1.1 0.4 0.8 1.1 0.4 Provision of private tuition, childcare services a fee 0.1 0.1 0.1 0.1 0.1 0.1
Total number of persons who had engaged in any economic activity %
100.0 100.0 100.0 100.0 100.0 100.0
Wage job 35.7 33.2 38.4 37.2 34.9 39.8 Self employed 64.3 66.8 61.6 62.8 65.1 60.2
31

Average Number of Hours Engaged in Economic Activities
4.5 The average number of hours of work done by the population aged 5 years and over who had engaged themselves in economic activities during the reference week classified by age, sex and sector is presented in Table 28. The table shows that the population aged 15 years and over that had worked during the reference week had spent 45.7 hours on economic activities and this national average is made up of 48.9 hours and 42.3 hours of work by males and females during the reference week. The average number of hours of work done increases steadily from 16 hours by male children aged 05-09 years that had worked during the reference week to 51 hours by males aged 30-34 years and declines thereafter.
Table 28: Average number of hours the persons had engaged in current economic activities during the last 7 days by age, sector and sex
Mongolia Urban Rural Age group Both
hours Male hours
Female hours
Both hours
Male hours
Female hours
Both hours
Male hours
Female hours
05-09 14.8 16.0 12.9 16.2 12.5 21.4 14.7 16.2 12.6
10-14 25.4 27.5 21.6 17.4 17.8 16.2 26.6 29.1 22.1
15-17 37.6 40.9 32.6 34.5 34.8 34.0 38.0 41.7 32.4
18-19 45.0 48.5 39.8 50.5 51.9 48.5 43.6 47.6 37.8
20-24 44.8 48.6 40.2 48.1 49.1 46.8 43.2 48.3 37.1
25-29 46.2 50.1 42.0 47.3 49.1 45.3 45.5 50.8 39.7
30-34 47.8 51.1 44.3 47.9 48.7 47.1 47.7 53.2 41.6
35-39 47.4 50.2 44.7 47.7 48.6 46.7 47.2 52.2 42.2
40-44 46.2 48.9 43.7 46.8 48.1 45.7 45.5 49.9 41.1
45-49 45.6 49.0 42.2 46.2 47.5 45.0 44.9 50.6 39.3
50-54 45.1 47.4 42.5 46.6 47.3 45.8 43.6 47.6 38.8
55-59 43.7 46.7 37.9 45.3 46.6 42.8 42.4 46.8 34.4
60-64 43.1 46.7 36.8 42.4 45.2 37.2 43.4 47.6 36.5
65-69 43.1 45.3 39.5 42.7 43.8 39.2 43.2 46.1 39.5
70+ 35.0 41.7 26.5 35.2 40.1 24.3 35.0 42.1 26.8 All age
groups % 44.7 47.6 41.5 46.7 47.7 45.7 43.1 47.5 38.1
Number 5+ 835,600 441,000 394,600 359,700 184,200 175,500 475,900 256,800 219,100 Aged 15+
% 45.7 48.9 42.3 47.0 48.1 45.8 44.7 49.5 39.3 Number
15+ 800,500 419,000 381,500 356,600 182,000 174,600 443,900 237,000 206,900
The females in their youth and in the prime of their working lives had spent 6-7 hours less on work than their male counterparts. The males in the rural sector had reported that they work somewhat longer hours than employed males in the urban sector. The opposite is the pattern reflected in the data in respect of females. The longer hours of work that females had engaged in their economic activities were observed in urban areas when compared with their counterparts in rural areas.
32

Graph 2
Percentage distribution of population aged 15 and over that had engaged in current economic activities, by number of hours spent
40-49 hours40.6%
70+ hours13.5%60-69 hours
6.8%
50-59 hours15.9%
10-19 hours4.8%
30-39 hours8.2%
20-29 hours8.6%
0-9 hours1.7%
Current Non-Economic Activities 4.6 In order to ascertain the actual labour force status of the population and also on time-use, information was also ascertained on the non-economic activities (housekeeping activities) that persons had been engaged in and on the number of hours they had spent on them during the reference period of one week before the survey from all persons aged 5 years and over. Altogether 12 activities including cooking and serving of food to the household, cleaning utensils and house; washing clothes and laundering; minor household repairs; shopping for household; fetching water; fetching fuel or preparing firewood; looking after children and voluntary community services without pay were listed and the total number of hours spent on the identified activities was ascertained. 4.7 Although fetching or collecting water, fetching fuel or preparing firewood have been included as economic activities and counted as work under UN SNA, it was considered that these activities should be itemized separately and included as housekeeping activities under this survey. It was felt that very high proportions of the population would be spending time on these two activities and it would not be feasible to ascertain the requisite information through a single direct question on the item, to treat the reported activity as work. Therefore the questions were included under household activities and data were collected on the items so that the data user could make an appropriate decision depending on the scope of the study and analysis undertaken by the researcher.
Table 29: Number and percentage of persons of 5 years and above who had engaged in non-economic activities in the reference period of 7 days before the survey
Mongolia (5 yrs and over) Mongolia (15 yrs and over) Non-Economic Activity Both Sexes Male Female Both Sexes Male Female
Cooking/serving food for the household 1,399,000 516,200 882,800 1,091,300 377,400 713,900 Cleaning utensils/house 1,254,700 419,300 835,400 956,000 288,200 667,800 Washing clothes/laundering 1,022,700 322,400 700,300 872,600 265,000 607,600 Minor household repairs 296,700 244,800 51,900 280,300 232,500 47,800 Shopping for household 713,000 294,700 418,300 637,300 259,700 377,600 Knitting/sewing/mending 291,300 25,400 265,900 274,900 21,800 253,100 Fetching water/washing 818,800 496,400 322,400 611,400 373,600 237,800 Fetching fuel/preparing firewood 823,100 502,500 320,600 641,100 392,800 248,300
33

Caring for the old/sick/infirm 62,600 25,300 37,300 54,800 22,000 32,800 Looking after children 248,300 83,000 165,300 210,800 67,400 143,400 Caring for household pets 137,300 67,900 69,400 111,800 52,500 59,300 Voluntary/community services without pay 89,500 47,700 41,800 67,100 36,400 30,700 Total number of persons who participated in any non-economic activity 1,826,700 874,400 952,300 1,419,200 667,800 751,400 % % % % % % Cooking/serving food for the household 76.6 59.0 92.7 76.9 56.5 95.0 Cleaning utensils/house 68.7 48.0 87.7 67.4 43.2 88.9 Washing clothes/laundering 56.0 36.9 73.5 61.5 39.7 80.9 Minor household repairs 16.2 28.0 5.4 19.8 34.8 6.4 Shopping for household 39.0 33.7 43.9 44.9 38.9 50.3 Knitting/sewing/mending 15.9 2.9 27.9 19.4 3.3 33.7 Fetching water/washing 44.8 56.8 33.9 43.1 55.9 31.6 Fetching fuel/preparing firewood 45.1 57.5 33.7 45.2 58.8 33.0 Caring for the old/sick/infirm 3.4 2.9 3.9 3.9 3.3 4.4 Looking after children 13.6 9.5 17.4 14.9 10.1 19.1 Caring for household pets 7.5 7.8 7.3 7.9 7.9 7.9 Voluntary/community services without pay 4.9 5.5 4.4 4.7 5.5 4.1 Total number of persons who participated in any non-economic activity =100 % 100.0 100.0 100.0 100.0 100.0 100.0
4.8 A total of 1.827 million persons aged 5 years and over had engaged in these non-economic activities comprising 874,400 males and 952,300 females during the reference week before the survey. Out of an estimated population of 1.539 million persons aged 15 years and over, 1.419 million or 92% had engaged in these activities. The proportion engaged in an identified non-economic activity expressed as a percentage of the total number of persons engaged in any of the identified activities is shown by sex in Table 29. 4.9 During the reference week more persons of 15 years and over had engaged in cooking and serving food to the household than in any other activity and 713,900 (95%) females and 377,400 (56.5%) males, a total of 1.091 million persons or more than 3 out of 4 persons of both sexes had participated in these activities. Similarly cleaning utensils and the house were also activities that had required a high level of participation of both sexes of where 67.4% of the population aged 15 and over who attended to any non-economic activity had participated in during the reference week with 88.9% of females and 43.2% of males helping in these household tasks.A total of 611,400 persons had spent time in fetching water and 641,100 persons had engaged in fetching fuel and preparing firewood. According to these estimates 43.1% and 45.2% of the total population had spent time on these tasks. Table 29 also shows that more males had contributed to the household tasks of fetching water and fuel, and preparing firewood. Nearly 20% of females and 10% of males had spent time in looking after children. The proportion that had participated in voluntary community services without pay was small amounting to 4.7%. Time Spent by Age Group 4.10 The average number of hours spent by persons aged 5 years and over in all current non-economic activities during the reference week broken down by age and sex is given in Table 30. The population of 15 years and over had spent 25 hours on average for non-economic activities. The average hours spent by males and females were 17.5 and 31.8 respectively.
34

4.11 The time spent on non-economic activities by persons aged 15 years and over expressed as a percentage of the total number of persons who had engaged in such activities is presented in Table 31. More than 1 out of 5 persons who had engaged in these household tasks had spent not more than 10 hours on these activities. Table 31 shows that 1 out of 4 persons had spent between 10 to 19 hours on household chores. The table also shows that nearly 20 percent of persons who had engaged in these household chores had spent more than 40 hours per week on these activities, while 37.8% of females in the rural sector had spent more than 40 hours per week on these chores.
Table 30: Average number of hours engaged in current non-economic activities during the last 7 days by age, sex and sector
Mongolia Urban Rural Age group Both
hours Male hours
Female hours
Both hours
Male hours
Female hours
Both hours
Male hours
Female hours
05-09 8.6 8.3 8.9 7.2 7.1 7.4 9.6 9.2 10.1
10-14 14.2 12.6 15.9 13.0 11.4 14.6 15.8 14.1 17.5
15-17 19.3 15.9 22.7 18.1 15.4 20.7 21.0 16.6 25.3
18-19 20.8 16.7 25.1 18.6 16.1 21.0 23.6 17.4 30.5
20-24 25.9 18.1 33.5 22.3 16.3 27.9 30.1 20.1 40.2
25-29 31.2 20.0 41.5 28.2 18.6 36.2 34.2 21.3 46.9
30-34 29.5 19.9 37.8 26.8 18.5 33.3 32.5 21.3 43.6
35-39 26.6 18.1 33.6 23.7 16.2 29.5 30.7 20.5 39.6
40-44 23.8 16.1 30.0 21.6 15.2 26.6 26.7 17.3 35.0
45-49 23.1 15.3 29.8 20.7 14.0 26.4 26.0 16.9 34.0
50-54 24.9 16.2 31.8 23.9 16.5 29.5 26.2 15.9 34.8
55-59 24.9 16.5 31.8 25.0 16.3 31.1 24.8 16.6 32.8
60-64 21.9 16.5 27.5 20.7 16.8 24.9 23.7 16.0 31.1
65-69 21.6 16.4 25.8 19.9 16.0 22.5 23.4 16.7 29.7
70+ 18.0 14.5 20.6 17.6 13.8 20.1 18.7 15.4 21.4
All age groups % 22.2 15.9 27.9 20.2 14.9 24.9 24.5 17.1 31.7
Number 5+ 1,826,700 874,400 952,300 996,300 466,000 530,300 830,400 408,400 422,000
Aged 15+ % 25.0 17.5 31.8 22.6 16.3 27.9 28.0 18.7 36.7
No. Aged 15+ 1,419,200 667,800 751,400 782,500 357,700 424,800 636,700 310,100 326,600
Table 31: Percentage of persons aged 15 years over who performed household duties grouped by number of hours spent, sex and sector
Mongolia Urban Rural Hours Spent
Both Male Female Both Male Female Both Male Female
0-9 22.2 35.4 10.5 25.8 39.9 13.8 17.9 30.2 6.3
35

10-19 26.1 31.1 21.6 27.4 30.0 25.3 24.3 32.3 16.7
20-29 21.1 17.6 24.1 22.1 16.7 26.6 19.8 18.6 20.9
30-39 12.3 7.9 16.2 10.9 6.6 14.6 13.9 9.3 18.3
40-49 7.5 4.4 10.3 6.0 3.5 8.1 9.4 5.3 13.2
50-59 4.2 1.8 6.3 2.7 1.4 3.7 6.1 2.3 9.6
60-69 2.5 0.8 4.0 1.6 0.6 2.5 3.6 1.0 6.0
70+ 4.2 1.1 6.9 3.5 1.2 5.4 5.1 0.9 9.0
All age groups 100.0 100.0 100.0 100.0 100.0 100.0 100.0 100.0 100.0
Number 1,419,200 782,500 636,700 667,800 751,400 357,700 424,800 310,100 326,600
Fetching Water and Fuel for Household Use 4.12 As referred to already, fetching or collecting water and fetching fuel or preparing firewood have been included as economic activities and counted as work under UN SNA. Accordingly, the persons who engage in these tasks have to be accepted and recognized as performing economic activities and therefore as employed. This would lead to a reduction of the number of persons who would otherwise be classified as economically inactive or unemployed. In order to study the two activities of fetching water or firewood, two tables which provide breakdown of the number of persons who were engaged in these activities and their employment status as employed, unemployed or inactive, were extracted and they are presented in Table 32 and Table 33. 4.13 Table 32 shows that 300,400 persons in the age groups 5-17 years will have to be classified as employed when fetching water is treated as an economic activity. Of them only 48,900 are currently classified as active with 3000 of them as unemployed and 251,500 as inactive will have to be transferred to the employed category. This would distort the employment status of this population group. Table 32 also shows that 180,200 persons aged 15 years and over who were classified as inactive will be grouped as employed, which would inflate the number of employed, reducing the number of economically inactive by a similar number.
Table 32: Number of persons who fetched water for drinking purposes grouped by their employment status as employed, unemployed, inactive, age and sex
Number of persons who fetched water
Active Employed Unemployed Inactive
Population aged 5 years and over Total 300,400 48,900 45,900 3,000 251,500 5-9 57,200 8,100 8,100 - 49,200 10-14 150,200 15,900 15,500 400 134,300 15-17 93,000 24,900 22,300 2,600 68,000 Male 176,300 31,100 29,200 1,900 14,5200 5-9 33,900 5,000 5,000 - 28,900 10-14 88,900 10,600 10,400 200 78,300 15-17 53,500 15,500 13,800 1,700 38,000
Female 124,100 17,800 16,700 1,100 106,300 5-9 23,300 3,100 3,100 - 20,200 10-14 61,300 5,300 5,100 200 56,000
36

15-17 39,500 9,400 8,500 900 30,100 Population aged 15 years and over
Total 611,400 431,200 368,100 63,100 180,200 15-17 93,000 24,900 22,300 2,600 68,100 18-24 137,700 93,700 76,100 17,600 44,000 25-34 170,000 149,600 128,400 21,200 20,400 35-44 105,600 95,200 80,700 14,500 10,400 45-54 52,500 44,700 38,800 5,900 7,800 55-64 34,400 18,000 16,800 1,200 16,400 65+ 18,200 5,100 5,000 100 13,100 Male 373,600 273,300 233,100 40,200 100,300 15-17 53,500 15,500 13,800 1,700 38,000 18-24 83,100 57,600 46,900 10,700 25,500 25-34 103,800 94,100 80,900 13,200 9,700 35-44 67,200 61,100 51,700 9,400 6,100 45-54 32,100 28,800 24,500 4,300 3,300 55-64 22,300 12,600 11,800 800 9,700 65+ 11,600 3,600 3,500 100 8,000 Female 237,800 157,900 134,900 23,000 79,900 15-17 39,500 9,400 8,500 900 30,100 18-24 54,600 36,100 29,100 7,000 18,500 25-34 66,200 55,500 47,500 8,000 10,700 35-44 38,400 34,100 29,000 5,100 4,300 45-54 20,400 15,900 14,300 1,600 4,500 55-64 12,100 5,300 4,900 400 6,800 65+ 6,600 1,600 1,600 - 5,000
4.14 The number of persons of 5 years and above who spent time on fetching fuel and preparing firewood is estimated as 265,100. A breakdown of these persons by age and employment status as employed, unemployed and economically inactive are presented in Table 33. The comments made earlier with regard to fetching water apply hereto.
Table 33: Number of persons who fetched fuel and prepared firewood grouped by their employment status as employed, unemployed, inactive, age and sex
Number of persons who fetched fuel Active Employed Unemployed Inactive
Population aged 5 years and over Total 265,100 48,600 46,000 2,600 216,500 5-9 58,600 9,300 9,300 - 49,300 10-14 123,400 15,300 15,200 100 108,100 15-17 83,100 24,000 21,500 2,500 59,100 Male 160,600 31,400 29,700 1,700 129,200 5-9 34,200 5,900 5,900 - 28,300 10-14 75,500 9,900 9,900 - 65,600 15-17 50,900 15,600 13,900 1,700 35,300
37

Female 104,500 17,200 16,300 900 87,300 5-9 24,400 3,400 3,400 - 21,000 10-14 47,900 5,400 5,300 100 42,500 15-17 32,200 8,400 7,600 800 23,800
Population aged 15 years and over Total 641,100 462,400 395,700 66,700 178,700 15-17 83,100 24,000 21,500 2,500 59,100 18-24 128,400 91,000 73,700 17,300 37,400 25-34 171,500 150,900 129,400 21,500 20,600 35-44 122,700 110,100 94,600 15,500 12,600 45-54 66,900 55,900 47,900 8,000 11,000 55-64 43,400 23,700 22,000 1,700 19,700 65+ 25,100 6,800 6,600 200 18,300 Male 392,800 289,600 245,600 44,000 103,200 15-17 50,900 15,600 13,900 1,700 35,300 18-24 78,700 55,700 44,700 11,000 23,000 25-34 103,200 92,400 78,500 13,900 10,800 35-44 77,700 69,700 59,700 10,000 8,000 45-54 40,300 35,500 29,500 6,000 4,800 55-64 27,400 16,300 15,000 1,300 11,100 65+ 14,600 4,400 4,300 100 10,200 Female 248,300 172,800 150,100 22,700 75,500 15-17 32,200 8,400 7,600 800 23,800 18-24 49,700 35,300 29,000 6,300 14,400 25-34 68,300 58,500 50,900 7,600 9,800 35-44 45,000 40,400 34,900 5,500 4,600 45-54 26,600 20,400 18,400 2,000 6,200 55-64 16,000 7,400 7,000 400 8,600 65+ 10,500 2,400 2,300 100 8,100
38

Chapter 5
Labour Supply
Labour Supply
5.1 The economically active population was accepted as comprising all persons of either sex who furnished the supply of labour for the production of goods and services as defined by the United Nations System of National Accounts (UN SNA) during a specified time reference period. According to the UN SNA the production of goods and services includes all production and processing of primary goods for the market for barter or for own consumption, production of all other goods and services for the market and in the case of households which produce such goods and services for the market, corresponding products for own consumption. 5.2 The currently economically active population or the labour force consisted of all persons who satisfied the requirements for inclusion among the employed or unemployed based on the employment or unemployment status during the short reference period of one week immediately preceding the survey. The definitions of employed and unemployed used in the survey are given in Annex 2. The population not currently active or persons not in the labour force comprised all persons who were not employed or unemployed during the reference period because of engagement in household duties; attendance at educational institutions; retirement or old age or other such reasons.
Labour Supply Estimates
5.3 The total labour supply or the total economically active population of Mongolia measured under the current status with a short reference period of 1 week was estimated as 1.004,800. This economically active population consisted of 523,500 males (52.1 %) and 481,300 (47.9%) females. The relative shares of urban and rural sectors were 482,600 (48.0%) and 522,200 (52.0%) respectively. The economically active population or the labour force consisted of 862,500 employed and 142,300 unemployed. Although the labour law fixes the working ages at 16-59, an age cut off of 15 years was used in the extraction of tables on economic activity to comply with the international methodology and provide for comparability of estimates from other sources. 5.4 There are some estimates of the labour supply and the profile of the employed population canvassed through ad hoc surveys and the Census of Population 2000. The Census 2000 had estimated the total labour force at 944,000 comprising 779,100 employed and 164,900 unemployed. This estimate of the labour force had included the population that resided in institutional living quarters as well as those who had been absent from their households for periods in excess of 6 months before the Census. The census enumerated those persons who didn’t work in the preceding week before the census and in search of work and couldn’t find suitable work during the census time. The annual survey of employment conducted by the NSO, which collected data through the administrative reporting system, had estimated the work force at 926,500 in 2003. The unemployment estimate in the annual survey of employment is restricted to the number registered under the Employment Office and was enumerated as 33,300. The labour force or economically active population is 1112.5(926.5+186.0) when estimated by persons in search of work, unable to find suitable work and not in search of work all of whom are not registered with the employment registered with employment registered offices and the unemployed registered with these offices. Thus, the LFS data is not strictly comparable with the estimates of censuses and records due to the definitional and methodology differences.
39

Table 34: Labour Force Status of the Population aged 15 years and over
by Sector and Sex Both Sexes Male Female Sector/ Current
status Number % Number % Number % Mongolia Currently active 1,004,800 65.3 523,500 69.7 481,300 61.1 Employed 862,500 56.0 448,900 59.8 413,600 52.5 Unemployed 142,300 9.2 74,600 9.9 67,700 8.6Not Currently Active 534,400 34.7 227,400 30.3 307,000 38.9Population 15+ 1,539,200 100.0 750,900 100.0 788,300 100.0Urban Currently active 482,600 56.4 247,800 60.6 234,800 52.6 Employed 392,300 45.9 199,900 48.9 192,400 43.1 Unemployed 90,300 10.6 47,900 11.7 42,400 9.5Not Currently Active 372,500 43.6 160,900 39.4 211,600 47.4Population 15+ 855,100 100.0 408,700 100.0 446,400 100.0Rural Currently active 522,200 76.3 275,700 80.6 246,500 72.1 Employed 470,200 68.7 249,000 72.8 221,200 64.7 Unemployed 52,000 7.6 26,700 7.8 25300 7.4Not Currently Active 161,900 23.7 66,500 19.4 95400 27.9Population 15+ 684,100 100.0 342,200 100.0 341,900 100.0Mongolia LFPR 65.3 69.7 61.1Employment rate 85.8 85.8 85.9Unemployment rate 14.2 14.2 14.1Urban LFPR 56.4 60.6 52.6Employment rate 81.3 80.7 81.9Unemployment rate 18.7 19.3 18.1Rural LFPR 76.3 80.6 72.1Employment rate 90.0 90.3 89.7Unemployment rate 10.0 9.7 10.3Note 1 : LFPR= Labour force participation rate
The overall estimates derived from these sources along with the survey estimates are presented in Table 35. The LFS canvassed information on the labour force status of all persons aged 5 years and over, as the survey included a child activity module to canvass information on child labour topics.
40

Table 35: Labour force status of the population aged 15 years and over from recent statistical inquiries
Labour Force Survey 2002-2003
Population Category Current Status
Usual Status
Census of Population
2000
*Annual Employment Survey 2003
Mongolia Population 15+ 1,539.2 1,539.2 1,524.3 1,488.9Economically Active 1,004.8 941.4 944.0 959.8Employed 862.5 856.6 779.1 926.5Unemployed 142.3 84.8 164.9 33.3Economically Inactive 534.4 597.8 580.3 529.1
Rates Labour Force Participation Rate 65.3 61.2 61.9 64.5Employment Rate 85.8 91.0 82.5 96.5Unemployment Rate 14.2 9.0 17.5 3.5
Rates :1st Round Labour Force Participation Rate 66.6 62.9Employment Rate 82.0 87.4Unemployment Rate 18.0 12.6
Rates: 2nd Round Labour Force Participation Rate 65.1 60.3Employment Rate 85.0 91.4Unemployment Rate 15.0 8.6
Rates: 3th Round Labour Force Participation Rate 64.9 61.0 Employment Rate 86.8 91.4 Unemployment Rate 13.2 8.6
Rates: 4th Round Labour Force Participation Rate 65.0 60.8 Employment Rate 89.6 93.5 Unemployment Rate 10.7 6.5 * Note : Annual Employment Survey had used an age cut off of 16+ . This survey compiles data collected through the administrative reporting system. The unemployment number is restricted to the number registered under the Employment Office.
Labour Force Participation Rates
5.5 The economically active population or the labour force consisted of the employed and the unemployed. The labour force participation rate (LFPR) is defined as
Economically Active Population Employed + Unemployed
LFPR =▬▬▬▬▬▬▬▬▬▬▬ x100 = ▬▬▬▬▬▬▬▬▬x100
Working Age Population Working Age Population
and the age specific labour force participation rate is defined as
41

(Employed + Unemployed) in specified Age Group
Age specific LFPR = ▬▬▬▬▬▬▬▬▬▬▬▬▬▬▬▬▬x100
Total population in specified Age Group
5.6 The labour force participation rates or the percentage of persons in the labour force for the population 15 years and over which amounted to 65.3% for the country as a whole was substantially higher in the rural sector at 76.3% which declines to 56.4% in urban areas. This high labour force participation in the rural areas was a result of high participation rates of both males and females that stood at 80.6% and 72.1% for males and females respectively mostly in agriculture. These overall rates in the urban sector were approximately 20 percentage points lower at 60.6% and 52.6 % respectively.
5.7 Table 35 also shows that the labour force participation rates from the 2nd, 3rd and 4th quarters had remained remarkably close to 65% except in the case of the 1st quarter which had reported a participation rate of 66.6%. This quarter had reported the highest unemployed population and the highest unemployment rate, too. The labour force participation rates for both sexes, males and females are depicted in Graph 3.
Graph 3
0.0
10.0
20.0
30.0
40.0
50.0
60.0
70.0
80.0%
Quarterly Estimates of Labour Force Participation Rates
Q1 66.6 72.2 61.4Q2 65.1 69.4 60.9Q3 64.9 68.9 61.0Q4 65.0 68.7 61.4All quarters 65.3 69.7 61.6
Both sexes Male Female
Age Specific Participation Rates 5.8 In order to study the variation in activity rates, the age specific labour force participation rates are usually prepared for 5 year age groups. Age specific labour force participation rates of both sexes, males and females for 5 year age groups between 05-70+ years by sex were prepared. Table 36 presents the participation rates for the age groups 15 years and over. The participation rates of both sexes for the country as a whole increases rapidly from 21% for the age group 15-17 years to 83% in the age group 25-29 years. The participation rates for both sexes remain between 80-90% for most of their working lives from 25-49 years which decline thereafter. The national level labour force participation rates remain high as a result of the high activity rates of females. The males have higher participation rates than that of females in all age groups. The activity rates of both males and females were higher in the rural sector when compared with those of the urban sector. The activity rates of
42

males are high in the rural sector reaching 90% in the ages of 25-49. Another noteworthy feature observed is the increase in the activity rates of females in the age 35-39 years when it reaches its maximum in both urban and rural sectors. This may be attributed to the fact that in their prime ages the females were engaged in education, household duties, child bearing and family responsibilities (See Graph 4, 5).
Table 36: Age Specific labour Force Participation Rates of Population aged 15 years and over
Mongolia Urban Rural Age group Both
sexes Male Female Both sexes Male Female Both
sexes Male Female
15-17 21.0 24.9 17.1 6.6 7.8 5.4 39.2 46.3 31.9 18-19 42.8 47.5 37.6 22.1 25.3 18.8 68.2 73.7 62.0 20-24 64.4 69.0 59.8 46.2 52.2 40.4 85.8 88.0 83.5 25-29 83.0 87.7 78.6 74.5 81.1 68.6 91.5 93.8 89.2 30-34 86.2 90.3 82.4 82.3 86.9 78.4 90.8 94.0 87.5 35-39 88.8 91.3 86.5 86.9 89.7 84.5 91.4 93.5 89.4 40-44 87.0 89.6 84.7 84.4 86.9 82.2 90.8 93.3 88.4 45-49 84.9 88.2 81.6 81.8 85.8 77.8 88.8 91.4 86.4 50-54 69.9 81.8 59.4 64.4 75.9 54.3 77.4 89.9 66.3 55-59 51.4 69.5 35.1 41.4 60.4 26.1 65.2 80.4 49.1 60-64 31.2 37.2 24.4 20.4 24.5 15.6 46.5 56.1 36.3 64-69 24.2 31.6 17.4 12.4 21.2 5.0 37.0 41.7 32.2 70 + 9.6 12.0 7.6 2.7 4.5 1.4 19.1 21.0 17.2
All age groups 65.3 69.7 61.1 56.4 60.6 52.6 76.3 80.6 72.1
Graph 4
Labour Force Participation Rate by Age, Sex, Mongolia
0.0
10.0
20.0
30.0
40.0
50.0
60.0
70.0
80.0
90.0
100.0
15-17 18-19 20-24 25-29 30-34 35-39 40-44 45-49 50-54 55-59 60-64 65-69 70+Age group
% Both sexesMaleFemale
5.9 Age specific LFPR are presented in Graph 4. The chart shows that the overall activity rates are high with both male and female participation rates reaching 90% in the age groups 25 to 49 years. In this age range the age specific participation rates of females are high and are only a few percentage points lower than that of males.
43

5.10 The high overall participation rates for both males and females in the rural sector have raised the activity rates for the country as a whole. These high overall activity rates in the rural sector had lowered the currently inactive population to less than half that of the urban sector. Economic growth and improved access to education and training to rural children and growth of industrial and service sector employment would alter the labour force participation rates reported through this survey.
Graph 5
Labour Force Participation Rate by Age, Sector, Mongolia
0.010.020.030.040.050.060.070.080.090.0
100.0
15-17 18-19 20-24 25-29 30-34 35-39 40-44 45-49 50-54 55-59 60-64 65-69 70+
Age group
%MongoliaUrbanRural
5.11 The labour force participation rates of children 5-17 years show that the activity rates were as high as 12.9-14.8% between 5-14 years among rural children with somewhat higher rates in male children in these age groups. In the case of male children activity rates rise up to 46.3% in the age group 15-17 years among rural children. In the urban areas however participation rates of both males and females remain below 3.0% in the age group 10-14 years, but rises to around 8% in children aged 15-17 years.
Table 37: Age specific labour force participation rates of children aged 5-17 years
Mongolia Urban Rural Age group Both
sexes Male Female Both sexes Male Female Both
sexes Male Female
5-9 7.2 8.3 6.1 0.6 0.7 0.5 12.9 14.8 10.9
10-14 7.4 9.2 5.6 1.8 2.5 1.1 14.8 18.1 11.4 15-17 21.0 24.9 17.1 6.6 7.8 5.4 39.2 46.3 32.0 5-17 10.8 12.8 8.7 2.8 3.4 2.1 20.0 23.6 16.2
Economically Inactive Population
5.12 The population not currently active or persons not in the labour force consisted of all persons who were not employed or unemployed during the brief reference period of 1 week immediately before the survey and therefore not currently active because of engagement in household duties, studies, retirement or old age or other such reasons. Thus, persons who did not engage at least for one hour in any economic activity during the reference week nor had a job
44

from which they were temporarily absent and also who were not available for work were treated as currently economically inactive. 5.13 The survey disclosed that 534,400 persons comprising 227,400 males and 307,000 females had been currently inactive. The majority of the currently inactive numbering 372,500 persons were in the urban sector, while the number currently inactive was substantially lower at 161,900 in the rural sector. The higher labour force participation rates in the rural sector had lowered the currently inactive population. In order to classify the currently inactive population by reason the survey had used the reasons for economic inactivity as household duties; studies; retirement/old age; disability; not available for work; looking after children; temporary ailment/sickness; persons below working age; and other reasons.
Graph 6 Economically inactive population of 15 years and over classified by reasons
Temporary ailment/sickness
2.9%
Other6.7%
Person below working age1.1%
Disability5.1%
Not available for work2.2%
Retired/old age28.5%Studied
38.7%
Household duties10.2%
Looking after children4.6%
5.14 The economically inactive population classified by main reason for inactivity shows that, 42.3% of males and 36.0% of females were inactive as they were engaged in education and training activities; 26.0% of males and 30.4% of females were inactive, because of retirement and old age; and 7.1% of males and 12.4% of females because of household duties.
Table 38: Reasons for being not economically active by sex and by sector of the population aged 15 years and over
Mongolia Urban Rural Reason for being Not Economically active Both
sexes Male Female Both sexes Male Female Both
sexes Male Female
Household duties 10.2 7.1 12.4 8.8 5.6 11.3 13.2 10.7 15.0Studied 38.7 42.3 36.0 42.5 46.4 39.5 30.0 32.3 28.3Retired/old age 28.5 26.0 30.4 26.9 24.4 28.8 32.2 29.8 33.9Disability 5.1 6.4 4.0 4.7 6.2 3.6 5.8 7.0 4.9Not available for work 2.2 3.3 1.4 2.4 3.8 1.3 1.8 2.3 1.5Looking after children 4.6 0.5 7.6 5.0 0.5 8.4 3.6 0.3 5.9Temporary ailment/sickness 2.9 3.5 2.4 2.8 3.5 2.3 3.0 3.3 2.7Person below working age 1.1 1.3 1.0 0.9 1.2 0.6 1.7 1.5 1.7Other 6.7 9.6 4.8 6.0 8.4 4.2 8.7 12.8 6.1
45
All reasons (%) 100.0 100.0 100.0 100.0 100.0 100.0 100.0 100.0 100.0Number 534,400 227,400 307,000 372,500 160,900 211,600 161,900 66,500 95,400
While education and training was given as the main reason by 42.5% of the economically inactive population in the urban sector, retirement/old age was cited as the main reason by 32.2% of the economically inactive population in the rural sector. As much as 46.4% of the economically inactive males in the urban sector had reported that their participation in studies as the main reason for being economically inactive. Table 38 shows that 20.9% of females in the rural sector were economically inactive as they were engaged in household duties and in looking after children. Hence, the main reasons for inactivity being studies and old age, a tabulation classifying economically inactive by age should reveal the dependence of inactivity on these two reasons.
46

Chapter 6
Currently Employed Population
Employment 6.1 LFS concentrated on compiling detailed information on the employment condition of the Mongolian population. The survey utilized questions to screen respondents to ascertain information on the type of economic activities persons had engaged in during the reference week. Information was canvassed on the total duration for which the respondents had worked in one or more of the listed activities in which the person had engaged in during the reference week. This information along with information as to whether the person had a job or business even though the person did not work during the reference period because of temporary illness, injury, vacation or other leave of absence, bad weather, strike, labour dispute or other reason was used to determine the current economic activity status of the person. If the person had engaged in any of the listed activities at least one hour during the reference week or had a job or business from which the person was temporarily absent for any of the aforesaid reasons then, the person was considered as currently employed. 6.2 The total currently employed population of Mongolia was estimated as 897,100 including 34,600 persons who were temporarily absent from their households for periods exceeding 6 months before the survey. The Census of Population 2000 had enumerated the total employed population as 779,100. The tables presented here exclude the 34,600 persons who were absent from their households as detailed information on employment was not collected from them.
Table 39: Currently employed population by sector, region and sex Sector/Region Both Sexes Males Females
Number % Number % Number % Urban 392,300 45.5 199,900 44.5 192,400 46.5 Rural 470,200 54.5 249,000 55.5 221,200 53.5 Central 167,300 19.4 86,600 19.3 80,700 19.5 East 68,200 7.9 36,400 8.1 31,800 7.7 West 175,700 20.4 93,200 20.8 82,500 19.9 Khangai 233,300 27.0 122,000 27.2 111,300 26.9 Ulaanbaatar 218,000 25.3 110,700 24.7 107,300 25.9 Mongolia 862,500 100.0 448,900 100.0 413,600 100.0
6.3 The geographic distribution of the employed population presented in Table 39 shows that about 45.5% of the employed population had resided in the urban sector. The employed population was unevenly distributed among the regions. More than one quarter of the employed population was from the capital city. The share of Khangai region was higher accounting for 27.0% of the total employed population while the share of the Eastern Region amounted to less than 8.0% of the employed population. Numerically the employed female population was nearly equal to the male employed population. Quarterly Employment Estimates 6.4 The estimated employed population had increased from 822,300 in the 1st quarter (Table 40) to 906,000 in the 4th quarter by 83,700. The employed male population had increased by
47

37,100 and employed females by 46,600. This increase had arisen mainly in the rural sector, where there were seasonal variations in the demand for labour both in agricultural and non-agricultural activities.
Table 40: Currently employed population by sector, region and sex Both Sexes Males Females Sector/Region
Number % Number % Number % Quarter 1 822,300 100.0 433,900 52.8 388,400 47.2 Quarter 2 838,700 100.0 435,000 51.9 403,700 48.1 Quarter 3 885,600 100.0 455,900 51.5 429,700 48.5 Quarter 4 906,000 100.0 471,000 52.0 435,000 48.0 Mongolia 862,500 100.0 448,900 100.0 413,600 100.0
These quarterly estimates of the employed population adjusted to include the employed persons who were temporarily absent from their households are illustrated in Graph 7.
Graph 7 Quarterly Estimates of Employed Population
971.6926.5 897.1
942.0924.3854.8
779.1
0.0100.0200.0300.0400.0500.0600.0700.0800.0900.0
1000.0
Census 2000 AnnualEmploymentsurvey 2003
Q1 Q2 Q3 Q4 All Quarters
Thou
s.pe
rson
s
Industrial Attachment 6.5 The industrial attachment of the currently employed population classified by major industry tabulation category is given in Table 41. Of the total employed population an estimated 402,700 persons or 46.7% comprising 216,500 males and 186,200 females had worked in the agriculture and livestock production category. The wholesale and retail trade sector had grown to become the 2nd largest sector providing employment to an estimated 98,100 or 11.4% of the total employed population. In terms of descending employment size, 7.3 % had worked in education, 5.9% in transport, storage and communication and 6.0% in public administration. The manufacturing sector was still small and it accounted to only 5.4% of employment opportunities in total employment. The survey had estimated the total employed population in the mining and quarrying sector at 23,300 persons.
48

Table 41: Currently employed population classified by main industry tabulation categories of main occupation
Both Sexes Male FemaleIndustry Tabulation Category Number % % %
A. Agriculture, Hunting and Forestry 402,200 46.6 48.2 45.0B. Fishing 500 0.1 0.1 0.1C. Mining and Quarrying 23,300 2.7 3.8 1.5D. Manufacturing 46,200 5.4 4.7 6.1E. Electricity, Gas and Water supply 15,800 1.8 2.5 1.1F. Construction 17,500 2.0 2.9 1.1G. Wholesale and Retail Trade 98,100 11.4 9.6 13.3H. Hotels and Restaurants 13,700 1.6 1.0 2.2I. Transport, Storage and Communications 51,000 5.9 8.4 3.2J. Financial Intermediation 6,300 0.7 0.7 0.8K. Real Estate, Renting and Business Activities 10,100 1.2 1.4 1.0L. Public Administration 52,100 6.0 7.8 4.2M. Education 63,300 7.3 4.5 10.4N. Health and Social Work 38,000 4.4 1.9 7.1O. Other Community, Social Activities 22,300 2.6 2.4 2.7P. Private Households with Employed Persons 900 0.1 0.1 0.1Q. Extra-Territorial Organizations 1200 0.1 0.1 0.1All Industry Tabulation Categories 862,500 100.0 100.0 100.0
Number 862,500 448,900 413,600 Main Occupation of Currently Employed Population 6.6 The currently employed population classified by major occupation group and sex is shown in Table 42. According to these estimates there were an estimated 33,300 legislators, senior officials and managers that amounted to 3.9% of the total employed population. What is most significant in the occupational distribution is the fact that 1 out of 8 of the employed persons were professionals which group was estimated at 103,300. The majority of professionals were females numbering 66,000. As expected the large majority of the employed population estimated at 392,000 (45.4%) were engaged in skilled agricultural activities including livestock production. The sectoral share of this sector was kept at this level by the participation of an estimated 181,000 women in these activities.
Table 42: Currently employed population classified by major occupation group of the main occupation
Both Sexes Male Female Major Occupation Group Number % % %
1. Legislators, senior officials and managers 33,300 3.9 5.0 2.62. Professionals 103,300 12.0 8.2 16.13. Technicians and associate professionals 40,600 4.7 3.5 6.04. Clerks 17,600 2.0 1.1 3.15. Service workers 97,600 11.3 8.0 14.96. Skilled agricultural workers 392,000 45.4 47.0 43.87. Craft and related trade workers 68,200 7.9 9.9 5.78. Plant and machine operators and assemblers 56,400 6.5 11.6 1.19. Elementary occupations 51,200 5.9 5.3 6.610. Other 2,300 0.3 0.4 0.1All major occupation groups 862,500 100.0 100.0 100.0
Number 862,500 448,900 413,600
49

The service workers were estimated at 11.3% of the total employed population. In this sector, the majority of workers were females which number was estimated at 62,000. There were an estimated 68,200 craft and related trade workers, and a further 56,400 plant and machinery operators, when taken together these two major groups constituted 14.0% of the employed population.
Employment Status
6.7 Altogether 7 employment status categories were identified including 2 categories of paid employees namely, paid employee on contract and paid employees under civil law. Nearly 2 out of every 5 workers were from these two categories and when taken together numerically they amounted to 338000 employed persons comprising 165,800 male workers and 172,800 female employees (See Table 10 in Annex 1). As seen in Graph 8, of the total employed, only 3.1% were paid employees under civil law. More than one third of the work force was own account workers and a further 1 out of 4 employed were unpaid family workers and these two employment status categories accounted for nearly 60.0% of the total employed population. An estimated 131,900 or 31.0% of the employed females had been working as unpaid family workers. Another striking feature of the employment status distribution was the small proportion of employers that amounted to 0.5 percent. It is indicative of the low numerical magnitude and pattern of dispersal of small and medium scale businesses in the country.
Graph 8 Employment status of the currently employed population in their main occupation
Other0.1%
Unpaid family worker0.2%
Own account worker0.5%
Paid employee on contract36.3%
Paid employee under civil law
3.1%
Employer34.9%
Member of cooperative
24.8%
Sector of Employment 6.8 The break down of employed population by sector of employment, region and urban and rural sector provided in Table 43 shows that 56.1% (484,000) were self-employed and about 10% had worked in limited liability companies. One out of 5 (170,000) had worked in government enterprises. In the urban sector, as many as 3 out of 10 employees worked for government enterprises and this proportion was low as 1 out of 10 employees in the rural sector. In the rural sector, 80% of the employed persons were self-employed. In Ulaanbaatar, nearly one third of the employed persons had worked in government enterprises while another 3 out of 10 employed persons had worked in limited liability companies.
50

Table 43: Currently employed population aged 15 years and over by sector of employment and region
Sector/ Region Mongolia Sector of employment cross
Number % Urban Rural Central East West Hangai UB
Private enterprise 33,100 3.8 2.9 4.6 5.7 1.5 1.3 7.6 1.2
Partnership 2,600 0.3 0.6 0.1 0.2 0.3 0.1 0.3 0.6
Cooperative 4,500 0.5 0.5 0.5 0.5 0.7 0.9 0.4 0.3
Joint state and private company 39,000 4.5 8.6 1.2 5.7 3.9 1.5 2.5 8.4
Limited liability company 84,000 9.7 19.4 1.7 6.1 2.8 2.2 2.3 28.8
State industry 32,200 3.7 7.1 0.9 6.2 3.9 1.1 3.8 3.9
Government enterprise 170,000 19.7 30.5 10.7 18.3 18.3 14.2 14.6 31.2
Non-profit organization 13,100 1.5 3.0 0.3 1.8 0.7 0.6 0.6 3.3
Self-employed 484,000 56.1 27.4 80.0 55.6 67.9 78.1 68.1 22.3
Total (%) 100.0 100.0 100.0 100.0 100.0 100.0 100.0 100.0
Number 862,500 392,300 470,200 167,300 68,300 175,600 233,300 218,000
Occupational Distribution of Employment by Industrial Sector 6.9 The currently employed population grouped by industry tabulation categories cross-classified by occupation group is presented in Table 44. The composition of the industry sector in terms of the number employed in each major occupation group is given therein. According to the break down provided for the agriculture, hunting and forestry sector only 0.8% of professionals had worked in the sector although the sector is as large as 46.6% of total employment. The table also shows that more than 1 out of 4 senior officials and managers, 11.6% of professionals and 24.6% of technicians had worked in the public administration sector. More than 1 out of 3 professionals and 1 out of 8 technicians had worked in the education sector. The table is useful as an industry-occupation matrix which provides the current deployment or utilization pattern of manpower in industry tabulation categories. Table 44: Population currently employed by main economic activity tabulation categories
cross classified with major groups of primary occupations Total
Number % Legislat
ors Professiona
ls Technici
ans Clerks Service workers
Sk. Agri. workers
Craft Trade.
workers
Plant. Mach.
Operator
Elementary
Agriculture, hunting ,forestry 402,200 46.6 2 0.8 0.8 2.3 1.3 98.9 1.2 3.5 15.9
Fishing 500 0.1 0 0 0.1 0.1 0 0 0.1 0.1 0.4
Mining, Quarrying 23,300 2.7 4.1 2.1 2 3.1 1.4 0.1 16 5.9 4.2
Manufacturing 46,200 5.4 10.1 3.6 3.3 7.2 2.2 0.2 40.6 5.5 5.5
Electricity, Gas ,Water 15,800 1.8 2.6 2.4 1.8 5.2 0.2 0 8.7 4.6 3.6
Construction 17,500 2 2.3 2.2 1.5 2.4 0.5 0 14.4 3.3 2.3
Wholesale, Retail trade 98,100 11.4 19.4 4.2 8.7 8.8 61.7 0.5 5.4 4.6 25.6
Hotel, ,Restaurant 13,700 1.6 4.1 0.5 0 1.6 9.3 0 0.8 0.7 2.7 Transport, Communication 51,000 5.9 5.7 3.7 5.5 22.8 3.1 0 4 50.8 8.3
Financial 6,300 0.7 3.2 2.7 2.2 5.1 0.3 0 0 0.1 0.6
Renting, Business 10,100 1.2 2.6 3.6 4.2 3 0.7 0 1.4 1.2 1.6
Public Administration 52,100 6 26.8 11.6 24.6 18.1 6.6 0.1 3 8.3 8.3
Education 63,300 7.3 7.3 37.9 15.9 10.7 4.7 0 1.5 4.2 10.2
51

Health, Social Work 38,000 4.4 2.2 18 23.5 3.4 3.2 0 1 4.3 4.1
Other Community 22,300 2.6 7.6 6.1 5.7 5.7 4.3 0 1.9 2.5 5.9
Private Households 900 0.1 0.1 0.1 0.1 0 0.5 0 0 0.1 0.5 Extra territorial organizations 1,200 0.1 0 0.6 0.1 0.6 0.1 0 0 0.2 0.2
Total (%) 100.0 100.0 100.0 100.0 100.0 100.0 100.0 100.0 100.0 100.0
Number 862,500 33,300 103,300 40,600 17,600 97,600 392,000 68,200 56,400 53,500
Secondary employment 6.10 The survey also collected information on persons who were engaged in a secondary occupation in addition to their primary occupation. The total number of persons who were engaged in such secondary occupations was estimated as 23,900. Thus only a small percentage of 3.0% of the employed population had worked in a secondary occupation. This is consistent with the rather long hours that the working population had worked in their primary jobs. Highly seasonal weather conditions with severe winters could have had a bearing on the labour demand under the current occupational profile and industrial structure that restricted work in a second job. One out of 2 persons who had a second job were those who had worked in service and skilled agricultural and animal husbandry occupations. About 2,200 persons had worked as professionals on a second job while a further 1,000 persons had worked in a second occupation which is grouped under legislators, senior officials and managers.
Table 45: Employed population classified by major occupation group of
the secondary occupation Both Sexes Male Female Major Occupation Group
Number % % % 1. Legislators, senior officials and managers 1,000 4.0 5.0 2.5 2. Professionals 2,200 9.4 7.9 11.7 3. Technicians and associate professionals 900 3.8 3.0 5.1 4. Clerks 300 1.3 1.2 1.4 5. Service workers 4,500 18.8 13.6 26.9 6. Skilled agricultural workers 7,200 30.1 29.7 30.7 7. Craft and related trade workers 3,800 15.7 16.5 14.5 8. Plant and machine operators and assemblers 2,700 11.5 17.5 2.0 9. Elementary Occupations 1,200 5.2 5.5 4.7 10. Other 100 0.2 0.0 0.6 All Major Occupation Groups 23,900 100.0 100.0 100.0
Underemployed Population
6.11 The resolution concerning statistics on the economically active population adopted at the ILO Thirteenth International Conference of Labour Statisticians, had described that “underemployment exists when a person’s employment is inadequate in relation to specified norms or alternative employment, account being taken of his or her occupational skill (training and work experience). Two principal forms of underemployment may be distinguished: visible and invisible.” 6.12 Visible underemployment is primarily a statistical concept directly measurable by labour force and other surveys, reflecting an insufficiency in the volume of employment. Invisible underemployment is primarily an analytical concept reflecting a misallocation of labour resources or a fundamental imbalance between labour and other factors of production. “For
52

operational reasons, the statistical measurement of underemployment may be limited to visible underemployment” 6.13 According to the ILO definition of visible underemployment, persons visibly underemployed comprise all persons in paid or self employment, whether at work or not at work, involuntarily working less than the normal duration of work determined for the activity, who were seeking or were available for additional work during the reference period. 6.14 In the measurement of visible underemployment there are two elements viz
- the number of persons visibly underemployed and - the quantum of visible underemployment.
6.15 In order to obtain a comprehensive picture on the employment condition of the population, the survey collected information from the currently employed population on their availability for more work. This information was elicited from all persons aged 5 years and over who were currently employed. In order to estimate visible underemployment it is necessary to take account of the duration they had engaged themselves in work during the reference week include only those who had worked less than the minimum stipulated duration. Although the person may have sought additional work in spite of having worked long hours, such persons should not be included as the visible underemployed in any analysis as it would merely inflate the underemployed population. Their desire to seek additional work may have been guided by considerations such as, their low employment earnings in poorly remunerated low productivity tasks; and jobs where actual time spent on work is shorter than the duration accepted as working hours.
6.16 The survey had collected information on whether the respondents were available for more and if they had sought more work.
6.17 The employed population that reported that they were available for more work broken down by sex and sector is given in Table 46. The estimated total number of employed persons who were available for more work and accordingly underemployed based on the respondents own perceptions of their employment was estimated as 58,200 comprising 34,400 males and 23,800 females. Thus, the number who considered themselves to be underemployed was rather low. The proportions that sought additional work when related to the total number of employed amounted to only 7.7% and 5.8% in respect of both sexes, males and females. It should be noted that these estimates of underemployed are inclusive of those who had worked for more than say 40 hours in the reference week who may have been excluded if such a norm had been exceeded.
Table 46: Sectoral and regional distribution of the underemployed Population
Both Sexes Males Females Sector/Region Number % Number % Number % Urban 20,800 35.7 11,800 34.3 9,000 37.9Rural 37,400 64.3 22,600 65.7 14,800 62.1 Central 21,700 37.3 13,100 38.2 8,600 35.9East 13,000 22.4 8,000 23.3 5,000 21.2West 12,800 21.9 7,600 22.0 5,200 21.7Khangai 3,300 5.7 1,900 5.6 1,400 5.9Ulaanbaatar 7,400 12.7 3,800 10.9 3,600 15.3Mongolia 58,200 100.0 34,400 100.0 23,800 100.0
53

6.18 Table 47 presents the employed population available for more work classified by employment status. It is observed that a total of 18,300 persons or 31.4% of the underemployed were paid employees on contract, employers and cooperative members. Further, the self-employed and the unpaid family workers when taken together accounted for more than 2 out of 3 of all employed that sought additional work.
Table 47: Underemployed classified by employment status of the employed population in their main occupation
Both Sexes Male Female Employment Status Category Number % % % 1. Paid employee on contract 16,300 28.0 23.7 34.3 2. Paid employee under civil law 1,500 2.6 3.1 1.8 3. Employer 400 0.7 0.9 0.5 4. Member of cooperative 100 0.1 0.2 0.0 6. Own account worker 23,200 39.9 48.6 27.2 7. Unpaid family worker 16,600 28.6 23.5 36.0 8. Other 100 0.1 0.0 0.2 All Employment Status Categories 58,200 100.0 100.0 100.0
6.19 As stated earlier, employed persons who sought additional work despite the fact they had worked for more than 40 hours could be those in receipt of low employment incomes and persons attempting to work additional hours to enhance their incomes. In order to derive an estimate taking the duration of work of the underemployed in to account, those who have worked for more than 40 hours in the reference week will have to be excluded. The reasons for not seeking additional work, was sought from the employed population who were not available for more work. It enables the population working less than 40 hours to be sub-divided into two groups with those who sought additional work and those who did not seek additional work.
54

Chapter 7
Unemployed Population
7.1 The international standard definition for unemployment developed by ILO was based on 3 criteria, namely: without work; currently available for work; and seeking work. In developing countries where the labour markets are not fully organized and where there are discouraged workers, the seeking work criterion is often not applied. The unemployed for the purpose of the LFS was defined as persons who were in the labour force who did not work or had no job or business during the reference week, but were reported available, and actively looking for work. Also considered as unemployed were persons without a job or business who were reported as available for work, but were not looking for work because of their belief that no work was available or because of temporary illness/disability, bad weather, pending job application or waiting for job interview.
7.2 The unemployment rates disclosed in the LFS 2002-2003 cannot be strictly compared with the estimates derived from previous statistical surveys. The definitions used in LFS 2002-2003 for measuring employment and unemployment that conform to international standards recommended by ILO are not strictly comparable to those used in the earlier inquiries. For instance the Census of Population 2000 defined unemployed as “persons who did not work during the past seven days were not temporarily absent from a job and were looking for work at the time of the census”. Census of Population 2000 estimated the total unemployed population at 164,900. The definition used in this survey that was described earlier is less restrictive allowing the inclusion of even discouraged workers who were available for work but did not actively seek employment because they thought no work was available, than the definition adopted in the Census of Population. The annual employment survey and monthly records define work age and work capable people , available and in active search of work registered with employment registered offices as unemployed in accordance with Resolution jointly issued by the NSO Chairman and SWL Minister dated on October 2002. By the end of 2003 the unemployed registered with the employment offices is 33,300. This number is very restrictive to only registered unemployed.
Unemployed Population 7.3 In terms of the current activity status based on the reference period of last 7 days before the survey, the total number of currently unemployed was estimated as 142,300 comprising 74,600 males and 67,700 females. The unemployment rate was reported as 14.2% with 14.2% for males and 14.1% for females. The unemployment rates among males were marginally higher in the urban sector but they were lower than that of females in the rural sector.
Sectoral Distribution
7.4 The unemployed in the urban sector was higher with over 60% of the total unemployed population. The unemployment among males was even more concentrated in the urban sector with nearly 2 out of 3 unemployed being located within the sector. The regional distribution of unemployed is also skewed with more than 1 out of 4 unemployed being located in the Central Region while the Eastern Region had only about 10.8% of the total unemployed in the country. Ulaanbaatar had over 31,200 unemployed or 22.0% of total unemployed in the country. The male and female shares of unemployed in the regions have been close.
55

Table 48: Sectoral and Regional Distribution of the unemployed population by sex
Unemployed Population Unemployment Rate
Both Sexes Males Females Both sexes Male Female
Sector/Region
No. % No. % No. % % % % Urban 90,300 63.5 47,900 64.2 42,400 62.7 18.7 19.3 18.1 Rural 52,000 36.5 26,700 35.8 25,300 37.3 10.0 9.7 10.3 Region Central 37,300 26.2 20,700 27.8 16,600 24.5 18.2 19.3 17.1 East 15,400 10.8 8,100 10.8 7,300 10.8 18.4 18.2 18.6 West 21,200 14.9 10,500 14.0 10,700 15.9 10.8 10.1 11.5 Khangai 37,200 26.1 18,200 24.4 19,000 28.0 13.7 13.0 14.6 Ulaanbaatar 31,200 22.0 17,100 23.0 14,100 20.8 12.5 13.4 11.6 Mongolia 142,300 100.0 74,600 100.0 67,700 100.0 14.2 14.2 14.1
Unemployment Rates
7.5 The unemployment rate had declined from 18.0% in the 1st quarter to 15.0% in the 2nd quarter, then to 13.2% in the 3rd quarter and finally to 10.7% in the 4th quarter. The seasonal variations in the demand for labour had mainly contributed to the reported changes in the unemployment levels.
Graph 9 Quarterly Estimates of Unemployment Rates
0.0
5.0
10.0
15.0
20.0
25.0
30.0%
Census 2000 17.5 24.4 10.2All Ouarters 14.2 18.7 10.0Q1 18.0 22.0 14.0Q2 15.0 19.4 10.8Q3 13.2 18.3 8.6Q4 10.7 15.1 6.9
Mongolia Urban Rural
Graph 9 presents the changes in labour force indicators over the 4 quarters of the survey from October 2002 to September 2003. The unemployment rates for males and females by quarters have been close.
56

Table 49: The number of unemployed persons and unemployment rate by sectors, regions and sex
Region Total Male Female Unemployed person
Total 142,300 74,600 67,700 Urban 90,300 47,900 42,400 Rural 52,000 26,700 25,300
Unemployement rate, %Total 14.2 14.2 14.1 Urban 18.7 19.3 18.1 Rural 10.0 9.7 10.3
1st quarter Total 18.0 17.8 18.2Urban 22.0 23.1 20.7 Rural 14.0 12.6 15.6
2nd quarter Total 15.0 15.4 14.5 Urban 19.4 20.9 18.0 Rural 10.8 10.6 11.1
3rd quarter Total 13.2 13.5 12.9Urban 18.3 18.4 18.2Rural 8.6 9.1 8.1
4th quarter Total 10.7 10.4 10.9 Urban 15.1 14.8 15.4 Rural 6.9 6.8 7.0
Age Distribution of Unemployed 7.6 The distribution of unemployed by age, presented in Table 50 shows that 57.3% of the unemployed were in the age groups of 15-34 years. The percentage of unemployed in the age groups between 35-49 years had amounted to 35.9% of the unemployed population. As much as 18.4% of all unemployed both males and females were concentrated in the age group of 20-24 years. Number of unemployed declines thereinafter and reaches 12,100 in the age group 45-49 years. Thus, it is seen that unemployment is a phenomenon that afflicts primarily persons in youth age groups particularly those who were new entrants to the workforce. 7.7 There is a broad similarity in the age distributions of unemployed males and females. The incidence of teenage unemployment was higher than other age groups. The unemployment rate of 13.1% reported for teenage females aged 15-17 years increases to 25.3% in respect of females aged 18-19 years. It declines to 21.2% for females aged 20-24 years. Unemployment rates of males increase steadily in the age groups between 15 years to 24 years and decline thereafter. Involuntary worklessness had affected males in working age groups and it is important to note that males in the age group 25-54 years had unemployment rates as high as 13% to 15.0%.
Table 50: Age Distribution of Unemployed Both sexes Age group
Number % Male
% Female
% 15-17 4,400 3.1 3.3 2.8 18-19 9,300 6.6 6.8 6.3 20-24 26,200 18.4 18.8 17.9 25-29 21,400 15.0 15.0 15.1
57

30-34 20,400 14.3 13.8 15.0 35-39 22,300 15.7 13.0 18.7 40-44 17,000 12.0 11.7 12.3 45-49 12,100 8.5 9.6 7.3 50-54 5,600 3.9 4.9 2.8 55-59 2,000 1.4 1.6 1.1 60-64 1,200 0.9 1.2 0.6 65-69 300 0.2 0.2 0.1 70+ 100 0.1 0.1 0.1 All age groups % 100.0 100.0 100.0 Number 142,300 74,600 67,700
Graph 10
Age and sex specific unemployment rates
0.0
5.0
10.0
15.0
20.0
25.0
15-19 20-24 25-29 30-34 35-39 40-44 45-49 50-54 55-59
Age group
% Female
Male
Duration of Unemployment
7.8 Table 51 shows that the majority of unemployed persons both males and females had been unemployed only for brief periods with nearly 3 out of 5 unemployed persons having been unemployed for a short duration of less than 1 month. A further, 8.0% or 1 out of 12 unemployed have been seeking work for periods ranging from 1 month to 1 year. It is also seen that 1 in 3 unemployed persons had been unemployed for periods in excess of one year with more than 22.8% of the unemployed having been in a state of workless-ness for periods in excess of 3 years. Thus it is seen that there is a hard core of unemployed numerically equivalent to 1 out of 5 unemployed who had failed to secure employment for durations longer than 3 years. There were no major differences in the unemployment duration of males and females. The proportion of males unemployed for periods in excess of 1 year are somewhat higher at 37.1% of total number of males unemployed, whereas in the case of females this percentage was lower at 32.9%.
Table 51: Duration of unemployment by sector and sex Mongolia Urban Rural
Duration Unemployed
Both sexes
%
Male %
Female %
Both sexes
%
Male %
Female %
Both sexes
%
Male %
Female %
58

<1 month 56.9 54.7 59.3 51.5 48.8 54.6 66.2 65.2 67.1 1-3 month 2.0 2.1 1.8 2.1 2.3 1.7 1.9 2.0 1.9 4-6 month 3.8 3.4 4.2 3.9 3.2 4.7 3.6 3.6 3.6 7-11 month 2.3 2.7 1.8 3.0 3.5 2.5 1.0 1.3 0.7 1-2 years 12.3 12.5 12.1 14.8 15.0 14.6 7.9 8.0 7.8 3+ years 22.8 24.6 20.8 24.7 27.2 21.9 19.4 19.9 18.9 All durations % 100.0 100.0 100.0 100.0 100.0 100.0 100.0 100.0 100.0
Number 142,300 74,600 67,700 90,300 47,900 42,400 52,000 26,700 25,300
Educational Level of the Unemployed 7.9 One in four unemployed persons have technical and vocational diploma level or over. Persons who had no education or only primary level education appear to accept any kind of work that is available and unemployment among them is rather low. Table 52 shows that about 17.7% of the unemployed were those with technical and vocational diploma level qualifications and with degrees from universities. It should be noted that 1 out of 12 unemployed males had a degree or a post graduate qualification and this percentage is higher among females rising to 10% of the total unemployed female population. At the other end of the spectrum, only 9% of the unemployed were those with no education or only a primary education. In the population aged 15 years and over the percentage of persons who had no education or only primary level education amounted to 21.7%, a percentage that is twice the proportion recorded in the unemployed population (see Table 23).
Table 52: Unemployed population by the highest grade/level successfully completed
Mongolia Urban Rural Educational Level Both %
Male %
Female %
Male %
Female %
Male %
Female %
None 2.6 2.8 2.4 2.0 1.3 4.1 4.2Primary 6.4 7.0 5.8 5.2 3.9 10.4 9.0Incomplete secondary 33.5 38.3 28.1 34.0 22.5 46.3 37.6Completed secondary 31.6 28.3 35.3 32.4 39.4 21.0 28.4Initial technical/vocational diploma 8.2 9.0 7.3 9.3 6.8 8.3 8.1Technical/vocational diploma 8.9 6.9 11.1 7.3 12.7 6.1 8.3University graduate 8.8 7.7 10.0 9.8 13.4 3.8 4.4
All educational levels % 100.0 100.0 100.0 100.0 100.0 100.0 100.0Number 142,300 74,600 67,700 47,900 42,400 26,700 25,300
Occupational Preferences 7.10 The occupational preferences of the unemployed are of special significance as they do not match with the occupational profile of the employed population shown in Table 53. Only 4.1% of the unemployed had opted for skilled agricultural and animal husbandry occupations. The occupational profile of the employed population given in Table 42 shows that a percentage as high as 45% had been working as skilled agricultural workers and therefore the opportunities that arise through the withdrawal of workers as a result of retirements and deaths would primarily
59

emerge in these occupational categories. The better educational attainments of the new entrants to the labour force had shifted the occupational aspirations out of skilled agricultural occupations and elementary occupations into work as service workers, craft and related trade workers and plant and machine operators and assemblers. Thus, it is seen that there is already a mismatch between the available opportunities and expectations of the new entrants to the labour force. About 9.2% or 1 out of 11 unemployed had expectations of finding employment in professional level occupations and this percentage among females was higher and rises to 13%. Nearly 19.3% of the unemployed have desires of securing work as service and sales workers and this proportion is higher among females where 1 out of 3 unemployed females seek such work. An examination of the occupational aspirations of the males shows that over 61.2% of the unemployed males have been aspiring to be craft and related trade workers, plant and machine operators and assemblers, but in the current profile the share of these two occupational groups amounted to less than 14.4% of the total employed population (See Table 42). This means that apart from the opportunities that accrue through withdrawals from the labour force through retirements and deaths in these occupations, they will have to be supplemented by new opportunities to meet the demand in these occupations. Although the new entrants to the labour force have better educational attainments, 1 out of 5 females are still willing to accept elementary occupations where no skills are required.
Table 53: Percentage distribution of occupations desired by unemployed persons by major occupation group
Both sexes Male Female Major Occupation Group Number % Number % Number %
Legislators, senior officials and managers 1,100 0.8 800 1.1 300 0.4Professionals 13,100 9.2 4,300 5.8 8800 13.0Technicians and associate professionals 5,500 3.9 2,500 3.3 3000 4.5Clerks 3,900 2.7 1,200 1.5 2700 4.0Service and shop and market sales workers 27,500 19.3 6,800 9.0 20700 30.6Skilled agricultural and fishery workers 5,900 4.1 3,500 4.7 2400 3.5Craft and related trades workers 36,100 25.4 20,900 28.1 15200 22.4Plant and machine operators and assemblers 26,400 18.6 24,700 33.2 1700 2.5Elementary occupations 22,700 15.9 9,800 13.2 12900 19.0Other 100 0.1 100 0.1 0 0.1All Major Occupation Groups 142,300 100.0 74,600 100.0 67,700 100.0
Steps Taken to Find Work
7.11 The LFS also canvassed information from the unemployed on what steps they had taken to seek work during the 30 days preceding the survey. Of the total unemployed population of 142,300 only an estimated 62,600(44%) had reported that they had taken steps to seek work during the 30 days preceding the survey.
60

Table 54: Steps taken to find employment by unemployed persons Mongolia Urban Rural Steps taken to find
Employment Both %
Male %
Female %
Both %
Male %
Female %
Both %
Male %
Female %
Registered at Employment Office 11.8 11.8 11.9 9.5 9.1 10.0 17.6 18.7 16.4 Responded to job advertisements 22.4 21.9 23.0 29.8 28.7 31.4 3.6 3.8 3.5 Applied to prospective employers 8.2 7.3 9.2 5.2 4.6 5.9 15.7 14.8 16.7 Checked at farms, factories, work sites etc 23.0 23.2 22.7 22.6 23.1 22.0 23.9 23.5 24.3 Sought help from friends or relatives 30.3 31.1 29.3 28.7 29.7 27.5 34.4 34.9 33.7 Looked for land and property to set up business 2.7 2.8 2.6 2.6 2.9 2.1 3.1 2.5 3.8 Other 1.6 1.9 1.3 1.6 1.9 1.1 1.7 1.8 1.6 All methods used % 100.0 100.0 100.0 100.0 100.0 100.0 100.0 100.0 100.0
Number 62,600 34,500 28,100 44,800 25,100 19,700 17,800 9,400 8,400 Table 54 shows that the main method resorted to find work had been to seek help from friends or relatives and 30.3% had used this method. The proportion amounting to 22.4% had responded to job advertisements and 23.0% checked at farms, factories, worksites, etc. in their search for work. Less than 1 out of 12 unemployed persons who had used any method to seek work, had registered at the Employment Offices to find work. While only 9.5% of the unemployed in the urban sector who used any method to seek work had registered themselves at Employment Offices, a relatively higher percentage amounting to 17.6% of rural unemployed had registered themselves in these Employment Offices. Reasons for Not Seeking Work 7.12 The survey also collected information as to the main reason, which made them not to look for work during the 30 days preceding the survey. Of the total unemployed population as much as 55.9% of the unemployed had not been looking for work. Table 55 shows that the majority of those who did not look for work that amounted to 68.9% had not sought work as they thought that no work was available.
Graph 11
Main reasons for unemployed persons not seeking work during the last 30 days preceding the survey
61
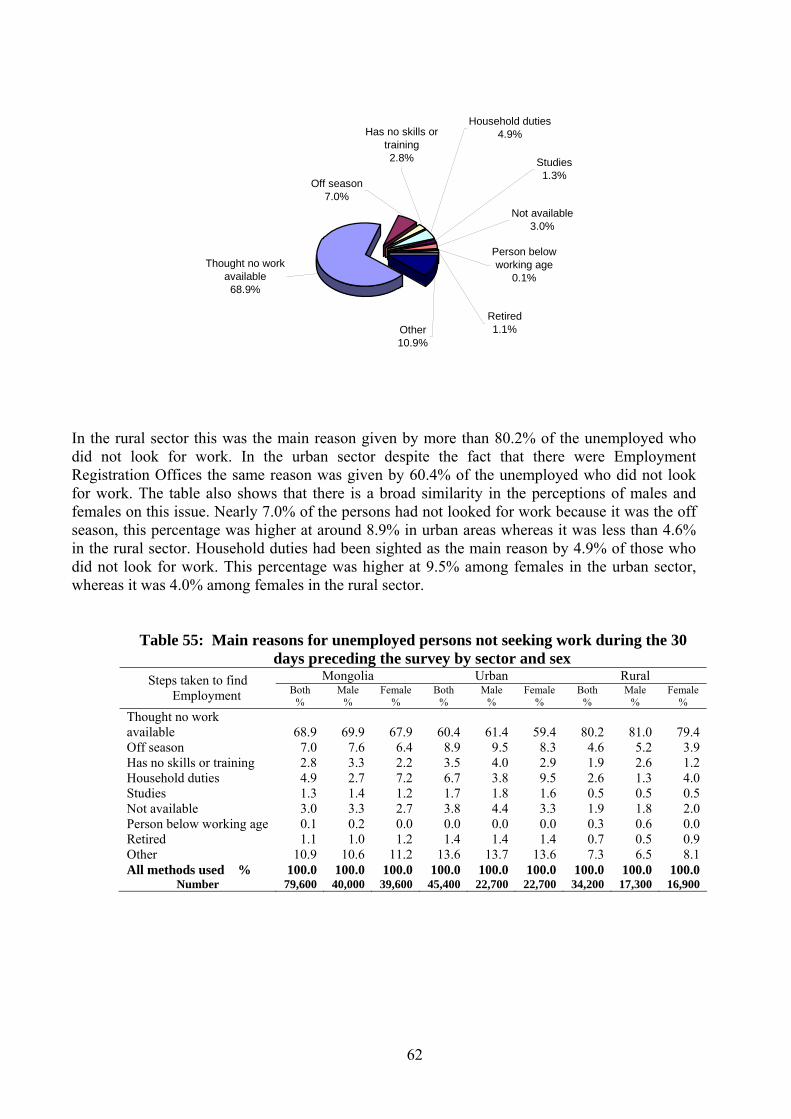
Thought no work available 68.9%
Has no skills or training2.8%
Other10.9%
Retired1.1%
Person below working age
0.1%
Off season7.0%
Studies1.3%
Household duties4.9%
Not available3.0%
In the rural sector this was the main reason given by more than 80.2% of the unemployed who did not look for work. In the urban sector despite the fact that there were Employment Registration Offices the same reason was given by 60.4% of the unemployed who did not look for work. The table also shows that there is a broad similarity in the perceptions of males and females on this issue. Nearly 7.0% of the persons had not looked for work because it was the off season, this percentage was higher at around 8.9% in urban areas whereas it was less than 4.6% in the rural sector. Household duties had been sighted as the main reason by 4.9% of those who did not look for work. This percentage was higher at 9.5% among females in the urban sector, whereas it was 4.0% among females in the rural sector.
Table 55: Main reasons for unemployed persons not seeking work during the 30
days preceding the survey by sector and sex Mongolia Urban Rural Steps taken to find
Employment Both %
Male %
Female %
Both %
Male %
Female %
Both %
Male %
Female %
Thought no work available 68.9 69.9 67.9 60.4 61.4 59.4 80.2 81.0 79.4 Off season 7.0 7.6 6.4 8.9 9.5 8.3 4.6 5.2 3.9 Has no skills or training 2.8 3.3 2.2 3.5 4.0 2.9 1.9 2.6 1.2 Household duties 4.9 2.7 7.2 6.7 3.8 9.5 2.6 1.3 4.0 Studies 1.3 1.4 1.2 1.7 1.8 1.6 0.5 0.5 0.5 Not available 3.0 3.3 2.7 3.8 4.4 3.3 1.9 1.8 2.0 Person below working age 0.1 0.2 0.0 0.0 0.0 0.0 0.3 0.6 0.0 Retired 1.1 1.0 1.2 1.4 1.4 1.4 0.7 0.5 0.9 Other 10.9 10.6 11.2 13.6 13.7 13.6 7.3 6.5 8.1 All methods used % 100.0 100.0 100.0 100.0 100.0 100.0 100.0 100.0 100.0
Number 79,600 40,000 39,600 45,400 22,700 22,700 34,200 17,300 16,900
62

Chapter 8
Usual Activity
Introduction 8.1 In order to obtain a more complete picture of the labour supply and demand situation, the economic activity status of the population over a long reference period of 12 months based on the usually active population measurement concept recommended by the ILO was also adopted in the survey. Where agriculture, animal husbandry and informal sectors are large and where there is seasonality of employment the measurement of the activity status over a long reference period is particularly necessary to make an accurate assessment of the employment situation. According to the concept of usually active population used in conjunction with the reference period of the last 12 months, persons who had worked (employed) and or are available or are seeking work (unemployed) when taken together are more than 6 months then they are reckoned as economically active and if it is less than 6 months then the persons are treated as economically inactive. Usually active persons who had been employed for a longer period than the duration for which the person was unemployed in the last 12 months is accepted as employed, and if the person had worked less than the number of months he was unemployed is reckoned as unemployed. 8.2 There are certain distinguishing characteristics of usually economically active status. The measurements based on the usual status concept are for all practical purposes not affected by seasonality since it takes the entire one full year as the reference period. Whereas in the case of the current activity concept the employment and unemployment measures are affected by seasonality due to changes in the volume of economic activity in the different seasons. Another major difference arises due to the fact that some of the unemployed under the usually active concept include persons who had been unemployed for a longer duration though they may have worked and been employed sometime during the year. In the case of unemployed under the currently active concept, unemployed are persons who had not worked at all during the brief reference period used in the measurement. There is an important difference in the classification into economically active and economically inactive under the two concepts. Under the usually active concept first a decision is made as to whether the respondent was usually active or usually inactive considering the persons activities over the one year reference period. Only after the classification of the person as usually active or inactive, the person’s status as employed or unemployed is decided upon taking the longer of the two durations of employment and unemployment status over the whole one year reference period as the activity status 8.3 The usually active population aged 15 years and over broken down by activity status is presented in Table 56 which shows that 941,500 persons comprising 492,200 males and 449,300 females were estimated as usually active. The usually active employed population was marginally lower at 856,600 than the estimated currently active population that was estimated as 862,500 by 5,900. The unemployed population under the usually active concept was estimated at 84,900 which is substantially lower than the current status estimate of 142,300. The lowering of the number unemployed under the usually active concept had raised the not usually active population to 597,800. Thus it is evident that as many as 63,400 persons who were classified as unemployed under the labour force concept had been transferred into the usually inactive and other categories under the usually active population concept. The usually active population
63
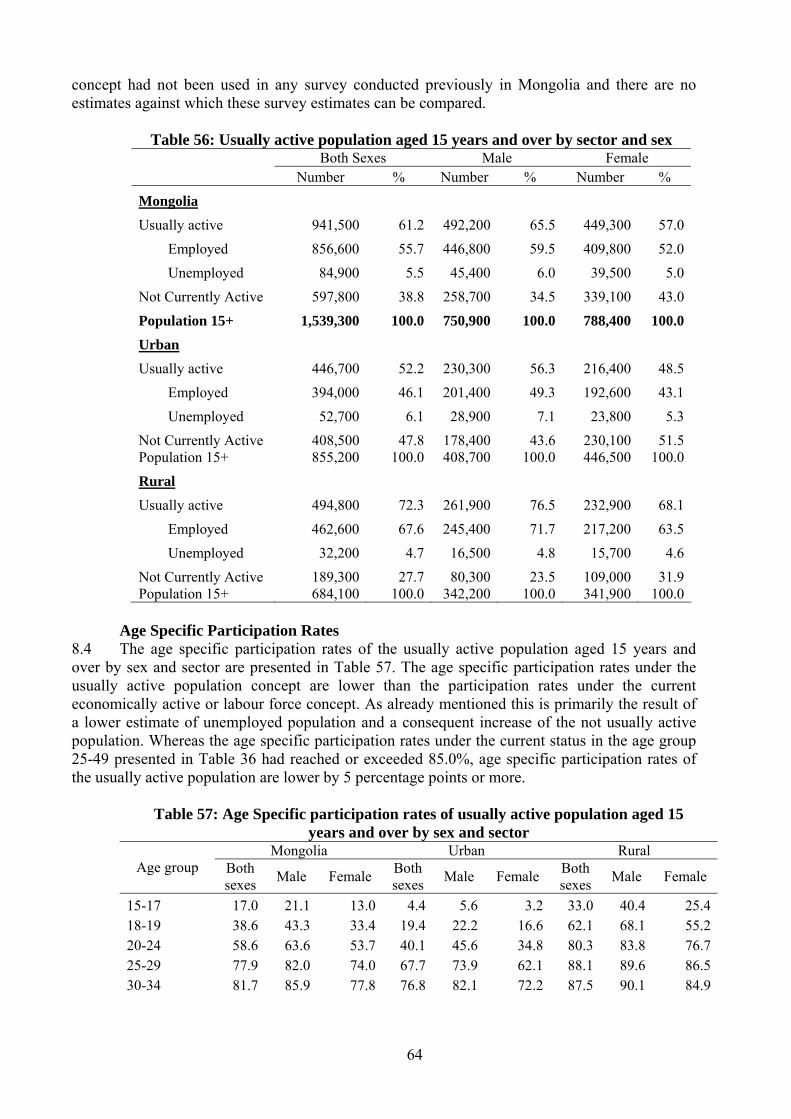
concept had not been used in any survey conducted previously in Mongolia and there are no estimates against which these survey estimates can be compared.
Table 56: Usually active population aged 15 years and over by sector and sex Both Sexes Male Female Number % Number % Number %
Mongolia Usually active 941,500 61.2 492,200 65.5 449,300 57.0 Employed 856,600 55.7 446,800 59.5 409,800 52.0 Unemployed 84,900 5.5 45,400 6.0 39,500 5.0Not Currently Active 597,800 38.8 258,700 34.5 339,100 43.0
Population 15+ 1,539,300 100.0 750,900 100.0 788,400 100.0Urban Usually active 446,700 52.2 230,300 56.3 216,400 48.5 Employed 394,000 46.1 201,400 49.3 192,600 43.1 Unemployed 52,700 6.1 28,900 7.1 23,800 5.3Not Currently Active 408,500 47.8 178,400 43.6 230,100 51.5Population 15+ 855,200 100.0 408,700 100.0 446,500 100.0
Rural Usually active 494,800 72.3 261,900 76.5 232,900 68.1 Employed 462,600 67.6 245,400 71.7 217,200 63.5 Unemployed 32,200 4.7 16,500 4.8 15,700 4.6Not Currently Active 189,300 27.7 80,300 23.5 109,000 31.9Population 15+ 684,100 100.0 342,200 100.0 341,900 100.0
Age Specific Participation Rates
8.4 The age specific participation rates of the usually active population aged 15 years and over by sex and sector are presented in Table 57. The age specific participation rates under the usually active population concept are lower than the participation rates under the current economically active or labour force concept. As already mentioned this is primarily the result of a lower estimate of unemployed population and a consequent increase of the not usually active population. Whereas the age specific participation rates under the current status in the age group 25-49 presented in Table 36 had reached or exceeded 85.0%, age specific participation rates of the usually active population are lower by 5 percentage points or more.
Table 57: Age Specific participation rates of usually active population aged 15 years and over by sex and sector
Mongolia Urban Rural Age group Both
sexes Male Female Both sexes Male Female Both
sexes Male Female
15-17 17.0 21.1 13.0 4.4 5.6 3.2 33.0 40.4 25.418-19 38.6 43.3 33.4 19.4 22.2 16.6 62.1 68.1 55.220-24 58.6 63.6 53.7 40.1 45.6 34.8 80.3 83.8 76.725-29 77.9 82.0 74.0 67.7 73.9 62.1 88.1 89.6 86.530-34 81.7 85.9 77.8 76.8 82.1 72.2 87.5 90.1 84.9
64

35-39 83.4 86.5 80.7 81.1 85.2 77.6 86.7 88.4 85.340-44 83.3 85.6 81.2 81.0 83.3 79.0 86.6 88.8 84.545-49 81.2 85.0 77.4 77.6 82.1 73.2 85.7 88.8 82.750-54 66.4 76.7 57.3 60.2 69.5 52.1 75.0 86.6 64.755-59 50.8 68.0 35.2 40.8 58.4 26.5 64.6 79.6 48.860-64 29.4 35.7 22.3 18.6 23.1 13.2 45.0 54.7 34.764-69 22.4 29.0 16.3 10.4 17.5 4.5 35.3 40.2 30.470 + 9.0 11.1 7.1 2.5 3.6 1.7 17.8 20.1 15.5
All age groups 61.2 65.5 57.0 52.2 56.3 48.5 72.3 76.5 68.1
Industrial Distribution
8.5 The industrial distribution of the usually active employed population aged 15 years and over by sex and sector is shown in Table 58.
Table 58: Usually active employed population aged 15 years and over classified by industry tabulation categories of main occupation
Both Sexes Males Females Industry Tabulation Category Number % Number % Number %
A. Agriculture, Hunting and Forestry 396,400 46.3 213,700 47.8 182,700 44.6 B. Fishing 400 0.1 200 0.1 200 0.0 C. Mining and Quarrying 21,200 2.5 15,900 3.5 5,300 1.3 D. Manufacturing 47,400 5.5 21,200 4.7 26,200 6.4 E. Electricity, Gas and Water Supply 16,200 1.9 11,800 2.6 4,400 1.1 F. Construction 18,600 2.2 13,700 3.1 4,900 1.2 G. Wholesale and Retail Trade 96,900 11.3 42,400 9.5 54,500 13.3 H. Hotels and Restaurants 13,500 1.6 4,900 1.1 8,600 2.1 I. Transport, Storage and Communications 50,800 5.9 37,200 8.3 13,600 3.4 J. Financial Intermediation 6,300 0.7 2,900 0.7 3,400 0.8 K. Real Estate, Renting and Business Activities 9,600 1.1 5,800 1.3 3,800 0.9 L. Public Administration 53,700 6.3 36,200 8.1 17,500 4.3 M. Education 63,500 7.4 20,400 4.6 43,100 10.5 N. Health and Social Work 38,100 4.4 8,900 2.0 29,200 7.1 O. Other Community, Social, … Activities 22,000 2.6 10,800 2.4 11,200 2.7 P. Private Households with Employed Persons 1,000 0.1 300 0.1 700 0.2 Q. Extra-Territorial Organizations 1,000 0.1 500 0.1 500 0.1
All tabulation categories 856,600 100.0 446,800 100.0 409,800 100.0
The industrial distribution of the usually active population shows that nearly one out of two male workers and more than two out of five female workers are engaged in agriculture and animal husbandry activities. The next largest industrial sector was the wholesale and retail trade which had employed 11.3% of the total employed population comprising 42,400 males and 54,500 females. Education, health and social work categories when taken together had contributed to 123,600 or 14.4% of total employment opportunities. Here females had dominated these three sectors with 83,500 females as against 40,100 males working in these sectors. It is seen that public administration, defence and compulsory social security had provided employment to 53,700 or 6.3% of the total employed population. In this sector 36,200 males and 17,500 females had been reported. A comparison with the industrial distribution of the employed population under the currently active status approach shows the numerical magnitudes and relative shares are broadly the same except for modest increases in the number employed in the agriculture,
65

hunting and forestry and mining and quarrying categories under the usually active population concept.
Occupational Distribution 8.6 The occupational distribution of the employed population under the usual activity status for the main occupation broken down by sex and sector is given in Table 59. Comparison with the corresponding Table 42 for current activity status shows that there are no major differences in the occupational distribution of the employed population under the usual activity status and labour force concept.
Table 59: Usually active employed population aged 15 years and over classified by major occupation group
Both Sexes Males Females Major Occupation Group
Number % Number % Number % Legislators, senior officials and managers 33,100 3.9 22,700 5.1 10,400 2.5
Professionals 103,100 12.0 36,800 8.2 66,300 16.2 Technicians and associate professionals 40,300 4.7 15,700 3.5 24,600 6.0
Clerks 17,500 2.0 4,800 1.1 12,700 3.1 Service and shop and market sales workers 100,000 11.7 38,100 8.5 61,900 15.1
Skilled agricultural and fishery workers 385,300 45.0 207,800 46.5 177,500 43.3
Craft and related trade workers 67,900 7.9 44,300 9.9 23,600 5.8
Plant and machinery operators and assemblers 57,600 6.7 52,700 11.8 4,900 1.2
Elementary occupations 51,800 6.1 23,900 5.4 27,900 6.8
All major occupation groups 856,600 100.0 446,800 100.0 409,800 100.0
Unemployed
8.7 The unemployed number and unemployed rates are lower under the usually active concept when compared with the rates reported under the currently active concept. Under the usually active concept a person to qualify to be treated as unemployed should be unemployed for a longer duration than the period for which the person was employed, and also the period for which the person was economically inactive and should also be less than 6 months. These two qualifications generally lower the unemployed number and rates, especially in situations where the unorganized sectors are large and work availability and intensity varies over the seasons. In this situation where any casual employment undertaken intermittently is added together usually results in raising the duration employed. Similarly, the economically inactive duration is also raised due to major changes in work availability due to seasonality.
Table 60: Age specific unemployment rates of usually active population
Unemployment rate Age group Both sex Male Female 15-17 9.1 8.5 10.1 18-19 18.1 17.1 19.4 20-24 13.8 14.4 13.2 25-29 8.4 8.3 8.6
66

30-34 8.7 8.9 8.6 35-39 8.7 7.9 9.4 40-44 7.8 8.4 7.3 45-49 7.9 9.8 5.9 50-54 6.7 7.7 5.6 55-59 3.9 3.2 5.2 60-64 4.5 4.7 4.1 64-69 1.3 0.9 2.0
All age groups 9.0 9.2 8.8 8.8 Age specific unemployment rate of both sexes for the age group 18-19 years, 20-24 years and 25-29 years were estimated as 18.1%, 13.8% and 8.4% for the usually active population whereas these rates were 6.5%, 18.4% and 15.0% (See Table 50) respectively under the currently active population.
Relationship between Current and Usual Activity Status
8.9 The relationship between current and usual activity status of the population is shown in Table 61. The majority of persons had retained the same status under both statuses. For example, of the estimated employed population of 862,500 under the currently active concept, Table 61 shows that 840,700 persons were employed under the usual activity status, 5,200 were unemployed and a further 16,600 were classified as inactive. Of the unemployed population of 142,300 persons estimated under the short reference of 1 week based on the current activity status, only 73,200 (51.4%) were unemployed under the usually active population concept and 58,400 or 41.0% were enumerated as inactive and 10,700 persons were enumerated as employed. The classification of 58,400 persons as usually inactive had caused the unemployed number and rate to decline substantially under the usual activity status. Table 61 also shows that out of the estimated usually inactive population numbering 597,700, some 75,000 persons had been transferred to the current activity status under the labour force concept. This is the main reason for the decrease in the dimensions of the usually inactive population.
Table 61: Relationship between current and usual activity status of the population aged 15 years and over
Usually active population Currently Active Population Total Total Employed Unemployed Inactive
Mongolia Currently active 1,004,800 929,800 851,400 78,400 75,000 Employed 862,500 845,900 840,700 5,200 16,600 Unemployed 142,300 83,900 10,700 73,200 58,400Not Currently Active 534,400 11,700 5,200 6,500 522,700All Statuses 1,539,200 941,500 856,600 84,900 597,700Male Currently active 523,500 486,800 444,600 42,200 36,700 Employed 448,900 441,500 438,300 3,200 7,400 Unemployed 74,600 45,300 6,300 39,000 29,300Not Currently Active 227,400 5,400 2,200 3,200 222,000All Statuses 750,900 492,200 446,800 45,400 258,700Female Currently active 481,300 443,000 406,800 36,200 38,300 Employed 413,600 404,400 402,400 2,000 9,200 Unemployed 67,700 38,600 4,400 34,200 29,100
67

Not Currently Active 307,000 6,300 3,000 3,300 300,700All Statuses 788,300 449,300 409,800 39,500 339,000
Chart 12 RELATIONSHIP BETWEEN CURRENT AND USUAL ACTIVITY STATUSES OF THE
POPULATION AGED 15 YEARS AND OVER Currently active population Usually active population
Employed (840,700)
Unemployed (5,200)
Inactive (16,600)
Employed (10,700)
Unemployed (73,200)
Inactive (58,400)
Employed (5,200)
Unemployed (6,500)
Inactive (522,700)
Inactive (534,400)
Unemployed (142,300)
Employed (862,500)
Total
population 15 years and over
(1,539,200)
Employed (856,600)
Unemployed (84,900)
Total population
15 years and over
(1,539,200)
Inactive (597,700)
Child Labour
68

8.10 As a child activities or labour module was included in the survey, information was canvassed from all persons aged 5 or more years to ascertain whether they were employed or available for work for most of the year during the last 12 months preceding the survey. Unlike in the case of the currently active population where any duration in excess of one hour during the reference week would qualify a child to be considered as employed, the usually active status approach requires that the person should be employed or unemployed for a duration exceeding 6 months to be treated as usually active. Accordingly, the employment and unemployment rates under the usually active concept for children of school going age were lower than the rates disclosed in the currently active population.
Table 62: Activity status of children aged 5-17 years based on currently active and usually active concepts
Of which: Age group Total Economically
Active Employed Unemployed Inactive
Currently active Total 679,000 73,500 68,600 4,900 605,500
5-9 212,100 15,300 15,300 - 196,800 10-14 294,900 21,900 21,400 500 273,000 15-17 172,000 36,300 31,900 4,400 135,700
Male 347,600 44,600 41,900 2,700 303,000 5-9 109,200 9,000 9,000 - 100,200 10-14 152,000 14,000 13,800 200 138,000 15-17 86,400 21,600 19,100 2,500 64,800
Female 331,400 28,900 26,700 2,200 302,500 5-9 102,900 6,300 6,300 - 96,600 10-14 142,900 7,900 7,600 300 135,000 15-17 85,600 14,700 12,800 1,900 70,900
Usually active Total 679,000 52,000 48,900 3,100 627,000
5-9 212,100 9,100 9,000 100 203,000 10-14 294,900 13,600 13,300 300 281,300 15-17 172,000 29,300 26,700 2,600 142,700
Male 347,600 32,700 31,000 1,700 314,900 5-9 109,200 5,600 5,500 100 103,600 10-14 152,000 8,900 8,800 100 143,100 15-17 86,400 18,200 16,700 1,500 68,200
Female 331,400 19,300 18,000 1,300 312,100 5-9 102,900 3,500 3,500 - 99,400 10-14 142,900 4,700 4,500 200 138,200 15-17 85,600 11,100 10,000 1,100 74,500
69

Chapter 9
Informal Sector Employment Introduction
9.1 The informal sector activities are known to account for a significant proportion of employment and income generation in Mongolia. In view of the special interest of this sector in employment generation in the short term, a brief analysis based on the data canvassed in the survey is provided in this section. It must be mentioned in this connection that the survey did not specifically focus on this issue at the stage when the survey questionnaire was designed, and therefore only some selected aspects can be studied from the data compiled through the survey. 9.2 According to the concept developed and adopted as a resolution at the ILO Fifteenth International Conference of Labour Statisticians (January 1993), the informal sector can be broadly characterized as consisting of units engaged in the production of goods and services with the primary objective of generating employment and income to the persons concerned. Informal sector units typically operate at a low level of organization with little or no division between labour and capital as factors of production and on a small scale. Production units of the informal sector have the characteristic features of household enterprises. Concept 9.3 For statistical purposes, “the informal sector is regarded as a group of production units which, according to the definitions and classifications provided in the United Nations System of National Accounts (REV.4), form part of the household sector as household enterprises or, equivalently, unincorporated enterprises owned by households”. Within the household sector informal sector comprises (i) informal own account enterprises and (ii) enterprises of informal employers. 9.4 Informal own-account enterprises are household enterprises owned and operated by own-account workers, either alone or in partnership with members of the same or other households, which may employ contributing family workers and employees on an occasional basis, but do not employ employees on a continuous basis. 9.5 Enterprises of informal employers are household enterprises owned and operated by employers either alone or in partnership with members of the same or other households, which employ one or more employees on a continuous basis. For operational purposes enterprises of informal employers may be defined, depending on national circumstances in terms of:
(i) size of the unit below specified level of employment and, or (ii) non-registration of the enterprise or its employees
9.6 Household enterprises which are exclusively engaged in non-market production i.e. the production of goods or services for own final consumption or own capital formation should be excluded from the scope of the informal sector for the purpose of statistics of employment in the informal sector. For practical reasons, the scope of the informal sector may be limited to household enterprises engaged in non-agricultural activities. Units engaged in professional and technical activities carried out by self-employed persons, such as doctors, lawyers or accountants,
70

or engineers should be included in the informal sector if they fall within the scope of the definition described earlier. 9.7 The ILO has recommended the integration of the collection of data on the informal sector into the regular national statistical system. The need to compile data at regular intervals is emphasized in order to monitor the changes in the size and characteristics of the informal sector over time. The labour force surveys of the economically active populations and similar household surveys provide useful and economical methods of collecting data on employment in the informal sector in terms of the number and characteristics of the persons concerned and the conditions of their employment and work. This data from household surveys will have to be supplemented with data from the establishments or economic censuses or surveys which collect data on employment, on production and other characteristics of informal sector units and their employers. Exclusion of Agricultural Employment 9.8 As it is difficult to identify and define informal sector activities in the agricultural sector in developing countries, the ILO has excluded the agricultural sector and the scope of the informal sector is limited to non-agricultural activities. Although the agricultural sector is large in Mongolia where animal husbandry and agriculture activities account for 46.6% of total employment and these activities for all practical purposes are operated as household based small scale activities, they therefore should be excluded from any assessment of the informal sector. Thus, it becomes necessary in terms of the ILO recommendations to separate non-agricultural employment from agricultural employment and thereafter divide non-agricultural employment into employment in informal sector activities and employment in the organized sector to estimate the dimensions and characteristics of the informal sector. Agricultural and Non-Agricultural Employment 9.9 The bifurcation into agricultural and non-agricultural employment that is essential as a preliminary step in the assessment of employment in the informal sector is presented in Table 63. Thus, 402,200 persons or 46.6% of the total employed population were engaged in agriculture and livestock production activities. These persons will not be considered in an assessment of the informal sector. But in view of the sheer size of the agriculture and animal husbandry sector and its importance in growth and employment, same details that were extracted for non-agriculture are presented for agricultural employment too, for the benefit of interested users. 9.10 The total volume of employment in non-agricultural activities amounts to 460,300 or 53.4% of total employment. Only about 20.0% of non-agricultural employment opportunities were located in the rural sector and that nearly 4 out of 5 persons employed in non-agricultural activities had resided in the urban sector. In other words, with 45.0% of total non-agricultural employment being located in, Ulaanbaatar city, absorbs a bigger share of employment in the informal sector.
Table 63: Currently employed agricultural and non-agricultural population aged 15 years and over by sector, region and sex
Mongolia Agriculture Non-Agriculture Sector/Region Total Male Female Male Female Male Female
Urban 392,300 199,900 192,400 15,300 12,800 184,600 179,600 Rural 470,200 249,000 221,200 200,900 173,200 48,100 48,000 Central 167,300 86,700 80,600 48,100 37,800 38,600 42,800
71

East 68,300 36,400 31,900 22,300 18,700 14,100 13,200 West 175,600 93,100 82,500 63,900 55,900 29,200 26,600 Hangai 233,300 122,000 111,300 80,600 71,700 41,400 39,600 UB 218,000 110,700 107,300 1,300 1,900 109,400 105,400
862,500 Total 448,900 413,600 216,200 186,000 232,700 227,600 Sector/Region % % % % % % %
Urban 45.5 44.5 46.5 7.1 6.9 79.3 78.9 Rural 54.5 55.5 53.5 92.9 93.1 20.7 21
Central 19.4 19.3 19.5 22.2 20.4 16.6 18.8 East 7.9 8.1 7.7 10.3 10.0 6.0 5.8 West 20.4 20.7 20.0 29.6 30.0 12.5 11.7 Khangai 27.0 27.2 26.9 37.3 38.5 17.8 17.4 UB 25.3 24.7 25.9 0.6 1.0 47.0 46.3 Total 100.0 100.0 100.0 100.0 100.0 100.0 100.0
9.11 The age distribution of the agricultural and non-agricultural employment clearly shows that a higher proportion of younger workers were working in agricultural pursuits with only 34.2% - 37.4% of workers being 35 years to 59 years old, whereas the corresponding proportions in the case of non-agricultural workers being closer to 60 % in respect of both males and females. The participation of young workers in non-agricultural activities is relatively small with 5,300 males and 4,000 females in the age group 15-19 years or 2.3% and 1.8% of the corresponding total employed population being reported as engaged in work. Whereas, as many as 53,000 or 13.2% of employed persons in agriculture and livestock production activities were youth in the age group 15-19 years. The lower educational enrollment rates in the rural areas and the demand for labour and opportunities for work in family farms had raised the number of young workers who were engaged in economic activities.
Enterprises by Number of Employees
9.12 Non-agricultural activities with no regular employees or 1-4 employees which are owned by neither state nor large private establishment may be included in the informal sector.
Table 64: Currently employed agricultural and non-agricultural
population aged 15 years and over by age and sex Mongolia Age group Agriculture Non-Agriculture
Both sexes Male Female Male Female Male Female No. No. No. No. No. No. No.
15-19 62,300 37,000 25,300 31,700 21,300 5,300 4,000 20-24 97,200 52,200 45,000 33,000 28,400 19,200 16,600 25-34 257,400 130,900 126,500 63,800 56,500 67,100 70,000 35-59 415,400 210,100 205,300 73,800 69,700 136,300 135,600 60+ 30,200 18,700 11,500 13,900 10,100 4,800 1,400
Total 862,500 448,900 413,600 216,200 186,000 232,700 227,600 % % % % % % %
15-19 7.2 8.2 6.1 14.6 11.5 2.3 1.8 20-24 11.3 11.6 10.9 15.3 15.3 8.2 7.3 25-34 29.8 29.2 30.6 29.5 30.4 28.9 30.7 35-59 48.2 46.8 49.6 34.2 37.4 58.6 59.6 60+ 3.5 4.2 2.8 6.4 5.5 2.1 0.6
72

Total 100.0 100.0 100.0 100.0 100.0 100.0 100.0 9.13 The survey collected information on the number of employees that worked in the establishment in which the respondent was employed, thus providing for a classification of the employed population by the number of employees in the enterprise. The currently employed population 15 years and over by sector of employment and number of employees in the enterprise is presented in Table 65.
Table 65: Currently employed population aged 15 years and over by sector of employment and number of employees in the enterprise
Number of employees Total No regular
employees 1 to 4 paid employees
5 to 9 paid employees
10 or more paid employees
Sector of employment
No. % No. % No. % No. % No. %
Private enterprise 33,100 3.8 22,600 4.6 6,600 12.7 1,800 5.3 2,100 0.7
Partnership 2,600 0.3 100 0.0 1,000 1.9 500 1.5 1,000 0.3
Cooperative 4,500 0.5 600 0.1 1,200 2.3 1,100 3.2 1,600 0.6
Joint state and private company 39,000 4.5 400 0.1 2,500 4.8 3,300 9.7 32,800 11.3
Limited liability company 84,000 9.7 700 0.1 10,100 19.4 10,600 31.3 62,600 21.6
State industry 32,200 3.7 0 0.0 1,300 2.5 1,200 3.5 29,700 10.2 Government enterprise 169,900 19.7 0 0.0 12,000 23.0 10,800 31.9 147,100 50.8
Non-profit organization 13,200 1.5 100 0.0 2,000 3.8 2,500 7.4 8,600 3.0
Self-employed 484,000 56.1 462,200 94.9 15,400 29.6 2,100 6.2 4,300 1.5 All sectors of employment 862,500 100.0 486,700 100.0 52,100 100.0 33,900 100.0 289,800 100.0
9.14 Only 33,900 persons had worked in enterprises that had 5-9 paid employees and 298,800 had worked enterprises that had 10 or more paid employees. Thus, the number of employed persons in enterprises that had 1 to 4 paid employees had amounted to 52,100 and that in enterprises which had no regular employees stood at 486,700. The distribution of enterprises by number of employees is useful to decide on the cut off size to be used in the subdivision of enterprises in the different sectors into informal and formal sectors. 9.15 The self-employed constitute 484,000 or more than 56.1% of the total employed population. About 95.4 % of the (462,200) self-employed had worked in establishments without any regular employees. The number of employees in government enterprises, state industry and joint state and private companies when taken together amounts to 241,100 or 28.0% of the total employed population in the country. These categories of institutions and organizations had contained large establishments and 209,600 or 72.3% of the total number of employees in them had worked in establishments that had 10 or more employees. The private enterprise category had provided employment to 33,100 persons, and its percentage share was small and amounted to only 3.8% of total employed population.
Definition of the Informal Sector 9.16 A government policy decision that defines and describes the informal sector has not been formulated for the statistical authorities to adopt in carrying out household and establishment based surveys for the collection and compilation of data on informal sector activities and on
73

employment in the informal sector. ILO also had not made any specific recommendations which could be used as guidelines by the national authorities to directly use in measuring the informal sector. Additionally this topic was not considered at the time the scope of the survey was determined, and interest was evinced on this topic only when work on the preparation of tabulations and survey report was commenced. Thus, only some specific aspects of employment in the informal sector can be examined at this stage. Therefore, it was necessary to develop a definition of the informal sector to meet the specific immediate needs and restricted purposes of studying the sector using the data available from the survey. 9.17 The survey had canvassed data on the sector of employment and size of the establishment in which the person worked, in addition to other details relating to industry, occupation, employment status, and place of residence of the household by urban, rural, and regional sub-divisions. The sector of employment was sub-divided according to the classification of organization type used by the NSO( private enterprise; partnership; cooperative; joint state and private company; limited liability company; state industry; government enterprise; non-profit organization and self employed) and it was decided to include private enterprise, partnerships and self-employed categories and exclude the other sub-divisions in the determination of the coverage of the informal sector. The cut-off point for the sub-division into formal and informal sectors was determined from the data on the size of establishment which was based on the number of employees that had worked in the establishment. The units that had no regular employees and those with 1-4 employees were accepted as falling within the informal sector and those that had 5 or more employees were treated as coming within the formal sector. . In the estimation of employment in the informal sector, employment in both primary occupation and secondary occupations were included. 9.18 According to the description of the sector as outlined above only employment in non-agricultural economic activities and non-agricultural enterprises, of those who were self employed, or in private enterprises and partnerships that had no paid employees or 1-4 employees were treated as employment that fell within the scope of the definition of the informal sector. Employment Estimate 9.19 Total employed population of 862,500 consisted of 402,200 persons employed in agricultural activities and 460,300 persons in non-agricultural employment (See Table 64). The population employed in agricultural activities was excluded in the estimation of the informal sector. The breakdown of employment by sector of employment presented in Table 65 shows that 484,000 were self-employed; 33,100 were employed in private enterprises; and 2,600 were employed in partnerships. From this total employed population in the 3 sectors that were covered, the employed population in agricultural sector was excluded and non-agricultural employed population was extracted which amounted to 125,100 (See Table 66).
Table 66: Currently employed population aged 15 years and over by sector of employment and number of employees in the enterprise
Number of employees Total No regular
employees 1 to 4 Paid employees
5 to 9 Paid employees
10 or more paid employees
Sector of employment
Number % Number % number % number % number % Private enterprise 14,400 100.0 5,100 35.5 5,500 38.2 1,800 12.2 2,000 14.2
Partnership 2,200 100.0 100 3.8 800 36.1 500 23.5 800 36.5
74

Self-employed 108,500 100.0 96,500 89.0 6,500 6.0 1,800 1.7 3,700 3.4 Non-Agriculture 125,100 100.0 101,700 81.3 12,800 10.2 4,100 3.3 6,500 5.2
Private enterprise 18,700 100.0 17,600 93.8 1,000 5.5 - 0.3 100 0.4
Partnership 300 100.0 - 5.6 200 53.4 - 0.0 100 41.0
Self-employed 375,500 100.0 365,600 97.4 8,900 2.4 300 0.1 700 0.2
Agriculture 394,500 100.0 383,200 97.1 10,100 2.6 300 0.1 900 0.2 Total 519,600 100.0 484,900 93.3 22,900 4.4 4,400 0.9 7,400 1.4
9.20 The number employed in informal sector activities in these 3 sectors was derived by excluding the persons employed in enterprises having 5 or more employees. Thus, the number employed in primary occupations which conformed to the definition of the informal sector described earlier amounted to 114,500. Similarly, the number employed in secondary occupations which conformed to this definition of the informal sector was estimated similarly and it amounted to 11,500. Thus, the total magnitude of the informal sector was estimated as 126,000 work and job opportunities. Distribution by Sex and Sector 9.21 The employment in the informal sector disaggregated by primary and secondary occupations, sex and sector is presented in Table 67. Of the 126,000 employment opportunities, 69,600 (55.2%) occupations were filled by males and 56,400 (44.8%) occupations were filled by females who worked in their primary and secondary occupations. Table 69 also shows the distribution of the opportunities by sector where 113,700 occupations were in self employment; 11,200 occupations were in private enterprise and remaining 1,100 occupations being grouped under partnerships.
Table 67: Currently employed population in the informal sector by sector of employment, primary and secondary occupation
Informal Total Male Female
Number % Number % Number % Total 126,000 100.0 69,600 55.2 56,400 44.8
Primary 114,500 100.0 62,500 54.6 52,000 45.4 Informal Sector
Secondary 11,500 100.0 7,100 61.5 4,400 38.5
Primary 10,600 100.0 5,200 49.6 5,400 50.4 Private enterprise Secondary 600 100.0 400 69.0 200 31.0
Primary 900 100.0 400 46.0 500 54.0 Partnership
Secondary 200 100.0 100 49.9 100 50.1
Primary 103,000 100.0 56,900 55.2 46,100 44.8 Self-employed
Secondary 10,700 100.0 6,600 61.3 4,100 38.7
Breakdown by Urban and Rural Sectors 9.22 126,000 employment opportunities in primary and secondary occupations in the informal sector consisted of 89,300 (70.9%) occupations in the urban sector and 36,700 (29.1%)
75

occupations in the rural sector (Graph 13). Every 3 out of 10 employment opportunities in self employment, private enterprise and partnerships are located in rural areas. Employees in the informal sector, by sectors Graph 13
Urban70.9%
Rural29.1%
Occupational Distribution 9.23 The occupational distribution of informal sector employment shows that 56,600 (44.9%) of the employment opportunities in informal sector activities were grouped under service, shop and market sales workers occupational group; 43,900 or 34.9% were under craft and related workers and plant and machinery operators major group. About 80.0% of employment in the informal sector were grouped under these two occupational groups. There were 1,200 and 3,000 occupations that were grouped under the occupation categories of senior officials and managers and professionals. As seen in the table below 3100 persons were engaged in agriculture and fishery activities.
Table 68: Occupational distribution of employed in the informal sector by sector of employment Informal
Total Private enterprise Partnership Self-employed Occupation group
number % Number % Number % Number % Legislators, senior officials and managers 1,200 1.0 300 2.7 0 0.0 900 0.8
Professionals 3,000 2.4 200 1.8 300 27.3 2,500 2.2 Technicians and associate professionals 3,800 3.0 300 2.7 100 9.1 3,400 3.0
Clerks 1,000 0.8 200 1.8 0 0.0 800 0.7 Service and shop and market sales workers 56,600 44.9 4,600 41.1 100 9.1 51,900 45.6
Skilled agricultural and fishery workers 3,100 2.5 500 4.5 0 0.0 2,600 2.3
Craft and related trade workers 22,900 18.2 2,600 23.2 200 18.2 20,100 17.7
Plant and machinery operators and assemblers 21,000 16.7 1,500 13.4 200 18.2 19,300 17.0
Elementary occupations 13,400 10.6 1,000 8.9 200 18.2 12,200 10.7
All occupational groups 126,000 100.0 11,200 100.0 1,100 100.0 113,700 100.0
Educational Attainment of Employed
76

9.24 The employed persons in the informal sector grouped by educational attainment is presented in Table 69. Two out of 5 persons who were employed in the informal sector had completed their secondary education. There were only 37,100 or about 3 out of 10 occupations in the informal sector that were occupied by persons with incomplete secondary or lower educational attainments.
Education attainment of employed in the informal sector Graph 14
University graduate
10.7%Technical/vocatio
nal diploma/certificat
e13.8%
Initial technical/vocatio
nal diploma/certificat
e9.1%
None1.2%
Primary5.1%
Incomplete secondary
23.2%
Completed secondary
36.9%
9.25 There were 13,500 occupations in which graduates were employed and 17,400 occupations in which persons with technical and diploma level qualifications were employed.
Table 69: Currently employed population aged 15 years and over by sector of employees in the enterprise and education
Informal Total Private enterprise Partnership Self employed Sector of employment cross Number % Number % Number % Number %
Total
126,000 100.0
11,200 8.9
1,100 0.9
113,700 90.3
Primary
114,500 100.0
10,600 9.3
900 0.8
103,000 90.0 Informal sector
Secondary
11,500 100.0
600 4.8
200 1.5
10,700 93.7
Primary
1,000 100.0
- 0.0
- 0.0
1,000 100.0 None
Secondary
500 100.0
- 0.0
- 0.0
500 100.0
Primary
5,300 100.0
500 9.4
- 0.0
4,800 90.6 Primary
Secondary
1,100 100.0
100 5.2
- 0.0
1,000 94.8
Primary
26,200 100.0
3,400 13.0
100 0.4
22,700 86.6 Incomplete secondary
Secondary
3,000 100.0
- 1.9
100 2.4
2,900 95.7
Primary
44,100 100.0
3,600 8.2
500 1.1
40,000 90.7 Completed secondary
Secondary
2,400 100.0
200 8.0
- 0.0
2,200 92.0
Primary
10,600 100.0
1,000 9.4
100 0.9
9,500 89.6 Initial technical/vocational diploma/certificate Secondary
900 100.0
- 0.0
- 0.0
900 100.0
Primary
15,300 100.0
1,600 10.5
100 0.7
13,600 88.9 Technical/vocational diploma/certificate
Secondary
2,100 100.0
100 4.1
- 2.4
2,000 93.5
77

Primary
12,000 100.0
500 4.2
100 0.8
11,400 95.0 University graduate
Secondary
1,500 100.0
200 10.9
100 3.5
1,200 85.6
78

Chapter 10
Child Activities
Introduction 10.1 The child activities module, which was incorporated as the last section of the survey questionnaire, had canvassed information on the participation of children in both economic and non-economic activities. In addition information on working children was also collected by lowering the age cut off on questions on labour force status to 5 years and over. Thus, information on a wide range of child activities is available through the survey as data was collected using both currently active and usually active concepts of measuring employment. In addition data was also collected on child participation in non-economic activities including household chores. As already mentioned, the information from the child activities module will provide important information on the magnitude, nature and distribution of child labour as well as its determinants and consequences which should help in identifying the children who are at risk and require urgent assistance through measures for the protection of working children. ILO IPEC is assisting the NSO in analyzing the data from the child activities module and preparing a report. Therefore, only some material that will provide an overview of child activities and incidence of child labour are presented in the paragraphs that follow. School Avoidance 10.2 The survey estimated that 171,200 or 25.2% of the 679,049 children aged 5-17 years had not been attending school (see Annex 1) and the reasons for school avoidance was ascertained from those who did not attend school.
Table 70: Main reason for not attending school by age and sex 5-17 Years 5-9 10-14 15-17
Reason Both Sexes Male Female Both Sexes Both Sexes Both Sexes
1. Under-aged 64.3 60.6 68.8 94.4 0.5 0.4 2. School too far 1.6 1.7 1.5 0.8 4.1 3.0 3. Cost of school materials, clothing etc 4.8 5.0 4.7 1.0 17.9 10.6
4. Poor performance in studies /not interested in studies 6.6 7.8 5.2 0.6 20.2 19.1
5. Add to household income 5.0 6.0 3.8 0.2 8.3 18.5 6. Help with household duties 9.0 10.4 7.4 0.8 20.4 29.4 7. Sick 3.2 2.8 3.7 0.7 13.4 5.8 8. Disabled 1.7 2.1 1.3 0.4 8.0 2.8 9. Other 3.8 3.6 3.6 1.1 7.2 10.4 10. All reasons % 100.0 100.0 100.0 100.0 100.0 100.0 Number 171,200 94,400 76,800 116,300 18,400 36,400
Table 70 shows that of the children who had not been attending school, as many as 64.3% comprising 60.6% males and 68.8% females had not attended school as they were under-age. The minimum age for school attendance, which is 7 years, had raised this percentage through the inclusion of children aged 5-6 years who were ineligible to enter school. About 14.0% of non–schooling children had not attended school, as they had to engage in economic activities to enhance household incomes and help their elders with household duties. A further 4.8% had not attended school because of the cost of schooling. About 4.9% had not been schooling as they were sick or disabled.
79

Economic Activities 10.3 Table 71 shows that 65,729 children aged 5-17 years comprising 40,406 male and 25,323 female children had participated in economic activities during the reference week preceding the survey. Of them 93.0% of children of both sexes had been engaged in animal husbandry, agricultural and forestry related work activities. 4.7% had been engaged in wholesale and retail trade and business activities. An estimated 706 children 451 males and 254 females or about 1.1% of the children who had been engaged in any economic activity had worked as paid employees.
Table 71: Number and percentage of persons aged 5-17 who had engaged in current economic activity during the reference week by sex and sector
Mongolia Economic Activity Both Sexes Male Female
Wage job 706 451 254 Any business (other than those listed below) 3122 1809 1313 Animal husbandry 58433 35759 22674 Agricultural activity 2536 1755 781 Forestry and logging 45 45 0 Transportation 194 194 0 Mining and quarrying 615 410 205 Food processing 157 0 157 Restaurant and hotel 525 151 374 Production, repair and maintenance of articles 70 70 0 Handicrafts 136 50 86 Construction and major repairs 172 119 52 Provision of private tuition, childcare services a fee 17 0 17 Total number of persons who had engaged in any economic activity 65,729 40,406 25,323 Wage job 706 451 254 Self employed 65,023 39,955 25,068 Economic Activity % % % Wage job 1.1 1.1 1.0 Any business (other than those listed below) 4.7 4.5 5.2 Animal husbandry 88.9 88.5 89.5 Agricultural activity 3.9 4.3 3.1 Forestry and logging 0.1 0.1 0.0 Transportation 0.3 0.5 0.0 Mining and quarrying 0.9 1.0 0.8 Food processing 0.2 0.0 0.6 Restaurant and hotel 0.8 0.4 1.5 Production, repair and maintenance of articles 0.1 0.2 0.0 Handicrafts 0.2 0.1 0.3 Construction and major repairs 0.3 0.3 0.2 Provision of private tuition, childcare services a fee 0.0 0.0 0.1 Total number of persons who had engaged in any economic activity % 100.0 100.0 100.0 Wage job 1.1 1.1 1.0 Self employed 98.9 98.9 99.0
80

Non-economic activities
10.4 The participation of children in current non-economic activities of the household presented in Table 72 shows that 567,400 children aged 5-17 years had been engaged in non-economic activities during the reference week preceding the survey. Of them 76.4% of the children aged 5-17 years had engaged themselves in cooking and serving food in the household. Cleaning utensils and house had been other household chores engaged in by a high percentage of children with 85.8% of female and 62.5% of male children had attended to these tasks. 8.1% of the children comprising 6.5% of the male and 9.8% of the female looked after children and 12.4% had been engaged in caring for pets and plants and community work without pay. 10.5 53% of the children who had engaged in household activities comprising 61.8% males and 44.0% females had attended to the tasks of fetching water. Further, 47.0% of children aged 5-17 years comprising 56.0% males and 37.0% female children had fetched fuel and prepared firewood. Fetching water for drinking and other household purposes and fetching fuel and preparing firewood have been included as economic activities under UN SNA as already discussed in Chapter 5: Current Activities. An estimated 300,400 children aged 5-17 years had been engaged in fetching water while the number of children that had attended to fetching fuel and preparing firewood amounted to 265,100. (See table 32, 33) If these children were to be included as economically active and therefore as employed persons, the number of economically active children would amount to approximately 30.0-40.0% of the current total labour supply.
Table 72: Percentage of persons aged 5-17 years who had engaged in household economic activities in the reference period of 7 days before the survey
All 5-9 10-14 15-17 Activity All Male Female All All All
Cooking/serving food for household 76.4 66.9 86.1 73.8 76.4 78.9 Cleaning utensils/house 74.1 62.5 85.8 67.3 76.7 76.0 Washing clothes/laundering 45.8 35.7 56.1 15.0 48.9 68.7 Minor household repairs 5.9 9.1 2.7 2.0 5.1 10.8 Shopping for household 21.1 18.3 23.9 11.3 22.6 27.6 Knitting/sewing/mending 5.8 2.1 9.5 1.2 5.5 10.2 Fetching water 53.0 61.8 44.0 39.5 57.2 58.2 Fetching fuel/preparing firewood 46.7 56.3 37.1 40.5 47.0 52.0 Caring for the old/sick/infirm 2.3 1.8 2.8 1.3 2.3 3.2 Looking after children 8.1 6.5 9.8 12.4 7.4 5.4 Caring for household pets 6.4 7.6 5.3 5.4 6.8 6.8 Voluntary/community services without pay 6.0 5.9 6.1 3.0 6.9 7.3
Total 100.0 100.0 100.0 100.0 100.0 100.0 All 567,400 285,500 281,900 144,800 262,700 159,900
Further, the information on the unemployed condition of the population will be distorted. In addition, there is also the difficulty of classifying the industrial and occupational statuses of the employed persons as appropriate sub-sectors and occupations in relation to these activities had not been designated and described. Considering these issues, although data was compiled it was left to the data user to appropriately group them to meet research needs. Child labour 10.6 The total number of child workers in the age group 5-17 years comprising employed children and potential workers who had sought work is estimated as 73,484 comprising 68,580 employed and 4,904 children who were seeking work (unemployed). The labour force status of
81
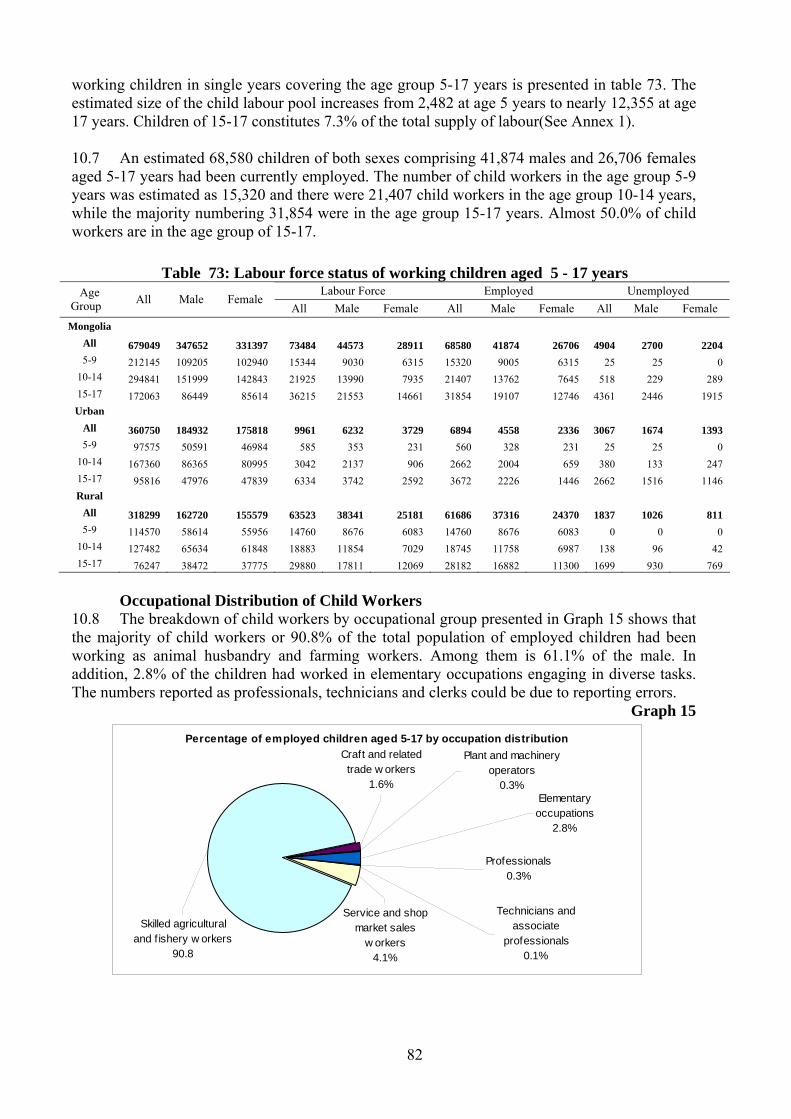
working children in single years covering the age group 5-17 years is presented in table 73. The estimated size of the child labour pool increases from 2,482 at age 5 years to nearly 12,355 at age 17 years. Children of 15-17 constitutes 7.3% of the total supply of labour(See Annex 1). 10.7 An estimated 68,580 children of both sexes comprising 41,874 males and 26,706 females aged 5-17 years had been currently employed. The number of child workers in the age group 5-9 years was estimated as 15,320 and there were 21,407 child workers in the age group 10-14 years, while the majority numbering 31,854 were in the age group 15-17 years. Almost 50.0% of child workers are in the age group of 15-17.
Table 73: Labour force status of working children aged 5 - 17 years Labour Force Employed Unemployed Age
Group All Male Female All Male Female All Male Female All Male Female
Mongolia All 679049 347652 331397 73484 44573 28911 68580 41874 26706 4904 2700 2204 5-9 212145 109205 102940 15344 9030 6315 15320 9005 6315 25 25 0
10-14 294841 151999 142843 21925 13990 7935 21407 13762 7645 518 229 289 15-17 172063 86449 85614 36215 21553 14661 31854 19107 12746 4361 2446 1915 Urban
All 360750 184932 175818 9961 6232 3729 6894 4558 2336 3067 1674 1393 5-9 97575 50591 46984 585 353 231 560 328 231 25 25 0
10-14 167360 86365 80995 3042 2137 906 2662 2004 659 380 133 247 15-17 95816 47976 47839 6334 3742 2592 3672 2226 1446 2662 1516 1146 Rural
All 318299 162720 155579 63523 38341 25181 61686 37316 24370 1837 1026 811 5-9 114570 58614 55956 14760 8676 6083 14760 8676 6083 0 0 0
10-14 127482 65634 61848 18883 11854 7029 18745 11758 6987 138 96 42 15-17 76247 38472 37775 29880 17811 12069 28182 16882 11300 1699 930 769
Occupational Distribution of Child Workers
10.8 The breakdown of child workers by occupational group presented in Graph 15 shows that the majority of child workers or 90.8% of the total population of employed children had been working as animal husbandry and farming workers. Among them is 61.1% of the male. In addition, 2.8% of the children had worked in elementary occupations engaging in diverse tasks. The numbers reported as professionals, technicians and clerks could be due to reporting errors.
Graph 15
Percentage of employed children aged 5-17 by occupation distribution
Elementary occupations
2.8%
Professionals0.3%
Plant and machinery operators
0.3%
Craft and related trade w orkers
1.6%
Service and shop market sales
w orkers4.1%
Technicians and associate
professionals0.1%
Skilled agricultural and f ishery w orkers
90.8
82

Employment Status 10.9 The employment status distribution of children shows that an estimated 61,677 working children comprising 37,379 male and 24,298 female children had been employed as unpaid family workers and a further 5,688 were self employed. Table 74 shows that only 1,154 or 1.7% of children in the age group 5-17 years had been employed as paid employees. Most importantly child labour has been largely a rural problem with as much as 89.9% of child labour having been reported from the rural sector. The total number of child workers in the urban sector is estimated as 6,894.
Table 74: Employment status of child workers aged 5-17 years by sex and sectors Employment status All Male Female 5-9 10-14 15-17
Mongolia All 68580 41874 26706 15320 21407 31854 Paid employee on contract 694 440 254 0 38 657 Paid employee on civil law 460 139 322 0 195 265 Self employed 5688 3855 1832 119 1822 3747 Unpaid family workers 61677 37379 24298 15200 19291 27185 Other 61 61 0 0 61 0 Urban All 6894 4558 2336 560 2662 3672 Paid employee on contract 568 350 218 0 38 531 Paid employee on civil law 207 102 105 0 102 105 Self employed 1020 776 245 0 621 399 Unpaid family workers 5098 3329 1769 560 1901 2638 Rural All 61686 37316 24370 14760 18745 28182 Paid employee on contract 126 90 36 0 0 126 Paid employee on civil law 254 36 217 0 93 161 Self employed 4667 3080 1588 119 1201 3347 Unpaid family workers 56579 34050 22529 14641 17391 24547 Other 61 61 0 0 61 0 Child Labour Estimates based on Usually Active Concept
10.10 Unlike in the case of the currently active population where any duration in excess of one hour during the reference week would qualify a child to be considered as employed, the usually active status approach requires that the person should be employed or unemployed for a duration exceeding 6 months to be treated as usually active. Accordingly, the employment and unemployment rates under the usually active concept for children of school going age will be lower than the rates disclosed under currently active or labour force concept of measuring employment and unemployment 10.11 As a child labour module was included in the survey, information was canvassed from all persons aged 5 or more years to ascertain whether they were employed or available for work for most of the year during the last 12 months preceding the survey. Table 75 shows that the number of currently active children aged 5-17 years which is estimated at 73,484 comprising 68,580 employed and 4,904 children in search of employment had declined to 52,024 children under the usually economically active population concept comprising 48,937 and 3,087 employed and unemployed children. Thus the decline in the number of economically active children under the usually active population concept amounts to approximately 29.2% . The number of employed children had declined from 68,580 to 48,937 by nearly 19,643 under the usually active population concept.
83

Table 75: Employment status of children aged 5-17 years based on currently active and usually active concepts by sex
Of which: Age group Total Economically
Active Employed Unemployed Inactive
Currently active Total 679050 73484 68580 4904 605566
5-9 212145 15344 15320 25 196801 10-14 294842 21925 21407 518 272917 15-17 172063 36215 31854 4361 135848
Male 347653 44573 41874 2700 303080 5-9 109205 9030 9005 25 100175 10-14 151999 13990 13762 229 138009 15-17 86449 21553 19107 2446 64896
Female 331397 28911 26706 2204 302486 5-9 102940 6315 6315 0 96625 10-14 142843 7935 7645 289 134908 15-17 85614 14661 12746 1915 70953
Usually active Total 679050 52024 48937 3087 627026
5-9 212145 9074 9017 57 203071 10-14 294842 13625 13274 351 281217 15-17 172063 29325 26646 2679 142738
Male 347653 32731 30978 1753 314922 5-9 109205 5590 5533 57 103615 10-14 151999 8943 8800 143 143056 15-17 86449 18198 16645 1553 68251
Female 331397 19293 17959 1334 312104 5-9 102940 3484 3484 0 99456 10-14 142843 4682 4474 208 138161 15-17 85614 11127 10001 1126 74487
Table 76: Employment status of children aged 5-17 years based on currently active and usually active concepts by U-R
Of which: Age
group Total Economically Active Employed Unemployed Inactive
Currently active Total 679050 73484 68580 4904 605566
5-9 212145 15344 15320 25 196801 10-14 294842 21925 21407 518 272917 15-17 172063 36215 31854 4361 135848
Urban 360750 9961 6894 3067 350789 5-9 97575 585 560 25 96990 10-14 167360 3042 2662 380 164318 15-17 95816 6334 3672 2662 89482
Rural 318299 63523 61686 1837 254776 5-9 114570 14760 14760 0 99811 10-14 127482 18883 18745 138 108599 15-17 76247 29880 28182 1699 46367
Usually active Total 679050 52024 48937 3087 627026
5-9 212145 9074 9017 57 203071 10-14 294842 13625 13274 351 281217
84

15-17 172063 29325 26646 2679 142738 Urban 360750 6350 4692 1658 354400
5-9 97575 527 527 0 97048 10-14 167360 1625 1412 213 165735 15-17 95816 4198 2753 1445 91618
Rural 318299 45673 44244 1429 272626 5-9 114570 8547 8490 57 106023 10-14 127482 12000 11862 138 115482 15-17 76247 25126 23892 1234 51121
85

Chapter 11
Seasonal Variations in Labour Supply and Demand
Introduction
11.1 The survey was designed to capture seasonal variations in the labour supply and demand in the whole country, urban and rural sectors as well as in the regions in to which the country is divided. For this purpose the sample was divided into 4 equal sub-samples and the sub-samples were independently selected and data collection was carried out in 4 quarters of 3 months each that covered the 12 months of the year. The samples drawn were sufficiently large with 3,200 households or more than 12,000 persons being included in the sample in each round that would enable the preparation of statistically reliable estimates on key variables based on the data from the 4 quarterly rounds. The sample population enumerated through the survey amounted to 49,948. The data collection in the survey began in October 2002 and ended in September 2003. The 3 month period from October to December 2002 during which field work was carried out was treated as the 1st quarter; the 2nd and 3rd quarters were conducted in the following 6 months and field work on the 4th and final quarter was undertaken during July to September 2003. In this chapter the quarterly estimates derived in respect of a few key topics are examined. Population 11.2 The survey estimated the total population of Mongolia at 2.402,8 million1. (Table 77)
Table 77: Distribution of the population of private households: Quarterly estimates All 4 Quarters Quarter 1 Quarter 2 Quarter 3 Quarter 4 Topic/ Item Oct 02- Sep 03 Oct-Dec Jan- Mar Apr-Jun Jul – Sep
Total Population 2,402,800 2,372,300 2,401,500 2,474,700 2,359,200 Number of Households 568,800 554,200 565,300 588,700 566,600 Population who lived away for>6months: 174,000 189,700 190,700 179,400 137,800
Of which : Currently attending 121,000 136,100 140,300 122,600 84,600 Working 34,600 32,600 32,900 38,700 36,000 Other 18,400 21,000 17,500 18,100 17,200 Enumerated Population 2,228,800 2,182,600 2,210,800 2,295,300 2,221,400 Male 1,106,100 1,080,100 1,099,200 1,137,300 1,107,000 Female 1,122,700 1,102,500 1,111,600 1,158,000 1,114,400 Population 0-14 689,600 677,800 694,700 722,900 661,200 Male 355,300 348,900 358,200 373,000 341,600 Female 334,300 328,900 336,500 349,900 319,600 Population 15+ 1,539,200 1,504,800 1,516,100 1,572,400 1,560,200 Male 750,800 731,200 741,000 764,300 765,400 Female 788,400 773,600 775,100 808,100 794,800 Population 5-17 679,000 673,500 664,600 706,300 669,000 Male 347,600 343,900 346,600 355,800 346,000 Female 331,400 329,600 318,000 350,500 323,000
1 As stated earlier, the tables presented in this report are based on the enumerated population that had excluded the persons living in institutional living quarters as well as the population that had resided temporarily away from the households for periods exceeding 6 months. This lowering of the magnitude of the estimated population should be noted in using the survey estimates.
86

Economically Active Population 11.3 The estimate of the labour force or economically active persons from the different quarters range from a low estimate of 986.8 thousand based on the 2nd quarter which fell mainly within the winter season to 1.020 million based on the 3rd quarter which fell within spring and summer seasons. Thus, the estimated economically active population had remained remarkably close to 1.0 million in all 4 quarters of the survey. This variation in the estimates is to be expected, because of the effects of sampling errors in the estimates.
Table 78: Activity status of the population : Quarterly estimates All 4 Quarters Quarter 1 Quarter 2 Quarter 3 Quarter 4 Topic/ Item Oct 02- Sep 03 Oct-Dec Jan- Mar Apr-Jun Jul - Sep
Labour Force 15+ 1,004,800 1,002,600 986,800 1,020,000 1,014,100 Male 523,500 527,700 514,500 526,800 525,900 Female 481,300 474,900 472,300 493,200 488,200 LFPR 15+ 65.3 66.6 65.1 64.9 65.0 Male 69.7 72.2 69.4 68.9 68.7 Female 61.1 61.4 60.9 61.0 61.4 Urban 56.4 59.9 55.8 55.3 55.1 Rural 76.3 75.1 77.1 76.8 76.8 Economically Inactive 534,400 502,200 529,300 552,400 546,100 Male 227400 203,600 226,500 237,500 239,400 Female 307,000 298,600 302,800 314,900 306,700 Urban 372,500 337,400 378,000 389,600 380,500 Rural 161,900 164,800 151,300 162,800 165,600
11.4 According to these estimates, the economically inactive population had increased by about 50,000 between the 1st quarter and the 3rd quarter and therefore there is no evidence that persons who are inactive during winter had become economically active during summer, in fact the available evidence point to a contrary position. The labour force participation rates vary between 64.9% from the 3rd Round to 66.6% in the 1st quarter. Some of these variations could be attributed to the effects of sampling errors. Employed Population 11.5 The data presented in Table 79 shows that there were seasonal changes in labour demand. The number of employed was lowest in the 1st quarter that amounted to 822,300 and this number had increased in each subsequent quarter to reach 906,000 in the 4th quarter. The variations in the dimensions of the economically active population cannot account for changes in the size of the employed population, it is seen that the additions to the employed population had resulted through a decline in the number of unemployed. It is of course possible that some persons who were in the labour force had become inactive during certain times of the year and others had joined to take their place. The extent of occurrence of such changes will have to be established through detailed analysis of the survey data. But it is evident that the increase in the number of employed had arisen mainly by the unemployed taking up work that becomes available when the winter season ends.
Table 79: Employment Indicators based on the currently active population aged 15 and over: Quarterly estimates
All 4 Quarters Quarter 1 Quarter 2 Quarter 3 Quarter 4 Topic/ Item Oct 02- Sep 03 Oct-Dec Jan- Mar Apr-Jun Jul - Sep Total employed 897,100 854,900 871,600 924,300 942,000
87

Employed away from home 34,600 32,600 32,900 38,700 36,000 Currently employed 15+ 862,500 822,300 838,700 885,600 906,000 Male 448,900 433,900 435,000 455,900 471,000 Female 413,600 388,400 403,700 429,700 435,000 Urban 392,300 393,700 384,700 393,500 395,900 Rural 470,200 428,600 454,000 492,100 510,100 Employed by Sector Agriculture 402,700 363,300 382,100 424,500 445,400 Production 102,900 106,300 102,800 98,100 104,100 Services 356,900 352,700 353,800 363,000 356,500 Employment Status Paid Employee 338,600 350,000 343,400 339,400 321,800 Employer 5,500 5,400 6,100 5,600 5,000 Own account worker 303,400 271,600 276,100 313,900 350,500 Unpaid Family Worker 215,000 195,300 213,100 226,700 228,700 Underemployed: Both 58,200 78,500 53,100 58,900 42,400 Male 34,400 46,100 30,700 37,000 23,900 Female 23,800 32,400 22,400 21,900 18,500
11.6 The breakdown of employed by industrial activity shows that the non-agricultural employment had not increased from one quarter to another but had remained practically unchanged. It is the increase in the demand for labour in agricultural pursuits that had resulted in these changes. The number of persons engaged in agricultural activities had increased from 363,300 in the 1st quarter to 382,100 in the 2nd quarter and finally to 445,400 in the 4th quarter an increase of 82,100 or by 22.6%. Chart 16
Quarterly Estimates of Employed by indusrial activity
0 100,000 200,000 300,000 400,000 500,000
Agriculture
Production
Services
Persons
All 4 QQ 4Q 3Q 2Q1
This growth in labour demand had occurred in the rural sector where the number employed had increased from 428,600 in the 1st quarter to 510,100 in the 4th quarter. As might be expected, employment in the production and services sectors had remained practically unchanged from one quarter to another, confirming that there are no significant changes in the demand for labour over the different seasons. Some variation in the estimates should be expected, because of the effects of sampling errors. 11.7 The employed population under the usually active population concept had also increased from the 1st quarter to the 4th quarter although the increase in the number of employed is some
88

what lower than that was observed under the currently active concept. Hereto, the growth in employment had arisen as a result of the increase in agricultural employment from 365,100 in the 1st quarter to 426,900 in the 4th quarter. There had been no significant change in the numbers employed in production and services sectors between the 1st and the 4th quarters confirming that there were no major seasonal changes in the demand for labour in the production and services sectors.
Table 80: Employment indicators based on the usually active population : Quarterly estimates
Topic/ Item All 4 Quarters Quarter 1 Quarter 2 Quarter 3 Quarter 4
Usually Active Population 15+ 941,500 946,300 914,600 959,800 948,900 Male 492,200 502,600 475,000 498,000 494,000 Female 449,300 443,700 439,600 461,800 454,900 Usually Active Participation Rate 15+ 61.2 62.9 60.3 61.0 60.8 Male 65.5 68.7 64.1 65.2 64.5 Female 57.0 57.4 56.7 57.1 57.2 Usually Active: Employed 15+ 856,600 827,200 836,000 877,600 887,000 Male 446,800 438,600 434,000 452,100 462,200 Female 409,800 388,600 402,000 425,500 424,800 Urban 394,000 400,800 383,800 393,100 396,100 Rural 462,600 426,400 452,200 484,500 490,900 Usually Active Employed by Sector Agriculture 396,800 365,100 381,900 416,800 426,900 Production 103,500 108,900 103,300 98,300 103,300 Services 356,300 353,200 350,800 362,500 356,800 Employment Status Paid Employee 340,400 354,200 343,700 338,000 325,900 Employer 8,100 12,200 7,900 7,100 4,900 Own account worker 281,400 232,700 246,400 306,900 339,400 Unpaid Family Worker 226,700 228,100 238,000 225,600 216,800
Unemployed Population 11.8 The survey has generated new and additional information on the profile of the unemployed. The data on seasonal variations in unemployment dimensions and magnitudes in Mongolia were compiled for the first time through this survey. The number of unemployed and the unemployment rate declines after the commencement of the winter season. Both the unemployed number and rate have declined from the levels reported in the 1st quarter from 180,300 or 18.0% in subsequent quarters reaching the lowest level in the 4th quarter estimated at 108,100 or 10.7%. Table 81 also shows that the unemployment level is still determined by the availability of work in agricultural pursuits in the rural sector. The unemployment rates in the rural sector were several percentage points lower than that of the urban sector. The age composition of the unemployed had remained quite stable in the different quarters with approximately 17.0%-20.0% falling within the age group 20-24 years; 30.0% of the unemployed falling within the age group 25-34 years; 27.0%-29.0% falling within the age group 35-44 years. Chart 17
89

Quarterly Estimates of Unemployment Rates
0.0
5.0
10.0
15.0
20.0
Q1 18.0 17.8 18.2
Q 2 15.0 15.4 14.5
Q 3 13.2 13.5 12.9
Q 4 10.7 10.4 10.9
All Quarters 14.2 14.2 14.1
Both sexes Male Female
11.9 As described earlier the number of unemployed and the unemployment rate under the usually active population concept are numerically lower than the values of these measures under the currently active concept. The number of unemployed had declined from 119,100 in the 1st quarter to 61,900 in the 4th quarter while the unemployment rate had declined from 12.6% to 6.5% during the same period.
Table 81: Unemployment condition of the population under the currently active and usually active concepts : Quarterly estimates
Topic/ Item All 4 Quarters Quarter 1 Quarter 2 Quarter 3 Quarter 4 Unemployed 15+ 142,300 180,300 148,100 134,400 108,100 Male 74,600 93,800 79,500 70,900 54,900 Female 67,700 86,500 68,600 63,500 53,200 Urban 90,300 110,800 92,900 88,200 70,400 Rural 52,000 69,500 55,200 46,200 37,700 Unemployment Rate % 14.2 18.0 15.0 13.2 10.7 Male 14.2 17.8 15.4 13.5 10.4 Female 14.1 18.2 14.5 12.9 10.9 Urban 18.7 22.0 19.4 18.3 15.1 Rural 10.0 14.0 10.8 8.6 6.9 Central 18.2 20.7 20.3 16.7 15.7East 18.4 22.2 21.5 15.5 14.5West 10.8 13.6 14.6 9.3 6.8Khangai 13.7 18.8 11.6 14.4 10.4Ulaanbaatar 12.5 16.9 12.7 11.3 8.8 Age distribution Both sexes 100.0 100.0 100.0 100.0 100.0 15-19 9.6 9.8 8.7 11.8 7.7 20-24 18.4 18.9 16.9 17.5 20.7 25-34 29.4 28.3 30.9 29.2 29.1 35-44 27.6 26.5 28.4 28.9 26.7 45-54 12.4 13.4 12.1 11.3 13.1 55-64 2.2 2.6 2.8 1.1 2.5 65 + 0.3 0.6 0.2 0.1 0.1
90

Duration unemployed 142,300 180,300 148,100 134,400 108,100 Less than 1 year 80,900 100,200 91,800 68,200 65,600 More than 1 year 61,400 80,100 56,300 66,200 42,500 Unemployed under usually active concept Both sexes 15+ 84,900 119,100 78,600 82,200 61,900 Male 45,400 64,000 41,000 45,900 31,800 Female 39,500 55,100 37,600 36,300 30,100Urban 52,700 67,800 53,100 48,900 42,500Rural 32,200 51,300 25,500 33,300 19,400Unemployment rate 15+ Both sexes 9.0 12.6 8.6 8.6 6.5 Male 9.2 12.7 8.6 9.2 6.4 Female 8.8 12.4 8.6 7.9 6.6
Current Activities
11.10 The number of persons who had engaged in current economic activities during the one week period before the survey had increased from 748,200 in the 1st quarter to 761,700 in the 2nd quarter and then to 838,900 in 3rd the quarter and finally to 856,200 in the 4th quarter. What is most significant is the fact that the number of persons engaged in wage employment had not increased during the transition from the winter season in the 1st and 2nd quarters through spring into summer and autumn in the 3rd and 4th quarters. Table 82 shows that the labour demand in agriculture and animal husbandry activities had increased during this period from 317,600 in the 1st quarter to 351,900 in the 2nd quarter and then to 392,700 in the 3rd quarter and finally to 416,800 in the 4th quarter.
Table 82: Number of persons who had engaged in any current economic activity during the reference week by sex and sector
Q1-4 Q1 Q2 Q3 Q4 Wage job 297,900 309,700 299,500 302,300 279,800Any business 79,100 73,500 77,300 84,100 82,300Animal husbandry 368,600 317,600 351,900 392,700 416,800Agricultural activity 14,700 5,300 2,300 26,400 25,000Forestry and logging 2,600 3,200 1,700 1,800 3,800Transportation 20,800 23,200 16,500 17,400 24,900Mining and quarrying 5,300 4,300 2,900 7,600 6,600Food processing 2,800 3,700 2,000 1,500 3,800Restaurant and hotel 5,000 2,900 4,200 4,100 8,600Production, repair and maintenance of articles 6,700 9,200 4,800 7,800 4,600Handicrafts 7,800 12,700 7,100 5,500 6,100Construction and major repairs 6,400 6,500 3,400 5,200 10,200Provision of private tuition, childcare services 1,100 2,000 1,400 500 500Total Self employed 502,600 438,500 462,200 536,600 576,400
Total 800,500 748,200 761,700 838,900 856,200
91

Chart 18 Composition of persons who had engaged in current economic activity during the reference
week
0.0% 20.0% 40.0% 60.0% 80.0% 100.0%
Q1
Q 2
Q 3
Q 4
All Quarters
Wage job Self employed The number that had engaged in business activities had increased modestly from 73,500 to 82,300 during this period. It is seen from Table 82 that in some activities such as handicrafts the number of persons who had worked had declined during the year from winter season to summer from 12,700 to 6,100. Hours Worked 11.11 The survey data show that there are no major differences in the number of hours worked by the economically active population in winter, spring and summer. The average number of hours worked had increased from 44.2 hours per week in winter to 47.3 hours per week in spring and beginning of summer. The persons in the age groups 25-39 years had worked nearly 50 hours per week on the average in the 3rd quarter.
Table 83: Average number of hours engaged in current economic activities by age and quarter
Age Group Q1-4 Q1 Q2 Q3 Q415-17 37.6 37.9 38.6 38.2 35.7 18-19 45.0 43.1 45.0 47.1 44.3 20-24 44.8 43.3 45.3 46.1 44.0 25-29 46.2 43.3 45.0 48.7 47.2 30-34 47.8 47.8 46.7 48.6 47.9 35-39 47.4 45.9 46.5 49.1 47.6 40-44 46.2 44.5 45.4 47.7 46.9 45-49 45.6 44.9 43.6 46.5 47.0 50-54 45.1 44.2 45.4 46.9 44.4 55-59 43.7 41.5 42.6 45.1 46.0 60-64 43.1 38.5 45.5 45.5 43.1 65-69 43.1 39.4 42.5 44.3 45.3 70+ 35.0 33.2 35.9 34.6 37.0
All age groups 45.7 44.2 45.1 47.3 45.9
92

Chapter 12
Sampling Errors of Estimates
12.1 As in any sample survey, the results obtained from the LFS are subject to sampling and non-sampling errors. The non-sampling errors arise as a result of imperfections in data collection, data processing and dissemination. These include errors that are introduced at the preparatory stage; errors committed during data collection including those committed by interviewers and respondents; and processing errors. In order to reduce these non-sampling errors several safeguards were adopted. Careful design of survey instruments, training and supervision of LFS staff deployed in data collection and processing, efficient operating procedures in data cleaning and data management, checking consistency and completeness of the tables that were extracted were some of the more important methods and procedures that were used in the survey. However it is known that non-sampling errors would be the major source of errors in the survey results, not withstanding the measures that were adopted in survey design and implementation. In view of the impracticality of measuring non-sampling errors, the total error calculation in surveys is restricted to calculation of sampling errors. 12.2 Sampling errors in surveys occur as a result of limiting the survey observations to a subset rather than the whole population. These errors are related to the sample size selected and sampling design adopted in the survey. In order to maintain these errors within acceptable levels, the efficient sampling design with the sample allocation described in Annex 3 was adopted. 12.3 The sampling error indicates the extent to which an estimate from the survey would vary by chance, because only a sample of enumeration areas is included rather than all the enumeration areas into which the country is divided. The sample size and survey design had determined the magnitude of the sampling errors and in respect of some items the sampling errors were known to be high at the design stage of the survey. 12.4 IMPS package that was developed by the US Bureau of the Census was used in processing data from the LFS +CAM. Therefore, it was decided to use CENVAR which is the variance calculation module of the IMPS package to compute sampling errors of key aggregates from the survey. For each specified parameter and domain of estimation, CENVAR produces a tabulated output that provides the following measures.
- the estimated value of the parameter
- the standard error
- the coefficient of variation
- the 95 percent confidence interval
- the design effect (DEFF) and - the number of observations upon which the estimate is based 12.5 It is common to allow an interval of either 2 standard errors or 1.6 standard errors in either direction around an estimate from a given sample as the possible range of sampling error.
93

Under the 2 standard error criterion, the population value as estimated from the sample falls within the indicated range in 95 cases out of 100. Under the 1.6 standard error criterion, the probability drops to 90 cases out of 100 but this is still a reasonable basis for judgment for many analytical purposes. Estimates of sampling errors computed using CENVAR have 95 confidence intervals of 2 standard errors. The sampling errors of key aggregates are provided in Tables 84-91. 12.6 As described in the users guide, CENVAR is designed for the calculation of the variances and uses formulae appropriate for stratified multistage sampling designs. The details of the two stage stratified sampling design used in the LFS +CAM including the stratification into 9 strata and sampling weights had been defined as required by the CENVAR system at the stage when variables corresponding to the sample design were specified. However, certain aspects of the sampling design such as the strong implicit stratification by aimag (province) soum( district) built in to the sampling design through the adoption of stratified circular systematic random sampling could not be specified in the CENVAR system. Thus, the sampling errors computed using the program and produced in the attached tables would probably overstate the width of the actual or true confidence intervals of parameters as well as the design effects of the sampling design.
94

Table 84. Estimate of Standard error
Total population
95 % Confidence interval Category Estimate Standard
error C.V. (%)
Lower Upper
Design Effect
Number of observations
Total 2,228,829 17,037 0.76 2,195,436 2,262,221 ****** 49,948 Region West 425,45 6,311 1.48 413,08 437,82 2.59 10,408 Khangai 541,84 8,420 1.55 525,33 558,34 3.87 9,360 Center 445,31 10,533 2.37 424,66 465,95 6.98 9,312 East 173,04 2,207 1,28 168,71 177,36 0.68 8,636 Ulaanbaatar 643,20 7,984 1,24 627,55 658,85 3,12 12,232 Location Urban 1,198,320 11,812 0.99 1,175,169 1,221,471 5.64 24,614 Rural 1,030,509 12,278 1,19 1,006,444 1,054,573 6,10 25,334 Sex Male 1,106,133 9,231 0.83 1,088,040 1,124,226 3.43 24,880 Female 1,122,695 9,774 0.87 1,103,538 1,141,853 3.84 25,068 Age group 15-19 182,66 3,753 2,05 175,30 190,01 1.88 4,155 20-24 212,15 4,014 1.89 204,28 220,01 1.88 4,823 25-29 294,84 5,394 1.83 284,27 305,41 2.55 6,527 30-34 265,26 4,656 1.76 256,13 274,38 2,08 5,843 35-39 191,52 3,730 1.95 184,21 198,83 1.78 4,281 40-44 178,50 3,648 2,04 171,35 185,65 1.82 4,040 45-49 175,18 3,433 1.96 168,45 181,91 1.64 3,908 50-54 170,93 3,663 1,96 163,75 178,11 1.91 3,788 55-59 161,58 3,341 2,14 155,03 168,13 1.67 3,606 60-64 116,07 2,748 2.37 110,68 121,45 1.54 2,640 65-69 76,58 2,234 2.92 72,20 80,96 1.51 1,718 70+ 58,45 1,892 3,24 54,74 62,15 1.41 1,293
95

Table 85. Estimate of Standard error
Labour force/new variable
95 % Confidence interval Category Estimate Standard
error C.V. (%)
Lower Upper
Design Effect
Number of observations
Total 0.653 0.005 0.73 0.643 0.662 3.44 34,443 Region West 0.725 0.011 1.57 0.702 0.747 3.97 6,672 Khangai 0.742 0.012 1.60 0.719 0.765 6.03 6,296 Center 0.668 0.011 1.59 0.647 0.688 3.48 6,409 East 0.688 0.013 1.86 0.663 0.713 2.08 6,036 Ulaanbaatar 0.525 0.007 1.34 0.511 0.538 2.1 9,030 Location Urban 0.564 0.006 1.00 0.553 0.575 2.46 17,514 Rural 0.763 0.008 1.04 0.748 0.779 5.31 16,929 Sex Male 0.697 0.005 0.77 0.687 0.708 2.29 16,894 Female 0.611 0.006 0.90 0.6 0.621 2.25 17,549 Age group 15-19 0.287 0.009 3.09 0.269 0.304 2.280 5,843 20-24 0.644 0.010 1.63 0.624 0.665 2.060 4,281 25-29 0.830 0.008 0.92 0.815 0.845 1.650 4,040 30-34 0.862 0.007 0.81 0.848 0.876 1.590 3,908 35-39 0.888 0.006 0.72 0.875 0.900 1.570 3,788 40-44 0.870 0.007 0.81 0.856 0.884 1.600 3,606 45-49 0.849 0.008 1.00 0.832 0.865 1.440 2,640 50-54 0.699 0.013 1.79 0.674 0.723 1.280 1,718 55-59 0.514 0.016 3.16 0.483 0.546 1.380 1,293 60-64 0.312 0.017 5.52 0.278 0.345 1.850 1,333 65-69 0.242 0.019 7.92 0.204 0.279 1.530 806 70+ 0.096 0.010 10.58 0.076 0.116 1.360 1,187
96

Table 86. Estimate of Standard error Employed/ Labour force
95 % Confidence interval Category Estimate Standard
error C.V. (%)
Lower Upper
Design Effect
Number of observations
Total 0.858 0.005 0.570 0.849 0.868 4.39 34,443 Region West 0.892 0.010 1.080 0.873 0.911 4.29 6,672 Khangai 0.863 0.010 1.210 0.842 0.883 5.58 6,296 Center 0.818 0.012 1.520 0.793 0.842 4.75 6,409 East 0.816 0.015 1.840 0.787 0.846 2.81 6,036 Ulaanbaatar 0.875 0.008 0.930 0.859 0.891 3.39 9,030 Location Urban 0.813 0.007 0.850 0.799 0.826 3.36 17,514 Rural 0.900 0.007 0.740 0.887 0.913 5.79 16,929 Sex Male 0.858 0.006 0.650 0.847 0.869 3.02 16,894 Female 0.859 0.005 0.620 0.849 0.870 2.50 17,549 Unemployed/ Labour force
95 % Confidence interval Category Estimate Standard
error C.V. (%)
Lower Upper
Design Effect
Number of observations
Total 0.142 0.005 3.440 0.132 0.151 4.39 34,443 Region West 0.108 0.010 8.980 0.089 0.127 4.29 6,672 Khangai 0.137 0.010 7.610 0.117 0.158 5.58 6,296 Center 0.182 0.012 6.820 0.158 0.207 4.75 6,409 East 0.184 0.015 8.170 0.154 0.213 2.81 6,036 Ulaanbaatar 0.125 0.008 6.510 0.109 0.141 3.39 9,030 Location Urban 0.187 0.007 3.680 0.174 0.201 3.36 17,514 Rural 0.100 0.006 6.690 0.087 0.113 5.79 16,929 Sex Male 0.142 0.006 3.940 0.131 0.153 3.02 16,894 Female 0.141 0.006 3.770 0.130 0.151 2.50 17,549 Age group 15-19 0.180 0.013 7.15 0.155 0.205 1.91 5,843 20-24 0.212 0.011 5.14 0.191 0.233 1.96 4,281 25-29 0.144 0.008 5.57 0.129 0.160 1.73 4,040 30-34 0.135 0.007 5.40 0.121 0.149 1.54 3,908
97

Table 87. Estimate of Standard error Usually employed/usually labour force
95 % Confidence interval Category Estimate Standard
error C.V. (%)
Lower Upper
Design Effect
Number of observations
Total 0.910 0.004 0.490 0.901 0.919 5.17 34,443 Region West 0.922 0.009 0.940 0.905 0.939 4.40 6,672 Khangai 0.886 0.011 1.200 0.865 0.906 6.46 6,296 Center 0.903 0.011 1.190 0.882 0.924 5.47 6,409 East 0.884 0.013 1.520 0.858 0.911 3.04 6,036 Ulaanbaatar 0.941 0.007 0.730 0.927 0.954 4.43 9,030 Location Urban 0.882 0.007 0.770 0.869 0.895 4.39 17,514 Rural 0.935 0.006 0.620 0.924 0.946 6.16 16,929 Sex Male 0.908 0.005 0.540 0.898 0.918 3.21 16,894 Female 0.912 0.005 0.530 0.903 0.921 2.89 17,549 Usually unemployed/ Usually labour force
95 % Confidence interval Category Estimate Standard
error C.V. (%)
Lower Upper
Design Effect
Number of observations
Total 0.090 0.004 4.980 0.081 0.099 5.17 34,443 Region West 0.078 0.009 11.130 0.061 0.095 4.40 6,672 Khangai 0.114 0.011 9.280 0.094 0.135 6.46 6,296 Center 0.097 0.011 11.090 0.076 0.118 5.47 6,409 East 0.116 0.013 11.650 0.089 0.142 3.04 6,036 Ulaanbaatar 0.059 0.007 11.640 0.046 0.073 4.43 9,030 Location Urban 0.118 0.007 5.730 0.105 0.131 4.39 17,514 Rural 0.065 0.006 8.940 0.054 0.076 6.16 16,929 Sex Male 0.092 0.005 5.360 0.082 0.102 3.21 16,894 Female 0.088 0.005 5.460 0.079 0.097 2.89 17,549
98

I QUARTER Table 88. Estimate of Standard error
Employed / Labour force
95 % Confidence interval Category Estimate Standard
error C.V. (%)
Lower Upper
Design Effect
Number of observations
Total 0.820 0.011 1.300 0.799 0.841 4.38 8,573 Region West 0.864 0.020 2.360 0.824 0.904 3.83 1,663 Khangai 0.812 0.026 3.170 0.761 0.862 6.60 1,621 Center 0.793 0.026 3.250 0.742 0.843 4.64 1,462 East 0.778 0.031 3.940 0.718 0.839 2.61 1,511 Ulaanbaatar 0.831 0.016 1.940 0.799 0.863 2.77 2,316 Location Urban 0.780 0.014 1.800 0.753 0.808 3.30 4,480 Rural 0.860 0.016 1.810 0.830 0.891 5.74 4,093 Sex Male 0.822 0.012 1.490 0.798 0.846 3.08 4,192 Female 0.818 0.012 1.470 0.794 0.841 2.61 4,381 Unemployed/ Labour force
95 % Confidence interval Category Estimate Standard
error C.V. (%)
Lower Upper
Design Effect
Number of observations
Total 0.180 0.011 5.920 0.159 0.201 4.38 8,573 Region West 0.136 0.020 14.950 0.096 0.176 3.83 1,663 Khangai 0.188 0.026 13.690 0.138 0.239 6.60 1,621 Center 0.207 0.026 12.460 0.157 0.258 4.64 1,462 East 0.222 0.031 13.860 0.161 0.282 2.61 1,511 Ulaanbaatar 0.169 0.016 9.570 0.137 0.201 2.77 2,316 Location Urban 0.220 0.014 6.390 0.192 0.247 3.30 4,480 Rural 0.140 0.016 11.160 0.109 0.170 5.74 4,093 Sex Male 0.178 0.012 6.880 0.154 0.202 3.08 4,192 Female 0.182 0.012 6.580 0.159 0.206 2.61 4,381
99

II QUARTER Table 89. Estimate of Standard error
Employed / Labour force
95 % Confidence interval Category Estimate Standard
error C.V. (%)
Lower Upper
Design Effect
Number of observations
Total 0.850 0.010 1.190 0.830 0.870 4.48 8,563 Region West 0.854 0.024 2.770 0.808 0.901 4.61 1,688 Khangai 0.884 0.017 1.930 0.851 0.918 4.38 1,597 Center 0.797 0.030 3.710 0.739 0.855 6.31 1,395 East 0.785 0.033 4.190 0.721 0.850 2.86 1,562 Ulaanbaatar 0.873 0.015 1.680 0.844 0.902 2.72 2,321 Location Urban 0.806 0.014 1.780 0.777 0.834 3.55 4,212 Rural 0.892 0.014 1.570 0.864 0.919 5.79 4,351 Sex Male 0.846 0.012 1.370 0.823 0.868 2.97 4,216 Female 0.855 0.011 1.270 0.834 0.876 2.52 4,347
Unemployed/ Labour force
95 % Confidence interval Category Estimate Standard
error C.V. (%)
Lower Upper
Design Effect
Number of observations
Total 0.150 0.010 6.750 0.130 0.170 4.48 8,563 Region West 0.146 0.024 16.270 0.099 0.192 4.61 1,688 Khangai 0.116 0.017 14.710 0.082 0.149 4.38 1,597 Center 0.203 0.030 14.580 0.145 0.261 6.31 1,395 East 0.215 0.033 15.350 0.150 0.279 2.86 1,562 Ulaanbaatar 0.127 0.015 11.580 0.098 0.156 2.72 2,321 Location Urban 0.194 0.014 7.380 0.166 0.223 3.55 4,212 Rural 0.108 0.014 12.860 0.081 0.136 5.79 4,351 Sex Male 0.154 0.012 7.480 0.132 0.177 2.97 4,216 Female 0.145 0.011 7.450 0.124 0.166 2.52 4,347
100

III QUARTER Table 90. Estimate of Standard error
Employed / Labour force
95 % Confidence interval Category Estimate Standard
error C.V. (%)
Lower Upper
Design Effect
Number of observations
Total 0.868 0.009 1.09 0.850 0.887 4.31 8,540 Region West 0.907 0.017 1.88 0.873 0.940 3.99 1,635 Khangai 0.856 0.020 2.32 0.817 0.895 4.48 1,490 Center 0.833 0.024 2.87 0.786 0.880 4.82 1,706 East 0.845 0.027 3.17 0.793 0.898 2.57 1,487 Ulaanbaatar 0.887 0.019 2.11 0.850 0.923 4.64 2,222 Location Urban 0.817 0.014 1.70 0.790 0.844 3.36 4,495 Rural 0.914 0.012 1.36 0.890 0.938 5.72 4,045 Sex Male 0.865 0.011 1.26 0.844 0.887 2.92 4,190 Female 0.871 0.010 1.16 0.852 0.891 2.42 4,350
Unemployed/ Labour force
95 % Confidence interval Category Estimate Standard
error C.V. (%)
Lower Upper
Design Effect
Number of observations
Total 0.132 0.009 7.16 0.113 0.150 4.31 8,540 Region West 0.093 0.017 18.29 0.060 0.127 3.99 1,635 Khangai 0.144 0.020 13.75 0.105 0.183 4.48 1,490 Center 0.167 0.024 14.34 0.120 0.214 4.82 1,706 East 0.155 0.027 17.33 0.102 0.207 2.57 1,487 Ulaanbaatar 0.113 0.019 16.52 0.077 0.150 4.64 2,222 Location Urban 0.183 0.014 7.57 0.156 0.210 3.36 4,495 Rural 0.086 0.012 14.43 0.062 0.110 5.72 4,045 Sex Male 0.135 0.011 8.10 0.113 0.156 2.92 4,190 Female 0.129 0.010 7.82 0.109 0.148 2.42 4,350
101

IV QUARTER
Table 91. Estimate of Standard error Employed / Labour force
95 % Confidence interval Category Estimate Standard
error C.V. (%)
Lower Upper
Design Effect
Number of observations
Total 0.893 0.009 0.96 0.877 0.910 4.42 8,767 Region West 0.932 0.017 1.84 0.898 0.965 5.40 1,686 Khangai 0.896 0.019 2.12 0.859 0.933 6.13 1,588 Center 0.843 0.02 2.41 0.803 0.882 3.41 1,846 East 0.855 0.032 3.74 0.793 0.918 4.05 1,476 Ulaanbaatar 0.912 0.014 1.50 0.885 0.939 3.21 2,171 Location Urban 0.849 0.013 1.49 0.824 0.874 3.28 4,327 Rural 0.931 0.011 1.21 0.909 0.953 6.08 4,440 Sex Male 0.896 0.01 1.11 0.876 0.915 3.13 4,296 Female 0.891 0.009 1.05 0.873 0.909 2.48 4,471
Unemployed/ Labour force
95 % Confidence interval Category Estimate Standard
error C.V. (%)
Lower Upper
Design Effect
Number of observations
Total 0.107 0.009 8.06 0.090 0.123 4.42 8,767 Region West 0.068 0.017 25.19 0.035 0.102 5.40 1,686 Khangai 0.104 0.019 18.26 0.067 0.141 6.13 1,588 Center 0.157 0.020 12.91 0.118 0.197 3.41 1,846 East 0.145 0.032 22.14 0.082 0.207 4.05 1,476 Ulaanbaatar 0.088 0.014 15.63 0.061 0.115 3.21 2,171 Location Urban 0.151 0.013 8.39 0.126 0.176 3.28 4,327 Rural 0.069 0.011 16.36 0.047 0.091 6.08 4,440 Sex Male 0.104 0.010 9.52 0.085 0.124 3.13 4,296 Female 0.109 0.009 8.61 0.091 0.127 2.48 4,471
102

Appendix 1
Table Table 1: Population by age, sex, region, urban, rural
Total Urban Rural Age group Total Male Female Total Male Female Total Male Female
0-4 8,2 8,5 7,9 6,5 6,9 6,2 10,1 10,3 9,9 5—9 9,5 9,9 9,2 8,1 8,6 7,7 11,1 11,3 11,0 10—14 13,2 13,7 12,7 14,1 14,7 13,2 12,4 12,6 12,1 15--17 7,7 7,8 7,6 8,0 8,2 7,8 7,4 7,4 7,4 18—19 4,2 4,4 4,0 4,3 4,4 4,1 4,1 4,3 3,8 20—24 8,6 8,7 8,5 8,6 8,7 8,6 8,6 8,7 8,4 25—29 8,0 7,9 8,1 7,4 7,2 7,7 8,7 8,7 8,7 30—34 7,9 7,6 8,1 7,9 7,4 8,3 7,8 7,8 7,9 35—39 7,8 7,2 8,3 8,3 7,8 8,8 6,9 6,5 7,3 40—44 7,2 6,9 7,6 7,9 7,5 8,3 6,5 6,3 6,6 45—49 5,2 5,2 5,2 5,4 5,5 5,4 4,9 4,8 5,1 50—54 3,4 3,2 3,6 3,7 3,5 3,9 3,1 2,9 3,3 55—59 2,6 2,5 2,7 2,8 2,6 3,0 2,4 2,4 2,4 60 –64 2,7 2,9 2,5 2,9 3,2 2,6 2,3 2,3 2,4 65-69 1,5 1,5 1,6 1,6 1,6 1,7 1,6 1,6 1,6 70+ 2,3 2,1 2,4 2,5 2,2 2,7 2,1 2,1 2,1
Total 100,0 100,0 100,0 100,0 100,0 100,0 100,0 100,0 100,0 Center 20,0 20,0 20,0 16,1 15,9 16,3 24,5 24,5 24,4 East 7,8 8,0 7,6 5,8 6,0 5,6 10,0 10,2 9,9 West 19,0 19,2 18,8 9,7 9,8 9,6 30,0 29,9 30,1 Khangai 24,3 24,5 24,2 14,7 14,8 14,6 35,5 35,4 35,6 UB 28,9 28,3 29,4 53,7 53,5 53,9 0,0 0,0 0,0
103

Table 2: Number of household sex of household head, household size and number of
employed in the household Number of unemployed persons
Number of HH
(Number) (%)
Number of households
with no employees
Number of households
with 1 employed
Number of households
with 2 employed
Number of households
with 3 employed
Number of households with 4 or
more employed
Number of employed persons
Total 568,800 100,0 18,3 29,7 37,5 8,3 6,2 899,300
Household size:
1 37,200 100,0 53,2 46,8 0,0 0,0 0,0 17,400
2 78,500 100,0 32,9 33,3 33,8 0,0 0,0 79,300
3 122,000 100,0 17,3 32,4 39,0 11,3 0,0 176,100
4 144,700 100,0 11,0 27,0 48,3 8,2 5,5 245,900
5 97,000 100,0 10,7 27,7 40,9 10,4 10,3 180,600
6 48,500 100,0 12,8 24,1 37,5 10,5 15,1 98,000
7 24,800 100,0 11,2 20,8 30,7 16,4 20,9 58,600
8 + 16,100 100,0 14,3 17,2 23,5 15,6 29,4 43,400
Male headed 475,400 100,0 15,1 26,8 42,3 8,9 6,9 807,600
Household size:
1 20,800 100,0 44,1 55,9 0,0 0,0 0,0 11,600
2 54,900 100,0 32,0 25,9 42,1 0,0 0,0 60,500
3 99,200 100,0 14,8 27,8 44,9 12,5 0,0 153,800
4 130,700 100,0 9,8 24,7 51,5 8,3 5,7 229,100
5 88,200 100,0 9,4 27,1 43,0 10,4 10,1 167,000
6 44,200 100,0 11,6 23,6 39,1 10,2 15,5 90,800
7 22 ,600 100,0 10,4 20,8 32,2 15,2 21,4 53,700
8 + 14,800 100,0 13,2 17,4 23,2 15,1 31,1 41,100
Female headed 93,400 100,0 34,7 44,2 13,4 5,3 2,4 91,700
Household size:
1 16,400 100,0 64,8 35,2 0,0 0,0 0,0 5 ,800
2 23,600 100,0 34,9 50,5 14,6 0,0 0,0 18,800
3 22,800 100,0 28,1 52,1 13,6 6,2 0,0 22,300
4 14,000 100,0 22,2 48,6 18,9 7,8 2,5 16,800
5 8,800 100,0 24,7 33,5 19,0 10,5 12,3 13,600
6 4,300 100,0 24,5 29,9 21,4 13,6 10,6 7,200
7 2,200 100,0 18,6 20,3 15,6 29,4 16,1 4,900
8 + 1,300 100,0 27,0 15,0 26,7 22,6 8,7 2,300
By region
Center 114,700 100,0 18,5 32,4 36,4 7,9 4,8 172,100
East 48,500 100,0 24,5 27,1 35,9 7,6 4,9 69,800
West 97,900 100,0 14,4 21,4 40,0 11,4 12,8 192,300
Khangai 138,900 100,0 17,2 23,3 39,2 11,2 9,1 246,500
104
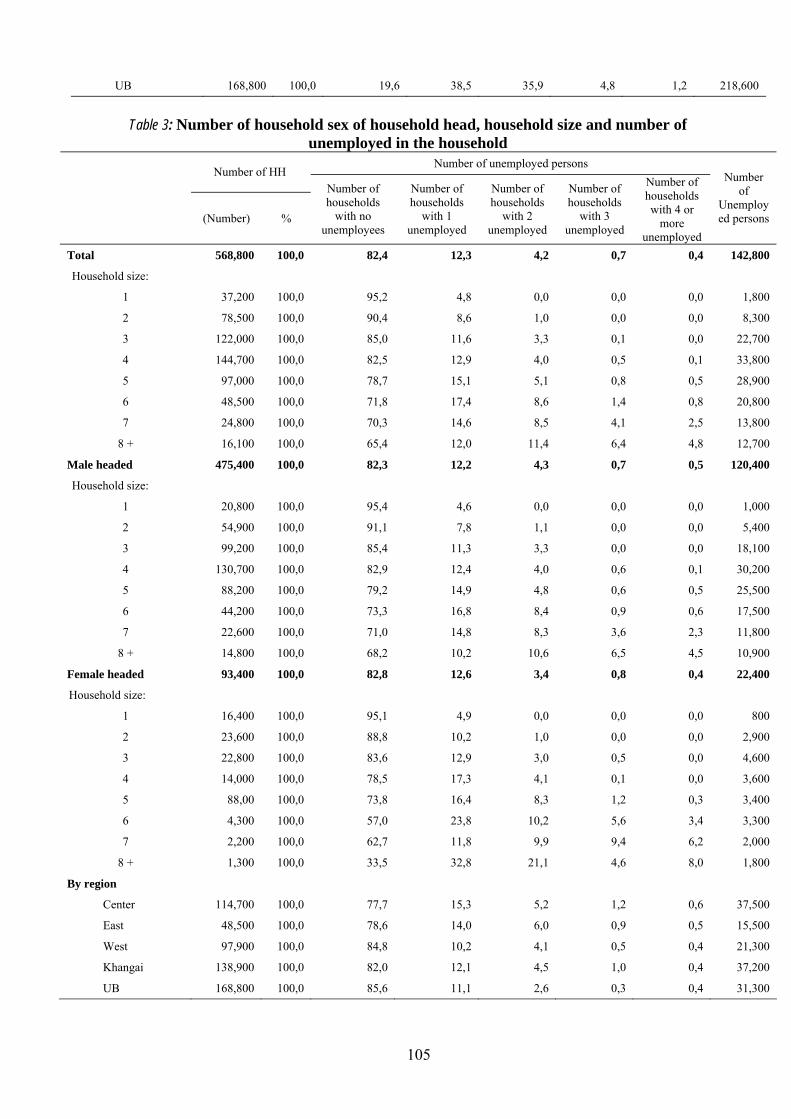
UB 168,800 100,0 19,6 38,5 35,9 4,8 1,2 218,600
Table 3: Number of household sex of household head, household size and number of
unemployed in the household Number of unemployed persons
Number of HH
(Number) %
Number of households
with no unemployees
Number of households
with 1 unemployed
Number of households
with 2 unemployed
Number of households
with 3 unemployed
Number of households with 4 or
more unemployed
Number of
Unemployed persons
Total 568,800 100,0 82,4 12,3 4,2 0,7 0,4 142,800
Household size:
1 37,200 100,0 95,2 4,8 0,0 0,0 0,0 1,800
2 78,500 100,0 90,4 8,6 1,0 0,0 0,0 8,300
3 122,000 100,0 85,0 11,6 3,3 0,1 0,0 22,700
4 144,700 100,0 82,5 12,9 4,0 0,5 0,1 33,800
5 97,000 100,0 78,7 15,1 5,1 0,8 0,5 28,900
6 48,500 100,0 71,8 17,4 8,6 1,4 0,8 20,800
7 24,800 100,0 70,3 14,6 8,5 4,1 2,5 13,800
8 + 16,100 100,0 65,4 12,0 11,4 6,4 4,8 12,700
Male headed 475,400 100,0 82,3 12,2 4,3 0,7 0,5 120,400
Household size:
1 20,800 100,0 95,4 4,6 0,0 0,0 0,0 1,000
2 54,900 100,0 91,1 7,8 1,1 0,0 0,0 5,400
3 99,200 100,0 85,4 11,3 3,3 0,0 0,0 18,100
4 130,700 100,0 82,9 12,4 4,0 0,6 0,1 30,200
5 88,200 100,0 79,2 14,9 4,8 0,6 0,5 25,500
6 44,200 100,0 73,3 16,8 8,4 0,9 0,6 17,500
7 22,600 100,0 71,0 14,8 8,3 3,6 2,3 11,800
8 + 14,800 100,0 68,2 10,2 10,6 6,5 4,5 10,900
Female headed 93,400 100,0 82,8 12,6 3,4 0,8 0,4 22,400
Household size:
1 16,400 100,0 95,1 4,9 0,0 0,0 0,0 800
2 23,600 100,0 88,8 10,2 1,0 0,0 0,0 2,900
3 22,800 100,0 83,6 12,9 3,0 0,5 0,0 4,600
4 14,000 100,0 78,5 17,3 4,1 0,1 0,0 3,600
5 88,00 100,0 73,8 16,4 8,3 1,2 0,3 3,400
6 4,300 100,0 57,0 23,8 10,2 5,6 3,4 3,300
7 2,200 100,0 62,7 11,8 9,9 9,4 6,2 2,000
8 + 1,300 100,0 33,5 32,8 21,1 4,6 8,0 1,800
By region
Center 114,700 100,0 77,7 15,3 5,2 1,2 0,6 37,500
East 48,500 100,0 78,6 14,0 6,0 0,9 0,5 15,500
West 97,900 100,0 84,8 10,2 4,1 0,5 0,4 21,300
Khangai 138,900 100,0 82,0 12,1 4,5 1,0 0,4 37,200
UB 168,800 100,0 85,6 11,1 2,6 0,3 0,4 31,300
105

Table 4: Distribution of population aged 15 year and over by educational attainment and sector
Total Urban Rural Educational attainment Total Male Female Total Male Female Total Male Female
University graduate 183,200 85,900 97,300 164,500 76,900 87,600 18,700 9,000 9,700
Tech/Voc/Dip 142,700 54,100 88,600 100,800 38,600 62,200 41,900 15,500 26,400
Initial Tech/Voc 77,500 41,900 35,600 49,000 26,600 22,400 28,500 15,300 13,200 Completed Secondary 374,500 172,200 202,300 268,600 127,200 141,400 105,900 45,000 60,900
Incomplete Secondary
426,000 228,300 197,700 175,900 95,500 80,400 250,100 132,800 117,300
Primary 260,900 133,500 127,400 76,400 35,600 40,800 184,500 97,900 86,600
None 74,400 34,900 39,500 19,900 8,200 11,700 54,500 26,700 27,800
Total 1,539,200 750,800 788,400 855,100 408,600 446,500 684,100 342,200 341,900
Table 5: Average number of hours spent on
fetching water Table 6: Average number of hours spent on
fetching fuel Age Number
of persons Total hours
Average hours Age Number of
persons Total hours
Average hours
Total 818,800 3018007.3 3.7 Total 823,100 3658279.9 4.4 5-9 57,200 168089.4 2.9 5-9 58,600 192613.6 3.3 10-14 150,300 508116.6 3.4 10-14 123,400 464782.4 3.8 15-17 93,000 351201.0 3.8 15-17 83,100 352167.2 4.2 18-24 137,700 551201.0 4.0 18-24 128,500 588740.8 4.6 25-34 170,000 657801.8 3.9 25-34 171,500 840665.7 4.9 35-44 105,500 400009.3 3.8 35-44 122,700 599106.3 4.9 45-54 52,500 196655.8 3.7 45-54 66,800 316133.3 4.7 55-64 34,400 124273.8 3.6 55-64 43,400 200343.3 4.6 65+ 18,200 60658.8 3.3 65+ 25,100 103727.3 4.1 Male 496,400 1918949.9 3.9 Male 502,500 2323661.1 4.6 5-9 33,800 102678.4 3.0 5-9 34,200 113896.3 3.3 10-14 89,000 322563.2 3.6 10-14 75,500 299223.3 4.0 15-17 53,500 215328.9 4.0 15-17 50,900 228802.1 4.5 18-24 83,100 351912.6 4.2 18-24 78,700 380166.2 4.8 25-34 103,800 417423.0 4.0 25-34 103,200 526301.6 5.1 35-44 67,200 261071.2 3.9 35-44 77,700 388118.9 5.0 45-54 32,100 124381.2 3.9 45-54 40,300 197855.7 4.9 55-64 22,300 82872.6 3.7 55-64 27,400 127318.1 4.6 65+ 11,600 40718.8 3.5 65+ 14,600 61979.0 4.2 Female 322,400 1099057.4 3.4 Female 320,600 1334618.8 4.2 5-9 23,300 65410.9 2.8 5-9 24,400 78717.3 3.2 10-14 61,300 185553.4 3.0 10-14 47,900 165559.1 3.5 15-17 39,500 135872.1 3.4 15-17 32,200 123365.2 3.8 18-24 54,600 199288.3 3.7 18-24 49,800 208574.6 4.2 25-34 66,200 240378.8 3.6 25-34 68,200 314364.2 4.6 35-44 38,400 138938.0 3.6 35-44 45,000 210987.4 4.7 45-54 20,400 72274.6 3.5 45-54 26,600 118277.6 4.5
106

55-64 12,100 41401.2 3.4 55-64 16,000 73025.2 4.6 65+ 6,600 19940.0 3.0 65+ 10,500 41748.3 4.0
Table 7: Percentage of persons aged 15 years and over who had engaged in current economic activities during the reference week by sex and sector
Total Urban Rural
Total Male Female Total Male Female Total Male Female
% % % % % % % % %
Wage job 37.2 34.9 39.8 65.4 63.6 67.4 14.5 12.8 16.5
Self employed 62.8 65.1 60.2 34.6 36.4 32.6 85.5 87.2 83.5
Total, % 100.0 100.0 100.0 100.0 100.0 100.0 100.0 100.0 100.0
number 800,500 419,000 381,500 356,600 182,000 174,600 443,900 237,000 206,900
Table 8: Persons aged 15 years over who had engaged in current economic activities during the
reference week by sex, time and sector Total Urban Rural
Spent time Total Male Female Total Male Female Total Male Female
0-9 1.7 0.9 2.5 0.6 0.8 0.5 2.5 1.1 4.1
10-19 4.8 3.4 6.3 1.4 1.2 1.6 7.6 5.2 10.4
20-29 8.6 6.4 10.9 2.8 2.5 3.2 13.2 9.5 17.4
30-39 8.2 7.7 8.7 3.8 3.6 4.0 11.6 10.8 12.7
40-49 40.6 37.8 43.6 58.5 55.6 61.5 26.2 24.1 28.6
50-59 15.9 17.8 13.9 15.2 16.0 14.4 16.5 19.1 13.4
60-69 6.8 8.2 5.3 6.2 6.5 5.8 7.4 9.5 4.8
70+ 13.4 17.8 8.8 11.5 13.8 9.0 15.0 20.7 8.6
Total 100.0 100.0 100.0 100.0 100.0 100.0 100.0 100.0 100.0
number, 15+ 800,500 419,000 381,500 356,600 182,000 174,600 443,900 237,000 206,900
107

Table 9: Percentage of persons aged 5 years old over who had engaged in current Non-
economic activities during the reference week by sex, time group, sector Total Urban Rural
Spent time Total Male Female Total Male Female Total Male Female
0-9 29.4 40.9 18.8 32.7 45.4 21.6 25.4 35.8 15.3
10-19 25.9 29.6 22.6 26.8 28.3 25.4 25.0 31.0 19.1
20-29 19.0 15.9 22.0 19.7 14.9 23.9 18.3 16.9 19.6
30-39 10.6 6.9 13.9 9.4 5.8 12.6 11.9 8.3 15.5
40-49 6.3 3.7 8.7 5.0 3.0 6.9 7.8 4.6 11.0
50-59 3.4 1.5 5.2 2.3 1.2 3.2 4.9 1.9 7.8
60-69 2.0 0.7 3.2 1.3 0.4 2.0 2.8 0.8 4.8
70+ 3.4 0.8 5.6 2.8 1.0 4.4 3.9 0.7 7.0
Total 100.0 100.0 100.0 100.0 100.0 100.0 100.0 100.0 100.0
Number, 5+ 1,826,700 874,400 952,300 996,300 466,000 530,300 830,400 408,400 422,000
Table 10: Currently employed population by status of employment, sex
Total Male Female Employement status number % % % Paid employee on contract 312,000 36.3 34.1 38.5Paid employee under civil law 26,700 3.1 3.0 3.3Employer 5,500 0.5 0.7 0.4Member of cooperative 1,800 0.2 0.3 0.2Own account worker 301,500 34.9 43.4 25.7Unpaid family worker 213,800 24.8 18.4 31.7Other 1,200 0.1 0.1 0.2
Total 100.0 100.0 100.0 Currently employed population 862,500 448,900 413,600
108

Table 11: Currently employed population aged 15 and over by sectors
Table 12: Currently employed population aged 15 and over by status of enterprise, region
Region/U-R Total
Urban Rural Center East West Khangai UB
Sector of employment cross
number % % % % % % % % Private enterprise 33,100 100.0 35.0 65.0 28.8 3.0 6.8 53.5 7.8Partnership 2,600 100.0 85.9 14.1 10.1 7.1 9.4 26.1 47.3Cooperative 4,500 100.0 45.2 54.8 17.4 10.5 36.2 19.1 16.8Joint state and private company 39,000 100.0 86.1 13.9 24.5 6.8 6.6 15.0 47.1
Limited liability company 84,000 100.0 90.5 9.5 12.1 2.2 4.7 6.3 74.7State industry 32,200 100.0 86.2 13.8 32.0 8.2 5.9 27.3 26.7
Government enterprise 170,000 100.0 70.5 29.5 18.1 7.4 14.6 20.0 40.0
Non-profit organization 13,100 100.0 88.6 11.4 22.5 3.8 8.6 9.8 55.3
Self-employed 484,000 100.0 22.2 77.8 19.2 9.6 28.3 32.8 10.0
Total 862,500 100.0 45.5 54.5 19.4 7.9 20.4 27.0 25.3
of employees in the enterprise
number of employees
Total no regular employees
1 to 4 paid employees
5 to 9 paid employees
10 or more paid
employees
Sector of employment cross
number % % % % %
Private enterprise 33,100 100.0 68.5 19.6 5.5 6.4
Partnership 2,600 100.0 4.1 38.2 20.6 37.1
Cooperative 4,500 100.0 14.2 26.3 24.1 35.4
Joint state and private company 39,000 100.0 1.0 6.7 8.3 84.0
Limited liability company 84,000 100.0 0.8 12.2 12.6 74.4
State industry 32,200 100.0 0.0 3.9 3.9 92.2
Government enterprise 170,000 100.0 0.1 7.0 6.4 86.5Non-profit organization 13,100 100.0 0.4 15.1 18.8 65.7Self-employed 484,000 100.0 95.5 3.2 0.4 0.9Total 862,500 100.0 56.5 6.0 3.9 33.6
.
109

Table 13: Currently employed population in private enterprise, partnership and self employment by number of employees the enterprise and age
Number of employees
Total no regular employees 1 to 4 paid employees 5 to 9 paid employees 10 or more paid employees
Sector of employment cross
number % number % number % number % number %
Urban 95,200 100.0 76,500 80.3 9,400 9.9 3,300 3.5 6,000 6.3
Private enterprise 9,900 100.0 3,300 33.6 3,600 36.4 1,200 11.5 1,800 18.5
Partnership 2,000 100.0 100 2.5 600 31.1 500 26.0 800 40.4
Self-employed 83,300 100.0 73,100 87.8 5,200 6.2 1,600 1.9 3,400 4.015-19 3,700 100.0 2,700 72.3 400 11.0 300 9.5 300 7.1
20-24 7,000 100.0 5,000 70.3 700 11.1 500 6.9 800 11.6
25-34 31,800 100.0 25,100 78.9 3,900 12.1 700 2.3 2,100 6.7
35-44 35,900 100.0 30,200 84.3 2,700 7.4 1,100 3.0 1,900 5.3
45-54 14,000 100.0 11,100 79.4 1,400 10.4 700 4.5 800 5.7
55-64 2,500 100.0 2,100 85.4 300 10.6 - 0.0 100 4.0
65+ 300 100.0 300 100.0 - 0.0 - 0.0 - 0.0
Rural 29,900 100.0 25,200 84.5 3,400 11.2 800 2.7 500 1.6
Private enterprise 4,500 100.0 1,800 39.8 1,900 42.2 600 13.6 200 4.5
Partnership 200 100.0 - 16.0 200 84.0 - 0.0 - 0.0
Self-employed 25,200 100.0 23,400 93.0 1,300 5.1 200 0.7 300 1.115-19 1,600 100.0 1,400 88.1 100 3.5 100 8.4 - 0.0
20-24 3,100 100.0 2,500 78.0 400 14.2 - 0.0 200 7.9
25-34 9,400 100.0 8,000 85.3 1,000 11.0 300 2.9 100 0.8
35-44 10,700 100.0 9,200 86.0 1,200 10.9 200 1.9 100 1.2
45-54 3,900 100.0 3,200 81.9 500 13.3 100 3.7 100 1.2
55-64 900 100.0 700 89.2 100 6.0 100 4.8 - 0.0
65+ 300 100.0 200 65.6 100 34.4 - 0.0 - 0.0
Total non- agriculture 125,100 100.0 101,700 81.3 12,800 10.2 4,100 3.3 6,500 5.2
15-19 5,300 100.0 4,100 77.2 500 8.7 400 9.2 300 4.9
20-24 10,100 100.0 7,500 72.7 1,100 12.0 500 4.8 1,000 10.5
25-34 41,200 100.0 33,100 80.3 4,900 11.8 1,000 2.4 2,200 5.4
35-44 46,600 100.0 39,400 84.7 3,900 8.2 1,300 2.7 2,000 4.3
45-54 17,900 100.0 14,300 80.0 1,900 11.0 800 4.3 900 4.7
55-64 3,400 100.0 2,800 86.4 400 9.4 100 1.2 100 3.0
65+ 600 100.0 500 82.1 100 17.9 - 0.0 - 0.0
110

Table 14: USUALLY ECONOMICALLY ACTIVE POPULATION AGED 15 YEARS AND OVER
Q1-4 Q1 Q2 Q3 Q4 Q1+Q2 Q3+Q4
1 Usually economically active population (15 +) Both sexes 1 ,004 ,800 1 ,002 ,600 986, 800 1, 020, 000 1 ,014, 100 995, 200 1 ,015, 700 Male 523, 500 527, 700 514, 500 526,800 525, 900 521, 500 525, 700 Female 481, 300 474, 900 472, 300 493,200 488, 200 473, 700 490, 000 Urban 482, 600 504, 500 477, 600 481,700 466, 300 491, 300 473, 300 Male 247, 800 260, 000 243, 400 246,800 239, 400 252, 000 243, 000 Female 234, 800 244, 500 234, 200 234,900 226, 900 239, 300 230, 300 Rural 522, 200 498, 100 509, 200 538,300 547, 800 503, 900 542, 400 Male 275, 700 267, 700 271, 100 280,000 286, 500 269, 500 282, 700 Female 246, 500 230, 400 238, 100 258,300 261, 300 234, 400 259, 700 Central 204, 600 201, 000 206, 300 215,600 195, 300 204, 000 205, 200 East 83, 600 83, 800 78, 600 86,100 87, 000 81, 100 86, 300 West 196, 900 190, 000 181, 000 213,800 207, 000 185, 600 209, 800 Khangai 270, 400 266, 900 273, 600 259, 000 281, 600 270, 400 270, 100
Ulaanbaatar 249, 300 260, 900 247, 300 245, 500 243, 200 254, 100 244, 300 2 Usually LFPR
Both sexes 65,3 66,6 65,1 64,9 65,0 65,9 64,9 Male 69,7 72,2 69,4 68,9 68,7 70,8 68,7 Female 61,1 61,4 60,9 61,0 61,4 61,2 61,2 Urban 56,4 59,9 55,8 55,3 55,1 57,9 55,1 Male 60,6 65,4 59,5 59,8 58,9 62,5 58,8 Female 52,6 55,0 52,4 51,9 51,5 53,7 51,6 Rural 76,3 75,1 77,1 76,8 76,8 76,2 76,8 Male 80,6 80,2 81,6 81,0 79,8 81,0 80,4 Female 72,1 70,0 72,5 72,6 73,7 71,3 73,2 Central 66,8 69,2 71,5 64,7 63,5 70,4 64,0 East 68,8 70,4 63,4 72,2 70,6 66,7 71,1 West 72,5 71,6 69,3 76,9 72,4 70,6 74,5 Khangai 74,2 74,1 76,0 71,1 75,4 75,1 73,3
Ulaanbaatar 52,5 55,5 51,3 51,4 51,7 53,4 51,5
3 Usually economically Inactive population (15 +)
Both sexes 534, 400 502, 200 529, 300 552,400 546,100 515, 200 550, 100 Male 227, 400 203, 600 226, 500 237,500 239,400 214,800 239, 000 Female 307, 000 298, 600 302, 800 314,900 306,700 300,400 311, 100 Urban 372, 500 337, 400 378, 000 389,600 380,500 357,600 385, 800
Male 160, 900 137, 700 165, 400 172,000 167,100 151,500 169, 900
Female 211, 600 199, 700 212, 600 217,600 213,400 206,100 215, 900 Rural 161, 900 164, 800 151, 300 162,800 165,600 157,600 164, 300 Male 66, 500 65, 900 61, 100 65,500 72,300 63,300 69, 100 Female 95, 400 98, 900 90, 200 97,300 93,300 94,300 95, 200 Central East 101, 900 89, 300 82, 300 117,600 112,400 85,900 115, 200 West 37, 900 35, 100 45, 300 33,200 36,100 40,400 35, 000 Khangai 74, 800 75, 400 80, 100 64,300 79,000 77,200 71, 700
Ulaanbaatar 94, 000 93, 300 86, 400 104,900 91,800 89,600 98, 500
111

Table 15: Currently employed population aged 15 and over Q1-4 Q1 Q2 Q3 Q4 Q1+Q2 Q3+Q4
1 Currently employed population Total 862,500 822,300 838,700 885,600 906,000 831,300 895,000 Male 448,900 433,900 435,000 455,900 471,000 434,900 463,200 Female 413,600 388,400 403,700 429,700 435,000 396,400 431,800 Urban 392,300 393,700 384,700 393,500 395,900 389,500 394,400 Male 199,900 199,900 192,600 201,300 204,000 196,500 202,700 Female 192,400 193,800 192,100 192,200 191,900 193,000 191,700 Rural 470,200 428,600 454,000 492,100 510,100 441,800 500,600 Male 249,000 234,000 242,400 254,600 267,000 238,400 260,500 Female 221,200 194,600 211,600 237,500 243,100 203,400 240,100 Central 167,300 159,400 164,500 179,600 164,600 161,900 171,900 East 68,200 65,200 61,700 72,800 74,400 63,400 73,300 West 175,700 164,100 154,600 193,900 192,900 159,900 193,300 Khangai 233,300 216,700 241,900 221,600 252,300 229,700 236,800
Ulaanbaatar 218,000 216,900 216,000 217,700 221,800 216,400 219,700
2 Currently employed by sector (15+) Total 862,500 822,300 838,700 885,600 906,000 831,300 895,000 Agriculture 402,700 363,300 382,100 424,500 445,400 373,200 434,500 Production 102,800 106,300 102,800 98,100 104,100 104,700 100,900 Services 357,000 352,700 353,800 363,000 356,500 353,400 359,600 Male 448,900 433,900 435,000 455,900 471,000 434,900 463,200 Agriculture 216,500 201,500 206,800 225,100 234,400 204,500 229,500 Production 62,400 65,100 60,400 61,500 62,200 62,800 61,800 Services 170,000 167,300 167,800 169,300 174,400 167,600 171,900 Female 413,600 388,400 403,700 429,700 435,000 396,400 431,800 Agriculture 186,200 161,800 175,300 199,400 211,000 168,700 205,000 Production 40,500 41,200 42,400 36,600 41,900 41,900 39,100
Services 186,900 185,400 186,000 193,700 182,100 185,800 187,700
3 Currently employed by employment status (15+) Total 862,500 822,300 838,700 885,600 906,000 831,200 895,000 Paid employees 338,700 350,000 343,400 339,400 321,800 347,000 330,100 Employer 5,500 5,400 6,100 5,600 5,000 5,800 5,400 Own account worker 303,300 271,600 276,100 313,900 350,500 274,100 332,000
Unpaid family worker 215,000 195,300 213,100 226,700 228,700 204,300 227,500
Male 448,900 433,900 435,000 455,900 471,000 434,800 463,200 Paid employees 165,800 172,700 166,200 165,200 159,200 169,500 162,000 Employer 3,700 4,000 4,200 3,600 3,000 4,100 3,400 Own account worker 196,300 172,700 176,100 206,000 230,000 174,600 217,900
Unpaid family worker 83,100 84,500 88,500 81,100 78,800 86,600 79,900
Female 413,600 388,400 403,700 429,700 435,000 396,400 431,800 Paid employees 172,800 177,300 177,200 174,200 162,600 177,500 168,100 Employer 1,800 1,400 1,900 2,000 2,000 1,700 2,000 Own account worker 107,100 98,900 100,000 107,900 120,500 99,500 114,100
Unpaid family worker 131,900 110,800 124,600 145,600 149,900 117,700 147,600
112
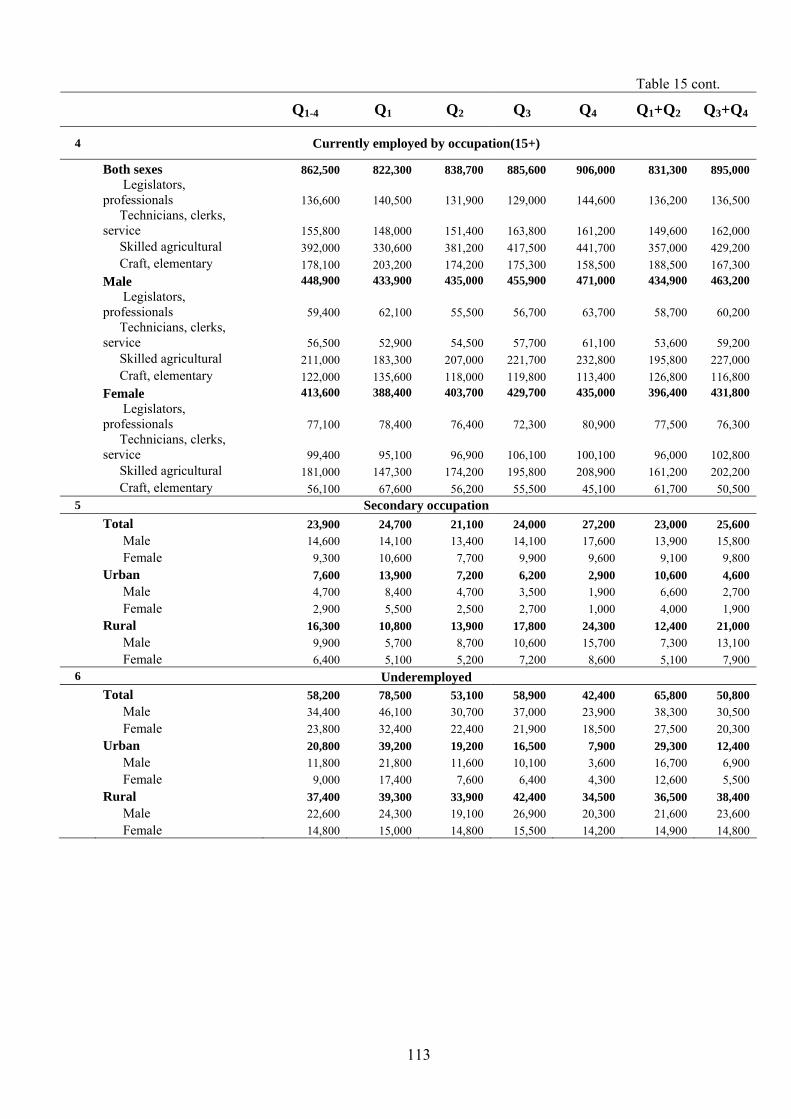
Table 15 cont. Q1-4 Q1 Q2 Q3 Q4 Q1+Q2 Q3+Q4
4 Currently employed by occupation(15+)
Both sexes 862,500 822,300 838,700 885,600 906,000 831,300 895,000 Legislators, professionals 136,600 140,500 131,900 129,000 144,600 136,200 136,500 Technicians, clerks, service 155,800 148,000 151,400 163,800 161,200 149,600 162,000 Skilled agricultural 392,000 330,600 381,200 417,500 441,700 357,000 429,200
Craft, elementary 178,100 203,200 174,200 175,300 158,500 188,500 167,300 Male 448,900 433,900 435,000 455,900 471,000 434,900 463,200
Legislators, professionals 59,400 62,100 55,500 56,700 63,700 58,700 60,200 Technicians, clerks, service 56,500 52,900 54,500 57,700 61,100 53,600 59,200 Skilled agricultural 211,000 183,300 207,000 221,700 232,800 195,800 227,000
Craft, elementary 122,000 135,600 118,000 119,800 113,400 126,800 116,800 Female 413,600 388,400 403,700 429,700 435,000 396,400 431,800
Legislators, professionals 77,100 78,400 76,400 72,300 80,900 77,500 76,300 Technicians, clerks, service 99,400 95,100 96,900 106,100 100,100 96,000 102,800 Skilled agricultural 181,000 147,300 174,200 195,800 208,900 161,200 202,200
Craft, elementary 56,100 67,600 56,200 55,500 45,100 61,700 50,500
5 Secondary occupation Total 23,900 24,700 21,100 24,000 27,200 23,000 25,600 Male 14,600 14,100 13,400 14,100 17,600 13,900 15,800 Female 9,300 10,600 7,700 9,900 9,600 9,100 9,800 Urban 7,600 13,900 7,200 6,200 2,900 10,600 4,600 Male 4,700 8,400 4,700 3,500 1,900 6,600 2,700 Female 2,900 5,500 2,500 2,700 1,000 4,000 1,900 Rural 16,300 10,800 13,900 17,800 24,300 12,400 21,000 Male 9,900 5,700 8,700 10,600 15,700 7,300 13,100
Female 6,400 5,100 5,200 7,200 8,600 5,100 7,900
6 Underemployed Total 58,200 78,500 53,100 58,900 42,400 65,800 50,800 Male 34,400 46,100 30,700 37,000 23,900 38,300 30,500 Female 23,800 32,400 22,400 21,900 18,500 27,500 20,300 Urban 20,800 39,200 19,200 16,500 7,900 29,300 12,400 Male 11,800 21,800 11,600 10,100 3,600 16,700 6,900
Female 9,000 17,400 7,600 6,400 4,300 12,600 5,500 Rural 37,400 39,300 33,900 42,400 34,500 36,500 38,400 Male 22,600 24,300 19,100 26,900 20,300 21,600 23,600 Female 14,800 15,000 14,800 15,500 14,200 14,900 14,800
113

Table 16: CURRENTLY UNEMPLOYED POPULATION AGED 15 YEARS AND OVER Q1-4 Q1 Q2 Q3 Q4 Q1+Q2 Q3+Q4
Currently unemployed (15 +) 1 Both sexes 142,300 180,300 148,100 134,400 108,100 163,900 120,700 Male 74,600 93,800 79,500 70,900 54,900 86,600 62,500 Female 67,700 86,500 68,600 63,500 53,200 77,300 58,200 Urban 90,300 110,800 92,900 88,200 70,400
101,800 78,900
Male 47,900 60,100 50,800 45,500 35,400
55,500 40,300 Female 42,400 50,700 42,100 42,700 35,000
46,300 38,600
Rural 52,000 69,500 55,200 46,200 37,700
62,100 41,800 Male 26,700 33,700 28,700 25,400 19,500 31,100 22,200 Female 25,300 35,800 26,500 20,800 18,200 31,000 19,600 Central 37,300 41,600 41,800 36,000 30,700 42,100 33,300 East 15,400 18,600 16,900 13,300 12,600 17,700 13,000 West 21,200 25,900 26,400 19,900 14,100 25,700 16,500 Khangai 37,200 50,200 31,700 37,400 29,300 40,700 33,300 UB 31,200 44,000 31,300 27,800 21,400 37,700 24,600
2 Currently unemployment rate(15 +) Both sex 14,2 18,0 15,0 13,2 10,7 16,5 11,9 Male 14,2 17,8 15,4 13,5 10,4 16,6 11,9
Female 14,1 18,2 14,5 12,9 10,9 16,3 11,9 Urban 18,7 22,0 19,4 18,3 15,1 20,7 16,7 Male 19,3 23,1 20,9 18,4 14,8 22,0 16,6 Female 18,1 20,7 18,0 18,2 15,4 19,4 16,8 Rural 10,0 14,0 10,8 8,6
6,9 12,3 7,7
Male 9,7
12,6 10,6 9,1 6,8 11,6 7,9 Female 10,3 15,6 11,1 8,1 7,0 13,2 7,5 18,2 20,7 20,3 16,7 15,7 20,6 16,2 Central 18,4 22,2 21,5 15,5 14,5 21,8 15,0 East 10,8 13,6 14,6 9,3 6,8 13,9 7,9 West 13,7 18,8 11,6 14,4 10,4 15,1 12,3 Khangai 12,5 16,9 12,7 11,3 8,8 14,8 10,1
3 Age distribution of Unemployed (15 +) Both sexes 142,300 180,300 148,100 134,400 108,100 163,900 120,700 15-19 13,700 17,600 12,900 15,800 8,300 15,200 12,100 20-24 26,200 34,100 25,000 23,500 22,400 29,600 22,700 25-34 41,800 51,100 45,800 39,300 31,500 48,300 35,300 35-44 39,300 47,700 42,000 38,900 28,900 44,600 34,000 45-54 17,700 24,200 17,900 15,200 14,200 21,100 14,500
55-64 3,200 4,600 4,200 1,500 2,700 4,500 2,000 65 + 400 1,000 300 200 100 600 100
Male 74,600 93,800 79,500 70,900 54,900 86,600 62,500 15-19 7,500 7,800 8,400 9,900 3,800 8,100 6,900 20-24 14,100 18,000 12,500 12,600 13,100 15,300 12,700 25-34 21,400 27,400 24,200 19,400 15,000 25,800 17,100 35-44 18,400 22,300 20,000 18,900 12,700 21,000 15,800 45-54 10,900 14,200 12,100 9,200 8,200 13,200 8,600 55-64 2,100 3,300 2,200 900 2,000 2,800 1,400 65 + 200 800 100 0 100 400 0 Female 67,700 86,500 68,600 63,500 53,200 77,300 58,200 15-19 6,200 9,800 4,500 5,900 4,500 7,100 5,200 20-24 12,100 16,100 12,500 10,900 9,300 14,300 10,000 25-34 20,400 23,700 21,600 19,900 16,500 22,500 18,200 35-44 20,900 25,400 22,000 20,000 16,200 23,600 18,200 45-54 6,800 10,000 5,800 6,000 6,000 7,900 5,900 55-64 1,100 1,300 2,000 600 700 1,700 600
65 + 200 200 200 200 0 200 100
114
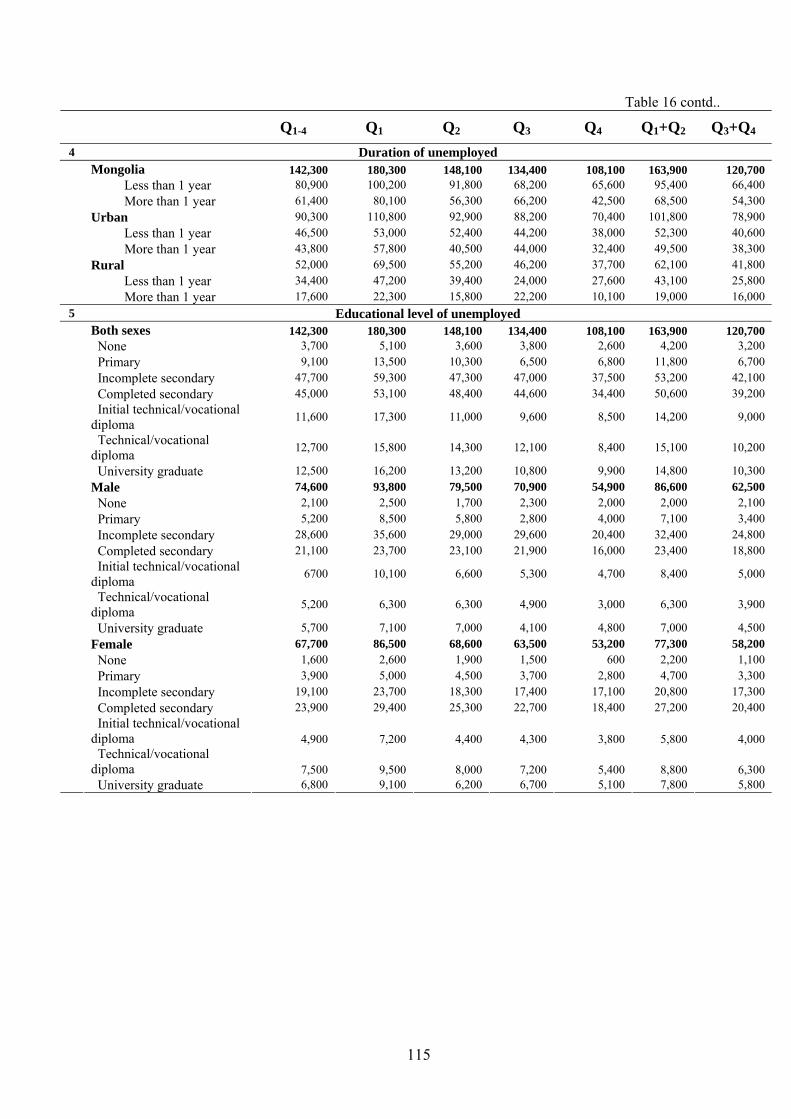
Table 16 contd..
Q1-4 Q1 Q2 Q3 Q4 Q1+Q2 Q3+Q4
4 Duration of unemployed Mongolia 142,300 180,300 148,100 134,400 108,100 163,900 120,700 Less than 1 year 80,900 100,200 91,800 68,200 65,600 95,400 66,400 More than 1 year 61,400 80,100 56,300 66,200 42,500 68,500 54,300 Urban 90,300 110,800 92,900 88,200 70,400 101,800 78,900 Less than 1 year 46,500 53,000 52,400 44,200 38,000 52,300 40,600 More than 1 year 43,800 57,800 40,500 44,000 32,400 49,500 38,300 Rural 52,000 69,500 55,200 46,200 37,700 62,100 41,800 Less than 1 year 34,400 47,200 39,400 24,000 27,600 43,100 25,800
More than 1 year 17,600 22,300 15,800 22,200 10,100 19,000 16,000 5 Educational level of unemployed
Both sexes 142,300 180,300 148,100 134,400 108,100 163,900 120,700 None 3,700 5,100 3,600 3,800 2,600 4,200 3,200 Primary 9,100 13,500 10,300 6,500 6,800 11,800 6,700 Incomplete secondary 47,700 59,300 47,300 47,000 37,500 53,200 42,100 Completed secondary 45,000 53,100 48,400 44,600 34,400 50,600 39,200 Initial technical/vocational diploma 11,600 17,300 11,000 9,600 8,500 14,200 9,000
Technical/vocational diploma 12,700 15,800 14,300 12,100 8,400 15,100 10,200
University graduate 12,500 16,200 13,200 10,800 9,900 14,800 10,300 Male 74,600 93,800 79,500 70,900 54,900 86,600 62,500 None 2,100 2,500 1,700 2,300 2,000 2,000 2,100 Primary 5,200 8,500 5,800 2,800 4,000 7,100 3,400 Incomplete secondary 28,600 35,600 29,000 29,600 20,400 32,400 24,800 Completed secondary 21,100 23,700 23,100 21,900 16,000 23,400 18,800 Initial technical/vocational diploma 6700 10,100 6,600 5,300 4,700 8,400 5,000
Technical/vocational diploma 5,200 6,300 6,300 4,900 3,000 6,300 3,900
University graduate 5,700 7,100 7,000 4,100 4,800 7,000 4,500 Female 67,700 86,500 68,600 63,500 53,200 77,300 58,200 None 1,600 2,600 1,900 1,500 600 2,200 1,100 Primary 3,900 5,000 4,500 3,700 2,800 4,700 3,300 Incomplete secondary 19,100 23,700 18,300 17,400 17,100 20,800 17,300 Completed secondary 23,900 29,400 25,300 22,700 18,400 27,200 20,400 Initial technical/vocational diploma 4,900 7,200 4,400 4,300 3,800 5,800 4,000 Technical/vocational diploma 7,500 9,500 8,000 7,200 5,400 8,800 6,300
University graduate 6,800 9,100 6,200 6,700 5,100 7,800 5,800
115

Table 17: USUALLY ECONOMICALLY ACTIVE POPULATION AGED 15 YEARS AND OVER
Q1-4 Q1 Q2 Q3 Q4 Q1+Q2 Q3+Q4
1 Usually economically active population (15 +)
Both sexes 941,500 946,300 914,600 959,800 948,900 930,700 953,600 Male 492,200 502,600 475,000 498,000 494,000 489,100 495,700 Female 449,300 443,700 439,600 461,800 454,900 441,600 457,900 Urban 446,700 468,600 436,900 442,000 438,600 453,100 440,100 Male 230,300 243,000 221,500 228,800 226,100 232,700 227,500 Female 216,400 225,600 215,400 213,200 212,500 220,400 212,600 Rural 494,800 477,700 477,700 517,800 510,300 477,600 513,500 Male 261,900 259,600 253,500 269,200 267,900 256,400 268,200 Female 232,900 218,100 224,200 248,600 242,400 221,200 245,300 Central 184,600 184,200 184,100 194,800 175,800 184,000 185,100 East 76,400 78,700 71,000 80,300 76,400 74,600 78,400 West 188,600 183,200 172,000 204,900 197,900 177,900 201,000 Khangai 259,200 258,400 261,000 252,900 263,400 260,000 258,000
Ulaanbaatar 232,700 241,800 226,500 226,900 235,400 234,200 231,100
2 Usually LFPR Both sexes 61,2 62,9 60,3 61,0 60,8 61,6 60,9 Male 65,5 68,7 64,1 65,2 64,5 66,4 64,8 Female 57,0 57,4 56,7 57,1 57,2 57,1 57,2 Urban 52,2 55,7 51,1 50,7 51,8 53,4 51,2 Male 56,3 61,1 54,2 54,6 55,6 57,7 55,1 Female 48,5 50,8 48,2 47,1 48,3 49,5 47,6 Rural 72,3 72,1 72,3 73,8 71,5 72,2 72,7 Male 76,5 77,8 76,3 77,9 74,6 77,0 76,2 Female 68,1 66,2 68,3 69,9 68,4 67,3 69,1 Central 60,2 63,5 63,8 58,5 57,1 63,5 57,8 East 62,9 66,1 57,3 67,3 62,0 61,4 64,6 West 69,4 69,1 65,8 73,7 69,2 67,7 71,4 Khangai 71,1 71,7 72,5 69,5 70,5 72,2 70,0
Ulaanbaatar 49,0 51,5 47,0 47,5 50,1 49,2 48,8
3 Usually economically Inactive population (15 +)
Both sexes 597,800 558,500 601,500 612,600 611,300 579,700 612,200 Male 258,700 228,600 266,100 266,300 271,500 247,200 269,000 Female 339,100 329,900 335,400 346,300 339,800 332,500 343,200 Urban 408,500 373,300 418,600 429,200 408,200 395,800 419,100 Male 178,400 154,700 187,300 190,000 180,500 170,800 185,500 Female 230,100 218,600 231,300 239,200 227,700 225,000 233,600 Rural 189,300 185,200 182,900 183,400 203,100 183,900 193,100 Male 80,300 73,900 78,800 76,300 91,000 76,400 83,500 Female 109,000 111,300 104,100 107,100 112,100 107,500 109,600 Central 121,900 106,100 104,500 138,400 131,900 105,900 135,300 East 45,100 40,200 52,900 39,000 46,700 46,900 42,900 West 83,100 82,200 89,100 73,200 88,100 84,900 80,500 Khangai 105,200 101,800 99,000 111,000 110,000 100,000 110,600
Ulaanbaatar 242,400 228,200 256,000 251,000 234,600 242,000 242,900
116

Table 17 contd. Q1-4 Q1 Q2 Q3 Q4 Q1+Q2 Q3+Q4
4 Usually employed population (15 +) Both sexes 856,600 827,200 836,000 877,600 887,000 832,500 881,600 Male 446,800 438,600 434,000 452,100 462,200 436,900 456,900 Female 409,800 388,600 402,000 425,500 424,800 395,600 424,700 Urban 394,000 400,800 383,800 393,100 396,100 392,800 394,400 Male 201,400 205,300 192,400 201,400 204,100 199,300 202,800 Female 192,600 195,500 191,400 191,700 192,000 193,500 191,600 Rural 462,600 426,400 452,200 484,500 490,900 439,700 487,200 Male 245,400 233,300 241,600 250,700 258,100 237,600 254,100 Female 217,200 193,100 210,600 233,800 232,800 202,100 233,100 Central 166,600 157,300 165,000 178,900 164,000 161,100 171,200 East 67,600 64,300 61,500 72,000 73,500 62,800 72,600 West 174,000 165,200 154,000 190,600 189,100 160,100 189,700 Khangai 229,500 219,900 239,900 218,600 238,300 230,400 228,300
Ulaanbaatar 218,900 220,500 215,600 217,500 222,100 218,100 219,800 5 Usually employment rate (15 +)
Both sexes 91,0 87,4 91,4 91,4 93,5 89,4 92,5 Male 90,8 87,3 91,4 90,8 93,6 89,3 92,2 Female 91,2 87,6 91,4 92,1 93,4 89,6 92,7 Urban 88,2 85,5 87,8 88,9 90,3 86,7 89,6 Male 87,5 84,5 86,9 88,0 90,3 85,6 89,2 Female 89,0 86,7 88,8 89,9 90,3 87,8 90,1 Rural 93,5 89,3 94,7 93,6 96,2 92,1 94,9 Male 93,7 89,9 95,3 93,1 96,3 92,7 94,8 Female 93,2 88,5 93,9 94,1 96,0 91,4 95,0 Central 90,3 85,4 89,6 91,9 93,3 87,6 92,5 East 88,4 81,7 86,7 89,7 96,2 84,1 92,6 West 92,2 90,2 89,6 93,0 95,5 90,0 94,4 Khangai 88,6 85,1 91,9 86,5 90,5 88,6 88,5
Ulaanbaatar 94,1 91,2 95,2 95,9 94,4 93,1 95,1 6 Usually unemployed population (15 +)
Both sexes 84,900 119,100 78,600 82,200 61,900 98,200 72,000 Male 45,400 64,000 41,000 45,900 31,800 52,200 38,800 Female 39,500 55,100 37,600 36,300 30,100 46,000 33,200 Urban 52,700 67,800 53,100 48,900 42,500 60,300 45,700 Male 28,900 37,700 29,100 27,400 22,000 33,400 24,700 Female 23,800 30,100 24,000 21,500 20,500 26,900 21,000 Rural 32,200 51,300 25,500 33,300 19,400 37,900 26,300 Male 16,500 26,300 11,900 18,500 9,800 18,800 14,100 Female 15,700 25,000 13,600 14,800 9,600 19,100 12,200 Central 18,000 26,900 19,100 15,900 11,800 22,900 13,900 East 8,800 14,400 9,500 83,00 2,900 11,800 5,800 West 14,600 18,000 18,000 14,300 8,800 17,800 11,300 Khangai 29,700 38,500 21,100 34,300 25,100 29,600 29,700
Ulaanbaatar 13,800 21,300 10,900 9,400 13,300 16,100 11,300
117

Table 17 contd..
Q1-4 Q1 Q2 Q3 Q4 Q1+Q2 Q3+Q4
7 Usually unemployment rate Both sexes 9,0 12,6 8,6 8,6 6,5 10,6 7,5 Male 9,2 12,7 8,6 9,2 6,4 10,7 7,8 Female 8,8 12,4 8,6 7,9 6,6 10,4 7,3
Urban 11,8 14,5 12,2 11,1 9,7 13,3 10,4 Male 12,5 15,5 13,1 12,0 9,7 14,4 10,8 Female 11,0 13,3 11,2 10,1 9,7 12,2 9,9 Rural 6,5 10,7 5,3 6,4 3,8 7,9 5,1 Male 6,3 10,1 4,7 6,9 3,7 7,3 5,2 Female 6,8 11,5 6,1 5,9 4,0 8,6 5,0 9,7 14,6 10,4 8,1 6,7 12,4 7,5 Central 11,6 18,3 13,3 10,3 3,8 15,9 7,4 East 7,8 9,8 10,4 7,0 4,5 10,0 5,6 West 11,4 14,9 8,1 13,5 9,5 11,4 11,5
Khangai 5,9 8,8 4,8 4,1 5,6 6,9 4,9 8 Usually employed by sector (15+)
Both sexes 856,600 827,200 836,000 877,600 887,000 832,500 881,600 Agriculture 396,800 365,100 381,900 416,800 426,900 374,200 421,400 Production 103,500 108,900 103,300 98,300 103,300 106,200 100,600 Services 356,300 353,200 350,800 362,500 356,800 352,100 359,600 Male 446,800 438,600 434,000 452,100 462,200 436,800 456,900 Agriculture 213,900 202,400 207,300 220,700 226,800 205,200 223,500 Production 62,500 67,700 59,900 61,500 60,400 63,800 60,900 Services 170,400 168,500 166,800 169,900 175,000 167,800 172,500 Female 409,800 388,600 402,000 425,500 424,800 395,700 424,700 Agriculture 182,900 162,700 174,600 196,100 200,100 169,000 197,900 Production 41,000 41,200 43,400 36,800 42,900 42,400 39,700
Services 185,900 184,700 184,000 192,600 181,800 184,300 187,100 9 Usually employed by employment status (15+)
Both sexes 856,600 827,200 836,000 877,600 887,000 832,500 881,600 Paid employees 340,400 354,200 343,700 338,000 325,900 349,100 331,500 Employer 8,100 12,200 7,900 7,100 4,900 10,100 6,000 Own account worker 281,400 232,700 246,400 306,900 339,400 240,100 322,800 Unpaid family worker 226,700 228,100 238,000 225,600 216,800 233,200 221,300 Male 446,800 438,600 434,000 452,100 462,200 436,800 456,900 Paid employees 168,700 177,400 168,100 167,200 161,800 172,800 164,400 Employer 4,700 8,000 4,900 2,700 3,100 6,400 2,900 Own account worker 188,000 155,800 165,700 204,100 226,900 161,200 215,300 Unpaid family worker 85,400 97,400 95,300 78,100 70,400 96,400 74,300 Female 409,800 388,600 402,000 425,500 424,800 395,700 424,700 Paid employees 171,700 176,800 175,600 170,800 164,100 176,300 167,100 Employer 3,400 4,200 3,000 4,400 1,800 3,700 3,100 Own account worker 93,400 76,900 80,700 102,800 112,500 78,900 107,500
Unpaid family worker 141,300 130,700 142,700 147,500 146,400 136,800 147,000
118

Table 17 contd.. Q1-4 Q1 Q2 Q3 Q4 Q1+Q2 Q3+Q4
10 Usually employed by occupation(15+) Both sexes 856,600 827,200 836,000 877,600 887,000 832,500 881,600
Legislators, professionals 136,200 138,700 131,000 129,500 145,800 134,800 137,200
Technicians, clerks, service 157,800 150,000 153,400 164,700 163,900 151,500 164,000
Skilled agricultural 385,300 331,700 380,700 409,700 421,100 357,500 415,000 Craft, elementary 177,300 206,800 170,900 173,700 156,200 188,700 165,400 Male 446,800 438,600 434,000 452,100 462,200 436,800 456,900 Legislators, professionals 59,500 61,000 55,300 57,100 64,800 58,100 60,800 Technicians, clerks, service 58,700 55,500 56,200 59,600 63,700 55,700 61,500 Skilled agricultural 207,800 183,700 207,300 217,400 223,400 196,200 220,200 Craft, elementary 120,800 138,400 115,200 118,000 110,300 126,800 114,400 Female 409,800 388,600 402,000 425,500 424,800 395,700 424,700 Legislators, professionals 76,700 77,700 75,700 72,400 81,000 76,700 76,400 Technicians, clerks, service 99,100 94,500 97,200 105,100 100,200 95,800 102,500 Skilled agricultural 177,500 148,000 173,400 192,300 197,700 161,300 194,800
Craft, elementary 56,500 68,400 55,700 55,700 45,900 61,900 51,000
Table 18: Percentage of persons aged 15 years and over who had engaged in current economic activities
during the reference week by quarters
Q1-4 Q1 Q2 Q3 Q4
Wage job 297,900 309,700 299,500 302,300 279,800Agriculture 385,900 326,100 355,900 420,900 445,600Self employed 135,000 138,000 119,600 133,700 147,600
Total 800,500 748,200 761,700 838,900 856,200 Wage job 37.2 41.4 39.3 36.0 32.7Agriculture 48.2 43.6 46.7 50.2 52.1Self employed 16.9 18.4 15.7 15.9 17.2
Total, % 100.0 100.0 100.0 100.0 100.0
Average number of hour per week 45.7 44.2 45.1 47.3 45.9
Number of persons aged 15 years and over who had engaged in current non economic activities during the reference week by quarters
Total number of persons whoparticipated in any non-economic
activity1,419,200 1,379,700 1,399,500 1,442,900 1,451,300
Average number of hour per week 25.0 29.9 25.0 23.5 22.2
119

Table 19: Number of persons aged 15 and over who had engaged in current economic activities during reference week by sex and sector
Total Total Urban Rural Economic activities Total Male Female Total Male Female Total Male Female
Wage job 297,856 146,134 151,722 233,341 115,686 117,654 64,516 30,448 34,067 Any business 79,164 34,017 45,147 63,731 27,647 36,084 15,433 6,370 9,062 Animal husbandry 368,556 198,787 169,769 23,315 12,334 10,981 345,241 186,453 158,788 Agricultural activity 14,759 8,945 5,814 4,142 2,245 1,897 10,617 6,701 3,916 Forestry and logging 2,641 2,181 459 1,251 999 251 1,390 1,182 208 Transportation 20,751 19,293 1,458 15,388 14,135 1,252 5,363 5,157 206 Mining and quarrying 5,357 4,136 1,220 1,785 1,482 303 3,572 2,654 918 Food processing 2,756 1,256 1,500 1,708 821 887 1,048 435 613 Restaurant and hotel 4,953 1,665 3,288 3,176 1,011 2,165 1,777 655 1,122 Production, repair and maintenance of articles 6,669 5,365 1,303 3,346 2,598 748 3,323 2,767 555 Handicrafts 7,815 1,599 6,217 3,593 1,073 2,520 4,222 526 3,696 Construction and major repairs 6,389 4,676 1,713 5,086 3,628 1,458 1,303 1,048 255 Provision of private tuition, childcare services a fee 1,101 580 521 840 421 419 261 159 102 Self employed 502,645 272,874 229,771 123,281 66,333 56,948 379,364 206,541 172,823 All 800,501 419,008 381,493 356,622 182,019 174,602 443,879 236,989 206,890
West Total Urban Rural Economic activities Total Male Female Total Male Female Total Male Female
Wage job 31,582 15,489 16,094 15,883 7,919 7,963 15,700 7,569 8,130 Any business 13,802 6,355 7,447 7,415 3,323 4,092 6,387 3,032 3,355 Animal husbandry 117,818 62,837 54,981 4,199 2,361 1,838 113,619 60,476 53,143 Agricultural activity 4,925 3,117 1,808 1,226 630 596 3,699 2,487 1,212 Forestry and logging 412 304 108 198 132 66 214 172 42 Transportation 4,837 4,702 135 2,557 2,422 135 2,280 2,280 0 Mining and quarrying 353 278 75 99 66 33 254 211 42 Food processing 763 333 429 198 66 132 564 267 297 Restaurant and hotel 622 118 505 363 33 330 259 85 175 Production, repair and maintenance of articles 1,196 1,021 174 363 231 132 832 790 42 Handicrafts 1,807 275 1,531 401 103 298 1,406 173 1,233 Construction and major repairs 1,760 1,369 391 1,123 859 264 637 510 127 Provision of private tuition, childcare services a fee 268 118 151 99 33 66 169 85 85 Self employed 140,121 75,718 64,403 17,615 9,848 7,768 122,506 65,870 56,636 All 171,704 91,207 80,497 33,498 17,767 15,731 138,205 73,440 64,766
120

Khangai Total Urban Rural Economic activities Total Male Female Total Male Female Total Male Female
Wage job 52,811 26,065 26,746 33,848 16,752 17,096 18,962 9,313 9,650 Any business 12,897 4,780 8,117 8,928 3,291 5,637 3,969 1,489 2,480 Animal husbandry 132,057 70,745 61,312 4,048 2,212 1,837 128,009 68,533 59,476 Agricultural activity 3,781 2,097 1,684 808 456 352 2,973 1,641 1,332 Forestry and logging 626 626 0 220 220 0 406 406 0 Transportation 4,277 4,116 162 2,718 2,613 105 1,559 1,502 57 Mining and quarrying 2,212 1,473 739 209 157 52 2,003 1,316 687 Food processing 767 287 480 538 172 366 229 114 114 Restaurant and hotel 1,110 281 829 366 52 314 744 229 515 Production, repair and maintenance of articles 2,600 2,214 386 1,111 954 157 1,489 1,260 229 Handicrafts 2,527 438 2,089 581 209 372 1,945 229 1,716 Construction and major repairs 1,094 884 210 750 540 210 343 343 0 Provision of private tuition, childcare services a fee 266 214 52 209 157 52 57 57 0 Self employed 157,906 85,521 72,384 18,914 10,299 8,614 138,992 75,222 63,770 All 210,716 111,587 99,130 52,762 27,052 25,710 157,954 84,535 73,420
Center
Total Urban Rural Economic activities Total Male Female Total Male Female Total Male Female Wage job 59,067 27,590 31,477 35,942 17,304 18,639 23,125 10,286 12,839 Any business 12,142 3,943 8,200 8,920 2,763 6,157 3,222 1,180 2,042 Animal husbandry 76,198 42,541 33,658 6,996 3,642 3,355 69,202 38,899 30,303 Agricultural activity 5,085 3,118 1,967 1,553 804 749 3,532 2,314 1,218 Forestry and logging 1,102 894 208 656 521 135 446 373 72 Transportation 3,959 3,379 580 2,952 2,520 432 1,007 859 149 Mining and quarrying 1,961 1,655 306 646 528 117 1,315 1,127 189 Food processing 285 154 131 176 117 59 109 36 72 Restaurant and hotel 1,216 472 743 600 183 418 616 290 326 Production, repair and maintenance of articles 1,018 727 292 294 235 60 724 492 232 Handicrafts 1,484 242 1,242 647 117 530 836 124 712 Construction and major repairs 1,202 813 389 999 704 295 203 109 94 Provision of private tuition, childcare services a fee 0 0 0 0 0 0 0 0 0 Self employed 103,552 56,641 46,910 23,735 11,723 12,012 79,816 44,918 34,898 All 162,619 84,231 78,388 59,678 29,027 30,651 102,941 55,204 47,737
121

East Total Urban Rural
Economic activities Total Male Female Total Male Female Total Male Female
Wage job 18,819 9,794 9,025 12,090 6,514 5,576 6,729 3,280 3,449 Any business 4,776 1,737 3,039 2,922 1,068 1,854 1,854 669 1,185 Animal husbandry 38,943 21,314 17,628 4,530 2,769 1,761 34,412 18,545 15,867 Agricultural activity 812 507 304 398 249 149 413 258 155 Forestry and logging 350 257 93 26 26 0 324 231 93 Transportation 1,276 1,276 0 759 759 0 516 516 0 Mining and quarrying 131 131 0 131 131 0 0 0 0 Food processing 370 67 303 224 50 174 146 17 129 Restaurant and hotel 308 126 182 149 75 75 159 52 107 Production, repair and maintenance of articles 402 300 101 125 75 50 277 226 52 Handicrafts 308 25 283 274 25 249 34 0 34 Construction and major repairs 320 260 59 199 174 25 120 86 34 Provision of private tuition, childcare services a fee 59 42 17 25 25 0 34 17 17 Self employed 47,614 25,857 21,757 9,564 5,326 4,238 38,049 20,530 17,519 All 66,433 35,651 30,782 21,655 11,840 9,814 44,778 23,811 20,967
UB
Total Urban Rural Economic activities
Total Male Female Total Male Female Total Male Female Wage job 135,577 67,197 68,380 135,577 67,197 68,380 0 0 0 Any business 35,546 17,203 18,344 35,546 17,203 18,344 0 0 0 Animal husbandry 3,541 1,351 2,190 3,541 1,351 2,190 0 0 0 Agricultural activity 156 106 50 156 106 50 0 0 0 Forestry and logging 150 100 50 150 100 50 0 0 0 Transportation 6,402 5,820 581 6,402 5,820 581 0 0 0 Mining and quarrying 700 600 100 700 600 100 0 0 0 Food processing 572 415 156 572 415 156 0 0 0 Restaurant and hotel 1,697 668 1,029 1,697 668 1,029 0 0 0 Production, repair and maintenance of articles 1,453 1,103 350 1,453 1,103 350 0 0 0 Handicrafts 1,690 619 1,071 1,690 619 1,071 0 0 0 Construction and major repairs 2,014 1,350 664 2,014 1,350 664 0 0 0 Provision of private tuition, childcare services a fee 506 206 301 506 206 301 0 0 0 Self employed 53,452 29,136 24,316 53,452 29,136 24,316 0 0 0 All 189,029 96,333 92,696 189,029 96,333 92,696 0 0 0
122
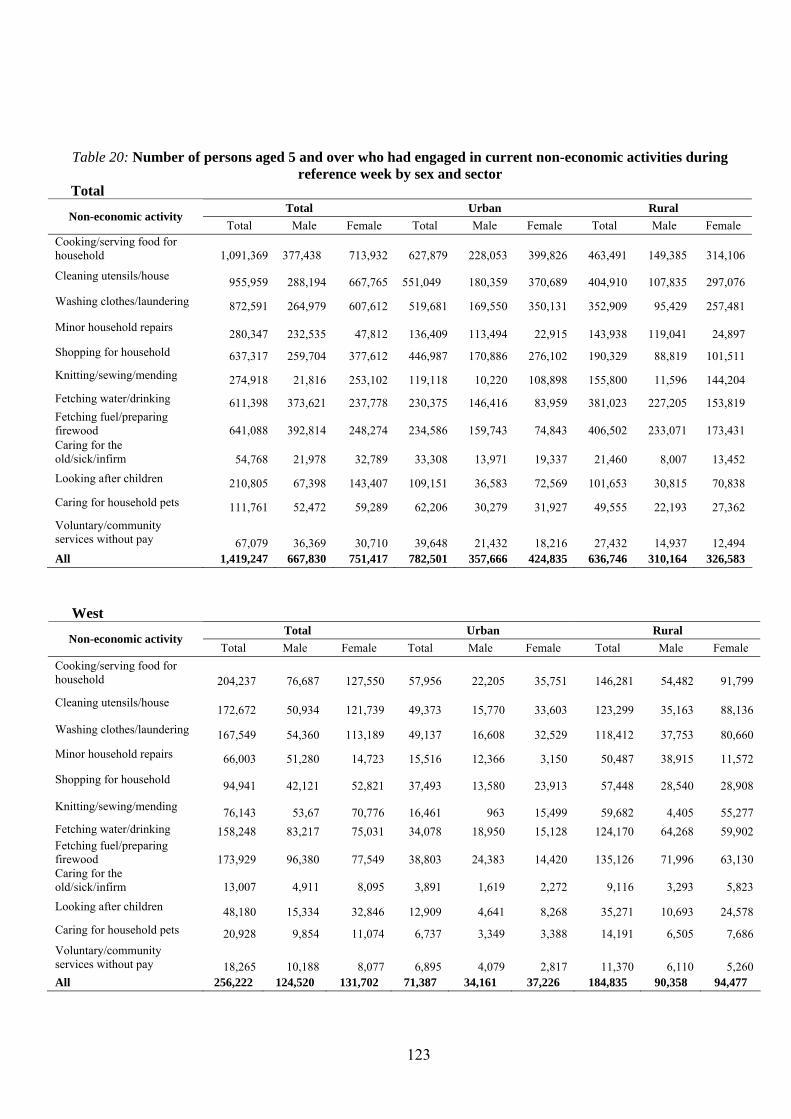
Table 20: Number of persons aged 5 and over who had engaged in current non-economic activities during reference week by sex and sector
Total Total Urban Rural
Non-economic activity Total Male Female Total Male Female Total Male Female
Cooking/serving food for household 1,091,369 377,438 713,932 627,879 228,053 399,826 463,491 149,385 314,106
Cleaning utensils/house 955,959 288,194 667,765 551,049 180,359 370,689 404,910 107,835 297,076 Washing clothes/laundering 872,591 264,979 607,612 519,681 169,550 350,131 352,909 95,429 257,481
Minor household repairs 280,347 232,535 47,812 136,409 113,494 22,915 143,938 119,041 24,897 Shopping for household 637,317 259,704 377,612 446,987 170,886 276,102 190,329 88,819 101,511 Knitting/sewing/mending 274,918 21,816 253,102 119,118 10,220 108,898 155,800 11,596 144,204 Fetching water/drinking 611,398 373,621 237,778 230,375 146,416 83,959 381,023 227,205 153,819 Fetching fuel/preparing firewood 641,088 392,814 248,274 234,586 159,743 74,843 406,502 233,071 173,431 Caring for the old/sick/infirm 54,768 21,978 32,789 33,308 13,971 19,337 21,460 8,007 13,452 Looking after children 210,805 67,398 143,407 109,151 36,583 72,569 101,653 30,815 70,838 Caring for household pets 111,761 52,472 59,289 62,206 30,279 31,927 49,555 22,193 27,362 Voluntary/community services without pay 67,079 36,369 30,710 39,648 21,432 18,216 27,432 14,937 12,494 All 1,419,247 667,830 751,417 782,501 357,666 424,835 636,746 310,164 326,583
West Total Urban Rural
Non-economic activity Total Male Female Total Male Female Total Male Female
Cooking/serving food for household 204,237 76,687 127,550 57,956 22,205 35,751 146,281 54,482 91,799
Cleaning utensils/house 172,672 50,934 121,739 49,373 15,770 33,603 123,299 35,163 88,136 Washing clothes/laundering 167,549 54,360 113,189 49,137 16,608 32,529 118,412 37,753 80,660 Minor household repairs 66,003 51,280 14,723 15,516 12,366 3,150 50,487 38,915 11,572
Shopping for household 94,941 42,121 52,821 37,493 13,580 23,913 57,448 28,540 28,908
Knitting/sewing/mending 76,143 53,67 70,776 16,461 963 15,499 59,682 4,405 55,277 Fetching water/drinking 158,248 83,217 75,031 34,078 18,950 15,128 124,170 64,268 59,902 Fetching fuel/preparing firewood 173,929 96,380 77,549 38,803 24,383 14,420 135,126 71,996 63,130 Caring for the old/sick/infirm 13,007 4,911 8,095 3,891 1,619 2,272 9,116 3,293 5,823 Looking after children 48,180 15,334 32,846 12,909 4,641 8,268 35,271 10,693 24,578 Caring for household pets 20,928 9,854 11,074 6,737 3,349 3,388 14,191 6,505 7,686 Voluntary/community services without pay 18,265 10,188 8,077 6,895 4,079 2,817 11,370 6,110 5,260 All 256,222 124,520 131,702 71,387 34,161 37,226 184,835 90,358 94,477
123

Khangai
Total Urban Rural Non-economic activity
Total Male Female Total Male Female Total Male Female Cooking/serving food for household 231,912 65,933 165,979 85,519 29,897 55,622 146,393 36,036 110,357 Cleaning utensils/house 202,522 49,488 153,035 77,226 25,557 51,668 125,297 23,931 101,366 Washing clothes/laundering 173,176 43,758 129,418 66,578 18,428 48,150 106,598 25,330 81,268 Minor household repairs 60,612 54,022 6,590 21,979 19,555 2,423 38,633 34,466 4,167 Shopping for household 118,784 52,063 66,721 57,391 19,343 38,049 61,393 32,720 28,673
Knitting/sewing/mending 76,604 4,059 72,545 22,345 714 21,630 54,259 3,345 50,915
Fetching water/drinking 169,663 102,387 67,276 40,092 24,394 15,697 129,571 77,993 51,578 Fetching fuel/preparing firewood 190,448 115,690 74,758 45,434 29,757 15,677 145,014 85,933 59,081 Caring for the old/sick/infirm 12,338 4,750 7,588 6,473 2,618 3,854 5,865 2,132 3,734
Looking after children 46,668 15,644 31,024 15,893 5,858 10,036 30,775 9,787 20,988 Caring for household pets 19,503 9,381 10,122 8,391 4,557 3,834 11,112 4,825 6,288 Voluntary/community services without pay 10,162 5,554 4,608 3,061 1,481 1,580 7,101 4,073 3,028
All 335,429 160,120 175,309 109,167 50,169 58,998 226,262 109,950 116,312
Center
Total Urban Rural Non-economic activity
Total Male Female Total Male Female Total Male Female Cooking/serving food for household 230,334 87,536 142,798 103,543 40,074 63,469 126,792 47,462 79,329 Cleaning utensils/house 212,526 74,997 137,529 95,795 35,006 60,789 116,731 39,991 76,740 Washing clothes/laundering 177,967 54,252 123,716 85,374 28,783 56,591 92,594 25,469 67,125 Minor household repairs 56,939 45,006 11,933 20,666 15,835 4,830 36,273 29,171 7,102 Shopping for household 115,185 38,529 76,656 66,677 21,321 45,356 48,508 17,208 31,300 Knitting/sewing/mending 53,150 6,284 46,866 20,710 3,267 17,443 32,440 3,017 29,423 Fetching water/drinking 134,820 88,581 46,240 44,858 27,485 17,373 89,962 61,096 28,867 Fetching fuel/preparing firewood 126,023 80,003 46,020 41,001 27,029 13,972 85,022 52,974 32,048 Caring for the old/sick/infirm 8,157 3,285 4,872 3,634 1,534 2,100 4,522 1,751 2,771 Looking after children 41,590 13,360 28,229 15,301 5,290 10,011 26,289 8,070 18,218 Caring for household pets 23,116 11,307 11,808 7,200 3,351 3,849 15,916 7,957 7,959 Voluntary/community services without pay 10,965 5,845 5,120 4,093 2,112 1,981 6,872 3,733 3,139
All 281,308 132,849 148,460 121,846 55,281 66,565 159,462 77,568 81,895
124

125
East
Total Urban Rural Non-economic activity
Total Male Female Total Male Female Total Male Female Cooking/serving food for household 80,068 23,883 56,185 36,042 12,478 23,564 44,026 11,405 32,621 Cleaning utensils/house 70,942 18,205 52,736 31,358 9,456 21,902 39,583 8,749 30,834 Washing clothes/laundering 64,584 15,181 49,402 29,278 8,304 20,974 35,306 6,877 28,428 Minor household repairs 27,726 24,606 3,121 9,182 8,116 1,066 18,544 16,490 2,055 Shopping for household 45,782 18,779 27,003 22,802 8,429 14,372 22,980 10,350 12,630 Knitting/sewing/mending 15,038 1,318 13,720 5,618 488 5,130 9,420 830 8,590 Fetching water/drinking 53,952 34,737 19,215 16,632 10,889 5,743 37,320 23,849 13,471 Fetching fuel/preparing firewood 58,834 32,384 26,450 17,493 10,216 7,277 41,341 22,168 19,173 Caring for the old/sick/infirm 3,175 1,410 1,766 1,219 578 641 1,956 832 1,124 Looking after children 13,458 3,534 9,924 4,140 1,269 2,871 9,318 2,265 7,054 Caring for household pets 12,932 4,771 8,161 4,595 1,864 2,732 8,336 2,907 5,429 Voluntary/community services without pay 4,177 2,067 2,110 2,088 1,046 1,043 2,089 1,022 1,068
All 112,699 54,362 58,337 46,512 22,074 24,438 66,187 32,288 33,899
UB
Total Urban Rural Non-economic activity
Total Male Female Total Male Female Total Male Female Cooking/serving food for household 344,818 123,399 221,419 344,818 123,399 221,419 0 0 0 Cleaning utensils/house 297,297 94,570 202,727 297,297 94,570 202,727 0 0 0 Washing clothes/laundering 289,314 97,428 191,886 289,314 97,428 191,886 0 0 0 Minor household repairs 69,067 57,621 11,446 69,067 57,621 11,446 0 0 0 Shopping for household 262,624 108,213 154,411 262,624 108,213 154,411 0 0 0 Knitting/sewing/mending 53,984 4,789 49,195 53,984 4,789 49,195 0 0 0 Fetching water/drinking 94,715 64,698 30,017 94,715 64,698 30,017 0 0 0 Fetching fuel/preparing firewood 91,855 68,357 23,497 91,855 68,357 23,497 0 0 0 Caring for the old/sick/infirm 18,091 7,622 10,469 18,091 7,622 10,469 0 0 0 Looking after children 60,908 19,525 41,383 60,908 19,525 41,383 0 0 0 Caring for household pets 35,283 17,159 18,124 35,283 17,159 18,124 0 0 0 Voluntary/community services without pay 23,510 12,714 10,795 23,510 12,714 10,795 0 0 0
All 433,588 195,980 237,609 433,588 195,980 237,609 0 0 0

126
Table 21: 5-17 economically active children by age group, sex Labour force Employed Unemployed Inactive Age group Total Male Female
Total Male Female Total Male Female Total Male Female Total Male Female Total 679,049 347,652 331,397 73,484 44,573 28,911 68,580 41,874 26,706 4,904 2,700 2,204 603,428 302,294 301,134 5 38,760 20,082 18,678 2,482 1,332 1,150 2,482 1,332 1,150 0 0 0 36,236 18,708 17,528 6 43,656 23,214 20,442 3,327 2,079 1,248 3,327 2,079 1,248 0 0 0 40,257 21,062 19,194 7 45,726 23,361 22,365 4,219 2,473 1,746 4,219 2,473 1,746 0 0 0 41,389 20,852 20,537 8 43,253 21,270 21,983 3,316 1,858 1,459 3,291 1,833 1,459 25 25 0 39,654 19,340 20,314 9 40,750 21,277 19,473 2,000 1,288 712 2,000 1,288 712 0 0 0 38,561 19,953 18,607 10 49,262 24,043 25,218 2,435 1,388 1,047 2,383 1,388 995 52 0 52 46,547 22,494 24,054 11 55,752 28,226 27,526 2,249 1,361 888 2,249 1,361 888 0 0 0 53,386 26,828 26,557 12 60,184 32,368 27,816 3,803 2,595 1,207 3,710 2,545 1,165 92 50 42 56,185 29,737 26,448 13 65,696 34,878 30,818 6,888 4,607 2,281 6,652 4,507 2,145 236 100 136 58,705 30,271 28,434 14 63,948 32,483 31,465 6,550 4,038 2,511 6,412 3,960 2,452 137 79 59 57,217 28,336 28,881 15 60,856 29,845 31,011 9,801 5,893 3,908 9,322 5,703 3,619 479 190 288 50,836 23,806 27,031 16 56,170 28,869 27,301 11,616 6,793 4,824 10,176 6,037 4,140 1,440 756 684 44,383 22,040 22,343
Total
17 55,037 27,735 27,302 14,797 8,868 5,930 12,355 7,368 4,987 2,442 1,500 942 40,073 18,868 21,205 Total 360,750 184,932 175,818 9,961 6,232 3,729 6,894 4,558 2,336 3,067 1,674 1,393 350,417 178,635 171,782 5 16,086 8,195 7,891 0 0 0 0 0 0 0 0 0 16,086 8,195 7,891 6 19,021 10,807 8,214 66 66 0 66 66 0 0 0 0 18,955 10,740 8,214 7 20,837 10,484 10,354 92 92 0 92 92 0 0 0 0 20,745 10,392 10,354 8 21,238 10,522 10,716 358 196 162 333 171 162 25 25 0 20,815 10,327 10,488 9 20,393 10,584 9,809 69 0 69 69 0 69 0 0 0 20,324 10,584 9,740 10 25,991 12,890 13,101 151 66 85 99 66 33 52 0 52 25,840 12,824 13,016 11 32,002 16,193 15,809 157 104 52 157 104 52 0 0 0 31,845 16,088 15,756 12 33,973 18,621 15,352 369 336 33 319 285 33 50 50 0 33,480 18,285 15,195 13 38,048 20,219 17,829 1,256 818 438 1,037 735 302 219 83 136 36,734 19,401 17,332 14 37,346 18,442 18,904 1,109 812 297 1,051 812 238 59 0 59 36,237 17,630 18,607 15 33,373 16,361 17,011 1,401 756 645 1,029 672 356 372 84 288 31,907 15,540 16,367 16 32,405 16,462 15,943 2,055 1,133 922 1,084 649 435 971 484 487 30,350 15,329 15,021
Urban
17 30,038 15,153 14,885 2,878 1,853 1,025 1,559 905 654 1,319 949 371 27,101 13,300 13,801 Total 318,299 162,720 155,579 63,523 38,341 25,181 61,686 37,316 24,370 1,837 1,026 811 253,010 123,658 129,352 5 22,674 11,888 10,787 2,482 1,332 1,150 2,482 1,332 1,150 0 0 0 20,150 10,513 9,637 6 24,636 12,407 12,228 3,261 2,013 1,248 3,261 2,013 1,248 0 0 0 21,302 10,322 10,980 7 24,888 12,877 12,011 4,128 2,381 1,746 4,128 2,381 1,746 0 0 0 20,644 10,460 10,184 8 22,015 10,748 11,267 2,958 1,662 1,296 2,958 1,662 1,296 0 0 0 18,839 9,014 9,826 9 20,357 10,694 9,663 1,931 1,288 643 1,931 1,288 643 0 0 0 18,237 9,369 8,867 10 23,271 11,153 12,117 2,284 1,322 962 2,284 1,322 962 0 0 0 20,708 9,670 11,038 11 23,750 12,033 11,717 2,092 1,257 836 2,092 1,257 836 0 0 0 21,541 10,740 10,801 12 26,211 13,748 12,464 3,434 2,260 1,174 3,392 2,260 1,132 42 0 42 22,705 11,452 11,253 13 27,648 14,659 12,989 5,632 3,789 1,843 5,615 3,772 1,843 17 17 0 21,971 10,869 11,101 14 26,602 14,041 12,561 5,440 3,226 2,214 5,362 3,148 2,214 79 79 0 20,981 10,706 10,275 15 27,483 13,484 14,000 8,400 5,137 3,263 8,293 5,030 3,263 107 107 0 18,930 8,266 10,664 16 23,765 12,407 11,358 9,561 5,660 3,902 9,092 5,388 3,704 469 272 198 14,033 6,711 7,322
Rural
17 24,999 12,582 12,417 11,919 7,015 4,904 10,796 6,463 4,333 1,122 551 571 12,971 5,568 7,404

127
Table 22 :Attending and not attending children by age group, sex, U-R Attending Not attending
Age group Total Male Female Total Male Female Total Male Female
Total 679,049 347,652 331,397 507,204 252,666 254,537 171,846 94,986 76,8605 38,760 20,082 18,678 893 494 399 37,867 19,588 18,2796 43,656 23,214 20,442 2,590 1,302 1,287 41,067 21,911 19,1557 45,726 23,361 22,365 18,034 8,926 9,108 27,692 14,435 13,2568 43,253 21,270 21,983 35,045 17,067 17,978 8,208 4,203 4,0059 40,750 21,277 19,473 38,637 20,048 18,589 2,113 1,230 88410 49,262 24,043 25,218 47,664 23,019 24,645 1,598 1,024 57311 55,752 28,226 27,526 53,383 26,879 26,504 2,369 1,347 1,02212 60,184 32,368 27,816 57,133 30,105 27,028 3,051 2,264 78813 65,696 34,878 30,818 60,480 31,670 28,810 5,216 3,208 2,00814 63,948 32,483 31,465 57,724 28,542 29,182 6,224 3,941 2,28215 60,856 29,845 31,011 52,855 25,015 27,840 8,001 4,830 3,17116 56,170 28,869 27,301 43,959 21,475 22,485 12,211 7,394 4,817
Total
17 55,037 27,735 27,302 38,807 18,126 20,681 16,230 9,610 6,620Total 360,750 184,932 175,818 303,679 153,790 149,889 57,072 31,142 25,9295 16,086 8,195 7,891 766 431 335 15,319 7,764 7,5566 19,021 10,807 8,214 2,061 1,232 829 16,960 9,575 7,3857 20,837 10,484 10,354 10,687 5,048 5,639 10,150 5,435 4,7158 21,238 10,522 10,716 18,789 9,391 9,398 2,448 1,131 1,3189 20,393 10,584 9,809 19,971 10,525 9,446 422 59 36410 25,991 12,890 13,101 25,640 12,696 12,944 351 194 15711 32,002 16,193 15,809 31,344 15,780 15,564 658 413 24512 33,973 18,621 15,352 33,533 18,290 15,243 439 330 10913 38,048 20,219 17,829 36,914 19,627 17,287 1,134 592 54214 37,346 18,442 18,904 36,072 17,742 18,330 1,274 700 57315 33,373 16,361 17,011 31,936 15,520 16,416 1,436 841 59516 32,405 16,462 15,943 29,778 14,894 14,883 2,627 1,568 1,060
Urban
17 30,038 15,153 14,885 26,185 12,613 13,573 3,853 2,540 1,312Total 318,299 162,720 155,579 203,525 98,876 104,649 114,774 63,844 50,9305 22,674 11,888 10,787 127 63 63 22,547 11,824 10,7236 24,636 12,407 12,228 529 71 458 24,107 12,337 11,7707 24,888 12,877 12,011 7,347 3,878 3,469 17,542 9,000 8,5428 22,015 10,748 11,267 16,256 7,676 8,580 5,759 3,073 2,6879 20,357 10,694 9,663 18,666 9,522 9,143 1,691 1,171 52010 23,271 11,153 12,117 22,024 10,323 11,701 1,247 830 41611 23,750 12,033 11,717 22,039 11,099 10,940 1,712 935 77712 26,211 13,748 12,464 23,599 11,814 11,785 2,612 1,933 67913 27,648 14,659 12,989 23,566 12,043 11,524 4,082 2,616 1,46614 26,602 14,041 12,561 21,652 10,800 10,852 4,950 3,241 1,70915 27,483 13,484 14,000 20,918 9,495 11,424 6,565 3,989 2,57616 23,765 12,407 11,358 14,182 6,580 7,601 9,583 5,826 3,757
Rural
17 24,999 12,582 12,417 12,621 5,513 7,109 12,377 7,069 5,308

Table 23: 5-17 children by main reason not attending school Total Age group:
5-9 10-14 15-17 Total Male Female
Total Male Female Total Male Female Total Male Female
Under-aged 110,075 57,228 52,847 109,822 57,053 52,769 99 57 42 153 117 36School too far 2,768 1,648 1,120 912 561 351 751 427 324 1,105 660 445Cost of school materials, clothing etc 8,289 4,700 3,588 1,120 629 491 3,291 1,940 1,351 3,877 2,131 1,746Poor performance in studies/not interested in studies 11,336 7,364 3,972 645 344 301 3,713 2,508 1,205 6,978 4,512 2,466Add to household income 8,502 5,622 2,881 237 172 65 1,525 1,243 282 6,741 4,207 2,534Help with household duties 15,447 9,802 5,645 973 587 386 3,755 2,495 1,259 10,719 6,720 4,000Sick 5,430 2,621 2,809 838 340 499 2,466 1,287 1,179 2,125 994 1,131Disabled 2,947 1,945 1,002 438 269 169 1,480 1,059 421 1,029 616 412Others 6,352 3,448 2,904 1,314 857 457 1,324 715 609 3,714 1,876 1,838All 171,145 94,377 76,768 116,300 60,812 55,487 18,404 11,731 6,673 36,442 21,834 14,608

Appendix 2 CONCEPTS AND DEFINITIONS
This section brings together the explanations of some important concepts and definitions
used in the Labour Force Survey questionnaire and the field survey instructions. In order to ensure comparability of the data the concepts that were used in the surveys the NSO had conducted recently were adopted to the extent feasible. It was necessary to prepare new definitions in respect of new topics and items. In the preparation of this material international standard concepts and definitions as recommended by the UN with appropriate modifications to suit local conditions were adopted.
Housing Unit A housing unit is a structurally separated and independent place of abode. It may have been constructed, built, converted or arranged for human habitation, such as commercial, industrial, and agricultural buildings, or natural and man-made shelters such as caves, boats, abandoned trucks, culverts and similar structures which are used as living quarters. Household A household is a group of persons (or a single person) who usually live together and have a common arrangement for food, such as using a common kitchen or a common food budget. The persons may be related to each other or may be non-relatives, including servants or other employees, staying with the employer. Students, boarders and employees residing in and having a common food arrangement with the household are considered members of the household if they have been in the household for more than a year or if they have no other place of residence. However, if there are …(decide on the number say 5) or more boarders/lodgers in a housing unit, they should not be reported as members of the household. They are considered to be living in a dormitory or boarding house operated by the household. Boarding houses with more than (number stipulated in the definition say 5) persons are considered to be institutional households. An institutional household is a group of (number stipulated in the definition say 5) or more unrelated persons living together. Other examples are military barracks, prisons, student dormitories, etc. Institutional households are not covered by the LFS 2002.
Head of Household The head of household is the adult member of the household who is accepted and recognised by the other household members as head. Where there are more than one household in a housing unit, each household should have it’s own head of household. Usual Member of Household A usual member of a household is any person who has been normally living in the household and sharing arrangements for food for at least ….months, or one who has no other residence. Thus, most students going to school away from home are considered to be members of their family household, rather than a household at the location of their school, unless they have stayed continuously at the household close to their school for more than …months. However, a person who has moved recently, is considered to be a member of a household at his destination if he does

not plan to return to the old household within 6 months. Similarly, a person who has moved out of a household recently with no intention to return is no longer considered a member of that household. Marital status The marital status of a person refers to the current defacto conjugal status of the person. A person claiming to be married according to custom or repute should also be treated as married, although the marriage has not been registered according to law.
Work Work is defined as an economic activity that a person performs for pay, profit or family gain. It includes paid employment; operating a farm or business; working for a household economic activity (like food processing or raising of livestock) without pay; working as an apprentice in order to learn a skill or craft, without necessarily receiving wages; and production of paddy or vegetables, say, solely for home consumption. Also, included is the holding of a job, even if the person is temporarily absent because of vacation, strike or illness. Production of fixed assets for own use, such as building or repairing the house is also considered as work.
Economically Active Population The economically active population comprises all persons of either sex who furnish the supply of labour for the production of goods and services as defined by the United Nations system of national accounts during a specified time reference period. According to the UN SNA the production of goods and services includes all production and processing of primary products for the market for barter or for own consumption, the production of all other goods and services for the market and in the case of households which produce such goods and services for the market, the corresponding production for own consumption. Usually Active Population The usually active population comprises all persons above a specified age whose main activity status as determined in terms of number of weeks or days during a long specified period such as the preceding 12 months or the preceding calendar year, was employed or unemployed. The usually active population is subdivided as employed and unemployed in accordance with the main activity. Labor Force or Currently Active Population The labour force or currently active population comprises all persons who satisfy the requirements for inclusion among the employed or the unemployed. Employed Employed persons are those who are in the labor force who were reported to be either at work or with a job or business although not at work during the reference week. Persons at work are those who did some work at all, even for an hour, during the reference period (past week). Persons are also considered employed if they are with a job or business even though not at work during the reference period because of temporary illness/injury, vacation or other leave of absence, bad weather, strike/labor dispute or other reason. Unemployed Unemployed persons are persons in the labor force who did not work or had no job or business during the reference week but were reported available and actively looking for work. Also, considered as unemployed are persons without job or business who were reported as available for
130

work but were not looking for work because of their belief that no work was available or because of temporary illness/disability, bad weather, pending job application or waiting for job interview. Population not economically active The population not economically active comprise all persons, irrespective of age, including those below the age specified for measuring the economically active population who were not economically active The Population not usually active The population not usually active comprises all persons whose main activity status during the long reference period was neither employed nor unemployed. It comprises the functional categories of (a) students; (b) homemakers; (c) income recipients (pensioners; rentiers etc. (d) others ( recipients of public assistance etc.)
The Population not currently active The population not currently active or persons not in the labour force, comprises all persons who were not employed or unemployed during the brief reference period and hence not currently active because (a) attendance at educational institutions (b). engagement in household duties, (c) retirement or old age, (d) other reasons such as infirmity or disablement etc. Occupation Occupation refers to the type of work, trade or profession performed by the individual during the reference period. If the person is not at work but with a job, occupation refers to the kind of work that the person will be doing when he reports for work.
Primary Occupation If any member had more than one economic activity – wage employment or self-employment – during the reference period (say, past week or past 12 months), then the primary occupation was one which the respondent accepts as such based on the time spent and /or income earned from different activities and other considerations like social and legal status. If the person was engaged in only one occupation, then that was his/her primary occupation.
Secondary Occupation If any member had more than one economic activity – wage employment or self-employment – during the reference period (say, past week or past 12 months), then the secondary occupation was one which the respondent accepts as the most important based on time spent on and income earned from different activities and other considerations like social and legal status among all occupations of the person excluding the primary occupation. Industry or Kind of Economic Activity Industry or kind of economic activity refers to the nature of work done (the goods and services produced) by the institution or the workplace or enterprise where the person works. Underemployment Underemployment exists when a person’s employment is inadequate in relation to specified norms or alternative employment; account being taken of the persons occupational skill training and work experience. Persons visibly underemployed comprise all persons in paid or self-employment, whether at work or not at work, involuntarily working less than the normal duration of work determined for the activity, who were seeking or available for additional work during the reference period
131

Employer A person who operates an enterprise or a person who operates an enterprise in partnership with others, or engages independently in a profession or trade, with the aid of one or more employees is considered as an employer. Employee An employee is a person who works for a public or private employer and receives remuneration in wages, salary, commission, tips, piece rates or payment in kind. Own account worker A person who operates an enterprise or a person who operates an enterprise in partnership with others, without the aid of an employee is considered as an own account worker. However the person may get the assistance of unpaid family workers. Unpaid family worker A person who works in an enterprise operated by a member of his household or by a group of persons including at least one member of his household, without a payment in cash or in kind. Reference Period In this survey there are two (2) reference periods “current” and “usual”. The current reference period is the week preceding the week of the survey, i.e. last week. The “usual” reference period is the preceding 12 months, i.e. the last 12 months. Literacy Literacy is the ability to read and write a simple message. A person is considered literate if he or she can both read and write a simple message in any language or dialect. A person capable of reading only his own name or numbers, or can read but not writes and vice versa, is not considered literate. Schooling The term schooling includes attendance at a kindergarten, primary, lower or upper secondary school, technical or professional school, college or university.
Student A person engaged in studies as the person’s main activity is considered as a student. The person may be attending school or some other educational institution or may be studying as a private student. Wages Wages include remuneration received as cash wages, tips, commissions, piece rate earnings, overtime payments, and imputed value of benefits in kind, such as meals or accommodation provided by the employer. Informal sector Only employment in non-agricultural economic activities and non-agricultural enterprises, of those who were self employed, or in private enterprises and partnerships that had no paid employees or 1-4 employees were treated as employment that fell within the scope of the definition of the informal sector. It was decided to include private enterprise, partnerships and self-employed categories and exclude the other sub-divisions in the determination of the coverage
132

of the informal sector. The units that had no regular employees and those with 1-4 employees were accepted as falling within the informal sector and those that had 5 or more employees were treated as coming within the formal sector.
133
Appendix 3
SAMPLING DESIGN AND ESTIMATION
A household is a group of persons (or a single person) who usually live together and have a common arrangement for food, such as using a common kitchen or a common food budget. The persons may be related to each other or may be non-relatives, including servants or other employees, staying with the employer. Sampling Design
The preparation of separate estimates for the different geographic sub-divisions of the country was an important consideration in determining the sampling design. The gains in efficiency through stratification based on economic and geographic criteria would result in lowering sampling errors when the number of strata were increased. In order to produce separate estimates for urban and rural sectors, they were treated as two domains. The capital city of Ulaanbaatar, which carried almost one third of the country’s population, was accepted as a separate stratum. The Central, East, West and Khangai Regions of the country were treated as separate domains. The sub-division of these regions in terms of their urban - rural stratifications resulted in 8 strata.
A two-stage probability sample design with enumeration areas as primary sampling units (PSU)’s and households as the secondary sampling units (SSU’s) was adopted. Apart from these major innovations, circular systematic sampling with probability proportional to size (CSSPPS) techniques were adopted in the selection of enumeration areas which were the primary sampling units (PSU's) and households which formed the secondary sampling units (SSU's). The sampling strategy adopted is described in the paragraphs that follow.
Sampling Frame The sampling frame from the Census of Population 2000 was used as the sampling frame.
There had been no major changes in the boundaries of geographic sub-divisions of Mongolia accept for a re-grouping of aimags (provinces) to create the Hangai region suppressing the Southern region. There were enumeration areas without any households, with mainly male population figures recorded against them, which were demarcated with institutional living quarters. These were checked and were deleted from the frame. In the Census 2000 sampling frame, the basic unit of enumeration was the enumeration area, with identifiers and measure of size in households and population totals and breakdowns by males and females. The census enumeration areas were chosen as primary sampling units (PSU) in both the urban and rural areas. Sample Size Determination
The inclusion of such topics as unemployment, child labor demonstrated that the sample size should be adequate to produce statistically reliable estimates for the main stratifications. Although several household surveys have been conducted during the past decade, it does not appear that the survey dimensions have been determined on the basis of desired precision of the estimates. The unemployment rates disclosed in the census 2000 and from other surveys conducted recently were used in deriving the coefficient of variation in the unemployment estimate. These levels of precision with assumed values of DEFF was used in ascertaining the sample size that will be required to produce the desired level of precision.
134

Survey Taking Capacity The discussions with the NSO officials reflected that the main consideration in deciding
on the sample size is funding rather than other considerations including staff capacity. Thee previous experience of undertaking sample surveys during the 5-7 years indicated that the NSO had been able to successfully carry out the implementation of several surveys. Further the Census of Population 2000 had been undertaken while some household surveys and regular data collection and compilation through the administrative network had been on-going. The availability of statistical staff of the aimags for field operations and the decentralized arrangements used in data processing have made it possible to extend the survey taking capacity much beyond what would have been feasible if the NSO was dependent on its own cadre for the entirety of survey operations. Sample Selection First Stage Selection In the first stage the EA’s or primary sampling units ( PSU’s ) were drawn from each stratum. The frame was arranged so that all the enumeration areas within a stratum were listed in the order of aimag, soum, and komiss, with their identification codes and the number of households in the EA. The number of households in the enumeration area Mhi was used as the measure of size (MOS) in the probability proportional to size method of selection of first stage units. The method of circular systematic sampling with probability of inclusion of an enumeration area proportional to its size (CSSPPS) method was used to select the sample of wards from each stratum. The procedure adopted is described below.
The selection probability for enumeration area i in stratum h is given by the formula, ph
( i ) = ah Mhi / Mh ( Eq. 1) where
ah = number of EA’s or PSU’s to be drawn from the stratum Mhi = number of households in the ith EA as reported in the frame
Mh = ∑Μhi = total number of households in the stratum as recorded in the frame
The selection of PSU’s was performed by arranging the EA’s in the h th stratum according to aimag, soum, and komiss and the estimated number of households was used as the measure of size Mhi. The values of Mhi were then cumulated and Cu Mhi was recorded against each PSU. The sampling interval Ih1 was computed which is given by Ih1 = Mh / ah rounded of to the nearest integer.
A random number Rh that falls between 0 and Mh was then selected using the random number generator in the Excel programme. The sequence of ah selector numbers were generated by the addition of Ih1 to the previous number selected. If the total exceeds Mh, then Mh was subtracted from the total to derive the number.
Let Rh1 = Rh and for j = 2, 3……. ah, Rhj ,= Rhj-1 + Ih1, if this does not exceed Mh; Rhj ,= Rhj-1 + Ih1 - Mh otherwise.
135

Accordingly, the selector numbers will be of the form
Rh, (Rh + Ih1), (Rh + 2 Ih1), (Rh + 3 Ih1), ( Rh + 4 Ih1), … (Rh + (j-1) Ih1), (Rh + (ah-1) Ih1). when Rhj ,= Rhj-1 + Ih1, does not exceed Mh. The expressions should be replaced with the terms Rhj ,= Rhj-1 + Ih1 - Mh when Rhj exceeds Mh.
Selection of EA’s in the first stage by CSSPPS was done using Excel rogramme. The details of the samples selected for Ulaanbaatar and the urban and rural sub-divisions of the 4 regions are copied to PC’ of the SSD staff members.
Circular Systematic Sample with Equal Probabilities of selection, CSSEQP was used for the selection of households from a selected EA, is a simpler version of CSSPPS.
The list of households in the sample EA prepared at the house listing stage was used as the frame, and a sample reference number was assigned sequentially to each household. The last number assigned should be equal to the total number households in the enumeration area Mhi
∗. Then the probability of selecting a household in the i th PSU in the h th domain is
ph( j / i ) = nh / Mhi
* (Eq. 2) where nh is equal to 10 in this instance. The sampling interval I = Mhi
∗ / 10 was computed and rounded off to the nearest integer. I should be computed after the listing operation when the actual number of households is determined. A random number Rhj in the interval 1 to Mhi
∗ was taken as the first selector number. The remaining 9 selector numbers were calculated one after the other by adding I to the previous number. If the sum exceeded Mhi ∗ the remainder after subtracting Mhi ∗ from the sum was taken as the selector number. These selector numbers were the serial numbers of the selected households. Selection of households from the sampled EA’s can be done in the EA itself by enumerators under the supervision of supervisors.
The design provides for estimators to be computed for the 9 strata, namely Ulaanbaatar,
urban and rural areas sub-divisions of the 4 regions into which Mongolia is divided. These estimates are in respect of the all four quarterly rounds of the survey. However, some estimates will have to be prepared based on the quarterly rounds of the survey. The method to be applied is the same. Most of the estimators that will be computed from the survey will be ratio estimates but frequently estimates of stratum totals are required for use by policy makers and administrators. The estimation procedure for these estimators are set out in the paragraphs that follow.
Design Weights
The design weights are used to compensate for differences in the selection probabilities. The weight for the PSU is inversely proportional to its selection probability.
The probability of selection of j th household in normal size PSU’s and blocks in the h th domain is ph
( i ) x ph( j / i ) = ph
( ij ) ( Eq. 3 )
where ph( i ) = ah Mhi / Mh
and ph
( j / i ) = nh / Mhi*
136

Thus the design weights whij for households are whij = 1 / ph
( ij ) Mh x Mhi
*
= ⎯⎯⎯⎯⎯⎯ ( Eq. 4 ) ah x Mhi x nh
The design for LFS is not self-weighting and therefore it is necessary to compute weight for each PSU selected in the sample and these weights have to be used in the estimation procedure.
Estimation Procedure for Household Information The estimate of the stratum total of a characteristic y is given by the following formula. ∧ Yh = ∑ ∑ whij yhij for i = 1, 2, 3,…….…. ah ( Eq. 5 ) i j j = 1, 2, 3,……… nhi where ∧ Yh = estimate of characteristic y for stratum h yhij = any characteristic of person k in household j in sample enumeration area i in stratum h nhi = number of sample households in enumeration area i ah = number of sample enumeration areas in stratum h whij = 1 / fh fh = 1 / whij
∧ The estimate for the total for all 9 strata Y was computed as the sum of the estimates for each domain viz. ∧ ∧ Y = ∑ Yh h = 1, 2, 3, ….9. ( Eq. 6 ) Most of the estimators to be computed from the LFS are in the form of averages and proportions. In general these estimators are combined ratio estimators which take the form set out below. The estimated stratum mean is a ratio and it is given by ∧ ∑ ∑ whij yhij Yh i j
rh = ⎯⎯ = ⎯⎯⎯⎯⎯⎯⎯ ( Eq. 7 ) ∧ ∑ ∑ whij xhij Xh i j
137

where yhij, ah, nhi, wwhij are as defined earlier. xhij = 1 for j = 1, 2, 3,………..nhi i = 1, 2, 3,………..ah The population mean is also a ratio, say r, which was estimated using the following formula. ∑ ∑ ∑ whij yhij h i j r = ⎯⎯⎯⎯⎯⎯ ( Eq. 8 ) ∑ ∑ ∑ whij xhij h i j where yhij , ah , nhi , whij are as defined in Eq. 7 Xhij is as defned in Eq. 7 Estimation of Variances and Standard Errors
The computation procedure will be incomplete without establishing the procedure for
assessing the precision or reliability of the survey estimates. The variances of the ratio estimates will be of the form var (r) = 1 / ∑ ( 1- fh) (ah / ah - 1) ∑ ( zhi
2 - zh 2 / ah ) ( Eq. 9 )
X2 where r = y / x yhi = ∑whij yhij j
xhi = ∑ w x ∑ whij x hij hij hij = j j r = ∑∑∑whij yhij / ∑∑∑ whij xhij ∧ x2 = X2 = ( ∑∑∑ whij xhij )2
h i j zhi = yhi - r xhi ah = number of sample enumeration areas from stratum h whij = weight for each individual in the sample household Variance of Ratio of rh in Stratum h The variance of ratio estimate rh in stratum h is of the form:
138

var (rh ) = (1 / xh2 )(1- fh) (ah / ah - 1) ∑ ( zhi
2 - zh 2 / ah) ( Eq.10 )
where ∧ X = x = ∑∑ whij xhijh h i j and fh , ah, and zhi are as defined earlier.
Standard Error and Coefficient of Variation
The standard error of a survey estimate provides a measure of how far the survey estimate is likely to vary from the true population value (i.e. parameter ) as a result of having collected the data on a sample basis rather through a complete census. The standard error se(r) of a survey estimate is by definition se( r ) = var( r )1/2
The relative standard error or coefficient of variation ( cv ), on the other hand provides a measure of the relative variance of a survey estimate; that is the magnitude of the estimated sampling error relative to the magnitude of the estimate itself. The cv that is expressed as a proportional error enables the data user to compare the relative reliability or precision with which different types of survey characteristics have been measured eg. Means versus proportions, where direct comparisons of standard errors are uninformative since the magnitude of the standard error is dependent upon the magnitude of the estimate. Computationally, the coefficient of variation is calculated as cv ( r ) = se ( r ) / r. Since only a sample of enumeration areas were included in the LFS the estimates prepared from the survey are subject to sampling errors. The sampling error indicates the extent to which an estimate from the LFS would vary by chance because only a sample of EA’s is included rather than all the EA’s into which the country is divided. The sample size and survey design determine the magnitude of sampling errors and in respect of some items the sampling errors are expected to be high and the users are cautioned to note this fact in using the data.
139
LIST OF PARTICIPANTS OF THE SURVEY
Consultant R.Korale ADB Consultant of Labour Force Survey Coordinator
B.Munkhjargal National Project Coordinator of TA 3684: Improving Social Statistics
Advisor R.Oidovdanzan Honoured Economist and Leading Statistician of Mongolia
Steering Committee P.Byambatseren Chairman of Steering Committee and Chairman of the
NSO B.Davaakhuu Secretary of Steering Committee and Seniour
Statistician of Population and Social Statistics Department, NSO
Members : N.Sodnomdorj Parliament Member N.Gerelsuren Parliament Member D.Oyunchimeg Deputy Director of Population and Social Statistics
Department, NSO Barry Hitchcock ADB Resident Mission N.Mongolmaa National Manager of ILO/IPEC in Mongolia N.Ayush Director of Labour Department of Ministry of Social Welfare
and Labour B.Ganbold Director of General Policy and Planning Department
of Ministry of Finance and Economy D.Narmandakh Vice President of Mongolian Trade Unions Kh.Ganbaatar Executive Director of National Employers’ Federation
Labour Force Working Group
D.Oyunchimeg Head of Working Group and Deputy Director of Population and Social Statistics Department, NSO
B.Davaakhuu Secretary of Working Group and Seniour Statistician of Population and Social Statistics Department, NSO
Members: N.Doljinsuren Statistician. Population and Social Statistics Department,
NSO Ts.Garid Statistician. Population and Social Statistics Department,
NSO D.Nasandelger Statistician. Population and Social Statistics Department,
NSO Z.Nansalmaa Seniour Officer of Data Processing and Software
Development Department, NSO M.Luvsan Officer of Data Processing and Software Development
Department, NSO M.Oyunjargal Statistician of Macroeconomic and Business Statistics
Department, NSO
140

B.Lhagvajargal Statistician of Macroeconomic and Business Statistics Department, NSO
Editorial Group P.Byambatseren Editor-in Chief, Chairman of the NSO
Ch.Dagvadorj Editor, PhD in Economics
Field staff
Supervisors and data entry persons: Ts.Samdan Kh.Ris D.Polooj D.Tuvshin Ts.Nerzedgaram B.Tserendorj D.Dashdavaa J.Narmandakh D.Baljaa Ts.Doljin E.Oyunmaam O.Tserendulam Ch.Enkhtuya D.Ayush J.Erdenesuren N.Batbuureg D.Baasandorj G.Tserennadmid D.Urnaa Ch.Bayanchimeg D.Dashjav B.Tuul Ts.Narantsatsralt D.Ira B.Batbayar
Interviewers: B.Chuluuntsetseg Ts.Otgontsetseg Sh.Manzelkhan Kh.Aiguli B.Sainkhuu G.Turtogtokh G.Erdene S.Rentsendorj L.Ariuntuya D.Mukhtuya N.Oyunchimeg U.Zolzaya B.Byambakhand G.Bayasgalan D.Oyungerel D.Purevdorj B.Delger Ts.Enkhbaatar Ts.Byambaabaatar G.Byambaa B.Sumiya Ch.Tsend-Ayush D.Myagmarsuren S.Enkhbaatar D.Baatar L.Tsogtsaikhan P.Sarantuya L.Ariunaa Z.Munkhjargal D.Munkhzul N.Davaakhuu I.Maakhuu J.Tumurbaatar D.Erdenebileg N.Sumzmaa Sh.Enkhtegsh N.Oyun-Undrakh B.Badamdorj N.Baigalmaa Ch.Munkhtuul E.Tumendemberel Ch.Odbayar M.Munkhtsetseg E.Buyan-Ulzii Ts.Khishigt D.Gansukh D.Jargalmaa A.Gantsetseg D.Batdelger
141