main street bank cra pe - mass.gov
TRANSCRIPT

PUBLIC DISCLOSURE
May 6, 2019
COMMUNITY REINVESTMENT ACT
PERFORMANCE EVALUATION
Main Street Bank
Certificate Number: 90235
81 Granger Boulevard
Marlborough, Massachusetts 01752
Division of Banks Federal Deposit Insurance Corporation
1000 Washington Street, 10th Floor 350 Fifth Avenue, Suite 1200
Boston, Massachusetts 02118 New York, New York 10118
This document is an evaluation of this institution’s record of meeting the credit needs of its entire
community, including low- and moderate-income neighborhoods, consistent with safe and sound
operation of the institution. This evaluation is not, nor should it be construed as, an assessment
of the financial condition of this institution. The rating assigned to this institution does not
represent an analysis, conclusion, or opinion of the Division of Banks or the Federal Deposit
Insurance Corporation concerning the safety and soundness of this financial institution.

TABLE OF CONTENTS
Institution Rating .............................................................................................................................1
Scope of Evaluation .........................................................................................................................2
Description of Institution .................................................................................................................3
Description of Assessment Area ......................................................................................................5
Conclusions on Performance Criteria ..............................................................................................9
Discriminatory or Other Illegal Credit Practices Review ..............................................................18
Appendix: Division of Banks Fair Lending Policies and Procedures...........................................19
Glossary .........................................................................................................................................21

1
INSTITUTION RATING
INSTITUTION’S CRA RATING: This institution is rated Satisfactory. An institution in this
group has a satisfactory record of helping to meet the credit needs of its assessment area,
including low- and moderate-income neighborhoods, in a manner consistent with its resources
and capabilities.
Main Street Bank’s satisfactory Community Reinvestment Act (CRA) performance under the
Lending Test and Community Development Test primarily supports the overall rating.
Examiners did not identify any evidence of discriminatory or other illegal credit practices. The
following points summarize the bank’s Lending Test and Community Development Test
performance.
The Lending Test is rated Satisfactory.
The loan-to-deposit (LTD) ratio is reasonable given the institution’s size, financial
condition, and assessment area credit needs.
The bank made a majority of its home mortgage and small business loans in the
assessment area.
The geographic distribution of loans reflects reasonable dispersion throughout the
assessment area.
The distribution of borrowers reflects reasonable penetration of loans among individuals
of different income levels and businesses of different sizes.
The institution did not receive any CRA-related complaints since the previous evaluation;
therefore, this factor did not affect the Lending Test rating.
The Community Development Test is rated Satisfactory.
The institution demonstrated adequate responsiveness to the community development
needs of its assessment area through community development loans, qualified
investments, and community development services, as appropriate. Examiners
considered the institution’s capacity and the need and availability of such opportunities
for community development in the assessment area.

2
SCOPE OF EVALUATION
General Information
This evaluation covers the period from the prior evaluation dated June 6, 2016, to the current
evaluation dated May 6, 2019. Examiners used the Interagency Intermediate Small Institution
(ISI) Examination Procedures to evaluate Main Street Bank’s (Main Street) performance. These
procedures include two tests: the CRA Small Bank Lending Test and the Community
Development Test.
The evaluation references demographic and economic information from the 2015 American
Community Survey (ACS), D&B, Moody’s Analytics Regional Workstation (Moody’s), and the
U.S. Bureau of Labor Statistics (BLS). Bank financial data reflects the March 31, 2019,
Consolidated Reports of Condition and Income (Call Report).
The Lending Test considered the institution’s performance according to the following criteria.
Loan-to-deposit ratio
Assessment area concentration
Geographic distribution
Borrower profile
Response to CRA-related complaints
The Community Development Test considered the following factors.
Number and dollar amount of community development loans, qualified investments, and
community development services
The responsiveness of such activities to the community development needs of the
assessment area
Banks must achieve at least a Satisfactory rating under each test to receive an overall
Satisfactory rating. This evaluation does not include any lending activity performed by affiliates.
Loan Products Reviewed
Examiners determined that the bank’s major product lines are home mortgage and commercial
loans representing 51.3 percent and 38.8 percent, respectively as of March 31, 2019. This
conclusion considered the bank’s business strategy and the number and dollar volume of loans
originated during the evaluation period. Examiners did not consider other product lines, such as
small farm and consumer loans, due to the low volume and the small portion of the loan portfolio
represented by these loan types. Since small farm and consumer lending provide no material
support for conclusions or ratings, this evaluation does not address these loan types.
This evaluation considered all originated home mortgage loans reported on the bank’s 2017 and
2018 Home Mortgage Disclosure Act (HMDA) Loan Application Registers (LARs). The LARs
contain data about home purchase and home improvement loans, refinances of one-to four-
family, and multi-family properties. In 2017, Main Street reported 329 loans totaling $63.6
million. In 2018, the bank reported 253 loans totaling approximately $96.1 million. Examiners

3
compared the bank’s 2017 home mortgage lending performance against the aggregate.
Additionally, examiners compared the bank’s 2017 and 2018 performance to 2015 ACS data.
The decline in originations from 2017 to 2018 is due to recent HMDA changes. With the
changes, the bank’s unsecured Mass Save Heat Loan, a home improvement loan, is no longer
HMDA-reportable.
To evaluate commercial lending, examiners reviewed all small business loans originated in 2017
and 2018. A small business loan has an original loan amount of $1 million or less and is secured
by non-farm non-residential properties or is classified as a commercial and industrial loan. As an
ISI, the bank is not required to report small business loan data and elected not to do so.
However, the bank collects small business lending data for its own purposes. Examiners
validated and analyzed the 2017 and 2018 small business loan data provided. In 2017, the bank
originated 82 small business loans totaling approximately $5.4 million. In 2018, the bank
originated 80 small business loans totaling approximately $9.2 million. Since the bank is not a
small business data reporter, examiners did not use small business aggregate data for
comparison. Instead, examiners used D&B data as a standard of comparison for the bank’s 2017
and 2018 small business loans.
For the Lending Test, examiners reviewed the number and dollar volume of home mortgage and
small business loans. Although this evaluation presents the number and dollar volume of loans,
examiners emphasized performance by number of loans, as the number of loans is a better
indicator of the number of individuals and businesses served. Additionally, the bank originated
significantly more home mortgage loans by both number and dollar volume than small business
loans during the evaluation period. Therefore, home mortgage lending contributed more weight
in assigning the overall Lending Test rating. Further, the Geographic Distribution and Borrower
Profile criteria only analyze loans extended within the bank’s assessment area.
For the Community Development Test, management provided data on community development
loans, qualified investments, and community development services since the prior CRA
evaluation dated June 6, 2016.
DESCRIPTION OF INSTITUTION
Background
Main Street is a state-chartered mutual savings bank that is wholly owned by Marlborough
Bancshares, Inc., a one-bank holding company located in Marlborough, Massachusetts.
Marlborough Bancshares is owned by Marlborough Bancshares Mutual Holding Company, the
top-tier bank holding company. The bank wholly owns three subsidiaries that invest in securities
(MSB Securities Corporation, 1885 Securities Corporation, and Rail Town Security Corporation)
and Marbro-Hudston, Inc., which was formed to hold real estate.
On April 1, 2017, Marlborough Savings Bank acquired and merged with North Middlesex
Savings Bank (NMSB) and became Main Street Bank.

4
The institution received a “Satisfactory” rating from the FDIC and the Massachusetts Division of
Banks during its prior joint evaluation dated June 6, 2016, using ISI procedures.
Operations
Main Street operates 13 full-service locations including its main office in Marlborough. The
bank has nine branches in Middlesex County and four in Worcester County. Since the prior
evaluation, Main Street acquired seven branches through the NMSB merger. The following
notes the seven acquired branch locations by county, municipality, and census tract income level.
Worcester County
Devens, located in an upper-income census tract
Lunenberg, located in an upper-income census tract
Middlesex County
Groton, located in an upper-income census tract
Littleton, located in an upper-income census tract
Ayer, located in a middle-income census tract
Pepperell, located in a moderate-income census tract
Shirley, located in a moderate-income census tract
In addition, Main Street also opened one branch in Hudson, in a middle-income census tract in
Middlesex County, on June 6, 2016. Main Street closed the acquired Devens branch on May 18,
2018.
Main Street offers various financial products and services to consumers and business customers.
The bank offers loan products including home mortgage, commercial, and consumer loans, with
a primary focus on residential lending. The bank also provides various deposit products
including checking, savings, money market deposit accounts, and certificates of deposit.
Alternative banking services include online and mobile banking, electronic bill pay, mobile
deposits, telephone banking, and bank-owned automated teller machines at each branch. In
addition, consumers can open deposit accounts and apply for loans online.
For commercial customers, the bank offers commercial real estate loans, lines of credit, term
loans, collateral loans, letters of credit, overdraft protection, and Small Business Administration
(SBA) loans.
Ability and Capacity
Assets totaled approximately $1.0 billion as of March 31, 2019, and included total loans of
$799.0 million. Total assets increased by 93.3 percent since the previous evaluation, primarily
due to the NMSB merger. The following table illustrates Main Street’s loan portfolio
distribution as of March 31, 2019.
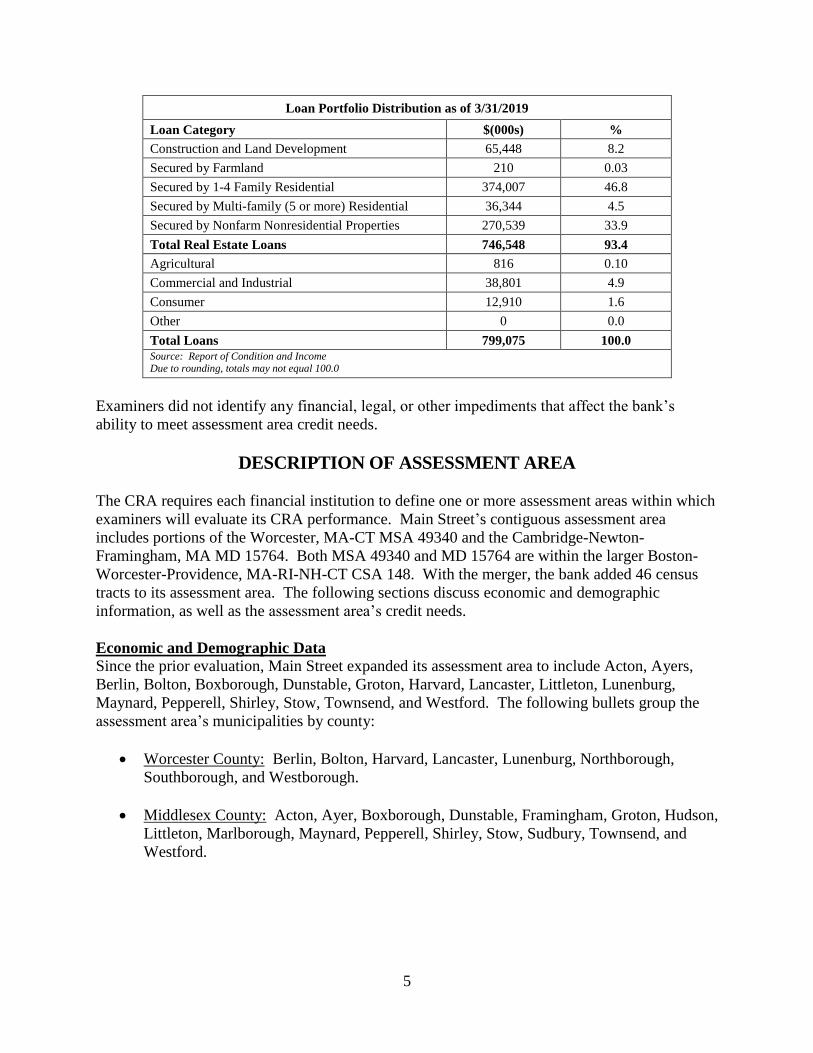
5
Loan Portfolio Distribution as of 3/31/2019
Loan Category $(000s) %
Construction and Land Development 65,448 8.2
Secured by Farmland 210 0.03
Secured by 1-4 Family Residential 374,007 46.8
Secured by Multi-family (5 or more) Residential 36,344 4.5
Secured by Nonfarm Nonresidential Properties 270,539 33.9
Total Real Estate Loans 746,548 93.4
Agricultural 816 0.10
Commercial and Industrial 38,801 4.9
Consumer 12,910 1.6
Other 0 0.0
Total Loans 799,075 100.0
Source: Report of Condition and Income Due to rounding, totals may not equal 100.0
Examiners did not identify any financial, legal, or other impediments that affect the bank’s
ability to meet assessment area credit needs.
DESCRIPTION OF ASSESSMENT AREA
The CRA requires each financial institution to define one or more assessment areas within which
examiners will evaluate its CRA performance. Main Street’s contiguous assessment area
includes portions of the Worcester, MA-CT MSA 49340 and the Cambridge-Newton-
Framingham, MA MD 15764. Both MSA 49340 and MD 15764 are within the larger Boston-
Worcester-Providence, MA-RI-NH-CT CSA 148. With the merger, the bank added 46 census
tracts to its assessment area. The following sections discuss economic and demographic
information, as well as the assessment area’s credit needs.
Economic and Demographic Data
Since the prior evaluation, Main Street expanded its assessment area to include Acton, Ayers,
Berlin, Bolton, Boxborough, Dunstable, Groton, Harvard, Lancaster, Littleton, Lunenburg,
Maynard, Pepperell, Shirley, Stow, Townsend, and Westford. The following bullets group the
assessment area’s municipalities by county:
Worcester County: Berlin, Bolton, Harvard, Lancaster, Lunenburg, Northborough,
Southborough, and Westborough.
Middlesex County: Acton, Ayer, Boxborough, Dunstable, Framingham, Groton, Hudson,
Littleton, Marlborough, Maynard, Pepperell, Shirley, Stow, Sudbury, Townsend, and
Westford.

6
The assessment area’s 68 census tracts reflect the following income designations according to
the 2015 ACS data:
2 low-income tracts,
9 moderate-income tracts,
23 middle-income tracts,
33 upper-income tracts, and
1 tract with no income designation.
The two low-income census tracts are in Framingham. The nine moderate-income census tracts
are in Middlesex County: Framingham (five), Marlborough (two), Pepperell (one), and Shirley
(one). The one census tract with no income designation is the United States Army Natick
Soldier Systems Center. The assessment area does not contain any designated distressed or
underserved middle-income census tracts.
The following table illustrates select demographic characteristics of the assessment area.
Demographic Information of the Assessment Area
Demographic Characteristics # Low
% of #
Moderate
% of #
Middle
% of #
Upper
% of #
NA*
% of #
Geographies (Census Tracts) 68 2.9 13.2 33.8 48.5 1.5
Population by Geography 353,882 2.5 14.6 35.1 47.8 0.0
Housing Units by Geography 136,515 2.4 15.3 37.2 45.1 0.0
Owner-Occupied Units by Geography 93,649 0.5 10.3 36.6 52.6 0.0
Occupied Rental Units by Geography 36,583 7.5 27.7 38.0 26.9 0.0
Vacant Units by Geography 6,283 1.0 18.6 40.5 39.8 0.0
Businesses by Geography 28,957 1.7 15.9 30.1 52.4 0.0
Farms by Geography 897 1.4 11.1 28.9 58.5 0.0
Family Distribution by Income Level 92,080 17.0 14.7 19.1 49.2 0.0
Median Family Income MSA - 15764
Cambridge-Newton-Framingham, MA MD
$100,380 Median Housing Value $378,174
Median Family Income MSA - 49340
Worcester, MA-CT MSA
$81,137 Median Gross Rent $1,145
Families Below Poverty Level 4.6%
Source: 2015 ACS Census and 2018 D&B Data Due to rounding, totals may not equal 100.0 (*) The NA category consists of geographies that have not been assigned an income classification.
According to 2018 D&B data, there were 28,957 non-farm businesses in the assessment area.
Service industries represent the largest portion of businesses at 46.1 percent, followed by retail
trade (11.1 percent); non-classifiable establishments (10.2 percent); construction (9.1 percent);
and finance, insurance, and real estate (8.0 percent). According to data obtained from Moody’s
as of January 2019, the top employers in the Worcester, MA-CT MSA included University of
Massachusetts (UMass) Memorial Health Care, UMass Medical School, Reliant Medical Group,

7
and Saint Vincent Hospital. In the Cambridge-Newton-Framingham, MA MD, the top
employers included Harvard University, Massachusetts Institute of Technology, the TJX Co.
Inc., and DeMoulas Supermarkets, Inc.
The analysis of small business loans under the Borrower Profile criterion compares the
distribution of small business loans to the distribution of businesses by gross annual revenue
(GAR) level. The following are the GARs for the area’s businesses based on 2018 D&B data:
83.3 percent have GARs of $1 million or less.
7.0 percent have GARs more than $1 million.
9.7 percent have unknown revenues.
Further, approximately 78.8 percent of all businesses in the assessment area have GARs less than
$500,000, 68.4 percent of the businesses employ four or fewer employees, and 88.7 percent of
the businesses operate from a single location. These factors indicate that the majority of
businesses in the assessment area are small.
Examiners used the FFIEC-updated median family income level to analyze home mortgage loans
under the Borrower Profile criterion. The following table presents the low-, moderate-, middle-,
and upper-income categories. These categories are based on the 2017 and 2018 FFIEC-updated
median family income for each MSA and MD.
Median Family Income Ranges
Median Family Incomes Low
<50%
Moderate
50% to <80%
Middle
80% to <120%
Upper
≥120%
Cambridge-Newton-Framingham, MA MD Median Family Income (15764)
2017 ($104,800) <$52,400 $52,400 to <$83,840 $83,840 to <$125,760 ≥$125,760
2018 ($110,300) <$55,150 $55,150 to <$88,240 $88,240 to <$132,360 ≥$132,360
Worcester, MA-CT MSA Median Family Income (49340)
2017 ($84,000) <$42,000 $42,000 to <$67,200 $67,200 to <$100,800 ≥$100,800
2018 ($86,900) <$43,450 $43,450 to <$69,520 $69,520 to <$104,280 ≥$104,280
Source: FFIEC
BLS data indicated that the 2018 year-end unemployment rate was 4.1 percent in Worcester
County and 3.1 percent in Middlesex County. The Massachusetts unemployment rate was 3.3
percent as of year-end 2018.
Competition
The assessment area is competitive for financial services. According to FDIC Deposit Market
Share data as of June 30, 2018, 28 financial institutions operated 107 full-service branches within
the assessment area. Of these institutions, Main Street ranked 6th with a deposit market share of
7.9 percent.
There is a high level of competition for home mortgage loans among banks, credit unions, and
non-depository lenders in the area. In 2017, 400 lenders reported 11,463 originated or purchased

8
residential mortgage loans. Main Street ranked 14th out of this group with a 1.6 percent market
share. The majority of lenders ranked ahead of Main Street were large national banks, non-
depository lenders, and credit unions.
Main Street is not required to collect or report its small business loan data, and elected not to do
so. Therefore, the analysis of small business loans under the Lending Test does not include
comparisons against aggregate data. However, the aggregate data reflects the level of demand
for small business loans. The 2017 aggregate data shows that 153 institutions reported 54,435
small business loans in the counties of the assessment area, indicating a high degree of
competition for this product.
Community Contact
As part of the evaluation process, examiners contact third parties active in the assessment area to
help assess credit and community development needs. The information obtained helps
examiners determine whether local financial institutions are responsive to these needs and what
credit and community development opportunities, if any, are available.
Examiners contacted a local organization that promotes economic development within the
assessment area. The community contact stated that the area needs new commercial and
residential zoning in the areas once occupied by manufacturing businesses. Consequently, there
are fewer opportunities for new commercial and housing development projects. The contact also
saw a need for flexibility in small business lending. Current conventional guidelines pose a
challenge for small- and medium-size businesses, in particular those seeking loans larger than the
micro-loan programs allow. In addition, the community contact noted that banks support local
micro-lending initiatives and charitable work.
Examiners also relied upon a recent contact with a representative of a non-profit affordable
housing and neighborhood revitalization organization active in the bank’s assessment area. The
organization serves low- and moderate-income individuals and families in Worcester County by
developing affordable housing, providing flexible financing, and offering affordable rental units.
The contact stated that Worcester County’s economic condition overall has steadily improved.
The contact also noted that local government funding has slowed in recent years, which has
substantially curbed the development of affordable housing. Additionally, the contact cited a
need for home improvement loans that would help contribute to the availability and quality of
affordable housing units.
Credit and Community Development Needs and Opportunities
Considering information from the community contacts, bank management, and demographic and
economic data, examiners determined that affordable housing and small business assistance are
the primary community development needs. As shown in the demographic table, housing costs
are high as the median housing value is $378,174 and based on 2018 D&B data, 78.8 percent of
all area businesses are small.
9
CONCLUSIONS ON PERFORMANCE CRITERIA
LENDING TEST
Main Street demonstrated reasonable performance under the Lending Test. The bank’s
performance under the LTD ratio, Assessment Area Concentration, and Geographic Distribution
criteria primarily supports this conclusion.
Loan-to-Deposit Ratio
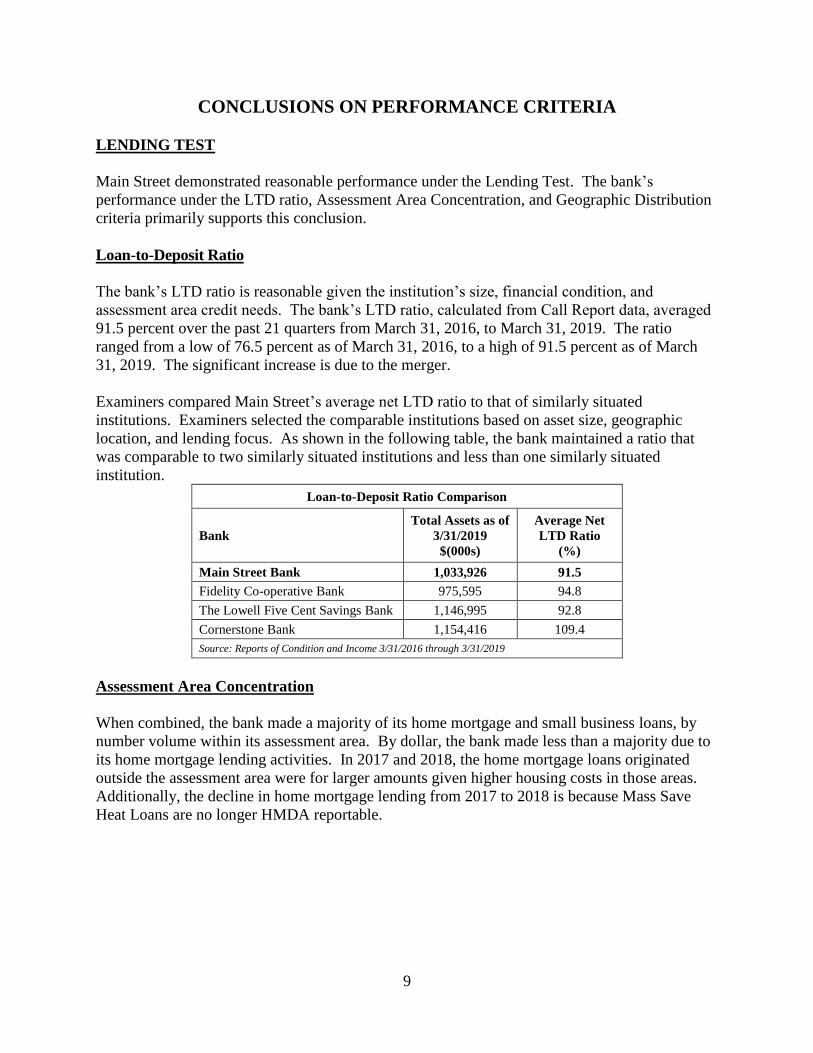
The bank’s LTD ratio is reasonable given the institution’s size, financial condition, and
assessment area credit needs. The bank’s LTD ratio, calculated from Call Report data, averaged
91.5 percent over the past 21 quarters from March 31, 2016, to March 31, 2019. The ratio
ranged from a low of 76.5 percent as of March 31, 2016, to a high of 91.5 percent as of March
31, 2019. The significant increase is due to the merger.
Examiners compared Main Street’s average net LTD ratio to that of similarly situated
institutions. Examiners selected the comparable institutions based on asset size, geographic
location, and lending focus. As shown in the following table, the bank maintained a ratio that
was comparable to two similarly situated institutions and less than one similarly situated
institution.
Loan-to-Deposit Ratio Comparison
Bank
Total Assets as of
3/31/2019
$(000s)
Average Net
LTD Ratio
(%)
Main Street Bank 1,033,926 91.5
Fidelity Co-operative Bank 975,595 94.8
The Lowell Five Cent Savings Bank 1,146,995 92.8
Cornerstone Bank 1,154,416 109.4
Source: Reports of Condition and Income 3/31/2016 through 3/31/2019
Assessment Area Concentration
When combined, the bank made a majority of its home mortgage and small business loans, by
number volume within its assessment area. By dollar, the bank made less than a majority due to
its home mortgage lending activities. In 2017 and 2018, the home mortgage loans originated
outside the assessment area were for larger amounts given higher housing costs in those areas.
Additionally, the decline in home mortgage lending from 2017 to 2018 is because Mass Save
Heat Loans are no longer HMDA reportable.

10
Lending Inside and Outside of the Assessment Area
Number of Loans Dollar Amount of Loans $(000s)
Loan Category Inside Outside Total Inside Outside Total
# % # % # $ % $ % $(000s)
Home Mortgage
2017 183 55.6 146 44.4 329 25,386 39.9 38,202 60.1 63,588
2018 117 46.2 136 53.8 253 37,643 39.1 58,537 60.9 96,180
Subtotal 300 51.5 282 48.5 582 63,029 39.5 96,739 60.5 159,768
Small Business
2017 55 67.1 27 32.9 82 3,711 69.4 1,639 30.6 5,350
2018 57 71.3 23 28.8 80 6,817 74.2 2,372 25.8 9,189
Subtotal 112 69.1 50 30.9 162 10,528 72.4 4,011 27.6 14,539
Total 412 55.4 332 44.6 744 73,557 42.2 100,750 57.8 174,307
Source: HMDA Data 1/1/2017 - 12/31/2018; Bank Small Business Loan Data 1/1/2017 - 12/31/2018
Geographic Distribution
The geographic distribution of loans reflects reasonable dispersion throughout the assessment
area. The bank’s reasonable performance of home mortgage and small business lending supports
this conclusion. Examiners focused on the percentage by number of loans in low- and moderate-
income census tracts.
Home Mortgage Loans The geographic distribution of home mortgage loans reflects reasonable dispersion throughout
the assessment area. Although examiners compared the bank’s lending performance to
aggregate and demographic data, examiners placed more weight on the comparisons to aggregate
data. The aggregate data provides a better indicator of the opportunities and demand in the
assessment area.
In 2017, lending was comparable to aggregate; whereas, in 2018, the bank did not make any
loans in these tracts. As the following table illustrates, there are limited lending opportunities in
the low-income census tracts due to a limited number of owner-occupied housing units and
lending overall during 2018 declined. Lending opportunities are greater in the moderate-income
census tracts. In 2017, lending in the moderate-income tracts exceeded the aggregate and in
2018, lending exceeded demographics.
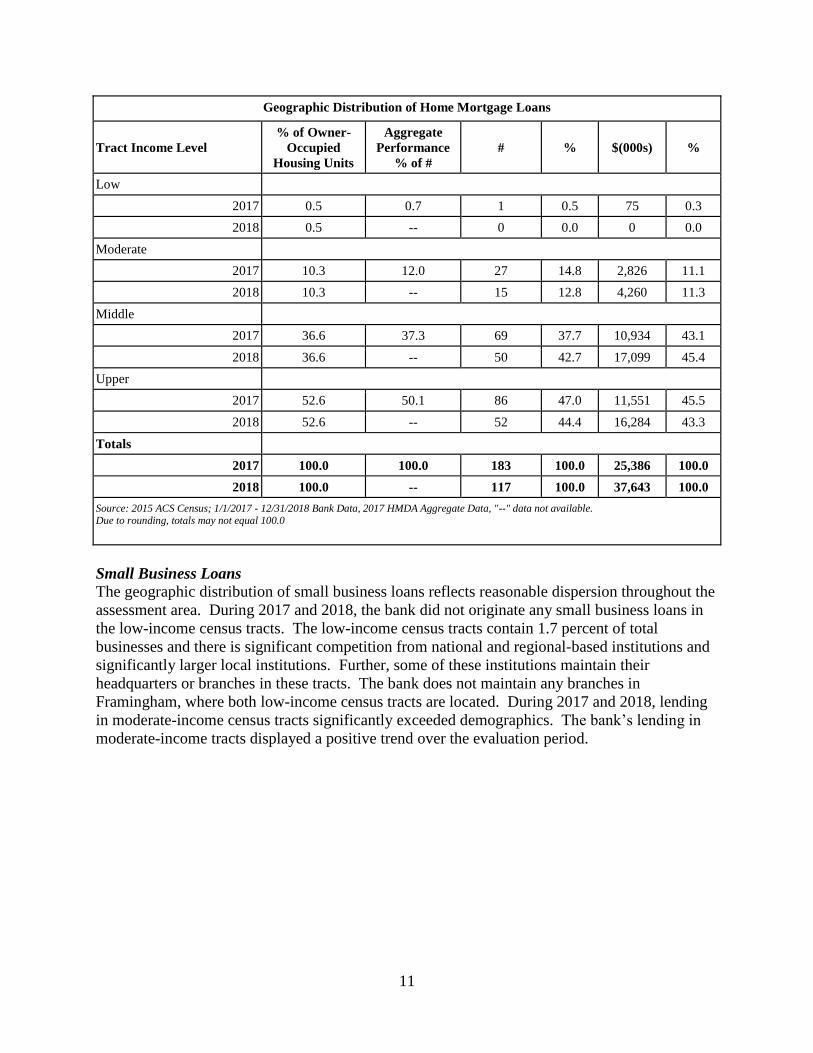
11
Geographic Distribution of Home Mortgage Loans
Tract Income Level
% of Owner-
Occupied
Housing Units
Aggregate
Performance
% of #
# % $(000s) %
Low
2017 0.5 0.7 1 0.5 75 0.3
2018 0.5 -- 0 0.0 0 0.0
Moderate
2017 10.3 12.0 27 14.8 2,826 11.1
2018 10.3 -- 15 12.8 4,260 11.3
Middle
2017 36.6 37.3 69 37.7 10,934 43.1
2018 36.6 -- 50 42.7 17,099 45.4
Upper
2017 52.6 50.1 86 47.0 11,551 45.5
2018 52.6 -- 52 44.4 16,284 43.3
Totals
2017 100.0 100.0 183 100.0 25,386 100.0
2018 100.0 -- 117 100.0 37,643 100.0
Source: 2015 ACS Census; 1/1/2017 - 12/31/2018 Bank Data, 2017 HMDA Aggregate Data, "--" data not available. Due to rounding, totals may not equal 100.0
Small Business Loans
The geographic distribution of small business loans reflects reasonable dispersion throughout the
assessment area. During 2017 and 2018, the bank did not originate any small business loans in
the low-income census tracts. The low-income census tracts contain 1.7 percent of total
businesses and there is significant competition from national and regional-based institutions and
significantly larger local institutions. Further, some of these institutions maintain their
headquarters or branches in these tracts. The bank does not maintain any branches in
Framingham, where both low-income census tracts are located. During 2017 and 2018, lending
in moderate-income census tracts significantly exceeded demographics. The bank’s lending in
moderate-income tracts displayed a positive trend over the evaluation period.

12
Geographic Distribution of Small Business Loans
Tract Income Level % of
Businesses # % $(000s) %
Low
2017 1.7 0 0.0 0 0.0
2018 1.7 0 0.0 0 0.0
Moderate
2017 15.8 14 25.5 504 13.6
2018 15.9 16 28.1 1,565 23.0
Middle
2017 30.1 16 29.1 662 17.8
2018 30.1 22 38.6 1,748 25.6
Upper
2017 52.4 25 45.5 2,545 68.6
2018 52.4 19 33.3 3,504 51.4
Totals
2017 100.0 55 100.0 3,711 100.0
2018 100.0 57 100.0 6,817 100.0
Source: 2017 & 2018 D&B Data; Bank Small Business Loan Data 1/1/2017 – 12/31/2018
Borrower Profile
The distribution of borrowers reflects reasonable penetration among individuals of different
income levels and businesses of different sizes. The bank’s reasonable performance of home
mortgage lending primarily supports this conclusion. Examiners focused on the percentage of
home mortgage loans to low- and moderate-income borrowers and the percentage of small
business loans to businesses with GARs of $1 million or less.
Home Mortgage Loans
The distribution of borrowers reflects reasonable penetration among individuals of different
income levels. Examiners emphasized performance compared to the aggregate.
The following table shows that in 2017, lending to low-income borrowers exceeded aggregate
performance and was significantly below demographics. In 2018, lending to low-income
borrowers declined and was less than demographics. However, the demand and opportunity for
lending to low-income families is relatively limited. First, approximately 4.6 percent of the
families in the assessment area have incomes below the poverty level, a sub-set of the low-
income category. Second, a low-income family in the assessment area would not likely qualify
for a mortgage under conventional underwriting standards, considering the median housing value
of $378,174.

13
Main Street’s lending to moderate-income borrowers was slightly below 2017 aggregate and
demographics. In 2018, the bank’s lending as a percent of total lending to moderate-income
borrowers increased, but the number of originations declined in line with the overall decline.
Distribution of Home Mortgage Loans by Borrower Income Level
Borrower Income Level % of Families
Aggregate
Performance
% of #
# % $(000s) %
Low
2017 17.0 4.6 20 10.9 2,354 9.3
2018 17.0 -- 8 6.8 1,588 4.2
Moderate
2017 14.7 14.7 24 13.1 1,890 7.4
2018 14.7 -- 21 17.9 4,379 11.6
Middle
2017 19.1 23.1 37 20.2 4,460 17.6
2018 19.1 -- 24 20.5 5,187 13.8
Upper
2017 49.2 47.7 89 48.6 12,412 48.9
2018 49.2 -- 51 43.6 21,173 56.2
Not Available
2017 0.0 9.8 13 7.1 4,270 16.8
2018 0.0 -- 13 11.1 5,316 14.1
Totals
2017 100.0 100.0 183 100.0 25,386 100.0
2018 100.0 -- 117 100.0 37,643 100.0
Source: 2015 ACS Census; 1/1/2017 - 12/31/2018 Bank Data, 2017 HMDA Aggregate Data, "--" data not available. Due to rounding, totals may not equal 100.0
Small Business Loans
The distribution of small business loans reflects reasonable penetration of loans to businesses
with GARs of $1 million or less. As the following table demonstrates, the majority of small
business loans were to businesses with GARs of $1 million or less. Although lending to
businesses with GARs of $1 million or less was less than demographics each year, a review of
2017 aggregate data to gauge loan demand shows that the bank’s lending was in line with loan
demand. Aggregate data for 2018 is not available.

14
Distribution of Small Business Loans by Gross Annual Revenue Category
Gross Revenue Level % of
Businesses # % $(000s) %
<=$1,000,000
2017 83.3 42 76.4 1,377 37.1
2018 83.3 34 59.6 2,990 43.9
>$1,000,000
2017 7.1 13 23.6 2,334 62.9
2018 6.9 23 40.4 3,827 56.1
Totals
2017 100.0 55 100.0 3,711 100.0
2018 100.0 57 100.0 6,817 100.0
Source: 2017 & 2018 D&B Data; Bank Small Business Loan Data 1/1/2017 - 12/31/2018
Response to Complaints
The bank did not receive any CRA-related complaints since the previous evaluation; therefore,
this criterion did not affect the Lending Test rating.
COMMUNITY DEVELOPMENT TEST
The bank demonstrated adequate responsiveness to the community development needs of its
assessment area through community development loans, qualified investments, and community
development services. Examiners considered the institution’s capacity and the need and
availability of such opportunities.
Community Development Loans
The bank originated seven community development loans totaling approximately $24.6 million
during the evaluation period. This activity level represents 2.9 percent of average total assets
and 3.9 percent of average total loans since the prior CRA evaluation. The total includes one
loan for $21.2 million originated in the greater statewide area. Although this loan does not
benefit the bank’s assessment area(s), examiners considered it because the bank was responsive
to the community development needs of its assessment area.
The bank’s community development lending primarily financed activities that help promote
affordable housing, which is consistent with one of the identified community development needs
of the assessment area. The following table illustrates the community development lending
activity by year and purpose.

15
Community Development Lending
Activity Year
Affordable
Housing
Community
Services
Economic
Development
Revitalize or
Stabilize Totals
# $(000s) # $(000s) # $(000s) # $(000s) # $(000s)
2016 0 0 0 0 0 0 0 0 0 0
2017 2 647 0 0 1 1,276 0 0 3 1,923
2018 3 21,831 0 0 1 855 0 0 4 22,686
Year to Date (YTD)
2019 0 0 0 0 0 0 0 0 0 0
Total 5 22,478 0 0 2 2,131 0 0 7 24,609
Source: Bank Records
The following are examples of the community development loans:
During the evaluation period, the bank originated two SBA 504 community development
loans totaling slightly more than $2.1 million in the Cambridge-Newton-Framingham,
MA MD. The SBA 504 program helps small businesses and promotes job creation and
economic development.
In 2017, the bank extended two loans totaling approximately $2.6 million to finance the
construction of a Chapter 40B residential development in Berlin, MA. Of the 32 total
units, 8 are affordable housing. The pro rata share of the loan amounts that qualify as
community development is $646,713.
In 2018, the bank originated a $21.2 million loan to provide bridge financing for the
purchase of a 231-unit building in Boston, MA. The building will provide affordable
housing to low- and moderate-income seniors. The Department of Housing and Urban
Development under its Section 8 Housing Assistance Payments Program subsidizes all
tenants’ rents. The bank participated out a portion of the loan. This loan responds to the
affordable housing need in Boston.
Qualified Investments
The bank made 88 qualified investments totaling $2.7 million. This includes two prior period
equity investments totaling $550,000, one current period investment totaling approximately $2.0
million, and 85 donations totaling approximately $158,000. The dollar amount of equity
investments equals 0.3 percent of average total assets and 1.6 percent of average total securities.
By dollar amount, a majority of the investments promoted affordable housing for low- and
moderate-income individuals. This demonstrates the bank’s responsiveness to the affordable
housing need.
The following table illustrates the bank’s community development investments by year and
purpose.

16
Qualified Investments
Assessment Area
Affordable
Housing
Community
Services
Economic
Development
Revitalize or
Stabilize Totals
# $(000s) # $(000s) # $(000s) # $(000s) # $(000s)
Prior Period 1 500 0 0 1 50 0 0 2 550
2016 0 0 0 0 0 0 0 0 0 0
2017 0 0 0 0 0 0 0 0 0 0
2018 1 2,010 0 0 0 0 0 0 1 2,010
YTD 2019 0 0 0 0 0 0 0 0 0 0
Subtotal 2 2,510 0 0 1 50 0 0 3 2,560
Qualified Grants &
Donations 6 9 75 124 4 25 0 0 85 158
Total 8 2,519 75 124 5 75 0 0 88 2,718
Source: Bank Records
The following are the bank’s qualified investments.
The bank continues to hold a prior period investment in the Marlborough Economic
Development Corporation Revolving Loan Fund (Loan Fund). The Loan Fund provides
access to capital and gap financing for small businesses in Marlborough. Financing
bridges the funding small business owners obtain through a private lender and the actual
amount needed to start or expand their business. The current book value is $50,000.
The bank continues to hold a prior period investment in the CRA Qualified Investment
Fund (Fund), which NMSB purchased prior to the merger. The Fund purchases CRA
qualifying investments. Proceeds purchased Massachusetts Housing Finance Agency
Rental Development Revenue Bonds. These bonds help to create multi-family affordable
housing. The current book value is $500,000.
In 2018, the bank purchased a $2.0 million CRA mortgage backed security. Mortgages
to low- and moderate-income borrowers within the assessment area collateralize the
security.
The bank also made 85 donations totaling approximately $158,000. The following are examples
of organizations that received qualified charitable contributions and grants.
Marlborough Mayor’s Charity Relief Fund - This fund helps low-income individuals
and families requiring financial assistance. Recipients include seniors needing heating
and fuel assistance, families that have lost their home due to fire, and individuals that are
financially struggling due to an illness.
HOPEsudbury - This organization helps low- and moderate-income residents.
Assistance includes food, rent or mortgage payments, heating, and household repairs.

17
Habitat for Humanity - This organization’s Critical Home Repair Program is a home
preservation program that provides low-income homeowners with needed interior and
external repairs.
Abby’s House - This organization provides shelter, affordable housing, advocacy, and
support services to low-income women with or without children.
Community Development Services
During the evaluation period, employees provided 61 instances of financial expertise or technical
assistance to 17 different community development-related organizations. The majority of
activity benefited organizations that provide community services to low- and moderate-income
individuals. The following table illustrates the bank’s community development services by year
and purpose.
Community Development Services
Activity Year
Affordable
Housing
Community
Services
Economic
Development
Revitalize or
Stabilize Totals
# # # # #
2016 2 7 5 0 14
2017 2 8 5 0 15
2018 2 9 6 0 17
YTD 2019 1 8 6 0 15
Total 7 32 22 0 61
Source: Bank Records
The following are examples of the bank’s community development services.
Marlborough Economic Development Corporation - This organization works with
municipal and private investors to foster economic development, job growth, and
community revitalization in Marlborough. A senior manager serves on the Loan
Committee.
Loaves and Fish Food Pantry - This food pantry serves Ayer, Devens, Groton, Harvard,
Littleton, and Shirley. A senior manager serves on the Finance Committee.
Massachusetts Community and Banking Council (MCBC) - MCBC’s mission is to
partner with financial institutions and community organizations to improve the
availability of credit and financial services to underserved communities, low- and
moderate-income families, and small businesses. The organization operates in a greater
statewide area that includes the bank’s assessment area. One senior manager serves on
the Economic Development Committee and another, on the Lending Committee.
North Central Massachusetts Development Corporation - This non-profit
corporation’s mission is to create jobs and improve the economy of North Central

18
Massachusetts. The corporation assists in workforce development, lends to small
businesses, and provides resources to business owners. This organization serves a
regional area that includes the assessment area. A senior manager serves as a Board
member of the Loan Committee.
Other Services
Interest on Lawyers’ Trust Accounts (IOLTA) - Interest earned on the accounts helps
fund legal services for low-income clients.
As a MCBC partner, the bank voluntarily provides low-cost checking and savings accounts.
These products increase access to financial services for low- and moderate-income individuals.
In addition, the bank operates four branches and ATMs in the moderate-income census tracts.
These branches and ATMs demonstrate the availability of banking services to low- and
moderate-income individuals.
DISCRIMINATORY OR OTHER ILLEGAL CREDIT PRACTICES REVIEW
Examiners did not identify any evidence of discriminatory or other illegal credit practices;
therefore, this consideration did not affect the institution’s overall CRA rating.

19
APPENDIX
FAIR LENDING POLICIES AND PROCEDURES
Please note any comments regarding the institution’s fair lending policies and procedures in
narrative form (Regulatory Bulletin 1.3-106).
MINORITY APPLICATION FLOW
Examiners reviewed the bank’s 2017 and 2018 HMDA LARs to determine if the application
flow from the different racial groups within the bank’s assessment area reflected the assessment
area’s demographics.
Examiners compared the bank’s level of lending to the aggregate for the most recent year that
data was available, 2017. This comparison assisted in deriving reasonable expectations for the
application rate the bank received from minority residential loan applicants.
In 2017, the bank received 252 HMDA reportable loan applications from within its assessment
area. Of these applications, the bank received 20 or 7.9 percent from minority applicants, of
which 13 or 65.0 percent resulted in originations. The aggregate received 15,532 HMDA
reportable loan applications of which 2,001 or 12.9 percent were from minority applicants and
originated 1,480 or 74.0 percent. The bank also received 11 or 4.4 percent of applications from
ethnic groups of Hispanic origin within its assessment area and originated 6 or 54.5 percent. The
aggregate received 905 applications or 5.8 percent and originated 628 or 69.4 percent.
In 2018, the bank received 157 HMDA reportable loan applications from within its assessment
area. Of these applications, the bank received 11 or 7.0 percent from minority applicants, of
which 7 or 63.6 percent resulted in originations. For the same time, the bank also received 9 or
65.8 percent of applications from ethnic groups of Hispanic origin within its assessment area and
originated 7 or 77.8 percent.
Refer to the following table for the minority application flow for the bank and aggregate.

20
MINORITY APPLICATION FLOW
RACE
Bank 2017 HMDA
2017
Bank 2018 HMDA Aggregate
Data
# % % # %
American Indian/ Alaska Native 1 0.4 0.2 0 0.0
Asian 11 4.4 9.5 5 3.2
Black/ African American 3 1.2 1.3 1 0.6
Hawaiian/Pacific Islander 0 0.0 0.1 0 0.0
2 or more Minority 0 0.0 0.1 0 0.0
Joint Race (White/Minority) 5 1.9 1.7 5 3.2
Total Minority 20 7.9 12.9 11 7.0
White 193 76.6 67.0 118 75.2
Race Not Available 39 15.5 20.1 28 17.8
Total 252 100.0 100.0 157 100.0
ETHNICITY
Hispanic or Latino 7 2.8 4.6 5 3.2
Not Hispanic or Latino 200 79.4 74.3 111 70.7
Joint (Hisp/Lat /Not Hisp/Lat) 4 1.6 1.2 4 2.6
Ethnicity Not Available 41 16.2 19.9 37 23.5
Total 252 100.0 100.00 157 100.0
Source: ACS Census 2015, HMDA Aggregate Data 2017, HMDA LAR Data 2017 and 2018 *Due to rounding, totals may not equal
100.0 percent.
Given the assessment area’s demographic composition and comparisons to aggregate data, the
bank’s minority application flow is adequate.

21
GLOSSARY
Aggregate Lending: The number of loans originated and purchased by all reporting lenders in
specified income categories as a percentage of the aggregate number of loans originated and
purchased by all reporting lenders in the metropolitan area/assessment area.
Area Median Income: The median family income for the MSA, if a person or geography is
located in an MSA; or the statewide nonmetropolitan median family income, if a person or
geography is located outside an MSA.
Assessment Area: A geographic area delineated by the bank under the requirements of the
Community Reinvestment Act.
Census Tract: A small, relatively permanent statistical subdivision of a county. Census tract
boundaries normally follow visible features, but they may follow governmental unit boundaries
and other non-visible features in some instances. They always nest within counties. Census
tracts average about 4,000 persons, and their physical size varies widely depending upon
population density. Census tracts are designed to be homogenous for population characteristics,
economic status, and living conditions to allow for statistical comparisons.
Combined Statistical Area (CSA): A combination of several adjacent metropolitan statistical
areas or micropolitan statistical areas or a mix of the two, which are linked by economic ties.
Community Development: For loans, investments, and services to qualify as community
development activities, their primary purpose must:
(1) Support affordable housing for low- and moderate-income individuals;
(2) Target community services toward low- and moderate-income individuals;
(3) Promote economic development by financing small businesses or farms; or
(4) Provide activities that revitalize or stabilize low- and moderate-income geographies,
designated disaster areas, or distressed or underserved nonmetropolitan middle-income
geographies; or
(5) Enable or facilitate projects or activities that address needs regarding foreclosed or
abandoned residential properties in designated target areas.
Community Development Corporation (CDC): A CDC allows banks and holding companies
to make equity type of investments in community development projects. Bank CDCs can
develop innovative debt instruments or provide near-equity investments tailored to the
development needs of the community. Bank CDCs are also tailored to their financial and
marketing needs. A CDC may purchase, own, rehabilitate, construct, manage, and sell real
property. Also, it may make equity or debt investments in development projects and in local
businesses. The CDC activities are expected to directly benefit low- and moderate-income
groups, and the investment dollars should not represent an undue risk on the banking
organization.

22
Community Development Financial Institutions (CDFIs): CDFIs are private intermediaries
(either for profit or nonprofit) with community development as their primary mission. A CDFI
facilitates the flow of lending and investment capital into distressed communities and to
individuals who have been unable to take advantage of the services offered by traditional
financial institutions. Some basic types of CDFIs include community development banks,
community development loan funds, community development credit unions, micro enterprise
funds, and community development venture capital funds.
A certified CDFI must meet eligibility requirements. These requirements include the following:
Having a primary mission of promoting community development;
Serving an investment area or target population;
Providing development services;
Maintaining accountability to residents of its investment area or targeted population
through representation on its governing board of directors, or by other means;
Not constituting an agency or instrumentality of the United States, of any state or
political subdivision of a state.
Community Development Loan: A loan that
(1) Has as its primary purpose community development; and
(2) Except in the case of a wholesale or limited purpose bank:
(i) Has not been reported or collected by the bank or an affiliate for consideration in the
bank’s assessment area as a home mortgage, small business, small farm, or consumer
loan, unless it is a multifamily dwelling loan (as described in Appendix A to Part 203 of
this title); and
(ii) Benefits the bank’s assessment area(s) or a broader statewide or regional area
including the bank’s assessment area(s).
Community Development Service: A service that
(1) Has as its primary purpose community development;
(2) Is related to the provision of financial services; and
(3) Has not been considered in the evaluation of the bank’s retail banking services under
§ 345.24(d).
Consumer Loan(s): A loan(s) to one or more individuals for household, family, or other
personal expenditures. A consumer loan does not include a home mortgage, small business, or
small farm loan. This definition includes the following categories: motor vehicle loans, credit
card loans, home equity loans, other secured consumer loans, and other unsecured consumer
loans.
Core Based Statistical Areas (CBSAs): The county or counties or equivalent entities
associated with at least one core (urbanized area or urban cluster) of at least 10,000 population,
plus adjacent counties having a high degree of social and economic integration with the core as
measured through commuting ties with the counties associated with the core. Metropolitan and
Micropolitan Statistical Areas are the two categories of CBSAs.

23
Distressed Middle-Income Nonmetropolitan Geographies: A nonmetropolitan middle-
income geography will be designated as distressed if it is in a county that meets one or more of
the following triggers:
(1) an unemployment rate of at least 1.5 times the national average;
(2) a poverty rate of 20 percent or more; or,
(3) a population loss of 10 percent or more between the previous and most recent
decennial census or a net migration loss of 5 percent or more over the 5-year period
preceding the most recent census.
Family: Includes a householder and one or more other persons living in the same household
who are related to the householder by birth, marriage, or adoption. The number of family
households always equals the number of families; however, a family household may also include
non-relatives living with the family. Families are classified by type as either a married-couple
family or other family. Other family is further classified into “male householder” (a family with
a male householder and no wife present) or “female householder” (a family with a female
householder and no husband present).
Family Income: Includes the income of all members of a family that are age 15 and older.
FFIEC-Estimated Income Data: The Federal Financial Institutions Examination Council
(FFIEC) issues annual estimates, which update median family income from the metropolitan and
nonmetropolitan areas. The FFIEC uses American Community Survey data and factors in
information from other sources to arrive at an annual estimate that more closely reflects current
economic conditions.
Full-Scope Review: A full-scope review is accomplished when examiners complete all
applicable interagency examination procedures for an assessment area. Performance under
applicable tests is analyzed considering performance context, quantitative factors (for example,
geographic distribution, borrower profile, and total number and dollar amount of investments),
and qualitative factors (for example, innovativeness, complexity, and responsiveness).
Geography: A census tract delineated by the United States Bureau of the Census in the most
recent decennial census.
Home Mortgage Disclosure Act (HMDA): The statute that requires certain mortgage lenders
that do business or have banking offices in a metropolitan statistical area to file annual summary
reports of their mortgage lending activity. The reports include such data as the race, gender, and
the income of applicants; the amount of loan requested; and the disposition of the application
(approved, denied, and withdrawn).
Home Mortgage Disclosure Loan Application Register (HMDA LAR): The HMDA LARs
record all applications received for residential purchase, refinance, home improvement, and
temporary-to-permanent construction loans.

24
Home Mortgage Loans: Includes home purchase and home improvement loans as defined in
the HMDA regulation. This definition also includes multi-family (five or more families)
dwelling loans, loans to purchase manufactured homes, and refinancings of home improvement
and home purchase loans.
Household: Includes all persons occupying a housing unit. Persons not living in households are
classified as living in group quarters. In 100 percent tabulations, the count of households always
equals the count of occupied housing units.
Household Income: Includes the income of the householder and all other persons that are age
15 and older in the household, whether related to the householder or not. Because many
households are only one person, median household income is usually less than median family
income.
Housing Unit: Includes a house, an apartment, a mobile home, a group of rooms, or a single
room that is occupied as separate living quarters.
Limited-Scope Review: A limited scope review is accomplished when examiners do not
complete all applicable interagency examination procedures for an assessment area.
Performance under applicable tests is often analyzed using only quantitative factors (for
example, geographic distribution, borrower profile, total number and dollar amount of
investments, and branch distribution).
Low-Income: Individual income that is less than 50 percent of the area median income, or a
median family income that is less than 50 percent in the case of a geography.
Low Income Housing Tax Credit: The Low-Income Housing Tax Credit Program is a housing
program contained within the Internal Revenue Code of 1986, as amended. It is administered by
the U.S. Department of the Treasury and the Internal Revenue Service. The U.S. Treasury
Department distributes low-income housing tax credits to housing credit agencies through the
Internal Revenue Service. The housing agencies allocate tax credits on a competitive basis.
Developers who acquire, rehabilitate, or construct low-income rental housing may keep their tax
credits. Or, they may sell them to corporations or investor groups, who, as owners of these
properties, will be able to reduce their own federal tax payments. The credit can be claimed
annually for ten consecutive years. For a project to be eligible, the developer must set aside a
specific percentage of units for occupancy by low-income residents. The set-aside requirement
remains throughout the compliance period, usually 30 years.
Market Share: The number of loans originated and purchased by the institution as a percentage
of the aggregate number of loans originated and purchased by all reporting lenders in the
metropolitan area/assessment area.
Median Income: The median income divides the income distribution into two equal parts, one
having incomes above the median and other having incomes below the median.

25
Metropolitan Division (MD): A county or group of counties within a CBSA that contain(s) an
urbanized area with a population of at least 2.5 million. A MD is one or more main/secondary
counties representing an employment center or centers, plus adjacent counties associated with
the main/secondary county or counties through commuting ties.
Metropolitan Statistical Area (MSA): CBSA associated with at least one urbanized area
having a population of at least 50,000. The MSA comprises the central county or counties or
equivalent entities containing the core, plus adjacent outlying counties having a high degree of
social and economic integration with the central county or counties as measured through
commuting.
Micropolitan Statistical Area: CBSA associated with at least one urbanized area having a
population of at least 10,000, but less than 50,000.
Middle-Income: Individual income that is at least 80 percent and less than 120 percent of the
area median income, or a median family income that is at least 80 and less than 120 percent in
the case of a geography.
Moderate-Income: Individual income that is at least 50 percent and less than 80 percent of the
area median income, or a median family income that is at least 50 and less than 80 percent in the
case of a geography.
Multi-family: Refers to a residential structure that contains five or more units.
Nonmetropolitan Area: All areas outside of metropolitan areas. The definition of
nonmetropolitan area is not consistent with the definition of rural areas. Urban and rural
classifications cut across the other hierarchies. For example, there is generally urban and rural
territory within metropolitan and nonmetropolitan areas.
Owner-Occupied Units: Includes units occupied by the owner or co-owner, even if the unit has
not been fully paid for or is mortgaged.
Qualified Investment: A lawful investment, deposit, membership share, or grant that has as its
primary purpose community development.
Rated area: A rated area is a state or multistate metropolitan area. For an institution with
domestic branches in only one state, the institution’s CRA rating would be the state rating. If an
institution maintains domestic branches in more than one state, the institution will receive a
rating for each state in which those branches are located. If an institution maintains domestic
branches in two or more states within a multistate metropolitan area, the institution will receive a
rating for the multistate metropolitan area.
Rural Area: Territories, populations, and housing units that are not classified as urban.

26
Small Business Investment Company (SBIC): SBICs are privately-owned investment
companies which are licensed and regulated by the Small Business Administration (SBA).
SBICs provide long-term loans and/or venture capital to small firms. Because money for venture
or risk investments is difficult for small firms to obtain, SBA provides assistance to SBICs to
stimulate and supplement the flow of private equity and long-term loan funds to small
companies. Venture capitalists participate in the SBIC program to supplement their own private
capital with funds borrowed at favorable rates through SBA’s guarantee of SBIC debentures.
These SBIC debentures are then sold to private investors. An SBIC’s success is linked to the
growth and profitability of the companies that it finances. Therefore, some SBICs primarily
assist businesses with significant growth potential, such as new firms in innovative industries.
SBICs finance small firms by providing straight loans and/or equity-type investments. This kind
of financing gives them partial ownership of those businesses and the possibility of sharing in the
companies’ profits as they grow and prosper.
Small Business Loan: A loan included in “loans to small businesses” as defined in the
Consolidated Report of Condition and Income (Call Report). These loans have original amounts
of $1 million or less and are either secured by nonfarm nonresidential properties or are classified
as commercial and industrial loans.
Small Farm Loan: A loan included in “loans to small farms” as defined in the instructions for
preparation of the Consolidated Report of Condition and Income (Call Report). These loans
have original amounts of $500,000 or less and are either secured by farmland, including farm
residential and other improvements, or are classified as loans to finance agricultural production
and other loans to farmers.
Underserved middle-income nonmetropolitan geographies: A nonmetropolitan middle-
income geography will be designated as underserved if it meets criteria for
Population size, density, and dispersion indicating the area’s population is sufficiently
small, thin, and
Distant from a population center that the tract is likely to have difficulty financing the
fixed costs of meeting essential community needs.
Upper-Income: Individual income that is more than 120 percent of the area median income, or
a median family income that is more than 120 percent in the case of a geography.
Urban Area: All territories, populations, and housing units in urbanized areas and in places of
2,500 or more persons outside urbanized areas. More specifically, “urban” consists of territory,
persons, and housing units in places of 2,500 or more persons incorporated as cities, villages,
boroughs (except in Alaska and New York), and towns (except in the New England states, New
York, and Wisconsin).
“Urban” excludes the rural portions of “extended cities”; census designated place of 2,500 or
more persons; and other territory, incorporated or unincorporated, including in urbanized areas.

PERFORMANCE EVALUATION DISCLOSURE GUIDE
Massachusetts General Laws Chapter 167, Section 14, as amended, and the Uniform
Interagency Community Reinvestment Act (CRA) Guidelines for Disclosure of Written
Evaluations, and Part 345 of the Federal Deposit Insurance Corporation’s Rules and
Regulations, require all financial institutions to take the following actions within 30 business
days of receipt of the CRA evaluation of their institution:
1) Make its most current CRA performance evaluation available to the public;
2) At a minimum, place the evaluation in the institution's CRA public file located at the
head office and at a designated office in each assessment area;
3) Add the following language to the institution's required CRA public notice that is
posted in each depository facility:
"You may obtain the public section of our most recent CRA Performance Evaluation,
which was prepared by the Massachusetts Division of Banks, at (Address at main
office)."
"You may obtain the public section of our most recent CRA Performance Evaluation,
which was prepared by the Federal Deposit Insurance Corporation, at (Address at
main office)."
[Please Note: If the institution has more than one assessment area, each office (other
than off-premises electronic deposit facilities) in that community shall also include
the address of the designated office for that assessment area.]
4) Provide a copy of its current evaluation to the public, upon request. In connection
with this, the institution is authorized to charge a fee which does not exceed the cost
of reproduction and mailing (if applicable).
The format and content of the institution's evaluation, as prepared by its supervisory
agencies, may not be altered or abridged in any manner. The institution is encouraged to
include its response to the evaluation in its CRA public file.