maintenance activity data analysis for performance based...
TRANSCRIPT

By
Dr. Stephanie C. Vereen Dr. Eric Marks
Louis Francis Yu Tiamco
Department of Civil, Construction, and Environmental Engineering The University of Alabama
Tuscaloosa, Alabama
Prepared by
UTCA University Transportation Center for Alabama
The University of Alabama, The University of Alabama at Birmingham, and The University of Alabama in Huntsville
ALDOT Report Number 930-896 UTCA Report Number 14412
April 2016
Maintenance Activity Data Analysis for Performance Based Budgeting
UTCA Theme: Management and Safety of Transportation Systems

About UTCA The University Transportation Center for Alabama (UTCA) is headquartered in the
Department of Civil, Construction, and Environmental Engineering at the University of Alabama (UA).
Interdisciplinary faculty members perform research, education, and technology-transfer projects using funds
provided by UTCA and external sponsors.
Mission Statement and Strategic Plan The mission of UTCA is “to advance the technology and
expertise in the multiple disciplines that comprise transportation through the mechanisms of education,
research, and technology transfer while serving as a university-based center of excellence.”
The UTCA strategic plan contains six goals that support this mission:
Education – conduct a multidisciplinary program of coursework and experiential learning that
reinforces the theme of transportation;
Human Resources – increase the number of students, faculty and staff who are attracted to and
substantively involved in the undergraduate, graduate, and professional programs of UTCA;
Diversity – develop students, faculty and staff who reflect the growing diversity of the US workforce
and are substantively involved in the undergraduate, graduate, and professional programs of
UTCA;
Research Selection – utilize an objective process for selecting and reviewing research that
balances the multiple objectives of the program;
Research Performance – conduct an ongoing program of basic and applied research, the products
of which are judged by peers or other experts in the field to advance the body of knowledge in
transportation; and
Technology Transfer – ensure the availability of research results to potential users in a form that
can be directly implemented, utilized or otherwise applied.
Theme The UTCA theme is “MANAGEMENT AND SAFETY OF TRANSPORTATION SYSTEMS.” UTCA concentrates
upon the highway and mass transit modes but also conducts projects featuring rail, waterway, air, and other
transportation modes as well as intermodal issues.
Acknowledgement This project was sponsored by Alabama Department of Transportation (ALDOT).
UTCA is grateful for ALDOT’s continued encouragement and support.
Disclaimer The contents of this report reflect the views of the authors, who are responsible for the facts
and the accuracy of the data presented herein. The contents do not necessarily reflect the official views or
policies of Alabama DOT, the University of Alabama, or UTCA, and they assume no liability for the contents
or use thereof. This report does not constitute a standard, specification, or regulation. Comments contained
in this report related to specific testing equipment and materials should not be considered an endorsement
of any commercial product or service; no such endorsement is intended or implied.
University Transportation Center for Alabama

i
Maintenance Activity Data Analysis for Performance Based Budgeting
By
Dr. Stephanie C. Vereen Dr. Eric Marks
Louis Francis Yu Tiamco
Department of Civil, Construction, and Environmental Engineering The University of Alabama
Tuscaloosa, Alabama
Prepared by
UTCA
University Transportation Center for Alabama The University of Alabama, The University of Alabama at Birmingham,
and The University of Alabama in Huntsville
UTCA Report Number 14412 April 2016
ii
Technical Report Documentation Page
1. Report No FHWA/CA/OR-
2. Government Accession No. 3. Recipient Catalog No.
4. Title and Subtitle Maintenance Activity Data Analysis for Performance Based Budgeting
5. Report Date
September 2015 6. Performing Organization Code
7. Authors
Dr. Stephanie C. Vereen, Dr. Eric Marks, Louis Francis Yu Tiamco
8. Performing Organization Report No.
UTCA Report Number 14412
9. Performing Organization Name and Address
University Transportation Center for Alabama The University of Alabama Box 870205 Tuscaloosa, Alabama 35487-0205
10. Work Unit No. 11. Contract or Grant No. UA Grant Number GR 24928
12. Sponsoring Agency Name and Address
Alabama Department of Transportation 1409 Coliseum Boulevard Montgomery, AL 36110
13. Type of Report and Period Covered
Jan 1, 2015 – Aug 31, 2015 14. Sponsoring Agency Code
ALDOT Research Project 930-896 15. Supplementary Notes 16. Abstract
The Alabama Department of Transportation (ALDOT) Maintenance Bureau is responsible for conducting effective and efficient highway maintenance operations throughout the state. A primary maintenance objective is to ensure effective and economical utilization of resources in the accomplishments of maintenance programs. In 2011, the Maintenance Bureau upgraded software programs used to collect and store data related to daily maintenance activities. Specifically, a computerized maintenance management system (CMMS) and a statistical software package were acquired. One objective in obtaining the systems was to improve budgeting performance and analysis for the Maintenance Bureau. This report presents the results of a study completed to review the CMMS system and to identify and demonstrate techniques that can maximize the usefulness of the large amount of quality data captured by the CMMS system since its implementation at ALDOT. The intended outcome of the study is to identify an analysis technique successful in increasing the efficiency and effectiveness of the current Bureau budgeting practices, as they relate to daily activities and asset condition assessments, without burdening the current process.
17. Key Words
RoadMAP, CMMS, SPSS 18. Distribution Statement
19. Security Classification (of this report)
Unclassified
20. Security Classification (of this page)
Unclassified
20. No of Pages
24
22. Price
Form DOT F 1700.7 (8-72)

iii
Table of Contents
Table of Contents ........................................................................................................................... iii
Tables ............................................................................................................................................. iv
Figures ..............................................................................................................................................v
Executive Summary ....................................................................................................................... vi
1.0 Introduction ................................................................................................................................1 1.1 Project Objective ...........................................................................................................1
1.2 Background ...................................................................................................................1
1.3 Methodology .................................................................................................................2
2.0 Historical Overview ...................................................................................................................4 2.1 Asset Management ........................................................................................................4
2.2 CMMS Utilization ........................................................................................................4
2.3 Performance Based Budgeting ......................................................................................5
2.4 Research Needs .............................................................................................................5
3.0 RoadMAP Questionnaire ...........................................................................................................7 3.1 Overview .......................................................................................................................7
3.2 Discussion ...................................................................................................................10
4.0 Data Analysis ...........................................................................................................................12 4.1 Background .................................................................................................................12
4.2 Methodology ...............................................................................................................15 4.2.1 EXCEL Pivot Tables.................................................................................16 4.2.2 Multiple Regression ..................................................................................16 4.3 Techniques ...................................................................................................................17 4.3.1 Budget Analysis ........................................................................................17 4.3.2 Equipment Comparison ............................................................................19
5.0 Conclusion ...............................................................................................................................22
References ......................................................................................................................................23

iv
Tables
Number Page
Table 1. Example Condition Assessment Rating – All Road Classes – 3 Year Trend ........... 2
Table 2. Survey Responses ..................................................................................................... 8
Table 3. CMMS User Responses ............................................................................................ 9

v
Figures
Number Page
Figure 1. RoadMAP generated spreadsheet ......................................................................... 12
Figure 2. Example segment of ALDOT’s condition rating form ......................................... 14
Figure 3. Raw condition assessment scores for number of potholes per mile ..................... 14
Figure 4. Letter grade scoring categories for each of ALDOT’s assets............................... 15
Figure 5. LOS scorecard for statewide asphalt pavement .................................................... 15
Figure 6. Excel Pivot Table of RoadMAP Data .................................................................. 16
Figure 7. Sum of Resource Expenditures per ALDOT Division and District ..................... 18
Figure 8. Division Expenditures per year as reported by RoadMAP .................................. 18
Figure 9. Graphical comparison: accomplishment per cost with a limited crew size.......... 20
Figure 10. Graphical comparison: accomplishment under time constraints .......................... 21

vi
Executive Summary A key component for the Alabama Department of Transportation (ALDOT) Maintenance Bureau to accomplish their objective of effective and economically maintaining state transportation resources is effective annual budgeting. The Bureau currently utilizes level of effort planning to generate budgets which involves projecting budgets based on desired quantities of a desired activity. Their goal is to transition to performance based budgeting where budgets may be determined by establishing a cost required to improve condition assessment ratings. This study assessed the current RoadMAP data collection and utilization practices of Bureau employees by conducting information sessions in which questionnaires were utilized to collect data from employees using the program. The results allowed the research team to develop a comprehensive understanding of how RoadMAP has been utilized since its adoption and provide feedback to the Bureau software administrators concerning how the software has been used and perceived by employees. Then, the research team analyzed data provided by RoadMAP. The scope used work report and condition assessment data from 2012, 2013, and 2014. Analysis was performed utilizing Microsoft Excel and SPSS. The research team was able to use multiple regression analysis to establish relationships between the RoadMAP and condition assessment ratings. The research team also used the date to compare equipment efficiency among similar maintenance activities. Overall, the research team was able identify the benefits and challenges of data collection using the RoadMAP CMMS. Accurate data is necessary to utilize the data collected for generating future budgets. The research team successfully developed an analysis technique to help support performance based budgeting of maintenance activities. The techniques presented herein will continue to improve in accuracy and usefulness as additional data are entered in RoadMAP.

1
Chapter 1 Introduction
The Alabama Department of Transportation (ALDOT) Maintenance Bureau is responsible for conducting effective and efficient highway maintenance operations throughout the state. A primary maintenance objective is to ensure effective and economical utilization of resources in the accomplishment of maintenance programs. In 2011, the Maintenance Bureau upgraded their software programs used to collect and store data related to daily maintenance activities. Specifically, a computerized maintenance management system (CMMS) and a statistical software package were acquired. One objective in obtaining the new systems was to improve budgeting performance and analysis for the Bureau. The goal of this research project is to assist the ALDOT Maintenance Bureau with analysis of the new systems and the significant amount of quality data being captured. The proposed outcome of the project is the identification and demonstrations of techniques the Maintenance Bureau can utilize in their transition to performance based budgeting. 1.1 Project Objective The main objective of the proposed research is to identify and demonstrate techniques to maximize the benefit of the large amount of quality data being captured daily in the Maintenance Bureau’s computerized maintenance management system (CMMS), entitled RoadMAP. The techniques developed will specifically target increasing efficiency and effectiveness of the budgeting process without burdening the current process. 1.2 Background A key component for the ALDOT Maintenance Bureau to accomplish their daily tasks is effective annual budgeting. Desired maintenance activities must have adequate labor, materials, and equipment to be completed. The Bureau currently utilizes level of effort planning to generate budgets. The completed maintenance workload programs currently serve as the basis for preparing budgets, for allocating funds among field Divisions, and for defining the labor and equipment needs of each Division. For example, the ALDOT Maintenance Manual indicates that a maintenance activity such as spot premix patching stipulates the following conditions:
Crew Size: 5 Employees Equipment: 1 Dump Truck 1 flatbed dump 1 Roller 1 Hop Pot Accomplishment/Crew Day: 3.0 tons of premix
2
If a work program requires 300 tons of premix, the resource requirements for labor, equipment, and materials, are then calculated using the given figures. The same process is then repeated for each activity in the work program and then totaled to provide the total requirements for the year. This process represents a “level of effort based” budget. It does not take into account improvements in the performance or condition of the system. The Maintenance Bureau also conducts annual condition assessments of select features. Each feature is assigned an annual grade. Table 1 shows example condition assessment grades for Paved Shoulders.
Table 1. Example Condition Assessment Rating – All Road Classes – 3 Year Trends
Group Feature 2012 2013 2014
Paved Shoulders
Potholes A A A+ Edge Raveling B B B Sweeping C- C- D+
Current budget processes show the amount of money spent on a specific feature such as Paved Shoulders - Potholes. The Maintenance Bureau could benefit from determining how much it may cost to move from a condition assessment rating of an F, for example, up to a rating of C-minus and then progressively over time achieve a rating of A. This approach represents activity or performance based budgeting. In 2011, ALDOT acquired RoadMAP, a CMMS software package, and SPSS, a statistical analysis software, to facilitate the progressive effort to move from a level of effort based budgeting method to an activity or performance based budgeting. Data pertaining to routine maintenance activities, as codified in the Bureau’s Maintenance Performance Guidelines, are entered and stored in RoadMAP. Activity specific data such as employees working on an activity, equipment used, and quantities completed, should be entered into RoadMAP on a daily basis. The system is pre-populated with cost information such as employee wages and materials. In addition to storing historical maintenance activity data, RoadMAP offers the additional capability to analyze data and apply the results to budget and resource planning for the Maintenance Bureau. There are many activities, personnel, software programs, and other factors that play a part in creating annual Maintenance Budgets and also completing daily maintenance and operation activities of the Bureau. In this project, the research team will first gain an understanding of RoadMAP usage and maintenance operations around the state before developing data analysis techniques to support the Maintenance Bureau’s progressive transition towards their desired performance based budgeting process. Then, historical cost and condition assessment data will be compared in an effort to determine a technique that can be used to forecast performance based budgets. 1.3 Methodology The research team needed to gain a better understanding about how maintenance operations are conducted daily as well as the process of how they are reported. The research team visited select

3
ALDOT Districts and conducted information sessions to see firsthand how maintenance operations are performed. Six ALDOT Districts were selected to conduct information sessions and administer questionnaires. The driving theme of these meetings was to gain an understanding of how RoadMAP is implemented and maintained at various Districts to accomplish everyday maintenance tasks. Districts that were surveyed were selected by ALDOT maintenance management personnel to provide a varying degree of RoadMAP success and experience. These Districts were located in different geographic regions within the state of Alabama and varied in office personnel experience, population served, and number of laborers. To investigate the process of scheduling, completing, and reporting maintenance activities in RoadMAP, a questionnaire was distributed to each District. The questionnaire provided an outline for each meeting and aided in guiding the conversation towards similar discussion topics. The survey tool content covered functionality of RoadMAP and daily maintenance operations. Interviewees were asked about RoadMAP’s related topics such as:
• ease of use • who typically accesses the software and why • the usefulness of ALDOT generated work reports and work orders towards
daily maintenance operations A general labor portion concluded the questionnaire and contained questions regarding scheduling, completion, and reporting of routine and non-routine maintenance activities. ALDOT management personnel reviewed and provided feedback and recommendations for the questionnaire before the information sessions began. After gaining additional knowledge as to how maintenance operations are performed and how RoadMAP is utilized around the state, the research team began analyzing data provided by RoadMAP. To do this, the team used work report and condition assessment data provided from the years 2012, 2013, and 2014. This data was organized in Microsoft Excel pivot tables and then imported into SPSS for analysis. In this way, the team was able to discover useful techniques to help support performance based budgeting.
4
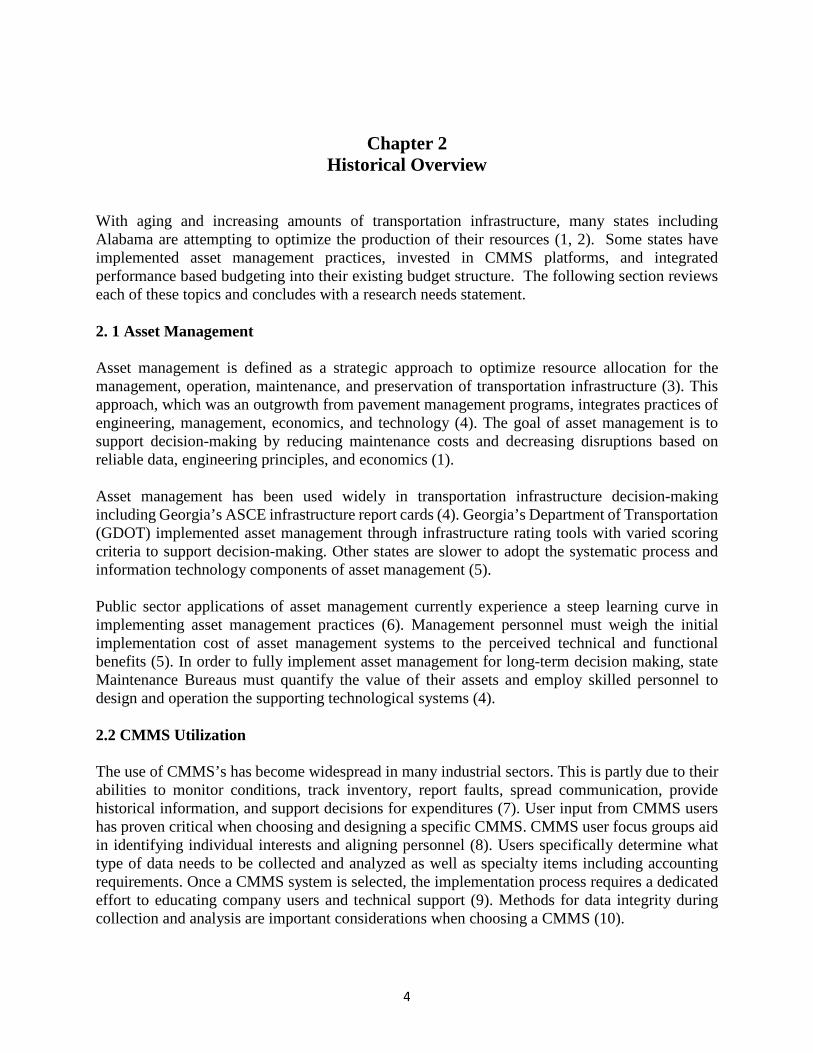
Chapter 2 Historical Overview
With aging and increasing amounts of transportation infrastructure, many states including Alabama are attempting to optimize the production of their resources (1, 2). Some states have implemented asset management practices, invested in CMMS platforms, and integrated performance based budgeting into their existing budget structure. The following section reviews each of these topics and concludes with a research needs statement. 2. 1 Asset Management Asset management is defined as a strategic approach to optimize resource allocation for the management, operation, maintenance, and preservation of transportation infrastructure (3). This approach, which was an outgrowth from pavement management programs, integrates practices of engineering, management, economics, and technology (4). The goal of asset management is to support decision-making by reducing maintenance costs and decreasing disruptions based on reliable data, engineering principles, and economics (1). Asset management has been used widely in transportation infrastructure decision-making including Georgia’s ASCE infrastructure report cards (4). Georgia’s Department of Transportation (GDOT) implemented asset management through infrastructure rating tools with varied scoring criteria to support decision-making. Other states are slower to adopt the systematic process and information technology components of asset management (5). Public sector applications of asset management currently experience a steep learning curve in implementing asset management practices (6). Management personnel must weigh the initial implementation cost of asset management systems to the perceived technical and functional benefits (5). In order to fully implement asset management for long-term decision making, state Maintenance Bureaus must quantify the value of their assets and employ skilled personnel to design and operation the supporting technological systems (4). 2.2 CMMS Utilization The use of CMMS’s has become widespread in many industrial sectors. This is partly due to their abilities to monitor conditions, track inventory, report faults, spread communication, provide historical information, and support decisions for expenditures (7). User input from CMMS users has proven critical when choosing and designing a specific CMMS. CMMS user focus groups aid in identifying individual interests and aligning personnel (8). Users specifically determine what type of data needs to be collected and analyzed as well as specialty items including accounting requirements. Once a CMMS system is selected, the implementation process requires a dedicated effort to educating company users and technical support (9). Methods for data integrity during collection and analysis are important considerations when choosing a CMMS (10).

5
However, CMMS’s are sometimes improperly implemented stemming from an expectation of instant efficiency (9). Some have questioned the added value of CMMS due to inaccurate trending and inconsistencies in data capturing. Limited commitment to CMMS stems from lack of understanding of forecasting models which indicates a need to link CMMS theory and practical use (7). For example, CMMS was improperly implemented in a metal working environment which resulted in increased maintenance costs and an underutilization of CMMS capabilities (11). Likewise, an investment in CMMS without consideration of actual conditions and maintenance strategy will result in underutilized systems (12). It was estimated that companies employ less than half of their CMMS capabilities which can flaw record keeping and limit the accuracy of data collection (13). 2.3 Performance Based Budgeting In his study of three budgeting propositions derived from economic theory, Verne Lewis concludes that although a formula of budget analysis seems theoretically sound, it is not often easy to apply because precise budget numbers are often unavailable. Effective budget estimates must forecast future needs and events (14). Performance based budgeting predicts future needs by allocating resources to achieve objectives based on program goals and measurable results. This budgeting strategy differs from traditional approaches because it focuses on the achievement that is made through the budget rather than the budget amount (15). Performance based budgeting establishes a link between the rationales for specific activities and the end outcome results. This information enables policymakers to identify cost-effective activities in reaching their intended outcome (16). Strategies for improving budget efficiency have been implemented in various capacities including a mathematical model for optimizing budget allocation for Arizona’s pavement management (17) and comparing inputs to outputs of highway maintenance operations to improve highway maintenance policies under budget restrictions (18). In Virginia, a private contractor maintains 250 miles of interstate highway in a performance based road-maintenance contract (19). The Louisiana Department of Transportation and Development identified budgeting needs and standards of budgeting models by creating a model to determine appropriate funding levels based on maintenance activity types and condition assessments (20). The U.S. Department of Commerce found that although performance based budgeting studies claim to enhance allocative efficiency, these claims are mainly based on anecdotal stories or self-reported surveys (21). The fundamental relationship between the maintenance level of service and budget requirements needs more investigation. A need exists to develop and implement a comprehensive framework that can measure overall efficiency of road maintenance operations accounting for environmental and operational factors (22). For example, personnel of Michigan’s capital preventative maintenance program identified an incomplete understanding of data captured, issues with determining cost effectiveness, and a lack of detailed treatment of performance information (23). 2.4 Research Needs Similar to several other states DOT’s, ALDOT requires an evaluation of the effectiveness of their recently implemented CMMS. A detailed investigation is required to gauge the successes and

6
failures of current data collection and analysis practices. Additionally, a need exists to qualitatively assess the level of utilization of CMMS and asset management for performance based budgeting. This includes creating best practices for implementing and maintaining such a system.

7
Chapter 3 RoadMAP Questionnaire
As previously noted, six ALDOT District offices were selected to conduct information sessions and administer questionnaires to gain an understanding of RoadMAP’s use since adoption. 3.1 Overview Based on the survey results, a general procedure was identified by which maintenance activities were completed and reported. The following steps outline this procedure:
1. District manager or other crew member identifies a maintenance concern 2. A work order is completed by a trained person which includes specifics of the
maintenance task to be performed 3. Maintenance activity is performed by local crew 4. Maintenance activity is reported using work reports, typically within 24 hours
Every District interviewed generally followed this step by step process for conducting maintenance operations. However, sometimes circumstances prevented full functional use of RoadMAP for daily maintenance operations. These barriers originated from technical errors in RoadMAP, maintenance delays, or user input errors. For example, many maintenance tasks were identified from community member calls and complaints which are prioritized upon receipt. High priority maintenance issues were considered non-routine maintenance. Non-routine tasks forced the delay of regularly scheduled maintenance activities which created backlogs of maintenance tasks. These non-routine tasks negatively impact RoadMAP work orders for maintenance tasks by introducing uncertainty into a scheduled program. Due to previous difficulties with the disruption of scheduled tasks by non-routine maintenance activities, many of Districts interviewed indicated they complete work orders less than a day before the work is to be performed. A few Districts choose not to complete work orders. This practice diminishes the usefulness of work orders and cripples the capabilities of RoadMAP to forecast and allocate maintenance resources. Other questionnaire responses were combined and summarized to provide a generalized view of the results. These results include an acknowledgement that all RoadMAP users received some level of training, whether from their respective District offices or at the ALDOT central office. All users indicated they had gained most of their knowledge of RoadMAP through hands-on experience and experimenting with the software interface. All surveyed Districts indicated they routinely completed work reports within 24 hours after the maintenance task was completed. RoadMAP users submitted between three and nine work reports per day. Most users agreed that work reports were an effective method to track expenditures and found RoadMAP to be useful for creating annual budgets. Most Districts used work orders to aid in scheduling maintenance tasks. Table 2 summarizes responses made by ALDOT maintenance personnel who were surveyed.

8
The District numbers in Table 2 do not reflect actual District numbers, only survey results from six miscellaneous Districts which have been anonymously labeled 1 through 6. Responses were recorded during the information sessions.
Table 2. Questionnaire Responses
Responses District
1 2 3 4 5 6
RoadMAP is good for budgeting x x x x
Some level of RoadMAP training was received x x x x x x
RoadMAP is good for expense tracking x x x x x
<=3 work reports per day x
3< work reports per day< 6 x x
6 < work reports per day < 9 x x x
Work orders are used every day x x x x
Another form of scheduling is used aside from work orders x x x x
There is no set deadline for maintenance tasks to be completed x x x x x x
After completing the questionnaire, users provided additional feedback about RoadMAP. Table 3 shows a list of common comments made during the information session and in which Districts they were made.

9
Table 3. CMMS User Responses
Responses Districts
1 2 3 4 5 6
There is a RoadMAP specialist on staff x x
It is not easy to edit past work reports x x x
There are problems/inefficiencies with reporting sign inspections x x x
Work reports are inconsistent with work performed x x
There are too many different types of reports x x x x x
Work orders take too long to complete x x x x
Work orders are not used x x
Equipment or Employees rates take too long to process in RoadMAP x x x
There are problems or inefficiencies with budgeting x x x x
As work reports were created every day at every District, some survey participants cited criticism concerning technical aspects of submitting work reports. Many users claimed there are too many types of work reports, which makes reporting a tedious and inefficient procedure. Multiple Districts claimed that many activity codes could be grouped together as a single maintenance activity or that different assets which are close to each other, or within the same milepost, could be considered one asset. Some Districts’ users claimed problems in editing past work report data. A work report is locked from additional editing by the original user after it is submitted. Users wishing to edit submitted reports must contact a supervisor to modify the reports. This created untimely inefficiencies in fixing incorrect work reports. RoadMAP users explained that work reports are sometimes inconsistent with actual work performed. Functions in RoadMAP only allow accomplishments to be reported to two decimal places even though some select work contracts require three decimal places. This creates inconsistencies and trouble in tracking of actual accomplishments and expenditures. Some maintenance activities also take place on multiple roads in multiple counties, but work reports only allow maintenance tasks to be reported on a single road in a single county. Some issues were also encountered while generating work report data. RoadMAP work reports require the reporting of each crew member, the type of equipment used, the labor hours spent, the location, the total accomplishment achieved, and the total resource cost of performing the task. The total resource cost is a calculation based on fixed rates for each laborer and piece of equipment. Half the Districts surveyed claimed that whenever a new employee is hired or a new piece of equipment is obtained, it can take several months before the new employee or equipment information appears in RoadMAP. In these cases, RoadMAP users recorded the new employee or equipment in the notes section of the report. These issues are not specific to any single Division, but rather across several Districts surveyed.

10
Some Districts also faced problems with RoadMAP’s budgeting tools. To request a budget for the coming year, RoadMAP users view the previous year’s budget and redistribute money by assigning percentage values for each of their budget categories. However, RoadMAP users claimed percentage values sometimes are not available in RoadMAP and must instead be reported through a different method. There were also several issues concerning sign inventory and inspection reporting. When reporting sign inspection, sign types are categorized into “warning signs” and “other signs”. Some users find distinguishing between these two types is arbitrary when reporting sign inspections. Reporting inspections in RoadMAP also requires reporting whether a sign is deficient or in good condition, which makes reporting sign inspection data a time consuming task. Although the average amount of time Districts surveyed claimed sign inspections takes approximately two weeks, inefficiencies in the inspection reporting process can require a two month reporting process. Lastly, users said work orders take too long to complete, and that RoadMAP’s connectivity speed as a whole is very slow. This led to two Districts not completing work orders and to four Districts implementing other forms of scheduling to replace work orders. Based on these findings, the research team was given a comprehensive understanding of maintenance practices and how RoadMAP is used and perceived. With this information, the research team was able to evaluate RoadMAP’s adaptation on the District level and notice any discrepancies between how maintenance operations are conducted and how they are reported 3.2 Discussion One of ALDOT’s purposes in acquiring a CMMS was to transition to performance based budgeting. The ALDOT Maintenance Bureau currently utilizes level of effort planning to generate budgets. As previously noted, this involves projecting budgets based on desired quantities of a desired activity. ALDOT intends to transition from level of effort budgeting to performance-based budgeting to better address statewide needs as they relate to condition assessment ratings. Survey results indicated that Districts rarely use performance guidelines set by the central office when assigning crew sizes for different maintenance activities. Due to limited personnel, supervisors tend to assign crews by day rather than activity. Therefore, a single crew may carry out multiple maintenance tasks in a day whether or not each maintenance task required the same crew size. As a result, activities are seldom assigned an appropriate crew size, and many maintenance activities exceed their estimated budget. Another challenge to performance based budgeting practices is that maintenance tasks generally do not have a set completion deadline. The standpoint of having no deadline to complete a task creates no reason for urgency, and therefore generates inefficiencies in maintenance operations. Many maintenance task accomplishments are measured in the CMMS as “crew hours” rather than a set quantity of work to be completed. Measuring accomplishments in crew hours with no completion dates can be misleading in the quantity of accomplishment produced for a specific work order and the required equipment and crew sizes for each maintenance task.

11
Because of the long processing time for new employees and new equipment rates into the system, work reports may reflect inaccurate manpower and wage data. As stated above, when an employee that worked on a maintenance task or a piece of equipment used on that task is still unavailable in the system, some users add their cost rates into the notes section of work reports; however, the notes section does not factor into the total resource cost of the work report for the maintenance activity. Other users assigned these employees or pieces equipment rates already available in RoadMAP which might not accurately display the actual amount the employee will be paid or the actual amount that was charged to use that piece of equipment. This makes some of the obtained maintenance data inaccurate in reporting the total resource costs expended on completing maintenance tasks. Therefore, a substantial amount of previously collected data could be misleading. These issues create challenges for ALDOT’s transition to performance based budgeting.
The survey results reported herein describing how District personnel currently utilize RoadMAP do not reflect the program’s intended use. However, these results portray the program’s usefulness and can aid in developing training methods which address inconsistencies and user errors for more reliable usage by RoadMAP personnel statewide.

12
Chapter 4 Data Analysis
After gaining an understanding of maintenance operations, as well as the nature of collected data and shortcomings of RoadMAP, the research team began to analyze the data exported from RoadMAP. 4.1 Background The research team was provided with RoadMAP work report data from 2012, 2013, and 2014. The work report data was in spreadsheets format and contained information for every work report submitted across the state within these years. Figure 1 is a snapshot of a work report spreadsheet.
Figure 1. RoadMAP generated spreadsheet
The columns depicted in Figure 1 represent the following data fields:
• Work Report Number: Unique number assigned to each maintenance task performed
• Report Date: Calendar date a maintenance activity work report was submitted • Activity Code: Coded designation of the type of maintenance task performed • District/Division: The ALDOT District and Division at which a maintenance
task was performed • Road Class: the type of road on which the maintenance task was performed

13
• Accomplishment/Work Unit: The amount of work completed by each maintenance task
• Crew Size: Number of laborers assigned to complete each task • Crew Hours: Number of labor hours spent completing each task • Resource Type: Type of resource reported for each task • Resource Rate: Amount of money charged per hour for each resource • Resource Total Cost: Total amount of money spent on each resource based on
rate and labor hours • Resource Description: Type of equipment used for to complete each
maintenance task The research team was also provided with the raw data collected in the field used to determine condition assessment ratings. Condition assessments are evaluations ALDOT provides each year to evaluate the condition of state assets (i.e., guardrail, signs, etc.). ALDOT employees across the state are tasked with measuring deficiencies within each of ALDOT’s asset groups (see Table 1). The data is then entered into spreadsheets with prepopulated formulas which generate a score (A, B-minus, etc.) for each asset’s condition. For example, to generate a score for statewide roads with regards to potholes, the amount of potholes per tenth of a mile is counted at randomly selected locations and reported in RoadMAP (the ALDOT Maintenance Bureau utilizes a formula to calculate the number of locations which must be rated in order to achieve a 95% confidence level on LOS Scorecards, then randomly selects locations to collect information). All of the pothole data across the state is then pooled together and entered into spreadsheets which generates raw scores. These raw scores are assigned ranges which represent different letter grades. For example, less than .1 potholes per mile receives a grade of an A+, between .1 and 1 potholes per mile receives A- or B+, and so on and so forth. Each asset group is assigned different ranges of scores to reflect typical scores for that group. These grades are based on the data collected from the sample set, and together they comprise ALDOT’s Level of Service (LOS) Scorecards. The scores are an important tool used to assess the condition of Alabama’s assets. The scores have been used in a portion of the research team’s analysis techniques. The following series of images depict an example of how LOS grades are created from raw condition assessment scores, as described above.

14
Figure 2. Example segment of ALDOT’s condition rating form
Figure 3. Raw condition assessment scores for number of potholes per mile

15
Figure 4. Letter grade scoring categories for each of ALDOT’s assets
Figure 5. LOS scorecard for statewide asphalt pavement
4.2 Methodology The existing organization of the data provided to the research team was difficult to interpret and unable to be used for analysis. Therefore it was necessary to organize the date in a more clear and efficient way. The following sections explain how Microsoft Excel pivot tables and the multiple

16
regression function in the SPSS statistical software multiple were used to analyze the data provided. 4.2.1 Excel Pivot Tables The research team used RoadMAP data from 2012, 2013, and 2014 as well as LOS Scorecards and condition assessment raw data from these years to analyze the data. Each year had hundreds of thousands of work reports encompassing multiple activity codes performed at multiple Divisions and Districts. Also, many work reports were broken into different rows by resources, making it complicated to perform any type of analysis. The existing organization of the data was impossible to decipher, so Excel pivot tables were used. Pivot tables allowed for work reports to be filtered by road type, location, Division, District, and date. Excel pivot tables also combined all of the data rows for one work report so that values like total resource costs and total crew size could be shown. The image below shows how Excel pivot tables helped organize data.
Figure 6. Excel Pivot Table of RoadMAP Data
4.2.2 Multiple Regression The maintenance team was tasked with finding ways in which SPSS could be used to aid the Bureau in moving toward performance based budgeting. The statistical function the research team selected for data analysis was multiple regression. Multiple regression is a function which allows for many independent variables to be correlated to a single dependent variable in a linear relationship. This tool is useful because it both shows the complicated interplay between each input to the output as well as any relationship between inputs while eliminating any overlap between input variables. Multiple regression was able to be applied as a budget analysis technique and later as a resource optimization technique, as outlined below.

17
4.3 Techniques The specific goal was to use this data to aid the Bureau in moving toward performance based budgeting. Therefore, the research team experimented with two new techniques which would utilize the RoadMAP data to this end: budgetary analysis and equipment efficiency comparison. 4.3.1 Budget Analysis The budget analysis method is a technique to evaluate ALDOT’s expenses compared to asset conditions. This technique compares the amount of money spent by each Division or District in a given year to each condition assessment score, enabling a correlation to be formed between expenditures and LOS score improvement. The research team first created pivot tables which isolated the annual expenditures of each District. Figure 7 shows how pivot tables were able to isolate each Divisions’ maintenance expenditures for the year 2013.

18
Figure 7. Sum of Resource Expenditures per ALDOT Division and District
This same method was used to isolate 2012 and 2014 expenditures so that yearly changes in expenditures could be shown. Alongside this data the raw condition assessment data can be entered. It was important to use raw condition assessment data instead of LOS scorecard grades in order to stay consistent with the grading scale used by each asset category.
Figure 8. Division Expenditures per year as reported by RoadMAP
Division Number District Number

19
This collection of data was then formatted in a way which made it easy to upload into SPSS. Once the data was uploaded onto SPSS, the multiple regression tool was used to create a linear correlation between District expenditures, the independent variables, and statewide level of service scores, the dependent variables. Out of the many statistics provided by SPSS’s linear regression tool, the value significant toward this analysis is the beta coefficient. The beta coefficient is a value which here represents the amount of change there was in each asset score per dollar spent at each Division or District. This coefficient is important because it shows how much money must be spent in order to get a desired amount of change in each LOS score. Furthermore, having beta coefficients for each District shows which Districts create the largest amount of change in score per dollar spent. From this tool, ALDOT can alter the budgets of previous years in accordance with their desired outcomes. The budget analysis technique is a good tool to use when deciding how to allocate money to different Districts. It shows the most direct relationship between inputs and outputs. However, there are things to consider before employing this technique fully. The budget analysis tool’s accuracy is contingent upon the reporting of every maintenance task as well as the accuracy of each work report. Because of this, RoadMAP data might not be the best reflection of how much money each District actually spends on maintenance. The Bureau might want to also use this technique with District budgets to get a better idea of how each District’s maintenance costs relate to improving statewide asset conditions. Each asset is graded on different scales based on the nature of their measured condition assessment data. Therefore, raw scores are not comparable to each other, making letter grades assigned to different types of assets completely unrelated to each other. Also, condition assessment data is taken from randomly chosen road segments, with the number of required segments calculated from a formula to obtain a 95% confidence interval on the condition assessment scores. Therefore, each asset grade represents the entire state’s conditions based on randomly selected road segments rather than an absolute measure of the state’s conditions. Thus, these techniques can only be used as an aid or suggestion when developing budgets rather than as a conclusive decision making tool. As there are only three years of data available, and these three years were an adjustment period for each District, the multiple regression technique applied herein is not realistically usable yet. However, it can continue to be applied and evaluated as a simple evaluation tool. The results will be more accurate with each coming year as more data are entered and available using RoadMAP. 4.3.2 Equipment Comparison The second technique developed by the research team was an equipment comparison technique. This technique allows an assessment of which pieces of equipment yield the most accomplishment and at the most efficient costs for different maintenance tasks. Before making equipment comparisons, it was important to first format the data in a way which allowed total quantities of each work report to be added together. Pivot tables were used again, which made viewing different scenarios and different pieces of equipment easier for the end user. However, a pivot table does not allow the total sum of resource costs as well as crew sizes and

20
hours to be viewed when work reports are sorted by equipment. Therefore, the Excel SUMIF function is also used to extract data from the original spreadsheets and organize it in a useful way. After the data was formatted in this way, different pieces of equipment were able to be compared. The pivot table shows every work report for every activity code, so first the maintenance task desired must be selected in the pivot table filter. Second, the types of equipment to be analyzed must be chosen. Once these criteria are chosen, the pivot table shows only work reports which match these activity codes and equipment types. The SUMIF columns then show the matching total resource costs, crew sizes, and labor hours, and accomplishments per dollar corresponding with these maintenance tasks. This method can be repeated for any activity code and any piece of equipment. Once these tables are created, multiple comparisons can be made. Graphical representations can also be generated to show which pieces of equipment are most efficient given under certain conditions and also for different criteria for comparison. The following figures are examples of comparisons made between equipment which may be helpful in determining which piece of equipment is more appropriate to use under certain conditions.
Figure 9. Graphical comparison: accomplishment per cost with a limited crew size
0
0.05
0.1
0.15
0.2
0.25
0.3
0 2 4 6 8 10 12 14
Acco
mpl
ishm
ent/
Cost
Crew Size
Equipment Comparison: Optimal Accomplishment per cost under crew size restraints
Equipment 1
Equipment 2
Linear (Equipment 1)
Linear (Equipment 2)

21
Figure 10. Graphical Comparison: accomplishment under time constraints
The equipment comparison technique discussed herein is a useful way to decide the efficiency of different types of equipment for different levels of accomplishment. The technique can be beneficial to the Maintenance Bureau in assigning pieces of equipment to different Divisions of the state based on their work load. The method is good because it is a reflection of real maintenance data. However, this maintenance data might not always be very accurate. The equipment comparison method’s accuracy depends on the efficiency of each crew size assigned to a maintenance task as well as the amount of time spent on a maintenance task. The values provided likely do not reflect the most optimal combination of money spent, crew sizes, and labor hours. Therefore, the results of these comparisons show actual working conditions rather than ideal working conditions. Though it may be argued that this is better for the accuracy of each comparison, the end-goal of this study is to improve efficiency, not to report on current conditions.
0
50
100
150
200
250
300
0 20 40 60 80 100 120
Acco
mpl
ishm
ent
Time (hours)
Accomplishment per Hour Comparison
Equipment 1
Equipment 2
Linear (Equipment 1)
Linear (Equipment 2)

22
Chapter 5 Conclusion
RoadMAP is collecting a large amount of data which can be valuable for analysis. In this study, researchers first evaluated statewide maintenance operations and utilization of this program. After doing so, the researchers used the RoadMAP data to create a framework for a budget analysis technique and discover ways to compare equipment work and cost efficiencies. These tools can be used on any level of organization within the ALDOT Maintenance Bureau from District-level to the central office. However, these techniques should be only used at their recommended levels. These techniques should simply aid in decision making rather than being the sole vessel for decision making. Further, because these methods rely on the accuracy of data, and there is a scarcity of available years of real data, these methods should be implemented gradually and adjusted accordingly with the Maintenance Bureau’s needs. Still, these tools can be quite useful and serve as a good cornerstone for a gradual shift to performance based budgeting. The purpose of this research study was to discover ways in which ALDOT can utilize RoadMAP data using the SPSS statistical software program, while at the same time not causing too much strain on their current processes. There is opportunity to expand from the work presented herein. Additional techniques can be formulated from the RoadMAP data. Also, work report and condition assessment data can be used to forecast future conditions and budgetary needs. Additional techniques would further help ALDOT move toward performance based budgeting. Expanding on the tools presented here, District managers could predict future personnel and equipment needs based on anticipated maintenance tasks as well as optimal resource combinations. This would allow District managers to assemble more accurate budgets which reflect their previous levels of output and cost efficiency. RoadMAP work report data could also help District managers formulate future activity schedules. Work report data includes the date of each maintenance activity as well as labor hours needed to accomplish each activity, so this should aid District managers to anticipate the duration of maintenance tasks as well as to optimize their work production rate.

23
References
1. Federal Highway Administration. Asset Management Data Collection for Support Decision Processes. FHWA. https://www.fhwa.dot.gov/asset/dataintegration/if08018/amdc_00.cfm Accessed July 30, 2015.
2. Amekudzi, A.A., R. Shelton, and T.R. Bricker, Infrastructure Rating Tool: Using Decision Support Tools to Enhance ASCE Infrastructure Report Card Process. Leadership and Management in Engineering, Vol. 13, Issue 2, 2013, pp. 76-82.
3. Markow, M. J., Highway Management Systems: State of the Art. Journal of Infrastructure systems 1, No. 3, 1995, pp.186-191.
4. Nemmers, C. Transportation Asset Management. Federal Highway Administration Vol. 6, No. 1, 1997.
5. Vanier, D.J., Why Industry Needs Asset Management Tools. Journal of Computing in Civil Engineering Vol. 15, No.1, 2001, pp. 35-43.
6. Switzer, A., S. Mcneil, Developing a Road Map for Transportation Asset Management Research. Publics Works Management & Policy, Vol. 6, No.3, 2004, pp.162-175.
7. Labib, A.W., A Decision Analysis Model for Maintenance Policy Selection Using a CMMS. Journal of Quality in Maintenance Engineering, Vol. 10, Iss. 3, 2004, pp. 191-202.
8. Tretten, P., and R. Karim, Enhancing the Usability of Maintenance Data Management Systems. Journal of Quality in Maintenance Engineering, Vol. 20, Iss. 3, 2014, pp. 290-303.
9. Crain, M., (2003), The Role of CMMS in Industrial Technologies. Northern Digital, Inc. Bakersfield, California, http://www.plant-maintenance.com/articles/Role_of_CMMS.pdf. Accessed July 30, 2015.
10. Cohen, T., The Basics of CMMS. Biomedical Instrumentation & Technology, Vol. 48, No. 2, 2010, pp.117-121.
11. Swanson, L., Computerized Maintenance Management Systems: A Study of System Design and Use. Production and Inventory Management Journal 38.2, 1997, pp.11-15.
12. Kans, M., An Approach for Determining the Requirements of Computerized Maintenance Management Systems. Computers in Industry 59, 2008, pp. 32–40.
13. Shahin, A., and A.M. Ghazifard, Radio Frequency Identification (RFID): A Technology for Enhancing Computerized Maintenance System (CMMS). New Marketing Research Journal Special Issue, 2013, pp. 13-20.
14. Lewis, V.B., Toward a theory of budgeting. Public Administration Review, Vol. 12, No.1, 1952, pp.42-54.
15. Carter, K., The Performance Budget Revisited: A Report on State Budget Reform. Legislative Finance Paper #91, Denver, National Conference of State Legislatures, pp. 2-3 as cited in Young, R.D. Performance-Based Budget Systems. Public Policy & Practice, 2003, pp. 12.
16. Segal G., and A. Summers, Citizens’ Budget Reports: Improving Performance and Accountability in Government, Reason Public Policy Institute. Policy Study No. 292, March 2002, pp. 4.
17. Golabi, K., R.B. Kulkarni, and G.B. Way., A Statewide Pavement Management System. Interfaces 12, 1982, pp. 5-21.

24
18. Fallah-Fini, S., K. Triantis, H. Rahmandad, and J. M. de la Garza, Measuring Dynamic Efficiency of Highway Maintenance Operations. Omega, Vol. 50, 2015, pp. 18-28.
19. Ozbek, M.E., and J.M. de la Garza, Comprehensive Evaluation of Virginia Department of Transportation’s Experience with its First Performance-Based Road-Maintenance Contract. Journal of Transportation Engineering, Vol. 137, No. 12, 2011, pp. 845-855.
20. Mann Jr, G. Knapp, R. Avent, J. Metcalf, Determination of Appropriate Funding for Maintenance. For Louisiana Transportation Research Center, 1997.
21. Ryu, J.E. Performance-Based Budgeting (PBB), Allocative Efficiency, and Budget Changes: The Case of the U.S. Department of Commerce. Public Finance and Management, Vol. 13 No. 4, 2013, pp. 335-360.
22. Ozbek, M., J.M. de la Garza, and K. Triantis, Data and Modeling Issues Faced During the Efficiency Measurement of Road Maintenance Using Data Envelopment Analysis. Journal or Infrastructure Systems, Vol. 16, No. 1, 2010, pp. 21–30.
23. Ram, P. V., and D. G. Peshkin, Performance and Benefits of Michigan Department of Transportation’s Capital Preventive Maintenance Program. Transportation Research Record: Journal of the Transportation Research Board No. 2431, 2014, pp. 24-32.

Executive Committee
Dr. Jay K. Lindly, Director UTCA The University of Alabama
Dr. Steven Jones, Associate Director UTCA
The University of Alabama
Dr. Fouad H. Fouad, Associate Director UTCA The University of Alabama at Birmingham
Dr. Houssam A. Toutanji, Associate Director UTCA
The University of Alabama in Huntsville
Staff
Ms. Connie Harris, Secretary UTCA
Contact Information
University Transportation Center for Alabama 1105 Bevill Building
Box 870205 Tuscaloosa, AL 35487-0205
(205) 348-9925 (205) 348-6862 fax
http://utca.eng.ua.edu
University Transportation Center for Alabama