maize morphophysiological responses to intense crowding ... · donni and otegui, 2006; borrás et...
TRANSCRIPT
Corn
1426 Agronomy Journa l • Volume101, I s sue6 • 2009
Published in Agron. J. 101:1426–1452 (2009)Published online 17 Sept. 2009doi:10.2134/agronj2009.0082Freely available online through the author-supported open access option.Copyright © 2009 by the American Society of Agronomy, 677 South Segoe Road, Madison, WI 53711. All rights reserved. No part of this periodical may be reproduced or transmitted in any form or by any means, electronic or mechanical, including photocopying, recording, or any in-formation storage and retrieval system, without permission in writing from the publisher.
Grain yields of modern commercial maize hybrids greatly exceed those of their predecessors (Duvick, 2005;
Lee and Tollenaar, 2007). In the United States, mean com-mercial grain yield increased from ~1.5 Mg ha–1 in the 1930s to ~8.5 Mg ha–1 at the end of the last century. Dramatic rates of yield improvement have also been documented in Argentina, Canada, France, and Germany within the latter half of the 20th century (Duvick, 2005). Yield increases in maize have been largely attributed to genetic gains made by public and private breeders, and to superior agronomic-management practices increasingly adopted by growers, with 50 to 70% of the observed yield improvement due to improved genetics and 30 to 50% due to superior agronomic-management practices (Cardwell, 1982; Duvick, 2005; Lee and Tollenaar, 2007). However, in actuality, nearly all prior yield advances in maize have resulted from the interaction between improved genetics and superior agronomic-management practices (Tollenaar and Lee, 2002).
Environmental stress tolerance has been recognized as the physiological trait most strongly linked with the genetic improvement of maize hybrids for grain production (Tollenaar and Wu, 1999). Modern genotypes generally have a greater tolerance to insect feeding; pathogen infection; drought; low soil fertility; saturated and/or cool soils; above- and below-average seasonal temperatures; low night temperatures during the grain-filling period; and inter- and intraspecific competi-tion (i.e., maize-weed and maize-maize interactions, respec-tively) for solar radiation, water, and soil nutrients (Dwyer and Tollenaar, 1989; Tollenaar et al., 1997; Tollenaar and Wu, 1999; Ying et al., 2000; Duvick, 2005). The tolerance of maize to intense intraspecific competition for available resources at high plant densities has improved more than many other environmental stress tolerances over the past 40 to 50 yr (Russell, 1991; Tollenaar, 1991; Tollenaar and Lee, 2002; Tokatlidis and Koutroubas, 2004). This progress has been principally driven by maize breeders selecting for grain yield
ABSTRACTMounting concerns over the cost and environmental impact of N fertilizer combined with progressively higher plant densities in maize (Zea mays L.) production systems make progress in maize N use efficiency (NUE) and N stress tolerance essential. The primary objectives of this 3-yr field study were to (i) evaluate the N responsiveness, NUE, and N stress tolerance of multiple modern maize genotypes using suboptimal, optimal, and supraoptimal plant densities (54,000, 79,000, and 104,000 plants ha–1, respectively) with three levels of side-dress N (0, 165, and 330 kg N ha–1), (ii) identify key morphophysiological responses to the simultaneous stresses of intense crowding and low N availability, and (iii) consider our results with extensive reference to literature on maize morphophysiological responses to plant crowding and N availability. At optimal and supraoptimal plant densities, maize receiving 165 kg ha–1 of side-dress N displayed strong N responsiveness, high NUE, pronounced crowding toler-ance, and plant density independence. However, crowding tolerance was contingent on N application. Relative to less crowded, N-fertilized environments, the 104,000 plants ha–1, 0 kg N ha–1 treatment combination exhibited (i) reduced pre- and postan-thesis plant height (PHT), stem diameter (SD), and total biomass; (ii) greater preflowering leaf senescence and lower R1 leaf areas at individual-leaf, per-plant, and canopy levels; (iii) enhanced floral protandry; (iv) lower pre- and postanthesis leaf-chlorophyll content; (v) lower per-plant kernel number (KNP), individual kernel weight (KW), grain yield per plant (GYP), andharvest index per plant (HIP); and (vi) enhanced per-plant grain yield variability (GYCV). Genetic efforts to improve high plant density toler-ance should, therefore, simultaneously focus on enhancing NUE and N stress tolerance.
C.R. Boomsma, Dow AgroSciences, 2310 County Road/1050 North, Homer, IL 61849; J.B. Santini and T.J. Vyn, Agronomy Dep., Purdue Univ., 915 W State Street, West Lafayette, IN 47907-2054; M. Tollenaar, Dep. of Plant Agriculture, Univ. of Guelph, Guelph, ON N1G 2W1 Canada. Received 27 Feb. 2009. *Corresponding author ([email protected]).
Abbreviations: ACRE, Purdue University Agronomy Center for Research and Education; ASIP, per-plant anthesis–silking interval; b, a coefficient that describes the breadth/kurtosis of the distribution of green leaf area; GDD, growing degree days; GYA, per-unit-area grain yield; GYCV, per-plant grain yield variability; GYP, per-plant grain yield; GYSA, per-plant sampling area grain yield; HI, harvest index; HIP, per-plant harvest index; KNP, per-plant kernel number; KW, individual kernel weight; LAD, per-plant green leaf area distribution; LAn, fully expanded individual leaf area; LAP, per-plant green leaf area; LÁT, per-plant green leaf area of tagged, nondestructively sampled plants; LAIG, green leaf area index; NLT, total number of green leaves per plant; NR, nitrogen application rate; NUE, nitrogen use efficiency; PDA, personal digital assistant; PHT, plant height; PPAC, Pinney-Purdue Agricultural Center; SD, stem diameter; SPAD, single-photon avalanche diode; TBP, aboveground per-plant total biomass; VBP, aboveground per-plant vegetative biomass; xe, earleaf position; xH, position of the highest green leaf; xL, position of the lowest green leaf; xo, position of the largest leaf.
MaizeMorphophysiologicalResponsestoIntenseCrowding andLowNitrogenAvailability:AnAnalysisandReview
ChristopherR.Boomsma,JudithB.Santini,MatthijsTollenaar,andTonyJ.Vyn*
Agronomy Journa l • Volume101, Issue6 • 2009 1427
and/or beneficial morphophysiological traits in environments commonly encountered in commercial maize production. This has included selection at high plant densities (Duvick and Cassman, 1999; Tollenaar and Lee, 2002; Fasoula and Tollenaar, 2005; Lee and Tollenaar, 2007). Thus, to optimize grain production and maximize grain yield potential in today’s production systems, modern hybrids must be grown at higher plant densities than their predecessors (Tollenaar, 1989; Tokat-lidis and Koutroubas, 2004).
Many morphophysiological traits that were either directly or indirectly selected for by maize breeders are now character-istic of today’s commercial genotypes (Duvick and Cassman, 1999; Tollenaar and Lee, 2002). Traits such as greater green leaf area index (LAIG) at silking [i.e., R1 (Ritchie et al., 1996)], improved radiation use efficiency, reduced dry matter parti-tioning to the tassel, less temporal separation between anthesis and silking, greater postsilking dry matter accumulation, and delayed leaf senescence during the grain-filling period [i.e., visual (leaf greenness) and/or functional (photosynthetic) stay-green (Lee and Tollenaar, 2007)] are often more evident among modern hybrids in both suboptimal and optimal conditions (Tollenaar, 1991; Tollenaar and Aguilera, 1992; Rajcan and Tollenaar, 1999a; Tollenaar and Wu, 1999; Sangoi et al., 2002; Valentinuz and Tollenaar, 2004; Duvick, 2005; Tollenaar and Lee, 2006; Lee and Tollenaar, 2007). Per-plant total leaf area has not generally changed since the 1930s (Duvick, 1997), so improvements in early-, mid-, and late-season LAIG are the result of improved crowding tolerance (Tollenaar and Lee, 2002; Lee and Tollenaar, 2007). Other morphophysiological traits specifically associated with the improved crowding toler-ance of modern genotypes include reduced root and/or stem lodging, shorter leaf length, increased vertical leaf angle, and greater leaf reorientation in response to intraspecific competi-tion. Such attributes have improved light interception, canopy photosynthesis distribution, and, consequently, dry matter accumulation and grain production of modern hybrids in crowded environments (Girardin and Tollenaar, 1994; Duvick and Cassman, 1999; Sangoi et al., 2002; Tollenaar and Lee, 2006; Hammer et al., 2009). As suggested through the recent modeling efforts of Hammer et al. (2009), the enhanced high plant density tolerance of modern North American hybrids may be strongly related to changes in root system architecture, which have improved water capture at greater soil depths. Whether the harvest index (HI) of maize genotypes has improved over time is still uncertain. Duvick (2005) contends that newer commercial genotypes exhibit a higher HI than older ones when plants are subjected to biotic stresses that promote barrenness, but in general, HI has not improved when modern hybrids are grown at their respective optimal plant densities. Similarly, Tollenaar and Lee (2002, 2006) and Tol-lenaar et al. (2000) suggest a lack of improvement in the HI of North American hybrids, with HI generally static at 0.5 (typi-cal range of 0.48 to 0.52) during the past 60 to 65 yr. On the contrary, Echarte and Andrade (2003) and Luque et al. (2006) report an increase in HI among Argentine hybrids. Tollenaar et al. (2000) similarly discuss an improvement in HI among tropical maize genotypes as a result of genetic improvement.
A roughly parabolic relationship exists between plant density and per-unit-area grain yield (GYA) (Tokatlidis and
Koutroubas, 2004). A plant density therefore exists for each environment (i.e., production system) that maximizes resource capture and utilization and, consequently, grain production. At suboptimal plant densities, the addition of more plants compen-sates for an accompanying decline in GYP due to intraspecific competition, leading to an overall increase in GYA. Yet at supraoptimal plant densities, further crowding cannot offset reductions in GYP resulting from intense intraspecific com-petition, leading to a general decline in GYA (Tollenaar and Wu, 1999). Overall reductions in GYA at supraoptimal plant densities are often associated with a variety of morphophysio-logical responses including, but not limited to, (i) reductions in per-plant photosynthesis and shoot and (more pronouncedly) ear growth during the critical period bracketing silking [i.e., approximately 15 d before to 15 d after silking (Andrade et al., 1999; Echarte and Tollenaar, 2006)], (ii) minor and major delays in the time to anthesis and silking, respectively, (iii) declines in aboveground per-plant total biomass (TBP) and overall biomass partitioning to the ear (i.e., HI), (iv) an increase in barrenness, and (v) a rise in plant-to-plant variability for PHT, pre- and postsilking TBP, floral protandry, KW, KNP, and GYP (Glenn and Daynard, 1974; Bunce, 1990; Otegui, 1997; Tollenaar and Wu, 1999; Tollenaar et al., 2000; Maddonni and Otegui, 2004; Tokatlidis and Koutroubas, 2004; Andrade and Abbate, 2005; Hashemi et al., 2005; Mad-donni and Otegui, 2006; Borrás et al., 2007).
Besides exhibiting superior tolerance to high plant densi-ties, modern hybrids demonstrate a greater responsiveness to a variety of inputs including irrigation, pesticide application, and fertilizer use (Russell, 1991; Tokatlidis and Koutroubas, 2004). In particular, current hybrids are more responsive to N fertil-izer than their predecessors in both low and high soil-N envi-ronments. For example, in a study involving 12 hybrids from three eras (1970s, early 1990s, late 1990s), O’Neill et al. (2004) found that early- and late-1990s-era hybrids exhibited larger yield responses to N application than 1970s-era hybrids. The greater responsiveness of post-1970s-era hybrids to N applica-tion has encouraged relatively high N fertilization rates among maize growers for the past roughly three decades (Cardwell, 1982; Duvick, 2001; USDA-ERS, 2008). Application of N in maize triggers a complex array of morphophysiological responses. At the per-plant and canopy levels of organization, these include, but are not restricted to, greater PHT, SD, dry matter production, leaf N concentration, LAIG, KNP, GYP, and GYA in addition to delayed leaf senescence (Ogunlela et al., 1988; Jacobs and Pearson, 1991; McCullough et al., 1994b; O’Neill et al., 2004; Ding et al., 2005; Subedi and Ma, 2005b).
In addition to improved N responsiveness, some studies suggest greater NUE and enhanced N stress tolerance among modern hybrids (e.g., McCullough et al., 1994a, 1994b; Ma and Dwyer, 1998; Ding et al., 2005; Coque and Gallais, 2007). According to Moll et al. (1982), NUE can be defined as the amount of grain produced per unit of available soil N (includ-ing fertilizer). Grain NUE can be more thoroughly expressed as the product of N-uptake efficiency (N uptake per unit available soil N) and N-utilization efficiency (grain production per unit absorbed N) (Moll et al., 1982; Coque and Gal-lais, 2007). Using an 15N-labeling approach, Ma and Dwyer (1998) found that prior genetic improvement for NUE (when

1428 Agronomy Journa l • Volume101, Issue6 • 2009
defined as the ratio of the amount of 15N recovered in grain or stover to the amount of fertilizer 15N applied to the soil) was primarily associated with greater N uptake and improved dry matter production during the grain-filling period. Discussing genetic progress for NUE among European maize varieties, Coque and Gallais (2007) similarly attribute prior advances in NUE [when defined according to Moll et al. (1982)] to greater postsilking N uptake in both low N and high N environ-ments. They also suggest potential genetic improvement for grain N-utilization efficiency. Advances in low N tolerance are evident for multiple physiological traits. For example, relative to older genotypes under N stress conditions, newer hybrids exhibit a higher C exchange rate per unit leaf N, greater N uptake capacity, improved leaf C exchange rate and higher leaf chlorophyll content during the grain-filling period, and greater KNP (McCullough et al., 1994a, 1994b; Ding et al., 2005; Coque and Gallais, 2007; Echarte et al., 2008). Despite these reported advances in NUE and N stress tolerance, recent genetic improvements for these traits have been neither consis-tently observed nor heavily studied. Furthermore, reductions in GYA for modern hybrids are still substantial when soil N is deficient (O’Neill et al., 2004).
Since approximately 50 to 60% of foliar N in maize is associated with chloroplasts (Hageman, 1986), a large amount of acquired N contributes to the maintenance of photosyn-thesis. Foliar responses to N deficiency are therefore typically pronounced and often strongly associated with GYA. Such responses commonly include reductions in total leaf area, leaf expansion and duration, leaf N and chlorophyll content, leaf stomatal conductance, and photosynthesis per unit leaf area (Wolfe et al., 1988a, 1998b; McCullough et al., 1994a, 1994b; Paponov and Engels, 2003; Monneveux et al., 2005; Echarte et al., 2008). These responses reduce radiation interception, radia-tion use efficiency, and, resultantly, crop growth and dry matter accumulation (McCullough et al., 1994a, 1994b; Uhart and Andrade, 1995b; Paponov and Engels, 2003, 2005; Paponov et al., 2005a; Echarte et al., 2008). With source activity dimin-ished in low N situations, dry matter partitioning to reproduc-tive sinks markedly decreases, silk growth commonly slows, kernel abortion often rises, and KW, KNP, GYP, and HIP con-sequently fall (Jacobs and Pearson, 1991; Uhart and Andrade, 1995c; Below et al., 2000; Tollenaar et al., 2000; O’Neill et al., 2004; Ding et al., 2005; Monneveux et al., 2005).
As N fertilizer costs remain relatively high, environmental concerns over excessive N application increase, and recom-mended plant densities move progressively higher, it is crucial that the N responsiveness, NUE, and N stress tolerance of current maize germplasm continue to be investigated and improved. Fundamental to future genetic improvement efforts is an understanding of the morphophysiological responses of modern commercial maize genotypes to deficit and adequate N availability at various plant densities. No studies to date have intensively examined the per-plant and canopy-level morphophysiological responses of modern, stress-tolerant, highly productive, North American maize hybrids to the simultaneous stresses of intense crowding and low fertilizer N availability. Thus the primary objectives of this work were to (i) evaluate the N responsiveness, NUE, and N stress toler-ance of multiple modern maize genotypes using agronomic
suboptimal, optimal, and supraoptimal plant densities in conjunction with three levels of side-dress N fertilization, (ii) identify key, yield-determining morphophysiological responses to the simultaneous stresses of intense crowding and low N availability through intensive measurement of numerous per-plant and canopy-level morphophysiological parameters, and (iii) provide an in-depth analysis of our experimental results through an extensive review of literature related to maize C and N physiology and metabolism. Secondary objectives for this study were to (i) investigate if the HI of certain modern, N-responsive, North American maize hybrids now potentially exceeds 0.5 when such genotypes are grown at their optimal plant densities with high N availability and (ii) develop, imple-ment, and validate an accurate, rapid, low-cost, nondestructive technique for determining the green leaf area (LAP) and green leaf area distribution (LAD) of individual maize plants (~4000 plants per year) at silking.
MATERIALS AND METHODSCultural Practices, Experimental Design,
and TreatmentsResearch during the 2005, 2006, and 2007 growing seasons
was conducted at the Purdue University Agronomy Center for Research and Education (ACRE) (40°28´07˝ N, 87°00´25˝ W) near West Lafayette, Indiana. From 1971 to 2000, the location averaged approximately 946 mm of precipitation and 1971 growing degree days (GDD) on an annual basis. The soil, which developed under prairie vegetation, was a Chalm-ers (fine-silty, mixed, mesic Typic Endoaquoll) silty clay loam with approximately 4.0 to 4.5% organic matter content in the top 30 cm of the soil profile and a pH of approximately 6.2. The experimental area has less than 2% slope and was systematically tile drained at 20-m intervals. In each year, maize was grown following no-till soybean [Glycine max (L.) Merr.]. Strip-tillage was performed in the fall of each year using a Remlinger six-row unit (Remlinger Manufacturing, Kalida, OH). Planting was done directly onto the strips the subsequent spring using a six-row John Deere 1780 planter (Deere & Company, Moline, IL) with electronic variable seeding rate controls, vacuum seed metering, and tined row cleaners ahead of each planting unit. In 2006 and 2007, both strip-tillage and planting were performed using a John Deere StarFire Real-Time Kinematic (Deere & Company, Moline, IL) automatic guidance system. Complete weed control was obtained with burndown, preemergence, and postemergence herbicides in addition to hand weeding. The insecticide Force 3G [Tefluthrin, (2,3,5,6-tetrafluoro-4-methylphenyl)methyl-(1a,3a)-(Z)-(±)-3-(2-chloro-3,3,3-trifluoro-1-propenyl)-2,2-dimethylcyclopropanecarboxylate, Syngenta Crop Protection, Inc., Greensboro, NC] was applied at planting. In 2005 and 2006, the insecticide Warrior T [λ-cyhalothrin ([1α(S*),3α(Z)]-(±)-cyano-(3-phenoxyphenyl)methyl-3-(2-chloro-3,3,3-trifluoro-1-propenyl)-2,2-dimethylcyclopropanecarboxylate), Syngenta Crop Protection, Inc., Greensboro, NC] was aerial-applied at silking to limit silk-feeding by western corn root-worm (Diabrotica virgifera virgifera LeConte) and Japanese beetle (Popillia japonica Newman) populations. Postplanting insecticide application was unnecessary in 2007 and fungicide application was deemed unnecessary in all years.
Agronomy Journa l • Volume101, Issue6 • 2009 1429
The study was arranged as a split-split plot design with four blocks. Hybrid (main plot), plant density (subplot), and N application rate (sub-subplot) served as the three treatment factors. Each sub-subplot consisted of six rows (76-cm inter-row spacing) and was approximately 4.5 m in width and 30.5 m (2005, 2007) or 27.5 m (2006) in length. Two hybrids were planted each year: Pioneer 33N09 [1529 GDD to R6, Com-parative Relative Maturity (CRM) of 114] in 2005; Pioneer 31G68 (1585 GDD to R6, CRM of 118) in 2005, 2006, and 2007; and Pioneer 31N28 (1630 GDD to R6, CRM of 119) in 2006 and 2007 (Pioneer Hi-Bred Intl., Inc., Johnston, IA). Hybrid Pioneer 31N28 replaced Pioneer 33N09 after 2005 since the former possessed the YieldGard Corn Borer trait (Monsanto Company, St. Louis, MO) and was more similar to Pioneer 31G68 with respect to ontogeny, phenology, morphol-ogy, relative maturity, and optimal plant density than was Pio-neer 33N09. In all years, planting rates were 58,000, 83,000, and 108,000 seeds ha–1 to achieve the desired final plant densi-ties of 54,000, 79,000, and 104,000 plants ha–1. Plant density measurements at V6 rarely differed from target plant densities by more than 3% (data are not shown). As suggested through multilocation, multienvironment testing by Pioneer Hi-Bred International, Inc., these final plant densities respectively corresponded to agronomic (based on maximum GYA) and economic (based on gross income less seed cost) suboptimal, optimal (approximately), and supraoptimal levels for each of this study’s hybrids (D. Rule, personal communication, 2008). Such plant densities therefore provided highly contrasting levels of per-plant resource availability and, consequently, vary-ing levels of intraspecific competition. For all sub-subplots in each year, starter fertilizer (10–34–0) was applied at planting 5 cm to the side and 5 cm below the seed at a rate equivalent to 25 kg N ha–1. Urea Ammonium Nitrate (UAN) (28–0–0) was applied via side-dressing at a rate equivalent to 165 kg N ha–1 once (V3), twice (V3, V5), or not at all, depending on each sub-subplots’ prescribed N application rate. Recent N rate trials on similar soils at ACRE in 2006, 2007, and 2008 have found the average agronomic optimal N rate (i.e., N rate that produces maximum GYA) for a soybean-maize rotation to be roughly 160 kg N ha–1 (J.J. Camberato, personal communica-tion, 2008). In general, the 0, 165, and 330 kg ha–1 side-dress N rates were chosen for investigating this study’s primary and secondary objectives because they theoretically provided (i) an environment with markedly high N stress, (ii) an N application rate similar to that used by local commercial maize grow-ers, and (iii) an environment with little to no N limitations, respectively. Chosen side-dress N rates therefore provided highly contrasting levels of per-plant resource availability and, consequently, varying levels of intraspecific competition.
In each year, five 2-cm-diam. soil cores were taken at V4 and V8 in each sub-subplot receiving only starter fertilizer. Samples were collected from the 0- to 30-cm depth (no subdivisions) in the interrow areas on each side of the third and fourth rows (at least 25 cm from any row). All samples were air-dried and sent to A&L Great Lakes Laboratories, Inc. (Fort Wayne, IN) for determination of soil nitrate (NO3
––N) and ammonium (NH4
+–N) concentrations. In brief, soil samples were dried for 12 h at 40°C, crushed with a flail-type grinder, and sieved through a U.S. No. 10 sieve (2 mm). A portion of each sample
was extracted with 1 N KCl. Extracts were analyzed for NO3–
–N by NO3– reduction and for NH4
+–N by the phenolate method (based on the Bertholot reaction) (A&L Great Lakes Laboratories, Inc., personal communication, 2008). In all years of this study, soil NO3
––N levels were between 3 and 13 ppm for all sub-subplots—values well below appropriate critical NO3
––N levels (Brouder and Mengel, 2003). Thus side-dress N application was warranted in every year. Through appropri-ate fertilization, all other nutrients were kept nonlimiting.
In all years, nondestructive per-plant sampling areas (4 m in length) were established in rows three and four of each six-row sub-subplot. Within each of the designated sampling areas, individual plants (~35–70 per sampling area depending on plant density, ~4000 in total per year) were tagged with indi-vidually numbered barcodes formatted for use with a barcode-scanning personal digital assistant (PDA) outfitted with MaizeMeister Phenotypic Data Collection and Seed Manage-ment System software. To accurately measure the ontogeny and phenology of each year’s approximately 4000 tagged plants, orange paint was lightly applied to the tip of each plant’s fourth leaf (leaves numbered from the bottom of the plant upward) at V4. When plants reached V8, bar-coded tags were stapled around the stem above the eighth leaf. As lower leaf senescence progressed, tags were moved above the 12th leaf, where they remained for the remainder of each growing season. Extensive nondestructive morphophysiological measurements were taken on these plants from seedling emergence through physiological maturity, with special attention given to limiting soil compac-tion from foot traffic. However, only a subset of all measured morphophysiological parameters is discussed here.
Weather Measurements
From 1 April to 1 October of each year, precipitation, minimum air temperature, and maximum air temperature were recorded on a daily basis at ACRE (<0.5 km from the study area) to examine the effects of these weather variables on crop phenology and physiology. The modified GDD formula was used to calculate the number of GDD accumulated during this 6-mo period for each growing season. The GDD measure of thermal time was chosen for this study since it is the most com-monly used method in the U.S. Corn Belt for describing maize growth and development. Using the modified GDD formula, accumulated GDD was calculated as follows for any given date:
Accumulated GDD = ( ){ }max min B T T /2 – Tn
i m=
+ ∑ [1]
where Tmax is the daily maximum air temperature (with an upper limit of 30°C), Tmin is the daily minimum air tempera-ture (with a lower limit of 10°C), TB is equal to 10°C, m is the first day of recorded air temperature data (1 April), and n is the last day of available recorded air temperature data (Cross and Zuber, 1972; Bollero et al., 1996; Dwyer et al., 1999).
Morphophysiological Measurements
In each year, PHT was determined at V5, V14, and R1. At V5 and V14, PHT was measured as the distance from the soil surface to the uppermost extended leaf tip. However, PHT at R1 was measured as the distance from the soil surface to the

1430 Agronomy Journa l • Volume101, Issue6 • 2009
collar of the uppermost leaf. Internode elongation was minimal to nonexistent after R1 (c.f., Siemer et al., 1969; Fournier and Andrieu, 2000), resulting in little to no change in PHT between R1 and R6. At V14 (2005–2007), R1 (2007), R3 (2005–2007), and R6 (2005–2007), the SD of tagged plants was measured as the maximum diameter at the midpoint of the sixth internode (i.e., between Leaves 6 and 7). For a very limited number of exceptionally small and/or malformed plants without a defined sixth internode, maximum SD was determined at the internode above the stem base. All measure-ments were taken using a Mitutoyo ABSOLUTE Digimatic 500–171 caliper (Mitutoyo America Corporation, Aurora, IL) connected to a PDA equipped with DataGet software (Baxter Codeworks, 2004).
Single-photon avalanche diode (SPAD) measurements were taken on all tagged plants using a Konica Minolta SPAD-502 Chlorophyll Meter (Konica Minolta Sensing Americas, Inc., Ramsey, NJ). Numerous studies in maize have indicated that SPAD readings can provide (i) a rapid, accurate, indirect indication of leaf N and chlorophyll content (e.g., Dwyer et al., 1991, 1995a, 1995b) and (ii) an accurate nondestructive measure of leaf absorptance (once the relationship between SPAD readings and leaf absorptance has been determined for a particular meter) (Earl and Tollenaar, 1997). For this experi-ment, three SPAD measurements were taken on the 12th leaf of each plant at V14. At R1, R3, and R5, three readings were collected on each plant’s uppermost earleaf. When plants did not have a fully developed ear or earshoot, SPAD readings were taken on the leaf subtending the barren earshoot or on the 12th leaf, respectively. On extremely small plants, measure-ments were taken on the uppermost, fully extended leaf. For all plants, SPAD measurements were taken on the middle third of the appropriate leaf (Chapman and Barreto, 1997), spaced along the midrib by 5 cm, and collected approximately 2 cm from the leaf margin. Nonrepresentative necrotic areas were intentionally avoided during data collection.
In both 2006 and 2007, the temporal separation between anthesis and silking was determined for all tagged plants [i.e., per-plant anthesis–silking interval (ASIP)]. Anthesis and silking were respectively defined as the beginning of pollen shed from the tassel (i.e., dehiscence of at least one anther and subsequent dispersal of pollen) and the appearance of the first pollen-receptive (stigmatic) style (i.e., silk) from the husk of the primary ear (Borrás et al., 2007). Throughout the flowering period, measurements of anthesis and silking were taken on a daily basis during mid to late afternoon. In all instances, treat-ment values for ASIP were calculated using the average of ASIP values for a given sampling area.
At physiological maturity in all 3 yr, the ears of plants in the per-plant sampling areas were hand-harvested and individually bagged with their respective tags. Grain was separated from each cob individually using an electric sheller. Per-plant grain samples were individually weighed, and the moisture content of each sample was determined using a Farmex MT3 portable moisture meter (Farmex, Streetsboro, OH). Per-plant grain weights were calculated to both 0% and 15.5% (GYP) mois-ture content. The grain yield of each sub-subplot’s per-plant sampling area (GYSA) was determined as the sum of GYP values for that respective area. Plant-to-plant variability for
grain production (GYCV) was calculated on a sub-subplot basis as the coefficient of variation (CV) of GYP values (Fasoula and Tollenaar, 2005; Tokatlidis et al., 2005). In all 3 yr, KNP was determined for all tagged plants using an Old Mill Company Model 850-2 electronic seed counter (International Mar-keting and Design Company, San Antonio, TX). For each tagged plant in each growing season, KW was calculated as the quotient of GYP and KNP. In 2006 and 2007, six ran-dom representative cobs were chosen from the shelled ears of each sampling area and dried to a constant weight at 60°C to determine a common per-plant cob biomass for each sub-subplot. After hand-harvesting in 2006 and 2007, six consecu-tive, representative plants from row three of each sub-subplot’s per-plant sampling area were cut at the stem base, individu-ally chopped to a fine consistency, and dried to a constant weight at 60°C to determine aboveground per-plant vegetative biomass (VBP). For each of these destructively sampled plants, TBP was calculated as the sum of VBP, per-plant cob biomass (common sub-subplot value), and per-plant grain weight (0% moisture). Per-plant harvest index was subsequently calculated as the proportion of per-plant grain weight (0% moisture) to TBP. Following each year’s per-plant measurements, grain was harvested from the center four rows of each six-row sub-subplot using a commercial plot harvester equipped with a four-row maize head. Grain weight and percent moisture were collected on the harvester. The GYA (15.5% moisture content) of each sub-subplot was calculated using the sum of that sub-subplot’s machine harvest grain weight and per-plant sampling area cumulative grain weight.
Within each year, NUE was determined for each sub-subplot receiving N application as the incremental agronomic efficiency from applied nitrogen (AEi). According to Cassman et al. (2003), AEi is defined as the incremental grain yield increase (ΔGYA) resulting from an incremental increase in N application rate (ΔNR). The following function was therefore used to express NUE in this study:
NUE = AEi = ΔGYA/ΔNR = (GYA+N – GYA–N)/(NR+N – NR–N)
[2]
where GYA+N is the per-unit-area grain yield (kg) of a sub-sub-plot receiving either 165 or 330 kg N ha–1 (NR+N), and GYA–N is the per-unit-area grain yield (kg) of the corresponding sub-subplot (i.e., the sub-subplot with the same block-hybrid-plant density combination) receiving no side-dress N (NR–N). For this study, ΔGYA between the 0 and 165 kg N ha–1 application rates was used as a measure of N responsiveness.
Leaf Area Measurements
To measure the LAP and LAD of each tagged plant at R1, a modification of the model and techniques used by Dwyer and Stewart (1986) and Valentinuz and Tollenaar (2006) was employed. Here, we briefly describe our methodology. Readers are encouraged to consult the accompanying appendix for a more comprehensive description of this methodology’s general theory, in-field measurements, and model selection, implemen-tation, and validation components.
In both 2006 and 2007, a destructive sampling area was established in each six-row sub-subplot. In each of these areas,

Agronomy Journa l • Volume101, Issue6 • 2009 1431
three consecutive, representative plants were harvested at R1. On each of these plants, leaf length (L) and maximum leaf width (W) were measured for all green leaves. The area of each green leaf (LAn) was calculated by multiplying L × W × 0.75 (Montgomery, 1911). For all plants in the nondestructive per-plant sampling areas, earleaf position (xe) was determined relative to the location of each plant’s tag. Values for xe from tagged plants were used to estimate xe for destructively sampled plants. The position of the largest leaf (xo) and of each green leaf (xn) were determined relative to xe for each destructively sampled plant, as were the total number of green leaves (NLT) and the positions of the lowest (xL) and highest (xH) green leaves. Using estimated values for xo from destructively sampled plants, the area of the largest green leaf of tagged plants (LÁo) was deter-mined at R1 as previously described (i.e., L × W × 0.75).
To describe the LAD of destructively sampled plants at R1, we used the function:
LAn = LAo × exp[–b(xn – xo)2] [3]
where LAo is the area of the largest leaf, b is a coefficient that describes the breadth/kurtosis of the distribution of green leaf area, and LAn, xn, and xo are as previously described. For the three destructively sampled plants within a sub-subplot, an average sub-subplot-level value for LAo was calculated. Using Eq. [3], sub-subplot-level LAo values, and SAS PROC NLIN (SAS Institute, 2004), a single b coefficient was generated for each plot based on the leaf measurements of the three plants destructively sampled within that plot. The predicted area of every green leaf (LÂn) was resultantly determined for each destructively sampled plant. The total predicted and observed green leaf area of each of these plants (LÂT and LAT, respec-tively) was then calculated as the sum of each plant’s LÂn and LAn values, respectively. The total green leaf area at R1 of each tagged plant (LÁT) within a sub-subplot was calculated as follows:
LÁT = LÂT × (LÁo/LAo) [4]
where LÁo is as previously described, and LÂT and LAo are the average total predicted leaf area and average area of the largest leaf of destructively sampled plants from that same sub-subplot, respectively. For each per-plant sampling area, the LAIG at
R1 was calculated using the sum of all LÁT values for that sampling area.
Statistical Analyses
The study was arranged and analyzed as a split-split plot design with four blocks. Hybrid (main plot), plant density (subplot), and side-dress N rate (sub-subplot) served as the three treatment factors. In some years, sub-subplot-level data was missing for a limited number of morphophysiological parameters. Years were analyzed separately due to the change in hybrids between 2005 and 2006, the enhanced opportunity to annually identify weather impacts on maize responses during the critical period, and the ability to demonstrate year-to-year consistency in responses to treatments. The majority of the subplot errors were not significant at P ≤ 0.25 [as determined via F tests for Type III sums of squares using PROC GLM (SAS Institute, 2004)], so all subplot errors were pooled with their respective sub-subplot errors. The final ANOVA was performed using SAS PROC MIXED (SAS Institute, 2004). When treatment effects were significant at the 0.05 probabil-ity level, least-squares mean (LS mean) separation tests were performed for fixed effects (t test). Presented results/means are generally averaged across hybrids since the effect of hybrid was often not significant (P ≤ 0.05), inconsistently significant across phenological stages for multistage morphophysiological parameters (e.g., SPAD), and/or of lesser importance than the plant density and N rate effects. The principal focus in the fol-lowing sections is therefore placed on the fixed effects of plant density, N rate, and plant density × N rate. Readers should note that, within many of the following figures, morphophysi-ological responses are compared across N rates within plant density. Statistical comparisons between plant densities within N rate are discussed only in the text.
RESULTSWeather Conditions
Total precipitation, mean maximum air temperature, and accumulated GDD for the months of April through Septem-ber are indicated in Table 1 for the 2005, 2006, and 2007 growing seasons, as are accompanying 30-yr averages. Total weekly precipitation, daily maximum air temperature, and accumulated GDD for each growing season are depicted in Fig. 1. Weather conditions expectedly differed between grow-ing seasons (Table 1, Fig. 1). Relatively dry, warm conditions in
Table 1. Total precipitation, mean maximum air temperature, and accumulated growing degree days (GDD) at the Purdue University Agronomy Center for Research and Education (ACRE) for the months of April to September during 2005, 2006, 2007 and the period 1971 to 2000.
Month
Total precipitation Mean maximum air temperature Accumulated GDD
2005 2006 200730-yr mean 2005 2006 2007
30-yr mean 2005 2006 2007
30-yr mean
mm °CApril 51 88 108 91 19 20 15 16 152 152 109 108May 46 131 95 111 23 21 27 23 214 204 301 228June 51 61 72 108 30 27 28 27 368 335 354 339July 117 156 59 102 30 30 28 29 398 445 358 401August 51 136 148 94 30 28 31 28 402 380 416 370September 122 72 46 76 28 24 28 25 317 234 306 2716-mototal 438 644 528 582 1851 1749 1844 17176-moavg. 27 25 26 25

1432 Agronomy Journa l • Volume101, Issue6 • 2009
2005 (Table 1, Fig. 1A) likely contributed to the lowest overall productivity being observed in this year (Fig. 2A), although rainfall events during the critical period bracketing silking likely limited reductions in kernel set and later-season kernel abortion due to water stress (Fig. 1A). Weather during the 2006 growing season was generally highly favorable for maize production (Table 1, Fig. 1B), resulting in the numerically highest GYA values in this year (Fig. 2B). During the 2007 growing season, overall precipitation was slightly below average and monthly maximum temperatures and GDD accumula-tion were typically above average (Table 1), generally resulting
in lower productivity in 2007 versus 2006 (Fig. 2C). As in 2005, rainfall events shortly before and after flowering in 2007 likely limited reductions in kernel set and later-season kernel abortion due to water stress (Fig. 1C). Given the precipitation patterns of each growing season, morphophysiological responses in high stress environments (i.e., supraoptimal plant crowd-ing and/or no side-dress N fertilization) were likely principally the result of imposed treatment stresses and not water or heat stress.
Per-Unit-Area Grain Yield and Nitrogen Use Efficiency
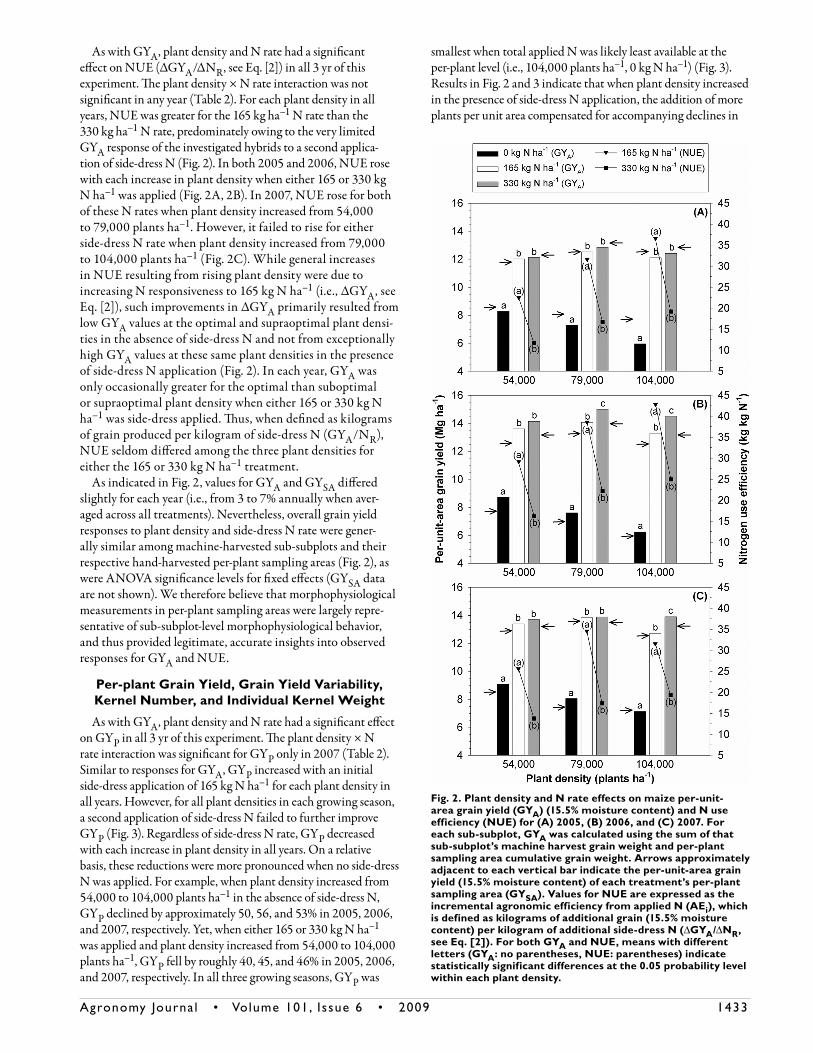
In all 3 yr of this study, the fixed effects of plant density, N rate, and plant density × N rate had a significant effect on GYA (Table 2). For each plant density in all years, GYA increased with an initial side-dress application of 165 kg N ha–1. When 165 kg ha–1 of side-dress N was applied, values for ΔGYA were approximately 3.7, 5.2, and 6.1 Mg ha–1 for the suboptimal, optimal, and supraoptimal plant densities in 2005, respectively; 4.9, 6.5, and 7.0 Mg ha–1 for these respective densities in 2006; and 4.3, 5.8, and 5.6 Mg ha–1 for these respective densities in 2007 (Fig. 2). Genotypes examined in this study therefore consistently displayed strong N responsive-ness (i.e., high ΔGYA values) to an initial side-dress application of 165 kg N ha–1, particularly at the supraoptimal plant density. A second application of 165 kg N ha–1 further improved GYA at only the optimal plant density in 2006 (Fig. 2B) and the supraoptimal plant density in 2006 and 2007 (Fig. 2B, 2C). Despite their statistical significance, these improvements were relatively small, indicating that even at the supraoptimal density further N applica-tion in marked excess of the approximate agronomic optimal N rate only marginally improved grain production. Nevertheless, side-dress N application in excess of 165 kg N ha–1 was more frequently essential for maximizing GYA at the supraoptimal than sub-optimal or optimal plant density (Fig. 2), suggesting a higher agronomic optimal N rate at the most intense level of crowding. When either 165 or 330 kg ha–1 of side-dress N was supplied, GYA rarely increased or decreased with each incremental rise in plant density in all years. Contrarily, in the absence of side-dress N application in each growing season, GYA
declined with each incremental increase in plant density. Dif-ferences in GYA between the 54,000 plants ha–1, 0 kg N ha–1 and 104,000 plants ha–1, 0 kg N ha–1 treatment combina-tions were approximately 28, 29, and 22% in 2005, 2006, and 2007, respectively. In all 3 yr, GYA was lowest when intraspecific competition for applied N was likely most severe (i.e., 104,000 plants ha–1, 0 kg N ha–1) (Fig. 2). Results for GYA (Fig. 2) therefore suggest that the stress-tolerant, highly productive maize hybrids used in this study displayed limited tolerance to the simultaneous stresses of intense crowding and low fertilizer N availability.
Fig. 1. Total weekly precipitation, daily maximum air temperature, and accumulated growing degree days (GDD) for (A) 2005, (B) 2006, and (C) 2007 at the Purdue University Agronomy Center for Research and Education (ACRE). Timing of planting and the phenological stages V5, R1, and R6 (Ritchie et al., 1996) are indicated for each year.
Agronomy Journa l • Volume101, Issue6 • 2009 1433
As with GYA, plant density and N rate had a significant effect on NUE (ΔGYA/ΔNR, see Eq. [2]) in all 3 yr of this experiment. The plant density × N rate interaction was not significant in any year (Table 2). For each plant density in all years, NUE was greater for the 165 kg ha–1 N rate than the 330 kg ha–1 N rate, predominately owing to the very limited GYA response of the investigated hybrids to a second applica-tion of side-dress N (Fig. 2). In both 2005 and 2006, NUE rose with each increase in plant density when either 165 or 330 kg N ha–1 was applied (Fig. 2A, 2B). In 2007, NUE rose for both of these N rates when plant density increased from 54,000 to 79,000 plants ha–1. However, it failed to rise for either side-dress N rate when plant density increased from 79,000 to 104,000 plants ha–1 (Fig. 2C). While general increases in NUE resulting from rising plant density were due to increasing N responsiveness to 165 kg N ha–1 (i.e., ΔGYA, see Eq. [2]), such improvements in ΔGYA primarily resulted from low GYA values at the optimal and supraoptimal plant densi-ties in the absence of side-dress N and not from exceptionally high GYA values at these same plant densities in the presence of side-dress N application (Fig. 2). In each year, GYA was only occasionally greater for the optimal than suboptimal or supraoptimal plant density when either 165 or 330 kg N ha–1 was side-dress applied. Thus, when defined as kilograms of grain produced per kilogram of side-dress N (GYA/NR), NUE seldom differed among the three plant densities for either the 165 or 330 kg N ha–1 treatment.
As indicated in Fig. 2, values for GYA and GYSA differed slightly for each year (i.e., from 3 to 7% annually when aver-aged across all treatments). Nevertheless, overall grain yield responses to plant density and side-dress N rate were gener-ally similar among machine-harvested sub-subplots and their respective hand-harvested per-plant sampling areas (Fig. 2), as were ANOVA significance levels for fixed effects (GYSA data are not shown). We therefore believe that morphophysiological measurements in per-plant sampling areas were largely repre-sentative of sub-subplot-level morphophysiological behavior, and thus provided legitimate, accurate insights into observed responses for GYA and NUE.
Per-plant Grain Yield, Grain Yield Variability, Kernel Number, and Individual Kernel Weight
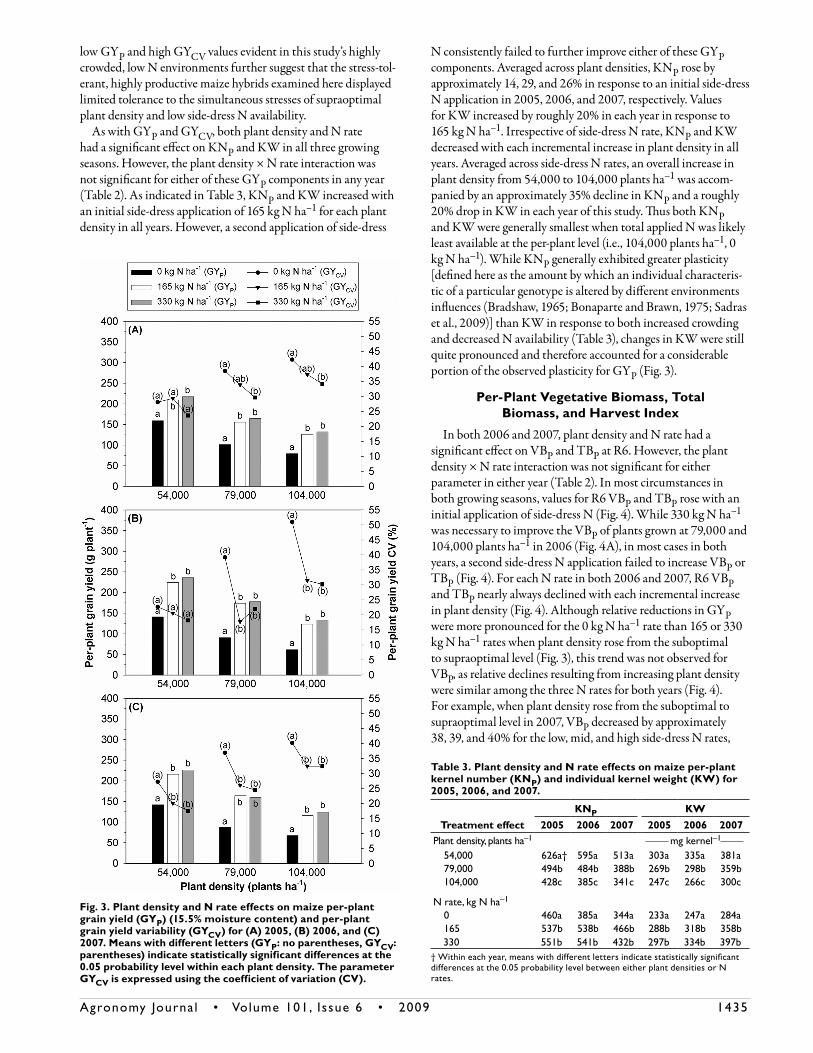
As with GYA, plant density and N rate had a significant effect on GYP in all 3 yr of this experiment. The plant density × N rate interaction was significant for GYP only in 2007 (Table 2). Similar to responses for GYA, GYP increased with an initial side-dress application of 165 kg N ha–1 for each plant density in all years. However, for all plant densities in each growing season, a second application of side-dress N failed to further improve GYP (Fig. 3). Regardless of side-dress N rate, GYP decreased with each increase in plant density in all years. On a relative basis, these reductions were more pronounced when no side-dress N was applied. For example, when plant density increased from 54,000 to 104,000 plants ha–1 in the absence of side-dress N, GYP declined by approximately 50, 56, and 53% in 2005, 2006, and 2007, respectively. Yet, when either 165 or 330 kg N ha–1 was applied and plant density increased from 54,000 to 104,000 plants ha–1, GYP fell by roughly 40, 45, and 46% in 2005, 2006, and 2007, respectively. In all three growing seasons, GYP was
smallest when total applied N was likely least available at the per-plant level (i.e., 104,000 plants ha–1, 0 kg N ha–1) (Fig. 3). Results in Fig. 2 and 3 indicate that when plant density increased in the presence of side-dress N application, the addition of more plants per unit area compensated for accompanying declines in
Fig. 2. Plant density and N rate effects on maize per-unit-area grain yield (GYA) (15.5% moisture content) and N use efficiency (NUE) for (A) 2005, (B) 2006, and (C) 2007. For each sub-subplot, GYA was calculated using the sum of that sub-subplot’s machine harvest grain weight and per-plant sampling area cumulative grain weight. Arrows approximately adjacent to each vertical bar indicate the per-unit-area grain yield (15.5% moisture content) of each treatment’s per-plant sampling area (GYSA). Values for NUE are expressed as the incremental agronomic efficiency from applied N (AEi), which is defined as kilograms of additional grain (15.5% moisture content) per kilogram of additional side-dress N (ΔGYA/ΔNR, see Eq. [2]). For both GYA and NUE, means with different letters (GYA: no parentheses, NUE: parentheses) indicate statistically significant differences at the 0.05 probability level within each plant density.

1434 Agronomy Journa l • Volume101, Issue6 • 2009
GYP , therefore leading to overall increases in GYA. Conversely, when no side-dress N was applied and plant density rose, increases in plant crowding could not offset reductions in GYP (Fig. 3), resulting in overall declines in GYA (Fig. 2A–2C).
Similar to trends for GYP, plant density and N rate had a significant effect on GYCV in all three growing seasons of this study. The plant density × N rate interaction for GYCV was sig-nificant in only 2006 (Table 2). In both 2006 and 2007, GYCV decreased at the optimal and supraoptimal plant densities with an initial application of side-dress N. A second application of 165 kg N ha–1 failed to further reduce GYCV for both of these plant densities in both years (Fig. 3B, 3C). In the 2005 growing sea-son, a total side-dress application of 330 kg N ha–1 was required for reducing GYCV at both the optimal and supraoptimal plant densities (Fig. 3A). In the absence of side-dress N during each growing season, GYCV rose when plant density increased from 54,000 to 79,000 plants ha–1 (Fig. 3). When plant density further rose from the optimal to supraoptimal level for the 0 kg N ha–1 rate, GYCV increased in only 2006 (Fig. 3B). When either 165 or 330 kg N ha–1 was applied in 2005 or 2006, GYCV values increased only when plant density rose from 54,000 to 104,000 plants ha–1 (Fig. 3A, 3B). However, for these same N rates in 2007, GYCV increased with each incremental rise in plant density (Fig. 3C). Overall, GYCV values were typically highest when total applied N was likely least available on a per-plant basis. For example, in 2006 the 104,000 plants ha–1, 0 kg N ha–1 environment displayed the great-est GYCV, while in 2005 and 2007, GYCV was highest for the 79,000 plants ha–1, 0 kg N ha–1 and 104,000 plants ha–1, 0 kg N ha–1 treatment combinations (Fig. 3B, 3C). The simultaneously
Table 2. A
nalysis of variance significance levels for fixed effects in 2005, 2006, and 2007 as determined using SA
S PR
OC
MIX
ED
(SAS Institute, 2004). V
ariables are maize per-unit-area
grain yield (GY
A ); nitrogen use efficiency (NU
E); per-plant grain yield (G
YP ); per-plant grain yield variability (G
YC
V ); per-plant kernel number (K
NP ); individual kernel w
eight (KW
); R6
(Ritchie et al., 1996) per-plant aboveground vegetative (V
BP ) and total (T
BP ) biom
ass; per-plant harvest index (HIP ); per-plant anthesis–silking interval (A
SIP ); V5, V
14, and R1 P
HT
; V14,
R1, R
3, and R6 (sixth-internode) stem
diameter (S
D); R
1 green leaf area index (LA
IG); and V
14 (12th leaf), R1, R
3, and R5 (upperm
ost earleaf) single-photon avalanche diode (SPAD
).
Sources of variation
GY
AN
UE
GY
PG
YC
V †K
NP
KW
VB
PT
BP
HIP
ASIP
V5
PH
TV
14 P
HT
R1
PH
TV
14 SD
R1 SD
R3 SD
R6 SD
LAIG
V14
SPAD
R1
SPAD
R3
SPAD
R5
SPAD
2005Hybrid(H
)NS‡
NS
NS
*NS
*NS
NS
NS
NS
****
NS
NS
NS
*Plantdensity(D
)**
****
****
**NS
***
****
****
****
**H×D
NS
**NS
NS
NS
NS
NS
NS
NS
NS
NS
NS
NS
NS
NS
*Nrate(N
)**
****
****
**NS
***
****
NS
****
****
H×N
NS
NS
NS
NS
NS
**NS
NS
NS
**NS
NS
NS
*NS
NS
D×N
**NS
NS
NS
NS
NS
NS
NS
NS
NS
NS
NS
****
**NS
H×D
×NNS
NS
NS
NS
NS
NS
NS
NS
NS
NS
NS
NS
NS
NS
NS
*
2006
HNS
NS
NS
NS
****
NS
NS
NS
****
****
****
**NS
NS
****
*D
****
****
****
****
****
NS
****
****
****
****
****
H×D
NS
****
***
NS
NS
*NS
*NS
NS
NS
NS
NS
NS
NS
NS
NS
NS
*N
****
****
****
****
****
NS
****
****
****
****
****
H×N
NS
NS
NS
****
**NS
NS
****
NS
NS
NS
NS
NS
NS
**NS
NS
NS
*D×N
**NS
NS
**NS
NS
NS
NS
***
NS
NS
NS
NS
NS
NS
****
*NS
NS
H×D
×NNS
NS
NS
*NS
**NS
NS
NS
NS
NS
NS
NS
NS
NS
NS
NS
NS
*NS
NS
2007
HNS
NS
NS
***
NS
**NS
NS
**NS
NS
****
****
****
***
***
D
****
****
****
****
****
NS
****
****
****
****
****
**H×D
NS
NS
NS
NS
NS
NS
NS
NS
NS
*NS
***
NS
NS
*NS
NS
NS
NS
NS
NS
N
****
****
****
****
****
NS
****
****
****
****
****
**H×N
NS
NS
NS
**NS
NS
NS
NS
NS
**NS
*NS
NS
****
*NS
NS
*NS
NS
D×N
*NS
**NS
NS
NS
NS
NS
NS
**NS
NS
NS
NS
****
NS
**NS
NS
NS
NS
H×D
×NNS
NS
NS
NS
NS
NS
NS
NS
NS
NS
NS
NS
NS
NS
NS
NS
NS
NS
NS
NS
NS
NS
*Significantatthe0.05probabilitylevel.
**Significantatthe0.01probabilitylevel.
†Per-plantgrainyieldvariabilityisexpressedusingthecoefficientofvariation(CV).
‡NS,nonsignificantatthe0.05probabilitylevel.
Agronomy Journa l • Volume101, Issue6 • 2009 1435
low GYP and high GYCV values evident in this study’s highly crowded, low N environments further suggest that the stress-tol-erant, highly productive maize hybrids examined here displayed limited tolerance to the simultaneous stresses of supraoptimal plant density and low side-dress N availability.
As with GYP and GYCV, both plant density and N rate had a significant effect on KNP and KW in all three growing seasons. However, the plant density × N rate interaction was not significant for either of these GYP components in any year (Table 2). As indicated in Table 3, KNP and KW increased with an initial side-dress application of 165 kg N ha–1 for each plant density in all years. However, a second application of side-dress
N consistently failed to further improve either of these GYP components. Averaged across plant densities, KNP rose by approximately 14, 29, and 26% in response to an initial side-dress N application in 2005, 2006, and 2007, respectively. Values for KW increased by roughly 20% in each year in response to 165 kg N ha–1. Irrespective of side-dress N rate, KNP and KW decreased with each incremental increase in plant density in all years. Averaged across side-dress N rates, an overall increase in plant density from 54,000 to 104,000 plants ha–1 was accom-panied by an approximately 35% decline in KNP and a roughly 20% drop in KW in each year of this study. Thus both KNP and KW were generally smallest when total applied N was likely least available at the per-plant level (i.e., 104,000 plants ha–1, 0 kg N ha–1). While KNP generally exhibited greater plasticity [defined here as the amount by which an individual characteris-tic of a particular genotype is altered by different environments influences (Bradshaw, 1965; Bonaparte and Brawn, 1975; Sadras et al., 2009)] than KW in response to both increased crowding and decreased N availability (Table 3), changes in KW were still quite pronounced and therefore accounted for a considerable portion of the observed plasticity for GYP (Fig. 3).
Per-Plant Vegetative Biomass, Total Biomass, and Harvest Index
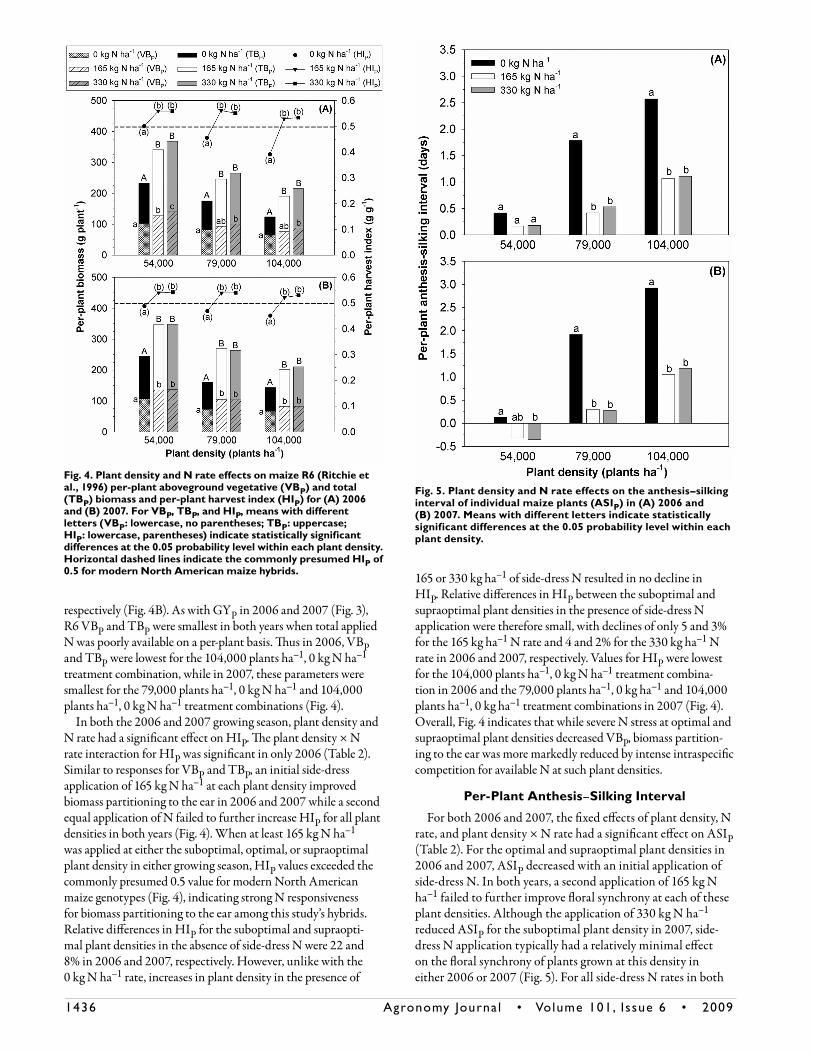
In both 2006 and 2007, plant density and N rate had a significant effect on VBP and TBP at R6. However, the plant density × N rate interaction was not significant for either parameter in either year (Table 2). In most circumstances in both growing seasons, values for R6 VBP and TBP rose with an initial application of side-dress N (Fig. 4). While 330 kg N ha–1 was necessary to improve the VBP of plants grown at 79,000 and 104,000 plants ha–1 in 2006 (Fig. 4A), in most cases in both years, a second side-dress N application failed to increase VBP or TBP (Fig. 4). For each N rate in both 2006 and 2007, R6 VBP and TBP nearly always declined with each incremental increase in plant density (Fig. 4). Although relative reductions in GYP were more pronounced for the 0 kg N ha–1 rate than 165 or 330 kg N ha–1 rates when plant density rose from the suboptimal to supraoptimal level (Fig. 3), this trend was not observed for VBP, as relative declines resulting from increasing plant density were similar among the three N rates for both years (Fig. 4). For example, when plant density rose from the suboptimal to supraoptimal level in 2007, VBP decreased by approximately 38, 39, and 40% for the low, mid, and high side-dress N rates,
Fig. 3. Plant density and N rate effects on maize per-plant grain yield (GYP) (15.5% moisture content) and per-plant grain yield variability (GYCV) for (A) 2005, (B) 2006, and (C) 2007. Means with different letters (GYP: no parentheses, GYCV: parentheses) indicate statistically significant differences at the 0.05 probability level within each plant density. The parameter GYCV is expressed using the coefficient of variation (CV).
Table 3. Plant density and N rate effects on maize per-plant kernel number (KNP) and individual kernel weight (KW) for 2005, 2006, and 2007.
Treatment effectKNP KW
2005 2006 2007 2005 2006 2007Plantdensity,plantsha–1 mgkernel–1
54,000 626a† 595a 513a 303a 335a 381a 79,000 494b 484b 388b 269b 298b 359b 104,000 428c 385c 341c 247c 266c 300c
Nrate,kgNha–1
0 460a 385a 344a 233a 247a 284a 165 537b 538b 466b 288b 318b 358b 330 551b 541b 432b 297b 334b 397b†Withineachyear,meanswithdifferentlettersindicatestatisticallysignificantdifferencesatthe0.05probabilitylevelbetweeneitherplantdensitiesorNrates.
1436 Agronomy Journa l • Volume101, Issue6 • 2009
respectively (Fig. 4B). As with GYP in 2006 and 2007 (Fig. 3), R6 VBP and TBP were smallest in both years when total applied N was poorly available on a per-plant basis. Thus in 2006, VBP and TBP were lowest for the 104,000 plants ha–1, 0 kg N ha–1 treatment combination, while in 2007, these parameters were smallest for the 79,000 plants ha–1, 0 kg N ha–1 and 104,000 plants ha–1, 0 kg N ha–1 treatment combinations (Fig. 4).
In both the 2006 and 2007 growing season, plant density and N rate had a significant effect on HIP. The plant density × N rate interaction for HIP was significant in only 2006 (Table 2). Similar to responses for VBP and TBP, an initial side-dress application of 165 kg N ha–1 at each plant density improved biomass partitioning to the ear in 2006 and 2007 while a second equal application of N failed to further increase HIP for all plant densities in both years (Fig. 4). When at least 165 kg N ha–1 was applied at either the suboptimal, optimal, or supraoptimal plant density in either growing season, HIP values exceeded the commonly presumed 0.5 value for modern North American maize genotypes (Fig. 4), indicating strong N responsiveness for biomass partitioning to the ear among this study’s hybrids. Relative differences in HIP for the suboptimal and supraopti-mal plant densities in the absence of side-dress N were 22 and 8% in 2006 and 2007, respectively. However, unlike with the 0 kg N ha–1 rate, increases in plant density in the presence of
165 or 330 kg ha–1 of side-dress N resulted in no decline in HIP. Relative differences in HIP between the suboptimal and supraoptimal plant densities in the presence of side-dress N application were therefore small, with declines of only 5 and 3% for the 165 kg ha–1 N rate and 4 and 2% for the 330 kg ha–1 N rate in 2006 and 2007, respectively. Values for HIP were lowest for the 104,000 plants ha–1, 0 kg N ha–1 treatment combina-tion in 2006 and the 79,000 plants ha–1, 0 kg ha–1 and 104,000 plants ha–1, 0 kg ha–1 treatment combinations in 2007 (Fig. 4). Overall, Fig. 4 indicates that while severe N stress at optimal and supraoptimal plant densities decreased VBP, biomass partition-ing to the ear was more markedly reduced by intense intraspecific competition for available N at such plant densities.
Per-Plant Anthesis–Silking Interval
For both 2006 and 2007, the fixed effects of plant density, N rate, and plant density × N rate had a significant effect on ASIP (Table 2). For the optimal and supraoptimal plant densities in 2006 and 2007, ASIP decreased with an initial application of side-dress N. In both years, a second application of 165 kg N ha–1 failed to further improve floral synchrony at each of these plant densities. Although the application of 330 kg N ha–1 reduced ASIP for the suboptimal plant density in 2007, side-dress N application typically had a relatively minimal effect on the floral synchrony of plants grown at this density in either 2006 or 2007 (Fig. 5). For all side-dress N rates in both
Fig. 4. Plant density and N rate effects on maize R6 (Ritchie et al., 1996) per-plant aboveground vegetative (VBP) and total (TBP) biomass and per-plant harvest index (HIP) for (A) 2006 and (B) 2007. For VBP, TBP, and HIP, means with different letters (VBP: lowercase, no parentheses; TBP: uppercase; HIP: lowercase, parentheses) indicate statistically significant differences at the 0.05 probability level within each plant density. Horizontal dashed lines indicate the commonly presumed HIP of 0.5 for modern North American maize hybrids.
Fig. 5. Plant density and N rate effects on the anthesis–silking interval of individual maize plants (ASIP) in (A) 2006 and (B) 2007. Means with different letters indicate statistically significant differences at the 0.05 probability level within each plant density.
Agronomy Journa l • Volume101, Issue6 • 2009 1437
growing seasons, ASIP generally rose with each increase in plant density, with this upward trend most pronounced when no side-dress N was applied. In both 2006 and 2007, the high-est floral protandry occurred when intraspecific competition for soil N was likely most severe (i.e., 104,000 plants ha–1, 0 kg N ha–1) (Fig. 5). This environment also exhibited the numeri-cally lowest HIP (Fig. 4) and GYP (Fig. 3B, 3C) values in both years, suggesting that ultimately low-yielding plants subjected to the simultaneous stresses of intense crowding and low N availability already exhibited reduced biomass partitioning to the ear before the grain-filling period and, concomitantly, limited tolerance to intense intraspecific competition for avail-able N at R1.
Plant Height and Stem Diameter
In all three growing seasons, neither plant density nor N rate had a significant effect on PHT at V5. However, in each year, both of these effects had a significant impact on V14 and R1 PHT. For all phenological stages in each year, the plant density × N rate interaction for PHT was not significant (Table 2). At V14 and R1 for each growing season, PHT often declined with an increase in plant density from 54,000 to 79,000 or 104,000 plants ha–1 regardless of side-dress N rate. Furthermore, for both of these phenological stages in each year, PHT was typi-cally reduced by a lack of side-dress N application regardless of plant density. Values for V14 and R1 PHT were therefore often lowest for the 79,000 plants ha–1, 0 kg N ha–1 and 104,000 plants ha–1, 0 kg N ha–1 treatment combinations (Table 4).
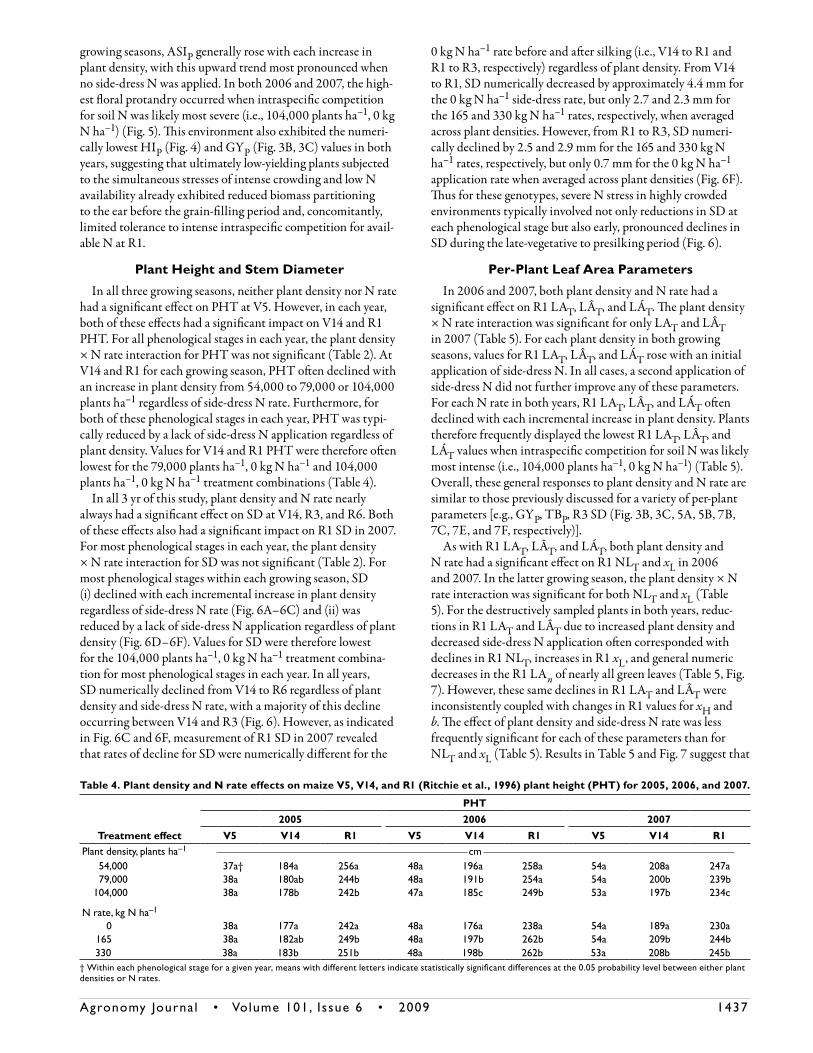
In all 3 yr of this study, plant density and N rate nearly always had a significant effect on SD at V14, R3, and R6. Both of these effects also had a significant impact on R1 SD in 2007. For most phenological stages in each year, the plant density × N rate interaction for SD was not significant (Table 2). For most phenological stages within each growing season, SD (i) declined with each incremental increase in plant density regardless of side-dress N rate (Fig. 6A–6C) and (ii) was reduced by a lack of side-dress N application regardless of plant density (Fig. 6D–6F). Values for SD were therefore lowest for the 104,000 plants ha–1, 0 kg N ha–1 treatment combina-tion for most phenological stages in each year. In all years, SD numerically declined from V14 to R6 regardless of plant density and side-dress N rate, with a majority of this decline occurring between V14 and R3 (Fig. 6). However, as indicated in Fig. 6C and 6F, measurement of R1 SD in 2007 revealed that rates of decline for SD were numerically different for the
0 kg N ha–1 rate before and after silking (i.e., V14 to R1 and R1 to R3, respectively) regardless of plant density. From V14 to R1, SD numerically decreased by approximately 4.4 mm for the 0 kg N ha–1 side-dress rate, but only 2.7 and 2.3 mm for the 165 and 330 kg N ha–1 rates, respectively, when averaged across plant densities. However, from R1 to R3, SD numeri-cally declined by 2.5 and 2.9 mm for the 165 and 330 kg N ha–1 rates, respectively, but only 0.7 mm for the 0 kg N ha–1 application rate when averaged across plant densities (Fig. 6F). Thus for these genotypes, severe N stress in highly crowded environments typically involved not only reductions in SD at each phenological stage but also early, pronounced declines in SD during the late-vegetative to presilking period (Fig. 6).
Per-Plant Leaf Area Parameters
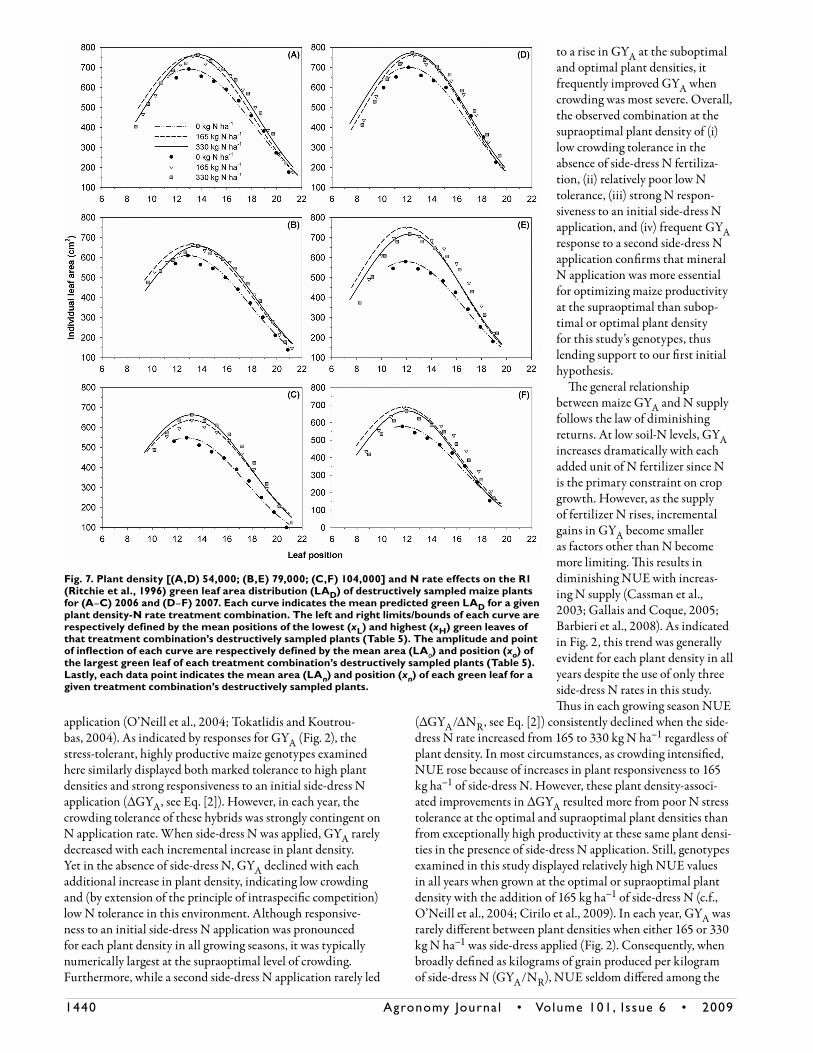
In 2006 and 2007, both plant density and N rate had a significant effect on R1 LAT, LÂT, and LÁT. The plant density × N rate interaction was significant for only LAT and LÂT in 2007 (Table 5). For each plant density in both growing seasons, values for R1 LAT, LÂT, and LÁT rose with an initial application of side-dress N. In all cases, a second application of side-dress N did not further improve any of these parameters. For each N rate in both years, R1 LAT, LÂT, and LÁT often declined with each incremental increase in plant density. Plants therefore frequently displayed the lowest R1 LAT, LÂT, and LÁT values when intraspecific competition for soil N was likely most intense (i.e., 104,000 plants ha–1, 0 kg N ha–1) (Table 5). Overall, these general responses to plant density and N rate are similar to those previously discussed for a variety of per-plant parameters [e.g., GYP, TBP, R3 SD (Fig. 3B, 3C, 5A, 5B, 7B, 7C, 7E, and 7F, respectively)].
As with R1 LAT, LÂT, and LÁT, both plant density and N rate had a significant effect on R1 NLT and xL in 2006 and 2007. In the latter growing season, the plant density × N rate interaction was significant for both NLT and xL (Table 5). For the destructively sampled plants in both years, reduc-tions in R1 LAT and LÂT due to increased plant density and decreased side-dress N application often corresponded with declines in R1 NLT, increases in R1 xL, and general numeric decreases in the R1 LAn of nearly all green leaves (Table 5, Fig. 7). However, these same declines in R1 LAT and LÂT were inconsistently coupled with changes in R1 values for xH and b. The effect of plant density and side-dress N rate was less frequently significant for each of these parameters than for NLT and xL (Table 5). Results in Table 5 and Fig. 7 suggest that
Table 4. Plant density and N rate effects on maize V5, V14, and R1 (Ritchie et al., 1996) plant height (PHT) for 2005, 2006, and 2007.
Treatment effect
PHT2005 2006 2007
V5 V14 R1 V5 V14 R1 V5 V14 R1Plantdensity,plantsha–1 cm 54,000 37a† 184a 256a 48a 196a 258a 54a 208a 247a 79,000 38a 180ab 244b 48a 191b 254a 54a 200b 239b 104,000 38a 178b 242b 47a 185c 249b 53a 197b 234c
Nrate,kgNha–1
0 38a 177a 242a 48a 176a 238a 54a 189a 230a 165 38a 182ab 249b 48a 197b 262b 54a 209b 244b 330 38a 183b 251b 48a 198b 262b 53a 208b 245b†Withineachphenologicalstageforagivenyear,meanswithdifferentlettersindicatestatisticallysignificantdifferencesatthe0.05probabilitylevelbetweeneitherplantdensitiesorNrates.

1438 Agronomy Journa l • Volume101, Issue6 • 2009
plants subjected to intense crowding and/or low N availabil-ity exhibited reduced R1 per-plant green leaf area (i.e., LAT, LÂT, and LÁT values) due to premature lower leaf senescence (i.e., lower NLT and higher xL values) and reduced individual leaf area for most of the nonsenesced canopy (i.e., lower LAn values for green leaves). Lower LAT, LÂT, and LÁT values were not associated with a reduction in the total number of initi-ated leaves (i.e., unchanged xH values) or a modification of the general shape of the green LAD curve (i.e., unaltered b values) (Table 5, Fig. 7).
Green Leaf Area IndexIn both 2006 and 2007, plant
density, N rate, and plant density × N rate had a significant effect on R1 LAIG (Table 2). As generally observed for other previously dis-cussed parameters (e.g., VBP, TBP, GYP), an initial side-dress applica-tion of 165 kg N ha–1 increased R1 LAIG for each plant density in each growing season, while a sec-ond equal application of N failed to further improve R1 LAIG for all plant densities in both years (Fig. 8). When either 165 or 330 kg N ha–1 was applied in 2006 or 2007, R1 LAIG increased with each incremental rise in plant density (Fig. 8), indicating that the addition of more plants more than compensated for accompany-ing declines in R1 LÁT (Table 5). However, when no side-dress N was applied in each growing sea-son, R1 LAIG was similar for the optimal and supraoptimal plant densities in 2006 and for all three plant densities in 2007 (Fig. 8), suggesting that in most circum-stances increases in plant crowd-ing barely offset pronounced reductions in R1 LÁT (Table 5). Thus, while an initial side-dress N application increased R1 LAIG values for each plant density, these improvements were particularly pronounced at the highest plant density for which LAIG respec-tively rose 68 and 71% in 2006 and 2007 in response to an initial 165 kg N ha–1. In comparison, R1 LAIG respectively increased by 42 and 47% for the suboptimal and optimal plant densities in 2006, and by 30 and 56% for these same respective densities in 2007. Over-all, values for LAIG at R1 were lowest for the 54,000 plants ha–1, 0 kg N ha–1 treatment com-
bination in 2006 and 54,000 plants ha–1, 0 kg N ha–1; 79,000 plants ha–1, 0 kg N ha–1; and 104,000 plants ha–1, 0 kg N ha–1 treatment combinations in 2007 (Fig. 8).
Single-Photon Avalanche Diode
Plant density and N rate had a significant effect on SPAD values at each sampling time in all three growing seasons of this study. Yet, for at least one phenological stage per year, the plant density × N rate interaction was not significant (Table 2). For all phenological stages within each year, the relative
Fig. 6. Plant density (A–C) and N rate (D–F) effects on maize V14, R1, R3, and R6 (Ritchie et al., 1996) maximum stem diameter (SD) for (A,D) 2005, (B,E) 2006, and (C,F) 2007. At each phenological stage, maximum SD was measured at the midpoint of the sixth internode. Means with different letters indicate statistically significant differences at the 0.05 probability level within each phenological stage.

Agronomy Journa l • Volume101, Issue6 • 2009 1439
chlorophyll concentration (i.e., SPAD) declined with each incremental increase in plant density regardless of side-dress N rate (Fig. 9A–9C). Furthermore, for most phenological stages within each season, leaf chlorophyll content declined with each incremental decrease in N rate irrespective of plant density (Fig. 9D–9F). Values for SPAD were lowest for the 104,000 plants ha–1, 0 kg N ha–1 treatment combination for most phenological stages in 2005, 2006, and 2007 (Fig. 9). When averaged across N rates, foliar chlorophyll levels remained relatively constant between V14 and R3 for each plant density. However, leaf greenness numerically decreased from R3 to R5 in all growing seasons, with the rate of decline from R3 to R5 numerically similar among plant densities within a year (Fig. 9A–9C). When no side-dress N was applied,
leaf chlorophyll concentration generally numerically declined from V14 to R5 regardless of plant density, with a majority of this reduction occurring between R3 and R5 (Fig. 9D–9F). Overall, results presented in Fig. 9 indicate that the simultane-ous stresses of intense crowding and low fertilizer N availability severely reduced leaf N concentration/chlorophyll content at each phenological stage and induced premature declines in visual stay-green.
DISCUSSIONAs a result of prior genetic improvement efforts, modern
maize hybrids commonly display both pronounced tolerance to intense crowding (Tollenaar and Lee, 2002; Tokatlidis and Koutroubas, 2004) and strong responsiveness to N fertilizer
Table 5. Plant density and N rate effects on the observed (LAT), predicted (LÂT), and estimated (LÁT) total green leaf area per plant; on the area of the largest leaf of destructively (LAo) and nondestructively sampled (LÁo) plants; on the total number of green leaves (NLT) per plant; on the positions of the earleaf (xe) and largest (xo), lowest (xL), and highest (xH) green leaves (leaves numbered from the bottom to the top of the plant for all initiated leaves); and on the b coefficient of Eq. [3] for maize grown in 2006 and 2007 and measured at R1 (Ritchie et al., 1996).
YearPlant
density N rate LAT† LÂT† LÁT‡ NLT† xL† xH† xe‡ xo† LAo† LÁo‡ b†
plantsha–1 kgNha–1 cm2plant–1 leafno. cm2
2006 54,000 0 5410a§ 5445a 5203a 11.2a 11.4a 21.6a 14.4a 13.0a 692a 661a 0.020a165 7255b 7349b 7114b 13.7b 9.0b 21.6a 14.4a 13.3ab 756b 733b 0.022ab330 7417b 7456b 7229b 13.7b 8.7b 21.4a 14.4a 13.7b 764b 741b 0.023b
79,000 0 4417a 4467a 4271a 10.5a 11.5a 21.0a 14.3a 12.9a 610a 582a 0.022a165 6132b 6187b 6360b 12.8b 9.4b 21.2a 14.3a 13.2ab 664b 684b 0.022a330 6059b 6093b 6377b 12.8b 9.4b 21.2a 14.3a 13.7b 657b 690b 0.024a
104,000 0 3696a 3733a 3526a 10.1a 11.8a 20.9a 14.3a 12.8a 548a 517a 0.023a165 5665b 5728b 5680b 12.4b 9.6b 21.0ab 14.2a 13.2a 635b 631b 0.022a330 6021b 6072b 5933b 12.8b 9.4b 21.3b 14.2a 13.2a 663b 648b 0.023a
2007 54,000 0 5705a 5783a 5192a 11.2a 9.7a 19.9a 13.9a 12.1a 700a 628a 0.021a165 7045b 7127b 6782b 13.3b 7.6b 19.9a 13.8a 12.5a 762b 726b 0.026b330 7247b 7390b 6963b 13.4b 7.4b 19.8a 13.8a 12.4a 772b 728b 0.024ab
79,000 0 4153a 4184a 3745a 10.0a 10.5a 19.5a 13.6a 11.9a 579a 522a 0.024a165 6765b 6913b 5893b 13.0b 7.6b 19.6a 13.7a 12.0a 752b 641b 0.026a330 6552b 6633b 5966b 13.2b 7.5b 19.7a 13.6a 12.3a 717b 645b 0.026a
104,000 0 3698a 3724a 2906a 9.3a 11.0a 19.4a 13.5a 11.6a 578a 453a 0.024a165 5942b 6078b 4993b 12.5b 8.1b 19.6a 13.5a 11.8a 688b 565b 0.025a330 5654b 5795b 5135b 12.7b 8.0b 19.6a 13.5a 12.0a 667b 591b 0.029b
ANOVASourcesofvariation
2006 Hybrid(H) NS¶ NS * NS ** ** ** NS ** ** NSPlantdensity(D) ** ** ** ** ** ** ** NS ** ** NSH×D NS NS NS NS NS NS NS NS NS NS NSNrate(N) ** ** ** ** ** NS NS ** ** ** NSH×N NS NS NS NS NS NS NS NS NS NS NSD×N NS NS NS NS NS * NS NS NS * NSH×D×N NS NS NS NS NS NS NS NS NS NS NS
2007 H ** ** ** ** ** ** ** ** ** ** NSD ** ** ** ** ** ** ** ** ** ** NSH×D NS NS NS NS NS NS NS NS NS * NSN ** ** ** ** ** NS NS NS ** ** **H×N NS NS NS NS * NS NS NS NS NS NSD×N ** ** NS ** * NS NS NS NS NS NSH×D×N NS NS NS NS NS NS NS NS NS NS NS
*Significantatthe0.05probabilitylevel.
**Significantatthe0.01probabilitylevel.
†Determinedfordestructivelysampledplants.
‡Determinedfortagged,nondestructivelysampledplants.
§Foreachcolumnwithinyearandplantdensity,meanswithdifferentlettersindicatestatisticallysignificantdifferencesatthe0.05probabilitylevel.
¶NS,nonsignificantatthe0.05probabilitylevel.
1440 Agronomy Journa l • Volume101, Issue6 • 2009
application (O’Neill et al., 2004; Tokatlidis and Koutrou-bas, 2004). As indicated by responses for GYA (Fig. 2), the stress-tolerant, highly productive maize genotypes examined here similarly displayed both marked tolerance to high plant densities and strong responsiveness to an initial side-dress N application (ΔGYA, see Eq. [2]). However, in each year, the crowding tolerance of these hybrids was strongly contingent on N application rate. When side-dress N was applied, GYA rarely decreased with each incremental increase in plant density. Yet in the absence of side-dress N, GYA declined with each additional increase in plant density, indicating low crowding and (by extension of the principle of intraspecific competition) low N tolerance in this environment. Although responsive-ness to an initial side-dress N application was pronounced for each plant density in all growing seasons, it was typically numerically largest at the supraoptimal level of crowding. Furthermore, while a second side-dress N application rarely led
to a rise in GYA at the suboptimal and optimal plant densities, it frequently improved GYA when crowding was most severe. Overall, the observed combination at the supraoptimal plant density of (i) low crowding tolerance in the absence of side-dress N fertiliza-tion, (ii) relatively poor low N tolerance, (iii) strong N respon-siveness to an initial side-dress N application, and (iv) frequent GYA response to a second side-dress N application confirms that mineral N application was more essential for optimizing maize productivity at the supraoptimal than subop-timal or optimal plant density for this study’s genotypes, thus lending support to our first initial hypothesis.
The general relationship between maize GYA and N supply follows the law of diminishing returns. At low soil-N levels, GYA increases dramatically with each added unit of N fertilizer since N is the primary constraint on crop growth. However, as the supply of fertilizer N rises, incremental gains in GYA become smaller as factors other than N become more limiting. This results in diminishing NUE with increas-ing N supply (Cassman et al., 2003; Gallais and Coque, 2005; Barbieri et al., 2008). As indicated in Fig. 2, this trend was generally evident for each plant density in all years despite the use of only three side-dress N rates in this study. Thus in each growing season NUE
(ΔGYA/ΔNR, see Eq. [2]) consistently declined when the side-dress N rate increased from 165 to 330 kg N ha–1 regardless of plant density. In most circumstances, as crowding intensified, NUE rose because of increases in plant responsiveness to 165 kg ha–1 of side-dress N. However, these plant density-associ-ated improvements in ΔGYA resulted more from poor N stress tolerance at the optimal and supraoptimal plant densities than from exceptionally high productivity at these same plant densi-ties in the presence of side-dress N application. Still, genotypes examined in this study displayed relatively high NUE values in all years when grown at the optimal or supraoptimal plant density with the addition of 165 kg ha–1 of side-dress N (c.f., O’Neill et al., 2004; Cirilo et al., 2009). In each year, GYA was rarely different between plant densities when either 165 or 330 kg N ha–1 was side-dress applied (Fig. 2). Consequently, when broadly defined as kilograms of grain produced per kilogram of side-dress N (GYA/NR), NUE seldom differed among the
Fig. 7. Plant density [(A,D) 54,000; (B,E) 79,000; (C,F) 104,000] and N rate effects on the R1 (Ritchie et al., 1996) green leaf area distribution (LAD) of destructively sampled maize plants for (A–C) 2006 and (D–F) 2007. Each curve indicates the mean predicted green LAD for a given plant density-N rate treatment combination. The left and right limits/bounds of each curve are respectively defined by the mean positions of the lowest (xL) and highest (xH) green leaves of that treatment combination’s destructively sampled plants (Table 5). The amplitude and point of inflection of each curve are respectively defined by the mean area (LAo) and position (xo) of the largest green leaf of each treatment combination’s destructively sampled plants (Table 5). Lastly, each data point indicates the mean area (LAn) and position (xn) of each green leaf for a given treatment combination’s destructively sampled plants.

Agronomy Journa l • Volume101, Issue6 • 2009 1441
three plant densities for either the 165 or 330 kg ha–1 side-dress N rate. Thus higher plant densities generally failed to improve overall NUE for these N-responsive genotypes. Still, more extensive multienvironment studies on NUE and its common components (e.g., recovery efficiency, physiological efficiency) using multiple agronomic, physiological, and genetic tech-niques (c.f., Hirel et al., 2001; Cassman et al., 2003; Subedi and Ma, 2005a, 2007; Coque and Gallais, 2007; Barbieri et al., 2008) are clearly needed for a more complete understanding of the NUE responses of these and other modern genotypes to varying plant density and N rate.
Besides indicating little difference in overall NUE (GYA/NR), similar GYA values among the three plant densities when either 165 or 330 kg ha–1 of side-dress N was applied (Fig. 2) suggest a high level of plant density independence [i.e., maximum GYA is attained over a wide range of plant densities (Tokatlidis et al., 2005)] for this study’s late-maturing geno-types in this particular environment. Such plant density inde-pendence partially conflicts with the general GYA responses observed by Pioneer Hi-Bred Intl., Inc. for both this study’s and other Pioneer brand late-maturing hybrids (>113 CRM) grown in high-yielding environments (>11.9 Mg ha–1) (Pasz-kiewicz and Butzen, 2007; D. Rule, personal communication, 2008). In these multiyear, multilocation commercial trials, GYA was measured at five plant densities ranging from 44,500 to 104,000 plants ha–1, with plant densities of 54,000, 79,000, and 104,000 plants ha–1 corresponding to agronomic and economic suboptimal, optimal (approximately), and supraop-timal levels of crowding. For these commercial tests, increases in plant density from 79,000 to 104,000 plants ha–1 led to relatively minimal reductions in GYA (≈1%), while decreases in plant crowding from 79,000 to 54,000 plants ha–1 caused relatively moderate declines in GYA (≈13%) (Paszkiewicz and Butzen, 2007; D. Rule, personal communication, 2008). This latter decline in GYA clearly contrasts with the similar GYA values observed each year for this study’s suboptimal and opti-mal plant densities when either 165 or 330 kg ha–1 of side-dress N was applied (Fig. 2).
When either 165 or 330 kg N ha–1 was side-dress applied, the roughly 30% decline in plant density from the optimal to suboptimal level was accompanied by an approximately 25 to 30% increase in GYP (Fig. 3) in addition to either no increase (Fig. 3A–3B) or a decrease (Fig. 3C) in GYCV. In general, these relative gains in GYP were associated with (i) 5 to 10% increases in KW and 15 to 25% gains in KNP (Table 3); (ii) 25 to 30% gains in R6 VBP and TBP (Fig. 4); (iii) 10 to 15% rises in R1 LÁT (Table 5); (iv) relatively small gains in V14, R3, and R6 SD (Fig. 6A–6C) and V14, R1, R3 and R5 leaf chloro-phyll content (Fig. 9A–9C); (v) minor reductions in ASIP (Fig. 5); and (vi) the maintenance of HIP values greater than 0.5 (Fig. 4). Enhanced pre- and postanthesis LAP, VBP, and TBP; delayed postsilking leaf senescence; reduced ASIP; greater KW, KNP, and GYP; and lower GYCV are common physiologi-cal responses to the reductions in intraspecific competition provided by lower plant densities, with KNP routinely affected more by changes in plant density than KW (Tetio-Kagho and Gardner, 1988a,b; Tollenaar, 1992; Andrade, 1995; Bertin and Gallais, 2000; Edmeades et al., 2000; Sangoi et al., 2002; Bruns and Abbas, 2003; Tokatlidis and Koutroubas, 2004;
Fasoula and Tollenaar, 2005; Hashemi et al., 2005; Mon-neveux et al., 2005; Sarlangue et al., 2007). In this study, the strong responsiveness of VBP, TBP, KNP, and GYP to reduced plant crowding and the maintenance of HIP values above 0.5 at the suboptimal plant density suggest a relatively high level of phenotypic plasticity and reproductive partitioning among these genotypes. Such results may largely explain the plant density independence observed for these hybrids (Echarte et al., 2004; Sarlangue et al., 2007).
Despite strong plasticity for VBP, TBP, KNP, and GYP, responsiveness for R1 LÁT to reduced plant crowding was limited for this study’s genotypes, with observed plasticity for R1 LÁT the result of not only increased LAn values for most green leaves, but also decreased lower leaf senescence (Table 5, Fig. 7A, 7B, 7D, 7E). Such findings reaffirm previ-ous reports of maize’s limited plasticity for per-plant total leaf area in response to altered resource availability (Tetio-Kagho and Gardner, 1988a; Andrade and Abbate, 2005). Restricted responsiveness for R1 LÁT among this study’s genotypes led to roughly 20% lower R1 LAIG values at the suboptimal versus optimal plant density when either 165 or 330 kg N ha–1 was side-dress applied (Fig. 8). Despite these differences in R1 LAIG, GYA was similar among these plant densities for either side-dress N rate (Fig. 2B, 2C). Values for R1 LAIG in excess of approximately 4.0 m2 m–2 therefore failed to improve GYA.
Fig. 8. Plant density and N rate effects on maize R1 (Ritchie et al., 1996) green leaf area index (LAIG) for (A) 2006 and (B) 2007. Means with different letters indicate statistically significant differences at the 0.05 probability level within each plant density.
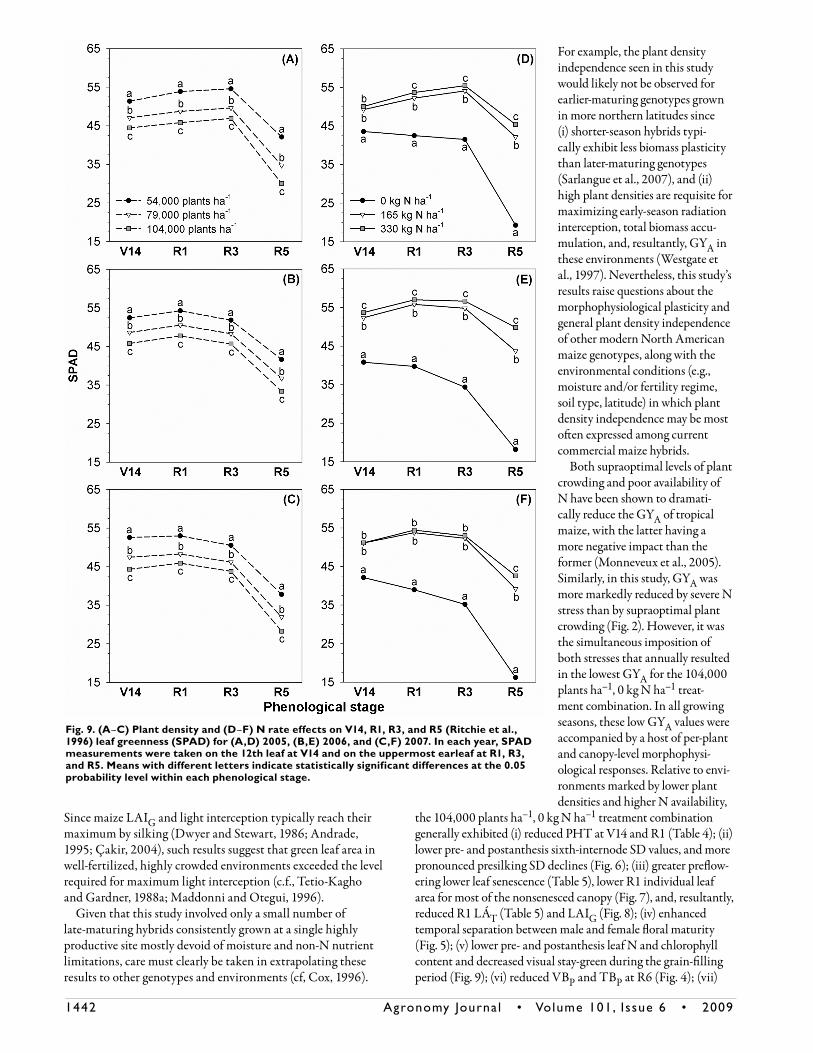
1442 Agronomy Journa l • Volume101, Issue6 • 2009
Since maize LAIG and light interception typically reach their maximum by silking (Dwyer and Stewart, 1986; Andrade, 1995; Çakir, 2004), such results suggest that green leaf area in well-fertilized, highly crowded environments exceeded the level required for maximum light interception (c.f., Tetio-Kagho and Gardner, 1988a; Maddonni and Otegui, 1996).
Given that this study involved only a small number of late-maturing hybrids consistently grown at a single highly productive site mostly devoid of moisture and non-N nutrient limitations, care must clearly be taken in extrapolating these results to other genotypes and environments (cf, Cox, 1996).
For example, the plant density independence seen in this study would likely not be observed for earlier-maturing genotypes grown in more northern latitudes since (i) shorter-season hybrids typi-cally exhibit less biomass plasticity than later-maturing genotypes (Sarlangue et al., 2007), and (ii) high plant densities are requisite for maximizing early-season radiation interception, total biomass accu-mulation, and, resultantly, GYA in these environments (Westgate et al., 1997). Nevertheless, this study’s results raise questions about the morphophysiological plasticity and general plant density independence of other modern North American maize genotypes, along with the environmental conditions (e.g., moisture and/or fertility regime, soil type, latitude) in which plant density independence may be most often expressed among current commercial maize hybrids.
Both supraoptimal levels of plant crowding and poor availability of N have been shown to dramati-cally reduce the GYA of tropical maize, with the latter having a more negative impact than the former (Monneveux et al., 2005). Similarly, in this study, GYA was more markedly reduced by severe N stress than by supraoptimal plant crowding (Fig. 2). However, it was the simultaneous imposition of both stresses that annually resulted in the lowest GYA for the 104,000 plants ha–1, 0 kg N ha–1 treat-ment combination. In all growing seasons, these low GYA values were accompanied by a host of per-plant and canopy-level morphophysi-ological responses. Relative to envi-ronments marked by lower plant densities and higher N availability,
the 104,000 plants ha–1, 0 kg N ha–1 treatment combination generally exhibited (i) reduced PHT at V14 and R1 (Table 4); (ii) lower pre- and postanthesis sixth-internode SD values, and more pronounced presilking SD declines (Fig. 6); (iii) greater preflow-ering lower leaf senescence (Table 5), lower R1 individual leaf area for most of the nonsenesced canopy (Fig. 7), and, resultantly, reduced R1 LÁT (Table 5) and LAIG (Fig. 8); (iv) enhanced temporal separation between male and female floral maturity (Fig. 5); (v) lower pre- and postanthesis leaf N and chlorophyll content and decreased visual stay-green during the grain-filling period (Fig. 9); (vi) reduced VBP and TBP at R6 (Fig. 4); (vii)
Fig. 9. (A–C) Plant density and (D–F) N rate effects on V14, R1, R3, and R5 (Ritchie et al., 1996) leaf greenness (SPAD) for (A,D) 2005, (B,E) 2006, and (C,F) 2007. In each year, SPAD measurements were taken on the 12th leaf at V14 and on the uppermost earleaf at R1, R3, and R5. Means with different letters indicate statistically significant differences at the 0.05 probability level within each phenological stage.
Agronomy Journa l • Volume101, Issue6 • 2009 1443
reduced total partitioning of biomass to the ear (Fig. 4); (viii) lower KW, KNP (Table 3), and GYP (Fig. 3); and (ix) higher GYCV (Fig. 3). As shown through the use of allometric models by Maddonni and Otegui (2004) and Pagano and Maddonni (2007), maize TBP at V14 and R1 is linearly related to stem volume when this volume is estimated via the cylinder formula using the morphometric parameters PHT and basal SD. Furthermore, TBP at R3 is positively related to stem volume and uppermost ear diameter through a quadratic relationship (Maddonni and Otegui, 2004; Pagano and Maddonni, 2007). Andrade et al. (1999) similarly determined that TBP is related to SD through a univariate quadratic function in the preflow-ering period and to SD, uppermost ear diameter, and upper-most ear length through a multivariate curvilinear function in the postflowering period. Thus, although VBP and TBP were not measured at V14, R1, and R3 in this study, these general allometric relationships in conjunction with observed results for PHT at V14 and R1 (Table 4); SD at V14, R1, and R3 (Fig. 6); LÁT at R1 (Table 5); and VBP, TBP, HIP (Fig. 4), and GYP (Fig. 3) at physiological maturity suggest that VBP and TBP at V14, R1, and R3 were lowest for the 104,000 plants ha–1, 0 kg N ha–1 treatment combination in each year. Overall, these observed responses (i) generally support our second initial hypothesis, (ii) strongly agree with previously reported responses to varying plant densities and/or N rates (e.g., Ogun-lela et al., 1988; Tetio-Kagho and Gardner, 1988a; Wolfe et al., 1988a, 1988b; Jacobs and Pearson, 1991; Jones et al., 1995; Uhart and Andrade, 1995b, 1995c; Maddonni and Otegui, 2004; Paponov and Engels, 2003, 2005; Tokatlidis and Koutroubas, 2004; Fasoula and Tollenaar, 2005; Monneveux et al., 2005; Paponov et al., 2005a, 2005b; Subedi and Ma, 2005a, 2005b; Borrás et al., 2007; Echarte et al., 2008; Ham-mer et al., 2009), and (iii) provide (to the best of our knowl-edge) the first report on the morphophysiological responses of modern North American hybrids to the simultaneous stresses of intense crowding and low N availability. When combined with results from numerous studies in maize C and N physiol-ogy and metabolism, this experiment’s per-plant and canopy-level responses offer an incomplete but improved and relatively integrated understanding of the pre- and postflowering morphophysiological behavior of these genotypes in this high stress environment.
During preflowering growth and development in maize, N deficiency commonly results in reduced leaf emergence and expansion rates along with lower LAn values for a majority of emerged leaves (Hageman, 1986; Uhart and Andrade, 1995b; Paponov and Engels, 2003). Such responses commonly limit per-plant and canopy-level leaf area, thus restricting pre- and postflowering light interception, total dry matter accumula-tion, and kernel production (Hageman, 1986; Uhart and Andrade, 1995b; Paponov and Engels, 2003; Subedi and Ma, 2005a, 2005b; Echarte et al., 2008). Markedly lower R1 LÁT (Table 5) and LAIG (Fig. 8) values in this study’s 104,000 plants ha–1, 0 kg N ha–1 environment suggest impaired pro-duction and maintenance of green leaf area between seedling emergence and flowering. In fact, LÁT was so reduced by preflowering intraspecific competition in this environment that the improvement in LAIG often conferred by high plant densities (e.g., Tetio-Kagho and Gardner, 1988a; Cox, 1996)
was largely absent (Fig. 8). As indicated by responses for xL, NLT (Table 5), and LAn (Fig. 7), reductions in LÁT were primarily the outcome of enhanced N remobilization from and subsequent senescence of lower leaves in addition to reduced individual leaf area for most of the established canopy. Mea-surements of SPAD at V14 suggest that preflowering produc-tivity was further impaired in this environment by relatively low leaf chlorophyll content in the upper-canopy strata that likely lowered leaf absorptance and C exchange among these leaves (Echarte et al., 2008). When considered in conjunction with previously discussed allometric relationships (Andrade et al., 1999; Maddonni and Otegui, 2004; Pagano and Mad-donni, 2007), reduced PHT and sixth-internode SD at V14 and R1 (Table 4, Fig. 6) suggest that these multiple limitations on per-plant and canopy-level photoassimilate production restricted per-plant aboveground dry matter accumulation dur-ing the preflowering period.
While N deficiency can negatively impact preflowering maize productivity, it is particularly detrimental during the critical period bracketing silking (Paponov et al., 2005b). In general, final KNP is a function of dry matter accumulation (i.e., crop growth rate) during this roughly 30-d period (Otegui and Andrade, 2000; Maddonni and Otegui, 2004; Lee and Tol-lenaar, 2007). Deficiency of N before and/or during this stage increases leaf N remobilization, thus decreasing leaf chlorophyll content, light absorptance, C exchange, and radiation use efficiency during the critical period (Uhart and Andrade, 1995b; Echarte et al., 2008). Crop and ear growth rates are conse-quently reduced, with the latter more markedly impaired than the former (Uhart and Andrade, 1995b; Otegui and Andrade, 2000; Paponov et al., 2005a). Poor dry matter partitioning to reproductive sinks commonly results in reduced rates of silk elongation, failures in fertilization, increases in kernel abor-tion, and, ultimately, reductions in KNP, GYP, and HIP (Jacobs and Pearson, 1991; Uhart and Andrade, 1995c; Andrade et al., 1999; Tollenaar et al., 2000; Bänziger et al., 2002; Mon-neveux et al., 2005; Coque and Gallais, 2007). Compared with severely N-deficient conditions, supraoptimal levels of crowding often have similar impacts on KNP and GYP. Intense crowding results in strong intraspecific competition for available radiation during the 30 d bracketing silking. As in low-N conditions, the attenuation of per-plant radiation interception, an accompany-ing decline in leaf C exchange, a concomitant reduction in plant growth rate, and an inflexible pattern of assimilate distribution to reproductive sinks during the critical period lead to a dramatic reduction in ear growth rate, an increase in kernel abortion, and decreases in KNP, GYP, and HIP (Edmeades and Daynard, 1979b; Edmeades et al., 1979; Otegui and Bonhomme, 1998; Otegui and Andrade, 2000; Tollenaar et al., 2000; Maddonni and Otegui, 2004; Gallais and Coque, 2005; Pagano and Maddonni, 2007). In general, the imposition of abiotic stress during this period primarily affects KNP and GYP through increased kernel abortion; it has limited effect on KW (Otegui and Andrade, 2000; Tollenaar et al., 2000; Gallais and Coque, 2005). Overall, morphophysiological responses during the criti-cal period in this study suggest that these general physiological processes were largely responsible for the ultimately low KNP (Table 3), GYP (Fig. 3), and HIP (Fig. 4) values observed for the highly crowded, low N environment in each year.

1444 Agronomy Journa l • Volume101, Issue6 • 2009
Responses for R1 LÁT (Table 5) and SPAD (Fig. 9) indicate the combination of intense crowding and low N availability markedly reduced source activity during the critical period. As previously discussed, these LÁT and SPAD reductions principally resulted from enhanced preflowering leaf senes-cence and reduced individual leaf area. While the general shape (i.e., b coefficient) of the R1 green LAD curve (Table 5, Fig. 7) was not altered by these simultaneous stresses, both LAn values for leaves proximal to the ear (Fig. 7) and SPAD values for the earleaf itself (Fig. 9) were reduced. Because of their relative size, proximity to the developing ear, and high rates of photo-synthesis, such leaves supply a substantial percentage of the C compounds utilized for plant and ear growth (Edmeades et al., 1979; Dwyer et al., 1989, 1992; Wardlaw, 1990). Observed decreases in LAn values and leaf chlorophyll content near the ear therefore suggest restricted assimilate availability for plant and ear growth during the critical period in this experiment. Still, ear growth may have been partially buffered against shortages in photosynthesis by the mobilization of stem carbohydrate reserves (Tollenaar et al., 2000). Although ear growth was not directly measured in this experiment, ASIP was used as an indirect indicator of C flux to the developing ear around the time of silking (Edmeades et al., 1993, 2000; Borrás et al., 2007; Hammer et al., 2009). Numerous studies report an increase in ASIP and a corresponding decrease in KNP, GYP, and HIP in response to high plant density or low N availability (e.g., Jacobs and Pearson, 1991; Bertin and Gallais, 2000; Edmeades et al., 2000; Gallais and Coque, 2005; Borrás et al., 2007). In every year of this study, ASIP was greatest for the 104,000 plants ha–1, 0 kg N ha–1 treatment combination (Fig. 5), suggesting that restrictions in assimilate partition-ing to the ear during the critical period were at least partially responsible for the strongly depressed KNP, GYP, and HIP values of highly crowded, severely N-stressed plants.
Approximately 50% of total seasonal dry matter is accu-mulated during the postsilking period in maize, with a vast majority of this postsilking accumulation occurring in the grain (Bertin and Gallais, 2000; Tollenaar et al., 2004; Lee and Tollenaar, 2007). During this period, vegetative C may remobilize to developing grains in stress conditions (e.g., low N environments) or for certain genotypes (Uhart and Andrade, 1995a; He et al., 2002; Paponov and Engels, 2005). Still, grain biomass is largely the product of postsilking photosynthetic activity (Swank et al., 1982; Cliquet et al., 1990; He et al., 2002; Gallais and Coque, 2005). Kernel dry matter accu-mulation is therefore heavily dependent on the maintenance of photosynthesis during the grain-filling period (Bänziger et al., 2002; Luque et al., 2006; Lee and Tollenaar, 2007). Both high plant densities and N deficiency routinely acceler-ate leaf senescence in maize during the postsilking period. Although senescence provides kernels with requisite N via leaf N remobilization, it reduces postsilking leaf absorptance, leaf C exchange, photoassimilate production, VBP, TBP, and, consequently, KW, KNP, and GYP (Rajcan and Tollenaar, 1999a; Bänziger et al., 2002; Borrás et al., 2003; Paponov and Engels, 2003, 2005; Gallais and Coque, 2005; Coque and Gallais, 2007; Echarte et al., 2008). In this study, the simul-taneous stresses of intense crowding and low N availability severely reduced R3 and R5 earleaf SPAD values (Fig. 9) and
consistently induced premature declines in visual stay-green. Leaves proximal to the ear are a major source of kernel N dur-ing senescence (Cliquet et al., 1990; Coque and Gallais, 2007). Such SPAD responses therefore indicate pronounced early degradation of earleaf chloroplasts, marked premature remobi-lization of earleaf N to developing kernels, and, concomitantly, considerable loss of postsilking photosynthetic activity among leaves that can supply a substantial amount of C assimilates for kernel growth (Edmeades et al., 1979; Gan and Amasino, 1997; Echarte et al., 2008). Low KW, KNP, GYP, and HIP values in this study’s highly crowded, N-deficient environment (Table 3; Fig. 3, 5) were therefore likely partially the product of major reductions in postsilking C exchange (Rajcan and Tol-lenaar, 1999a; Paponov et al., 2005b).
Source strength during very early stages of grain-filling can largely determine kernel sink potential and KW through modifications in kernel growth rate during the effective grain-filling period (Gambín et al., 2006). Thus reductions in KW in this study’s highly stressed environment (Table 3) were likely the product of source limitations both shortly after silking and during latter portions of the grain-filling period. Severe source limitations during the grain-filling period can induce C remobilization from vegetative to reproductive tissues (Uhart and Andrade, 1995a). While this process may have occurred among these hybrids in this highly competitive environment, the absence of a strong sink combined with restrictions in preflowering source production and C exchange may have limited the impact of this process. Still, this mechanism may have supplemented postsilking photosynthesis in meeting the C demands of kernel dry matter accumulation during the grain-filling period.
Although root parameters were not measured in this experi-ment, it is likely that pronounced constraints in postflowering source activity in the 104,000 plants ha–1, 0 kg N ha–1 envi-ronment were physiologically linked with pre- and postsilk-ing root growth and N uptake dynamics. Deficiency of N in maize often results in greater root length, increased root dry matter, and a higher root/shoot ratio before, during, and after flowering (Eghball and Maranville, 1993; Durieux et al., 1994; McCullough et al., 1994b; Echarte et al., 2008). This increase in belowground growth is supported by enhanced transloca-tion of C assimilates from the shoot to the roots (Mackay and Barber, 1986). However, severe senescence in low N conditions can limit carbohydrate availability to the roots, thus restricting N uptake and enhancing leaf senescence (Gallais and Coque, 2005). Lower leaves typically supply a substantial amount of carbohydrates to the lower stem and root system (Fairey and Daynard, 1978; Edmeades et al., 1979; Wardlaw, 1990). However, severe lower leaf senescence in this study’s highly crowded, low N environment (Table 5) suggests this source of C assimilates may have been rather limited. As shown in Fig. 6C and 6F, early reductions in SD between V14 and R1 were evident for each plant density when no side-dress N was applied in 2007. Because of its ability to store carbohydrates and general proximity to the root system, the lower stem may have served as a C source for roots during the preflower-ing period to enhance N uptake and limit N remobilization (Rajcan and Tollenaar, 1999b; Coque and Gallais, 2007). Still, as suggested by low pre- and postanthesis SPAD values (Fig. 9);
Agronomy Journa l • Volume101, Issue6 • 2009 1445
pronounced senescence of lower leaves (Table 5); and high rates of decline for visual stay-green (Fig. 9); plants in the 104,000 plants ha–1, 0 kg N ha–1 environment were largely incapable of acquiring sufficient N to prevent pronounced N remobiliza-tion and subsequent reductions in GYP (Fig. 3). Though the data are not shown here, comparatively low shoot and grain N concentrations at physiological maturity in this environment confirmed limitations in N uptake.
Pronounced reductions in KW, KNP, GYP, and GYA in this study’s highly crowded, N-deficient environment may not have been solely related to the production and general activ-ity of source tissues. A number of studies suggest that poor N availability may limit kernel set through direct effects on C and N metabolism in developing grains. For example, Tsai et al. (1980) found that low N availability markedly reduced zein and glutelin deposition in developing maize kernels. This, they propose, limited sucrose transport into developing seeds, conse-quently restricting kernel dry matter accumulation. Singletary and Below (1990) similarly found lower endosperm concentra-tions of zein and glutelin in N-deficient conditions, but also discovered increased sucrose and decreased starch content in developing kernels. They therefore suggest that N deficiency limited endosperm dry weight primarily through a reduced capacity for starch synthesis. Previous experiments involving either stem infusion of C and N assimilates in the field or in vitro culture of maize kernels additionally found that N avail-ability had a direct impact on the ability of plants to utilize sugars for ear growth, potentially through effects on the activ-ity of enzymes directly involved in kernel C and N use (Below et al., 2000). In contrast to this collection of studies, Uhart and Andrade (1995c) found that N shortage had no direct effect on kernel set; impairment of KNP was solely the product of reduced C exchange.
Plant-to-plant variability for GYP is negatively correlated with resource use efficiency and, consequently, GYA (Tollenaar and Wu, 1999; Tokatlidis and Koutroubas, 2004; Fasoula and Tollenaar, 2005). Such variability can result from cultural (i.e., anthropogenic) practices and/or biological phenomena. Some cultural sources of variability include deviations in planting depth, seed spacing, and crop residue distribution, while biological sources of nonuniformity include variations in insect feeding, disease pressure, and soil type (Tokatlidis and Koutroubas, 2004; Andrade and Abbate, 2005). However, plant-to-plant nonuniformity is also the product of intense intraspecific competition for available resources (i.e., solar radiation, water, soil nutrients). As plant density increases in maize, greater competition between individual maize plants results in increased by-plant variability for GYP, its primary components (i.e., KW, KNP), and other morphophysiologi-cal traits (e.g., plant growth rate, ASIP, pre- and postsilking VBP and TBP) (Edmeades and Daynard, 1979a; Tollenaar and Wu, 1999; Maddonni and Otegui, 2004; Tokatlidis and Koutroubas, 2004; Andrade and Abbate, 2005; Maddonni and Otegui, 2006; Borrás et al., 2007; Pagano and Maddonni, 2007). In this study, GYCV generally rose with an increase in plant density regardless of N rate. However, it was the simultaneous stresses of severe crowding (i.e., 79,000 and/or 104,000 plants ha–1) and low fertilizer N availability that resulted in the greatest GYCV values (Fig. 3). As indicated
through previous eco- and morphophysiological examinations of this study’s individual plant responses (Boomsma and Vyn, 2006, 2007, 2008), these high GYCV values were primarily the product of intense intraspecific competition for available N (and potentially other limited resources). They were not principally the result of temporal (i.e., seedling emergence date) or spatial (i.e., within-row plant spacing) variability (data are not shown). Such competition encouraged the formation of plant hierarchies composed of “dominating” and “dominated” (see Maddonni and Otegui, 2004) individuals (Boomsma and Vyn, 2008), consequently leading to unequal resource sharing between plants, a reduction in overall resource use efficiency [e.g., overall NUE (GYA/NR) (Fig. 2)], and a subsequent decline in GYA in these highly crowded, low N environments (Fig. 2) (Tol-lenaar and Wu, 1999; Fasoula and Tollenaar, 2005).
CONCLUSIONSWhen grown at optimal and supraoptimal plant densities
with 165 kg ha–1 of side-dress N, this study’s stress-tolerant, highly productive, North American maize hybrids exhibited both strong N responsiveness (ΔGYA) and relatively high NUE (ΔGYA/ΔNR) (c.f., O’Neill et al., 2004; Cirilo et al., 2009). When N was applied roughly at or markedly above this location’s approximate agronomic optimal N rate (i.e., roughly 160 kg N ha–1), GYA values were very often similar among all plant densities. Such results suggest (i) optimal and supraopti-mal levels of crowding generally did not improve overall NUE (GYA/NR) relative to the suboptimal plant density, and (ii) this study’s genotypes exhibited a degree of plant density inde-pendence in this particular highly productive environment. Regardless of plant density, this experiment’s hybrids displayed HIP values in excess of the commonly presumed 0.5 value for modern North American genotypes when N was side-dress applied at 165 or 330 kg ha–1. Such results suggest that the HI of current North American genotypes may now exceed 0.5 when these hybrids are grown in highly productive environ-ments. While this experiment’s hybrids exhibited pronounced tolerance to high plant densities, this tolerance was heavily dependent on the application of side-dress N (e.g., side-dress N in excess of 165 kg ha–1 was more often required at the supraop-timal than optimal plant density to maximize GYA).
In the absence of side-dress N, these hybrids displayed low crowding tolerance, poor N stress tolerance, and, consequently, low values for GYA. Markedly low grain production in the highly crowded, low N environment (i.e., 104,000 plants ha–1, 0 kg N ha–1) was primarily the product of intense intraspecific competition for available N. This severe competition resulted in a number of per-plant and canopy-level morphophysiologi-cal responses including, but not limited to, (i) reduced pre- and postanthesis PHT, SD, VBP, and TBP; (ii) greater preflowering lower leaf senescence, lower R1 individual leaf area for most of the nonsenesced canopy, and, consequently, reduced R1 LAP and LAIG; (iii) enhanced temporal separation between male and female floral maturity; (iv) lower pre- and postanthesis leaf N and chlorophyll content and decreased visual stay-green during the grain-filling period; (v) lower KW, KNP, GYP, and HIP, and (vi) higher GYCV. Based on these responses, we suggest that poor grain production in this highly competitive environment was primarily the result of (i) reduced production

1446 Agronomy Journa l • Volume101, Issue6 • 2009
and activity of source tissues during the presilking period, (ii) decreased plant growth and markedly abated assimilate parti-tioning to the developing ear during the critical period bracket-ing silking, (iii) early remobilization of leaf N and subsequent reduction in C assimilation during the grain-filling period, and (iv) enhanced plant-to-plant variability for key morphophysi-ological traits (expressed ultimately in high GYCV). Overall, the observed combination at the supraoptimal plant density of (i) low crowding tolerance in the absence of side-dress N, (ii) relatively poor low N tolerance, (iii) strong N responsiveness to 165 kg ha–1 of side-dress N, and (iv) frequent GYA response to a second side-dress N application indicates that N application was more essential for optimizing maize productivity at the supraoptimal than suboptimal or optimal plant density for this study’s genotypes.
While the results of this study provide an understanding of the morphophysiological behavior of modern maize genotypes in highly crowded, low-N environments, they also provide guidance for future maize advancement, particularly in the area of N stress tolerance. This experiment’s responses for GYA suggest that tolerance to high plant densities is strongly contin-gent on adequate N application. As indicated by the poor GYA of the 104,000 plants ha–1, 0 kg N ha–1 treatment combina-tion in all 3 yr of this study, the downside risk to N deficiency is much greater in highly crowded environments. Considering the necessity for high N application rates at high plant densi-ties, the frequently high and continually fluctuating price of N fertilizer, the unpredictable effects of weather on N availability, and environmental concerns over excessive N fertilization, losses in GYA resulting from N deficiency may increase with the progressive movement of productive North American maize systems to higher plant densities. Consequently, we propose that efforts aimed at improving a genotype’s high plant density tolerance should simultaneously focus on enhancing that genotype’s N stress tolerance and NUE. As evidenced by the literature reviewed and the results discussed in this publication, low N availability and intense plant crowding can generate similar morphophysiological responses in maize [e.g., attenuated per-plant radiation interception, decreased plant growth rate, and markedly reduced ear biomass accumula-tion during the critical period (Uhart and Andrade, 1995b; Paponov et al., 2005a; Edmeades et al., 2000; Maddonni and Otegui, 2004)]. While the genetic, metabolic, and physiologi-cal mechanisms underlying these comparable responses can differ pronouncedly by stressor, selection for some traits may improve hybrid tolerance to each of these abiotic stresses [e.g., reduced ASIP (Edmeades et al., 2000)]. Based on this study’s results and much of the literature cited in this publication (e.g., Tollenaar and Wu, 1999; Edmeades et al., 2000; Ote-gui and Andrade, 2000; Maddonni and Otegui, 2004; Lee and Tollenaar, 2007), we suggest that genetic efforts aimed at improving maize tolerance to the simultaneous stresses of high plant density and low N availability focus initially on (i) improving crop growth and biomass partitioning to the ear during the critical period bracketing silking, (ii) maintaining photosynthetically active leaf area (i.e., functional stay-green) and kernel dry matter accumulation during the grain-filling period, and (iii) enhancing season-long plant-to-plant unifor-mity through improved above- and belowground per-plant
morphophysiological plasticity. Although the maize research community knows the least about mechanism (iii), its fur-ther understanding and improvement may hold considerable potential for the future advancement of maize abiotic stress tolerance. It is the aboveground aspects of this mechanism which will be intensively examined in this study’s subsequent publications.
APPENDIXModel Use and General Theory
Because extensive measurements were taken on the same approximately 4000 tagged plants from seedling emergence through physiological maturity each year, an accurate, rapid, low-cost, nondestructive technique was needed to measure the LAP and LAD of each tagged plant at R1. Pagano and Mad-donni (2007) recently determined LAP at R1 by multiplying leaf length (L) × maximum leaf width (W) × 0.75 (Mont-gomery, 1911) for all green leaves on each plant. However, this procedure was too labor-intensive, time-consuming, and costly for this study’s purposes and available resources. To meet these unique needs, a modification of the model and techniques used by Dwyer and Stewart (1986) and Valentinuz and Tollenaar (2006) to describe leaf area development and the LAD of all initiated leaves (i.e., from the first seedling leaf to the upper-most leaf beneath the tassel) was employed. Here we describe this method in detail.
According to Dwyer and Stewart (1986), the LAD for all initiated leaves on a maize plant resembles a slightly skewed bell-shaped curve. This curve is described by the model:
LAn = LAo × exp[–b(xn – xo)2 + c(xn – xo)
3] [A1]
where LAn is the fully expanded area of the nth leaf, LAo is the fully expanded area of the largest leaf and dictates the ampli-tude of the function, xn is the position on the stem of the nth leaf (leaves numbered from the bottom to the top of the plant for all initiated leaves), xo is the position on the stem of the larg-est leaf and is the point of inflection of the curve, and b and c are coefficients that describe the breadth/kurtosis and skewness of the distribution of leaf area for all initiated leaves, respec-tively (Dwyer and Stewart, 1986; Elings, 2000; Valentinuz and Tollenaar, 2006).
In-Field Measurements
To rapidly and nondestructively determine the LAP and LAD of tagged plants at R1 in 2006 and 2007 using a modification of this model, a destructive sampling area was established in row three of each six-row sub-subplot. In each of these areas, three consecutive, representative plants were tagged and removed (cutting at the stem base) at R1 (12 plants per hybrid-plant density-N rate treatment combination, 216 plants in total per year). In each sub-subplot, these areas were at least 3 m from the nondestructive per-plant sampling area and 4 m from the sub-subplot border (intrarow distances). To account for reductions in GYA caused by the removal of these plants, the linear distance from the point midway between plant one and its respective nonsampled neighbor to the point midway between plant three and its respective nonsampled neighbor was measured for each sub-subplot’s three consecutive
Agronomy Journa l • Volume101, Issue6 • 2009 1447
plants. This distance was multiplied by the interrow spacing to determine the area of plant removal. For each sub-subplot, this area of destructive sampling was subtracted from the area used for determination of GYA. In both 2006 and 2007, rep-resentative plants for destructive sampling were chosen based on overall visual similarity (i.e., size, lower leaf senescence) to tagged plants in nondestructive per-plant sampling areas. On each of these destructively sampled plants, L and W were measured for all green leaves [i.e., those leaves with greater than 50% of their area still green (Rajcan and Tollenaar, 1999a)]. As with Valentinuz and Tollenaar (2006), L was measured along the midrib as the distance from the collar to the tip. As proposed by Montgomery (1911) and employed by numerous others (e.g., Maddonni and Otegui, 1996; Stewart and Dwyer, 1999; Elings, 2000; Pagano and Maddonni, 2007), the LAn of each green leaf was calculated by multiplying L by W by 0.75. Unlike plants in the nondestructive per-plant sampling areas, the phenology of these plants was not measured throughout the growing season.
For all plants in the nondestructive per-plant sampling areas, earleaf position (xe) was determined relative to the location of each plant’s tag. Since the phenology of destructively sampled plants was not tracked, values for xe from tagged plants were used to estimate xe for destructively sampled plants. For tagged plants in both 2006 and 2007, neither plant density nor N rate had a substantial impact on xe (i.e., means for xe differed by less than 0.5 leaf positions), although the plant density effect was significant in both years (Table 5). However, the effects of year (data are not shown) and hybrid were more pronounced (i.e., means for xe differed by greater than 0.5 leaf positions), with the hybrid effect significant in both years (Table 5). Based on these results, values for xe were set for destructively sampled plants of each hybrid by year irrespective of plant density and N rate. These values were 15 and 14 for hybrid Pioneer 31G68 in 2006 and 2007, respectively, and 14 and 13 for hybrid Pioneer 31N28 in 2006 and 2007, respectively. For all destruc-tively sampled plants, xo and xn (for green leaves only) were determined relative to these set values for xe. For destructively sampled plants within a hybrid-plant density-N rate treatment combination, xo, the total number of green leaves (NLT), and the positions of the lowest (xL) and highest (xH) green leaves were highly uniform (data are not shown). However, each treatment factor often significantly affected the values of these parameters in both years (Table 5). An average value for xo was therefore calculated for each hybrid-plant density-N rate treatment combination. Since determining xo for all tagged plants was impractical, these average values were then used to estimate xo by hybrid-plant density-N rate treatment combina-tion for all plants within nondestructive sampling areas. To ensure that the xo of a treatment combination’s destructively sampled plants was an accurate estimate of xo for tagged plants of that same treatment combination, the true xo was verified for five consecutive, representative, tagged plants in each per-plant sampling area. Using estimated values for xo, the area of the largest green leaf of tagged plants (LÁo) was determined at R1 in both 2006 and 2007 using the same method as previously described (i.e., L × W × 0.75).
Model SelectionWhereas Eq. [A1] is a “robust predictor of the area-per-leaf
profile in maize” when the area of all initiated, fully expanded leaves is measured (Valentinuz and Tollenaar, 2006), it may not be as useful an estimator of LAP and LAD at a single postan-thesis phenological stage. This may be particularly true when plants are grown at a supraoptimal density or when abiotic stress (e.g., limited N or water availability) is severe. In each of these scenarios, lower leaf senescence can be pronounced and the left half of the slightly skewed bell-shaped curve described by Valentinuz and Tollenaar (2006) may be nearly or entirely missing. In such cases, the LAD would no longer resemble the slightly skewed bell-shaped curve described by Dwyer and Stewart (1986) and Valentinuz and Tollenaar (2006). Other functions that might more accurately describe the LAD at R1 were therefore considered for all destructively sampled plants. In addition to Eq. [A1], the following functions were evaluated on a by-plant basis:
LAn = LAo × exp[–b(xn – xo)2] [A2]
LAn = LAo × [a + d(xn – xo) + f(xn – xo)2] [A3]
LAn = LAo × [a + d(xn – xo)] [A4]
LAn = LAo × [a + f(xn – xo)2] [A5]
where LAn, LAo, n, xn, xo, and b are as described for Eq. [A1], and a, d, and f are model coefficients. For Eq. [A1] through [A5], the position of each green leaf was set relative to xo (such that a describes the intercept of the curve at xo for Eq. [A3] through [A5]). The b and c coefficients in Eq. [A1] and [A2] were estimated using the SAS NLIN procedure (SAS Institute, 2004), with starting parameter values (b = 0.03, 0.05; c = 0.00014, 0.00016) estimated from Valentinuz and Tollenaar (2006). Regression analyses for Eq. [A3] through [A5] were performed using the SAS GLM procedure (SAS Institute, 2004).
For each of the 432 plants, the best model was identified using the following criteria: (i) all model parameters were sig-nificant at the 0.05 probability level, (ii) the overall model was significant at the 0.05 probability level, and (iii) the model had the lowest P value among all significant models. Based on these selection criteria, Eq. [A2] provided the best fit for approxi-mately 80% of the plants. For nearly all remaining plants, Eq. [A1] was the best model, but in these circumstances, its fit was only slightly better than that of Eq. [A2]. Given these results and the greater simplicity of Eq. [A2], we chose to use Eq. [A2] for all subsequent calculations of LAP and LAD at R1.
Model Implementation
For implementation of Eq. [A2] in this study, the position of each green leaf was set relative to xo for all destructively sampled plants. For the three destructively sampled plants within a sub-subplot, an average sub-subplot-level value for LAo was calculated. Using Eq. [A2], sub-subplot-level LAo values, and SAS PROC NLIN (starting values for b = 0.03, 0.05), a single b coefficient was generated for each sub-subplot based on the leaf measurements of the three plants destructively sampled

1448 Agronomy Journa l • Volume101, Issue6 • 2009
within that sub-subplot. The predicted area of every green leaf (LÂn) was resultantly determined for each of these plants. The total predicted green leaf area of each of these plants (LÂT) was then calculated as the sum of each plant’s LÂn values. The total observed/measured green leaf area of each destructively sampled plant (LAT) was similarly calculated as the sum of green LAn values.
The total area of all initiated leaves on an individual maize plant can be related to the area of a single leaf representing a relatively large proportion of total leaf area (Pearce et al., 1975; Elings, 2000). As such, the total green leaf area at R1 of each tagged, nondestructively sampled plant (LÁT) within a sub-subplot was calculated as follows:
LÁT = LÂT × (LÁo/LAo) [A6]
where LÁo is the area of the largest leaf of the tagged plant and LÂT and LAo are the average total predicted leaf area and average area of the largest leaf of destructively sampled plants from that same sub-subplot, respectively. The total green leaf area (m2) at R1 of each nondestructive per-plant sampling area (LÁSA) was calculated as the sum of all LÁT values for that sampling area. For each per-plant sampling area, the LAIG at R1 was calculated as:
LAIG = LÁSA/6.08 [A7]
where 6.08 is the total soil surface area (m2) of each sampling area.
It should be noted that, while values for LAT, LÂT, and LÁT were numerically similar in 2006, LÁT values were pronouncedly less than LAT and LÂT values in 2007. Low LÁT values in the second growing season primarily resulted from LÁo values being consistently numerically smaller than LAo values (Table 5). Such results for 2007 suggest that plants sampled in destructive sampling areas were not perfectly repre-sentative of plants measured in nondestructive sampling areas in this growing season. This likely resulted from the inadver-tent selection of slightly larger plants for destructive-sampling purposes. Still, considering patterns of lower leaf senescence were similar between destructive and nondestructive sampling areas and treatment effects had little impact on b values, plant sampling errors likely had minimal effect on 2007 results for all per-plant leaf area parameters.
Model Validation
The ability of Eq. [A2] to predict both the area of individual green maize leaves and total per-plant green leaf area at R1 was evaluated using two independent datasets. Data for model validation was collected in 2008 at two locations: ACRE and the Pinney-Purdue Agricultural Center (PPAC) (41°26́ 41˝ N, 86°56́ 41˝ W) in Wanatah, IN.
For the experiment at ACRE, maize was grown following soybean. Recommended practices were followed for the control of weeds and insect pests. The experiment was arranged as a split plot design with six blocks. Hybrid (main plot) and plant density (subplot) served as the two treatment factors. Each subplot consisted of four rows (76-cm interrow spacing) and was approximately 3.0 m in width and 15.0 m in length. While
the experiment involved four modern hybrids and six plant densities, sampling was limited to only two hybrids [DEKALB DKC61–69 (VT3) and DEKALB DKC61–19 (VT3)] and three plant densities (49,000, 74,000, and 99,000 plants ha–1) in a single block. Both hybrids were planted at rates of 53,000, 78,000, and 103,000 seeds ha–1 to achieve the desired final plant densities. For those subplots from which leaf measurements were taken, plant density measurements at V6 rarely differed from target plant densities by more than 5% (data are not shown). In all subplots, starter fertilizer [ammonium nitrate (33.5–0–0)] was applied at planting 5 cm to the side and 5 cm below the seed at a rate equivalent to 35 kg N ha–1 and UAN was applied via side-dressing at V5 at a rate equivalent to 180 kg N ha–1.
At PPAC, the soil was a Runnymede (fine-loamy, mixed, mesic Typic Argiaquolls) loam with approximately 3% organic matter content in the top 30 cm of the soil profile. The experi-mental area had <2% slope. The modern maize hybrid Pioneer 34A20 was grown following soybean. Recommended practices were followed for the control of weeds and insect pests. The experiment was arranged as a randomized complete block design with four blocks. In addition to a no N control, treat-ments were a factorial combination of (i) type of starter fertil-izer, (ii) rate of starter fertilizer, and (iii) timing of side-dress N application. Each plot consisted of 12 rows (76-cm interrow spacing) and was approximately 3.0 m in width and 15.0 m in length. While the experiment involved eight treatment combinations and a no-N control, sampling was limited to only the no-N control and a treatment combination involving the application of 19–17–0 starter fertilizer (at planting, 5 cm to the side and 5 cm below the seed) at a rate equivalent to 45 kg N ha–1 followed by the side-dressing of UAN at V4 at a rate equivalent to 135 kg N ha–1. Leaf area measurements were fur-ther limited to only two blocks. Seeds were sown at a density of 83,000 plants ha–1 to achieve a final stand density of 79,000 plant ha–1. For those plots from which leaf measurements were taken, plant density measurements at V6 rarely differed from target plant densities by more than 3% (data are not shown).
At both locations, seven consecutive, representative plants were tagged and removed (cutting at the stem base) at R1 from row three of each designated plot. In each plot, these plants were at least 2 m from the plot border (intrarow distance). As previously described, L and W were measured for all green leaves on each of these plants, and LAn was calculated by mul-tiplying L × W × 0.75. The position of each green leaf was set relative to xo for all plants.
Predicting the area of individual green maize leaves first involved calculating an average, plot-level value for LAo for plants one through three. Using Eq. [A2], these plot-level LAo values, and SAS PROC NLIN (starting values for b = 0.03, 0.05), a single LAD curve (i.e., b coefficient) was generated for each plot based on the individual leaf measurements of only these first three plants. For each plot, the b coefficient was sig-nificant at the 0.01 probability level. Using Eq. [A2] and appro-priate model coefficients from the first three plants, values for LÂn were calculated by plant for plants four through seven of each plot. Using SAS PROC REG (SAS Institute, 2004), LÂn was regressed on LAn both by and across location(s) using plants four through seven from all plots. The linear relation-ship between LÂn and LAn was highly significant both by

Agronomy Journa l • Volume101, Issue6 • 2009 1449
(ACRE: R2 = 0.88, P ≤ 0.01; PPAC: R2 = 0.89, P ≤ 0.01) and across [Fig. A1(A)] location(s). Across locations, the slope was slightly less than one (P = 0.02), indicating that the use of Eq. [A2] and the techniques employed may have slightly underes-timated the LAn value of green leaves. Still, across-location values for the coefficient of determination and slope [Fig. A1(A)] were only slightly lower and higher, respectively, than those reported by Valentinuz and Tollenaar (2006) in their comparison of observed individual leaf area values
with estimated individual leaf area values (determined using Eq. [A1]) for all initiated leaves.
For plants four to seven of each plot, the parameters LÂT and LAT were calculated as the sum of each plants LÂn and LAn values, respectively, and LÁT was estimated using Eq. [A6]. In this case, LÁo represents the area of the largest leaf of a single plant (from plants four through seven) and LÂT and LAo represent the average total predicted leaf area and average area of the largest leaf of destructively sampled plants one through three from that same plot, respectively. Using SAS PROC REG, LÁT was regressed on LAT both by and across location(s) using plants four through seven from all plots. The linear rela-tionship between LÁT and LAT was highly significant both by (ACRE: R2 = 0.81, P ≤ 0.01; PPAC: R2 = 0.84, P ≤ 0.01) and across [Fig. A1(B)] location(s). Across locations, the slope was not different from one (P = 0.10), indicating that Eq. [A6] and the techniques employed likely accurately estimated LAT values. Overall, given the various demands and restrictions of this experiment, this technique proved to be a relatively accu-rate, rapid, low-cost technique for nondestructively determin-ing the green LAP and green LAD of a large number of maize plants at silking.
ACKNOWLEDGMENTS
Funding for this research was provided by a Pioneer Fellowship in Plant Sciences (2006–2009), a Purdue University Andrews Foundation Fellowship (2004–2006), and the Purdue Research Foundation. Pioneer Hi-Bred Intl., Inc. provided seed and Deere & Company loaned field and automatic guidance equipment for this study. We express our thanks to numerous field technicians, undergraduate and graduate students, and volunteers for their extensive and indispensible help in both the field and laboratory. Special thanks to research agronomist T.D. West and the staff at the Purdue University Agronomy Center for Research and Education (ACRE) for help in establishing and managing this study’s research plots. Gratitude is also expressed to J.J. Camberato, R.D. Edwards, and an anon-ymous reviewer for helpful suggestions on the manuscript.
REFERENCESAndrade, F.H. 1995. Analysis of growth and yield of maize, sunflower and soy-
bean grown at Balcarce, Argentina. Field Crops Res. 41:1–12.Andrade, F.H., and P.E. Abbate. 2005. Response of maize and soybean to vari-
ability in stand uniformity. Agron. J. 97:1263–1269.Andrade, F.H., C. Vega, S. Uhart, A. Cirilo, M. Cantarero, and O. Valentinuz.
1999. Kernel number determination in maize. Crop Sci. 39:453–459.Bänziger, M., G.O. Edmeades, and H.R. Lafitte. 2002. Physiological mecha-
nisms contributing to the increased N stress tolerance of tropical maize selected for drought tolerance. Field Crops Res. 75:223–233.
Barbieri, P.A., H.E. Echeverría, H.R. Saínz Rozas, and F.H. Andrade. 2008. Nitrogen use efficiency in maize as affected by nitrogen availability and row spacing. Agron. J. 100:1094–1100.
Baxter Codeworks. 2004. DataGet Port Instructions for Version 2.6. Baxter Codeworks, Portland, OR.
Below, F.E., J.O. Cazetta, and J.R. Seebauer. 2000. Carbon/nitrogen interac-tions during ear and kernel development of maize. p. 15–24. In M. West-gate and K. Boote (ed.) Physiology and modeling kernel set in maize. Proc. of a Symp. Sponsored by Div. C-2 and A-3 of the CSSA and the ASA, Baltimore, MD. 18–22 Oct. 1998. CSSA and ASA, Madison, WI.
Bertin, P., and A. Gallais. 2000. Genetic variation for nitrogen use efficiency in a set of recombinant inbred lines: I. Agrophysiological results. Maydica 45:53–66.
Bollero, G.A., D.G. Bullock, and S.E. Hollinger. 1996. Soil temperature and planting date effects on corn yield, leaf area, and plant development. Agron. J. 88:385–390.
Fig. A1. Regression of (A) predicted individual leaf area (LÂn) on observed individual leaf area (LAn) and (B) estimated total green leaf area (LÁT) on observed total green leaf area (LAT). Each data point represents either the area of an individual green maize leaf (A) or the total green leaf area of an individual maize plant (B). Measurements were taken at R1 (Ritchie et al., 1996) at either the Purdue University Agronomy Center for Research and Education (ACRE) or Pinney-Purdue Agricultural Center (PPAC). Solid lines and accompanying statistics for both (A) and (B) describe regression relationships across locations. Dashed lines for both (A) and (B) indicate theoretical 1:1 relationships between the respective variables. N, number of observations; R2, coefficient of determination; ** Significant at the 0.01 probability level.

1450 Agronomy Journa l • Volume101, Issue6 • 2009
Bonaparte, E.E.N.A., and R.I. Brawn. 1975. The effect of intraspecific com-petition on the phenotypic plasticity of morphological and agronomic characters of four maize hybrids. Ann. Bot. (London) 39:863–869.
Boomsma, C.R., and T.J. Vyn. 2006. Intraspecific competition in corn: Nitro-gen rate and plant density effects on growth and developmental unifor-mity. In Annual meetings abstracts [CD-ROM]. ASA, CSSA, and SSSA, Madison, WI.
Boomsma, C.R., and T.J. Vyn. 2007. Physiological dynamics of plant-to-plant variability in maize at multiple plant densities. In Annual meetings abstracts [CD-ROM]. ASA, CSSA, and SSSA, Madison, WI.
Boomsma, C.R., and T.J. Vyn. 2008. Resource availability and intra-specific competition in maize: An eco-physiological perspective. In Annual meet-ings abstracts [CD-ROM]. ASA, CSSA, and SSSA, Madison, WI.
Borrás, L., G.A. Maddonni, and M.E. Otegui. 2003. Leaf senescence in maize hybrids: Plant population, row spacing, and kernel set effects. Field Crops Res. 82:13–26.
Borrás, L., M.E. Westgate, J.P. Astini, and L. Echarte. 2007. Coupling time to silking with plant growth rate in maize. Field Crops Res. 102:73–85.
Bradshaw, A.D. 1965. Evolutionary significance of phenotypic plasticity in plants. Adv. Genet. 13:115–155.
Brouder, S.M., and D.B. Mengel. 2003. The presidedress soil nitrate test for improving N management in corn, AY-314-W. Coop. Ext. Serv., Purdue Univ., West Lafayette, IN.
Bruns, H.A., and H.K. Abbas. 2003. Effects of plant populations on maize hybrids in the sub-tropical Mid South USA. Maydica 48:21–27.
Bunce, J.A. 1990. Afternoon inhibition of photosynthesis in maize: I. Evidence, and relationship to stand density. Field Crops Res. 24:251–260.
Çakir, R. 2004. Effect of water stress at different development stages on vegeta-tive and reproductive growth of corn. Field Crops Res. 89:1–16.
Cardwell, V.B. 1982. Fifty years of Minnesota corn production: Sources of yield increase. Agron. J. 74:984–990.
Cassman, K.G., A. Dobermann, D.T. Walters, and H. Yang. 2003. Meeting cereal demand while protecting natural resources and improving envi-ronmental quality. Annu. Rev. Environ. Resour. 28:315–358.
Chapman, S.C., and H.J. Barreto. 1997. Using a chlorophyll meter to estimate specific leaf nitrogen of tropical maize during vegetative growth. Agron. J. 89:557–562.
Cirilo, A.G., J. Dardanelli, M. Balzarini, F.H. Andrade, M. Cantarero, S. Luque, and H.M. Pedrol. 2009. Morpho-physiological traits associated with maize crop adaptations to environments differing in nitrogen avail-ability. Field Crops Res. 113:116–124.
Cliquet, J., E. Deléens, and A. Mariotti. 1990. C and N mobilization from stalk and leaves during kernel filling by 13C and 15N tracing in Zea mays L. Plant Physiol. 94:1547–1553.
Coque, M., and A. Gallais. 2007. Genetic variation among European maize varieties for nitrogen use efficiency under low and high nitrogen fertiliza-tion. Maydica 52:383–397.
Cox, W. 1996. Whole-plant physiological and yield responses of maize to plant density. Agron. J. 88:489–496.
Cross, H.Z., and M.S. Zuber. 1972. Prediction of flowering dates in maize based on different methods of estimating thermal units. Agron. J. 64:351–355.
Ding, L., K.J. Wang, G.M. Jiang, D.K. Biswas, H. Xu, L.F. Li, and Y.H. Li. 2005. Effects of nitrogen deficiency on photosynthetic traits of maize hybrids released in different years. Ann. Bot. (London) 96:925–930.
Durieux, R.P., E.J. Kamprath, W.A. Jackson, and R.H. Moll. 1994. Root distribution of corn: The effect of nitrogen fertilization. Agron. J. 86:958–962.
Duvick, D.N. 1997. What is yield? p. 332–335. In G.O. Edmeades et al. (ed.) Developing drought- and low N-tolerant maize. Proc. of a Symp., El Batán, Mexico. 25–29 Mar. 1996. CIMMYT, El Batán, Mexico.
Duvick, D.N. 2001. Biotechnology in the 1930s: The development of hybrid maize. Nat. Rev. Genet. 2:69–74.
Duvick, D.N. 2005. The contribution of breeding to yield advances in maize (Zea mays L.). Adv. Agron. 86:83–145.
Duvick, D.N., and K.G. Cassman. 1999. Post-Green Revolution trends in yield potential of temperate maize in the north-central United States. Crop Sci. 39:1622–1630.
Dwyer, L.M., A.M. Anderson, B.L. Ma, D.W. Stewart, M. Tollenaar, and E. Gregorich. 1995a. Quantifying the nonlinearity in chlorophyll meter response to corn leaf nitrogen concentration. Can. J. Plant Sci. 75:179–182.
Dwyer, L.M., A.M. Anderson, D.W. Stewart, B.L. Ma, and M. Tollenaar. 1995b. Changes in maize hybrid photosynthetic response to leaf nitro-gen, from preanthesis to grain fill. Agron. J. 87:1221–1225.
Dwyer, L.M., and D.W. Stewart. 1986. Leaf area development in field-grown maize. Agron. J. 78:334–343.
Dwyer, L.M., D.W. Stewart, D. Balchin, L. Houwing, C.J. Marur, and R.I. Hamilton. 1989. Photosynthetic rates of six maize cultivars during devel-opment. Agron. J. 81:597–602.
Dwyer, L.M., D.W. Stewart, L. Carrigan, B.L. Ma, P. Neave, and D. Balchin. 1999. Guidelines for comparisons among different maize maturity rat-ings systems. Agron. J. 91:946–949.
Dwyer, L.M., D.W. Stewart, R.I. Hamilton, and L. Houwing. 1992. Ear posi-tion and vertical distribution of leaf area in corn. Agron. J. 84:430–438.
Dwyer, L.M., and M. Tollenaar. 1989. Genetic improvement in photosyn-thetic response of hybrid maize cultivars, 1959 to 1988. Can. J. Plant Sci. 69:81–91.
Dwyer, L.M., M. Tollenaar, and L. Houwing. 1991. A nondestructive method to monitor leaf greenness in corn. Can. J. Plant Sci. 71:505–509.
Earl, H.J., and M. Tollenaar. 1997. Maize leaf absorptance of photosyntheti-cally active radiation and its estimation using a chlorophyll meter. Crop Sci. 37:436–440.
Echarte, L., and F.H. Andrade. 2003. Harvest index stability of Argentinean maize hybrids released between 1965 and 1993. Field Crops Res. 82:1–12.
Echarte, L., F.H. Andrade, C.R.C. Vega, and M. Tollenaar. 2004. Kernel num-ber determination in Argentinean maize hybrids released between 1965 and 1993. Crop Sci. 44:1654–1661.
Echarte, L., S. Rothstein, and M. Tollenaar. 2008. The response of leaf photo-synthesis and dry matter accumulation to nitrogen supply in an older and a newer maize hybrid. Crop Sci. 48:656–665.
Echarte, L., and M. Tollenaar. 2006. Kernel set in maize hybrids and their inbred lines exposed to stress. Crop Sci. 46:870–878.
Edmeades, G.O., J. Bolaños, A. Elings, J.-M. Ribaut, M. Bänziger, and M.E. Westgate. 2000. The role and regulation of the anthesis–silking interval in maize. p. 43–73. In M. Westgate and K. Boote (ed.) Physiology and modeling kernel set in maize. Proc. of a Symp. Sponsored by Div. C-2 and A-3 of the CSSA and the ASA, Baltimore, MD. 18–22 Oct. 1998. CSSA and ASA, Madison, WI.
Edmeades, G.O., J. Bolaños, M. Hernández, and S. Bello. 1993. Causes for silk delay in a lowland tropical maize population. Crop Sci. 33:1029–1035.
Edmeades, G.O., and T.B. Daynard. 1979a. The development of plant-to-plant variability in maize at different planting densities. Can. J. Plant Sci. 59:561–576.
Edmeades, G.O., and T.B. Daynard. 1979b. The relationship between final yield and photosynthesis at flowering in individual maize plants. Can. J. Plant Sci. 59:585–601.
Edmeades, G.O., N.A. Fairey, and T.B. Daynard. 1979. Influence of plant den-sity on the distribution of 14C-labelled assimilate in maize at flowering. Can. J. Plant Sci. 59:577–584.
Eghball, B., and J.W. Maranville. 1993. Root development and nitrogen influx of corn genotypes grown under combined drought and nitrogen stresses. Agron. J. 85:147–152.
Elings, A. 2000. Estimation of leaf area in tropical maize. Agron. J. 92:436–444.
Fairey, N.A., and T.B. Daynard. 1978. Assimilate distribution and utilization in maize. Can. J. Plant Sci. 58:719–730.
Fasoula, V.A., and M. Tollenaar. 2005. The impact of plant population density on crop yield and response to selection in maize. Maydica 50:39–48.
Fournier, C., and B. Andrieu. 2000. Dynamics of the elongation of inter-nodes in maize (Zea mays L.): Analysis of phases of elongation and their relationships to phytomer development. Ann. Bot. (London) 86:551–563.
Gallais, A., and M. Coque. 2005. Genetic variation and selection for nitrogen use efficiency in maize, a synthesis. Maydica 50:531–547.
Gambín, B.L., L. Borrás, and M.E. Otegui. 2006. Source-sink relations and kernel weight differences in maize temperate hybrids. Field Crops Res. 95:316–326.

Agronomy Journa l • Volume101, Issue6 • 2009 1451
Gan, S., and R.M. Amasino. 1997. Making sense of senescence. Molecular genetic regulation and manipulation of leaf senescence. Plant Physiol. 113:313–319.
Girardin, P., and M. Tollenaar. 1994. Effects of intra-specific interference on maize leaf azimuth. Crop Sci. 34:151–155.
Glenn, F.B., and T.B. Daynard. 1974. Effects of genotype, planting pattern, and plant density on plant-to-plant variability and grain yield of corn. Can. J. Plant Sci. 54:323–330.
Hageman, R.H. 1986. Nitrate metabolism in roots and leaves. p. 105–116. In J.C. Shannon et al. (ed.) Regulation of carbon and nitrogen reduction and utilization in maize. Waverly Press, Baltimore, MD.
Hammer, G.L., Z. Dong, G. McLean, A. Doherty, C. Messina, J. Schussler, C. Zinselmeier, S. Paszkiewicz, and M. Cooper. 2009. Can changes in canopy and/or root system architecture explain historical maize yield trends in the U.S. Corn Belt? Crop Sci. 49:299–312.
Hashemi, A.M., S.J. Herbert, and D.H. Putnam. 2005. Yield response of corn to crowding stress. Agron. J. 97:839–846.
He, P., W. Zhou, and J. Jin. 2002. Effect of nitrogen application on redistribu-tion and transformation of photosynthesized 14C during grain forma-tion in two maize cultivars with different senescence appearance. J. Plant Nutr. 25:2443–2456.
Hirel, B., P. Bertin, I. Quilleré, W. Bourdoncle, C. Attagnant, C. Dellay, A. Gouy, S. Cadiou, C. Retailliau, M. Falque, and A. Gallais. 2001. Towards a better understanding of the genetic and physiological basis for nitrogen use efficiency in maize. Plant Physiol. 125:1258–1270.
Jacobs, B.C., and C.J. Pearson. 1991. Potential yield of maize, determined by rates of growth and development of ears. Field Crops Res. 27:281–298.
Jones, R.M., M.A. Sanderson, J.C. Read, and A.C. Lovell. 1995. Manage-ment of corn for silage production in south central USA. J. Prod. Agric. 8:175–180.
Lee, E.A., and M. Tollenaar. 2007. Physiological basis of successful breeding strategies for maize grain yield. Crop Sci. 47(S3):S202–S215.
Luque, S.F., A.G. Cirilo, and M.E. Otegui. 2006. Genetic gains in grain yield and related physiological attributes in Argentine maize hybrids. Field Crops Res. 95:383–397.
Ma, B.L., and L.M. Dwyer. 1998. Nitrogen uptake and use of two contrasting maize hybrids differing in leaf senescence. Plant Soil 199:283–291.
Mackay, A.D., and S.A. Barber. 1986. Effect of nitrogen on root growth of two corn genotypes in the field. Agron. J. 78:699–703.
Maddonni, G.A., and M.E. Otegui. 1996. Leaf area, light interception, and crop development in maize. Field Crops Res. 48:81–87.
Maddonni, G.A., and M.E. Otegui. 2004. Intra-specific competition in maize: Early establishment of hierarchies among plants affects final kernel set. Field Crops Res. 85:1–13.
Maddonni, G.A., and M.E. Otegui. 2006. Intra-specific competition in maize: Contribution of extreme plant hierarchies to grain yield, grain yield com-ponents and kernel composition. Field Crops Res. 97:155–166.
McCullough, D.E., A. Aguilera, and M. Tollenaar. 1994a. N uptake, N parti-tioning, and photosynthetic N-use efficiency of an old and a new maize hybrid. Can. J. Plant Sci. 74:479–484.
McCullough, D.E., P. Girardin, M. Mihajlovic, A. Aguilera, and M. Tollenaar. 1994b. Influence of N supply on development and dry matter accumula-tion of an old and a new maize hybrid. Can. J. Plant Sci. 74:471–477.
Moll, R.H., E.J. Kamprath, and W.A. Jackson. 1982. Analysis and interpre-tation of factors which contribute to efficiency of nitrogen utilization. Agron. J. 74:562–564.
Monneveux, P., P.H. Zaidi, and C. Sanchez. 2005. Population density and low nitrogen affects yield-associated traits in tropical maize. Crop Sci. 45:535–545.
Montgomery, E.G. 1911. Correlation studies in corn. Neb. Agric. Exp. Stn. Annu. Rep. 24:108–159.
Ogunlela, V.B., G.M. Amoruwa, and O.O. Ologunde. 1988. Growth, yield components and micronutrient nutrition of field-grown maize (Zea mays L.) as affected by nitrogen fertilization and plant density. Fert. Res. 17:189–196.
O’Neill, P.M., J.F. Shanahan, J.S. Schepers, and B. Caldwell. 2004. Agronomic responses of corn hybrids from different eras to deficit and adequate lev-els of water and nitrogen. Agron. J. 96:1660–1667.
Otegui, M.E. 1997. Kernel set and flower synchrony within the ear of maize: II. Plant population effects. Crop Sci. 37:448–455.
Otegui, M.E., and F.H. Andrade. 2000. New relationships between light inter-ception, ear growth, and kernel set in maize. p. 89–102. In M. Westgate and K. Boote (ed.) Physiology and modeling kernel set in maize. Proc. of a Symp. Sponsored by Div. C-2 and A-3 of the CSSA and the ASA, Balti-more, MD. 18–22 Oct. 1998. CSSA and ASA, Madison, WI.
Otegui, M.E., and R. Bonhomme. 1998. Grain yield components in maize: I. Ear growth and kernel set. Field Crops Res. 56:247–256.
Pagano, E., and G.A. Maddonni. 2007. Intra-specific competition in maize: Early established hierarchies differ in plant growth and biomass parti-tioning to the ear around silking. Field Crops Res. 101:306–320.
Paponov, I.A., and C. Engels. 2003. Effect of nitrogen supply on leaf traits related to photosynthesis during grain filling in two maize genotypes with different N efficiency. J. Plant Nutr. Soil Sci. 166:756–763.
Paponov, I.A., and C. Engels. 2005. Effect of nitrogen supply on carbon and nitrogen partitioning after flowering in maize. J. Plant Nutr. Soil Sci. 168:447–453.
Paponov, I.A., P. Sambo, G. Schulte auf ’m Erley, T. Presterl, H.H. Geiger, and C. Engels. 2005a. Kernel set in maize genotypes differing in nitrogen use efficiency in response to resource availability around flowering. Plant Soil 272:101–110.
Paponov, I.A., P. Sambo, G. Schulte auf ’m Erley, T. Presterl, H.H. Geiger, and C. Engels. 2005b. Grain yield and kernel weight of two maize genotypes differing in nitrogen and carbohydrate availability during flowering and grain filling. Plant Soil 272:111–123.
Paszkiewicz, S., and S. Butzen. 2007. Corn hybrid response to plant popula-tion. Available at http://www.pioneer.com/web/site/portal/menuitem.d329704b991fbeac81127b05d10093a0 [accessed 5 Dec. 2008, 21 Jan. 2008; verified 15 July 2009]. Pioneer Hi-Bred Intl., Johnston, IA.
Pearce, R.B., J.J. Mock, and T.B. Bailey. 1975. Rapid method for estimating leaf area per plant in maize. Crop Sci. 15:691–694.
Rajcan, I., and M. Tollenaar. 1999a. Source:sink ratio and leaf senescence in maize: I. Dry matter accumulation and partitioning during grain filling. Field Crops Res. 60:245–253.
Rajcan, I., and M. Tollenaar. 1999b. Source:sink ratio and leaf senescence in maize: II. Nitrogen metabolism during grain filling. Field Crops Res. 60:255–265.
Ritchie, S.W., J.J. Hanway, and H.E. Thompson. 1996. How a corn plant devel-ops, Spec. Rep. 48. Coop. Ext. Serv., Iowa State Univ. of Sci. and Tech-nol., Ames, IA.
Russell, W.A. 1991. Genetic improvement of maize yields. Adv. Agron. 46:245–298.
Sadras, V.O., M.P. Reynolds, A.J. de la Vega, P.R. Petrie, and R. Robinson. 2009. Phenotypic plasticity of yield and phenology in wheat, sunflower and grapevine. Field Crops Res. 110:242–250.
Sangoi, L., M.A. Gracietti, C. Rampazzo, and P. Bianchetti. 2002. Response of Brazilian maize hybrids from different eras to changes in plant popula-tion. Field Crops Res. 79:39–51.
Sarlangue, T., F.H. Andrade, P.A. Calviño, and L.C. Purcell. 2007. Why do maize hybrids respond differently to variations in plant density? Agron. J. 99:984–991.
SAS Institute. 2004. SAS/STAT 9.1 user’s guide. SAS Inst., Cary, NC.Siemer, E.G., E.R. Leng, and O.T. Bonnett. 1969. Timing and correlation of
major developmental events in maize, Zea mays L. Agron. J. 61:14–17.Singletary, G.W., and F.E. Below. 1990. Nitrogen-induced changes in the
growth and metabolism of developing maize kernels grown in vitro. Plant Physiol. 92:160–167.
Stewart, D.W., and L.M. Dwyer. 1999. Mathematical characterization of leaf shape and area of maize hybrids. Crop Sci. 39:422–427.
Subedi, K.D., and B.L. Ma. 2005a. Effects of N-deficiency and timing of N supply on the recovery and distribution of labeled 15N in contrasting maize hybrids. Plant Soil 273:189–202.
Subedi, K.D., and B.L. Ma. 2005b. Nitrogen uptake and partitioning in stay-green and leafy maize hybrids. Crop Sci. 45:740–747.
Subedi, K.D., and B.L. Ma. 2007. Dry matter and nitrogen partitioning patterns in Bt and non-Bt near-isoline maize hybrids. Crop Sci. 47:1186–1192.
Swank, J.C., F.E. Below, R.J. Lambert, and R.H. Hageman. 1982. Interaction of carbon and nitrogen metabolism in the productivity of maize. Plant Physiol. 70:1185–1190.
Tetio-Kagho, F., and F.P. Gardner. 1988a. Responses of maize to plant popula-tion density: I. Canopy development, light relationships, and vegetative growth. Agron. J. 80:930–935.
1452 Agronomy Journa l • Volume101, Issue6 • 2009
Tetio-Kagho, F., and F.P. Gardner. 1988b. Responses of maize to plant popula-tion density: II. Reproductive development, yield, and yield adjustments. Agron. J. 80:935–940.
Tokatlidis, I.S., and S.D. Koutroubas. 2004. A review of maize hybrids’ depen-dence on high plant populations and its implications for crop yield stabil-ity. Field Crops Res. 88:103–114.
Tokatlidis, I.S., M. Koutsika-Sotiriou, and E. Tamoutsidis. 2005. Benefits from using maize density-independent hybrids. Maydica 50:9–17.
Tollenaar, M. 1989. Genetic improvement in grain yield of commercial maize hybrids grown in Ontario from 1959 to 1988. Crop Sci. 29:1365–1371.
Tollenaar, M. 1991. Physiological basis of genetic improvement of maize hybrids in Ontario from 1959 to 1988. Crop Sci. 31:119–124.
Tollenaar, M. 1992. Is low plant density a stress in maize? Maydica 37:305–311.
Tollenaar, M., and A. Aguilera. 1992. Radiation use efficiency of an old and a new maize hybrid. Agron. J. 84:536–541.
Tollenaar, M., A. Aguilera, and S.P. Nissanka. 1997. Grain yield is reduced more by weed interference in an old than in a new maize hybrid. Agron. J. 89:239–246.
Tollenaar, M., A. Ahmadzadeh, and E.A. Lee. 2004. Physiological basis of het-erosis for grain yield in maize. Crop Sci. 44:2086–2094.
Tollenaar, M., L.M. Dwyer, D.W. Stewart, and B.L. Ma. 2000. Physiologi-cal parameters associated with differences in kernel set among maize hybrids. p. 115–130. In M. Westgate and K. Boote (ed.) Physiology and modeling kernel set in maize. Proc. of a Symp. Sponsored by Div. C-2 and A-3 of the CSSA and the ASA, Baltimore, MD. 18–22 Oct. 1998. CSSA and ASA, Madison, WI.
Tollenaar, M., and E.A. Lee. 2002. Yield potential, yield stability and stress tolerance in maize. Field Crops Res. 75:161–169.
Tollenaar, M., and E.A. Lee. 2006. Dissection of physiological processes underlying grain yield in maize by examining genetic improvement and heterosis. Maydica 51:399–408.
Tollenaar, M., and J. Wu. 1999. Yield improvement in temperate maize is attributable to greater stress tolerance. Crop Sci. 39:1597–1604.
Tsai, C.Y., D.M. Huber, and H.L. Warren. 1980. A proposed role of zein and glutelin as N sinks in maize. Plant Physiol. 66:330–333.
Uhart, S.A., and F.H. Andrade. 1995a. Nitrogen and carbon accumulation and remobilization during grain filling in maize under different source/sink ratios. Crop Sci. 35:183–190.
Uhart, S.A., and F.H. Andrade. 1995b. Nitrogen deficiency in maize: I. Effects on crop growth, development, dry matter partitioning, and kernel set. Crop Sci. 35:1376–1383.
Uhart, S.A., and F.H. Andrade. 1995c. Nitrogen deficiency in maize: II. Car-bon-nitrogen interaction effects on kernel number and grain yield. Crop Sci. 35:1384–1389.
USDA-Economic Research Service. 2008. U.S. fertilizer use and price. Avail-able at http://www.ers.usda.gov/Data/FertilizerUse/ [accessed 3 Feb. 2009; verified 15 July 2009]. USDA-ERS, Washington, DC.
Valentinuz, O.R., and M. Tollenaar. 2004. Vertical profile of leaf senescence during the grain-filling period in older and newer maize hybrids. Crop Sci. 44:827–834.
Valentinuz, O.R., and M. Tollenaar. 2006. Effect of genotype, nitrogen, plant density, and row spacing on the area-per-leaf profile in maize. Agron. J. 98:94–99.
Wardlaw, I.F. 1990. Tansley review no. 27: The control of carbon partitioning in plants. New Phytol. 116:341–381.
Westgate, M.E., F. Forcella, D.C. Reicosky, and J. Somsen. 1997. Rapid canopy closure for maize production in the northern US corn belt: Radiation-use efficiency and grain yield. Field Crops Res. 49:249–258.
Wolfe, D.W., D.W. Henderson, T.C. Hsiao, and A. Alvino. 1988a. Interactive water and nitrogen effects on senescence of maize: I. Leaf area duration, nitrogen distribution, and yield. Agron. J. 80:859–864.
Wolfe, D.W., D.W. Henderson, T.C. Hsiao, and A. Alvino. 1988b. Interactive water and nitrogen effects on senescence of maize: II. Photosynthetic decline and longevity of individual leaves. Agron. J. 80:865–870.
Ying, J., E.A. Lee, and M. Tollenaar. 2000. Response of maize leaf photosyn-thesis to low temperature during the grain-filling period. Field Crops Res. 68:87–96.