major agriculture company incorporates tibco spotfire ... · major agriculture company incorporates...
TRANSCRIPT
Major Agriculture Company Incorporates TIBCO Spotfire® Software into Global Data Strategy
When a multinational biotechnology company realized it needed to devise a global data strategy and “transform data into decisions,” it decided to work with PerkinElmer's informatics business and deployed the TIBCO Spotfire® data
analysis and visualization platform at the center of its solution. More than 10 years and nearly 20,000 users later, TIBCO Spotfire® software is the go-to tool across the enterprise, from R&D to QA/QC and commercial operations.
CASE STUDY
Transforming Data into Decisions via the TIBCO Spotfire® Platform
2
Data Challenges: From No Data Strategy to Broadly Sharing a Successful Data Strategy
More than a decade ago, this global agricultural company used available technologies to collect and analyze its data. With an explosion of data propelled by technologies with greater, faster output, the organization realized it needed an enterprise-wide data strategy if it was going to succeed in using information to improve farming practices, protect crops from pests and diseases, and make more efficient use of farming resources, including water. The company recognized it was inefficiently using its own resources, missing opportunities, and not collaborating or communicating effectively when it came to business intelligence. As the volume of data increased, the solutions for analyzing the data didn’t keep pace or allow for real-time decision-making. The result, despite best intentions, was duplication of efforts, inconsistent results that led to data integrity issues, and data “analysts” spending 60-80 percent of their time cleaning, organizing, and managing data instead of analyzing and drawing business intelligence from it. Something had to change.
Hold a “Bake Off”
The company had several small deployments of various business intelligence software solutions and wanted to determine which was providing the most value. They held a “bake off” between TIBCO Spotfire® software and other leading BI tools. Within R&D, chemists, biologists, biochemists, molecular biologists, microbiologists, and other scientists would be using the selected software. The goal was to find the platform that would fulfill the global data strategy of transforming data into decisions.
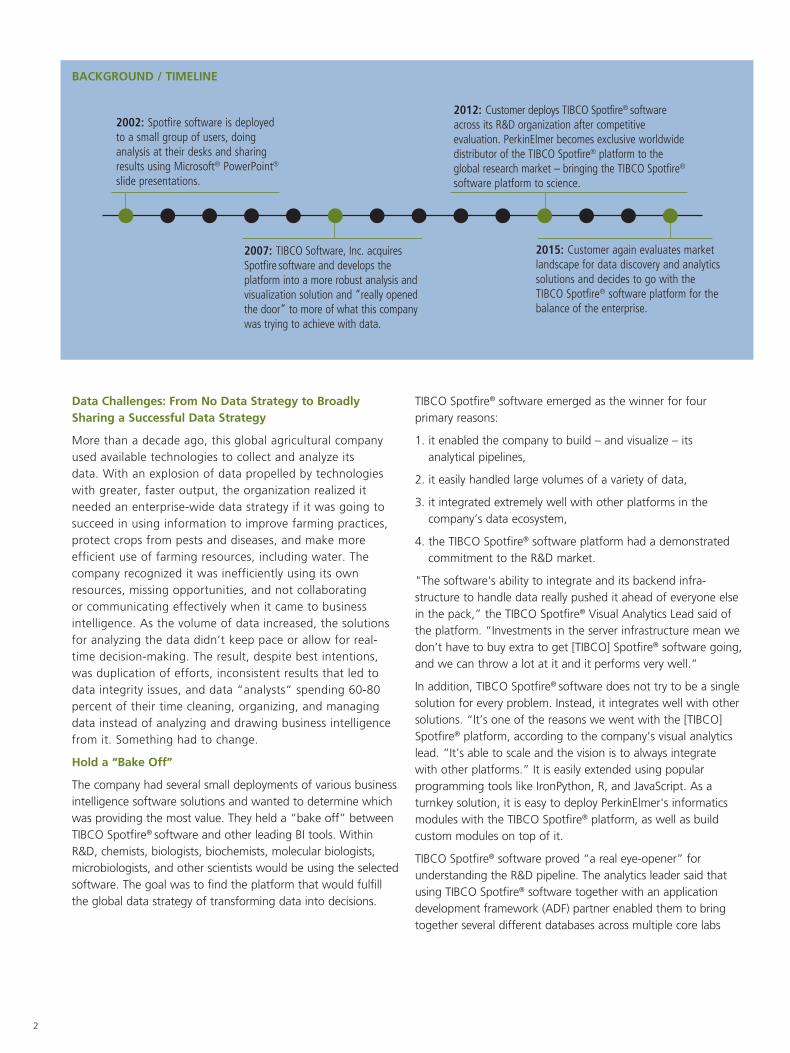
BACKGROUND / TIMELINE
2002: Spotfire software is deployed to a small group of users, doing analysis at their desks and sharing results using Microsoft® PowerPoint® slide presentations.
2012: Customer deploys TIBCO Spotfire® software across its R&D organization after competitive evaluation. PerkinElmer becomes exclusive worldwide distributor of the TIBCO Spotfire® platform to the global research market – bringing the TIBCO Spotfire® software platform to science.
2015: Customer again evaluates market landscape for data discovery and analytics solutions and decides to go with the TIBCO Spotfire® software platform for the balance of the enterprise.
2007: TIBCO Software, Inc. acquires Spotfire software and develops the platform into a more robust analysis and visualization solution and “really opened the door” to more of what this company was trying to achieve with data.
TIBCO Spotfire® software emerged as the winner for four primary reasons:
1. it enabled the company to build – and visualize – its analytical pipelines,
2. it easily handled large volumes of a variety of data,
3. it integrated extremely well with other platforms in the company’s data ecosystem,
4. the TIBCO Spotfire® software platform had a demonstrated commitment to the R&D market.
"The software's ability to integrate and its backend infra-structure to handle data really pushed it ahead of everyone else in the pack,” the TIBCO Spotfire® Visual Analytics Lead said of the platform. “Investments in the server infrastructure mean we don’t have to buy extra to get [TIBCO] Spotfire® software going, and we can throw a lot at it and it performs very well.”
In addition, TIBCO Spotfire® software does not try to be a single solution for every problem. Instead, it integrates well with other solutions. “It’s one of the reasons we went with the [TIBCO] Spotfire® platform, according to the company’s visual analytics lead. “It’s able to scale and the vision is to always integrate with other platforms.” It is easily extended using popular programming tools like IronPython, R, and JavaScript. As a turnkey solution, it is easy to deploy PerkinElmer's informatics modules with the TIBCO Spotfire® platform, as well as build custom modules on top of it.
TIBCO Spotfire® software proved “a real eye-opener” for understanding the R&D pipeline. The analytics leader said that using TIBCO Spotfire® software together with an application development framework (ADF) partner enabled them to bring together several different databases across multiple core labs
3
and visualize the analytical pipeline. This further allowed the company to follow the workflow, see where work is handed off, and how it comes back together. “That was a real eye-opener for a lot of folks because how you put things in at the beginning of the pipeline determines how it comes out,” she said.
TIBCO Spotfire® software also facilitates decision capture – the ability to record and share who made a decision to move something forward, what evidence or information they used in their decision-making, and any comments on the decision. “So now, if there are issues with anything moving through the pipeline, you can catch those early,” she said. “This presents a huge cultural shift in the way we move products through our pipeline.”
An Enterprise Bake Off
Three years after selecting the TIBCO Spotfire® platform as the solution-of-choice for R&D, the company ran another evaluation of software to use throughout the commercial organization. Hosting a myriad of solutions, the commercial organization wanted to simplify and standardize its software. The TIBCO Spotfire® platform again emerged as the winner. In addition to its success within R&D, TIBCO Spotfire® software was determined to be “discipline agnostic,” according to the visual analytics leader. “It’s not just an R&D tool; it’s a business intelligence tool and we realized there were other areas of the company, like operations, that were finding value from it too.” It can be used by operations, finance, field workers, anyone who needs to analyze data and make a decision from it – which, in a culture of data fluency, is pretty much everyone. The user interface in TIBCO Spotfire® software enables user-friendly dashboards and intuitive visualizations that cut across many functional uses.
More specifically, TIBCO Spotfire® software has improved the knowledge and understanding derived from more data types and sources. For example, the inclusion of Maporama technology improved geospatial analytics, which has been helpful for evaluating information by geographic location – from crop yields to pest control issues or environmental effects on crops.
Predictive capacity has also improved using TIBCO Spotfire®
software, because the ability to accurately forecast is highly dependent on data connectivity. TIBCO Spotfire® software presents a much fuller picture by pulling disparate data together and creating visualizations from which analysts can spot trends, patterns, and other insights that improve decision-making. This has also helped relieve bottlenecks and improve data consistency through standards. Previously, there was evidence of people using a variety of algorithms to analyze data, which led to confusion when making decisions from the data. This organization had a statistician build a workflow and put it behind a button in the TIBCO Spotfire® platform, so others could simply trigger the workflow and get consistent results. “This group optimized their data management resources and was able to hire another statistician,” the analytics lead said. “They also improved their expertise level because they were able to streamline data cleansing.”
Part of the strength of the TIBCO Spotfire® platform is facilitating collaboration and communication across interdisciplinary teams that must work together to make decisions. This generates productivity improvements as well. For example, this company brings large groups of people together annually for intensive, weeks-long meetings to pour over data and make plans for the coming year. “It was very difficult and tedious and there was no audit trail,” according to the analytics lead. Fast forward to working with the TIBCO Spotfire® platform and farmers are able to quickly update data in real time, build dashboards, and make and record decisions. The weeks-long meetings were reduced to a few days, with data aggregation, analysis, and visualization automated in TIBCO Spotfire® platform.
Results: Increased Data Fluency
With just under 20,000 TIBCO Spotfire® software users – and growing, this customer reports a significant increase in the data fluency across its organization. As more people use TIBCO Spotfire® software and are presented with the information it generates, the company’s culture around data has shifted to better appreciate data, understand what makes for good data and the importance of complete and consistent data, and how to use data to make better decisions.
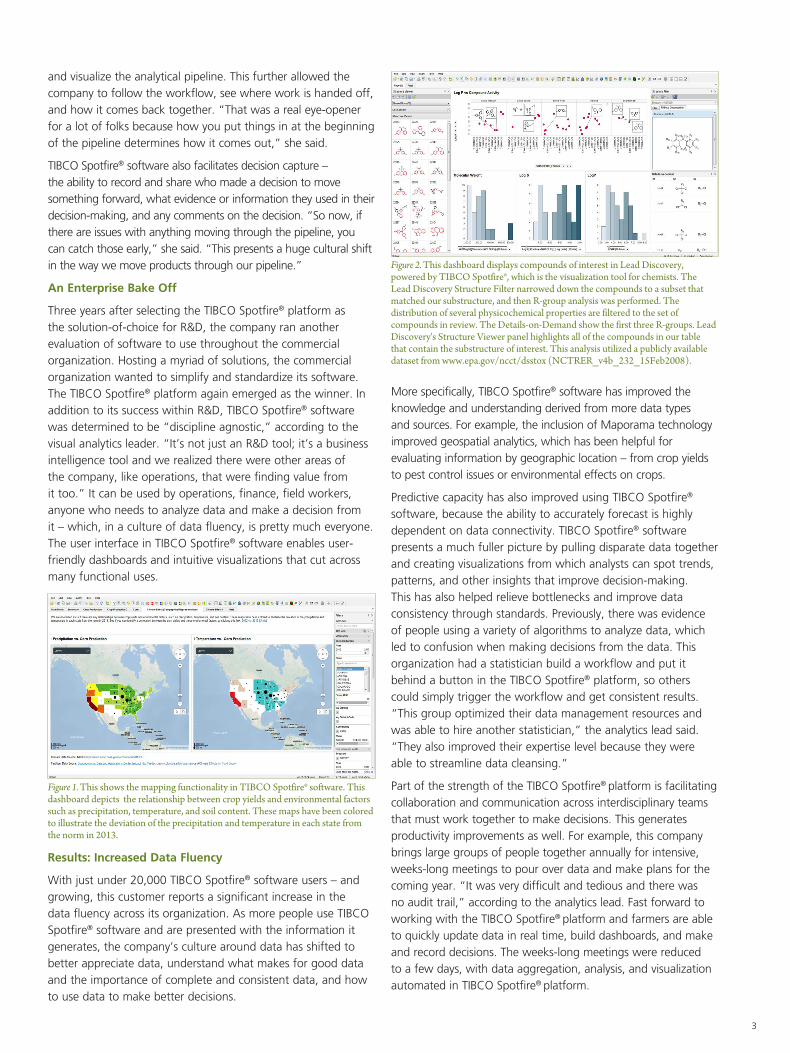
Figure 1. This shows the mapping functionality in TIBCO Spotfire® software. This dashboard depicts the relationship between crop yields and environmental factors such as precipitation, temperature, and soil content. These maps have been colored to illustrate the deviation of the precipitation and temperature in each state from the norm in 2013.
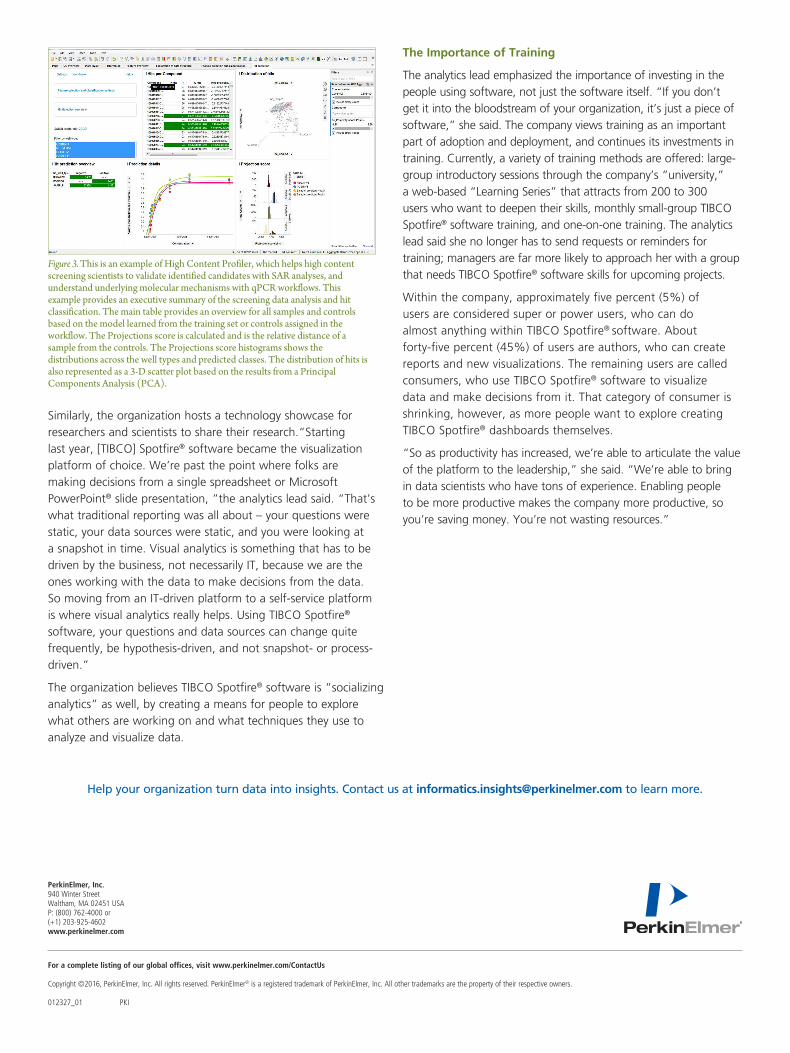
Figure 2. This dashboard displays compounds of interest in Lead Discovery, powered by TIBCO Spotfire®, which is the visualization tool for chemists. The Lead Discovery Structure Filter narrowed down the compounds to a subset that matched our substructure, and then R-group analysis was performed. The distribution of several physicochemical properties are filtered to the set of compounds in review. The Details-on-Demand show the first three R-groups. Lead Discovery's Structure Viewer panel highlights all of the compounds in our table that contain the substructure of interest. This analysis utilized a publicly available dataset from www.epa.gov/ncct/dsstox (NCTRER_v4b_232_15Feb2008).
For a complete listing of our global offices, visit www.perkinelmer.com/ContactUs
Copyright ©2016, PerkinElmer, Inc. All rights reserved. PerkinElmer® is a registered trademark of PerkinElmer, Inc. All other trademarks are the property of their respective owners. 012327_01 PKI
PerkinElmer, Inc. 940 Winter Street Waltham, MA 02451 USA P: (800) 762-4000 or (+1) 203-925-4602www.perkinelmer.com
Help your organization turn data into insights. Contact us at [email protected] to learn more.
Similarly, the organization hosts a technology showcase for researchers and scientists to share their research.“Starting last year, [TIBCO] Spotfire® software became the visualization platform of choice. We’re past the point where folks are making decisions from a single spreadsheet or Microsoft PowerPoint® slide presentation, ”the analytics lead said. “That’s what traditional reporting was all about – your questions were static, your data sources were static, and you were looking at a snapshot in time. Visual analytics is something that has to be driven by the business, not necessarily IT, because we are the ones working with the data to make decisions from the data. So moving from an IT-driven platform to a self-service platform is where visual analytics really helps. Using TIBCO Spotfire® software, your questions and data sources can change quite frequently, be hypothesis-driven, and not snapshot- or process-driven.”
The organization believes TIBCO Spotfire® software is “socializing analytics” as well, by creating a means for people to explore what others are working on and what techniques they use to analyze and visualize data.
The Importance of Training
The analytics lead emphasized the importance of investing in the people using software, not just the software itself. “If you don’t get it into the bloodstream of your organization, it’s just a piece of software,” she said. The company views training as an important part of adoption and deployment, and continues its investments in training. Currently, a variety of training methods are offered: large-group introductory sessions through the company’s “university,” a web-based “Learning Series” that attracts from 200 to 300 users who want to deepen their skills, monthly small-group TIBCO Spotfire® software training, and one-on-one training. The analytics lead said she no longer has to send requests or reminders for training; managers are far more likely to approach her with a group that needs TIBCO Spotfire® software skills for upcoming projects.
Within the company, approximately five percent (5%) of users are considered super or power users, who can do almost anything within TIBCO Spotfire® software. About forty-five percent (45%) of users are authors, who can create reports and new visualizations. The remaining users are called consumers, who use TIBCO Spotfire® software to visualize data and make decisions from it. That category of consumer is shrinking, however, as more people want to explore creating TIBCO Spotfire® dashboards themselves.
“So as productivity has increased, we’re able to articulate the value of the platform to the leadership,” she said. “We’re able to bring in data scientists who have tons of experience. Enabling people to be more productive makes the company more productive, so you’re saving money. You’re not wasting resources.”
Figure 3. This is an example of High Content Profiler, which helps high content screening scientists to validate identified candidates with SAR analyses, and understand underlying molecular mechanisms with qPCR workflows. This example provides an executive summary of the screening data analysis and hit classification. The main table provides an overview for all samples and controls based on the model learned from the training set or controls assigned in the workflow. The Projections score is calculated and is the relative distance of a sample from the controls. The Projections score histograms shows the distributions across the well types and predicted classes. The distribution of hits is also represented as a 3-D scatter plot based on the results from a Principal Components Analysis (PCA).