major applied research paper no. 2 - phrplus
TRANSCRIPT

HFS MAJOR APPLIED RESEARCH PAPER NO. 2
TECHNICAL AND ECONOMIC EFFICIENCYIN THE PRODUCTION OF HEALTH SERVICES
Phase 1:Review of Concepts and Literature,and Preliminary Field Work Design
Submitted to:
Health Services DivisionOffice of Health
Bureau for Research and DevelopmentAgency for International Development
By
Ricardo BITRAN, Ph.D.Abt Associates Inc.
December 1992
Health Financing and Sustainability (HFS) ProjectAbt Associates Inc., Prime Contractor4800 Montgomery Lane, Suite 600Bethesda, MD 20814 USATel: (301) 913-0500 Fax: (301) 652-7791Telex: 312636
The Urban Institute, SubcontractorManagement Sciences for Health, Subcontractor
A.I.D. Contract No. DPE-5974-Z-00-9026-00

ABSTRACT
This report completes the first phase of the HFS Project's three-phase major applied researchproject entitled "Private Sector: Private and Public Differences in Efficiency." This first phase laysthe groundwork for phase two (field work) and phase three (analysis) of the research project. Thispaper provides a selective review of studies of health service production efficiency that have beenperformed in developed and developing countries. The review examines techniques used to measureefficiency, methodological problems associated with these measurements, and possible solutions.It also provides information about the efficiency of public and private health services in developingcountries. Finally, the report describes opportunities for phase two field work, and discussesefficiency measurement techniques for data analysis. The field work opportunities described are:1) a comparative study of hospital efficiency in Ecuador for five different types of providers, and2) a study of productive efficiency for private and public facilities in Senegal, including facilitiesfrom various levels.

TABLE OF CONTENTS
LIST OF EXHIBITS . . . . . . . . . . . . . . . . . . . . . . . . . . . . . . . . . . . . . . . . . . . . . . . . . . . . . . . . v
ACRONYMS . . . . . . . . . . . . . . . . . . . . . . . . . . . . . . . . . . . . . . . . . . . . . . . . . . . . . . . . . . . . . vi
ACKNOWLEDGEMENTS. . . . . . . . . . . . . . . . . . . . . . . . . . . . . . . . . . . . . . . . . . . . . . . . . . vii
EXECUTIVE SUMMARY . . . . . . . . . . . . . . . . . . . . . . . . . . . . . . . . . . . . . . . . . . . . . . . . . .viii
1.0 INTRODUCTION . . . . . . . . . . . . . . . . . . . . . . . . . . . . . . . . . . . . . . . . . . . . . . . . . . . . . 10
2.0 DEFINITIONS: EFFICIENCY, EQUITY, AND QUALITY IN HEALTH CARE. . . . 122.1 QUALITY OF CARE . . . . . . . . . . . . . . . . . . . . . . . . . . . . . . . . . . . . . . . . . . 122.2 TECHNICAL EFFICIENCY. . . . . . . . . . . . . . . . . . . . . . . . . . . . . . . . . . . . . 132.3 ECONOMIC EFFICIENCY. . . . . . . . . . . . . . . . . . . . . . . . . . . . . . . . . . . . . . 15
3.0 MEASUREMENT OF TECHNICAL AND ECONOMIC EFFICIENCY IN THEPRODUCTION OF HEALTH CARE. . . . . . . . . . . . . . . . . . . . . . . . . . . . . . . . . . . . . . . . . . 16
3.1 EFFICIENCY AND QUALITY OF CARE. . . . . . . . . . . . . . . . . . . . . . . . . . 163.2 EFFICIENCY AND CASE MIX . . . . . . . . . . . . . . . . . . . . . . . . . . . . . . . . . . 173.3 ECONOMIC EFFICIENCY AND INPUT PRICE ISSUES. . . . . . . . . . . . . . 183.4 TECHNICAL AND ECONOMIC EFFICIENCY: THEIR RELATIVE
IMPORTANCE . . . . . . . . . . . . . . . . . . . . . . . . . . . . . . . . . . . . . . . . . . . . . . . 20
4.0 REVIEW OF SELECTED STUDIES ON HEALTH SERVICES EFFICIENCY FROMTHE DEVELOPED WORLD . . . . . . . . . . . . . . . . . . . . . . . . . . . . . . . . . . . . . . . . . . 224.1 THE PROBLEM OF QUALITY HETEROGENEITY. . . . . . . . . . . . . . . . . . 224.2 THE PROBLEM OF CASE-MIX DIFFERENCES. . . . . . . . . . . . . . . . . . . . 254.3 THE MEASUREMENT OF EFFICIENCY AND INPUT PRICE ISSUES . . 304.4 MEASUREMENT OF EFFICIENCY: RATIO ANALYSIS. . . . . . . . . . . . . 304.5 MEASUREMENT OF EFFICIENCY: ECONOMETRIC ANALYSIS OF
HEALTH FACILITY COSTS . . . . . . . . . . . . . . . . . . . . . . . . . . . . . . . . . . . . 314.6 MEASUREMENT OF TECHNICAL EFFICIENCY: DATA
ENVELOPMENT ANALYSIS AND RELATED TECHNIQUES. . . . . . . . . 374.7 CONCLUSIONS. . . . . . . . . . . . . . . . . . . . . . . . . . . . . . . . . . . . . . . . . . . . . . 44
5.0 REVIEW OF SELECTED STUDIES ON HEALTH SERVICES EFFICIENCYFROM THE DEVELOPING WORLD . . . . . . . . . . . . . . . . . . . . . . . . . . . . . . . . . . . 465.1 LITERATURE REVIEW. . . . . . . . . . . . . . . . . . . . . . . . . . . . . . . . . . . . . . . . 465.2 SUMMARY AND CONCLUSIONS. . . . . . . . . . . . . . . . . . . . . . . . . . . . . . . 52
6.0 PRELIMINARY RESEARCH DESIGN FOR PHASE TWO FIELD WORK. . . . . . . . 546.1 A COMPARATIVE STUDY OF EFFICIENCY IN GOVERNMENT AND
PRIVATE INPATIENT FACILITIES IN ECUADOR. . . . . . . . . . . . . . . . . . 54

BITRAN HFS APPLIED RESEARCH
6.1.1 Assessment of Overall Hospital Technical Efficiency Using the DEATechnique. . . . . . . . . . . . . . . . . . . . . . . . . . . . . . . . . . . . . . . . . . . . . . 546.1.1.1 Study Goals and Objectives. . . . . . . . . . . . . . . . . . . . . . . . . . 546.1.1.2. Method and Workplan. . . . . . . . . . . . . . . . . . . . . . . . . . . . . . 556.1.1.3 Level of Effort. . . . . . . . . . . . . . . . . . . . . . . . . . . . . . . . . . . . 58
6.1.2 Assessment of Economic Efficiency for a Selected Sample of HealthInterventions. . . . . . . . . . . . . . . . . . . . . . . . . . . . . . . . . . . . . . . . . . . . 586.1.2.1 Study Goals and Objectives. . . . . . . . . . . . . . . . . . . . . . . . . . 586.1.2.2 Method and Workplan. . . . . . . . . . . . . . . . . . . . . . . . . . . . . . 606.1.2.3 Level of Effort. . . . . . . . . . . . . . . . . . . . . . . . . . . . . . . . . . . . 63
6.2 A COMPARATIVE STUDY OF EFFICIENCY IN GOVERNMENT ANDPRIVATE INPATIENT FACILITIES IN SENEGAL . . . . . . . . . . . . . . . . . . 656.2.1. Goals and Objectives. . . . . . . . . . . . . . . . . . . . . . . . . . . . . . . . . . . . . . 656.2.2. Method and Workplan. . . . . . . . . . . . . . . . . . . . . . . . . . . . . . . . . . . . . 656.2.3. Level of Effort . . . . . . . . . . . . . . . . . . . . . . . . . . . . . . . . . . . . . . . . . . 69
BIBLIOGRAPHY . . . . . . . . . . . . . . . . . . . . . . . . . . . . . . . . . . . . . . . . . . . . . . . . . . . . . . . 71

BITRAN HFS APPLIED RESEARCH
LIST OF EXHIBITS
Exhibit 1: Technically Efficient Production Possibilities Frontier or Isoquant. . . . . . . . . 14Exhibit 2: Technical and Economic Efficiency. . . . . . . . . . . . . . . . . . . . . . . . . . . . . . . . . 15Exhibit 3: Technical Quality of Care and Efficiency. . . . . . . . . . . . . . . . . . . . . . . . . . . . . 16Exhibit 4: Case Mix and Efficiency. . . . . . . . . . . . . . . . . . . . . . . . . . . . . . . . . . . . . . . . . 18Exhibit 5: Economic Efficiency and Input Prices. . . . . . . . . . . . . . . . . . . . . . . . . . . . . . . 19Exhibit 6: Social Economic Inefficiency in Production Due to an Undervalued Input. . . . 20Exhibit 7: Technical Versus Economic Efficiency. . . . . . . . . . . . . . . . . . . . . . . . . . . . . . 21Exhibit 8: Approaches for Standardizing Hospital Output According to
Tatchell (1983). . . . . . . . . . . . . . . . . . . . . . . . . . . . . . . . . . . . . . . . . . . . . . . . . 22Exhibit 9: A Graphical Interpretation of Technical and Economic
Inefficiency . . . . . . . . . . . . . . . . . . . . . . . . . . . . . . . . . . . . . . . . . . . . . . . . . . . 38Exhibit 10: Several Providers Producing Different Quantities of Single, Homogeneous
Output (Q) with Two Inputs (X and X ). . . . . . . . . . . . . . . . . . . . . . . . . . . . . 39a b
Exhibit 11: Efficiency Points and Unit Isoquant (adapted from Charnes et al, 1978). . . . . 40Exhibit 12: Study of Hospital Efficiency in Ecuador Using DEA Technique:
Gantt Chart . . . . . . . . . . . . . . . . . . . . . . . . . . . . . . . . . . . . . . . . . . . . . . . .56-57Exhibit 13: Study of Hospital Efficiency in Ecuador Using DEA Technique:
Estimated Level of Effort. . . . . . . . . . . . . . . . . . . . . . . . . . . . . . . . . . . . . . . . . 59Exhibit 14: Study of Hospital Efficiency in Ecuador for Selected Sample of Interventions: Gantt
Chart . . . . . . . . . . . . . . . . . . . . . . . . . . . . . . . . . . . . . . . . . . . . . . . . . . . . .61-62Exhibit 15: Study of Hospital Efficiency in Ecuador for Selected Sample of Interventions:
Estimated Level of Effort. . . . . . . . . . . . . . . . . . . . . . . . . . . . . . . . . . . . . . . . . 64Exhibit 16: Study of Health Facility Costs and Efficiency and Health Committee Performance
in Senegal: Gantt Chart. . . . . . . . . . . . . . . . . . . . . . . . . . . . . . . . . . . . . . .66-67Exhibit 17: Study of Health Facility Costs and Efficiency and Health Committee Performance
in Senegal: Level of Effort. . . . . . . . . . . . . . . . . . . . . . . . . . . . . . . . . . . . . . . . 70

vi
LIST OF ACRONYMS
CER Cost-Effectiveness RatioDEA Data Envelopment AnalysisDMU Decision Making UnitEGLS Estimated Generalized Least SquaresFTE Full-Time EquivalentIHU Intermediate Health UnitITE Index of Technical EfficiencyLOS Length of StayMOH Ministry of HealthOLS Ordinary Least SquaresWLS Weighted Least Squares

vii
ACKNOWLEDGEMENTS
This paper benefitted from comments by HFS staff at a seminar held in December 1991,from written comments by Marty Makinen, John Tilney, Jr., Avi Dor, Philip Musgrove, and TarynVian, from reviews by Carl Stevens and David Gwatkin, and from suggestions by the members ofthe HFS Technical Advisory Group during the 1992 meeting. I thank Dayl Donaldson for bringingto my attention several useful references on health service efficiency measurement.

viiiBITRAN HFS APPLIED RESEARCH
EXECUTIVE SUMMARY
This paper constitutes the first phase of a three-phase HFS major applied research projectin the area of "Private Sector: Private and Public Differences in Efficiency" (HFS Applied ResearchAgenda, 1991). The document provides the foundations for phases two (field work) and three(analysis). A companion HFS phase one paper entitled "Provider Incentives and ProductiveEfficiency in Government Health Services" (Bitran and Block, 1992) complements the definitionsand analysis of this document.
The purpose of this paper is to review studies of health service production efficiencyconducted in industrialized countries as well as in developing nations. Through this review, HFSseeks both to improve its understanding of available techniques for the measurement of efficiency,and to gain empirical knowledge about the efficiency of public and private health services indeveloping countries. Increased knowledge about public-private levels and differences in efficiencycan contribute to the public policy debate on how to improve the efficiency with which governmentsspend their scarce resources for the provision of health care to their populations.
The paper describes techniques for the measurement of technical and economic efficiencyin the production of health services, the methodological problems associated with thesemeasurements, and possible solutions; it also provides a selective review of efficiency studies donein developing and developed countries.
The final section identifies field work opportunities for phase two. A preliminary discussionof efficiency measurement techniques appropriate for data analysis is presented. The field workopportunities are:
• A comparative study of hospital efficiency in Ecuador for five different types ofproviders; and
• A study of productive efficiency for private and public facilities in Senegal,including facilities from various levels.
The study in Ecuador seeks to assess the efficiency of hospitals run by the Ministry of PublicHealth, the Junta de Beneficencia, the Social Security Administration, the private sector, and themilitary. One hospital of each type would be included in the study. USAID/Quito has recently askedHFS to develop a research proposal. Possible measurement methods for this study are DataEnvelopment Analysis; assessment of efficiency for a small selected sample of interventions andfor a probabilistic sample of patients, controlling for quality of care; and ratio analysis.
In Senegal, USAID/Dakar has requested that HFS perform a study of health facilityefficiency using a sample of about 120 Ministry of Health and private facilities, including hospitals,maternities, health centers, posts, and huts. Efficiency measurement studies that can be used in thisstudy for the case of hospitals include ratio analysis and assessment of efficiency using selectedinterventions and a sample of patients. For the ambulatory facilities, DEA and econometric

ixBITRAN HFS APPLIED RESEARCH
estimation of cost and production functions, and the derivation of associated measures of efficiencyare proposed.

See, for example, Wouters (1990), Bitran and Dunlop (1989), and Lewis et al. (1990).1
Examples are Rodríguez and Jiménez (1985) and Wouters (1990). For a review of developing country studies on health facility2
costs and efficiency, see Barnum and Kutzin (1990).
For example, the data sets used by Bitran and Dunlop (1989) and by Wouters (1990) did not include information about prices of3
production inputs.
For a review of advances in econometrics and other mathematical techniques regarding the general problem of measuring productive4
efficiency in firms, see the 1980 and 1990 Supplements to the Journal of Econometrics.
10BITRAN HFS APPLIED RESEARCH
1.0 INTRODUCTION
Improving efficiency in government-run health services of developing countries is a majorgoal of governments and donors alike. Higher efficiency can allow greater production and betterquality of services without consuming further financial or real resources.
Numerous strategies have been advanced by experts to improve the efficiency ofgovernment-run health services. One strategy is the outright privatization of government-ownedoperations. It is based on the notion that private ownership entails mechanisms which promoteeconomic efficiency, while public ownership lacks such mechanisms. Despite its popularity, thispolicy recommendation is based on weak empirical foundations, insofar as the health sector isconcerned. While inefficiencies in government-run health services have been documented in thedeveloping country context , to date only a handful of studies have compared efficiency between1
public and private providers. For the most part, these studies have based their results on rather2
small sample sizes and have been constrained by poor data. Of course, if greater private efficiency3
were found, appropriate financing and management systems would have to be put into place toensure that the superior efficiency of private provision were in fact captured by the public. Thestudy of such systems should be the subject of a separate paper.
The purpose of this paper is to review studies of health service production efficiencyconducted in industrialized countries as well as in developing nations. Through this review, HFSseeks both to improve its understanding of available techniques for the measurement of efficiency,and to gain empirical knowledge about the efficiency of public and private health services indeveloping countries. Increased knowledge about public-private levels and differences in efficiencycan contribute to the public policy debate on how to improve the efficiency with which governmentsspend their scarce resources for the provision of health care to their populations.
The paper presents a review of selected studies on productive efficiency from industrializedand developing countries. For the industrialized country literature, the emphasis of the review ison methods rather than on findings; for the developing country literature, emphasis is put on boththe methods and the findings. This review is by no means comprehensive; rather, it is selective andhas the purpose of highlighting methodological problems and approaches and describing the variousmeasurement techniques available.4

See HFS Applied Research Agenda, HFS Project, 1991.5
11BITRAN HFS APPLIED RESEARCH
This paper focuses on the measurement of efficiency of individual health care facilities orproviders. It does not address issues of overall health system efficiency, which involve assessingthe efficiency of an array of providers at various levels of the health care delivery system. For adiscussion of health system efficiency, see the work of Nutting et al. (1981 and 1982).
This document constitutes the first phase of a three-phase major applied research initiativeof the HFS Project. It falls under the research topic of "Public Sector: Public and PrivateDifferences in Efficiency." Phase 2 constitutes the field work (mainly data collection) and phase5
3 is for data analysis.
The paper's intended audience includes health financing and economics researchers, graduatehealth economics students, and policymakers with a background in health economics.
The remainder of the document is organized as follows. Section 2 provides definitions ofbasic efficiency-related concepts. Section 3 is a discussion of efficiency measurement issues. Areview of selected studies on health facility efficiency that use data from developed countries isprovided in Section 4. A similar review for developing countries is presented in Section 5. Finally,a summary of the findings from the reviews and a preliminary discussion of the field work designare presented in Section 6.

12BITRAN HFS APPLIED RESEARCH
2.0 DEFINITIONS: EFFICIENCY, EQUITY, AND QUALITY IN HEALTH CARE
Before proceeding to an analysis of efficiency measurement, it is necessary to clarify theunderlying concepts around which this discussion revolves: quality of care, technical efficiency,and economic efficiency.
2.1 QUALITY OF CARE
Quality of care is of critical concern in the analysis of health care systems. This concern isdue to the fact that health services can vary widely in quality, whereas goods and services in othermarkets, particularly in commodity markets, tend to exhibit greater quality homogeneity. Also,quality of care is not easily discerned by consumers of health services, because such services are notalways traded in competitive markets. Additionally, quality of care affects health care demand.
When studying health services, it is useful to distinguish between technical quality andperceived quality of care. The definition of technical quality adopted here is that used byWyszewianski et al.(1987), who consider technical quality for care A to be higher than that for careB if care A is likely to make a greater net contribution to the patient's health and well-being thancare B. These authors further explain that the expected effect on health is determined in part bywhether one type of care is more appropriate than another, and in part by whether the procedure iscorrectly performed.
Quality also has a more subtle dimension relating to the perceptions of consumers of healthcare. Demand for health care is, in part, a function of perceived quality. While, ultimately, thisperception may be formed by whether or not the patient's condition improves, perceptions of qualitymay also be colored by whether or not drugs are prescribed, or by how politely the patient is treatedby facility staff.
Barnum and Kutzin (1990) recognize that the quality of health care has two dimensions: themedical or technical dimension and the consumer's dimension.
Quality has both supply and demand characteristics. The critical demand issue is"perceived" quality: the consumer's assessment of the relative quality of differenthealth care providers... Adequate staff and supplies are obvious supply side factorsaffecting "actual" quality of services that are important in affecting perceivedquality. [Chapter 3, p.17]
Technical quality and perceived quality are not competing but rather complementarydefinitions of health care quality. Technical quality is a concept that encompasses the medicalprocedures performed and their effects on patients' health. Perceived quality influences theconsumers' decisions to seek medical care and to choose a particular provider. Health analysts andpolicymakers must be concerned with both dimensions of quality, since both are important inunderstanding health care systems.
Health service researchers in the U.S. use the terms "efficacy" to refer to technical efficiency and "appropriateness" to denote6
economic efficiency.
Pauly (1970), p.1147
13BITRAN HFS APPLIED RESEARCH
Two additional central concepts, pertaining to health care production and quality, need tobe defined at this point: health care output and health care outcome. Health output denotes thenumber of units of medical services or procedures performed. Examples of output measures are:number of hospital discharges, number of surgical interventions, number of children immunized,and number of curative outpatient consultations. Health outcomes, in contrast, are measures of thepopulation's health status. The improvement of health outcomes is the ultimate goal of healthinterventions; the provision of health outputs is intended to have a positive effect on people's healthoutcomes. The number of healthy days of life saved, deaths averted, and illnesses averted are allcommon examples of health outcome measures, as they relate to health interventions.
There is a direct link between the concept of technical quality and the notion of healthoutcome. In fact, technical quality can only be gauged fully when the effect of health services onhealth outcomes can be established. Unfortunately, health service professionals and researchersoften have at their disposal information about health outputs, from facility statistics on servicesprovided, while information about outcomes is more rare. Further, establishing a relationshipbetween health output levels and health outcome levels is a complex empirical task, because healthstatus is influenced by a large number of variables, such as nutrition, hygiene, health care, and lifestyle; isolating the effect of each variable, including the consumption of health outputs, on healthis thus not a straightforward exercise.
As is explained in the next section, knowledge about health care quality, and thus outcomes,is essential to the analysis of health services efficiency. In practice, however, the empirical obstaclesfaced by researchers in linking specific health outputs with outcomes, means that they often haveto limit themselves to expressing efficiency as a function of the more easily observable healthoutputs.
2.2 TECHNICAL EFFICIENCY
Two important concepts intervene in the analysis of efficiency of a production process:technical efficiency and economic efficiency. A procedure is technically efficient if production6
inputs (e.g., labor, drugs, equipment) are combined in a way that yields the maximum feasibleoutput (e.g., outpatient visits, hospitalizations).7

While most health care production processes employ more than two inputs, the visual illustrations used in this document are two-8
dimensional, for graphical convenience. The definitions and analyses presented here are directly generalizable to multiple inputproduction processes.
14BITRAN HFS APPLIED RESEARCH
Exhibit 1: Technically Efficient Production Possibilities Frontieror Isoquant
In microeconomic terms, a technicallyefficient production process is one that isplaced along the production possibilitiesfrontier or isoquant. This is exemplified inExhibit 1, for a simple medical productionprocess that uses only two production inputs,X and X (these inputs can be viewed as beinga b
doctor and nurse time, or doctor time anddrugs, etc.). Any point along the production8
possibilities frontier QQ represents atechnically efficient way of combining variousquantities of production inputs X and X toa b
produce the same amount of output Q. Forexample, while points 1 and 2 differ in thecombination of X and X (production at 1 isa b
more intensive in X than at 2), both permitb
production of the same quantity Q. Points 1and 2, like all other points on the frontier QQare technically efficient because it is not possible to produce Q with smaller quantities of either Xa
or X , as depicted by the line (there is no room for further gain in technical efficiency). Point 3, likeb
all points to the left of the production possibilities frontier, is infeasible: any reduction in theamounts of X and X from the amounts represented by the frontier necessarily translates into a dropa b
in Q. In contrast, point 4, like all points to the right of the production possibilities frontier,constitutes a technically inefficient way of producing Q: technical efficiency can be improved bymoving production from 4 to 2, thereby reducing the amount of X from X to X . In sum, onea a4 a2
procedure is considered more technically efficient than another, either if it produces the samequantity of output using fewer inputs, or if it produces a greater quantity of outputs using the sameresources.
The production possibilities frontier represents all the possible combinations of inputs whichpermit production of the same quantity of health care output. It will be further assumed thattechnical quality of care also remains constant along the production possibilities frontier. Thus, notonly does any combination of inputs X and X along the curve permit production of quantity Q ofa b
medical care output, but also any such combination delivers medical care of constant technicalquality, i.e., with the same effect on patients' health status.
Perceived quality of care is not necessarily constant along the frontier QQ, however. Forexample, while both points 1 and 2 in Exhibit 1 permit production of Q with the same impact onpatients' health, some patients may find one point superior, or of better perceived quality, than the

There are some unusual production processes which will display more than one economically efficient configuration.9
15BITRAN HFS APPLIED RESEARCH
Exhibit 2: Technical and Economic Efficiency.
other. For instance, if X is doctor time and X is nurse time, some patients may prefer point 2a b
because it uses more doctor time than point 1, which is more intensive in nurse time.
2.3 ECONOMIC EFFICIENCY
Economic efficiency extends the concept of technical efficiency to take into account therelative prices of production inputs. A procedure is economically efficient if inputs are combinedto produce a given level of output at minimum cost. In general, while many technically efficientalternatives might present themselves to produce a given quantity Q, there is only one economicallyefficient way of doing so. 9
Exhibit 2 helps to illustrate thefundamental difference and relationshipbetween technical and economic efficiency.Suppose that the unit prices of productioninputs X and X are W and W , respectively.a b a b
If the health facility is allocated a budget B ,1
then line B represents the facility's budget1
constraint. The constraint is given by theequation: B = X .W + X .W . Any point1 a a b b
along the budget constraint line, such as points1 and 3, consumes the total budget B .1
However, point 1 is preferable to 3 because at1 quantity Q is produced, whereas at point 3the smaller quantity Q" is produced. Further,of all the technically efficient points along thefrontier QQ, point 1 is the most economicallyefficient way of producing quantity Q. Point 2is technically as efficient as 1, but is lesseconomically efficient, since production at 2 requires a budget of B , higher than B . Graphically,2 1
the economically efficient point (point 1) corresponds to the tangency between the budget constraintand the production possibilities frontier.
With the above definitions in mind, we turn to a discussion of efficiency measurementissues.

16BITRAN HFS APPLIED RESEARCH
Exhibit 3: Technical Quality of Care and Efficiency
3.0 MEASUREMENT OF TECHNICAL AND ECONOMIC EFFICIENCY IN THEPRODUCTION OF HEALTH CARE
The purpose of this section is to provide a conceptual discussion about issues in themeasurement of technical and economic efficiency in the production of health services. Thediscussion begins with an analysis of efficiency measurement and quality of care issues. Next, Iexplain how efficiency measurement for a group of providers becomes a more complex problemwhen their case mix varies. An analysis of efficiency measurement and input price issues follows.The section concludes with a brief discussion about the use and importance of technical andeconomic efficiency.
3.1 EFFICIENCY AND QUALITY OF CARE
Comparisons of technical and economic efficiency among providers must take into accounttheir technical quality of care. Different levels of quality often consume different levels ofproduction inputs. Unless quality differences are considered, the researcher seeking to measureefficiency of a group of providers may obtain a distorted picture.
To illustrate this point, consider the twoproviders of Exhibit 3, D and E, each capableof producing the same volume of output (e.g.,Q ambulatory visits) according to theirrespective production possibilities frontiers.While both providers operate at the sameoutput level, they produce care of differenttechnical quality: provider D is assumed toprovide care of greater technical quality, H ,1
while provider E is supposed to produce careof a lower technical quality, H .2
Suppose that provider D operates atpoint 1 and provider E operates at point 2. Ifthe researcher attempting to compare technicaland economic efficiency between the twoproviders did not take into account theirdifferences in technical quality, he would reachthe conclusion that provider E is technically and economically more efficient than D. Hisconclusion would arise from the fact that provider E uses fewer production inputs than D (X anda2
X versus X and X , respectively) and, as a consequence, provider E produces the level of outputb2 a1 b1
Q at a lower total cost than D. His conclusion would be wrong.
An appropriate comparison of efficiency is one which, at any given level of output, relatestechnical quality to input use. The researcher should therefore establish a relationship between H1
and (X ,X ) for provider D and compare it with the equivalent relationship between H anda1 b1 2

CERD '
Wa @Xa1%Wb @Xb1
H1
CERE '
Wa @Xa2%Wb @Xb2
H2
For example, if W and W were the purchase prices of the two inputs, then the cost effectiveness ratio (CER) of providers D and10a b
E would be computed as follows:
The CER ratio computes the cost per unit of health outcome achieved. When a choice is to be made among alternative providersor interventions, the one with the highest cost effectiveness ratio is chosen.
17BITRAN HFS APPLIED RESEARCH
(X ,X ) for the provider E. However, because the input levels X and X are in physical units, ita2 b2 a b
is difficult to establish a quantitative relationship between health outcome levels (H) and the inputlevels.
A solution to that problem is the cost effectiveness technique, which consists of multiplyingeach production input by its price to compute the total cost of production, and then relating the totalcost to the health outcome level. There exist other techniques for measuring and comparing10
technical and economic efficiency among various providers. Such techniques, presented insubsequent sections of this paper, include econometric estimation of production and cost functionsand the Data Envelopment Analysis method.
Higher technical quality does not necessarily imply greater use of inputs, as is suggested byisoquants D and E in Exhibit 3. There, it is assumed that technical quality is higher along theisoquant D than along E, and also that resource use is greater for D. That does not necessarily haveto be the case in all situations. For example, consider production of quantity Q according to F.Provider F's technical quality could be higher than E's, with F using smaller quantities of inputswhen both providers operate at the far right of their possibilities (that is, production that is intensivein resource X ). Or technical quality of provider G could be greater than that of E at all points, yeta
with G consuming fewer inputs than E and thus being technically and economically more efficient.
3.2 EFFICIENCY AND CASE MIX
Just like differences in technical quality of care obscure comparisons of efficiency amongproviders, so do differences in case mix. Case mix is an important, yet hard to define, concept (seeTatchell (1983), Hornbrook (1982a), and Hornbrook (1982b)) through which researchers attemptto define hospital output. Definitions available involve some or all of the following information:facilities (or services) available, intermediate and final services actually provided, complexity of thecases treated, and patient characteristics (for example, age and gender). Everything else beingconstant, one would expect efficient providers with different case mix to use different levels ofproduction inputs. For example, a facility with a greater proportion of complex cases should beexpected to use more resources in production than an otherwise identical facility treating a set ofpatients with fewer severe cases.

See the companion Phase 1 HFS paper on "Provider Incentives and Productive Efficiency", by Bitran and Block (1992).11
Ibid.12
18BITRAN HFS APPLIED RESEARCH
Exhibit 4: Case Mix and Efficiency
Unless case mix is considered,comparative studies of technical and economicefficiency among several providers will likelybe wrong. To illustrate this point, consider inExhibit 4 the case of two providers, L and M,with L treating high severity patients, such aschildren with severe dehydration fromdysentery, and M treating low severity patients,like children with mild dehydration fromdysentery. Highly dehydrated children mayneed to remain hospitalized for several days,often receiving intravenous feeding andrehydration, and requiring close attention bythe facility staff. Children with milddehydration can be sent home with instructionsto the parents to feed them oral rehydrationsalts and with the appropriate treatment fordysentery. Suppose that provider L operated atpoint 3 to treat high severity cases while provider M operated at point 4 to treat the milder cases.If case severity were not taken into account in this case, the uninformed researcher would wronglyconclude that provider M, the one with the lowest input use, is the more technically andeconomically efficient. If case mix were considered, however, the researcher would observe thatthe provider consuming the greatest amount of resources happens to treat the most severe cases.Without further analysis he could not make any definitive statements about relative efficiency.
3.3 ECONOMIC EFFICIENCY AND INPUT PRICE ISSUES
Depending on a variety of circumstances, dealing with the incentives, constraints, andinformation available to health facility managers , some providers may operate in a technically11
efficient, yet economically inefficient manner. One such circumstance has to do with the prices ofproduction inputs. Economic inefficiency arises when production occurs at a point that is not costminimizing. This can happen either because facility managers do not know their input prices, orthey know the prices but, for a number of reasons discussed elsewhere , they fail to minimize their12
costs.

19BITRAN HFS APPLIED RESEARCH
Exhibit 5: Economic Efficiency and Input Prices
To distinguish between those two cases,consider the example of two providersoperating at points 1 and 2 in Exhibit 5, eachproducing output level Q according to the sameproduction possibilities frontier. Assume alsothat the two providers pay the same set ofprices for their production inputs, X and X .a b
Under those circumstances, provider 1 wouldbe the most economically efficient of the twobecause its production cost would be B , lower1
than B . If the researcher wanting to study2
economic efficiency for these providers knewthat both face the same input prices, he wouldnot need to measure those prices at all torightly conclude that 1 is more economicallyefficient than 2.
Suppose, instead, that providers 1 and 2face different input prices. Unless the researcher knew exactly what those sets of prices were, hewould be unable to make any statements about the providers' relative economic efficiency. Bothproviders could be cost minimizers but, given the different prices they face, they would operate atdifferent points along the production frontier. Or both could operate at points that are not costminimizing. To ascertain their relative economic efficiency, knowledge and use of the priceinformation would become essential.
In general, two types of circumstances, discussed above, can lead to economic inefficiency:technical inefficiency and technically efficient production that uses a mix of inputs that is not costminimizing. There is a third cause of economic inefficiency, referred to as social economicinefficiency that can arise when the input prices faced by facility managers (for example, personnelwages or pharmaceutical products) depart from social (or shadow) prices. Social economicinefficiency is discussed next.
A socially undervalued production input will likely result in too much use of it relative towhat a social economic evaluation would dictate, while an overvalued resource will result in toolittle use of it. For example, in a country with an overvalued currency, the transaction, or marketprice of imported inputs, such as pharmaceutical products, will be low relative to the shadow priceof those goods. This may result in excessive use of drugs and medical supplies and, thus, ineconomic inefficiency from the viewpoint of society.

20BITRAN HFS APPLIED RESEARCH
Exhibit 6: Social Economic Inefficiency in Production Due to anUndervalued Input
Exhibit 6 helps to illustrate, through anexample, how divergences between transactionand social input prices can result in socialeconomic inefficiency even if the provider isminimizing its private (as opposed to thesocial) costs of production. Suppose that theproduction of Q curative visits takes place atpoint 1, the economically efficient way ofproducing Q when the transaction input pricesare W and W . The associated minimuma b
provider cost of producing Q is equal to B .1
Suppose, however, that one of the inputs isundervalued relative to the socially correctprice. Assume, for example, that X is nurseb
time and W is the undervalued hourly wage ofb
nurses. If the facility manager had to pay thehigher, social wage to nurses, the budgetconstraint line would rotate downwards asdepicted by the arrow in the figure. In that situation, the budget of B would become insufficient1
to produce quantity Q. Production of Q at the minimum social cost would occur at point 2 at thehigher total cost of B . Notice that when the socially appropriate input prices are considered, then2
production at point 1 actually costs society B , an amount greater than both B and B . Social3 1 2
economic efficiency would increase by moving production from point 1 to point 2 because the socialcost of production would drop from B to B .3 2
3.4 TECHNICAL AND ECONOMIC EFFICIENCY: THEIR RELATIVEIMPORTANCE
A question that has not been addressed so far is the relative importance of technical andeconomic efficiency: What type of efficiency should managers wishing to improve productiveefficiency focus on: technical or economic efficiency?
As was suggested above, economic inefficiency often arises as a result of technicalinefficiency. Thus, in many instances, improvements in technical efficiency (reducing the amountof resources used to produce a given quantity of output) will also result in greater economicefficiency (lowering the cost of producing a given quantity of output).

21BITRAN HFS APPLIED RESEARCH
Exhibit 7: Technical Versus Economic Efficiency
An example of this is shown in Exhibit7. Technical and economic efficiency areimproved when production moves from point1 (at cost B ) to point 2 (at cost B <B ).1 2 1
Unfortunately, greater technical efficiency willnot always result in higher economicefficiency. In some instances, a gain intechnical efficiency will result in a loss ineconomic efficiency. For example, productionof Q according to point 1 is technically lessefficient than according to point 3.Nevertheless, production at point 1 iseconomically more efficient than at point 3(because B <B ). This is so because of the1 3
relative prices of inputs X and X .a b
Which of the two production points tochoose, point 1 or point 3, will depend on theincentives and constraints of facility managers as well as on quality of care considerations. Ifmanagers were free to allocate production resources, and if they had the right cost minimizingincentives, then they should choose the lowest-cost, economically efficient production, or point 2.One factor which could possibly lead cost minimizing managers to choose a point along QQ otherthan point 2 would be the consumers' perceived quality of care. For example, suppose thatconsumers predominantly preferred point 3 to point 2, because they liked better those services thatare intensive in resource X . Under those circumstances, if managers attempted to produce at pointb
2 they could find themselves with a quantity demanded smaller than Q, with unutilized resources,and thus with economic inefficiency. This discussion illustrates that the problem of deciding howto combine production inputs can become more complex when demand is taken into account, andit stresses the importance of understanding and considering demand information in the planningprocess. The ultimate solution to the problem will depend in part on how responsive demand is toalternative input configurations, as well as on the financial constraints of the facility, the goals ofmanagers, and the mandate of the health system.

The studies on production efficiency and related studies reviewed for this section are: Vitaliano (1987), Caves and Christensen13
(1980), Sear (1991), Wyszewianski, Thomas, and Friedman (1987), Valdmanis (1990), Sherman (1984), Register and Bruning (1986), Eakin(1991), Eakin and Kniesner (1988), Reinhardt (1972), Goldman and Grossman (1983), Toda (1976), Byrnes and Valdmanis (1989), Golladay,Manser, and Smith (1974), Timmer (1970), Nutting, Burkhalter, Dietrick, and Helmick (1982), Nutting, Shorr, and Burkhalter (1981),Berwick (1989), Prescott, Cuthbertson, Fenwick, Garraway, and Ruckley (1978), Gold (1979), O'Donovan (1979), Lee, Wolfe, and Swenson(1984), Gururaj, Laude, Rajkumar, and Russo (1982), Pineault, Contandriopoulos, Valois, Bastian, and Lance (1985), Soulier andDeCoster (1982), Blandes, Culyer, and Walker (1987), Thorngren and Tinstman (1990), Bliersbach (1989), and Wan, Vanostenberg,Salley, Singley, and West (1987). For the reasons cited earlier, only a selected subset of these papers is discussed in thisdocument.
See, for example, Register and Bruning (1987) and Lee et al. (1984).14
22BITRAN HFS APPLIED RESEARCH
4.0 REVIEW OF SELECTED STUDIES ON HEALTH SERVICES EFFICIENCY FROMTHE DEVELOPED WORLD
In recent years there has been a growing body of literature about the efficiency of health careservices in industrialized countries, particularly in the U.S., where each year, over the past twodecades, health care costs have risen much faster than the consumer price index. Knowledge aboutthe levels and determinants of health services efficiency can help policymakers and health caremanagers determine whether there is inefficiency in production and, if so, to take measures aimedat curtailing costs while maintaining acceptable levels of quality and access.
This section presents a review of selected studies of health services efficiency conducted inindustrialized countries. The purpose of the section is to discuss measurement issues and describe13
measurement techniques that may be applied to measuring efficiency in developing countries.
The section first illustrates how the problems discussed in Section 3 —quality and case-mixheterogeneity and price variations and distortions— are dealt with in the developed countryliterature. Next, the section presents alternative techniques for the measurement of efficiency,including: ratio analysis, econometric estimation of cost or production functions and associatedmeasures of efficiency, and data envelopment analysis and related linear programming techniques.
4.1 THE PROBLEM OF QUALITY HETEROGENEITY
As already noted, quality variations in health services hinder efficiency comparisons amongproviders. Failure to control for quality differences may ascribe higher efficiency to lower-qualityproducers and vice-versa. Most studies of health facility costs and efficiency ignore the problemof quality variations, some implying that the only possible source of bias in efficiency measurementamong providers is the difference in case-mix (see discussion below). 14
Controlling for quality variations in the measurement of efficiency poses importantmethodological problems, mainly because of difficulties in measuring quality. Even if only atechnical, or supply-side definition of quality is adopted, data limitations generally preclude anappropriate quality adjustment in studies of efficiency. If technical quality is to be measured on thebasis of compliance with technical treatment standards and health outcomes, as in Wyszewianski

An example of this type of study done in the developing country context is described in Section 5 (see Shepard et al., 1991).15
Pineault at al. (1985), p. 173. The authors point out that "direct measures of satisfaction are obtained by asking the patient16
to what extent he (she) is satisfied with various elements of the medical care process." (They also mention that there is a greatdeal of literature on this subject, and cite Ware et al. (1978) and Zastowny et al. (1983)).
In the case of meniscectomy patients, the recovery period extends beyond three months and is much longer than for the other17
surgical procedures. The study thus did not assess the long-term recovery for meniscectomy patients.
23BITRAN HFS APPLIED RESEARCH
et al. (1987), then a study of efficiency that controls for quality of care would have to obtaininformation about both the procedures performed and the patients' health status after the care isprovided.
Collecting information on the extent to which medical standards are met in the provision ofcare can be time consuming, but is feasible within the realm of a study. Gathering informationabout health outcomes, however, can be a difficult task, particularly for medical procedures that arefollowed by slow patient recovery that takes place primarily outside of the health facility.Nevertheless, several studies have assessed health care quality by measuring clinical outcomes.Examples of studies which use the two alternative measures of technical quality are describedbelow.15
In their study of one-day surgery in Quebec, Pineault et. al (1985) compare patientsatisfaction, clinical outcomes, and costs of care between individuals undergoing one-day(ambulatory) surgery for tubal ligation, hernia repair, and meniscectomy, and individualsundergoing inpatient (overnight stay) surgery for those procedures. Patients participating in thestudy were randomly assigned to either one-day or inpatient surgery. This study combines bothdemand- and supply-side measures of quality (patient satisfaction and clinical outcome,respectively) with cost data.
Pineault et al. distinguish between "direct" and "indirect" measures of patient satisfaction,but adopt the latter, arguing that direct measures "are not specific enough and thus fail todiscriminate between different modes of care." The indirect measures they retain pertain to16
"patients' perception [of the process of care]" and include:
(1) accessibility, as measured by perception of distance between home and hospital,controlling for real distance; (2) physician availability, as measured by at least onepostoperative visit (excluding follow-up visits); and (3) patients' opinion concerningthe appropriateness of the length of stay, and overall preference for the alternativemode of care [patients were asked if, given their actual experience, they wouldchoose the same setting again or the alternative mode of care]. [p.173]
Evaluation of clinical outcomes came from two sources: the patients' view, which includedseriousness of discomfort felt in the first 24 postoperative hours and the self-reporting of post-surgical problems (over a three-month follow-up period) , and medical charts, which provided17
medical information on complications, general health status, symptoms, and complaints.

24BITRAN HFS APPLIED RESEARCH
A weakness of the study is its inability to provide specific mechanisms for combining thethree dimensions of the evaluation (patient satisfaction, clinical outcomes, and cost) into a uniqueperformance measure which would allow comparisons between one-day and inpatient surgery. Thisis a problem if a procedure that is better on one dimension is worse on another.
A second limitation of this type of exercise is that the interpretation of the results requiresvalue judgements about the relative importance of health outcomes. For example, more than 50%of one-day surgery patients would accept a repeat of their experience for tubal ligation and herniarepair. In addition, that form of care represents cost savings for both the patient and the Quebechealth financing authority. From the above, the authors conclude that "tubal ligation and herniarepair seem to be surgical procedures for which one-day surgery is an appropriate form of care"[p.180]. This conclusion implicitly assigns a weight of zero to the other half of the patients whowere dissatisfied and would not repeat their experience.
The Pineault et al. study is useful in illustrating the types of information that can be collectedto assess qualitative aspects of health care but, like other studies of this nature, it provides little clueas to how qualitative measures can be combined with cost information for evaluative purposes.
The Pineault et al. study illustrates that quality of care can be assessed and controlled for invarious ways when measuring efficiency. This includes measuring quality according to:
(1) The degree of compliance with medical norms of practice;(2) Clinical outcomes; and(3) Various measures of patient satisfaction.
Combining two or three of these measures into a single quality indicator is impractical, for itrequires value judgements that will generally be questionable. Separate use of any of theseindividual measures, however, in combination with information about costs, may shed light on truerefficiency differences among providers (i.e., differences less contaminated by quality variations).Nevertheless, two important problems remain unresolved. First, when two or more of theseindicators are used, problems will arise if the quality measures yield conflicting results. Forexample, if provider A exhibits better compliance with clinical norms than provider B but patientsatisfaction (or clinical outcome) is better with B than with A, quality differences between the twoproviders will remain ambiguous. A related, unresolved problem is the weighting of various qualityindicators. An extreme example, that uses only clinical outcome as the quality measure, is asituation where the majority of provider A's patients recover fully but a small fraction die, versusthe patients of provider B, all of whom recover only partially. In such cases, there will beambiguities about quality differences between providers.
4.2 THE PROBLEM OF CASE-MIX DIFFERENCES
Comparative studies of health facility costs and efficiency have to overcome the difficultmethodological problems arising from the wide diversity of health care activities produced and the

25BITRAN HFS APPLIED RESEARCH
effects that this heterogeneity has on resource use, cost, and efficiency. This problem is particularlyserious in the case of large secondary and tertiary hospitals.
Tatchell (1983) provides a comprehensive review of methods and studies used in theliterature to tackle this problem in the context of hospital care. He identifies two main approachesfor defining and measuring hospital output: one that uses "final outcomes" (or health outcomes orhealth status measures) and one that uses health output (services produced by the provider, such asnumber of discharges, patient days, number of deliveries, and so on). Tatchell argues, as has beendone earlier in this paper, that the use of health outcome as a measure of health provider activity ishindered by two problems. First, health outcomes are difficult to measure since they often requirepatient follow-up over the long periods of time during which recovery is expected to occur. Second,even if changes in health outcomes can be measured, it is difficult to discern which part of thechanges is attributable to health care and which is due to other factors affecting health status. Theauthor therefore focuses his review on the use of health outputs (or "intermediate outcomes") tomeasure hospital output.
Tatchell argues that:
The main problem faced by researchers employing [health output] measures is lackof homogeneity. The problem presents itself in a number of ways and for a varietyof reasons. A patient day of care, for example, is likely to differ:
(a) between hospitals;(b) between different departments of the same hospital;(c) over time (both short term for a particular patient and in the longer term
overall).
These differences may arise because of:
(a) changing technology;(b) varying qualities of care;(c) varying case-mix(d) varying case complexity or case severity;(e) varying institutional characteristics—size, teaching status, location,
composition, ownership, and so on. [p.872]
The author identifies two methods to standardize hospital output: service-mix and case-mix.The service-mix approach uses information about the types of services offered by the hospital (e.g.,obstetrics and gynecology, oncology) as a basis for standardizing hospital output. Vitaliano (1987)calls this a supply-side method because it does not directly take into account utilization information,which is a function of demand as well as supply. Tatchell argues that the existence of commonservices among providers does not imply that the mix and complexity of cases, as well as the qualityof care, are similar among providers. He also points out that knowing whether or not certain

26BITRAN HFS APPLIED RESEARCH
services are offered by a particular provider is not sufficient to characterize its output, because thereis a lack of information about the extent to which those services are actually used.
The case-mix approach attempts to standardize hospital output according to the mix of casesactually treated in hospitals. Vitaliano (1987) calls this method a demand-side one. In fact, bothmethods reflect demand and supply forces, since the services offered by hospitals generally respondto demand in the longer run. The case-mix approach, however, captures supply-demand interactionsbetter because it is based on utilization information. Under the case-mix approach, Tatchelldistinguishes several methods; they are: specialty mix, diagnostic related groupings, informationtheory, case severity, and other measures. The definitions, advantages, and disadvantages of thesemethods, as well as the studies that have used them, are reviewed in detail by Tatchell. Exhibit 8summarizes the approaches available to standardize hospital output, according to Tatchell's review.

EXHIBIT 8 Approaches for Standardizing Hospital Output
According to Tatchell (1983)
Measuring hospital output
BITRAN 27 HFS APPLIED REEEARCH
According to intermediate outcomes or outputs 1
Hospital outputs (e.g., patient days, discharges, deliveries) , 1
Hospital inputs (e.g., number of doctor- and nurse- hours, number of beds)
Output standardization Output standardization according to service- according to case-mix
mix information information
Diagnostic related groupings
1
Information theory

Register and Bruning (1987), p.902.18
The technique and results are described in section 4.6.19
28BITRAN HFS APPLIED RESEARCH
The remainder of this section focuses on the use of the case-mix approach to control forvariations in output when measuring health facility efficiency.
When comparing efficiency among providers, the problem of variations in case mix can beovercome in part though econometric estimation of multi-product cost functions (see discussion inSection 4.5). This approach has been used by Grannemann et al (1986), Vitaliano (1987), Eakinand Kniesner (1988), Eakin (1991), and many others. Because of data limitations, however, whileit is sometimes possible to obtain data about composition of output, it is usually difficult to gatherinformation on output complexity. Complementary techniques must then be used in studies ofhealth facility efficiency. These are described below.
Register and Bruning (1987) suggest that case mix differences may introduce a bias in theircomparative study of efficiency between for-profit and not-for-profit U.S. hospitals. Lackinginformation on case mix of individual hospitals, they distinguish among hospitals based on aprocedure that uses case mix proxies to limit the confounding effects of case heterogeneity onefficiency measures. They assume that urban and rural hospitals differ in case mix and thus droprural hospitals from their sample. Next, they eliminate from the sample all long-term and federalhospitals. Then they restrict their sample to hospitals which provide a specified set of services, thuseliminating those that are either too basic or too "high-tech". Finally, they posit that hospital size,18
as measured by the number of beds, also is associated with case mix. They therefore limit theirsample to hospitals within the range of 100 to 250 beds.
In order to check their hypothesis that hospital size is associated with case mix, the authorsuse a rather questionable method, however. They group hospitals by size and compare the groupson the basis of bed-to-doctor and bed-to-nurse ratios. They interpret differences in ratios asdifferences in case mix, a rather questionable conclusion. Contrary to their intentions, thisprocedure may introduce a bias into their analysis, because beds-to-labor ratios may reflect not onlycase mix but also efficiency differences.
The authors then use a multiple-output, multiple-input approach for estimating hospitaltechnical efficiency. This allows them to control for case composition, while the previous19
procedure (if the bed-to-labor argument is assumed to be appropriate) for restricting the sampleallows them to control for complexity, as well.
Register and Bruning found that no significant difference in technical efficiency existedbetween for-profit and non-profit hospitals.
In their study of economic efficiency of U.S. hospitals, Eakin and Kniesner (1988) alsoconfront the problem of case-mix differences among facilities:

The findings by Eakin and Kniesner are discussed below, in Section 4.6.20
Additional findings from Vitaliano (1987) are presented in Section 4.6.21
For a comprehensive review of methods available, see Tatchell (1983).22
29BITRAN HFS APPLIED RESEARCH
The output data indicate that hospitals are a heterogeneous group with respect to themix of cases treated. Consequently, we adopt a multiple output specification in thisstudy. In particular, we use four categories of outputs—general medicine, obstetricsand gynecology, weighted surgery, and outpatient visits. [p.587]
The above procedure allows the authors to control (very crudely) for case composition. Inorder to control for case severity and factors other than case mix influencing hospital costs, theyproceed as follows:
Three additional variables—TEACH, a dummy variable indicating medical schoolaffiliation, ALOH, the average overall length of hospitalization, and OR, the averageoverall occupancy rate—are included in the list of regressors to control for caseseverity and capacity utilization. [p.587]
The variable TEACH is used to capture the (positive) effect on hospital costs of teachingactivities. As pointed out by Vitaliano (1987), 'The teaching-related costs of a medical school arelikely to exert an upshift, "ceteris paribus", on hospital costs. Normally, the expected sign of themedical school variable would be positive' [p. 310]. The length of hospitalization variable isintroduced by Eakin and Kniesner to control for severity; however, this variable may also representdifferences in medical practice not attributable to severity but which may reflect differences inefficiency. The occupancy rate variable is introduced to discriminate between technical andeconomic efficiency, a useful distinction. A hospital can be technically efficient (i.e., it can operateon its production possibilities frontier) but, because of low occupancy, it may be economicallyinefficient. Because the demand for inpatient services is to a large extent exogenous to the facility,a particular hospital located in a low demand area may be able to attain maximum technicalefficiency yet unable to raise its economic efficiency.20
Vitaliano (1987) adopts a service-mix approach to control for case-mix and its effects onhospital efficiency which draws from Francisco (1970) and Tatchell (1983). For each hospital in hissample he constructs an unweighted index of 11 available hospital facilities or services and uses thatindex as an independent variable to estimate a total cost function. He finds that the service-mixvariable is statistically significant and has an important positive effect on total cost.21
In sum, there are several methods available to control for case mix when evaluating healthprovider efficiency. They include: 22
(1) Limiting the sample of providers to be compared on the basis of efficiency to those thatprovide a similar case mix;

30BITRAN HFS APPLIED RESEARCH
(2) In econometric studies of efficiency, including as explanatory variables indicators of casemix such as the types and volumes of outputs produced, measures of output complexity, andqualitative variables indicating whether the provider performs other activities that affectresource use, such as the provision of medical education; and(3) Limiting the comparison of efficiency to a few, well-defined medical services (e.g.,appendectomies, hernia repairs, etc.), as was done by Pineault et al. (1985). When using thefirst method, case mix information should be derived based on the providers' outputs and noton the inputs (as was done in some of the studies described above), since input usage is anelement of productive efficiency.
4.3 THE MEASUREMENT OF EFFICIENCY AND INPUT PRICE ISSUES
As was discussed in Section 3, knowledge of input prices is necessary to compare economicefficiency among providers. Further, to assess social economic efficiency, knowledge of shadowprices of inputs is needed, as well.
The DEA technique, explained in greater detail later in Section 4, limits itself to thecalculation of technical efficiency, and therefore does not use any input price information. Ratioanalysis, described below, can require input price data. While some examples were found in theliterature where provider expenditure information was used for the computation of efficiency ratios,no examples were found where input prices were used explicitly in the analysis. Similarly, nodiscussion was found among ratio analysis studies about the issue of departures between market andsocial prices of inputs and the associated efficiency implications. The literature on efficiencymeasurement using econometric estimation of cost functions does address the input price issuesdiscussed in Section 3. Examples of approaches are provided in Section 4.5 below.
4.4 MEASUREMENT OF EFFICIENCY: RATIO ANALYSIS
The measurement of productive efficiency through ratio analysis generally consists ofcomputing and comparing one or both of the following two types of ratios: input to output ratiosand cost of inputs to output ratios. An obvious and important limitation of this method is itsinability to deal with multiple-output production. The first type of ratio—input tooutput—approximates technical efficiency; the second—cost of inputs to output—approximateseconomic efficiency.
There is a rich literature on the measurement of health services efficiency using ratioanalysis. Barnum and Kutzin (1990) provide an excellent review of that literature for developingcountries. To illustrate the types of analysis performed in ratio analysis, two papers about the U.S.are briefly described below.
Sear (1991) conducted a study of efficiency and profitability of investor-owned and not-for-profit hospitals using a sample of 142 hospitals obtained in 1988 by the State of Florida Health CareCost Containment Board. He used three measures of efficiency: (1) the total number of full-time

AdjPatDay' j Patient Days@ 1%outpatient revenue1%inpatient revenue
Adjusted patient day was defined as follows:23
Presumably, this ratio constitutes an attempt (however questionable) to capture in a single measure (AdjPatPay) the volume of bothoutpatient and inpatient output.
If standard statistical confidence is sought for differences in ratios, however, the sample of providers must be large enough.24
31BITRAN HFS APPLIED RESEARCH
equivalent (FTE) personnel per active bed; (2) the number of man-hours per adjusted patient day;23
and (3) the total wages paid per adjusted patient day. He found that investor-owned hospitals usedsignificantly fewer FTE staff per bed, had significantly fewer man-hours per adjusted patient day,and paid significantly less in wages (this last finding — a difference in the price of an input — doesnot say anything about relative economic efficiency).
Lee et al. (1984) conducted a comparative study of efficiency between free-standingambulatory care and hospital-based care using data from three hospitals and three neighborhoodhealth centers participating in the Bedford-Stuyvesant and Crown Heights Demonstration Project.Using a simple method for allocating fixed and indirect costs, the authors computed the average costper visit in hospitals and health centers. They found wide variability in costs and no clear patternemerged between the two types of facilities. Using other methods for apportioning various coststo visits, the authors demonstrated how sensitive the results were to the cost allocation ruleemployed.
Ratio analysis has several advantages, including its conceptual simplicity, ease ofcomputation, low cost, and the fact that it can be performed on small samples. Ratio analysis has24
several limitations, however. A first, and important one, is the method's inability to deal withmultiple-output production, as noted above. Also, in some instances, ratio analysis requires thatcertain costs of multi-product providers be allocated among services, an exercise that usuallyrequires arbitrary assumptions about allocation rules. Often, the results are very sensitive to theallocation rule used. Also, ratio analysis is not immune to the problem of quality and case mixvariations among providers. Unless adequately done (two totally different kinds of ratios areinvolved), ratio analysis may also fail to distinguish between technical and economic efficiency.
Depending on the circumstances, the advantages of ratio analysis may prevail over itsshortcomings and its use may thus be warranted. Additionally, ratio analysis is a powerful tool forassessing efficiency within a health care institution. A thorough discussion of the advantages andlimitations of this technique can be found in Barnum and Kutzin (1990).
4.5 MEASUREMENT OF EFFICIENCY: ECONOMETRIC ANALYSIS OF HEALTHFACILITY COSTS
The statistical study of health facility costs, especially hospitals, has received a great andgrowing amount of attention in the U.S. literature over the past three decades. Cowing et al. (1983),citing Feldstein (1974), attribute this interest to two primary factors:

lnC ' lnA%ji"i@lnPi%F(Y,D,CM,R,Z)%,
A compact expression for the logarithm of the total cost function used by Grannemann et al is25
where A contains a vector of various factors that are assumed to affect the level of costs, but not the shape of the cost functionwith respect to outputs; P is the price of the i production input; Y is a vector of hospital outputs (Y -Y are inpatient days,i 1 3
th
by type, Y is outpatient visits, and Y is emergency department visits); D is a vector of inpatient discharges by type, CM is a4 5
matrix of case mix variables, R and R are vectors of variables indicating hospital's sources of revenue; Z is a vector of1 2
miscellaneous other outputs produced in some hospitals; and , is a random error. The F function includes single, squared, cubic,and interaction terms for the Ys, single and squared terms for the Ds and the Ys and selected interaction terms between: the Dsand the CMs, the Ys and the CMs, and the Ys and the Rs.
The authors describe these constraints as follows:26
...hence, the production function associated with this cost function by duality is homothetic. This impliesthat the cost minimizing mix of inputs is unaffected by the volumes or mix of outputs produced. It also meansthat changes in input prices will affect cost estimates only by a scale factor; they will not change therelationship between marginal and average incremental cost or measures of economies of scale.
32BITRAN HFS APPLIED RESEARCH
...the emergence of health care as a major national public policy concern, and the useof the health sector to test new economic models dealing with such "nonstandardmarket" characteristics as non-profit institutions, non-price rationing, third-partyfinancing of services, and inherent uncertainty on the part of the consumer. [p. 257]
There are a number of excellent surveys of the hospital cost literature, including Cowing etal. (1983), Feldstein (1974), and many others. The interested reader is referred to those reviews toobtain a comprehensive picture of the work done prior to 1983.
Many additional studies have been conducted since the Cowing et al. (1983) review, andwith an increasing degree of sophistication. Providing a comprehensive survey of those, of course,falls outside of the scope of this paper. Instead, this section reviews a small number of recentstudies of health facility cost which use somewhat different methodologies and which are consideredparticularly relevant for the study of health services efficiency in the developing world. Theyinclude Grannemann et al (1986), Vitaliano (1987), Eakin and Kniesner (1988), Frank and Taube(1987), and Eakin (1991).
Grannemann et al. (1986), in their statistical study of costs and efficiency of a sample ofU.S. hospitals, introduce a "modified translog" total cost function where outputs enter directly, andnot in logarithmic form, to permit zero output levels. Capital is included as an independent variable,reflecting their assumption that capital is not fully exogenous to the hospital. This total costfunction is therefore a long-run function which allows for endogenous variations in a hospital'scapital stock. They also include various measures of hospital output, including emergency care,home visits, and two measures of inpatient care, to account for differences among hospitals inaverage length of stay.25
Contrary to Eakin and Kniesner (1988), Grannemann et al. had poor data on input prices.This led them to exclude from their cost function interaction terms between input prices and outputlevels. This introduces an important theoretical constraint in their work.26

As is acknowledged by the authors, the possible endogeneity of output may bias the regression coefficient on the output terms27
in a single-equation OLS model. They argue, however, that this bias may be small because third-party reimbursement weakens therelationship between the amount reimbursed (and thus cost) and quantity demanded.
Vitaliano also supposes that hospitals are cost minimizing, an arbitrary assumption which may hamper the interpretation of28
statistical results if wrong. He argues 'Although almost all the hospitals included in this study are not-for-profit, the regulatorsallow them to keep any "profit" and impose financial penalties for cost overruns. Thus it is not unreasonable to assume least-costbehavior on the part of the hospitals."
33BITRAN HFS APPLIED RESEARCH
The authors estimate various measures of hospital performance, including marginal cost,average incremental cost, and product-specific economies of scale and scope (see definitions ofterms in Section 3). Estimation of the cost function and associated measures is done using data fromthe 1981 American Hospital Association's Annual Survey. Estimation is done using ordinary leastsquares.27
Grannemann et al. find that case mix measures of both inpatient and outpatient care areimportant, and that characterizing outpatient care volume according to both patient days anddischarges helps explain cost variations among hospitals. They also find that estimates of marginalcosts for these two inpatient quantity measures are inconsistent with a reimbursement system whichpays on a discharge basis only while reimbursing nothing at the margin for additional days of care.The results suggest economies of scale (declining average incremental cost) for emergencyoutpatient care but no economies of scale for other kinds of ambulatory care. Diseconomies ofscope are found between inpatient and outpatient activities.
Vitaliano (1987) argues that econometric studies of efficiency which use a multiple outputapproach are plagued by the statistical problem of multicollinearity among outputs, which hindersthe interpretation of regression coefficients. He also points out that hospital cost behavior shouldbe studied in the context of a system of equations, where price, cost, and output are determinedjointly; a single equation is a reduced form of the system, a fact that hampers the interpretation ofstatistical coefficients.
Vitaliano uses a sample of 166 New York State hospitals. He argues that, because prices areexogenous to the hospital (due to prospective reimbursement) and hospital "output is non-storableand supplied on demand", estimation of a single cost equation is appropriate. He thus proposes28
a minimum total cost equation with a single output, to conduct a comparative study of economicefficiency. Next, apparently owing to data problems, he proposes to use number of availablehospital beds as a proxy for hospital output. Beds, a capacity measure, is more weakly related tocosts than output is. Other explanatory variables included as regressors are: the teaching conditionof the hospital (MEDSCHOOL); a case mix index of services provided in the hospital(FACILITIES); a regional dummy variable (URBAN); and a measure of the hospital's monopolyand monopsony power (SHARE), as measured by the hospital's share of the total supply of beds in

C ' a%b@BEDS%c@BEDS2%d@MEDSCHOOL%e@FACILITIES%f@URBAN%g@SHARE%,
wi
wj
'
FXi
FXj
His final total cost equation is a quadratic functional form:29
where , is a random error term and the other variables are as defined in the text.
34BITRAN HFS APPLIED RESEARCH
its county. Vitaliano argues that a monopsony or oligopsony hospital may be able to exert29
downward pressure on factor prices. His estimation technique is weighted least squares.
With his quadratic cost function, the author obtains a U-shaped average cost function.However, when he uses a different specification for the cost function (log form), he finds a decliningaverage cost curve and, thus, economies of scale. These results are not entirely surprising, since aquadratic function is likely to yield a U-shape average cost curve, whereas a logarithmicspecification is not. He attributes the economies of scale to the presence of high fixed costs suchas specialized personnel and equipment.
Eakin and Kniesner (1988) propose a general method for estimating hospital cost functionswhich allows for the possibility that hospitals may not be cost minimizers. They point out that costminimization is a special case of a more general case where cost minimization does not necessarilyoccur. They point out that "erroneously assuming cost minimization leads to inaccurate estimatesof factor substitution possibilities." [p.584]
The authors list several reasons why hospitals may minimize neither their own private costsnor the social cost of production. Failure to minimize private costs may result from: differencesbetween expected and actual input prices; systematic biases in hiring resulting from satisficingbehavior on the part of managers; and mismeasurement of prices. Failure to minimize social costsmay result from any of the above reasons, as well as from systematic over- or under-valuation bythe firm of the social price of resources.
Given a technology and input prices, costs are minimized when the ratio between any pairof input prices equals the ratio between the inputs' marginal rate of technical substitution (seeSection 4.6),
where w is input price and F denotes the marginal product of factor X.X

lnC obs' lnC sh
%ln[jn
i(wi/w
shi ) @$i%j
n
j$ij @ ln(wj%2j)%j
m
k*ik @Yk @ ln(wi%2i)]
M obsi ' M sh
i @ [jn
h(wh/w
shh ) @$h%j
n
j$hj @ ln(wj%2j)%j
m
h*hk@Yk @ ln(wh%2h)]
wish
wjsh'
wi%2i
wj%2j
'
FXi
FXj
The estimated system of equations includes the logarithm of the observed total cost C equation and three observed factor30 obs
share equations M (four cost shares are observed -- i=labor, capital, materials, and physicians-- but only three equationsiobs
are independent and thus included in the system (the physicians equation is excluded)). The equation for the logarithm ofobserved total cost is
where Y denotes the level of the k output and w is the hospital's shadow price of the i input. The factor share equationsk ith sh th
included in the system are
35BITRAN HFS APPLIED RESEARCH
Misperception of the shadow price of inputs by hospital managers leads them to equate therate of technical substitution to the ratio of their perceived input prices:
where the superscript sh denotes the firm's shadow price and 2 is the "shadow price divergenceparameter." [p.584]
Eakin and Kniesner establish a relationship between the hospital's observed cost function,with observed total cost and observed input prices, and the shadow cost function, with shadow costand shadow prices. This relationship reduces to the traditional minimum cost specification when2 = 0, i.e., when the hospital's shadow price and the actual price of inputs coincide. They estimatei
a system of equations which include the observed cost function and three observed factor shareequations. The total cost function is specified as a "hybrid" translog where, to accommodate zerooutput levels, they enter the actual values of the outputs instead of their logarithm. The system is30
estimated via the method of seemingly unrelated non-linear regression.
Estimation of the non-minimum cost function requires data on observed costs, observedinput cost shares, input prices, and output levels. In their specification they include four outputs(general medicine, obstetrics and gynecology, weighted surgery, and outpatient visits) and fourproduction inputs (non-physician labor, capital, physicians, and material). Shadow costs are, ofcourse, not observed but estimated. Their sample consists of 331 U.S. short-term hospitals.Efficiency-related measures derived by the authors include estimates of the Allen elasticities offactor substitution, the price elasticities of factor demand, marginal costs, output cost elasticities,and overall economies of scale.
The authors measure allocative efficiency (AI) as

AI '(C
obs&C
min)
Cmin
36BITRAN HFS APPLIED RESEARCH
where � denotes estimated total cost.
They find empirically that hospitals undervalue the cost of capital and overvalue the priceof physicians. Hospitals thus tend to over-employ capital and under-employ physicians. Thus, thehospitals in the sample do not minimize cost relative to market (or observed) prices. This resultsin an allocative inefficiency which is equal to about five percent of the total observed cost. Eakinand Kniesner also find that input concepts, such as elasticities of substitution and factor demands,are sensitive to model specification. However, they conclude that:
A researcher who is primarily interested in output concepts, such as marginal costand scale and scope economies, does not need to use a non-minimum cost function,even if cost minimization cannot be readily assumed [p.597].
In the case of developing countries, however, where markets are less perfect than in theindustrialized world, gaps between social, market, and perceived input prices may be large,particularly among governmental providers. Wrongly assuming cost minimization, and thus usinga standard minimum cost function, could result in large errors in both input and output measures.The non-minimum cost approach adopted by Eakin and Kniesner therefore may be warranted forestimation of productive efficiency in developing-country health services.
Frank and Taube (1987) study technical and allocative efficiency in the production ofoutpatient mental health clinic services, using data from 755 clinics obtained through a 1982 surveyby the U.S. National Institute of Mental Health. Their study focuses on the estimation of productionfunctions for mental health visits. Like Eakin and Kniesner (1988), they are interested in exploringprovider departures from cost minimizing behavior. They also do so by comparing the ratiobetween factor prices with the ratio between the factors' marginal products. As explained above,cost minimization is present when those two ratios are the same for all pairs of variable inputs.Differences in price-marginal product ratios mean that certain production inputs are either over- orunderemployed. Frank and Taube are also interested in system efficiency (see discussion in Section2), and thus study the extent of economies or diseconomies of scale in production of mental healthvisits. Finally, they study the determinants of efficiency by focusing on differences in productivitybetween government-run county and private clinics.

lnQ ' lnA%"@lnX1%B@lnX2
lnQ ' A%"@lnX1%B1@X2%B2@X22
The Cobb-Douglas production function is31
The ratio of the marginal products is ("X )/(B X ) and the elasticity of scale (ES) is " + B. The transcendental production2 1
function is specified as
The marginal product ratio is "/(2B B X X ) and ES = " + (B + 2B X )X . If ES<1 then there are decreasing returns to scale,1 2 1 2 1 2 2 2
while ES > 1 implies increasing returns to scale.
The use of OLS has been questioned in this context. The authors indicate that this practice may introduce a bias due to the32
joint determination of inputs and outputs. Citing Reinhardt (1972), however, they point out that the bias is small if factor andproduct prices vary substantially across the sample observations, which happens to be the case in their sample of mental healthclinics.
37BITRAN HFS APPLIED RESEARCH
The authors use two different empirical specifications for the production functions of theclinics: a Cobb-Douglas and a transcendental production function. Estimation of the two31
alternative production functions is done using ordinary least squares. They find decreasing returns32
to scale with both specifications, and greater productivity of private clinics, as evidenced by anownership dummy included in the production functions. Finally, they compare input price ratioswith marginal product ratios (evaluated at mean values) and find that they differ for the case ofphysician and other clinical staff, physicians being over-employed. This signals a departure fromcost minimizing behavior. With regard to their empirical specifications, they find that the simplerCobb-Douglas model performs better than the alternative specification, as measured by the goodnessof fit criterion.
Eakin (1991) uses the results from Eakin and Kniesner (1988) to study the determinants ofeconomic efficiency in hospitals. He does this by regressing their estimated measure of allocativeinefficiency (see above) against several hospital and market characteristics predicted by economictheory to be determinants of efficiency. The independent variables include ownership (i.e., a for-profit dummy and a dummy indicating whether or not the hospital is operated by a religious entity;regulatory factors (e.g., the presence of a Certificate of Need program which controls hospitalcapital outlays); competitive factors, as measured by the percentage of the population enrolled inHMOs; factors characterizing the sources of hospital revenue, including the proportion of patientswho self-pay, who are privately insured, and who are MEDICARE and MEDICAID beneficiaries;measures of hospital size (number of beds); and regional dummy variables. Estimation is doneusing estimated generalized least squares (EGLS).
4.6 MEASUREMENT OF TECHNICAL EFFICIENCY: DATA ENVELOPMENTANALYSIS AND RELATED TECHNIQUES
This section presents the work of various authors in estimating technical efficiency, usinga family of operations research techniques called Data Envelopment Analysis (DEA). Unlikeeconometric techniques for the estimation of production or cost functions, this linear programmingtechnique permits the study of production efficiency without the need to make any assumptions

OE ' TE.AE
38BITRAN HFS APPLIED RESEARCH
Exhibit 9: A graphical interpretation of technical and economicinefficiency.
about the technology of production or the presence of cost-minimizing behavior. DEA is a non-parametric technique, that is, one which estimates efficiency without the need to estimate anyparameters, such as those of production or cost functions. Finally, and also contrary to econometrictechniques, DEA is a deterministic technique, which, as such, does not include explicitly a statisticalerror term reflecting measurement or sampling error.
The papers reviewed in this section include Sherman (1984), Register and Bruning (1987),Valdmanis (1990), and Byrnes and Valdmanis (1989). A review of studies that use DEA to measuretechnical efficiency in health care organizations is provided by Rosko (1990). Before proceedingwith a review of the above references, however, a conceptual discussion about the DEA method isprovided.
Farrell (1957) developed a framework, susceptible to empirical estimation, to distinguishbetween technical and economic efficiency.His approach can best be explainedgraphically, by considering a process thatproduces a single output, Q, with twoinputs, X and X (see Exhibit 9). Asa b
explained in Section 3, all points along theisoquant, such as A and B, are technicallyefficient but only one point (point A, at theintersection of the isoquant and isocostlines) on the isoquant is economicallyefficient. Consider production of quantityQ at point F. At F there is technical andeconomic inefficiency. Farrell measurestechnical efficiency as the ratio OB/OF.Because at F more inputs are used toproduce Q than is technically necessary, OFis greater than OB, OB/OF is less than one,and thus F is technically inefficient. But atpoint B (as well as at point F, of course)there is also economic inefficiency, becausethe least costly combination of inputs to produce Q is not chosen. Economic efficiency of point Bis measured as OD/OB, where D is a point on the isocost line. Since OB is greater than OD, OD/OBis less than one, and therefore there is economic inefficiency. Farrell thus states that a provider'sdeviation from minimum cost (or from maximum economic efficiency) can be attributed to, ordecomposed into, technical and economic inefficiencies. Thus:
or overall economic efficiency (OE) equals technical efficiency (TE) times economic efficiency(AE). Using the example from the figure, overall efficiency of production at point F would be

OEF '
ODOF
'
OBOF
@ODOB
Exhibit 11 and the numerical examples provided below are adapted from Charnes et al. (1978).33
39BITRAN HFS APPLIED RESEARCH
Exhibit 10: Several Providers Producing Different Quantities of Single,Homogeneous Output (Q) With Two Inputs (X and X )a b
The Implementation of DEA. Consider aset of several providers (say, eight of them)each producing different quantities of asingle, homogeneous output, andconsuming different combinations of thetwo production inputs, X and X , as showna b
in Exhibit 10. How efficient are theseproviders? Let us consider technicalefficiency (Farrell discards the usefulness ofestimating economic efficiency, stating that"[economic] efficiency is a measure that isboth unstable and dubious ofinterpretation.(p.261)" His approach, aswell as subsequent approaches and theDEA technique, are concerned only withtechnical but not with economicefficiency.) Because the quantities ofoutput Q differ among the providers, it isnot possible, at least graphically, to determine the relative technical efficiency of each: differencesin input use may be due to either differences in the volume of output or differences in the technicalefficiency of input use, or both. To facilitate comparison, the providers can be normalizedaccording to their output level by dividing their consumption of inputs by their respective output.For example, for provider 1 we do X /Q and X /Q , which yields point P in Exhibit 11. Alla1 1 b1 1 1
33
other points in Exhibit 11 are similarly obtained. Now, the technical efficiency of these providerscan be gauged more easily.
At this point, it is important to distinguish between absolute and relative technical efficiency.Ideally, one would like to determine how each of the eight providers fares relative to the theoretical,technically most efficient production frontier. Unfortunately, as Farrell points out, it is oftendifficult to know what the theoretically efficient production practice is, and this difficulty increaseswith the level of complexity of the production process (as happens when the number and diversityof production inputs goes up, a phenomenon rather typical in the production of health care).Because of this difficulty, Farrell discards the possibility of devoting effort to the determination ofthe theoretically efficient isoquant. In any case, whether that isoquant is known or not, it woulddefinitely fall to the South-West, or at the South-Western edge, of all observed points, as depictedin Exhibit 11.

P2 '56@P4%
13@P3
57@P4%
27@P3 '
67@P2 ' P )
2
40BITRAN HFS APPLIED RESEARCH
Exhibit 11: Efficiency Points and Unit Isoquant (adapted from Charneset al., 1978)
Departures from the theoreticallyefficient isoquant being impossible tocompute, Farrell proposes to focus on theanalysis of technical efficiency ofproduction units relative to the mostefficient observed practice. The solid lineof Exhibit 11 constitutes precisely that. Itis obtained simply by joining with straightsegments the south-westernmost points inthe figure. The line thus obtained is thebest practice, technically efficient unitisoquant. Thus, points P , P , P , and P all3 4 5 6
have a technical efficiency of 100% relativeto the eight providers in the set. Incontrast, P , P , P , and P all are1 2 7 8
technically inefficient relative to theproviders on the efficient practice unitisoquant.
Using linear programming techniques, such as any adjacent extreme point method like thesimplex or dual methods, it is possible to compute an index of technical efficiency for each providerin a set. For example, consider provider 2 (P ). Using such methods, provider 2's position in the2
input plane can be expressed as
That is, it is possible to express P in terms of an optimal basis (adjacent points P and P , both of2 3 4
which are 100% technically efficient). The sum of the two weights (5/6 and 1/3) is 7/6. By dividingthe above expression by 7/6, one obtains
The above result indicates that if P had been producing as efficiently as P and P , then it2 3 4
should have been able to produce its output with only 6/7 of the amount of inputs X and X ita b
actually used. The index of technical efficiency (ITE) of P is therefore 6/7, or about 86%. Notice2
that 6/7 is equivalent to the technical efficiency ratio proposed by Farrell and described in Exhibit9, OB/OF. A similar calculation can be performed to show that P can be expressed as a linear1
combination of the technically efficient basis P and P , yielding, coincidentally, an ITE of 86%.4 5
Using the linear programming methods described above, the ITE of P and P could similarly be7 8
computed.

maxh0 '
js
r'1
ur @yr0
jm
i'1vi @xio
maxh0 '
js
r'1ur @yrj
jm
i'1
vi @xij
# 1;
.for j ' 1,...,n; ur,vi$0; r ' 1,...,s; i ' 1,...,m.
The precise formulation of the Charnes et al. (1978) approach is34
subject to:
where the subindex 0 is used to denote the facility for which technical efficiency is being calculated and where "the y , x (allrj ij
positive) are the [observed] outputs and inputs of the j DMU and the u ,v >= 0 are the variable weights to be determined by thethr i
solution to this problem --e.g., by the data on all of the DMUs which are being used as a reference set. The efficiency of onemember of this reference set of j=1,...,n DMUs is to be rated relative to the others" (p.430). According to this approach, thesolution to the technical efficiency calculation problem is obtained by solving, in any order, n linear programming, constrainedmaximization problems.
41BITRAN HFS APPLIED RESEARCH
Building on the work of Farrell (1957), Charnes et al. (1978) proposed a formal linearprogramming approach for studying technical efficiency of "decision making units", or "DMUs",allowing for multiple output production (a common characteristic of most health providers). Theyproposed an iterative algorithm where, in each iteration, the technical efficiency of a DMU iscomputed relative to all the other DMUs in the set. The efficiency measure is obtained as "themaximum of a ratio of weighted outputs to weighted inputs subject to the condition that the similarratios for every DMU be less than or equal to unity (p.430)".34
According to the Farrell (1957) and Charnes et al. (1978) approach, a facility with an ITEof one reflects the best technical practice within the set studied. It would, of course, be possible tofind facilities outside of the set with even greater technical efficiency. In the case of those facilitiesin the set with ITE<1, DEA unambiguously indicates that they can improve their technicalefficiency by reducing the quantities of one of more inputs while keeping output levels constant.
DEA has several advantages. It permits estimation of technical efficiency in the case ofmultiple output health facilities. Because of that, the analyst can control for case mix by specifyingin the output vector detailed information about the types and complexity of cases treated. DEArequires no assumptions about the technology of production or about whether the providers seek tomaximize profits (or minimize costs).

Variations in input prices across providers would also preclude conclusions about relative economic efficiency based on35
technical efficiency measures.
42BITRAN HFS APPLIED RESEARCH
It is important to understand, however, that no firm conclusions can be inferred about theeconomic efficiency of the facilities based on their DEA-computed index of technical efficiency,especially if their choice of production inputs places them far apart along the production possibilitiesfrontier. This has been illustrated in Exhibit 7 of Section 3. There, providers 2 and 3 have equal35
technical efficiency which is higher than provider 1's. Because production input X is sufficientlya
inexpensive relative to X , however, provider 2—and provider 1—are economically more efficientb
than 3. DEA would assign 2 and 3 equal technical efficiency and would rate 1 as inferior.Economically, however, 1 would be superior to 3 (but not to 2).
Sherman (1984) introduces DEA analysis to the estimation of hospital technical efficiency.He uses a sample of six Massachusetts teaching hospitals and defines their outputs and inputs forthe medical-surgical area through discussions with a panel of experts. Using DEA, two out of thesix hospitals are found to have relative technical efficiency ratings of less than one. Shermancompares these results with the ranking used by the Massachusetts Rate Setting Commission tomeasure hospital efficiency. He demonstrates (not surprisingly) that the Commission's ratios(average cost per patient and per patient day) fail to distinguish technical inefficiencies. Becausehis analysis is limited to the estimation of technical efficiency, Sherman is unable to judge thevalidity of the Commission's ratios from an economic efficiency standpoint.
Sherman uses his results to urge the managers of the relatively inefficient facilities toexamine their efficiency. Moreover, the results can be used to tell the managers which facilities'input proportions they ought to copy. He also uses the findings to re-examine technical efficiencyfollowing actual or potential management measures. He thus illustrates how DEA can be used tosimulate the technical efficiency implications of various management practices such as reducing thenumber of beds, or purchasing fewer selected supplies. However, because DEA does not take factorprice information into account, recommendations aimed at improving technical efficiency (factorsubstitution) might in fact result in reduced economic efficiency.
Register and Bruning (1987) use the Farrell technique and DEA to compare technicalefficiency between for-profit and non-profit U.S. hospitals, using data from a 1984 AmericanHospital Association Survey. The authors explain the maximization problem as follows:
...given all the hospitals included in the sample, and considering the amount of eachinput employed by each hospital producing one unit of output, what is the maximumoutput that can be produced? In short, can the system of hospital care production beimproved by reallocating productive inputs from a given hospital to other hospitals?If so, the hospital under consideration is inefficient relative to others in the sample.[p. 907]
From the total sample, the authors extract a subset of 457 hospitals (300 are non-profit)which they consider to be relatively homogeneous in terms of case mix. They proceed in two steps:

43BITRAN HFS APPLIED RESEARCH
first, they compute an index of technical efficiency (ITE) for each of the 457 hospitals of theirsample. Second, to attempt to explain technical efficiency, they use ordinary least squares (OLS)to regress the dependent variable of ITE against a series of independent variables believed to affecttechnical efficiency. These variables include a dummy variable for hospital ownership; a measureof market concentration; hospital size, as measured by the number of beds; and interaction termsbetween these variables.
The innovative feature of the Register and Bruning study is that it not only computestechnical efficiency but it also attempts to find the determinants of technical efficiency. Oneproblem with this study, however, is that, like other studies of technical efficiency, it does not useany information about input prices and thus provides few clues about the providers' relativeeconomic efficiency. Another shortcoming of the study (and the method) is that it uses a singlemeasure of output, the number of bed days. Even if attempts are made to limit the sample to arelatively homogeneous set of facilities, the use of a single output measure may be a seriouslimitation to study efficiency of multi-product firms, such as hospitals, with a very heterogeneousset of outputs.
Valdmanis (1990) also uses DEA to measure technical efficiency of hospitals in relationshipto ownership, using a sample of Michigan State hospitals in Standard Metropolitan Statistical Areas.This sample came from the 1982 American Hospital Association Survey of Hospitals. In contrastwith Register and Bruning (1987), and like Sherman (1984), she uses a multiple-output, multiple-input version of DEA. Technical efficiency indices are computed for public and non-profit hospitalsseparately. She then uses a non-parametric test (Mann-Whitney) to assess the statistical significanceof the differences between the efficiency indices obtained for the two hospital groups. Valdmanisalso studies the relationship between the technical efficiency indices and the cost per adjusted patientday for the two groups. She finds a statistically significant, negative relationship between technicalefficiency and cost per patient day.
Byrnes and Valdmanis (1989) use DEA to study technical efficiency for a group of 123non-profit, non-teaching, California community hospitals. They also use linear programming andinformation about input prices and technology to compute economic efficiency for individualhospitals in the sample. Their measures of output include acute medical surgical discharges, surgicalintensive care unit discharges, and maternity discharges. The authors distinguish between fixed andvariable production inputs. Their analysis thus presupposes the presence of short-run inputconstraints which preclude the achievement of long-run minimum cost in these facilities. Thevariable inputs they consider include: registered nurse hours; management and administrativepersonnel hours; technical services personnel hours; aide and orderly hours; and licensed practicalnurse hours. The fixed inputs chosen are the number of staff physicians and physicians withadmitting privileges and the average staffed beds.
In order to compute overall economic efficiency for the sample, the authors first solve thelinear programming problem of minimizing total variable costs given input prices and variousconstraints. Second, using the computed minimum cost, they obtain the overall economic efficiencyindex (OE) by dividing observed variable cost by minimum estimated variable cost. Next, they

44BITRAN HFS APPLIED RESEARCH
compute technical efficiency (TE) with the DEA technique. Finally, they derive an allocativeefficiency (AE) index by dividing OE by TE.
In sum, DEA is a useful, and rather innovative method for estimating relative technicalefficiency of a group of medical providers. It is designed for processes with multiple outputs andinputs and permits a detailed specification of the case mix. It can also be used as a managementtool to simulate technical efficiency implications of alternative management practices.
4.7 CONCLUSIONS
The review of the industrialized-country studies of health services efficiency has emphasizedthe study of hospitals. That is not surprising, considering that hospitals account for the lion's shareof health expenditures in developed countries. Because the same is true in developing nations, theabove literature review remains highly relevant for our purposes.
Similarly, a great deal of the developed-country literature, particularly in the U.S., has dealtwith the comparative study of hospital efficiency between non-profit and for-profit facilities, orbetween government and private institutions. This focus is indeed relevant in the developing-country context and fits well within the aims of this review, i.e., to identify and use new methodsto assess efficiency of government and private providers of care.
There are limitations, however, to the benefits that the developing-country research on thistopic can draw from the research done in the industrialized world. In particular, many of the studiesand techniques reviewed rely heavily on large and detailed data sources. For example, severalstudies done in the U.S. have benefitted from the presence of large, existing data sets collectedroutinely by various hospital and medical associations. Despite the presence of these data bases,however, several developed-country researchers still find themselves constrained by data limitations(e.g., Grannemann et al., (1986) could not obtain accurate data on input prices).
Poor data availability in developing countries is likely to increase the cost, while limitingthe sophistication and predictive power of the studies that can be conducted there. Althoughutilization statistics can often be obtained at the central or facility level, information on input pricesand, more generally, costs, is seldom available in routinely kept records. This implies that studiesof health facility efficiency in developing countries will generally have an important data collectioncomponent, a factor that will heavily increase the overall costs of research. Further, becausegovernment facilities are generally subsidized from the central level, data collection efforts oftenhave to combine facility data with information obtained from the central level.
The methodological problems described in this section—qualitative, case mix, and inputprice variations among providers—are certainly present in the developing country context. Thelessons learned from the above review are certainly applicable to the case of poorer nations. By thesame token, the techniques used in developed countries, with the caveat of data availabilitymentioned above, can also be used in developing countries.

45BITRAN HFS APPLIED RESEARCH
The following section presents a review of studies of health facility efficiency in developingcountries.

LOS ' D%T%R
According to this reasoning, one should also expect to see that T is affected by the financing modality, given the36
behavioral incentives to providers and clients associated with various forms of payment.
46BITRAN HFS APPLIED RESEARCH
5.0 REVIEW OF SELECTED STUDIES ON HEALTH SERVICES EFFICIENCY FROMTHE DEVELOPING WORLD
This section presents a review of selected studies of health provider efficiency in thedeveloping world. The studies reviewed here are Rodríguez and Jiménez (1985), Anderson (1980),Dor (1987), Bitran and Dunlop (1989), Wouters (1990), Lewis et al. (1990), and Shepard et al.(1991). Barnum and Kutzin (1990) provide an excellent review of some of these and other studies,including Barnum (1990 and 1991). The section concludes with a summary of the review, fromwhich conclusions are drawn for the phases two and three work.
5.1 LITERATURE REVIEW
Rodríguez and Jiménez (1985) conducted a comparative study of productivity betweenprivate and decentralized public Chilean hospitals. Their measure of productivity was the inverseof the average length of stay (LOS), shorter LOS being associated with higher productivity. Theauthors broke LOS into three components, according to the stages patients follow in a hospital:diagnosis (D), medical treatment (T), and recovery (R), such that
They posited that while T must be done within the hospital, D and R can partially be accomplishedon an outpatient basis. For a given patient case mix, Rodríguez and Jiménez hypothesized that aseries of individual specific variables, such as age and income, can influence D and R. Theyassumed that a patient's income is a close proxy for the type of health insurance or coverage he orshe has. Thus income was assumed to be closely correlated with the out-of-pocket price of theservices and therefore to influence D and R. Illness severity and the types and amounts of medical36
inputs provided to the patients were also assumed to influence D, T, and R.
Using a total sample of five hospitals (three private and two public) and 369 patients, theauthors used ordinary least squares (OLS) to regress length of stay on patient age and income,medical inputs (use of pharmacy and laboratory exams), and facility-specific dummy variables.Three separate equations were estimated for obstetrics and gynecology, surgery, and internalmedicine.
The authors found that, other things in their model being equal, private hospitals had lowerLOS and thus were more productive than public institutions. They cautioned, however, that theiranalysis was weakened (rather severely, most likely) by their inability to obtain accurate informationabout diagnosis, case mix, and severity of the health problem.

lnACPD ' lna0%a1@lnSCALE%a2@lnOCR%a3@lnALS%a4@lnTOPPD%a5lnSAT%a6@PHD%u
ACk ' b0%b1@Fk%b2@(Fk)2%C )
@Zk%<k
Used beds is a measure of output, not capacity.37
The average cost function estimated was38
where the variables are as defined in the text and u is a random error term.
This recommendation takes no account of location of demand, however.39
Dor estimated quadratic average cost functions of the following form:40
where F denotes patient flow (after Feldstein, 1967), Z is a vector of case mix and technology variables, b -b are coefficients,0 2
C is a vector of coefficients, < is a random error term, and k is an index denoting the cost category (k = all cost categories;labor only; goods only; and services only).
47BITRAN HFS APPLIED RESEARCH
Anderson (1980) conducted a statistical study of hospital costs using a sample of 51 Kenyanhospitals with data from the years 1975-76. Using OLS, he estimated an average cost functionwhere the dependent variable was average cost per patient day (ACPD) and the explanatoryvariables were the capacity (SCALE) (as measured alternatively by available and used beds) ; the37
occupancy rate (OCR); the average length of stay (ALS); the number of outpatient visits perinpatient day (TOPPD); the number of satellite ambulatory facilities operating under the hospital(SAT); and the nature of the hospital (PHD) (provincial or non-provincial). 38
Anderson estimated four alternative specifications of the model, using alternative dependentand independent variables. He found that the hospitals were operating with increasing returns toscale, as evidenced by negative (decreasing average cost) and statistically significant coefficientsassociated with the scale variables. He also found that higher occupancy levels resulted in loweraverage costs, concluding that greater demand should be accommodated within existing hospitalsrather than through new ones. Outpatient activity was found to increase average cost, as expected.39
In contrast, length of stay did not come out statistically significant. Because the costs of a hospitaland its satellite facilities were intertwined, the average cost used as a dependent variable includedalso the cost of the satellite facilities. The regression results showed that a greater level of satelliteactivity had a positive impact on aggregate average cost. Finally, provincial hospitals were foundto have higher average costs than district and sub-district facilities.
Some rather dramatic limitations of the analysis, as pointed out by the author, included theinability to control for differences in quality of care, case mix, and input prices. Some or all of theseshortcomings, however, also arise in the other studies described below.
Dor (1987) estimated average cost functions for a sample of 19 Ministry of Health (MOH)and Social Security (IPSS) urban hospitals in Peru. A key explanatory variable was patient flow(F), which is equal to the ratio between the number of hospital admissions (ADMISS) and thenumber of beds (BEDS). Other dependent variables included case-mix variables (share ofadmissions that were deliveries; share of admissions that were surgery), an affiliation dummy (IPSSor MOH), and the volume of outpatient visits. 40

lnC ' m0%m1@BEDS%ji
(ai@lnPi)%f(Y)%,
f(Y) ' b11@IP%b12@OP%b13@DELIV%b14@XRAY%b15@SURG%b16@LAB%c11@IP2%c12@OP2
%d11@IP@OP
This is done by differentiating the AC equation with respect to F and equating it to zero, which yields F = -b /(2.b ).41 *1 2
The exact functional form used by Bitran and Dunlop was42
where C is total annual cost, BEDS is the total number of beds in the facility, P is the price of the i production input, lnith
denotes natural logarithm, f(Y) is a function of various hospital products and outputs, and , is a random error. In the absenceof input prices, two alternative variables, that can be viewed as input price proxies, were used: P = (number of1
physicians)/(total personnel) and P = distance (in miles) between the hospital and the country's capital of Addis Ababa. P2 1
captures possible differences in the average price of labor (those facilities with a higher percentage of physicians to totallabor should have higher average wages); P was intended to capture differences in input prices arising from differential2
transportation costs from the main distribution points in the capital city. The precise form of f(Y) was
where IP is number of inpatient admissions, OP is number of outpatient visits, DELIV is number of deliveries, XRAY is number of X-rays performed, SURG is number of surgical interventions performed, and LAB is number of laboratory tests done.
48BITRAN HFS APPLIED RESEARCH
Based on his average cost equation, Dor calculated an analytical expression for the optimalpatient flow, i.e., the flow at which hospital average cost is minimum. Using OLS and weighted41
least squares (WLS), he estimated separate average cost functions for all cost categories combinedas well as for each of his three cost categories separately (the categories were labor, goods, andservices). He found that hospital average cost decreased with service intensity (although at adecreasing rate). This means that average cost of hospitalizations went down if the number ofhospitalizations increased, or the number of beds decreased, or both. He computed an optimal flowvalue of 4.2 (admissions per bed per month) that was above the sample mean but below the actualflow of several hospitals in the sample. He thus concluded that the average cost curve was U-shaped. He also found that the aggregate number of hospital beds of both institutions should bereduced to move toward a minimum average cost point. Finally, he observed that, other thingsbeing equal, IPSS hospitals exhibited higher average costs than MOH institutions.
Bitran and Dunlop (1989) studied the determinants of hospital costs using a sample of 15government hospitals in Ethiopia, with one to three annual observations for each, for a total of 38observations. The study involved estimating a total cost function using OLS with a functional formsimilar to that introduced by Grannemann et al (1986) (see Section 4). Marginal costs of inpatient42
and outpatient care, average incremental cost, product-specific economies of scale, and economiesof scope measures were analytically derived and evaluated from the estimated cost function.
The authors found that the hospitals in the sample were operating under constant returns toscale for patient days, laboratory exams, and deliveries. Economies of scope were found betweenfirst outpatient visits and inpatient days, signaling an economic advantage to the joint productionof inpatient and outpatient care. The number of hospital beds affected total hospital costs in astatistically significant and economically important way. Input price proxy variables performedpoorly in the regressions.

lnV ' a0%a1@(IN 7&1)
7%a2@lnDRGNUM86%a3@lnHHW%a4@lnLHW
%a5@BEDSDUMMY%a6@[(BEDS7&1)
7@BEDSDUMMY]
The production function was a generalized translog Cobb-Douglas bi-product function, as follows43
where ln denotes natural logarithm and lambda (7) is a parameter of the Box Cox metric. This generalized formulation allows forzero inpatient and bed levels.
49BITRAN HFS APPLIED RESEARCH
A limitation of this type of analysis is that cost minimization cannot be assumed a priori.The estimated coefficients may be biased estimators of the minimum cost coefficients. As aconsequence, the associated measures about technology (e.g., economies of scale and scope),derived from the estimated cost function, may also be biased (see discussion on this point underEakin and Kniesner (1988) in Section 4.5). Another limitation of the work of these authors is thatthey used as an independent variable hospital expenditures, as reported by the Ethiopiangovernment. This figure probably underestimated the actual resources used in production, becauseit did not include possible donor gifts and the depreciation of capital. An additional possiblelimitation is that reported expenditures may depart from the actual social cost of the resources usedin hospital operations (see discussion of this point in Section 4). Finally, the sample of hospitalsused by Bitran and Dunlop was bi-modal with respect to hospital size. Estimation of cost from thepooled sample of small and large hospitals could be a shortcoming if the true cost relations differedbetween the different size facilities. Unfortunately, the small number of observations precludedseparate estimation of cost functions for small and large hospitals.
Wouters (1990) studied the costs and efficiency of a sample of 42 private and public healthfacilities in Ogun State, Nigeria. The sample included a heterogeneous range of facilities, includingcomprehensive health centers, primary health care clinics, maternities, health clinics, anddispensaries. Wouters analyzed costs and efficiency, estimating a production and a cost function,and deriving associated measures of efficiency.
Technical efficiency was assessed by estimating a production function and deriving measuresof the marginal product of health workers. The (rather peculiar) production function expressed thenumber of outpatient visits (V) as a function of the number of inpatient admissions (IN), the numberof patients receiving drugs (DRGNUM86), the proportion of high- and low-level health workers(HHW and LHW, respectively), and the presence and number of beds (BEDSDUMMY and BEDS,respectively). To assess whether cost minimization was taking place, estimates of the relative43
marginal product of high- and low-level health workers were compared with the relative price ofeach category of labor, in both public and private facilities. She found that public facilitiesemployed too many low-level health workers. In contrast, private providers were found to be usinga near optimal (i.e., cost minimizing) mix of high- and low-level health workers.
The cost function estimated by Wouters included as independent variables the volume ofoutpatient visits and inpatient admissions, the proportion of patients obtaining drugs, the wages of

lnRcost' b0%b1@lnV%b2@(IN 7&1)
7%b3@lnDRGPCT86%b4@ln Index
%b5@lnWagHHW%b6@lnWagLHW%b7@BEDSDUMMY%b8@[(BEDS7&1)
7@BEDSDUMMY]
Index ' |
MPLHW
MPHHW
WAGELHW
WAGEHHW9
&1|
The cost function was a generalized Cob-Douglas bi-product function:44
where Rcost is recurrent expenditures of the facility, the other variables are as defined in the preceding footnote, and Index isthe efficiency index as proposed by Goldman and Grossman (1983):
where MP denotes marginal product of health worker labor and |.| denotes absolute value.
The sample consisted of all emergency patients during a one-week period; a sample of people consulting on an ambulatory45
basis during that week; and inpatients admitted to five (three surgical, two ophthalmology) of the hospital's 18 wards during atwo-week reference period. The exercise also included 23 surgical interventions consisting of wounds, appendicitis, cataract,hysterectomy, and hernia.
50BITRAN HFS APPLIED RESEARCH
both kinds of health workers, the availability and number of beds, and an efficiency index. She44
found that the efficiency variable was insignificant and thus concluded that departures from costminimization had little effect on expenditures. She also found that marginal costs were less thanaverage costs and thus concluded that the facilities in her sample exhibited increasing returns toscale for both admissions and outpatient visits. With regard to economies of scope, she concludedthat there were no apparent advantages to the joint production of inpatient and outpatient care.
Lewis et al. (1990) conducted a study of costs, efficiency, and quality of care at AybaraHospital, a 271-bed government-run facility in the Dominican Republic. To compute costs, theauthors tracked a selected sample of patients as they moved through the hospital, recording andpricing the services provided to them. Where possible, non-labor prices were obtained directly45
from the supplier. Labor costs were computed by measuring actual staff time devoted to medicalprocedures and multiplying it by the worker's actual wage (converted to an hourly basis). The totalcost of a procedure was computed as the sum of the variable (or direct) and allocated fixed costs.Variable costs were broken into labor, drugs, ancillary services, and consumables. Fixed costsincluded allocated overhead and the depreciation of buildings, equipment, and other fixed assets.Quality of care was measured in two ways: by assessing the appropriateness of the qualificationsof the medical staff involved in care and by comparing actual diagnostic and treatment practices andservices delivered with medical norms of care.
By extrapolating labor use from the sample to all services and patients in the hospital, Lewiset al. concluded that only 12% of the medical labor contracted by the hospital could actually beaccounted for. Although no allowances were made for down time by the medical staff, this strikingresult signals a major inefficiency in the operations of Aybara Hospital. With regard to quality ofcare, major departures were found between the expected cost of meeting diagnostic and treatment

51BITRAN HFS APPLIED RESEARCH
norms and the cost of diagnostic and treatment services actually provided; the drugs dispensed andthe tests done represented about 10 percent of the costs implied by the norms.
The study by Lewis et al. is one of the few that carefully examines resource use and technicalquality of care in a developing-country hospital. The information the study provides is useful forhospital staff as well as government decision makers. A drawback of the study, however, is itselevated cost, arising from the need to price, and monitor carefully, through time and motionstudies, resource use. To retain the method's advantages yet limit its cost, it has to be applied to anarrow set of interventions, and for a small, but statistically significant sample of patients, as wasdone by Lewis et al. and Pineault et al. (1985) (see Section 4).
Shepard et al. (1991) conducted a cost-effectiveness study of surgery in intermediate healthunits (IHUs) in Cali, Colombia. In an effort to reduce the high costs of hospital care, IHUs werecreated as intermediary settings between primary care facilities and hospitals. Two facilities werechosen for the comparative study: a 20-bed IHU, which performed about 1,100 operations of alltypes in 1988, and a 127-bed secondary hospital, which performed 3,500. Inguinal herniorrhaphywas selected as the intervention on which to base the study because of its high frequency, itsmoderate degree of technical complexity, and the existence of standardized indices of surgical riskin both facilities.
The measures of effectiveness included complication rates, patient satisfaction, and durationof post-operative disability. Complication rates were assessed through the eighth post-operative dayby analyzing medical records by trained health professionals. Patient satisfaction was measuredthrough two surveys which assessed the patient's period of convalescence. The first survey tookplace one week after the intervention, when the patient returned for his or her surgical follow-upvisit (if the patient did not return, attempts were made to contact him or her at home). The secondpatient survey took place in his or her home four to seven months after the surgery.
Costs of care were measured from the patient's admission through the eighth post-operativeday, thus excluding the costs of diagnostics tests prior to admission. Both direct and indirect costsof care were accounted for. Direct costs consisted of medical supplies, general supplies, personnel,and depreciation of medical equipment. The latter three direct costs were allocated to a singlehernia repair based on the ratio of the intervention's time to the total time of use of the operatingroom in one year.
The study found that the rates of surgical and anesthesia complications were higher in thehospital (three complications) than in the IHU (none); patient satisfaction was higher in the IHU,as measured by the promptness with which patients were able to return to work after surgery. IHUswere found to use a mix of personnel that was less intensive in high cost professionals. The averagecost of herniorrhaphy was $39.12 at the IHU and $148.76 at the hospital. Average out-of-pocketprices to patients were $16.53 at the IHU versus $38.96 at the hospital. When patient drugexpenditures were added, average patient payments represented 30 and 48 percent of costs in theIHU and the hospital, respectively. The authors also found that economic efficiency could beimproved in both settings with increased utilization, revealing under-utilization of fixed resources

For a review of studies of hospital costs in developing countries see Barnum and Kutzin (1990).46
52BITRAN HFS APPLIED RESEARCH
at current demand levels. This finding has policy relevance only if there is unsatisfied demand, thatis, if there are hernia patients who need surgery but do not get it.
5.2 SUMMARY AND CONCLUSIONS
Despite a large and growing body of literature on the measurement of health facility costsin developing countries, the literature on the measurement of efficiency is scant. While datalimitations are undoubtedly the basis for the lack of research in this area, the limited volume of workmay be explained largely by the fact that measuring efficiency is intrinsically much harder thanmeasuring costs.46
Of the seven studies reviewed, only one (Wouters, 1990) used data that were not fromhospitals. In addition, all seven studies included government facilities in their sample, while onlyone of them (Wouters, 1990) included both private and public providers.
The emphasis on hospital efficiency research in developing countries coincides with that inthe developed world, because hospitals account for the largest share of health care costs. Theemphasis on government hospital efficiency, on the other hand, can be explained because either orboth:
(1) Governments tend to keep information on utilization and costs—however inaccurate—in a uniform way, whereas private providers generally do not; or(2) The search for health care financing and delivery reform has focused on gauging andimproving productive efficiency of the public sector.
The lack of comparative studies of productive efficiency between government and privateproviders is surprising, in light of the growing—yet empirically unsupported—pressures on the partof experts and donors to promote public divestment of curative care production in favor of agrowing private participation. The reasons that lead private providers to behave more efficientlythan government institutions in other fields (e.g., agriculture) are likely to prevail in the healthsector. Yet, the existing body of research appears to be too weak to support empirically the reformsso strongly promoted.
The following section proposes three studies of health provider efficiency in developingcountries. These studies seek to:
(1) Test existing techniques for the measurement of efficiency in the developing-countrysetting; and(2) Gain further empirical information about the levels and differences in efficiency betweengovernment and private providers.

53BITRAN HFS APPLIED RESEARCH
The two objectives will be pursued in a balanced way in the hospital sector as well as in the case ofambulatory facilities.

54BITRAN HFS APPLIED RESEARCH
6.0 PRELIMINARY RESEARCH DESIGN FOR PHASE TWO FIELD WORK
This paper has described techniques for the measurement of technical and economicefficiency, methodological problems associated with these measurements, and possible solutions.It has also provided a selective review of efficiency studies done in developed and developingcountries.
This final section presents the research design for three studies on efficiency measurement.The first two studies are proposed in the context of a comparative study of hospital efficiency inEcuador. The third study seeks to measure efficiency in a sample of public and private health carefacilities in Senegal. The research design of these studies is described next.
6.1 A COMPARATIVE STUDY OF EFF ICIENCY IN GOVERNMENT AND PRIVATEINPATIENT FACILITIES IN ECUADOR
USAID/Quito has recently asked HFS to submit a research proposal to assess the efficiencyof five different types of inpatient providers in Ecuador. They are the Ministry of Public Health,the Junta de Beneficencia, the Social Security Administration, the private sector, and the military.The study sample would consist of five hospitals, one of each type.
This section proposes two existing methods to assess hospital efficiency:
(1) The use of Data Envelopment Analysis (DEA) to measure overall hospital technicalefficiency, as was done by Sherman (1981) for a group of six Massachusetts hospitals (seeSection 4.6); and(2) The assessment of efficiency for a small sample of interventions, controlling for qualityof care, as done by Pineault et al. (1985).
Separate research designs for these two methods follow. While there would be some economies ifboth studies were performed simultaneously, particularly at the data collection stage, the studies areproposed as two discrete activities. They can easily be combined as a single activity, however, ifso desired by USAID/Quito.
6.1.1 Assessment of Overall Hospital Technical Efficiency Using the DEA Technique
6.1.1.1 Study Goals and Objectives
The goals of this study are to:
(a) Measure overall technical efficiency in sample hospitals and(b) Make recommendations for improving health system efficiency.

55BITRAN HFS APPLIED RESEARCH
The objectives of the study are to:
(a) Compare technical efficiency among hospitals;(b) Make policy, technical, and managerial recommendations to improve efficiency in allfive facilities; and(c) Demonstrate the use in the developing-country setting of existing methods for measuringoverall technical efficiency.
6.1.1.2. Method and Workplan
The first study task will be to hold a technical and planning meeting in the U.S. with theparticipation of a consultant familiar with the use of the DEA technique to measure hospitalefficiency. The DEA method requires information about hospital outputs and production inputs (seeSection 4.6). Therefore, the next step will be to assemble a panel of hospital experts and managersfrom the five study facilities to define all relevant hospital outputs and inputs. At this meeting thenotion of hospital technical efficiency will be discussed and the basic principles behind the DEAtechnique explained. The policy relevance of the study will be established. Data collectioninstruments will then be developed and tested. These instruments will be used to gather detailedinformation about output and input levels.
A data collection team will be assembled and trained both to gather data and to put them inthe form required by the DEA linear programming algorithm. The DEA technique will then be usedto compute a hospital-specific index of technical efficiency (ITE). The most technically efficienthospital(s) in the sample will be assigned an ITE of 1.0 while the others will obtain indices between0 and 1. For the relatively inefficient hospitals, various simulations will be made through DEA toexplore how alternative management measures would affect technical efficiency in those facilities.Measures that improve technical efficiency will be those that increase the facility's ITE.
A policy-oriented report will be written and circulated among managers and clinicians fromthe five study facilities. A two-day workshop will then be held in Quito to discuss the study resultsand recommendations. The outcomes of this workshop will be incorporated in the final report.
Exhibit 12 presents a tentative Gantt chart for the study. It is anticipated that the studywould take place over a period of 29 weeks, or about 7 months.

Y- _, 7
Study of Hospital Efficiency in Ecuador Using DEA Technique Gantt Chart
ECUADOR (A) LOE DISTRIBUTION
WEEK 1 2 3 4 5 STAFF AND LOE BY PHASE
6 8 LOE ’
7 9 10 11 12 13 I I I I
lnltlal Meetlnge with DEA Con~uIIanl to Fine Tune Mathodolq y. HFS-AR DIRECTOR 2 HFS-DEA CONSULTANT 2 HFS-TASK MANAQER 1 HFS-ANALYST 2 R
Assemble Panel 01 Hospital Experts lncludlng Cllnlclans and M snagers.
LOCAL-STUDY MANAGEWECONOMIST 6
Maal rlth Panel and ldenllfy Hapllal lnpulr and Outputs lhal a,. relw.an~ lor TechnIcal Elllclency Evaluallon (Verify lhal all data a,. aval Iable).
HFS-AR DIRECTOR 3 HFS-TASK MANAGER 3 LOCAL-STUDY UANAQEWECONOMIST 3 CLINICAL EXPERTS (6) 24
Develop Data Collec~lon In6lrumenls
HFS-AR DIRECTOR HFS-DEA CONSULTANT HFS-TASK MANAGER LOCAL-STUDY MANAQEWECONOMIST CLINICAL EXPERTS (6)
3
10 10
6
Hire and Train Data CollectIon Tepm
HFS-TASK MANAGER 6 LOCAL-STUDY YANAQEWECONOYIST 6 CLINICAL EXPERTS (6) 16
Field To61 Survey lnelrumenls
HFS-TASK MANAGER 6 LOCAL-STUDY MANAQEWECONOMIST 6
CLINICAL EXPERTS (8) 16
Data Collecllon
HFS-TASK MANAGER 6 LOCAL-STUDY MANAQEWECONOMIST 26 DATA COLLECTION TEAM (3) 76
Data Enlry and Proceealng HFS-TASK MANAGER LOCAL-STUDY MANAQERfECONOMlST DATA COLLECTION TEAM (3)
10 10 30
El

ECUADOR (A)
STAFF AND LOE BY PHASE
HFS-AR DIRECTOR 3 HFS-DEA CONSULTANT 2 HFS-TASK MANAGEA 1 HFS-ANALYST 25
Report Wrlllnfi. Revler, and Revl~lons.
HFS-AR DIRECTOR 6 HFS-TASK YANAQER 1 HFS-ANALYST 25
Dlseemlnstlon lncludlng Workshop
HFS-AA DIRECTOR HFS-TECH DIRECTOR HFS-TASK MANAGER HFS-ANALYST LOCAL-STUDY MANAQEWECONOMIST CLINICAL EXPERTS (8) TRANSLATOR
1 1 5 6 5
18 15
WEEK 14 15 16 17 18 ’ 19 20 21 22 23 24 25 26 27 28
LOE
I I 29 I I I I I I I I I I I I I I
0
b I 1nrl 0
Cl II Cl IL II nlzzln 0
390

58BITRAN HFS APPLIED RESEARCH
6.1.1.3 Level of Effort
The estimated level of effort for the study is summarized in Exhibit 13 The study isexpected to require approximately 390 person-days or about 18 person-months. An estimate of thestudy labor costs is also provided in the exhibit. The study will be managed by an HFS staffmember in conjunction with a local economist. A panel of about eight clinical experts will berecruited as technical advisors. The data collection staff will be either hospital managers oraccountants, or economists familiar with hospital administration. The analysis of the data will bedone by an HFS economist with input from both the HFS task manager and the local task manager.
6.1.2 Assessment of Economic Efficiency for a Selected Sample of Health Interventions
6.1.2.1 Study Goals and Objectives
The goals of this study are to:
(a) Assess and compare economic efficiency for a group of five Ecuadorian hospitals for asample of two frequently performed medical interventions and(b) Recommend measures for improving efficiency.
The objectives of the study are to:
(a) Estimate the costs to the hospital of performing these interventions as well as the coststo the patients of undergoing care;(b) Assess clinical outcomes and patient satisfaction with the services;(c) Compare the above measures among hospitals;(d) Make policy, technical, and managerial recommendations to improve efficiency in allfive facilities; and(e) Develop and use a methodology for measuring technical and economic efficiency indeveloping-country hospitals.

Study of Hospital Effkiency in Ecuador Using DEA Technique Estimated Level of Effort
ECUADOR (A)
HFS-SENIOR STAFF
HFS-AR DIRECTOR
HFS-TECH DIRECTOR
HFS-DEA CONSULTANT
SUBTOTAL
HFS-MIDLEVEL STAFF
HFS-TASK MANAGER
HFS-ANALYST
SUBTOTAL
LOCAL-SENIOR STAFF
LOCAL-STUDY MANAGERIECON
CLINICAL EXPERTS (8)
TRANSLATOR
SUBTOTAL
LOCAL-FIELD AND SUPPORT STAFF
DATA COLLECTTION TEAM (3)
CLERK/SECRETARY
SUBTOTAL
TOTAL
RATE
832
832
832
450
456
150
150
150
30
30
PERSON
DAYS AMOUNT
17 14,144
1 832
5 4,166
23 19.136
46 20,700
57 25,650
103 46.356
68 10,200
76 11,400
15 2,250
159 23,856
105
0
105
3,150
0
3,150
92,486 7 5 33 30 25 25 105 50 31 31 48
PHASE
1 2 3 4 5 6 7 8 9 10 11 -_---------
2 3 3 3 5 1
1
2 1 2
1 3 10 5 5 5 10 1 1 5
2 25 25 5
5 3 10 5 5 25 10 5
24 6 15 15 16
15
75 30

60BITRAN HFS APPLIED RESEARCH
6.1.2.2 Method and Workplan
The study will begin with meetings with hospital medical directors and managers to discussthe study goals and objectives. A committee of clinical experts will be appointed and two relativelyuncomplicated medical interventions that are frequently performed in all facilities will be selected.Examples of such interventions are: normal deliveries, appendectomies, tonsil-lectomies, and herniarepairs. The clinical experts will agree on standards of treatment for the two interventions.
Methods for assessing the interventions' cost to the facilities and patients, patient satisfaction,and clinical outcomes will be developed. Facility treatment costs will be assessed by measuring andcosting out the resources used directly in care as well as by allocating indirect costs to care. Asampling frame will be established to select a subset of patients undergoing each of the twointerventions in all five facilities. Data collection for resource use will be done by tracking downall resources devoted to care, from the time the patient enters the facility to the time he or she isdischarged. Forms and questionnaires will be developed and used for this purpose. Input prices aswell as indirect costs will be gathered through facility-specific questionnaires.
Departures from the norms of care will be measured by comparing actual practices withstandards of treatment. Assessment of clinical outcomes will be done by physician consultantsthrough analysis of medical charts, examination of patients, and patient follow-up interviews afterdischarge. Patient satisfaction will be measured through interviews, which will seek informationabout patient perception of quality and attitude of staff, cleanliness of the premises, waiting time,post-operative discomfort, post-operative follow-up visits, and overall recovery.
Economic efficiency will be assessed by combining overall treatment costs with informationabout patient quality perceptions, compliance with norms of care, and clinical outcome. The studyfindings will be included in a report to be shared with hospital managers and medical staff, as wellas with USAID/Quito. A one-day workshop with the above participants will be conducted in Quitoto discuss the study findings and recommendations. Advice will include possible managementmeasures for improving efficiency. The outcome of the discussions at the workshop will beincorporated into the final report.
The study is expected to take place over a period of 38 weeks or approximately nine months,as is shown in the Gantt chart of Exhibit 14.

Study of Hospital Efficiency in Ecuador for Selected Sample of Interventions Gantt Chart
ECUADOR (9) Assessment of Economic Ellic iowy for a Selected Sample of Health lnterventlons
LOE DISTRIBUTION
STAFF AND LOE BY PHASE
WEEK 1, 23456 789 10 11 12 13 14 15 19 20 21
LOE ’ I I I I I I I I I I I I I I I 1 1 1
Meet with Hcnpital DirectorsIManager~ to Dlacuna Qoals. ObJe ctlves. a”d Methods.
HFS-AR DIRECTOR 6
Chow. a Set 01 Intefventlon~ (2 or 3) I” Meetinga with Medical Dlrectorr ot Hospital and ClinIcal Experts.
HFS-TASK MANAQER 6 LOCAL-STUDY MANAGER 6 LOCAL-ECONOMIST 6 HOSPITAL COUNTERPARTS 6 CLINKXL EXPERTS 16 CLEFWSECRETARY 6
Dellno Standard@ of Treatment for the Study.
HFS-TASK MANAGER 6 LOCAL-STUDY MANAGER 6 LOCAL-ECONOMIST 6 HOSPilAL COUNTERPAATS 6 CLINICAL EXPERTS 16
CLEW/SECRETARY 6
Deslgn Melhodology and Instruments for Gathering Inlormrtlo n on Resource tJ.8 and Compliance rlth
Study-dellned Msdlcal Standards. Pallenl Recovery. Pallent Satkfactlon. and Input Prices and lndlrect Costs.
HFS-TASK MANAGER 16 LOCAL-STUDY MANAGER 16 LOCAL-ECONOMIST 16 HOSPlTAL COUNTERPARTS 6 CLEFWSECRETARY 16
krlp., n, Sw.,pllq Ya1’x.W.w (6) F#tlrnrm tn Selerlr.9 lnla rvbnlhnr
HFS-TASK MANAGER LOCAL-STUDY MANAGER LOCAL-ECONOMIST HOSPtTAL COUNTERPARTS CLINICAL EXPERTS
Salscllon and Tralnlng 01 Enumerators.
LOCAL-STUDY MANAQER 20
LOCAL-ECONOMIST 16
HOSPKAL COUNTERPARTS 6 ENUMERATORS/ANALYSTS 16 CLEW/SECRETARY 16
Tesllng cl Instruments. Enumerators. and Dala Collscllon Met hods, Revlslons.
LOCAL-STUDY MANAQER 6 LOCAL-ECONOMIST 6 HOSPtTAL COUNTERPARTS 6
CLINICAL EXPEATS 16
ENUMERATORS/ANALYSTS 6 CLEFWSECRETARY 5
Data Collectlo”
HFS-TASK MANAQER 10 LOCAL-STUDY MANAGER 10 HOSPITAL COUNTERPARTS 5 ENUMERATORS/ANALYSTS 250
15

ml
ml
ml
mll
ml
E

63BITRAN HFS APPLIED RESEARCH
6.1.2.3 Level of Effort
The study is expected to rely heavily on the use of local consultants, as is shown in Exhibit15. These will include a study manager, an economist, possibly one or more accountants ormanagers, clinical experts, enumerators, data entry staff, and a study clerk. The following tablesummarizes the personnel requirements, including a rough estimate of the study labor costs. Thestudy is expected to require about 790 person-days, or 36 person-months, with labor costs ofapproximately $120,000. Personnel rates are estimates and are fully loaded.

Study of Hospital Efficiency in Ecuador for Selected Sample of Interventions Estimated Level of Effort
ECUADOR (B)
HFS-SENIOR STAFF
HFS-AR DIRECTOR
HFS-TECH DIRECTOR
SUBTOTAL
832
832
34 28,288
5 4.160
39 32.446
HFS-MIDLEVEL STAFF
HFS-TASK MANAGER
HFS-ANALYST
SUBTOTAL
450
450
75
150
75
150
150
30
30
30
37 16.650
59 26,550
96 43,200
LOCAL-SENIOR STAFF
LOCAL-STUDY MANAGER
LOCAL-ECONOMIST
HOSPITAL COUNTERPARTS
CLINICAL EXPERTS
TRANSLATOR
SUBTOTAL
77 5,775
72 10,800
45 3,375
71 10,650
15 2,250
280 32.850
LOCAL-FIELD AND SUPPORT STAFF
ENUMERATORS/ANALYSTS
DATA ENTRY STAFF
CLERWSECRETARY
SUBTOTAL
270 8.100
30 BOO
75 2.250
375 11,250
TOTAL 790 119.748
RATE
PERSON
DAYS AMOUNT
PHASE
1 2 3 4 5 6 7 8 Q 10 11 12 13 -------------
5
5
5
5
5
15
5
5 40
5
5
5
5
15
5
40
15 2
15
15
5
15
65 17
20
15
5
15
15
70
10
5 10 15
5
5 5 5
15
5 250
30
5 15 15
40 290 65
15 IO 2 2
2 3
25 20 7 7
25
5
20
16
Q9 30 11 27
-. . .---- -- ------- _--- .I __ _ __ ..__.. _ _ _. __ .._._ _.. ._ _ __.. .___._ ____. _ .._..

The study of health committees has been requested by USAID/Dakar and is part of the purchase order.47
65BITRAN HFS APPLIED RESEARCH
6.2 A COMPARATIVE STUDY OF EFF ICIENCY IN GOVERNMENT AND PRIVATEINPATIENT FACILITIES IN SENEGAL
USAID/Dakar has asked HFS to perform a study of health facility costs and efficiency usinga sample of about 40 Ministry of Health facilities, including three hospitals, 18 health centers, ninematernities, 34 health posts, and 34 health huts. Although USAID is primarily interested in issuespertaining to MOH efficiency, HFS will seek to include in the study a sample of private sectorproviders. The field work will begin in early February 1993, with a visit to Senegal by an HFS staffmember to interview local study counterparts and to plan the study logistics. USAID/Dakar willfund all the study costs associated with the analysis of MOH costs and efficiency and healthcommittee performance. The incremental costs associated with the study of private facility costsand efficiency, as well as a comparison of costs and efficiency between MOH and private providers,will be borne by HFS.
6.2.1. Goals and Objectives
The study goals are to:
(a) Improve knowledge about the levels and determinants of costs and efficiency for asample of government and private health facilities; and(b) Recommend policy measures to improve the overall efficiency of the health system bymaking better use of government and private resources. 47
The study objectives are to:
(a) Use information on government health facility costs to aid in budgeting and strategicfinancial planning;(b) Obtain information on health services utilization in a sample of government facilities;and(c) Recommend measures for improving the efficiency of government facilities.
6.2.2. Method and Workplan
Following an initial visit to Dakar by HFS, the study will begin with the design of thesampling frame to select public and private ambulatory health facilities (see Exhibit 16). Hospitals,of which there are fewer than ten in the country, will be selected in a non-random fashion with theaim of obtaining geographic variation. Selected facilities will then be visited to seek theircollaboration.

Study of Health
SENEGAL LOE DISTRIBUTION
STAFF AND LOE SV PHASE
Startup Trip HFS-AR DIRECTOR
Devdopm~nlol Sampling Methods, Identlfkallon of Sampled Facllllles, and Inlllal Conlacct wllh Facllltles.
HFS-TASK MANAQER MOH-TECH DIRECTOR MOH-TECH SUPERVISOR’HEALTH ECON SECRETARY
HFS-AR DlRECTOR HFS-TASU MANAGER MOH-TECH DlRECTOR MOH-TECH SUPERVISOWHEALTH ECON SOClOLoGlST TRANSLATOR SECRETARY
HFS-TASK MANAGER MOH-TECH DIRECTOR MOH-TECH SUPERVISOFVHEALTH ECON MOWENlJMERATOfUlEAM LEADE TEAM-l MOH-ENUMERATOR TEAM-l MOH-ENUMERATOWTEAM LEADE TEAM-2 MOH-ENUMERATOR TEAM-2 MOH-ENUMERATOFVTEAM LEADE TEAM-3 MOH-ENUMERATOR TEAM-3 SOCIOLOQIST SECRETARY
Data Collacllon 428
HFS-TASK MANAQER MOM-TECH SUPERVISOR’HEALTH ECON SOCIOLOQIST SECRETARY
MOH-ENUMERATOR TEAM - 1 ENUMERATOfWEAM LEADER ENUMERATOR DRIVER
MOH-ENUMERATOR TEAM - 2 ENUMERATOIWEAM LEADER ENUMERATOR DRIVER
MOH-ENUMERATOR TEAM - 3 ENUMERATOWTEAM LEADER ENUMERATOR DRIVER
Data Entry MOH-DATA PROCESSINQ MANAQER MOH-DA1 A PROCESSOR
Facility Costs and Effkiency and Heaith Committee Performance in Senegal Gantt Chart
WEEK 1 2 3 4 5 6 7 8 9 10 11 12 13 14 15 16 17 I I I I I I I I I I I I I I I I I 1
LOE
0
6 16 16 16
4 10
6 6 6 6 6
15 16 15 15 16 16 15 16 16 16 15
10 34 34 34
34 34 34
34 34 34
34 34 34
28 28
I I I
i
I I I I
I I I I I
1
I I I I I I
I I ”
t
I I I I I
I I I 1
I I I 1 .’
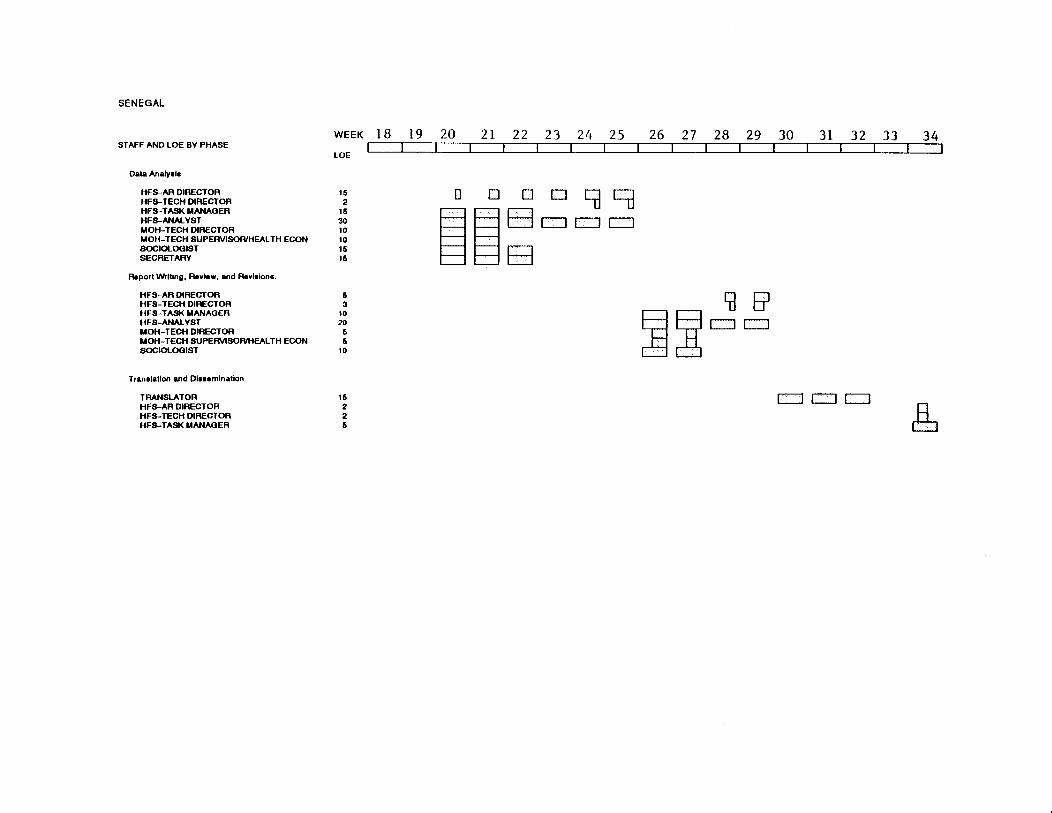
u m n

The purchase order from USAID/Dakar does not include hospitals in the study sample. HFS will recommend that hospitals, both48
private and public, be added. The following Gantt chart and level of effort estimates do not include the activities and resourcesrequired to assess hospital efficiency. If hospitals do become part of the study, the research design will be modified accordingly.
68BITRAN HFS APPLIED RESEARCH
Next, survey instruments will be developed and translated into French. The instruments willconsist of facility questionnaires which will gather data on output levels, input prices, inputquantities, facility costs, staff, and assets. The appropriate period from which facility data will becollected will be established. Enumerators will be hired and trained in data collection. Thequestionnaires, as well as the skills of the enumerators, will be field-tested. Necessary changes inthe survey instruments will be made and additional personnel training will be provided, as needed.The study will then enter the data collection stage, to be performed through three teams ofenumerators. Data entry will start two weeks after the beginning of the data collection phase. Thefacility data will be converted into ASCII files suitable for analysis through standard statisticalpackages such as SAS, SPSS, LIMDEP, and Lotus 1-2-3.
The analysis of health facility costs and efficiency will be done in the U.S. A reportsummarizing the methods, findings, and recommendations will be written in the U.S. and presentedin Dakar.
The study of health committees will be conducted simultaneously with that of health facilitycosts and efficiency, as is shown in the Gantt chart of Exhibit 16. A sampling frame to select healthcommittees will be developed. It is anticipated that a subset of the committees of the facilitiessurveyed will constitute the sample for the qualitative study of health committee performance.
Hospital efficiency will be measured using the DEA method in a fashion similar to thatdescribed for the study of hospital efficiency in Ecuador (see above). Using the same technique48
in both studies will permit a comparison of results and an assessment of the advantages anddisadvantages of this technique in different settings. With regard to ambulatory facilities,econometric estimation of cost and production functions will be performed. Flexible functionalforms for cost and production functions, like those used by Eakin and Kniesner (1988) andGrannemann et al. (1986), will be adopted. The assumption of cost minimization will be tested.
The study will use cost and utilization information to illustrate how facility data can be usedin budgeting. A computer model will be developed to illustrate how various fee levels would affectutilization, revenue, costs, and cost recovery performance, using alternative assumptions aboutdemand response to price. The study is expected to take place over a six-month period.

69BITRAN HFS APPLIED RESEARCH
6.2.3. Level of Effort
The estimated level of effort for this study is 938 person-days, or 43 person-months, asshown in Exhibit 17. Approximately one-half of this effort would be undertaken by HFS staff orHFS U.S. consultants. The study envisions heavy use of in-country personnel for the data collectionand entry phase.

Study of Health Facility Costs and Efficiency and Health Committee Performance in Senegal Estimated Level of Effort
SENEGAL
PERSON
RATE DAYS -- HFS-SENIOR STAFF
HFS-AR DIRECTOR 832 34
HFS-TECH DIRECTOR 832 7
SUBTOTAL 41
HFS-MIDLEVEL STAFF
HFS-TASK MANAGER 450 70
HFS-ANALYST 450 50
SUBTOTAL 128
LOCAL-SENIOR STAFF
MOH-TECH DIRECTOR 75 50
MOH-TECH SUPERVlSOfUHEALTH EC0 150 a4
SOCIOLOGIST 75 79
TRANSLATOR 150 20
SUBTOTAL 233
LOCAL-FIELD AND SUPPORT STAFF
MOH-ENUMERATORS/TEAM LEADER 30 240
MOH-DRIVER 30 147
MOH-DATA ENTRY STAFF 30 56
SECRETARY 30 84
SUBTOTAL 536
AMOUNT
28.288
5,824
34,112
35.100
22,500
57.600
3.750
12,600
5.925
3,000
25.275
7,470
4.410
1.880
2.520
18.080
TOTAL 038 133,087

71BITRAN HFS APPLIED RESEARCH
BIBLIOGRAPHY
ANDERSON, David L. (1980) "A Statistical Cost Function Study of Public General Hospitals inKenya." 14(2): 223-235, 1980.
BARNUM, H., BARLOW, R., FAJARDO, L., PRADILA, A. (1980) "Resource Allocation Modelfor Child Survival", Oelgeschlager, Gunn, Hain: Cambridge, MA.
BARNUM, H. (1990) China Health Sector Study, The World Bank, unpublished.
BARNUM, Howard and Joseph KUTZIN. (1990) "Public Hospitals in Developing Countries:Resource Use, Costs and Financing." Population and Human Resources Department, TheWorld Bank: Washington, D.C.
BERMAN, Peter. (1989) "Cost Efficiency in Primary Health Care: Studies of Health Facilities inIndonesia." Health Policy and Planning, Volume 4, No. 4, pp. 316-322.
BERMAN, P., M. Nadjib BROTOWASISTO, S. SAKAI, and A. GANI. (1989) "The Costs ofPublic Primary Health Care Services in Rural Indonesia." Bulletin of the World HealthOrganization, Volume 67, No. 6, pp. 685-694.
BERMAN, Peter and Suomi SAKAI. (1987) "The Productivity of Manpower and Supplies in PublicHealth Services in Java." The Johns Hopkins University, Department of International Health:Baltimore, MD.
BERWICK, Donald M., M.D. (1989) "Health Services Research and Quality of Care —Assignments for the 1990s." Medical Care, Volume 27, No. 8, pp. 763-771.
BITRAN, Ricardo and David W. DUNLOP. (1989) "The Determinants of Hospital Costs — AnAnalysis of Ethiopia." WPS 249, Policy, Planning and Research Working Papers,Population, Health and Nutrition Department, The World Bank: Washington, D.C.
BITRAN, Ricardo and Steven BLOCK. (1992) "Provider Incentives and Productive Efficiency."Health Financing and Sustainability Project, Abt Associates Inc.: Bethesda, MD.
BITRAN, Ricardo, and Keith McINNES. (1993) "The Demand for Health Care in Latin America:Lessons Drawn from the Dominican Republic and El Salvador." Economic DevelopmentInstitute of the World Bank: Washington, D.C. Forthcoming.
BLADES, C.A., A.J. CULYER and A. WALKER. (1987) "Health Service Efficiency: Appraisingthe Appraisers — A Critical Review of Economic Appraisal in Practice." Social Science andMedicine, Volume 25, No. 5, pp. 461-472.

72BITRAN HFS APPLIED RESEARCH
BLIERSBACH, Christopher M. (1989) "Integrating Quality Assurance and Cost Accounting toFacilitate Management Efficiency." QRB, October, pp. 302-305.
BROOK, Robert H., M.D., ScD. and Kathleen N. LOHR, Ph.D. (1985) "Efficacy, Effectiveness,Variations, and Quality — Boundary-crossing Research." Medical Care, Volume 23, No.5, pp. 710-722.
BROWN, Randall S., Douglas W. CAVES, and Laurits R. CHRISTENSEN. (1979) "Modelling theStructure of Cost and Production for Multiproduct Firms," Southern Economic Journal, Vol.46, July, pp.256-273.
BYRNES, Patricia and Vivian VALDMANIS. (1989) "Variable Cost Frontiers and Efficiency: AnInvestigation of Labor Costs in Hospitals. Lecture Notes in Economics and MathematicalSystems Series. Berlin: Springer-Verlag, 332, pp.89-109.
CAVES, Douglas W. and Laurits R. CHRISTENSEN. (1980) "The Relative Efficiency of Public
and Private Firms in a Competitive Environment: The Case of Canadian Railroads." Journalof Political Economy, Volume 88, No. 5, pp. 958-976.
CAVES, Douglas W., Laurits R. CHRISTENSEN, and Michael W. TRETHEWAY. (1980),"Flexible Cost Functions for Multiproduct Firms." The Review of Economics and Statistics,August, pp.477-481.
CHARNES, A., W.W. COOPER, E. RHODES. (1978), "Measuring the Efficiency of DecisionMaking Units", European Journal of Occupational Research, Vol. 2, pp. 429-444.
COWING, T. G., A. G. HOLTMANN and S. POWERS. (1983) "Hospital Cost Analysis: A Surveyand Evaluation of Recent Studies." Advances in Health Economics and Health ServicesResearch, Vol. 4, pp. 257-303.
COWING, Thomas G. and Alphonse G. HOLTMANN (1983) "The Multiproduct Short-RunHospital Cost Function: Empirical Evidence and Policy Implications from Cross-SectionData." Southern Economic Journal, January, pp. 637-653.
DOR, Avi, Ph.D. and Dean E. FARLEY, Ph.D. (1992) "The Cost and Quality of Hospital Care bySource of Payment: Inferences from a Multiproduct Cost Function." Presented at NationalBureau of Economic Research, Summer Institute.
DOR, Avi, Ph.D., Philip J. HELD, Ph.D., and Mark V. PAULY, Ph.D. (1992) "The Medicare Costof Renal Dialysis: Evidence from a Statistical Cost Function." Medical Care, Vol. 30, No.10, pp. 879-891.
DOR, Avi. (1987) "Estimates of Cost Function for the Peruvian Hospital Sector: Some PolicyImplications." The Urban Institute: Washington, D.C.

73BITRAN HFS APPLIED RESEARCH
EAKIN, B. Kelly. (1991) "Allocative Inefficiency in the Production of Hospital Services." SouthernEconomic Journal, Vol. 58, No. 1, July, pp. 240-248.
EAKIN, B. Kelly and Thomas J. KNIESNER. (1988) "Estimating a Non-minimum Cost Functionfor Hospitals." Southern Economic Journal, January, pp. 583-597.
EVANS, Robert G., Ph.D., and Geoffrey C. ROBINSON, M.D. (1980) "Surgical Day Care:Measurements of the Economic Payoff." Canadian Medical Association Journal, Volume123, pp. 873-880.
FARRELL, M. (1957) "The Measurement of Productive Efficiency." Journal of the RoyalStatistical Association, Series A.
FARRELL, M. and M. FIELDHOUSE. (1962) "Estimating Efficient Production Functions UnderIncreasing Returns to Scale." Journal of the Royal Statistical Association.
FELDSTEIN, M.S. (1974) "Econometric Studies of Health Economics." In M. Intrilligator and D.Kendrick (eds.), Frontiers of Quantitative Economics, Amsterdam: North Holland.
FRANCISCO, E.W. (1970) "Analysis of Cost Variations Among Short Term General Hospitals."In H. Klarman, ed., Empirical Studies in Health Economics, Johns Hopkins University Press,Baltimore, MD.
FRANK, Richard G. and Carl A. TAUBE. (1987), "Technical and Allocative Efficiency inProduction of Outpatient Mental Health Clinic Services." Social Science and Medicine,Volume 24, No. 10, pp. 843-850.
FREDERIKSEN, Kirsten. (1989) "Towards Improved Management of Costs and Revenues as aMeans Towards Self-Sustainability of Health Services in Haiti." Institute for Child Health,Haiti.
FRIEDMAN, Bernard and Mark V. PAULY. (1983) "A New Approach to Hospital Cost Functionsand Some Issues in Revenue Regulation." Health Care Financing Review, Volume 4, No.3, pp. 105-114.
GARNER, Paul, Jane THOMASON and Dayl DONALDSON. (1990) "Quality Assessment ofHealth Facilities in Rural Papua New Guinea." Health Policy and Planning, Volume 5, No.1, pp. 49-59.
GOLD, Marsha, M.C.P, M.P.H. (1979) "Hospital-Based Versus Free-Standing Primary Care Costs."Journal of Ambulatory Care Management, February, pp. 1-20.

74BITRAN HFS APPLIED RESEARCH
GOLDMAN, Fred and Michael GROSSMAN. (1983) "The Production and Cost of AmbulatoryMedical Care in Community Health Centers." Advances in Health Economics and HealthServices Research, Volume 4, pp. 1-56.
GOLDSCHMIDT, Taaqov and Amiram GAFNI. (1990) "A Managerial Approach to AllocatingIndirect Fixed Costs in Health Care Organizations." Health Care Management Review,Volume 15, No. 2, pp. 43-51.
GOLLADAY, Frederick L., Marilyn E. MANSER, and Kenneth R. SMITH (1974) "ScaleEconomies in the Delivery of Medical Care: A Mixed Integer Programming Analysis ofEfficient Manpower Utilization." The Journal of Human Resources, Volume IX, No. 1, pp.50-62.
GRANNEMANN, Thomas W., Randall S. BROWN, and Mark V. PAULY. (1986) "EstimatingHospital Costs — A Multiple-Output Analysis." Journal of Health Economics, Volume 5,pp. 107-127.
GURURAJ, Vymutt J., M.D., Teresita A. LAUDE, M.D., Solomon V. RAJKUMAR, M.D.,Raymond M. RUSSO, M.D. (1982) "Observations of the Efficiency of Pediatric AmbulatoryCare in a Teaching Clinic." The Journal of Ambulatory Care Management, February, pp. 41-46.
HFS PROJECT. HFS Applied Research Agenda. Health Financing and Sustainability Project. AbtAssociates Inc.: Bethesda, MD.
HORNBROOK, Mark C., Ph.D. (1982) "Review Article — Hospital Case Mix: Its Definition,Measurement and Use: Part I. The Conceptual Framework." Medical Care Review, Vol. 39,pp. 1-43.
HORNBROOK, Mark C., Ph.D. (1982) "Review Article — Hospital Case Mix: Its Definition,Measurement and Use: Part II. Review of Alternative Measures," Medical Care Review,Vol. 39, pp. 73-123.
JACOBS, Philip. (1974) "A Survey of Economic Models of Hospitals." Inquiry, Volume XI, pp.83-97.
LASSO, Hipólito Pabón. (1986) "Evaluating Hospital Performance Through SimultaneousApplication of Several Indicators." Pan American Health Organization Bulletin, Volume20, No. 4, pp. 341-357.
LAVE, Judith R. and Lester B. LAVE. (1984) "Hospital Cost Functions." Annual Review of PublicHealth, Volume 5, pp. 193-213.

75BITRAN HFS APPLIED RESEARCH
LEE, A. James, Ph.D., Harry B. WOLFE, Ph.D., and Betty SWENSON, R.N., B.S. (1984)"Hospital-Based Versus Free-Standing Ambulatory Care Costs: A Comparison." Journalof Ambulatory Care Management, February, pp. 25-39.
LEWIS, Maureen A., Margaret B. SULVETTA and Gerard LAFORGIA. (1990) "Economic Costsof Hospital Services in the Dominican Republic." The Urban Institute: Washington, D.C.
LEWIS, Maureen A., Margaret B. SULVETTA and Gerard M. LAFORGIA. (1990) "MeasuringCosts, Efficiency, and Quality in Public Hospitals: A Dominican Case." Internal DiscussionPaper, Report No. IDP-090, The World Bank: Washington, D.C.
McGUIRE, Alistair. (1987) "The Measurement of Hospital Efficiency." Social Science andMedicine, Volume 24, No. 9, pp. 719-724.
NUTTING, Paul A., M.D., Barton R. BURKHALTER, Ph.D., Duane L. DIETRICK, Ph.D., andEdward F. HELMICK, MPH (1982) "Relationship of Size and Payment Mechanism toSystem Performance in 11 Medical Care Systems." Medical Care, Volume XX, No. 7, pp.676-690.
NUTTING, Paul A., M.D., Gregory I. SHORR, M.D., and Barton R. BURKHALTER, Ph.D.(1981) "Assessing the Performance of Medical Care Systems: A Method and ItsApplication." Medical Care, Volume XIX, No. 3, pp. 281-296.
O'DONOVAN, Thomas R., Ph.D. (1979) "Cost of Services in Ambulatory Surgical Facilities." TheJournal of Ambulatory Care Management, November, pp. 23-28.
OVER, Mead, Jr. (1984) "Cost-Effective Integration of Immunization and Basic Health Servicesin Developing Countries: The Problem of Joint Costs." Boston University: Boston,Massachusetts.
OVER, Mead, Jr. (1985) "The Effect of Scale on Cost Projections for a Primary Health CareProgram in a Developing Country." Social Science and Medicine, Volume 22, No. 3, pp.351-360.
PAULY, Mark V. (1970) "Efficiency, Incentives and Reimbursement for Health Care." Inquiry,Volume 7, No. 1, pp. 114-131.
PINEAULT, Raynald, M.D., Ph.D., André-Pierre CONTANDRIOPOULOS, Ph.D., MarieVALOIS, M.Sc., Marie-Lynn BASTIAN, B.A., and Jean-Marie LANCE, M.Sc. (1985)"Randomized Clinical Trial of One-Day Surgery — Patient Satisfaction, Clinical Outcomes,and Costs." Medical Care, Volume 23, No. 2, pp. 171-182.

76BITRAN HFS APPLIED RESEARCH
PRESCOTT, R.J., Constance CUTHBERTSON, Norma FENWICK, W.M. GARRAWAY, and C.V. RUCKLEY. (1978) "Economic Aspects of Day Care After Operations for Hernia orVaricose Veins." Journal of Epidemiology and Community Health, Volume 32, pp. 222-225.
PUGLISI, Robert J., Cindy Lou PARKS, William J. BICKNELL. (1991) "Functional ExpenditureAnalysis for the Lesotho Ministry of Health." Draft, Boston University School of PublicHealth: Boston, MA.
REGISTER, Charles A. and Edward R. BRUNING. (1986) "Profit Incentives and TechnicalEfficiency in the Production of Hospital Care." Southern Economic Journal, Volume 53, pp.899-914.
REINHARDT, U. (1972) "A Production Function for Physician Services." The Review ofEconomics and Statistics, Volume 60, pp. 55-66.
RODRIGUEZ, Jorge and Jorge JIMENEZ. (1985) "Comparative Analysis of Productivity in Publicand Private Chilean Hospitals." Encuentro Anual de Economistas 1985, Departamento deEconomia, Universidad de Santiago de Chile.
ROSENSTEIN, Alan H. (1991) "Health Economics and Resource Management: A Model forHospital Efficiency." Hospital and Health Services Administration, Volume 36, No. 3, pp.313-330.
ROSKO, Michael D., Ph.D. (1990) "Measuring Technical Efficiency in Health Care Organizations."Journal of Medical Systems, Volume 14, No. 5, pp. 307-322.
SCHMIDT, Peter and C. A. Knox LOVELL. (1980), "Estimating Stochastic Production and CostFrontiers when Technical and Allocative Inefficiency are Correlated." Journal ofEconometrics, Volume 13, pp. 83-100.
SEAR, Alan M. (1991) "Comparison of Efficiency and Profitability of Investor-OwnedMultihospital Systems with Not-for-Profit Hospitals." Health Care Management Review,Volume 16, No. 2, pp. 31-37.
SHEPARD, Donald S., Julia WALSH, Wolfgang MUNAR, Laura ROSE, Rodrigo GUERRERO,Luis F. CRUZ, Guillermo REYES, Gail P. ORSOLANI, Carlos SOLARTE. (1991) "Cost-Effectiveness of Ambulatory Surgery in Cali, Colombia." Department of PopulationSciences, Harvard School of Public Health: Boston, MA.
SHERMAN, H.D. (1984) "Hospital Efficiency Measurement and Evaluation. Empirical Test of aNew Technique." Medical Care, Vol. 22, No. 10.

77BITRAN HFS APPLIED RESEARCH
SHERMAN, H.D. (1981) "Measurement of Hospital Technical Efficiency: A ComparativeEvaluation of Data Envelopment Analysis and Other Efficiency Measurement Techniquesfor Measuring and Locating Inefficiency in Health Care Organizations." UnpublishedD.B.A. Thesis, Harvard University.
SOULIER, Mary Ziebell and Don T. DECOSTER. (1982) "Productivity Versus Cost Control:Considerations for Health Care Managers." Health Care Management Review, Winter, pp.15-20.
TATCHELL, Michael. (1983) "Measuring Hospital Output: A Review of the Service Mix and CaseMix Approaches." Social Science and Medicine, Volume 17, No. 13, pp. 871-883.
THORNGREN, Teresa A. and Thomas C. TINSTMAN. (1990) "Challenging New Roles forMedical and Professional Staff: Managing Costs and Quality of Care." Topics in HealthCare Financing, Spring, pp. 1-11.
TIMMER, C. Peter (1970) "On Measuring Technical Efficiency." Food Research Institute Studiesin Agricultural Economics, Trade, and Development, Volume IX, No. 2, pp. 99-171.
TODA, Yasushi (1976) "Estimation of a Cost Function When the Cost is not Minimum: The Caseof Soviet Manufacturing Industries, 1958-1971." The Review of Economics and Statistics,Volume LVIII, No. 3, pp. 259-268.
VALDMANIS, Vivian G., Ph.D. (1990) "Ownership and Technical Efficiency of Hospitals."Medical Care, Volume 28, No. 6, pp. 552-561.
VARIAN, H. (1987) Microeconomic Analysis, Second Edition, W.W. Norton & Company.
VITALIANO, Donald F. (1987) "On the Estimation of Hospital Cost Functions." Journal of HealthEconomics, Volume 6, pp. 305-318.
WAN, Thomas T. H., Ph.D., Paul R. VANOSTENBERG, DDS, John J. SALLEY, DDS, Ph.D.,David W. SINGLEY, MHA, John L. WEST, MHA. (1987) "A Cost and ProductionAnalysis of Hospital Dental Care Programs." Public Health Reports, Volume 102, No. 5,pp. 512-522.
WILSON, George W. and Joseph M. JADLOW (1982) "Competition, Profit Incentives, andTechnical Efficiency in the Provision of Nuclear Medicine Services." The Bell Journal ofEconomics, Volume 13, No. 2 (Autumn), pp. 472-482.
WOUTERS, Annemarie. (1990) "The Cost and Efficiency of Public and Private Health CareFacilities in Ogun State, Nigeria." The Johns Hopkins University School of Hygiene andPublic Health, Working Paper No. 4: Baltimore, MD.

78BITRAN HFS APPLIED RESEARCH
WYSZEWIANSKI, Leon, J. William THOMAS, Bruce A. FRIEDMAN. (1987) "Case-BasedPayment and the Control of Quality and Efficiency in Hospitals." Inquiry, Volume 24, pp.17-25.
YANKAUER, Alfred, M.D., MPH. (1983) "Lessons in Surgery for the Third World." AmericanJournal of Public Health, Volume 73, No. 12, pp. 1359-1360.
ZASTOWNY, Thomas R., Ph.D., Klaus J. ROGHMANN, Ph.D., and Acco HENGST, Ph.D. (1983)"Satisfaction with Medical Care: Replications and Theoretic Reevaluation," Medical Care,Volume XXI, No. 3, pp. 294-322.