major retail types, classification and the · major retail types, classification hierarchy retail...
TRANSCRIPT
nurturing South Africa’s retail network
MAJOR RETAIL TYPES, CLASSIFICATION AND THE HIERARCHY OF RETAIL FACILITIES IN SOUTH AFRICA
September 2016AUTHOR: Dr Dirk A Prinsloo

SEPTEMBER 2016
1
Retail constitutes a significant part of the urban environment in all developed as well as in a substantial and growing proportion of developing countries. In South Africa there are ± 2 000 formal shopping centres ranging from 1 000m² up to more than 170 000m². These centres represent >23 million m² of an estimated 37 million m² of all retail facilities. Based on the information from the International Council of Shopping Centres Country Fact Sheet, South Africa has the 5th highest number of shopping centres in the world.
NO. COUNTRY NO. OF CENTRES GLA m² (mil)
1 USA 115 438 701.9
2 China 3 800 250.0
3 Canada 3 517 54.6
4 Japan 3 096 46.4
5 South Africa 1 942 23.0
6 UK 1 672 28.4
7 Australia 1 508 22.2
8 Italy 962 15.4
9 Malaysia 924 13.5
10 France 746 15.8
11 Germany 672 17.7
12 Spain 551 15.5
Source: ICSC Country Fact Sheet, 2015
1. RETAIL AS A VERY UNIQUE LAND USE
Graph 1 - GLA in m² (mil) of Top 12 Countries in World
Graph 1 - International Council of Shopping Centres Country Fact Sheet

nurturing South Africa’s retail network
MAJOR RETAIL TYPES, CLASSIFICATION AND THE HIERARCHY OF RETAIL FACILITIES IN SOUTH AFRICA
2
The retail sector of the local economy represents almost 15% of the total Gross Domestic Product (GDP) of South Africa, and almost 1 million people are employed in a large number of stores throughout the country. The annual sales from all these retail facilities are close to R 900 billion.
Graph 2 - Retail Sales at Current Prices 2009-2015 (R million)
Graph 3 - GDP Continued Growth in the office sector (1994-2015)
Source: Retail Trade 2015 Sales August 2015 Stats SA P 6242.1

SEPTEMBER 2016
3
The following table is a Country Fact Sheet compiled by Urban Studies for the International Council of Shopping Centres. There are ±50 countries included in the annual fact sheet. The shopping centre industry is the 6th largest in the world and the following outstanding characteristics should be noted:
• the number of shopping centres increased from just more than 1 053 centres in 2007, to 1 942 centres in 2015;• of the 1 942 shopping centres, 712 are classified as neighbourhood centres, and 668 as local convenience centres;• the number of super regional centres increased from 7 in 2007 to 11 in 2016 with the opening of the Mall of Africa;• the total annual retail sales is just below R900 billion per year (see figure above) and the estimated proportion of
the total retail spent in shopping centres is between 60% and 65%;• the largest shopping centres in South Africa range between 120 000m² and 170 000m²;• an estimated 2 million households benefit from this sector in terms of direct and indirect employment.
Source: ISCS Fact Sheet, 2015Last update - October 2015
South Africa Shopping Centre Fact Sheet-2015
Retail Real Estate 2007 2008 2009 2010 2012 2014
Number of Shopping Centers Minimum Size Shopping Center CountedShopping Centers by Type (Number of Centers) Super-Regional (100,000+ sq m) Regional (50,000 - 100,000 sq m) Small Regional (25,000 - 50,000 sq m) Community (12,000 - 25,000 sq m) Neighborhood (5,000 - 12,000 sq m) Local Convenience Center (1,000 - 5,000 sq m) Lifestyle Center (13,000 - 50,000 sq m)Value Center (7,000 - 52,000 sq m)
1 0532,000 sq m
1 0537
2780
177446294
319
1 2632,000 sq m
1 2638
3893
229539330
323
1 2802,000 sq m
1 2808
3992
233542334
527
1 4472,000 sq m
1 4478
43101265601398
427
1 6532,000 sq m
1 6538
49109280679477
645
19422000 sq m
19421053
1333107126681145
Shopping Center GLA 15,536,182 sq m 16,178,860 sq m 16,399,652 sq m 18,418,073 sq m 20,678,287 sq m 23,046,164 sq m
Shopping Centers by Type (Share of GLA) Super-Regional (100,000+ sq m) Regional (50,000 - 100,000 sq m) Small Regional (25,000 - 50,000 sq m) Community (12,000 - 25,000 sq m) Neighborhood (5,000 - 12,000 sq m) Local Convenience Center (1,000 - 5,000 sq m) Lifestyle Center (13,000 - 50,000 sq m) Value Center (7,000 - 52,000 sq m)Total Shopping Center GLA per 100 Inhabitants
6.5%
12.7%20.7%21.7%25.4%7.8%1.6%3.1%
32.6 sq m
5.7%
14.6%19.9%23.5%25.4%7.2%0.5%3.2%
34.2 sq m
5.6%
14.7%19.5%23.6%25.2%7.2%0.8%3.3%
33.1 sq m
5.6%
15.2%18.4%23.9%25.3%7.5%3.3%0.1%
36.5 sq m
5.0%
16.0%18.0%22.0%25.0%8.0%1.0%4.0%
39.9 sq m
5.4%15.6%19.9%22.3%23.6%8.6%3.7%0.9%
42.7 sq m
Sales 2007 2008 2009 2010 2012 2014
Total Retail Sales (in Rand) Year-on-Year % Change in Retail Sales Total Retail Sales per Capita Total Retail Sales % GDPShopping Center Sales (in Rand) Year-on-Year % Change in Shopping Center SalesShopping Center Sales per Capita Shopping Center Sales % GDP
ZAR 455 bil.12.4%
ZAR 9,60014.1%
ZAR 245 bil.12.0%
ZAR 5,25511.8%
ZAR 508 bil.11.7%
ZAR 10,43214.1%
ZAR 300 bil.22.0%
ZAR 6,17211.3%
ZAR 528 bil.3.9%
ZAR 10,68213.1%
ZAR 306 bil.2.0%
ZAR 6,18211.8%
ZAR 565 bil.7.0%
ZAR 11,18813.1%
ZAR 332 bil.8.5%
ZAR 6,64011.9%
ZAR 663 bil.17.3%
ZAR 12,80512.1%
ZAR 392 bil.8.7%
ZAR 7,60012.3%
ZAR 807 bil10.3%
ZAR 14,80715.0%
ZAR 520 bil.8.3%
ZAR 8,90011.5%
Employment 2007 2008 2009 2010 2012 2014
Total EmployeesTotal Retail and Wholesale EmployeesTotal Retail Employees Total Retail Employees as % Total EmployeesTotal Shopping Center Employees Total Shopping Center Employees as % Total Employees
1 633 000748 000
8.9%356 200
4.2%
8 512 0001 741 000835 000
9.7%437 176
5.1%
8 163 0001 665 000840 00010.0%
431 5705.3%
8 251 0001 687 000850 00010.4%
485 270
5.9%
8 440 0001 690 000852 00010.1%
544 160
6.4%
8 986 0001 860 000930 00010.3%558000
6.2%
Demographics 2007 2008 2009 2010 2012 2014
Population 47.6 mil. 48.6 mil. 48.6 mil. 50.5 mil. 51.7 mil. 54.5 mil
Six Largest Shopping CentersGateway Theatre of ShoppingCanal WalkSandton CityThe Pavilion - WestvilleMenlyn Park Shopping CentreEastgate Shopping Centre - Bedfordview
Total Retail GLA Fiscal Year 2014154,840 sq m147,362 sq m144,938 sq m120,000 sq m118,862 sq m118,732 sq m
-------
-------
Five Largest Retailers
ShopriteMassmartPick ‘n PaySpar GroupWoolworths
Domestic SalesZAR 85 337 milZAR 71 600 milZAR 60 000 milZAR 51 500 mil.ZAR 31 600 mil.
Total Sales Fiscal Year 2014
International SalesZAR 16 800 milZAR 6 400 milZAR 3 200 milZAR 3 000 mil
A$ 849 mil
Total SalesZAR 102 200 milZAR 78 000 milZAR 64 000milZAR 54 500 milZAR 39 900 mil
Five Largest Shopping Center Owners GrowthpointRedefineResilientLiberty PropertiesPareto
Domestic GLA
1 410 4611 215 1991 009 5631 000 000821 504
Total GLA Owned Fiscal Year 2014International GLA
-----
-Total GLA
1 410 461sq m1 215 199sq m1 009 563sq m1 000 000sq m821 504 sq m
www.growthpoint.co.zawww.redefine.co.zawww.resilient.co.za
www.libertyproperties.co.zawww.pareto.co.za
nurturing South Africa’s retail network
MAJOR RETAIL TYPES, CLASSIFICATION AND THE HIERARCHY OF RETAIL FACILITIES IN SOUTH AFRICA
4
The ICSC definitions are slightly different to the South African classification especially in terms of centre sizes.
2. U.S. SHOPPING CENTRE CLASSIFICATION AND CHARACTERISTICS
U.S. SHOPPING CENTRE CLASSIFICATION AND CHARACTERISTICS The ICSC definitions are slightly different to the South African classification especially in terms of centre sizes.
U.S. Shopping Centre Classification and Characteristics
Type of Shopping
Centre Concept
Centre Count
Aggregate GLA
(Sq. Ft.)
% Share of
Industry GLA
Average Size
(Sq. Ft.)
Typical GLA
Range (Sq. Ft.)
Acres # of
Anchors
% Anchor
GLA
Typical Number
of Tenants
Typical Type of Anchors
Trade Area Size
(miles) General-Purpose Centres 112 141 Super-Regional Mall
Similar in concept to regional malls, but offering more variety and assortment.
625 775 151 094 10.3% 1 240 242 800 000+ 60-120 3+ 50-70% N/A
Full-line or junior department store, mass merchant, discount department store and/or fashion apparel store
5-25
Regional Mall General merchandise or fashion-orientated offerings. Typically enclosed with inward-facing stores connected by a common walkway. Parking surrounds the outside perimeter.
597 353 393 011 4.7% 591 948 400 000- 800 000
40-100 2+ 50-70% 40-80 stores
Full-line or junior department store, mass merchant, discount department store and/or fashion apparel store
5-15
Community Centre (“Large Neighbourhood Centre”)
General merchandise or convenience-oriented offerings. Wider range of apparel and other soft goods offerings than neighbourhood centres. The centre is usually configured in a straight line as a strip, or may be laid out in an “L” or “U” shape, depending on the site and design.
9 730 1 923 267 818 25.5% 197 664 125 000-400 000
10-40 2+ 40-60% 15-40 stores
Discount store, supermarket, drug, large speciality discount (toys, books, electronics, home improvement/furnishings or sporting goods, etc.)
3-6
Neighbourhood Centre
Convenience oriented. 32 459 2 334 816 341 30.9% 71 931
30 000-125 000
3-5 1+ 30-50% 5-20 stores Supermarket
3
Strip/Convenience Attached row of stores or service outlets managed as a coherent retail entity, with on-site parking usually located in front of the stores. Open canopies may connect the store fronts, but a strip centre does not have enclosed walkways linking the stores. A strip centre may be configured in a straight line, or have an “L” or “U” shape. A convenience centre is among the smallest of the centres, whose tenants provide a narrow mix of goods and personal services to a very limited trade area.
68 730 909 928 604 12.0% 13 239 <30 000 <3
Anchorless or a small
convenience store
anchor
N/A N/A
Convenience store, such as a mini-market
<1
Specialised-Purpose Centres 3 234 Power Centre Category-dominant anchors, including discount
department stores, off-price stores, wholesale clubs, with only a few small tenants.
2 240 977 614 956 12.9% 436 435 250 000-600 000
25-80 3+ 70-90% N/A
Category Killers, such as home improvement, discount department, warehouse club and off-price stores
8-10
Lifestyle Upscale national-chain speciality stores with dining and entertainment in an outdoor setting.
466 155 327 402 2.1% 333 321 150 000-500 000
10-40 0-2 0-50% N/A Large format upscale speciality
8-12
Factory outlet Manufacturers’ and retailers’ outlet stores selling brand name goods at a discount.
365 88 659 863 1.2% 242 904 50 000-400 000
10-50 N/A N/A N/A Manufacturers’ and retailers’ outlets
25-75
Theme/Festival Leisure, tourist and service-oriented offerings with entertainment as a unifying theme. Often located in urban areas, they may be adapted from older – sometimes historic – buildings and can be part of a mixed-use project.
163 24 046 736 0.3% 147 526 80 000-250 000
5-20 Unspecified N/A N/A
Restaurants, entertainment
25-75
Limited-Purpose Property 54
Airport Retail Consolidation of retail stores located within a commercial airport. 54 12 479 607 0.2% 231 104
75 000-300 000
N/A N/A N/A N/A No anchors: retail includes speciality retail and restaurants
N/A
Total Industry 115 429
Total Industry Traditional + Speciality + Special Purpose. 115 429 7 554 685 432 100.0% 65 449 Source: ICSC Research and CoStar Realty Information, Inc. (www.costar.com) June 2016

SEPTEMBER 2016
5
The first group of retail types refers to planned shopping centres covering the full hierarchy of retail facilities ranging from super regional centres to small local convenience centres. The second group comprises planned specialist/focus/niche centres and airport retail. The third group includes unplanned (also referred to as incremental development) town centre/inner city developments and the fourth group deals with rural retail developments.
Planned and unplanned retail types in the whole spectrum of retail facilities:
Most international models were inadequate to address the entire retail structure and especially South African circumstances. The hierarchical model developed by Prof Kahn (1988) was updated and adjusted for a much better understanding of the urban and metropolitan retail market in South Africa. The following additional aspects were incorporated in this model:
The market characteristics of each type of centre should be well understood and taken into consideration in the planning process for a specific type centre. The most important to be included are the age and lifecycle profile, socio-economic status, disposable income and expenditure levels, as well as different lifestyles of the residents living in a particular trade area.
The local conditions of individual markets should be considered. For example, the development of centres as part of coastal towns has different threshold values and the focus should be on the permanent residents living in the town. The peak tourist months should be regarded as additional support, and not part of the long-term sustainability of a centre.
3. PLANNED AND UNPLANNED SHOPPING FACILITIES IN SOUTH AFRICA
4. HIERARCHY OF SOUTH AFRICAN SHOPPING CENTRES
Planned Unplanned Rural
Core Classification• Small free standing
and convenience • Neighbourhood• Community• Small regional/ large
community• Regional• Super Regional
Specialist• Big Box Retailers• Entertainment/casinos• Lifestyle• Value• Hyper• Motor showrooms and
related facilities• Filling station stores• Airport retail• Centres at railway/
commuter stations• Organised flea markets
• CBD/Town Centre• Taxi rank retail/
commuter centre• Informal Traders• Spaza shops• Fresh produce markets• Morning/daily food
markets
• Rural retail taxi orientated
• Town centres• Informal trade• Spaza shops• Planned shopping
centres
Source: Urban Studies 2010 updated for 2016

nurturing South Africa’s retail network
MAJOR RETAIL TYPES, CLASSIFICATION AND THE HIERARCHY OF RETAIL FACILITIES IN SOUTH AFRICA
6
The following diagram below gives an indication of the different rural town centre sizes and the role they play in the supply of shopping centres. The village represents a one tier retail hierarchy with small retail stores offering a full spectrum of food, clothing and service facilities. As the size of the settlement increases, the level and the number of retail facilities also increase. The most prominent rural retail offering is restricted to a large town where mainly a two/three tier retail hierarchy is present. The largest retail offering in this regard is found in small cities where up to a four tier retail offering could be represented. This however becomes closer to the large urban and metropolitan areas with a well-established hierarchy of shopping centres.
• The difference in disposal income amongst different socio-economic groups is reflected in the use of the LSM classification. The LSM segmentation model is used by most retailers to differentiate their products, markets and store type as well as sizes. The SAARF LSM segmentation model is updated annually and the average household income is mainly used by retailers and not the 29 different wealth variables;
• The level of transport mobility of the consumer in South Africa has a major impact on how different shopping centres are being supported. The emphasis is on car ownership which is increasing in most of the lower middle and upper income categories. Taxi transport is also very important with a direct influence on the development of retail facilities;
• Different threshold values for different product categories have a direct impact on the hierarchy of shopping centres. The threshold values clearly indicate how many households of a specific LSM group are required to warrant retail of any kind;
• The hierarchy of shopping centres consist of different levels and tiers of representation, depending on the size of the population and available disposable income. In the metropolitan areas the hierarchy will offer retail facilities ranging from small neighbourhood centres to super regional centres.
• In large towns and smaller cities the hierarchy include fewer levels while in rural areas the hierarchy consist of only one or two levels.
• Retail is continuously changing because of changes in aspirations and rising incomes, increase in mobility and new products/retailers entering the market. The hierarchy and type of shopping centres is part of an evolutionary process where new attractive marketing applications are applied all the time. This is also the reason for the wide variety of typologies and different retail formats. There are and there will always be exceptions on the broad categories. This is only a guideline.
Graph 4 - Hierarchy of Shopping Centres Influenced by Income and Number of Households

SEPTEMBER 2016
7
Graph 5 - Retail Hierarchy in Rural Areas and Small Cities
The following is a detailed description of all the different retail types forming part of a metropolitan retail structure from the smallest filling station to a super-regional mall. The information provided for each retail type includes the following:
• Role and function. Different centres in the hierarchy of shopping centres fulfil different roles and functions in terms of their offering, their tenant mix, the number of stores, and the market they serve;
• Description and centre characteristics. This gives a broad indication of the size of a typical centre in each of the categories measured in Gross Leasable Area (GLA), the number of stores and the land size requirements;
• Location criteria focusing on the road accessibility, the visibility of the building/site, access to public transport and general traffic flows;
• Market characteristics and threshold values. This refers to the minimum number of households required in a particular socio-economic area to warrant a shopping centre of a particular size;
• Tenant mix. An indication is given regarding the anchor tenants, independent stores, line shops and specific services;
• Benchmark Indicators in terms of frequency of weekly visits and the average dwell time to a particular type of centre;
• Trading Densities. A historical trend line highlighting the average trading densities applicable for a particular type of centre;
5. MAJOR RETAIL TYPES: PLANNED SHOPPING CENTRES

nurturing South Africa’s retail network
MAJOR RETAIL TYPES, CLASSIFICATION AND THE HIERARCHY OF RETAIL FACILITIES IN SOUTH AFRICA
8
Role and function
The function offered by these centres is mainly express convenience and caters mainly for daily milk and bread purchases. This includes a café/small food store, takeaway foods, local restaurants, DVD stores, banks and ATM facilities.
Description and centre characteristics
This retail facility aims at satisfying the local needs of the residents within one or two adjoining suburbs. Such a facility could be a single building or a number of buildings located in close proximity to each other to provide a single destination. These centres could consist of one tenant or a number of small tenants.
Location Criteria
These centres are usually located on collector streets in suburbs. Most of these centres require customers to get to the centre by car, but are often also located within walking distance of a large proportion of the local population. The close proximity of a taxi rank will add to the market strength of a convenience centre.
Geographic segmentation
These centres mainly form part of metropolitan and city suburbs. Fewer of these centres are located in the township areas.
5.1 SMALL FREE STANDING CONVENIENCE CENTRES
• Geographic Segmentation. It is wrong to regard all centres with the same size as similar. The geographical segmentation clearly distinguishes between centres located in metropolitan areas and in smaller cities and towns. The following categories will be used to classify all centres:
o Metropolitan CBD o Metropolitan suburban o Metropolitan township o City CBD o City suburban o City township o Town centre o Town suburbs o Townships o Rural areas• Actions to guide future retail development. Very broad guidelines are given regarding the latest trend in the
development of a particular type of shopping centre.
Size of centre (m²)(GLA)
Number of stores Size of land (ha)
500 - 5 000 5 - 25 0.15 - 1.5
Average radius of primary trade area
Median travel time to the centre
Access requirements
1 - 1.5km 2 - 3min Suburban street or minor collector road

SEPTEMBER 2016
9
Market characteristics and threshold values
For a successful local convenience centre, the following threshold values and market support are required:
Tenant mix
Anchor tenant: Usually smaller than ±1 000m² with the typical tenants being a café, independent food store, Woolworths Food or other smaller grocery stores such as Kwik Spar or specialised food stores.
Other tenants for these centres are convenience retailers including a pharmacy, deli, butchery, DVD store, hairdresser, dry cleaner, liquor store, florist and a hardware store. Small eating places/fast-food outlets could be accommodated depending on the micro location.
Geographic segmentation
Present in metropolitan areas, cities, towns and rural areas.
Actions to Guide Future retail
The potential will mainly be determined by the local population, the location of the proposed centre, as well as the anchor tenant. Some anchor tenants in this category are more successful than others. In most cases shoppers have a very specific preference based on the product range, the quality and price, the operator, the service, business hours, parking and security. These are all factors which will impact on the success of these centres.
Growth in these types of centres will probably occur in the new residential growth areas in suburbs and townships. Currently, each of the major township areas makes provision for centres on this level. The ‘follow-the-roofs’ strategy should be implemented in this case. At least 60% of the required number of households should be occupied before the retail development will become viable. A new trend is to redevelop many of the older, well located convenience centres focusing on an appealing appearance.
Parktown Quarters, Parktown North Johannesburg: This centre revamped and re-tenanted, offering an attractive tenant mix.
LSM groups Number of households
LSM 1 - 5 <10 000
LSM 6 - 9 <5 000
LSM 10 - 10+ <2 000

nurturing South Africa’s retail network
MAJOR RETAIL TYPES, CLASSIFICATION AND THE HIERARCHY OF RETAIL FACILITIES IN SOUTH AFRICA
10
Examples
• L Corro, Northcliff, Johannesburg• Mountain View, Fairland, Johannesburg• Addys Plaza, Botshabelo, Bloemfontein• Amalinda Square, East London• Essenwood Park Shopping Centre, Richards Bay• Kenilworth Corner, Cape Town• Parys Boulevard, Parys• Pine Park Centre, Pine Park, Randburg• Sinoville Corner, Sinoville, Pretoria.
Role and function
These centres fulfil a convenience and express convenience role. The three most critical aspects with regard to these centres are the following:
• a reputable, good, attractive, and well known food anchor;• the provision of sufficient parking and• a very good micro location offering easy access for residents from the surrounding suburbs.
Description and centre characteristics
This retail facility aims at the suburban level with a larger impact than the local convenience centre. These centres usually service the surrounding neighbourhood within a 2 km range but can also play an intercepting role for passing traffic to other suburbs.
Location criteria
These centres are usually located on major collector roads in suburbs or township areas offering high visibility and accessibility to passing traffic intended for the suburb(s) in the immediate vicinity.
Geographic segmentation
These centres mainly form part of metropolitan and city suburbs. Fewer of these centres are located in the township areas.
5.2 NEIGHBOURHOOD CENTRES
Average radius of primary trade area
Median travel time to the centre
Access requirements
1.5 - 2km 4 - 9min Major collector road
Size of centre (m²)(GLA)
Number of stores Size of land (ha)
5 000 - 12 000 25 - 50 1.5 - 3.6
SEPTEMBER 2016
11
Market characteristics and threshold values
The household threshold value for these centres in the different LSM groups is shown below.
Tenant mix
• Anchor Tenant: Usually larger than 1 400m² with the typical tenants being Spar, Pick n Pay, Checkers, Shoprite, Woolworths Food and Food Lovers Market. The latest trend is where two food anchor stores, for example Pick n Pay and Woolworths Food, are located in the same centre. This is also applicable on a combination with other food anchors like Spar and Checkers. The emphasis in this regard is to complement the offering of the larger supermarkets, and to provide a variety of food and grocery products. The preferred supermarket is in most cases a reflection of the socio-economic profile of the residents in the surrounding suburbs
• The other tenant types to be found in these centres are convenience retailers including a pharmacy (stores like Dis-Chem and Clicks are popular tenants in these type of centres), butchery, video store, hairdresser, dry cleaner, liquor store and a hardware store. There are also other tenants in these centres which could include specialised stores, small clothing stores, restaurants and takeaways, as well as services like medical and banking facilities.
• Part of the tenant mix also includes independent stores mainly run by local residents. These shops offer better variety in the tenant mix. A good example is home industries.
Benchmark indicators
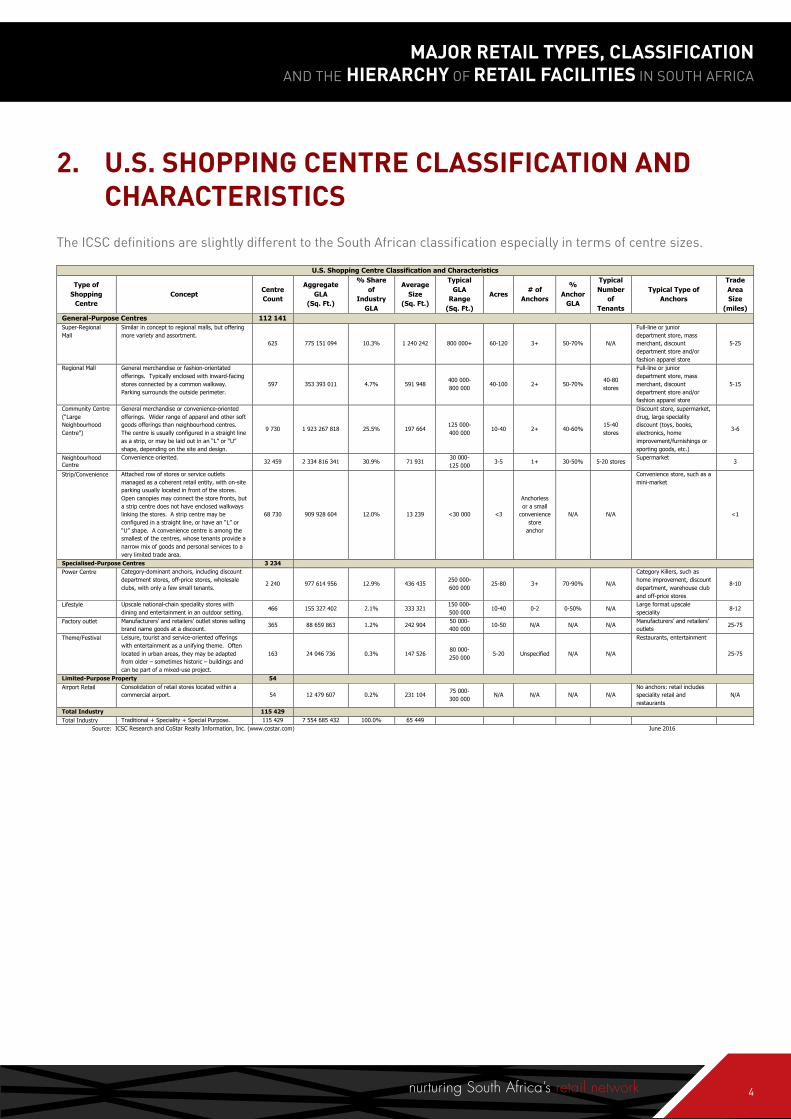
Graph 6 - % of Shoppers Visiting Neighbourhood Centres on a Weekly or More Frequent Basis
Source: Urban Studies 2015
LSM groups Number of households
LSM 1 - 5 20 000 - 47 000
LSM 6 - 9 9 000 - 20 000
LSM 10 - 10+ 3 600 - 8 500

nurturing South Africa’s retail network
MAJOR RETAIL TYPES, CLASSIFICATION AND THE HIERARCHY OF RETAIL FACILITIES IN SOUTH AFRICA
12
In most cases the neighbourhood centres are visited by 60%-75% of their customers on a weekly or more frequent basis and the average dwell time is ±30-35 minutes.
Graph 7 - Average Dwell Time per Trip for Neighbourhood Centres
Source: Urban Studies 2015
Graph 8 - South Africa Retail Trading Denisty Index: Neighbourhood
-
20,0
40,0
60,0
80,0
100,0
120,0
140,0
160,0
10 11 12 13 14 15 16
Inde
xVa
lue
Source: MSCI, South Africa Retail Trading Density Index, 2016

SEPTEMBER 2016
13
Actions to guide future retail development
Neighbourhood centre development will mainly happen as part of the following:
• Infill areas in suburban and township areas;• Redevelopment of existing neighbourhood centres;• New growth areas where the threshold value is sufficient to warrant immediate development and• Greenfields developments where ‘follow the roofs’ strategies should be followed and developed once a substantial
proportion of the threshold value in terms of occupied homes have been reached.
Examples:
• Checkers Centre - Kathu• Harding Corner, Harding• Jean Avenue, Centurion• Kyalami on Main, Midrand• Lifestyle Square, Rustenburg• Maskam Mall, Vredendal• Old Rembrandt, Paarl• Serala View Convenience Centre, Polokwane

nurturing South Africa’s retail network
MAJOR RETAIL TYPES, CLASSIFICATION AND THE HIERARCHY OF RETAIL FACILITIES IN SOUTH AFRICA
14
Role and function
The role of a community centre is to satisfy the need for shopping facilities between that of a neighbourhood and a regional centre. Their role is to offer a larger variety of convenience products with more depth and variety of merchandise. The community centre has a larger catchment area and services more households. The definition of a community centre is often not precise and overlapping/duplication occurs with neighbourhood centres and small regional centres.
The role fulfilled by these centres in township areas is very important, mainly because of transport/taxi orientated facilities, the lack of private transport and to offer a large facility mainly within walking distance of a large portion of the community. In many cases, shoppers are prepared to walk to these large centres and to save on transport costs.
Description and centre characteristics
Community centres are offering a wider tenant mix than a neighbourhood centre. These centres however are not large enough to offer a full range of comparative tenants and are sometimes difficult to develop because of the nature of being in between small and large centres.
Location Criteria
These centres are located on main arterial roads which are accessible from a number of suburbs located in the area. The site must offer high visibility to passing traffic and accessibility to the residents in this area.
Market characteristics and threshold values
For a successful community centre the following threshold values and market support is required:
5.3. COMMUNITY CENTRES
LSM groups Number of households
LSM 1 - 5 44 000 - 102 000
LSM 6 - 9 15 000 - 45 000
LSM 10 - 10+ 5 000 - 12 000
Size of centre (m²)(GLA)
Number of stores Size of land (ha)
12 000 - 25 000 50 - 100 3.6 - 7.5
Average radius of primary trade area
Median travel time to the centre
Access requirements
2.5 - 3km 6 - 14min Major arterial road

SEPTEMBER 2016
15
Tenant mix
• Anchor tenant: One or two large supermarkets bigger than 2 500m² with the typical tenants being Spar, Pick n Pay Family Store, Pick n Pay, Shoprite and Checkers (or combined with a Woolworths Food store). Food Lovers Market has also become a very popular tenant in these centres;
• Convenience retailers including a pharmacy, butchery, video store, hairdresser, dry cleaner, liquor store and a hardware store. Dis-Chem and Clicks are also popular tenants;
• National clothing stores (to a limited extent), boutiques, shoes and some comparative shopping;• Restaurants and takeaways;• Services like medical facilities, banking and limited office functions;• Some might have cinemas. In a few of these size centres, cinemas closed because of smaller trades areas.
Graph 9 - % of Shoppers Visiting Community Centres on a Weekly or More Frequent Basis
Source: Urban Studies 2015
Graph 10 - Average Dwell Time Per Trip for Community Centres
Source: Urban Studies 2015

nurturing South Africa’s retail network
MAJOR RETAIL TYPES, CLASSIFICATION AND THE HIERARCHY OF RETAIL FACILITIES IN SOUTH AFRICA
16
Between 60% and 70% of customers visit these centres on at least a weekly basis with an average dwell time of between 60-80 minutes.
Actions to guide future retail development
The potential for this type of development will mainly be in three different areas, namely:• infill developments where enough potential exists;• new growth areas and a ‘follow the roofs’ strategy;• redevelopment of well-located existing centres;• expansion of the tenant mix and floor area of existing centres to offer a better tenant mix and• expansion of large neighbourhood centres where sufficient potential exists for community centres.
Nicolway in Bryanston is slightly bigger than a community centre. This attractive centre focuses on food, restaurants and speciality stores. It is located in an affluent area with many office workers in the vicinity.
Graph 11 - South Africa Retail Trading Density Index: Community
-
20,0
40,0
60,0
80,0
100,0
120,0
140,0
160,0
180,0
03 04 05 06 07 08 09 10 11 12 13 14 15 16
Inde
xVa
lue
Source: MSCI, South Africa Retail Trading Density Index, 2016
SEPTEMBER 2016
17
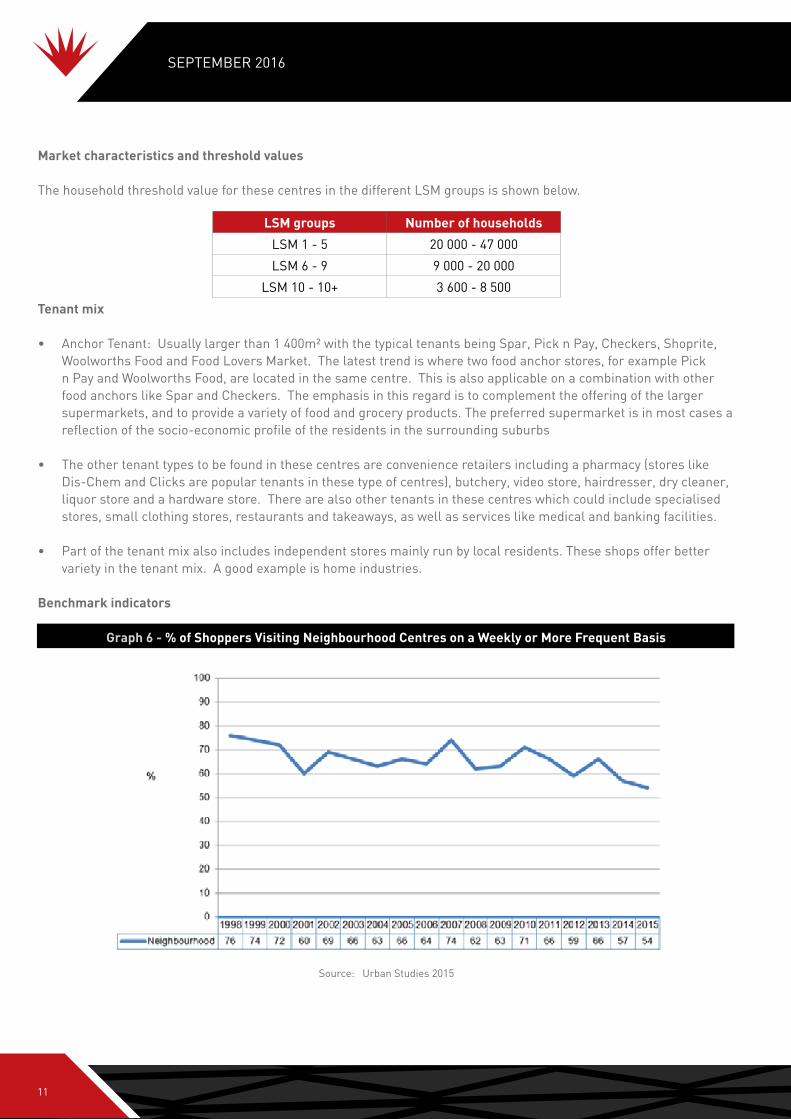
Dainfern SquareThis is a new centre built in a high growth affluent area. The design is attractive with both open and enclosed areas.
Example
• Cosmo Mall, Randburg• KG Mall, Kwa Guqa, Emalahleni• Mall @ Lebo, Lebowakgomo• Mtuba Mall, Mtubatuba.
Role and Function
The role and function of these types of centres are mainly to satisfy the needs of the broader community and to offer a better tenant mix than community centres. Most of these centres do not necessarily fulfil a true regional role, but rather that of a larger community facility.
Some of these centres also address the needs of a specific market segment. Many new centres in this size category have opened during the last 10 years. The tenant mix is wider and competes on both ends against community and regional centres. In some cases, especially in more rural areas, these centres fulfil a much stronger regional attraction.
Description and centre characteristics
This retail facility offers a wide variety of stores and is bigger than a community centre, at a better location, with a wider tenant mix but not yet in the category of a regional centre.
Such a centre could be a large community centre according to the definition, but due to its role and function in the area, it could be regarded as a small regional centre. These centres can also fulfil a regional role in more rural areas.
5.4 SMALL REGIONAL CENTRES/LARGE COMMUNITY CENTRES
Size of centre (m²)(GLA)
Number of stores Size of land (ha)
25 000 - 50 000 75 - 150 7.5 - 15

nurturing South Africa’s retail network
MAJOR RETAIL TYPES, CLASSIFICATION AND THE HIERARCHY OF RETAIL FACILITIES IN SOUTH AFRICA
18
Location criteria
Good regional accessibility and the site must offer high visibility to passing traffic and easy accessibility to residents in the community/region.
Geographic segmentation
These centres mainly form part of metropolitan and city suburbs. More of these centres are located in metropolitan townships and large towns.
Market characteristics and threshold values
For a successful small regional centre the following threshold values and market support is required:
LSM groups Number of households
LSM 1 - 5 89 000 - 208 000
LSM 6 - 9 39 000 - 92 000
LSM 10 - 10+ 16 000 - 37 000
Average radius of primary trade area
Median travel time to the centre
Access requirements
3 - 5km 10 - 16min Major arterial roads
Tenant mix
• Anchor Tenant: Large supermarket (>±4 000m²) with the typical tenants Shoprite, Checkers, Pick ‘n Pay, Spar and Food Lovers Market. Up to two or three food anchors can be on offer in one centre;
• Convenience retailers;• Major national clothing anchor stores like Edgars, Woolworths and Mr Price, boutiques, shoe shops and some
comparative shopping;• Restaurants and takeaways;• Entertainment mainly focusing on cinemas and• Services, such as medical and banking facilities as well as limited office functions.The focus of the tenant mix is on comparative shopping in clothing and household items.

SEPTEMBER 2016
19
Between 60%-65% of customers visit these centres on a weekly basis and normally stay for ±95 minutes.
Graph 12 - % of Shoppers Visiting Small Regional Centres on a Weekly or More Frequent Basis
Graph 13 - Average Dwell Time Per Trip for Small Regional Centres
Source: Urban Studies 2015
Source: Urban Studies 2015

nurturing South Africa’s retail network
MAJOR RETAIL TYPES, CLASSIFICATION AND THE HIERARCHY OF RETAIL FACILITIES IN SOUTH AFRICA
20
Actions to guide future retail development
• Fewer opportunities exist mainly because of over saturation in some of the suburban areas;• Provision should be made for small regional centres to expand over time. Community centres in rural and
township areas could be increased to this level. These facilities will initially act as a catalyst for further retail and other development. Depending on the area, provision should be made for office development and other additional types of retail facilities.
• In the case of existing centres, expansion must be allowed to cater for a better tenant mix, existing stores to expand (internal growth) and to offer more eating facilities and new retail concepts.
• Infill developments could be considered.
Soshanguve Crossing catering for a large population in a fast growing township area
Heidelberg Mall serves the local and surrounding regional market. On a higher level shoppers still tend to go to nearby metropolitan centres.
Graph 14 - South Africa Retail Trading Density Index: Small Regional
-
20,0
40,0
60,0
80,0
100,0
120,0
140,0
160,0
180,0
03 04 05 06 07 08 09 10 11 12 13 14 15 16
Inde
xVa
lue
Source: MSCI, South Africa Retail Trading Density Index, 2016

SEPTEMBER 2016
21
Location criteria
Major arterial roads, usually provincial roads linked to a national road offering very high accessibility and visibility. Provision should be made for enough vehicle stacking space from the highway to prevent queuing and traffic obstructions.
Examples
• Eyethu Orange Farm Mall, Stretford, Sebokeng• La Lucia Mall, Durban• Leratong City, Leratong• Moruleng Mall, Moruleng• Langeberg Mall, Mossel Bay• Tubatse Crossing, Burgersfort• Walmer Park, Port Elizabeth• Vincent Park, East Londen
Role and function
The role and function of these centres are to satisfy the needs of a large primary (±60%-70% of regular customers) and a secondary catchment area (20%-30% of customers). The support from the tertiary trade area usually varies between 8% and 10%. These centres are often supported by a strong workforce in the immediate vicinity. They offer a wider entertainment component to attract people especially during the evenings and children during holiday periods.
These centres also act as a catalyst for the establishment of a mixed use node with retail facilities, office firms, hotels, residential development and entertainment. These areas then develop into strong mixed use nodes.
Description and centre characteristics
This is a large retail facility offering a wide variety of stores, sufficient parking facilities and a significant entertainment component.
5.5 REGIONAL CENTRES
Size of centre (m²)(GLA)
Number of stores Size of land (ha)
50 000 - 100 000 150 - 250 15+
Average radius of primary trade area
Median travel time to the centre
Access requirements
5 - 8km 14 - 20min Major arterial road usually a provincial road linking to
a national road
Geographic segmentation
These centres mainly form part of metropolitan and large cities. There are a number of regional centres located in metropolitan townships.

nurturing South Africa’s retail network
MAJOR RETAIL TYPES, CLASSIFICATION AND THE HIERARCHY OF RETAIL FACILITIES IN SOUTH AFRICA
22
Market characteristics and threshold values
For a successful regional centre, the following threshold values and market support is required:
Tenant mix
• Anchor tenant: In most cases, two large supermarkets (larger than ±5 000m²) or one large supermarket of 8 000m²-12 000m² with the typical tenants being Pick n Pay or Pick n Pay Hypermarket, Shoprite, Checkers or Checkers Hyper and SuperSpar. Some centres also offer a third large food store like Food Lovers Market. A tenant like Dis-Chem is an important tenant in most regional centres;
• Clothing anchor stores such as Edgars, Woolworths, Mr Price, Foschini and Truworths. International fashion tenants like Zara, Cotton On, H&M, and Topshop are strong drawcards to compliment the fashion section;
• Boutiques and shoe stores;• Restaurants and food court areas;• A variety of homeware and décor stores;• Entertainment such as cinemas, electronic games/game arcades and • Other services such as medical facilities, banking, cell phone service centres, post offices and other community
services.
The focus of the tenant mix is on comparative and destination shopping in especially clothing and household items. Eating places and entertainment are main drawcards as well as a differentiating factor.
LSM groups Number of households
LSM 1 - 5 180 000 - 417 000
LSM 6 - 9 80 000 - 185 000
LSM 10 - 10+ 33 000 - 76 000
Benchmark indicators
Graph 15 - % of Shoppers Visiting Regional Centres on a Weekly or More Frequent Basis
Source: Urban Studies 2015

SEPTEMBER 2016
23
The support fluctuates between 50% and 60% weekly support with an average dwell time of 2 hours.
Graph 16 - Average Dwell Time Per Trip for Regional Centres
Source: Urban Studies 2015
Graph 17 - South Africa Retail Trading Denisty Index: Regional
-
20,0
40,0
60,0
80,0
100,0
120,0
140,0
160,0
180,0
03 04 05 06 07 08 09 10 11 12 13 14 15 16
Inde
xVa
lue
Source: MSCI, South Africa Retail Trading Density Index, 2016

nurturing South Africa’s retail network
MAJOR RETAIL TYPES, CLASSIFICATION AND THE HIERARCHY OF RETAIL FACILITIES IN SOUTH AFRICA
24
Actions to guide future retail development
• New developments should mainly focus on high growth areas where sufficient demand exists. ‘Follow-the-roofs’ strategy is very important in this case. Sufficient growth must have taken place before a regional centre could be established in any area. There are a number of examples where new centres were built much too early with low trading densities, low merchandise depth and width as well as low pedestrian volumes.
• Consider expansion of existing small regional centres and regional centres to cater for increased demand. These centres will also develop into first and second order nodes and provision should be made for additional retail facilities, as well as office development in specific areas. This is one of the most important trends in shopping centre development over the last 15 years. With fewer new opportunities the expansion of existing regional centres will be a strong focus.
Matlosana Mall is a new mall catering for Klerksdorp and surrounding towns. The performance of this centre is strongly influenced by local economic conditions.
Randburg Square serving a very wide commuter market.

SEPTEMBER 2016
25
Examples
• Bay West Mall, Port Elizabeth• Cradlestone Mall, Krugersdorp• Forest Hill Mall, Centurion• Galleria Shopping Centre, Amanzimtoti• Greenstone Shopping Centre, Edenvale• Hemingways Mall, East London• Highveld Mall, Emalahleni• Mall of the North, Polokwane• Mall of the South, Johannesburg• Maponya Mall, Soweto• Trade Route Mall, Lenasia• Liberty Midlands Mall Pietermaritzburg• Ni City Mall, Cape Town• Garden Route Mall, George• MooiRivier Mall, Potchefstroom• Denlyn Centre, Mamelodi, Pretoria
Role and Function
The role and function of these centres are to provide retail facilities for the whole metropolitan area, a large region, as well as national and international tourists. Support from all over the city is very important in this case. Comparative and specialist shopping becomes very important.
Most small regional centres within a metropolitan area fall within the catchment area of the super-regional centre. These centres offer a very wide tenant mix, entertainment, services and the latest retail concepts and international brands.
Description and centre characteristics
This is a very large retail facility offering the widest possible variety of stores, an appealing shopping atmosphere with a large entertainment component.
Location criteria
A major arterial road, usually a provincial road linked to a national road offering very high accessibility and visibility. Provision should be made for enough vehicle stacking space from the highway to prevent queuing.
5.6 SUPER REGIONAL CENTRES
Size of centre (m²)(GLA)
Number of stores
>100 000 More than 250
Average radius of primary trade area
Median travel time to the centre
Access requirements
10+km 24 - 30min Major arterial road usually a provincial main road link-
ing to a national road

nurturing South Africa’s retail network
MAJOR RETAIL TYPES, CLASSIFICATION AND THE HIERARCHY OF RETAIL FACILITIES IN SOUTH AFRICA
26
Geographic segmentation
These centres mainly form part of metropolitan suburban areas.
Market characteristics and threshold values
For a successful super regional centre, the following threshold values and market support is required:
Tenant Mix
The widest possible tenant mix with at least seven anchor tenants which include groceries, clothing (all the national and latest international clothing brands), household goods (a wide variety of comparative home and décor stores) entertainment (cinemas, electronic games, ice rinks) banks and other services as well as health and beauty stores. New retail concepts are normally tested and first implemented on the super-regional level. Most international stores have opened branches in these centres.
LSM groups Number of households
LSM 6 - 9 106 000 - 250 000
LSM 10 - 10+ 44 000 - 101 000

SEPTEMBER 2016
27
Benchmark Indicators
50% of the shoppers visit super regional centres on a weekly basis for ±140 minutes.
Graph 19 - Average Dwell Time Per Trip for Super Regional Centres
Graph 18 - % of Shoppers Visiting Super Regional Centres on a Weekly or More Frequent Basis
Source: Urban Studies 2015
Source: Urban Studies 2015

nurturing South Africa’s retail network
MAJOR RETAIL TYPES, CLASSIFICATION AND THE HIERARCHY OF RETAIL FACILITIES IN SOUTH AFRICA
28
Actions to guide future retail development
Most metropolitan areas can only cater for one or at most two super regional malls. The potential will be driven by city wide support, the tenant mix and the entire offering. Growth of existing super regional centres will mainly depend on new retail offerings, as well as on internal expansion of existing retailers. The new Mall of Africa opened in 2016 at 131 000mm² the largest centre to open at that size. This centre is regarded as an infill development where sufficient houses already exist around the centre.
Examples
• Canal Walk, Century City, Cape Town• Eastgate, Bedfordview• Gateway, Umhlanga Rocks• Mall of Africa, Midrand• Cresta, Johannesburg• Menlyn Park, Pretoria• Sandton City, Sandton • The Pavilion, Durban• Westgate, Roodepoort
Mall of Africa
Graph 20 - South Africa Retail Trading Denisty Index: Super Regional
-
20,0
40,0
60,0
80,0
100,0
120,0
140,0
160,0
180,0
200,0
03 04 05 06 07 08 09 10 11 12 13 14 15 16
Inde
xVa
lue
Source: MSCI, South Africa Retail Trading Density Index, 2016
SEPTEMBER 2016
29
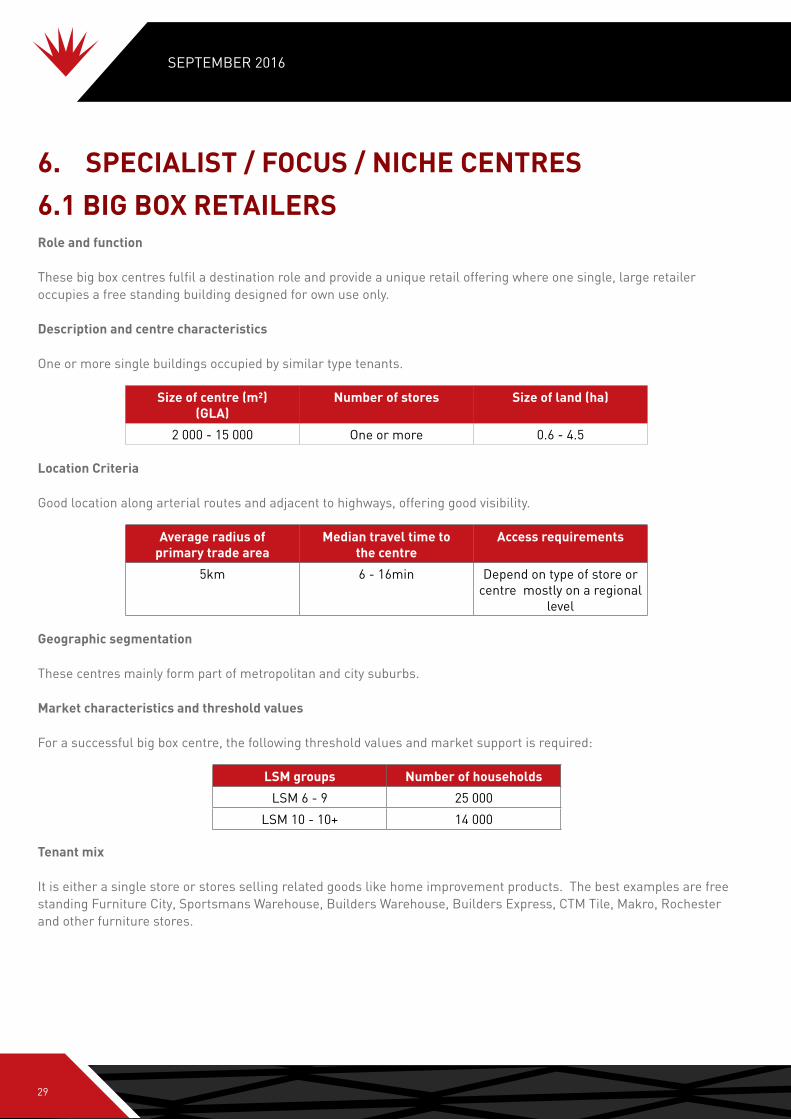
Role and function
These big box centres fulfil a destination role and provide a unique retail offering where one single, large retailer occupies a free standing building designed for own use only.
Description and centre characteristics
One or more single buildings occupied by similar type tenants.
Location Criteria
Good location along arterial routes and adjacent to highways, offering good visibility.
Geographic segmentation
These centres mainly form part of metropolitan and city suburbs.
Market characteristics and threshold values
For a successful big box centre, the following threshold values and market support is required:
Tenant mix
It is either a single store or stores selling related goods like home improvement products. The best examples are free standing Furniture City, Sportsmans Warehouse, Builders Warehouse, Builders Express, CTM Tile, Makro, Rochester and other furniture stores.
6. SPECIALIST / FOCUS / NICHE CENTRES6.1 BIG BOX RETAILERS
LSM groups Number of households
LSM 6 - 9 25 000
LSM 10 - 10+ 14 000
Size of centre (m²)(GLA)
Number of stores Size of land (ha)
2 000 - 15 000 One or more 0.6 - 4.5
Average radius of primary trade area
Median travel time to the centre
Access requirements
5km 6 - 16min Depend on type of store or centre mostly on a regional
level

nurturing South Africa’s retail network
MAJOR RETAIL TYPES, CLASSIFICATION AND THE HIERARCHY OF RETAIL FACILITIES IN SOUTH AFRICA
30
Actions to guide future retail development
Potential exists for big box retailers to complement the retail offerings close to regional and super regional centres. The same critical mass created by regional and super regional centres should be the guideline for further big box retailing. The concentration benefits of grouping a number of big box retailers together are important.
Big box development will mainly happen as part of the following:• Nodal/mixed use development close to large regional and super regional centres;• Part of strip developments and• Visible sites along highways.
Fewer of these have been built in recent times. These centres also focus on high visibility.
Role and function
The main focus of these centres/complexes is to provide more than the normal type of entertainment available in a regional centre. The gambling component is in most cases supplemented with other entertainment, mainly for children. The focus is mainly on eating facilities ranging from takeaway food products to exclusive restaurants. The retail component on offer varies. Some centres provide more retail stores than others. In most cases the retail is scaled down to make provision for more gambling facilities.
In a few cases the casino is directly linked to a large shopping centre and therefore complements each other.
Description and centre characteristics
The main focus is the casino with its gambling facilities. Up to 85% of the visitors visit the casino to gamble. The rest of the people are there to enjoy the other entertainment facilities like games, rides, eating places, cinemas and specialised retail stores. The Las Vegas model where major shopping facilities are provided is not really applicable in South Africa.
Most of the large casinos have a number of small and large theatres/arenas for shows and events. Where the casino and shopping centre are linked, a strong flow of pedestrians between the two facilities is required. More casinos consider linking up with larger shopping centre facilities.
6.2 ENTERTAINMENT/CASINOS

SEPTEMBER 2016
31
Location criteria
In most cases the casino is the destination while the retail facilities are supplementary to the gambling facilities. A good visible and accessible location is preferred to make a statement and to improve the awareness levels of the casino. The catchment area of a casino is much broader and the average drive time to different size casinos varies between 20 and 30 minutes.
Geographic segmentation
These centres are located in metropolitan cities and rural areas.

nurturing South Africa’s retail network
MAJOR RETAIL TYPES, CLASSIFICATION AND THE HIERARCHY OF RETAIL FACILITIES IN SOUTH AFRICA
32
Market characteristics and threshold values
This is a specialised retail/entertainment facility which caters for lower middle to high LSM groups.
Tenant mix
The tenant mix includes the following:
• casino/gambling facilities offering a wide variety and a large number of tables and play stations;• the focus is on eating facilities, ranging from takeaways to exclusive fine dining restaurants;• cinemas and theatres;• speciality retail facilities including shops like jewellers, book stores, different styles of fashion;• different types of kiosks and• banking and exchange services.
Actions to guide future retail development
In this regard, the most important guideline is that a licence is required to operate a casino. The size of the casino (measured in the number of gambling tables and slot machines) will determine the size of the retail facilities.
Examples
• MonteCasino, Johannesburg• Boardwalk Casino, Port Elizabeth• Hemmingways Casino, East London• Grand West, Cape Town• Gold Reef City, Johannesburg• Sun Coast Casino, Durban
Role and function
Lifestyle centres are also included in the ICSC definitions. This is not a popular format in South Africa.
The role of a lifestyle centre is to offer a unique retail shopping and entertainment experience in a relaxed and attractive environment. The emphasis is mostly on restaurants, entertainment and a more focused retail offering, including products that are rarely seen in South Africa. Lifestyle centres mainly have open air designs where the emphasis is on creating an appealing atmosphere. These centres are also based on a combined approach where the tenant mix and architectural style attract more affluent shoppers.
Description and centre characteristics
Lifestyle centres is unique and has a “feel good” atmosphere. It was an important retail development type in the USA during 2000-2010. Lifestyle centres in many cases form part of a bigger mixed use development. These developments also correspond with the concept of new urbanism where live, work, play and shop take place in one precinct. There is no agreed definition for a lifestyle centre amongst industry leaders and most regard this as an ordinary community or small regional centre.
6.3 LIFESTYLE CENTRES
SEPTEMBER 2016
33
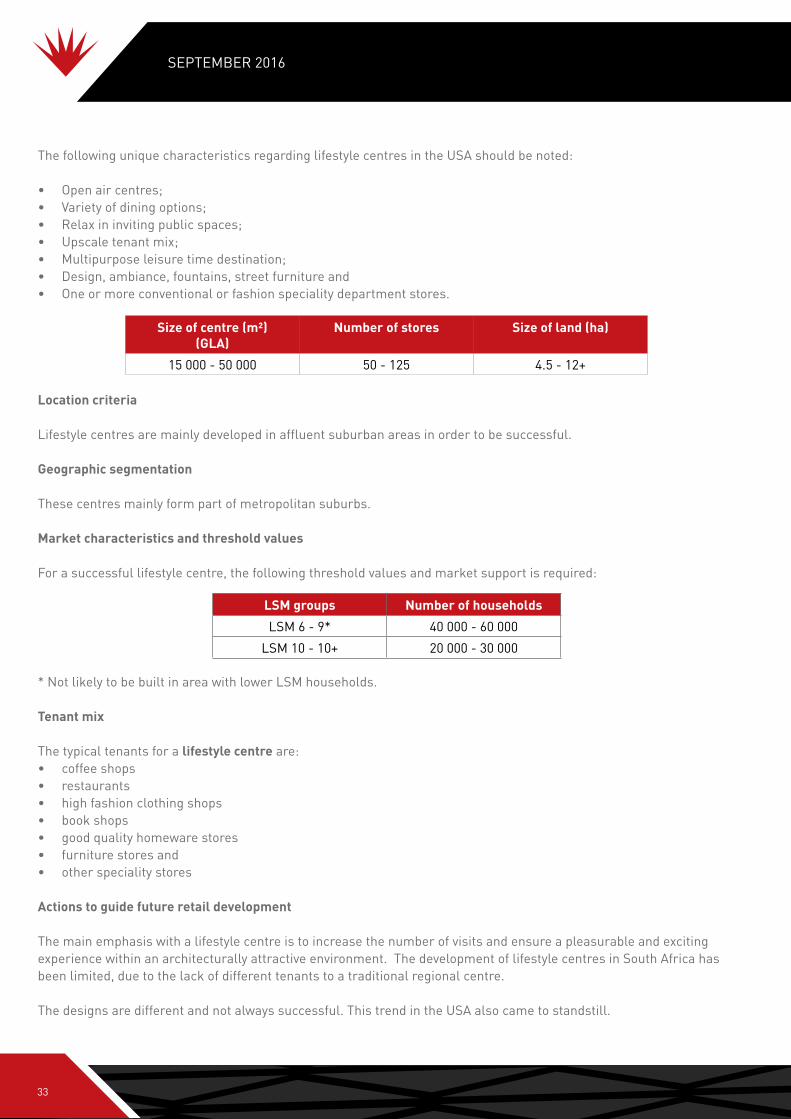
The following unique characteristics regarding lifestyle centres in the USA should be noted:
• Open air centres;• Variety of dining options;• Relax in inviting public spaces;• Upscale tenant mix;• Multipurpose leisure time destination;• Design, ambiance, fountains, street furniture and• One or more conventional or fashion speciality department stores.
Location criteria
Lifestyle centres are mainly developed in affluent suburban areas in order to be successful.
Geographic segmentation
These centres mainly form part of metropolitan suburbs.
Market characteristics and threshold values
For a successful lifestyle centre, the following threshold values and market support is required:
* Not likely to be built in area with lower LSM households.
Tenant mix
The typical tenants for a lifestyle centre are:• coffee shops• restaurants• high fashion clothing shops• book shops• good quality homeware stores• furniture stores and• other speciality stores
Actions to guide future retail development
The main emphasis with a lifestyle centre is to increase the number of visits and ensure a pleasurable and exciting experience within an architecturally attractive environment. The development of lifestyle centres in South Africa has been limited, due to the lack of different tenants to a traditional regional centre.
The designs are different and not always successful. This trend in the USA also came to standstill.
LSM groups Number of households
LSM 6 - 9* 40 000 - 60 000
LSM 10 - 10+ 20 000 - 30 000
Size of centre (m²)(GLA)
Number of stores Size of land (ha)
15 000 - 50 000 50 - 125 4.5 - 12+

nurturing South Africa’s retail network
MAJOR RETAIL TYPES, CLASSIFICATION AND THE HIERARCHY OF RETAIL FACILITIES IN SOUTH AFRICA
34
Examples
• Carlswald Lifestyle Centre, , Midrand• Lifestyle Garden Centre, Randburg• Lynnwood Bridge, Pretoria• Moffett on Main Lifestyle Centre, Port Elizabeth• Polokwane Lifestyle Centre, Polokwane• Six Fountains Lifestyle Centre, Pretoria• The Palms Décor and Lifestyle Centre, Woodstock, Cape Town.
Role and function
The role and function of a value centre are to compliment the retail facilities that are not necessarily represented in large regional and super regional centres. These centres do not necessarily offer a full range of goods compared to other centres in the hierarchy. They are usually limited to specific product types. Only a few clothing stores are represented in this type of centre.
These facilities should complement other retail offerings in a particular node or sub node. These centres should not duplicate and compete with adjacent/nearby regional and super regional centres. The emphasis is on quality products at affordable prices.
In some areas more than one value centre is found within the same node because of a variety of different products provided by different retailers. The best example is the very strong East Rand Mall precinct.
Most of these centres also offer a strong food/grocery component. The function therefore is destination, as well as convenience driven. A value centre should not be regarded as a discount centre which is of a lower quality as far as the product offering is concerned. The tenants in a value centre are of a much higher calibre. Many tenants require being close to a regional mall, but are not prepared to pay high rentals.
Description and centre characteristics
The value centres are mostly occupied by traders requiring large space and are destination orientated. The design and layout of the centre is open with parking in front of the stores. The quality of the building is good but basic, with no extra frills.
The smaller value centres in the metropolitan areas seem to be less successful.
Location criteria
There are basically two trends emerging from successful value centres, namely a location next to a regional centre, or a facility fulfilling a regional role like a Hyper store or Makro/Trade Centre. Alternative locations are highly visible and accessible along a main or national road which proves to be more successful.
6.4 VALUE CENTRES
Size of centre (m²)(GLA)
Number of stores Size of land (ha)
10 000 - 50 000 20 - 40 3 - 12+

SEPTEMBER 2016
35
Geographic segmentation
These centres mainly form part of metropolitan and city suburbs.

nurturing South Africa’s retail network
MAJOR RETAIL TYPES, CLASSIFICATION AND THE HIERARCHY OF RETAIL FACILITIES IN SOUTH AFRICA
36
Market characteristics and threshold values
Value centres are mainly capitalising on the catchment area serviced by regional and super regional centres. For a successful value centre the following threshold values and market support is required:
Park Meadows is located close to Eastgate.
Tenant mix
A value centre could have the following type of tenants:• Specialised retailers occupying a large space offering a wide variety of products at competitive prices e.g.
Incredible Connection, Hi-Fi Corporation and Toys R Us (so-called category killers);• Home improvement facilities like hardware, paint, furniture, tiles and interior decorating;• A number of specific clothing stores like Clothing City and Shoe City;• So-called factory shops;• Discounters and stores like Cash Convertors;• A grocery store (may vary from small to large hyper store) and• A small component fast foods and some eating places.
Actions to guide future retail development
Potential will mainly be driven by the presence or the absence of value retailers in a particular area. Smaller value centres seem to be less attractive than the larger value centres where the tenant mix is a strong draw card.
Socio-economic groups Number of households
LSM 6 - 9 40 000 - 60 000
LSM 10 - 10+ 20 000 - 30 000
Examples
• East Rand Value Mall, Boksburg• Fourways Crossing, Johannesburg• Hillfox Power Centre, Roodepoort• Menlyn Retail Park, Pretoria• Moffet Retail Park, Port Elizabeth• Retail Crossing West Rand, Roodepoort• Southgate Value Market, Johannesburg• Atterbury Value Mart, Pretoria• Capegate Value Centre, Cape Town

SEPTEMBER 2016
37
Geographic segmentation
These centres mainly form part of metropolitan and city suburbs.
Role and function
Hyper centres consist of a large hyper store. These centres were developed in the 1980s and 1990s and are a concept not favoured by developers and retailers any more. This is now replaced with a “Value Centre” where the hypermarket is one of the major tenants. A number of large Pick n Pay, Checkers and President Hypers have been built during the last 5 years.
Description and centre characteristics
A hyper centre is occupied by a single hyper store which sells groceries, hardware, appliances, clothing, furniture and household goods. A number of smaller line shops fill the rest of the space.
Location criteria
A major arterial road, usually a provincial road linked to a national road offering high accessibility and visibility.
6.5 HYPER CENTRES
Size of centre (m²)(GLA)
Number of stores
15 000 - 35 000 15 - 40
Average radius of primary trade area
Median travel time to the centre
Access requirements
6 - 8km 12 - 20min Strong correlation with a regional centre

nurturing South Africa’s retail network
MAJOR RETAIL TYPES, CLASSIFICATION AND THE HIERARCHY OF RETAIL FACILITIES IN SOUTH AFRICA
38
Tenant mix
A hyper centre consists mostly of the hyper store and a number of mainly convenience orientated stores which form a small part of the total floor area.
Actions to guide future retail development
The emphasis will be on larger value centres including hyper market facilities. New retailers like President Hyper have so far opened three stores in Gauteng and is very strong competition for existing hypermarkets.
Examples
• Pick n Pay Nicol Way, Bryanston• Little Falls Hypermarket, Roodepoort• 14 Avenue District Shopping Centre, Constantia Kloof, Roodepoort• President Hyper, Vereeniging• Brackenfell Centre, Brackenfell• Ottery Centre, Ottery, Cape Town
President Hyper

SEPTEMBER 2016
39
6.6 MOTOR SHOWROOMS AND RELATED FACILITIES
Role and function
The role and function of motor showrooms mainly display a variety of brands and models to create awareness and to attract buyers for different motor vehicle products
Description and centre characteristics
Motor showrooms are included as a specialist retail facility, and are not directly comparable to other shopping centre facilities.
Location criteria
The best located showrooms are located along major arterial routes, as well as highways with high visibility. Many of these showrooms are located along fast moving highways without real benefits for the drivers.
Geographic segmentation
These centres mainly form part of metropolitan areas, cities, towns and township areas.
Market characteristics and threshold values
The most important location criteria are more affluent areas and a large population.
Size of centre (m²)(GLA)
Number of stores
500 - 5 000 <4

nurturing South Africa’s retail network
MAJOR RETAIL TYPES, CLASSIFICATION AND THE HIERARCHY OF RETAIL FACILITIES IN SOUTH AFRICA
40
6.7 FILLING STATION STORESRole and function
Filling stations provide petrol sales and express convenience shopping for mainly two different markets:
• Local and passing motor vehicle traffic and• Express convenience shopping for commuters and residents living in close proximity.
Description and centre characteristics
This retail facility is located at filling stations and consists of a small store offering a variety of mainly daily purchased consumer goods (cool drinks, sweets, bread, milk and cigarettes) representing ±80% of all sales. The distinguishing factor for these ‘express convenience’ stores is that it is operated by filling station personnel only, and mostly operated on a 24-hour basis.
The latest stores include small Woolworths Food stores, Pick n Pay Express stores and Fresh Stop outlets. Larger filling stations offer takeaway facilities like Steers, Wimpy and specialised coffee shops like Mugg&Bean On-the-go. Readymade food is a key aspect of express convenience. These stores also offer parking and a 24-hour secure environment.
There is a trend that these stores are increasing in size and latest developments include stores of up to 600m².
Tenant mix
In most cases one or two manufacturers are located in one showroom. A number of showrooms may open in the same area. This is mainly done for comparative reasons and to capitalise on the same visible location. Used car facilities also open in the same areas.
Actions to guide future retail development
The potential will depend on economic conditions, interest rates and on the world markets. The local potential will depend on the disposable income of the residents in the area. There is a strong growth in motor ownership which will influence the new and used motor market.
New developments will mainly happen in new growth areas, infill developments and good locations in the metropolitan townships.
Examples
• Menlyn Motor City, Dealership & Home City, Pretoria• East Rand Precinct• William Nicol Drive, Bryanston• Gateway Precinct, Durban• Century City Precinct, Cape Town• Motor City, Strijdompark, Randburg
Size of centre (m²)(GLA)
Number of stores
30 - 600 1

SEPTEMBER 2016
41
Location criteria
Filling station stores are located at filling stations either on main arterial routes or on feeder roads at accessible locations within residential and commercial areas.
Locations• Main arterial roads leading to suburbs and commercial nodes;• Taxi ranks/CBDs and • Close to on and off ramps of national and provincial highways.
Geographic segmentation
Filling station stores are located everywhere ranging from metropolitan to rural areas.
Market characteristics and threshold values
Size of store will depend on:• Location of garage as reflected in the type of road, the accessibility and visibility of the site;• Number of litres petrol pumped per month;• Nature of immediate vicinity – could be the only convenience shopping destination in a particular area. The area
can form part of a residential area, a highway, commercial areas and any other accessible area with high motor/truck/bus/taxi volumes throughout the day.
Actions to guide future retail development
• Driven by filling station (petrol company) requirements;• High traffic volumes;• Outbound location preferred;• Inbound location at the edge of the city could also be considered;• High density residential area fulfils more a shopping role than a filling station role;• Very good visibility;• Stores/shops/facilities other than petrol;• Should be well signposted.
Filling station development will mainly happen as part of the following:
• Existing CBD and Town Centres• Infill areas• Existing suburbs and townships • New growth/Greenfield areas and• Developing rural areas
nurturing South Africa’s retail network
MAJOR RETAIL TYPES, CLASSIFICATION AND THE HIERARCHY OF RETAIL FACILITIES IN SOUTH AFRICA
42
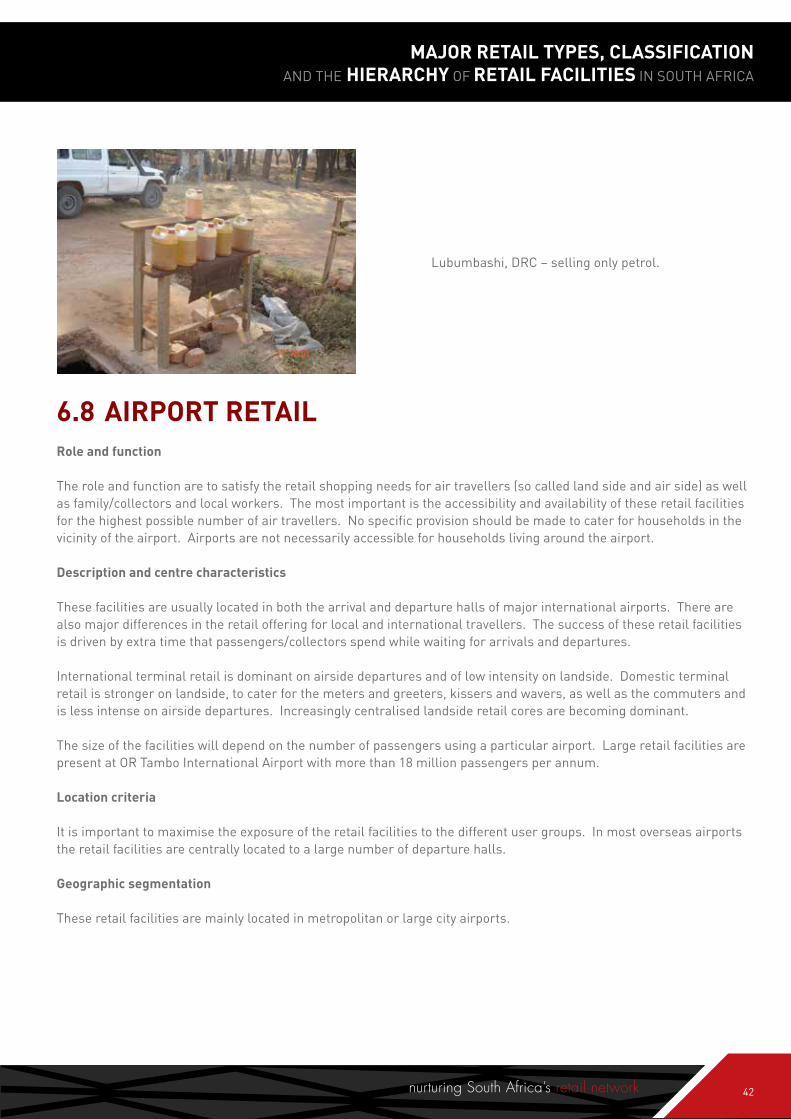
Role and function
The role and function are to satisfy the retail shopping needs for air travellers (so called land side and air side) as well as family/collectors and local workers. The most important is the accessibility and availability of these retail facilities for the highest possible number of air travellers. No specific provision should be made to cater for households in the vicinity of the airport. Airports are not necessarily accessible for households living around the airport.
Description and centre characteristics
These facilities are usually located in both the arrival and departure halls of major international airports. There are also major differences in the retail offering for local and international travellers. The success of these retail facilities is driven by extra time that passengers/collectors spend while waiting for arrivals and departures.
International terminal retail is dominant on airside departures and of low intensity on landside. Domestic terminal retail is stronger on landside, to cater for the meters and greeters, kissers and wavers, as well as the commuters and is less intense on airside departures. Increasingly centralised landside retail cores are becoming dominant.
The size of the facilities will depend on the number of passengers using a particular airport. Large retail facilities are present at OR Tambo International Airport with more than 18 million passengers per annum.
Location criteria
It is important to maximise the exposure of the retail facilities to the different user groups. In most overseas airports the retail facilities are centrally located to a large number of departure halls.
Geographic segmentation
These retail facilities are mainly located in metropolitan or large city airports.
Lubumbashi, DRC – selling only petrol.
6.8 AIRPORT RETAIL

SEPTEMBER 2016
43
Tenant mix
The emphases are mainly on food products with coffee shops and sit down fast food and pub restaurants. The tenant mix is also making provision for gifts, books, clothing and services. Duty free facilities are also very popular and occupy large areas of retail space. Lately, stores like Woolworths, Foschini, Truworths and other branded national clothing stores have opened facilities at the OR Tambo International Airport in South Africa.
Retail facilities at airports like Heathrow and Dubai offer very exclusive fashion, electronic ware and jewellery.
Role and function
CBDs in South Africa fulfil a city-wide destination for mainly township residents. The CBDs are also the focus point of public transport and the destination for the majority of workers in metropolitan areas. The CBDs offer a wide range of retail facilities, entertainment, browsing and opportunity to socialise. Most CBDs have a very strong support base and good retail performances.
On town level, the town centre fulfils a similar role catering for all town residents, as well as the farm/rural population. The function of retail in these towns has changed dramatically because of new labour laws. Town centres have become very important shopping destinations, especially over weekends.
A distinction is drawn between the older ‘unplanned’ centres of the inner city, including town and city central business districts where individual developments of CBD erven are not coordinated to complement adjacent or opposite erven developments.
The CBD/Town Centre areas range in size from the smaller towns to large metropolitan areas. These facilities are classified as unplanned or incremental because of the historical development in CBD/Town Centre areas and the incremental expansion over time.
Taxi rank and commuter centres form part of planned and unplanned retail facilities in CBD/Town Centres. Most facilities at the larger stations/taxi ranks form part of a planned structure, while most of the activities outside the building are unplanned and informal and will be discussed later.
These unplanned and incremental centres do not form part of the traditional hierarchy of shopping centres ranging from a small convenient centre up to a regional centre. The highest level according to the classification by Berry (1967) is the metropolitan CBD which developed as the strongest/largest retail offering. The CBD consists of planned, unplanned or incremental retail types that developed over many years.
The hierarchy of shopping facilities on the lowest levels of the whole spectrum of rural villages and urban settlements has received no or very little attention in the past. The town centre forms the basis of each tier of retail representation as part of this unplanned and incremental development of retail facilities.
7. MAJOR RETAIL TYPES: UNPLANNED RETAIL FACILITIES
7.1 CBD/TOWN CENTRES

nurturing South Africa’s retail network
MAJOR RETAIL TYPES, CLASSIFICATION AND THE HIERARCHY OF RETAIL FACILITIES IN SOUTH AFRICA
44
Description
CBD shopping facilities form part of street retailing and cater for the nearby residents, but mostly for the people moving in and out of the CBD on a daily basis. In recent years, the consumer base for CBD/Town Centres retailing has been dominated by lower LSM profiles. Most CBDs also have shopping centres as part of the total retail mix, but operate within the broader CBD context. Many of these centres are located close to the taxi /station facilities.
Market characteristics and threshold values
These centres are dependent on a large number of pedestrians coming to the area either to shop or to work. The outstanding characteristic is the dependence on public transport.
Tenant mix
A wide range of tenants can be seen in CBD/Town Centres, including the following:• large national clothing stores• furniture stores• homeware stores• fast food restaurants• supermarkets• cell phone shops/service centres• banking facilities and• lower quality clothing, furniture and other stores (mainly independent traders).
Trends and changes
The most important trend is the establishment of a very strong retail component, focusing mainly on the needs of LSM 1-7 shoppers. More focus has been placed on the revitalisation and redevelopment of CBDs lately. Cities like Cape Town have been very successful in creating an attractive living environment for more affluent households. Other metropolitan areas, like Durban, Johannesburg and Pretoria are also following this trend; however, the residential facilities in the CBD areas are of middle market standard.
There is a major need to upgrade the CBD/Town Centre facilities and to make sure that these facilities remain attractive for mainly the commuter, office and local resident market. CBDs also experience major competition from centres in the townships. The upgrade of retail facilities in the CBD of Johannesburg focused on more and better fashion stores as well as new coffee shops.
Size of centre (m²)(GLA)
Number of stores
10 000 - ±200 000 Depend on the size of the city/town/metropolitan area

SEPTEMBER 2016
45
Actions to guide CBD/Town Centre redevelopment
The focus should be on core areas, major streets and destinations en route to stations and taxi ranks. Poorly located retail facilities will become vacant, rundown and redundant. New retail facilities will mainly develop as upgraded and revitalised existing structures.
Safety and security play a major role in these developments, as well as the revitalisation of the entire CBD. Development guidelines will also have to include the rest of CBD activities, e.g. office development and redevelopment, pedestrian flows, secure areas and attractive environment.
The Boxer Superstore in Ladysmith
Informal traders In Lenasia
Role and function
The role and function of retail facilities at a transport break point are to provide variety retail products for large volumes of commuters using this particular precinct. The precinct usually includes a railway station, taxi and bus ranking facilities. The retail varies from formal shopping centres to informal traders all focusing on arriving and departing commuters.
7.2 TAXI RANK RETAIL/COMMUTER CENTRES

nurturing South Africa’s retail network
MAJOR RETAIL TYPES, CLASSIFICATION AND THE HIERARCHY OF RETAIL FACILITIES IN SOUTH AFRICA
46
Market characteristics and threshold values
The commuter volumes using different stations vary from 20 000 to 30 000 people per day. The key aspect is to ensure that the layout of the centre is such that pedestrians walk through the centre and do not bypass the retail facilities.
Location criteria
It is of utmost importance that any retail facility planned at the taxi rank/stations is placed in such a way that it attracts pedestrians through the centre. The micro location in this regard becomes of utmost importance. Should a centre be built in the opposite direction from the normal pedestrian flow patterns, the centre will be missed and will become less attractive and not successful. The positioning of the centre must therefore maximise the through flow of pedestrians.
Size of centre (m²)(GLA)
Number of stores
1 000 - 15 000 5 - 50
Description
The outstanding aspect in the case of taxi/commuter centres is the high pedestrian volumes throughout the day. The commuters using these transport breakpoint facilities usually do so because of two reasons namely:• to connect to other transport facilities or to change routes and• to work or shop in the area.
During these two actions, the shopping facilities are being used as express convenience or as a destination trip to buy specific products from the surrounding retail facilities.

SEPTEMBER 2016
47
Tenant mix
A wide range of tenants can be seen in taxi/commuter centres, including the following:• large national clothing stores• homeware stores like Jet Mart and Pep Home• fast-food restaurants• supermarkets• cell phone shops/service centres and• ATM facilities
Actions to guide taxi/commuter centre redevelopment
The potential for a shopping centre at this particular location will depend on train, bus and taxi commuter volumes.
The most important guidelines are:• to be aware of pedestrian volumes using the precinct on a daily basis;• to establish whether these volumes will be of a permanent basis and• to make sure that the centre is built to maximise the through flow of traffic.
Taxi/commuter centre development will mainly happen as part of the following:• CBD/Town Centre redevelopment• New taxi ranks and railway stations
Noord Street Taxi Rank, Johannesburg CBD

nurturing South Africa’s retail network
MAJOR RETAIL TYPES, CLASSIFICATION AND THE HIERARCHY OF RETAIL FACILITIES IN SOUTH AFRICA
48
In this regard a distinction is drawn between formally organised markets and spontaneous informal traders. The former is located and run from a built structure on a permanent basis. The informal traders do not occupy formal retail space and could move around during one particular day e.g. exposing their products for commuters arriving along one particular street during the morning, and along another street for commuters leaving the area in the afternoon.
Role and function
The main function is to provide convenience or speciality products from fixed or non-fixed premises. They also form part of subsistence economies in specific areas within cities/towns/rural areas.
Description
Distinguish between formal flea markets based on a fixed time and location at a permanent rented stand and informal trade which is something different with many product categories, no fixed operating hours or location, and no formal lease agreement exist.
Size
The informal trading space ranges from a few square meters up to ±50m². The stalls as part of a formal flea market also vary according to the same size categories and the whole offering varies based on the total volume of pedestrians/commuters. There is no fixed size and will depend on volumes, climatic conditions as well as tastes and preferences of the commuters.
Location criteria
Informal traders are dependent on large and regular volumes of passing pedestrian/vehicle traffic. These facilities are footloose (not at a fixed location) and will move to where pedestrians are.
Market characteristics and threshold values
The success of the informal traders is totally dependent on high passing pedestrian volumes.
Tenant mix
A variety of products are sold, including:• food • clothing and shoes • fruit and vegetables • electronic equipment and cell phones • cigarettes and • music and DVDs
Competition sometimes exists in the same area (within meters of each other).
The typical formal flea market offers similar products, but of better quality.
7.3 FLEA MARKETS/INFORMAL TRADE

SEPTEMBER 2016
49
Actions to guide informal trade/flea markets development
Potential of these facilities will mainly depend on the location and type of adjacent facilities.
In many cases, the informal sector within the CBD areas creates problems associated with dirtiness. A specific policy must be in place with regard to informal traders. As far as formal flea markets are concerned, the potential will mainly be determined by the product, the awareness of these facilities and the offering of unique product categories.
Informal traders on street level
Role and function
The function of Spaza shops should be regarded as part of the informal trade sector. In many cases this also forms part of the subsistence economic base. The function is merely to collect an extra income and to offer express convenience facilities to the immediate vicinity in poorer townships and suburban areas.
Description
The Spaza shop forms part of the dwelling unit or an outbuilding on a residential stand. This is an informal retail facility that first developed in the townships as a result of the lack of formal retail facilities in the area. Some of these stores are now also opening in the suburbs.
The premises consist mainly of a converted garage, a room in the house or small separate structure on the yard or on the pavement.
Size
The size of these stores is usually smaller than 50m², and in exceptional cases will be up to ±100m².
7.4 SPAZA SHOPS

nurturing South Africa’s retail network
MAJOR RETAIL TYPES, CLASSIFICATION AND THE HIERARCHY OF RETAIL FACILITIES IN SOUTH AFRICA
50
Location criteria
These stores can be found anywhere in a township or residential area, and although a location with high visibility is usually required, this is not always the case. These facilities usually cater for surrounding households ranging from 100 to 300 meters away, depending on the nature of the area and the level of competition.
Market characteristics and threshold value
These Spaza shops are mainly found in low and middle low socio economic areas. No specific market related guidelines exist in this regard. The opening of stores is mainly driven by entrepreneurship.
Product mix
A typical Spaza shop provides mainly convenience grocery goods needed on a day to day basis (similar to a garage store, but on a smaller basis). Liquor is sold from the taverns, in most cases without the necessary licenses.
Spaza Shop in Wolmaranstad

SEPTEMBER 2016
51
Retail development in the rural areas is unplanned in most cases, while lately the emphasis has been on the development of planned shopping centres. The type and size of the development will depend on the location of the rural town/village, as well as the attraction of larger towns and cities. Most of the developments can also be described as incremental developments.
The development history of rural retail development has its roots in the former homeland policies where a number of smaller settlements were established as towns and places of economic decentralisation.
Examples of retail centres are Kanyamazane near Nelspruit, Phokeng and Thlabane near Rustenburg and Elim near Makhado, all located close to the bigger towns. Retail in Giyani, located 120 km from Tzaneen, 150 km from Polokwane and 70km from Thohoyandou is an example of much stronger rural retail developments. Queenstown, Burgersfort, Lephalale, Umtata and QuaQua are all good examples of how distance from other retail developments has a major attraction to local shoppers
The whole hierarchy of shopping centre facilities is mainly applicable on all the appropriate levels/tiers in metropolitan areas, while only one or two planned retail types can be justified in rural areas. The required threshold values for large planned shopping centres are not achieved, and in most cases the largest facilities are in the order of a community centre. The rest of the retail forms part of the town/village centre occupied in small single free standing buildings on 2 or 3 tiers of the retail hierarchy.
Role and function
Rural retail development will mainly depend on the location and the total number of people living within the broader catchment area, transport to the rural node/town, the level of competition, the existing facilities and most importantly, the income of these households. Apart from the traditional town centre a number of community size centres have developed in the larger town/smaller cities lately.
Retail in these areas is usually very strong because of the very large trade areas. These trade areas normally coincide with the sphere of influence of a particular town which is influenced by schools, hospitals and other community facilities.
Description
These types of centres are in most cases built according to the profile and needs of the local residents. It is a very dynamic and challenging area for retail development.
Size
Rural centres mainly vary in size between 12 000m² and 50 000m². The size of the centres ranges from neighbourhood centres to large community/small regional centres. The size of the centre will depend on the threshold population within the town as well as the sub region. The town’s sphere of influence will play a major role in this regard.
Location criteria
The most important location criterion for rural retail development, is to establish itself in the main town/rural community close to taxi facilities and the main road running through the village or town. Distance to major towns plays a very important role in the success of retail facilities in these areas.
8. RURAL RETAIL DEVELOPMENT

nurturing South Africa’s retail network
MAJOR RETAIL TYPES, CLASSIFICATION AND THE HIERARCHY OF RETAIL FACILITIES IN SOUTH AFRICA
52
Market characteristics and threshold values
For a successful rural centre, the following threshold value and market support is required:
Very large numbers of households are required to warrant retail development. The emphasis is on the town centre with a number of small buildings on street level. Lately community size centres have developed in most of the larger rural communities.
Tenant mix
The tenant mix of these centres would usually comprise of food, clothing, furniture and services.
Actions to guide rural retail development
The number of households and level of income are of critical importance. The centre must be very close to the main taxi rank for the area. It can be expected that the outflow to the larger city areas will continue.
Example• Hazyview
LSM groups Households
LSM 1 - 5 30 000 - >200 000
Dayizenza Plaza near Hazyview.
South Africa is the 6th largest supplier in the world of shopping centre space. The different types of retail facilities indicated above clearly highlight the strength of this industry. The hierarchy of shopping centres makes provision for supplying different market segments with the required retail facilities.
Over the last 5 years, South Africa has also become a strong destination for international brands. Cotton On is one of the most successful international brands that have moved into the country lately. Four of their top 10 stores worldwide are located in South Africa. Other brands have followed with Zara, Top Shop, H&M and Hamley’s, and other more specialised boutique type stores moving into most of the super-regional centres.
The success of most of the 2 000 centres is driven by large population numbers, an affluent sector of the market, a growing middle class, and a strong lower-end market with very specific needs.
9. CONCLUSION

SEPTEMBER 2016
53
Core Classification
Summary Table: Classification And Hierarchy Of Retail Facilities In South Africa
TYPE OF CENTRE SIZE OF CENTRE (M²)(GLA) TRADE AREA ROLE AND FUNCTION GEOGRAPHIC
SEGMENTATION
Small free standing and convenience centre
500 – 5 0005-25 stores
Serves part of a suburb Offers express convenience
Part of metros and city suburbs
Neighbourhood centre ±5 000-±12 00025-50 stores
Centrally located for a group of suburbs
Convenience and express convenience role
Part of metropolitan and city suburbs and townships
Community centre ±12 000-±25 00050-100 stores
Strategically located to serve a suburban com-munity
Larger variety of convenience products to more households
Metros, cities, large towns and rural areas
Small regional/Large community centre
±25 000-±50 00075-150 stores
Specific sub region of city (can be large self contained community,i.e. Chatsworth)
Larger community and much wider tenant mix. More a community than regional role
Metros, cities, large towns and rural areas
Regional centre ±50 000-±100 000150-250 stores
Large region of city/or whole city/rural towns
Large primary and sec-ondary trade areas. Also support from tertiary trade area.Part of a business node
Metros, large cities and metro township areas
Super regional centre >100 000>250 stores
Large region in city and surrounding areas/Tourists
Serves whole metro, region, national and international visitors offering widest tenant mix
Metropolitan suburban

nurturing South Africa’s retail network
MAJOR RETAIL TYPES, CLASSIFICATION AND THE HIERARCHY OF RETAIL FACILITIES IN SOUTH AFRICA
54
NO. OF HOUSEHOLDS SOCIO-ECONOMIC SEGMENTS
TRADE AREAAVE RADIUS
(KM)
MEDIAN TRAVEL TIME(MINS) MAIN TENANTS
LSM 1-5, <10 000 LSM 6-9, <5 000 LSM 10-10+ <2 000
All LSM groups 1 – 1.5 <3 • small grocery store• few convenience
stores
LSM 1-5, (20 000-47 000)LSM 6-9, (9 000-20 000) LSM 10-10+(3 600-8 500)
AllLSM 4-10
2 4-9 • supermarket• convenience• some small
specialised stores
LSM 1-5, (44 000-102 000)LSM 6-9, (15 000-46 000) LSM 10-10+ (5 000-12 000)
AllLSM 4-10
3 6-14 • large supermarket(s)
• convenience• small national
clothing• restaurants &
takeaways• services
LSM 1-5, (90 000-209 000)LSM 6-9, (40 000-90 000) LSM 10-10+, (16 000-37 000)
AllLSM 4-10
3-5 10-16 • large supermarket(s)
• 1 or 2 large clothing anchors
• strong national tenant
• comparison goods component
• boutiques• restaurants• entertainment • services
LSM 1-5, (180 000-420 000)LSM 6-9, (80 000-185 000) LSM 10-10+, (33 000-76 000)
AllLSM 4-10
5-8 14-20 • large supermarkets • (even 2) or hyper• 3 or more large
clothing stores• small clothing
stores and boutiques
• international brands• entertainment,
restaurants• services• convenience
LSM 6-9, (106 000-250 000) LSM 10-10+, (44 000-101 000)
Above averageLSM 5-10
10+ 24-30 • Same as regional but more emphasis on entertainment and variety

SEPTEMBER 2016
55
A List/Focus/Niche Centres
TYPE OF CENTRE SIZE OF CENTRE (M²)(GLA) TRADE AREA ROLE AND FUNCTION GEOGRAPHIC
SEGMENTATION
Big Box Retailers Vary from 2 000 to 15 000
Depend on type of store or centre - mostly on regional level
Large single building with one shop offering specialist products
Metros and city suburbs
Entertainment/Casino
Vary from 10 000 to 50 000
Depend on type of store or centre - mostly on regional level
Offer gaming, entertainment, restaurants and retail facilities
Metros, cities and rural areas
Lifestyle Centre 15 000 – 50 000 (can be smaller or larger)
Upmarket trade areas Upmarket shopping in relaxed atmosphere
Metropolitan suburban
Value Centre 10 000 – 50 00020 – 40 stores
Next to regional sharing same trade area
Complement regional centres with stores not normally in regional centres
Metropolitan suburban and cities
Hyper Centre 15 000 – 35 00015-20 stores
Strong correlation with regional centre
Offer groceries, hardware, appliances, clothing, furniture, household goods in large store
Metropolitan suburban and cities
Motor Showrooms 500 -5 000 Display and sell variety of car brands and models
Metros to rural
Filling Stations 30 - 600 Local & through traffic plus nearby households
Service through traffic and local households with express convenience
Metros to rural
Airport Retail 1 000 – 20 00010-100 stores
Size of airport will determine size of retail
Satisfy retail needs of travellers, family, collectors and workers
Metropolitan and large city airports

nurturing South Africa’s retail network
MAJOR RETAIL TYPES, CLASSIFICATION AND THE HIERARCHY OF RETAIL FACILITIES IN SOUTH AFRICA
56
NO. OF HOUSEHOLDS SOCIO-ECONOMIC SEGMENTS
TRADE AREAAVE RADIUS
(KM)
MEDIAN TRAVEL TIME(MINS) MAIN TENANTS
LSM 6-9, (±25 000) LSM 10-10+, (±14 000)
Mainly above averageLSM 7-10
5-10 10-30 • specialist traders
LSM 6-9(40 000-60 000) LSM 10-10+(20 000+)
Average and higherLSM 5-10
5-30 10-30 • specialist traders/ entertainment and/or theme centre
• emphasis on food, restaurants & fast food outlets
LSM 6-9(40 000-60 000) LSM 10-10+(20 000-30 000)
Mainly LSM 9-10
3-8 6 - 15 • upscale supermarket
• book stores• dining• entertainment• speciality retail
(house/home/ garden)
• fresh produce stores
LSM 6-9(40 000-60 000) LSM 10-10+(20 000-30 000)
Middle to above averageLSM 6-10
3-6 10-15 • emphasis on big box retailers
• specialist retailers• home improvement• small to large
groceries
LSM 10-10+(21 400 - 50 000)LSM 6-9(60 000– 100 000)
Middle to above averageLSM 5-10
6-8 10-15 • one hyper store • (70% of area)• convenience line
stores• services
Higher LSM suburbs
Depend on size and location of filling station
All LSM 4-10 • convenience store• ATM• fast food• car wash
Mainly higher LSM • mainly food• curio’s & souvenirs• clothing• exchange services

SEPTEMBER 2016
57
Unplanned/Incremental Classifications
TYPE OF CENTRE SIZE OF CENTRE (M²)(GLA) TRADE AREA ROLE AND FUNCTION GEOGRAPHIC
SEGMENTATION
CBD /Town Centre
Vary from 10 000 to 200 000 Number of stores depend on size of city/town
Metro/city wide Provide retail facilities to workers and township commuters and shoppers
Metropolitan and city CBD and town centre
Taxi Rank Retail / Commuter Centre
10 000 to 15 000Depending on size and importance of station
Metro/city wide Provide retail facilities to workers and township commuters and shoppers
Metropolitan and city CBD and town centre
Flea Markets /Informal Trade
Vary from a few stands to hundreds of stands
Focusing on passing pedestrian volumes
Serve community and festive shoppers.High pedestrian volume areas
Metros, cities and towns
Spaza Shops 10 – 50 Provide for surrounding residents – Walking distance 100m
Express convenience Township and rural areas
Rural Retail Development
5 000 – 50 000 Whole community up to 50km
Service whole community
Rural areas

nurturing South Africa’s retail network
MAJOR RETAIL TYPES, CLASSIFICATION AND THE HIERARCHY OF RETAIL FACILITIES IN SOUTH AFRICA
58
NO. OF HOUSEHOLDS SOCIO-ECONOMIC SEGMENTS
TRADE AREAAVE RADIUS
(KM)
MEDIAN TRAVEL TIME(MINS) MAIN TENANTS
Linked to metro/city or rural area
DominantLSM 3-8
Not fixed-Up to 50 km
Mainly by taxi Wide variety of tenants including:• national tenants• supermarkets• homeware stores• furniture stores• cell phone shops• banking facilities
Linked to metro/city or rural area
MainlyLSM 1-6
Not fixed-Up to 50 km
20 minutes plus • national tenants• supermarkets• homeware stores• fast food outlets• cell phone shops• ATM facilities
Not applicable MainlyLSM 1-6
Part of larger town/ rural trade area
Passing by • food• clothing and shoes• fruit and vegetables• electronic
equipment and cell phones
• music and DVDs
200 - 400+ MainlyLSM 1-6
Up to 100m Up to 5 minutes walking distance
• convenience grocery goods
• cigarettes
20 000 - 210 000 MainlyLSM 1-5
Very wide up to 80 km Up to 45 minutes • depend on the size – need to focus on the needs of the surrounding community

SEPTEMBER 2016
59
Allan, J., Massey, D. & Pryke, M. Unsettling Cities. Movement/Settlements. Routledge, London, 1999.
Berry, B.J.L. Geography of market centres and retail distribution. Prentice Hall. London, 1967.
Bureau of Market Research. Total household cash expenditure patterns, 2005/2008.
Carter, H. The Study of Urban Geography. Arnold. London, 1995.
Clark, D. Urban World/Global Cities. Routledge. London, 1996.
Davies, R.L. & Rogers, D.S. 1985. Store Locations and Store Assessment Research. John Wiley & Sons, Inc. New York, 1985.
Dawson, J.A. Retail Geography. John Wiley and Sons. New York, 1980.
Development Bank of South Africa, 1998.
DeLisle J. R. US Shopping Centre Classifications: Challenges and Opportunities.Research Review. Volume.12, no. 2, 2005.
Ghosh, A. & Mclafferty, S.L. Location Strategies for Retail and Service Firms. Lexington Books. Toronto, 1987.
Ghyoot, V.G. Feasibility Analysis for Proposed Shopping Centres with special emphasis on trade area demarcation. D.Com. University of South Africa. Pretoria, 1992.
Hall, T. Urban Geography. Routledge. London, 1998.
Herbert, D.T. & Thomas, C.J. Cities in Space City as Place. Third Edition. David Fulton Publishers. London, 1998.
Herbert, D.T. & Thomas C. J. Cities in Space, City as Place. David Fulton Publishers, London, 1997.
Hines, M.A. Shopping Centre Development and Investment. John Wiley & Sons. New York, 1987.
International Council of Shopping Centres. Shopping Centre Definitions: Basic Configurations and Types for the United States. New York, 2004 and 2015.
International Council of Shopping Centres (ISCS). Towards a Pan-European Shopping Centre Standard. Excerpt from ISCS Research. A framework for International Comparisons. New York, 2005 and ICSC Research, 2005.
International Council of Shopping Centres (ISCS). Country Fact Sheets. New York, 2015 and ICSC Research.
Jones, K.G. & Simmons, J.W. The Retail Environment. Routledge. New York, 1990.
Kahn, M. Change and Evolution of Shopping Centres. Paper delivered at the 1988 Conference of the Institute of Town and Regional Planners. Sun City, Oct 1988.
Kahn, M. Regional Shopping Centres Research Project : A Study of Shopping in Metropolitan Durban. The Natal Town and Regional Planning Commission. 1983. (ISBN 0 909232 35 0)
10. BIBLIOGRAPHY / REFERENCES

nurturing South Africa’s retail network
MAJOR RETAIL TYPES, CLASSIFICATION AND THE HIERARCHY OF RETAIL FACILITIES IN SOUTH AFRICA
60
Mason, J.B. Mayer, M.L. & Ezell, H.F. Retailing. Third edition. . Fulton, London, 1998.
McGoldrich, P.J. Retail marketing. McGraw Hill. London, 1990.
Roca, R.A. et al. Market Research for Shopping Centres, International Council of Shopping Centres. New York, 1988.
Rogers, D.S. Retail Location Analysis in Practice: Retail site analysis is much more than “location location location”. Research Review. Volume 14, no 2, 2007.
Shopping centre development handbook. Second edition. Urban Land Institute. Washington, 1985.
South African Advertising Research Foundation (SAARF). Living Standards Measure Classification (LSM) 2015.
South African Council of Shopping Centre Directory. Johannesburg, 1993-2015.
Urban Studies own database, 2006-2016.
Stats SA Population Census, 2001/2011/2015.
White, J.R. & Gray, K.D. Shopping centres and other retail properties: Investment, development, financing and management. Wiley. New York, 1996.
Wringley, N. ed. Store Choice, Store Location and Market Analysis. Routledge. London, 1988.

SEPTEMBER 2016
61
NOTES

nurturing South Africa’s retail network
MAJOR RETAIL TYPES, CLASSIFICATION AND THE HIERARCHY OF RETAIL FACILITIES IN SOUTH AFRICA
62

For more information, visit www.sacsc.co.za or call 010 003 0228
DR Dirk A PrinslooAUTHOR
URBAN STUDIES