major vegetables and rootcrops - psa.gov.ph bulletin 2016 jan... · updates on production of major...
TRANSCRIPT

ISSN 2094-618x Volume 10 No. 1 Quezon City, Philippines
January-March 2016
PHILIPPINE STATISTICS AUTHORITY
Major Vegetables and Rootcrops
Quarterly Bulletin
If you want to know more about these statistics write or call Crops Statistics Division
(02) 376-2022 o PSA Website: http//www.psa.gov. ph

Photos Illustration by: Quirino G. Santos Jr. Knowledge Management and Communication Division (KMCD) Philippine Statistics Authority
FOREWORD
The Major Vegetables and Rootrops Quarterly Bulletin provides updates on production of major vegetables and rootcrops, namely, mongo, peanut, cabbage, eggplant, tomato, garlic, onion, sweet potato, and cassava. These crops are highlighted in the report on the Performance of Agriculture that the Philippine Statistics Authority (PSA) releases quarterly. The 1st quarter 2016 issue of the Bulletin presents the preliminary estimates of production for January-March 2016. The main source of data is the quarterly Crop Production Survey (CrPS) of the PSA.
LISA GRACE S. BERSALES, Ph. D. National Statistician
Quezon City, Philippines June 2016
i

TABLE OF CONTENTS
Foreword i Table of Contents ii Technical Notes iv Mongo 2 Peanut 4 Cabbage 6 Eggplant 8 Tomato 10
Garlic 12 Red and Yellow Onion 14 Multiplier Onion 16 Sweet Potato 18 Cassava 20
List of Tables
Table 1. Vegetables and Rootcrops: Volume of production in 23 metric ton, Philippines, January-March 2015-2016P
Table 2. Mongo: Volume of production, by region, Philippines, 24 January-March 2015-2016P
Table 3. Peanut: Volume of production, by region, Philippines, 25 January-March 2015-2016P
Table 4. Cabbage: Volume of production, by region, Philippines, 26 January-March 2015-2016P
Table 5. Eggplant: Volume of production, by region, Philippines, 27 January-March 2015-2016P
Table 6. Tomato: Volume of production, by region, Philippines, 28 January-March 2015-2016P
Table 7. Garlic: Volume of production, by region, Philippines, 29 January-March 2015-2016P
Table 8. Red and Yellow Onion: Volume of production, by region, 30 Philippines, January-March 2015-2016P
Table 9. Multiplier Onion: Volume of production, by region, Philippines, 31 January-March 2015-2016P
Table 10. Sweet Potato: Volume of production, by region, Philippines, 28 January-March 2015-2016P
Table 11. Cassava: Volume of production, by region, Philippines, 28 January-March 2015-2016P
ii
List of Figures
Figure 1. Mongo production by region, Philippines, January-March 2016 1 Figure 2. Mongo: Top Producing Regions, Philippines, January-March 2016 2 Figure 3. Peanut production by region, Philippines, January-March 2016 3 Figure 4. Peanut: Top Producing Regions, Philippines, January-March 2016 4 Figure 5. Cabbage production by region, Philippines, January-March 2016 5 Figure 6. Cabbage: Top Producing Regions, Philippines, January-March 2016 6 Figure 7. Eggplant production by region, Philippines, January-March 2016 7 Figure 8. Eggplant: Top Producing Regions, Philippines, January-March 2016 8 Figure 9. Tomato production by region, Philippines, January-March 2016 9 Figure 10. Tomato: Top Producing Regions, Philippines, January-March 2016 10 Figure 11. Garlic production by region, Philippines, January-March 2016 11 Figure 12. Garlic: Top Producing Regions, Philippines, January-March 2016 12 Figure 13. Red and Yellow Onion production by region, Philippines, 13
January-March 2016 Figure 14. Red and Yellow Onion: Top Producing Regions, Philippines, 14
January-March 2016 Figure 15. Multiplier Onion production by region, Philippines, January-March 2016 15 Figure 16. Multiplier Onion: Top Producing Regions, Philippines, January-March 2016 16 Figure 17. Sweet Potato production by region, Philippines, January-March 2016 17 Figure 18. Sweet Potato: Top Producing Regions, Philippines, January-March 2016 18 Figure 19. Cassava production by region, Philippines, January-March 2016 19 Figure 20. Cassava: Top Producing Regions, Philippines, January-March 2016 20
ii iii
P – Preliminary
Table 11. Cassava: Volume of production by region, Philippines, January-March 2015-2016P
33

TECHNICAL NOTES Production refers to the quantity produced and actually harvested for a particular crop during the reference period. For other crops, area planted refers to the actual physical area planted while area harvested refers to the actual area from which harvests are realized. Estimates of production and area planted/harvested are generated from the Quarterly Crops Production Survey (CrPS) of which there are four survey rounds in a year, that is, February, May, August, and November.
iv
P – Preliminary
Table 9. Multiplier Onion: Volume of production by region, Philippines, January-March 2015-2016P
31

1
Figure 1. Mongo production by region, Philippines, January-March 2016
P – Preliminary
Table 8. Red and Yellow Onion: Volume of production by region, Philippines, January-March 2015-2016P
30

2
Mongo
For January-March 2016, production of mongo was estimated at 7.35 thousand mt. This was 0.7 percent higher than last year’s 7.30 thousand mt brought about by the following factors: o more utilization of areas previously planted with palay in Tarlac, Antique,
and Iloilo; o seeds distribution by the Department of Agriculture-Local Government
Units (DA-LGU) in Bulacan;
o lesser occurrence of downy mildew and pod rot diseases in Ilocos Sur; and
o better pods harvested due to early control of bean fly, thrips, and aphids in Ilocos Norte.
Lower production was noted in Pangasinan due to shifting to yellow corn
production attributed to availability of hybrid planting material (Hybrid Sweet Purple).
Ilocos Region topped all the mongo producing regions with 2.96 thousand mt contributing 40.3 percent share to the national output. This was followed by Western Visayas with 19.6 percent share and Autonomous Region in Muslim Mindanao (ARMM) with 10.3 percent (Figure 2).
Figure 2. Mongo: Top Producing Regions, Philippines, January–March 2016
Table 7. Garlic: Volume of production by region, Philippines, January-March 2015-2016P
P – Preliminary
29

28 3
33
Figure 3. Peanut production by region, Philippines, January-March 2016
P – Preliminary
Table 6. Tomato: Volume of production, Philippines, January-March 2015-2016P

3
4 27
Peanut
The first quarter 2016 production of peanut at 11.04 thousand mt was 7.8 percent lower than last’s years 11.98 thousand mt. The drop in output was caused by the following:
o decrease in area planted in Pangasinan due to unavailability of seeds; o damages brought by Typhoon “Nona” during pod development in Cagayan; o lesser area planted coupled with lower yield due to drought in
SOCCSKSARGEN and intense heat in Iloilo; and o shifting of some areas to mongo production in Tarlac due to increase in
demand.
Ilocos Region recorded the highest production at 6.78 thousand mt and shared 61.3 percent to total peanut production this quarter. Northern Mindanao came next with 6.8 percent followed by Western Visayas with 6.5 percent (Figure 4).
Figure 4. Peanut: Top Producing Regions, Philippines, January–March 2016
P – Preliminary
Table 5. Eggplant: Volume of production by region, Philippines, January-March 2015-2016P
July-September and October-December 2014-2015

26 5
Figure 5. Cabbage production by region, Philippines, January-March 2016
P – Preliminary
Table 4. Cabbage: Volume of production by region, Philippines, January-March 2015-2016P

6 25
Cabbage
In January-March 2016, cabbage production decreased by 1.0 percent, from 32.64 thousand mt in 2015 to 32.31 thousand mt this year. The negative output was attributed to the following: o lesser area planted due to insufficient water supply caused by dry spell
in Benguet and drought in SOCCSKSARGEN; and o temporarily shifting to lettuce production in Mountain Province to minimize
the attack of pests.
Higher production in some areas were due to the following:
o increase in yield attributed to enough supply of irrigation water in Cebu; o additional area planted in Cagayan due to availability of seeds and financial
assistance from private lenders; and o expansion in area and control of diamondback moth in Ilocos Sur.
Cordillera Administrative Region (CAR) produced 24.91 thousand mt and
contributed 77.1 percent to total cabbage production during the reference period (Figure 6).
Figure 6. Cabbage: Top Producing Regions, Philippines, January–March 2016
P – Preliminary
Table 3. Peanut: Volume of production by region, Philippines, January-March 2015-2016P
24 7
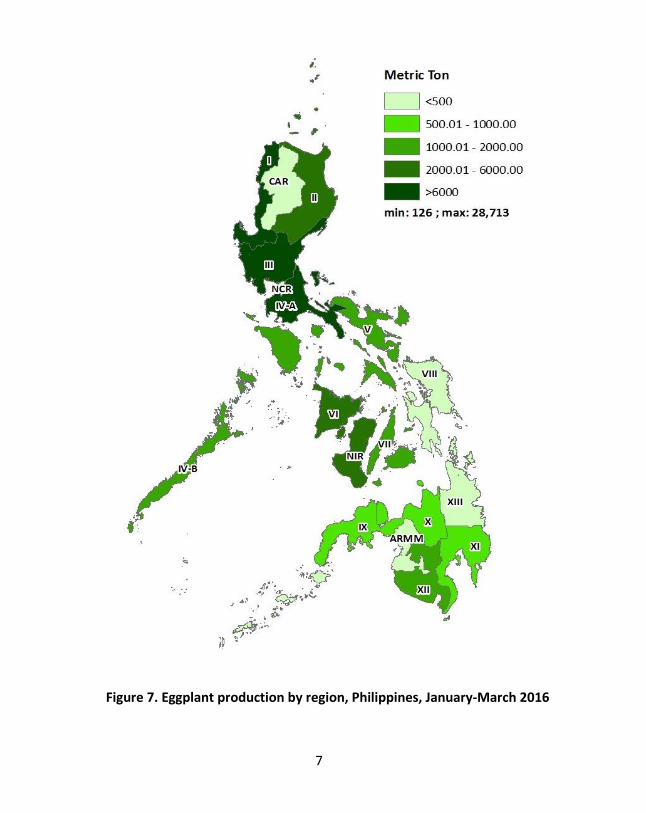
Figure 7. Eggplant production by region, Philippines, January-March 2016
P – Preliminary
Table 2. Mongo: Volume of production by region, Philippines, January-March 2015-2016P January-March, April-June and January-June 2013-2014

23 8 8
Eggplant
During the January–March 2016 period, production of eggplant slightly decreased by 0.2 percent, from 76.50 thousand mt in 2015 to 76.36 thousand mt this year. Among the factors that contributed to the decline were the following: o insufficient supply of water during the vegetative stage of the crop coupled
with the attack of fruit borer in Quezon; o some areas planted to eggplant in Isabela and Nueva Ecija were flooded due
to Typhoon “Nona”; and o lesser area planted and lower yield in SOCCSKSARGEN due to drought.
Positive growths were noted in some areas due to: o shifting of some areas from white corn to eggplant production in Pangasinan
due to availability of seeds from DA-LGU coupled with the control of fruit flies;
o sustained usage of high yielding varieties distributed by DA-LGU in Ilocos Norte and Ilocos Sur;
o more areas were utilized due to non-planting of 2nd crop palay in Iloilo; and o improved yield in Tarlac due to efficient use of fertilizer.
The major producers of eggplant and their respective shares were Ilocos Region, 37.6 percent; CALABARZON, 18.6 percent; and Central Luzon, 15.4 percent (Figure 8).
Figure 8. Eggplant: Top Producing Regions, Philippines, January – March 2016
P- Preliminary
Table 1. Vegetables and Root Crops: Volume of production, Philippines, January-March 2015-2016P
2015 2016P
Mongo 7,298 7,348 0.7
Peanut 11,981 11,044 (7.8)
Cabbage 32,643 32,308 (1.0)
Eggplant 76,497 76,360 (0.2)
Tomato 89,930 87,681 (2.5)
Garlic 9,754 7,861 (19.4)
Onion 121,770 75,539 (38.0)
Red and Yellow 96,064 50,600 (47.3)
Multiplier 25,706 24,939 (3.0)
Sweet Potato 117,198 113,386 (3.3)
Cassava 541,390 580,817 7.3
CropsProduction (mt) Percent
Change

STATISTICAL TABLES
9
Figure 9. Tomato production by region, Philippines, January-March 2016

10
Tomato
Production of tomato in the first quarter of 2016 reached 87.68 thousand mt. This was 2.5 percent lower than the 89.93 thousand mt level in 2015. The drop in output was brought about by the following: o decrease in contract growing scheme of Northern Foods Corporation (NFC)
in Ilocos Sur while some areas were shifted to yellow corn production. o lesser area planted in Pangasinan due to low price last year; o wilting of flowers due to intermittent rains and intense heat in Quezon; and
o lesser area planted in Bukidnon due to dry spell.
Increases in production were reported in some areas due to: o efficient use of fertilizer in Nueva Ecija resulting to bigger fruits harvested;
o seeds distribution by DA-LGU in Bulacan; and
o utilization of areas not planted with palay during the second cropping season in Iloilo.
Ilocos Region, the top producer recorded production of 38.07 thousand mt and shared 43.4 percent to the national total. Central Luzon followed with 19.3 share and CALABARZON with 12.6 percent (Figure 10).
Figure 10. Tomato: Top Producing Regions, Philippines, January–March 2016

11 20
Figure 11. Garlic production by region, Philippines, January-March 2016
Cassava
In the first quarter 2016, production of cassava grew by 7.3 percent, from 541.39 thousand mt in 2015 to 580.82 thousand mt this year. The positive growth was attributed to the following:
o increase in demand for feeds use from cassava feed millers and marketing
assistance from San Miguel Corporation in Isabela, Cagayan, and Quirino. o bigger tubers harvested in Bohol due to use of high yielding variety (Rayong);
and
o expansion in area planted in Leyte due to technical assistance such as good farm management practices conducted by non-governmental organizations (NGO).
Lower production were noted in some areas due to the following: o smaller tubers harvested in Bukidnon, Misamis Occidental, Tawi-tawi, and Sulu
due to the effect of dry spell; and o lesser area planted in South Cotabato due to drought.
Northern Mindanao recorded the biggest production at 182.88 thousand mt and shared 31.50 percent to the country’s cassava output. Cagayan Valley followed with 17.6 percent share, and ARMM with 16.9 percent (Figure 20).
The major producing regions this quarter were Northern Mindanao with the
highest production at 182.88 thousand mt at 31.5 percent of the country’s
cassava output. Followed by Cagayan Valley with 17.6 share, and ARMM with
16.9 percent.
Figure 20. Cassava: Top Producing Regions, Philippines, January – March 2016

12 19
Garlic
For the first quarter of 2016, garlic production was estimated at 7.86 thousand mt, 19.4 percent lower than last year’s 9.75 thousand mt. The decrease was attributed to the following: o in Ilocos Norte, smaller bulbs were harvested due to unfavorable weather
condition which affected bulb formation. Some areas were shifted to yellow corn and peanut production due to low price during the planting season; and
o lesser areas were planted in Occidental Mindoro because of anticipation of El Niño.
Ilocos Region contributed 70.3 percent share to the country’s total output (Figure 12).
Figure 12. Garlic: Top Producing Regions, Philippines, January–March 2016
Figure 19. Cassava Production by region, Philippines, January-March 2016

18 13
Sweet Potato
In the first quarter of 2016, sweet potato production went down to 113.39 thousand mt, from 117.20 thousand mt level in 2015 or a decrease of 3.3 percent. This was attributed to the following: o smaller tubers harvested in Negros Oriental and Guimaras due to insufficient
soil moisture caused by intense heat; o lesser area planted in Iloilo due to insufficient rains during the planting
season; and
o lower yield in Leyte as tubers were damaged by weevils due to changing weather condition.
Increases in production were noted in some areas due to the following: o additional area harvested in Caraga;
o non-occurrence of weevils in Pangasinan; and
o favorable weather condition in Albay which resulted to bigger tubers harvested.
The top producing regions and their respective shares during the quarter were Bicol Region with 20.7 percent; Eastern Visayas, 13.0 percent; and Western Visayas, 9.5 percent (Figure 18).
Figure 18. Sweet Potato: Top Producing Regions, Philippines, January – March 2016
Figure 13. Red and Yellow Onion Production by region, Philippines, January-March 2016

14 17
Figure 17. Sweet Potato Production by region, Philippines, January-March 2016
Red and Yellow Onion
For January-March 2016 period, production of red and yellow onion dropped by 47.3 percent, from 96.06 thousand mt in 2015 to 50.60 thousand mt this year. The decline in output could be accounted to the following: o in Nueva Ecija, there were damages on standing crops due to Typhoon
“Lando” in October 2015. Some replantings done in December were also damaged by Typhoon “Nona” in the same month. The attack of army worms also affected the drop in production in the same province.
o damages on seedlings caused by Typhoon “Nona” in Oriental Mindoro;
o lesser area planted in Occidental Mindoro due to oversupply last year that
resulted to low price; and
o drop in yield in Pangasinan due to bulb rot disease.
Central Luzon registered the biggest production at 38.49 thousand mt which represented 76.1 percent of the country’s onion production. The other major producing regions were Cagayan Valley with 13.8 percent share and Ilocos Region with 6.1 percent (Figure 14).
Figure 14. Red and Yellow Onion: Top Producing Regions, Philippines, January–March 2016

16 15
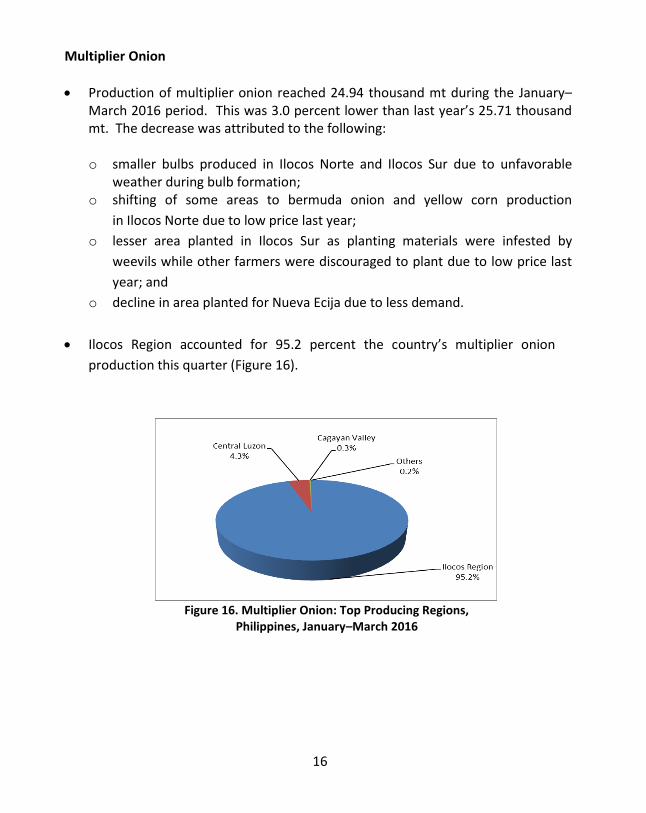
Multiplier Onion
Production of multiplier onion reached 24.94 thousand mt during the January–March 2016 period. This was 3.0 percent lower than last year’s 25.71 thousand mt. The decrease was attributed to the following:
o smaller bulbs produced in Ilocos Norte and Ilocos Sur due to unfavorable
weather during bulb formation; o shifting of some areas to bermuda onion and yellow corn production
in Ilocos Norte due to low price last year;
o lesser area planted in Ilocos Sur as planting materials were infested by
weevils while other farmers were discouraged to plant due to low price last
year; and
o decline in area planted for Nueva Ecija due to less demand.
Ilocos Region accounted for 95.2 percent the country’s multiplier onion
production this quarter (Figure 16).
Figure 16. Multiplier Onion: Top Producing Regions, Philippines, January–March 2016
Figure 15. Multiplier Onion Production by region, Philippines, January-March 2016
16 15
Multiplier Onion
Production of multiplier onion reached 24.94 thousand mt during the January–March 2016 period. This was 3.0 percent lower than last year’s 25.71 thousand mt. The decrease was attributed to the following:
o smaller bulbs produced in Ilocos Norte and Ilocos Sur due to unfavorable
weather during bulb formation; o shifting of some areas to bermuda onion and yellow corn production
in Ilocos Norte due to low price last year;
o lesser area planted in Ilocos Sur as planting materials were infested by
weevils while other farmers were discouraged to plant due to low price last
year; and
o decline in area planted for Nueva Ecija due to less demand.
Ilocos Region accounted for 95.2 percent the country’s multiplier onion
production this quarter (Figure 16).
Figure 16. Multiplier Onion: Top Producing Regions, Philippines, January–March 2016
Figure 15. Multiplier Onion Production by region, Philippines, January-March 2016

14 17
Figure 17. Sweet Potato Production by region, Philippines, January-March 2016
Red and Yellow Onion
For January-March 2016 period, production of red and yellow onion dropped by 47.3 percent, from 96.06 thousand mt in 2015 to 50.60 thousand mt this year. The decline in output could be accounted to the following: o in Nueva Ecija, there were damages on standing crops due to Typhoon
“Lando” in October 2015. Some replantings done in December were also damaged by Typhoon “Nona” in the same month. The attack of army worms also affected the drop in production in the same province.
o damages on seedlings caused by Typhoon “Nona” in Oriental Mindoro;
o lesser area planted in Occidental Mindoro due to oversupply last year that
resulted to low price; and
o drop in yield in Pangasinan due to bulb rot disease.
Central Luzon registered the biggest production at 38.49 thousand mt which represented 76.1 percent of the country’s onion production. The other major producing regions were Cagayan Valley with 13.8 percent share and Ilocos Region with 6.1 percent (Figure 14).
Figure 14. Red and Yellow Onion: Top Producing Regions, Philippines, January–March 2016

18 13
Sweet Potato
In the first quarter of 2016, sweet potato production went down to 113.39 thousand mt, from 117.20 thousand mt level in 2015 or a decrease of 3.3 percent. This was attributed to the following: o smaller tubers harvested in Negros Oriental and Guimaras due to insufficient
soil moisture caused by intense heat; o lesser area planted in Iloilo due to insufficient rains during the planting
season; and
o lower yield in Leyte as tubers were damaged by weevils due to changing weather condition.
Increases in production were noted in some areas due to the following: o additional area harvested in Caraga;
o non-occurrence of weevils in Pangasinan; and
o favorable weather condition in Albay which resulted to bigger tubers harvested.
The top producing regions and their respective shares during the quarter were Bicol Region with 20.7 percent; Eastern Visayas, 13.0 percent; and Western Visayas, 9.5 percent (Figure 18).
Figure 18. Sweet Potato: Top Producing Regions, Philippines, January – March 2016
Figure 13. Red and Yellow Onion Production by region, Philippines, January-March 2016

12 19
Garlic
For the first quarter of 2016, garlic production was estimated at 7.86 thousand mt, 19.4 percent lower than last year’s 9.75 thousand mt. The decrease was attributed to the following: o in Ilocos Norte, smaller bulbs were harvested due to unfavorable weather
condition which affected bulb formation. Some areas were shifted to yellow corn and peanut production due to low price during the planting season; and
o lesser areas were planted in Occidental Mindoro because of anticipation of El Niño.
Ilocos Region contributed 70.3 percent share to the country’s total output (Figure 12).
Figure 12. Garlic: Top Producing Regions, Philippines, January–March 2016
Figure 19. Cassava Production by region, Philippines, January-March 2016

11 20
Figure 11. Garlic production by region, Philippines, January-March 2016
Cassava
In the first quarter 2016, production of cassava grew by 7.3 percent, from 541.39 thousand mt in 2015 to 580.82 thousand mt this year. The positive growth was attributed to the following:
o increase in demand for feeds use from cassava feed millers and marketing
assistance from San Miguel Corporation in Isabela, Cagayan, and Quirino. o bigger tubers harvested in Bohol due to use of high yielding variety (Rayong);
and
o expansion in area planted in Leyte due to technical assistance such as good farm management practices conducted by non-governmental organizations (NGO).
Lower production were noted in some areas due to the following: o smaller tubers harvested in Bukidnon, Misamis Occidental, Tawi-tawi, and Sulu
due to the effect of dry spell; and o lesser area planted in South Cotabato due to drought.
Northern Mindanao recorded the biggest production at 182.88 thousand mt and shared 31.50 percent to the country’s cassava output. Cagayan Valley followed with 17.6 percent share, and ARMM with 16.9 percent (Figure 20).
The major producing regions this quarter were Northern Mindanao with the
highest production at 182.88 thousand mt at 31.5 percent of the country’s
cassava output. Followed by Cagayan Valley with 17.6 share, and ARMM with
16.9 percent.
Figure 20. Cassava: Top Producing Regions, Philippines, January – March 2016

STATISTICAL TABLES
9
Figure 9. Tomato production by region, Philippines, January-March 2016

22 8 8
Eggplant
During the January–March 2016 period, production of eggplant slightly decreased by 0.2 percent, from 76.50 thousand mt in 2015 to 76.36 thousand mt this year. Among the factors that contributed to the decline were the following: o insufficient supply of water during the vegetative stage of the crop coupled
with the attack of fruit borer in Quezon; o some areas planted to eggplant in Isabela and Nueva Ecija were flooded due
to Typhoon “Nona”; and o lesser area planted and lower yield in SOCCSKSARGEN due to drought.
Positive growths were noted in some areas due to: o shifting of some areas from white corn to eggplant production in Pangasinan
due to availability of seeds from DA-LGU coupled with the control of fruit flies;
o sustained usage of high yielding varieties distributed by DA-LGU in Ilocos Norte and Ilocos Sur;
o more areas were utilized due to non-planting of 2nd crop palay in Iloilo; and o improved yield in Tarlac due to efficient use of fertilizer.
The major producers of eggplant and their respective shares were Ilocos Region, 37.6 percent; CALABARZON, 18.6 percent; and Central Luzon, 15.4 percent (Figure 8).
Figure 8. Eggplant: Top Producing Regions, Philippines, January – March 2016
P- Preliminary
Table 1. Vegetables and Root Crops: Volume of production, Philippines, January-March 2015-2016P
2015 2016P
Mongo 7,298 7,348 0.7
Peanut 11,981 11,044 (7.8)
Cabbage 32,643 32,308 (1.0)
Eggplant 76,497 76,360 (0.2)
Tomato 89,930 87,681 (2.5)
Garlic 9,754 7,861 (19.4)
Onion 121,770 75,539 (38.0)
Red and Yellow 96,064 50,600 (47.3)
Multiplier 25,706 24,939 (3.0)
Sweet Potato 117,198 113,386 (3.3)
Cassava 541,390 580,817 7.3
CropsProduction (mt) Percent
Change

23 7
Figure 7. Eggplant production by region, Philippines, January-March 2016
P – Preliminary
Table 2. Mongo: Volume of production by region, Philippines, January-March 2015-2016P January-March, April-June and January-June 2013-2014

6 24
Cabbage
In January-March 2016, cabbage production decreased by 1.0 percent, from 32.64 thousand mt in 2015 to 32.31 thousand mt this year. The negative output was attributed to the following: o lesser area planted due to insufficient water supply caused by dry spell
in Benguet and drought in SOCCSKSARGEN; and o temporarily shifting to lettuce production in Mountain Province to minimize
the attack of pests.
Higher production in some areas were due to the following:
o increase in yield attributed to enough supply of irrigation water in Cebu; o additional area planted in Cagayan due to availability of seeds and financial
assistance from private lenders; and o expansion in area and control of diamondback moth in Ilocos Sur.
Cordillera Administrative Region (CAR) produced 24.91 thousand mt and
contributed 77.1 percent to total cabbage production during the reference period (Figure 6).
Figure 6. Cabbage: Top Producing Regions, Philippines, January–March 2016
P – Preliminary
Table 3. Peanut: Volume of production by region, Philippines, January-March 2015-2016P

25 5
Figure 5. Cabbage production by region, Philippines, January-March 2016
P – Preliminary
Table 4. Cabbage: Volume of production by region, Philippines, January-March 2015-2016P

3
4 26
Peanut
The first quarter 2016 production of peanut at 11.04 thousand mt was 7.8 percent lower than last’s years 11.98 thousand mt. The drop in output was caused by the following:
o decrease in area planted in Pangasinan due to unavailability of seeds; o damages brought by Typhoon “Nona” during pod development in Cagayan; o lesser area planted coupled with lower yield due to drought in
SOCCSKSARGEN and intense heat in Iloilo; and o shifting of some areas to mongo production in Tarlac due to increase in
demand.
Ilocos Region recorded the highest production at 6.78 thousand mt and shared 61.3 percent to total peanut production this quarter. Northern Mindanao came next with 6.8 percent followed by Western Visayas with 6.5 percent (Figure 4).
Figure 4. Peanut: Top Producing Regions, Philippines, January–March 2016
P – Preliminary
Table 5. Eggplant: Volume of production by region, Philippines, January-March 2015-2016P
July-September and October-December 2014-2015

27 3
33
Figure 3. Peanut production by region, Philippines, January-March 2016
P – Preliminary
Table 6. Tomato: Volume of production, Philippines,
January-March 2015-2016P

2
Mongo
For January-March 2016, production of mongo was estimated at 7.35 thousand mt. This was 0.7 percent higher than last year’s 7.30 thousand mt brought about by the following factors: o more utilization of areas previously planted with palay in Tarlac, Antique,
and Iloilo; o seeds distribution by the Department of Agriculture-Local Government
Units (DA-LGU) in Bulacan;
o lesser occurrence of downy mildew and pod rot diseases in Ilocos Sur; and
o better pods harvested due to early control of bean fly, thrips, and aphids in Ilocos Norte.
Lower production was noted in Pangasinan due to shifting to yellow corn
production attributed to availability of hybrid planting material (Hybrid Sweet Purple).
Ilocos Region topped all the mongo producing regions with 2.96 thousand mt contributing 40.3 percent share to the national output. This was followed by Western Visayas with 19.6 percent share and Autonomous Region in Muslim Mindanao (ARMM) with 10.3 percent (Figure 2).
Figure 2. Mongo: Top Producing Regions, Philippines, January–March 2016
Table 7. Garlic: Volume of production by region, Philippines, January-March 2015-2016P
P – Preliminary
28

1
Figure 1. Mongo production by region, Philippines, January-March 2016
P – Preliminary
Table 8. Red and Yellow Onion: Volume of production by region, Philippines, January-March 2015-2016P
29

TECHNICAL NOTES Production refers to the quantity produced and actually harvested for a particular crop during the reference period. For other crops, area planted refers to the actual physical area planted while area harvested refers to the actual area from which harvests are realized. Estimates of production and area planted/harvested are generated from the Quarterly Crops Production Survey (CrPS) of which there are four survey rounds in a year, that is, February, May, August, and November.
iv
P – Preliminary
Table 9. Multiplier Onion: Volume of production by region, Philippines, January-March 2015-2016P
30

P – Preliminary
Table 10. Sweet Potato: Volume of production by region, Philippines, January-March 2015-2016P
31

List of Figures
Figure 1. Mongo production by region, Philippines, January-March 2016 1 Figure 2. Mongo: Top Producing Regions, Philippines, January-March 2016 2 Figure 3. Peanut production by region, Philippines, January-March 2016 3 Figure 4. Peanut: Top Producing Regions, Philippines, January-March 2016 4 Figure 5. Cabbage production by region, Philippines, January-March 2016 5 Figure 6. Cabbage: Top Producing Regions, Philippines, January-March 2016 6 Figure 7. Eggplant production by region, Philippines, January-March 2016 7 Figure 8. Eggplant: Top Producing Regions, Philippines, January-March 2016 8 Figure 9. Tomato production by region, Philippines, January-March 2016 9 Figure 10. Tomato: Top Producing Regions, Philippines, January-March 2016 10 Figure 11. Garlic production by region, Philippines, January-March 2016 11 Figure 12. Garlic: Top Producing Regions, Philippines, January-March 2016 12 Figure 13. Red and Yellow Onion production by region, Philippines, 13
January-March 2016 Figure 14. Red and Yellow Onion: Top Producing Regions, Philippines, 14
January-March 2016 Figure 15. Multiplier Onion production by region, Philippines, January-March 2016 15 Figure 16. Multiplier Onion: Top Producing Regions, Philippines, January-March 2016 16 Figure 17. Sweet Potato production by region, Philippines, January-March 2016 17 Figure 18. Sweet Potato: Top Producing Regions, Philippines, January-March 2016 18 Figure 19. Cassava production by region, Philippines, January-March 2016 19 Figure 20. Cassava: Top Producing Regions, Philippines, January-March 2016 20
ii
iii
P – Preliminary
Table 11. Cassava: Volume of production by region, Philippines, January-March 2015-2016P
32

ISSN 2094-618x Volume 10 No. 1 Quezon City, Philippines
January-March 2016
PHILIPPINE STATISTICS AUTHORITY
Major Vegetables and Rootcrops
Quarterly Bulletin
If you want to know more about these statistics write or call Crops Statistics Division
(02) 376-2022 o PSA Website: http//www.psa.gov. ph