make america great again – listed infrastructure has a plan american society of civil engineers...
TRANSCRIPT

For professional / institutional clients only
1
IntroductionInfrastructure in the United States today feels like the opening line of Charles Dickens’ A Tale of Two Cities: “It was the best of times, it was the worst of times”. Many segments of the US infrastructure market are working well while other segments suffer from chronic underinvestment. We believe that a large part of this disparity can be explained by differences in funding models and ownership structures. The Global Listed Infrastructure asset class plays a large role in the US.
This article looks at the ownership profiles of different US infrastructure segments; and at the performance of those segments. It also discusses the ways that global listed infrastructure companies are providing solutions, and what impact President Trump may have on the sector.
US infrastructure ownershipThe US is a large, diverse and complex country with an infrastructure sector to match. The degree of government verse private sector ownership of infrastructure assets in the US varies considerably by sector. The table below compares ownership across different infrastructure sectors.
Three infrastructure sectors – freight rail, oil & gas pipelines and mobile towers – are almost exclusively owned by the private sector. In another four sectors – electric utilities, gas utilities, waste and satellites – ownership is dominated by the private sector, although significant levels of government ownership remains (including the US$50 billion Tennessee Valley Authority and the US$25 billion Bonneville Power Administration).
Sea ports are a mixed business model. Port authorities are government-owned, but operated by the private sector. Ownership of water utilities is dominated by local government with the private sector being a small, albeit growing, player. The road, airport and passenger rail sectors are almost exclusively owned by different levels of government.
Global Listed InfrastructureFebruary 2018
Make America Great Again – listed infrastructure has a plan
Andrew Greenup, Deputy Head of Global Listed Infrastructure George Thornely, Investment Manager
Ownership of US infrastructure assets
Public sector owned Private sector owned
Electric utilities 15% government (federal & local) 70% privately owned, 15% Rural co-ops
Gas utilities Small minority local government owned Vast majority privately owned
Water utilities 85% local government owned 15% privately owned
Waste 25% local government owned 75% privately owned
Roads Almost all local, state & federal government owned 20 privately owned toll roads
Airports All but one is owned by local, state or federal governments San Juan (PR) & several PPPs
Sea Ports Port authorities owned by local & state governments Stevedore & terminal management predominately private sector
Freight rail All privately owned
Passenger rail Federal government (Amtrak) for long distance trains Local and state government owned metropolitan trains
Several small PPPs
Oil & gas pipelines All privately owned
Mobile towers All privately owned
Satellites Minority federal government owned including GPS, NASA & DoD satellites Majority privately owned
Source: Industry associations & CFSGAM estimates

Global Listed InfrastructureFebruary 2018
2
Performance of US infrastructureIn the World Bank’s 2016-17 Global Competitiveness Index, the US ranks 3rd in overall competiveness, but only 11th in Infrastructure.
This Infrastructure ranking is behind Japan (5th), France (7th), Germany (8th) and the United Kingdom (9th), but ahead of Canada (15th), Australia (17th) and China (42nd). While the overall ranking is solid, we believe great disparities exist in the quality of infrastructure within the US.
The American Society of Civil Engineers (ASCE) produces an annual report card on US infrastructure. The 2017 grade was D+ (from a potential A to F range) which they define as being “Poor, at risk”. The table below compares ASCE’s sector grades against ownership type. It shows a clear link between private ownership and better grades.
Ownership and quality of US infrastructure assets
Ownership
ASCE 2017 report
card grade (A-F)
Freight rail All privately owned B
WasteMajority privately owned with some government
C+
Sea PortsMixed - government owned, privately operated
C+
Electric utilitiesMajority privately owned with some government
D+
Gas utilitiesMajority privately owned with some government
D+
Water utilitiesMajority government owned with some private
D
Roads Government owned D
Airports Government owned D
Passenger rail Government owned D-
Oil & gas pipelines
All privately owned N/A
Mobile towers All privately owned N/A
SatellitesMajority privately owned with some government
N/A
Below is the complete ASCE 2017 infrastructure grading by sector.
ASCE 2017 Infrastructure report card
Source: ASCE
“Slowly but surely, government-owned infrastructure sectors are seeking and utilising private sector capital to fund new investment.”
Source: ASCE and CFSGAM

Global Listed InfrastructureFebruary 2018
3
Private sector delivering investmentInfrastructure sectors in the US that are owned and operated by private sector players are investing in order to maintain and grow their asset base.
We would argue that the lightly regulated, privately owned freight rail1, oil & gas pipelines2, mobile towers3 and waste4 sectors provide the US with world class infrastructure assets run by world class companies. These sectors are able to deploy capital effectively for the following reasons:
(1) investment is driven by commercial considerations, not through public policy,
(2) regulation tends to be light handed,
(3) there is no requirement for government subsidies, and
(4) there is a predominance of business to business transactions (i.e. freight rail with Walmart, oil & gas pipelines with ExxonMobil, mobile towers with Verizon), with no direct impact on end consumers/voters.
These sectors have proven track records of raising and deploying large amounts of capital to meet the growing needs of the US economy. We have just witnessed a period of significant investment by oil & gas pipeline companies in response to the shale oil and gas energy renaissance in the US. The following charts illustrate the growing capital investments made by the freight railway industry, and the large productivity improvement delivered to the economy.
80
18
16
14
12
10
8
4
6
2
083 85 87 89 91 93 95 97 99 01 03 05 07 09 11 13 15
Capital Expenditure by US freight railways (US$, bn)
Source: Association of American Railroads, Class 1 railways only.
64
300
250
200
150
100
50
067 70 73 76 79 82 85 88 91 94 97 00 03 06 09 12 15
Rates Productivity
Staggers Act passedOct 1980
Revenue Volume
US freight railway performance (1981 = 100)
Source: Association of American Railroads.
While electric and gas utilities are predominately privately owned, they are closely regulated by state utility commissions and, to a lesser extent, the US Federal Energy Regulatory Commission (FERC). Hence their rate of investment tends to be determined in conjunction with state-based public policy objectives, and is often constrained by the impact on customers’ / voters’ energy bills. In recent years, the shale energy revolution has kept electric and gas utility fuel costs low. This has enabled regulators and utilities to spend money on maintaining and enhancing aged transmission, distribution and generation assets without needing to sharply raise bills.
0
20
40
60
80
100
120
140
03 04 05 06 07 08 09 10 11 12 13 14 15 16 17 1918
Investor owned electric utilities investment (US$, bn)
Source: Edison Electric Institute.
1 Including companies like Union Pacific, BNSF, CSX, Norfolk Southern and Kansas City Southern.2 Including companies like Kinder Morgan, Williams Cos, Enterprise Products Partners and Enbridge Energy.3 Including companies like American Tower, Crown Castle, SBAC Communications and Vertical Bridge.4 Including companies like Waste Management, Republic Services, Waste Connections and Advance Disposal.

Global Listed InfrastructureFebruary 2018
4
Public sector investment laggingThe US infrastructure sectors where we believe investment is failing to keep up with demand are roads, bridges, airports, water utilities and passenger rail. These sectors are all dominated by government ownership. In our view the main reasons for this under investment are:
(1) inadequate or flawed funding models in a low taxing economy5,
(2) a political inability to raise taxes,
(3) the timing mismatch between political electoral cycles of between 2 and 4 years and infrastructure asset lifecycles of between 40 and 60 years,
(4) a public perception that roads and bridges should be “free”, limiting politicians’ ability to introduce tolling systems and,
(5) planning complexity between local, state, regional and federal governments.
The evidence of under investment and failure to meet the demands of the growing economy in these government dominated infrastructure sectors are numerous. Some of the main examples include:
– The US Department of Transportation estimates an annual highway and bridge investment shortfall of US$43 billion.
– Despite a 23% increase in highway spending from 2002 to 2012, travel delays have increased 20% and ride quality has declined by 2%6.
– 9% of US bridges carrying 188 million trips per day are rated structurally deficient by the American Society of Civil Engineers7.
– 240,000 water mains break every year wasting two trillion gallons of treated drinking water.
– Water pipes are being replaced at a rate of just 0.5% pa or every 200 years - almost twice the useful lives.
– While the government-owned Amtrak passenger rail provider has improved its ridership and operating performance in recent years, it still loses US$1 billion8 pa, only has two profitable services9, and has failed to implement the “land value capture strategy” around its stations that has proved so successful for Asian rail operators.
– Within metropolitan areas, public transport has a low and declining share of commuter usage. Nowhere is this more apparent in the US’ second largest city, Los Angeles, where the metropolitan transport authority’s ridership is almost 20% below 1985 levels despite an almost 20% increase in population over this time, according to the Los Angeles Times.
Over the past decade we have seen modest signs that governments are slowly but surely opening up some of these underfunded infrastructure sectors to private operators. In the road space, new privately funded express lane projects have been established in Texas, Virginia and North Carolina, two toll roads in Puerto Rico have been sold to a private company, and Public Private Partnerships10 (PPPs) have been set up for new bridges/tunnels in New York / New Jersey, Ohio / Kentucky, Pennsylvania, Virginia and Florida.
5 Tax as a percentage of US GDP was 26% in 2016, well below the OECD average of 34%. Over the past 50 years this percentage has increased by just 2% for the US but by 9% on average for the OECD.6 Source is ‘2015 Status of the Nation’s Highways, Bridges, and Transit: Conditions & Performance’ report.7 We note this this percentage has been declining over the past five years.8 These losses include over US$200 million from state subsidies.9 Acela Express and Northeast Regional services which account for around a third of Amtrak’s passengers.10 PPPs are “a project delivery model whereby private companies partner with local governments to finance, construct, manage, and share the risk of public projects. Depending on the scope of the partnership, a private company may take on just some or all aspects of a project. The private companies are repaid in various ways, including by income generated through highway tolls or airport fees or bonds issued by local governments. Payments often are tied to performance metrics; failure to meet established thresholds may trigger reduced or delayed payments” – Icons of Infrastructure.
2017 Grade: D2013 Grade: D
2009 Grade: D-
2005 Grade: D-
Drinking water report card
2017 Grade: D+2013 Grade: D
2009 Grade: D-
2005 Grade: D-
Wastewater report card
The AWWA estimates that investment needs for buried drinking water infrastructure total more than US$1 trillion nationwide over the next 25 years.
Without renewal or replacement of existing systems, pipe classified as poor, very poor or like elapsed will increase from 10% of pipes in the U.S. to 44% by 2020.
Corroded water pipeWooden water pipes
Aging US water utility infrastructure
Source: American Water Works.
American Society of Civil Engineers (ASCE) Grades US Infrastructure
How Americans commute to work
Source: US Census Bureau.
1960 1970 1980 1990 2000 2009 20160
10
20
30
40
50
60
70
80
90
100
Private vehicleBusRail
WalkOther/Work from home
Global Listed InfrastructureFebruary 2018
5
In the airports space, Puerto Rico has sold its main airport to the private sector, while PPPs are being used to upgrade terminals at LaGuardia Airport and Denver International Airport. Plans are also in train for a US$10 billion PPP at John F. Kennedy International Airport.
In the passenger rail space, Denver’s US$2.2 billion Eagle P3 project was completed in 2016, the privately owned Brightline railway has recently opened in Florida, Maryland’s Purple Line PPP broke ground in 2017 (with completion due in 2022) and there are plans for a privately funded fast train between Dallas and Houston (of which we remain highly sceptical).
In the words of Ferrovial, “PPPs help local governments leverage their limited resources to build infrastructure quickly and at a reduced cost”.
Global listed infrastructure is part of the funding solutionThe global listed infrastructure asset class is a significant, successful investor in the US, predominantly via the freight railway, oil & gas pipeline, mobile tower, waste and electric, gas & water utilities sectors. As stated above, we believe these sectors are effectively deploying substantial amounts of capital into the stock of US infrastructure. Going forward we believe more global listed infrastructure companies can participate in funding and fixing the US infrastructure investment deficit in various sectors. Some of the main opportunities are outlined below:
Toll roads – Transurban, Ferrovial and Vinci are world leaders in
designing, building and owning toll road concessions. We would expect these firms to be active participants in any new projects.
– Transurban, Ferrovial, Vinci and Abertis all have operating toll roads assets in the US.
– Atlantia has an electronic toll collection company in the US.
Express Lane example
31
A solution to congestion on “existing urban corridors”
Active management of “newly added capacity” through tolling
by means of
Free
Lanes
Free
Lanes
Tolled Lanes Speed >50mph
“Express Tollway within an Existing Highway”
Managed Lanes
New assets landmark
Source: Ferrovial.
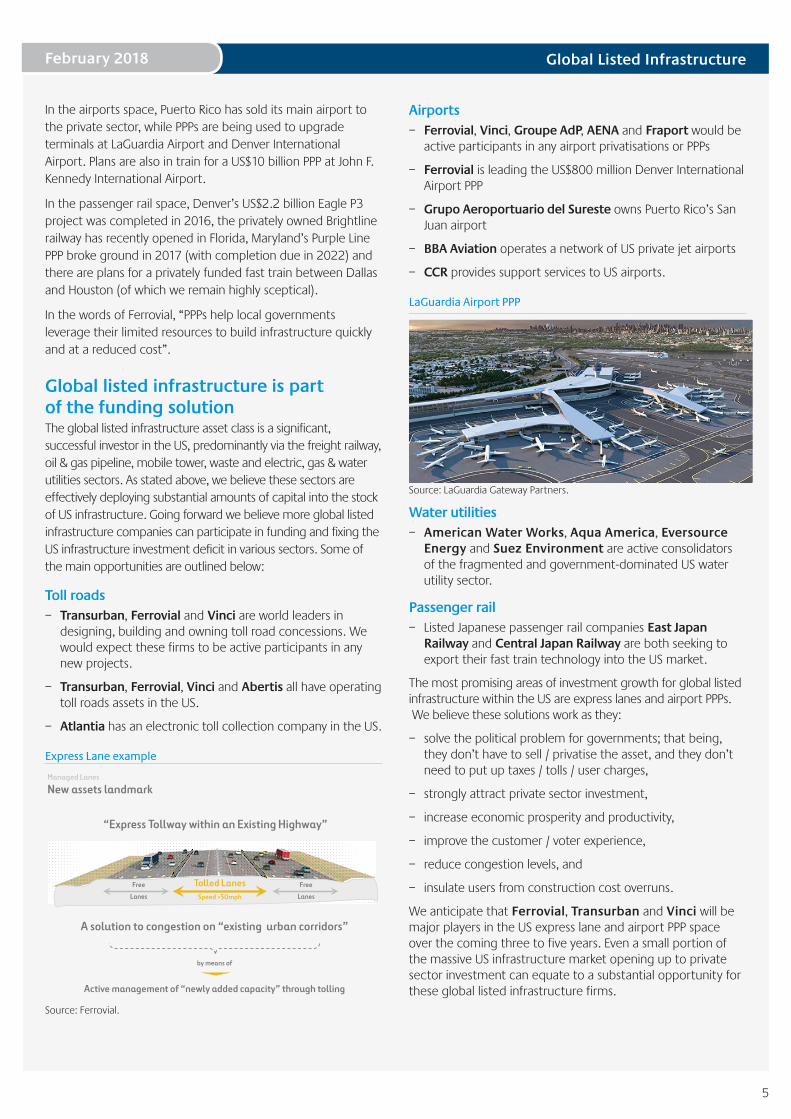
Airports – Ferrovial, Vinci, Groupe AdP, AENA and Fraport would be
active participants in any airport privatisations or PPPs
– Ferrovial is leading the US$800 million Denver International Airport PPP
– Grupo Aeroportuario del Sureste owns Puerto Rico’s San Juan airport
– BBA Aviation operates a network of US private jet airports
– CCR provides support services to US airports.
LaGuardia Airport PPP
Source: LaGuardia Gateway Partners.
Water utilities – American Water Works, Aqua America, Eversource
Energy and Suez Environment are active consolidators of the fragmented and government-dominated US water utility sector.
Passenger rail – Listed Japanese passenger rail companies East Japan
Railway and Central Japan Railway are both seeking to export their fast train technology into the US market.
The most promising areas of investment growth for global listed infrastructure within the US are express lanes and airport PPPs. We believe these solutions work as they:
– solve the political problem for governments; that being, they don’t have to sell / privatise the asset, and they don’t need to put up taxes / tolls / user charges,
– strongly attract private sector investment,
– increase economic prosperity and productivity,
– improve the customer / voter experience,
– reduce congestion levels, and
– insulate users from construction cost overruns.
We anticipate that Ferrovial, Transurban and Vinci will be major players in the US express lane and airport PPP space over the coming three to five years. Even a small portion of the massive US infrastructure market opening up to private sector investment can equate to a substantial opportunity for these global listed infrastructure firms.

Global Listed InfrastructureFebruary 2018
6
What can President Trump do to help US infrastructure?We believe the Trump presidency will have a positive impact on private sector investment in US infrastructure, which will benefit global listed infrastructure companies.
To be clear, we do not expect any ‘big bang’ step change in private sector infrastructure investment; rather, a gradual increase. This is because the US system of government is very much state based. Most infrastructure decisions are made at local or state government level, not federal. For example, local and state governments own 96% of US highways and 98% of bridges. As one infrastructure Chief Financial Officer (CFO) said to us recently “Demand for infrastructure in US is strong – but the decision-making process is very fragmented”.
Focus on ex-Goldman appointees to deliver infrastructure
Source: peoplespunditdaily.com.
However even a gradual increase in private sector investment in this massive market can be very meaningful for global listed infrastructure firms. The four main impacts we expect the Trump presidency to have on the infrastructure sector are outlined below.
Firstly, Trump has established a pro-business political and regulatory environment, lowering the barriers to investment. He has made pro-business appointments to the FERC, the Federal Communications Commission (FCC) and the Environmental Protection Agency (EPA). These moves are positive for infrastructure investment.
Secondly, by cutting taxes (and most likely increasing the US deficit), Trump is “starving the beast of government”, meaning that the government now has less revenue to spend on infrastructure projects. As a result, private sector capital will become an even more necessary source of funding for infrastructure projects.
Thirdly, it is widely expected that Trump will release his infrastructure agenda in the first half of 2018. The table on the next page is the leaked priority list of infrastructure projects. While we have low expectations, it should at least provide more low cost financing, tax credits and a framework for using more private sector capital. All of this will be helpful for global listed infrastructure investment. However as one CFO said to us recently, “All Trump can do is supply more financing, but financing is not the problem. We need states to make decisions”.
US Express Toll Lane projects (2016) Source: Reason Foundation.
Seattle
Alameda County Salt Lake City
Denver
Phoenix
Minneappolis
ChicagoNorthern Virginia
Maryland
Research Triangle
Charlotte
Atlanta
Orlando
Miami
Tampa
Dallas/Fort Worth
Austin
Managed lanes being implemented or under construction Feasibility studiesManaged lanes in operation
San Antonio Houston
Los Angeles
San Jose
Orange County
Entire Bay Area
San Diego

Global Listed InfrastructureFebruary 2018
7
President Trump’s infrastructure priority list Sector State Revenue Stream
Gateway Program Mass Transit/Rail NY, NJ No
The Brent Spence Bridge Highways and Bridges OH, KY No
National Research Lab for Infrastructure National Initiative OH No
Locks and Dams 52 and 53 on the Ohio River Inland Waterways IL Yes
I-95 Critical Highway Repairs Highways and Bridges NC No
15 Bridges on I-95, Philadelphia Highways and Bridges PA No
Mississippi River Shipping Channel Dredging Ports LA Yes
NextGen Air Traffic Control System National Initiative National No
Plains and Eastern Electric Transmission Lines Electricity and Transmission OK Yes
Project Clean Lake, Cleveland Water OH Yes
South Carolina Dams Accelerated Repairs Water/Inland Waterways SC No
Hydroelectric Plants operated by USACE Inland Waterways/Electricity National Yes
Alaska Pipeline & LNG Project Oil and Gas AK Yes
Cotton Belt Line Rail Project Mass Transit TX Yes
Cadiz Water Conveyance Project Water CA Yes
TransWest Express Transmission Electricity and Transmission CA, NV, AZ Yes
Chokecherry and Sierra Madre Wind Energy Electricity and Transmission WY Yes
Second Avenue Subway - Phases 2 & 3 Mass Transit NY Yes (Partial)
Savannah Harbor Expansion Acceleration Ports GA Yes
Atlantic Coast Pipeline Oil and Gas VA, NC Yes
Champlain Hudson Power Express Electricity and Transmission NY Yes
DC Union Station Expansion and Rehab Rail DC No
Maryland Purple Line Mass Transit MD Yes
M-1 Rail, Detroit Mass Transit MI Yes
Gordie Howe International Bridge Highways and Bridges MI Yes
Kansas City Airport Airports MO Yes
The Peace Bridge Highways and Bridges NY No
MBTA Green Line Extension, Boston Mass Transit MA Yes (Partial)
Augustin Plains Ranch Water NM Yes
I-93 Rebuild Highways and Bridges NH No
Lake Ponchartrain Bridge Highways and Bridges LA Yes
Port Newark Container Terminal Improvements Ports NJ Yes
Fort Mojave Solar Project Electricity and Transmission AZ Yes
Red and Purple Line Modernization, Chicago Mass Transit IL Yes (Partial)
I-95/I-395 Reconstruction Highways and Bridges FL No
Chicago Union Station Redevelopment Rail IL No
Upper Mississippi Locks 20-25 Inland Waterways MO Yes
Illinois River Locks Inland Waterways IL Yes
Colorado I-70 Mountain Corridor Highways and Bridges CO No
Colorado I-25 Improvements Highways and Bridges CO No
INHC Lock Replacement, New Orleans Inland Waterways LA Yes
Chickamauga Lock Inland Waterways TN Yes
Soo Locks Modernization Project Inland Waterways MI Yes
Huntington Beach Desalination Plant Water CA Yes
Upper Ohio Navigation Improvements Inland Waterways OH Yes
Monongahela River Locks and Dams Inland Waterways PA Yes
Seattle Airport Expansion Airports WA Yes
Arlington Memorial Bridge Highways and Bridges VA No
Energy Storage and Grid Modernization Electricity and Transmission National Yes
St. Louis Airport Airports MO Yes
Source: McClatchy.
Fourthly, a committed federal government can work with states – at least with red, Republican-led ones - to find solutions and remove the obstacles blocking new infrastructure investment. While the US presidency is weak in many areas of domestic policy, we should not underestimate the value of Theodore Roosevelt’s “bully pulpit” to advocate for an infrastructure agenda.
While we do not believe the Trump presidency will create a step change in infrastructure spending, it is likely to assist in providing more investment opportunities for global listed infrastructure companies.
Global Listed Infrastructure
DisclaimerThis document is directed at persons of a professional, sophisticated, institutional or wholesale nature and not the retail market.
This document has been prepared for general information purposes only and is intended to provide a summary of the subject matter covered. It does not purport to be comprehensive or to give advice. The views expressed are the views of the writer at the time of issue and may change over time. This is not an offer document, and does not constitute an offer, invitation, investment recommendation or inducement to distribute or purchase securities, shares, units or other interests or to enter into an investment agreement. No person should rely on the content and/or act on the basis of any matter contained in this document.
This document is confidential and must not be copied, reproduced, circulated or transmitted, in whole or in part, and in any form or by any means without our prior written consent. The information contained within this document has been obtained from sources that we believe to be reliable and accurate at the time of issue but no representation or warranty, express or implied, is made as to the fairness, accuracy or completeness of the information. We do not accept any liability for any loss arising whether directly or indirectly from any use of this document.
References to “we” or “us” are references to Colonial First State Global Asset Management (CFSGAM) which is the consolidated asset management division of the Commonwealth Bank of Australia ABN 48 123 123 124. CFSGAM includes a number of entities in different jurisdictions, operating in Australia as CFSGAM and as First State Investments (FSI) elsewhere.
Past performance is not a reliable indicator of future performance.
Reference to specific securities (if any) is included for the purpose of illustration only and should not be construed as a recommendation to buy or sell. Reference to the names of any company is merely to explain the investment strategy and should not be construed as investment advice or a recommendation to invest in any of those companies. Commonwealth Bank of Australia (the “Bank”) and its subsidiaries are not responsible for any statement or information contained in this document. Neither the Bank nor any of its subsidiaries guarantee the performance of the Company or the repayment of capital by the Company. Investments in the Company are not deposits or other liabilities of the Bank or its subsidiaries, and the Company is subject to investment risk, including loss of income and capital invested.
Hong Kong and Singapore
In Hong Kong, this document is issued by First State Investments (Hong Kong) Limited and has not been reviewed by the Securities & Futures Commission in Hong Kong. In Singapore, this document is issued by First State Investments (Singapore) whose company registration number is 196900420D. First State Investments and First State Stewart Asia are business names of First State Investments (Hong Kong) Limited. First State Investments (registration number 53236800B) and First State Stewart Asia (registration number 53314080C) are business divisions of First State Investments (Singapore).
Australia
In Australia, this document is issued by Colonial First State Asset Management (Australia) Limited AFSL 289017 ABN 89 114 194311.
United Kingdom and European Economic Area (“EEA”)
In the United Kingdom, this document is issued by First State Investments (UK) Limited which is authorised and regulated in the UK by the Financial Conduct Authority (registration number 143359). Registered office: Finsbury Circus House, 15 Finsbury Circus, London, EC2M 7EB, number 2294743.
Outside the UK within the EEA, this document is issued by First State Investments International Limited which is authorised and regulated in the UK by the Financial Conduct Authority (registration number 122512). Registered office 23 St. Andrew Square, Edinburgh, Midlothian EH2 1BB number SC079063.
Middle East
In certain jurisdictions the distribution of this material may be restricted. The recipient is required to inform themselves about any such restrictions and observe them. By having requested this document and by not deleting this email and attachment, you warrant and represent that you qualify under any applicable financial promotion rules that may be applicable to you to receive and consider this document, failing which you should return and delete this e-mail and all attachments pertaining thereto.
In the Middle East, this material is communicated by First State Investments International Limited which is regulated in Dubai by the DFSA as a Representative Office.
Kuwait
If in doubt, you are recommended to consult a party licensed by the Capital Markets Authority (“CMA”) pursuant to Law No. 7/2010 and the Executive Regulations to give you the appropriate advice. Neither this document nor any of the information contained herein is intended to and shall not lead to the conclusion of any contract whatsoever within Kuwait.
UAE – Dubai International Financial Centre (DIFC)
Within the DIFC this material is directed solely at Professional Clients as defined by the DFSA’s COB Rulebook.
UAE (ex-DIFC)
By having requested this document and / or by not deleting this email and attachment, you warrant and represent that you qualify under the exemptions contained in Article 2 of the Emirates Securities and Commodities Authority Board Resolution No 37 of 2012, as amended by decision No 13 of 2012 (the “Mutual Fund Regulations”). By receiving this material you acknowledge and confirm that you fall within one or more of the exemptions contained in Article 2 of the Mutual Fund Regulations.
Copyright © (2017) Colonial First State Group Limited
All rights reserved.
February 2018
8
Outlook – slowly but surely The US infrastructure sector is divided between privately owned assets which work well, and government-owned sectors which suffer from chronic underinvestment from a low taxing government.
Slowly but surely, government-owned infrastructure sectors are seeking and utilising private sector capital to fund new investment. Over the next three to five years we expect global listed infrastructure companies to expand their participation in the US infrastructure market.