make it real it real book of mathematical models i table of contents linear function models..... 1...
TRANSCRIPT

Make It Real Book of Mathematical Models
Frank C. Wilson Chandler-Gilbert Community College


Make It Real Book of Mathematical Models
Frank C. Wilson Chandler-Gilbert Community College

© 2007 Frank C. Wilson This book was developed with the support of a Maricopa Center for Learning and Instruction Learning Grant. Permission is granted to use these models on exams, in classroom learning activities, and other noncommercial learning aids. Commercial use of these materials is prohibited without prior written consent from Frank C. Wilson. Excepted as noted above, no part of this work may be reproduced or transmitted in any form or by any means with out prior written permission from Frank C. Wilson unless such copying is permitted under federal copyright law. For permissions, write [email protected].

Make It Real Book of Mathematical Models
i
Table of Contents
LINEAR FUNCTION MODELS .................................................................... 1
Marketing Labor Cost for Farm Foods (Linear) ............................................................................ 2 Health Services Spending as a function of Physician Services Spending (Linear)....................... 3 Carbon Monoxide Pollutant Concentrations (Linear).................................................................... 4 Carbon Dioxide Emissions as a function of Greenhouse Gas Emissions (Linear) ....................... 5 Private College Enrollment as a function of Public College Enrollment (Linear)........................... 6 Apple Computer Net Sales as a function of Cost of Sales (Linear) .............................................. 7 Chipotle Mexican Grill Food and Labor Costs (Linear)................................................................. 8 Death Rate Due to Heart Disease (Linear)................................................................................... 9 Children Under 5 Sleeping Under Insecticide Treated Nets − Chad (Linear) ............................. 10 Long Lasting Insecticidal Nets − Olyset® Net (Linear)............................................................... 11 Forecast of Snow Runoff Volumes (Linear)................................................................................ 12 Cigarettes and Heart Disease (Linear) ....................................................................................... 13 US Resident Population as a function of US Population (Linear) ............................................... 14 Families as a function of Households (Linear) ........................................................................... 15 Consumer Spending on Farm Foods (Linear) ............................................................................ 16 Juvenile Arrests by Offense (Linear) .......................................................................................... 17 Late Airline Departures and Arrivals (Linear).............................................................................. 18
QUADRATIC FUNCTION MODELS ............................................................ 19
Per Capita Spending on Prescription Drugs (Quadratic) ............................................................ 20 Tenpin Bowling Membership as a function of Bowling Establishments (Quadratic) ................... 21 Cassette Tape Value as a function of Cassette Tapes Shipped (Quadratic).............................. 22 Albums (LP/EP) Value as a function of Albums (LP/EP) Shipped (Quadratic) ........................... 23 iPod Sales Revenue as a function of Units Sold (Quadratic) ..................................................... 24 Apple Macintosh Sales Revenue as a function of Units Sold (Quadratic) .................................. 25 Chipotle Mexican Grill Revenue Sources (Quadratic) ................................................................ 26 Projected National Health Expenditures: Public vs. Private (Quadratic)..................................... 27 Medicare Enrollees (Quadratic).................................................................................................. 28 Prescriptions as a function of Medicare Enrollees (Quadratic) ................................................... 29 Malaria Cases in Children Under 5 − Ghana (Quadratic)........................................................... 30 Children Under 5 Sleeping Under Insecticide Treated Nets − Chad (Quadratic) ....................... 31 Child Population in Madagascar (Quadratic) .............................................................................. 32 Population in Equatorial Guinea (Quadratic) .............................................................................. 33 US Population (Quadratic) ......................................................................................................... 34 Wal−Mart Net Sales (Quadratic) ................................................................................................ 35 Hospital Beds as a function of Hospitals (Quadratic) ................................................................. 36 Non-Federal Hospitals as a Function of Federal Hospitals (Quadratic)...................................... 37 Consumer Spending on Books: Adult Trade (Quadratic) ........................................................... 38 US Oil Production Versus Oil Imports (Quadratic)...................................................................... 39 Yogurt Production (Quadratic).................................................................................................... 40 White Births as a function of All Births (Quadratic)..................................................................... 41 Arizona Virtual Academy Enrollment (Quadratic) ....................................................................... 42

Make It Real Book of Mathematical Models
ii
USAA Net Worth (Quadratic) ..................................................................................................... 43 National Football League Salaries (Quadratic)........................................................................... 44 Aerospace Products Industry Employees (Quadratic)................................................................ 45 Abortion Rate (Quadratic) .......................................................................................................... 46 Computer and Electronic Products Industry Employees (Quadratic).......................................... 47 Disneyland Tickets − Adults (Quadratic) .................................................................................... 48 Disneyland Tickets − Children (Quadratic)................................................................................. 49 Johnson and Johnson Net Income (Quadratic ) ........................................................................ 50 Federal and State Prison Rate (Quadratic) ................................................................................ 51
CUBIC AND QUARTIC MODELS ............................................................... 52
USAA Products (Cubic).............................................................................................................. 53 USAA Membership (Cubic) ........................................................................................................ 54 Number of Nonbusiness Chapter 11 Bankruptcies(Cubic) ......................................................... 55 Egg Production (Cubic) .............................................................................................................. 56 Per Capita Consumer Spending on Physician Services by Year (Cubic) ................................... 57 Per Capita Spending on Health Services and Supplies by Year (Cubic) .................................... 58 Motion Picture Screens as a function of Movie Attendance (Cubic) ........................................... 59 Pager Sales as a function of Cell Phone Sales (Cubic).............................................................. 60 Male Life Expectancy as a function of Female Life Expectancy (Cubic) .................................... 61 Per Capita Pineapple Consumption as a function of Other Fruit Consumption (Cubic).............. 62 Chipotle Mexican Grill Earnings Per Share (Cubic).................................................................... 63 Mail Order Prescriptions as a function of Supermarket Prescriptions (Cubic) ............................ 64 Prescription Retail Sales as a function of Prescriptions (Cubic) ................................................. 65 Fast Food Restaurant Sales as a function of Years (Cubic)....................................................... 66 Prescription Drug Sales as a function of the US Population (Cubic) .......................................... 67 Consumer Spending on Books (Cubic) ...................................................................................... 68 Television Sets (Cubic) .............................................................................................................. 69 Hospital Bed Availability (Quartic) .............................................................................................. 70 Average Hourly Earnings for a Ford Motor Company Employee ( Quartic) ................................ 71 Columbia River Flow Below Priest Rapids Dam (Quartic) .......................................................... 72
EXPONENTIAL FUNCTION MODELS ......................................................... 73
DVD Players Sold as a function of Price (Exponential) .............................................................. 74 Rwanda Population (Exponential) .............................................................................................. 75 Hungary Population (Exponential).............................................................................................. 76 Cambodia Population (Exponential) ........................................................................................... 77 Kazakhstan Population (Exponential)......................................................................................... 78 Bangladesh Population (Exponential) ........................................................................................ 79 Russian Federation Population (Exponential) ............................................................................ 80 Indonesia Population (Exponential)............................................................................................ 81 United States Population (Exponential) ...................................................................................... 82 India Population (Exponential).................................................................................................... 83 China Population (Exponential) .................................................................................................. 84 Insecticide Treated Net Distribution in African Region (Exponential) ......................................... 85 Netto Extra Treated Net Insecticide Residue (Exponential)........................................................ 86

Make It Real Book of Mathematical Models
iii
Long Lasting Insecticidal Nets − Olyset® Net (Exponential) ...................................................... 87 Average Brand Name Prescription Drug Prices (Exponential) ................................................... 88 Future Value of a Certificate of Deposit (Exponential)................................................................ 89 Highway Accident Injuries (Exponential) .................................................................................... 90
POWER AND PIECEWISE MODELS........................................................... 91
Custom Greeting Card Costs (Piecewise).................................................................................. 92 Asparagus Plant Cost (Piecewise) ............................................................................................. 93 Late Airline Departures and Arrivals (Power) ............................................................................. 94
LOGISTIC FUNCTION MODELS................................................................ 95
Number of Golf Courses (Logistic) ............................................................................................. 96 Blank Audio Cassette Tape Sales (Logistic) .............................................................................. 97 Drug Prescriptions as a function of Year (Logistic)..................................................................... 98 Death Rate Due to Chronic Liver Disease and Cirrhosis (Logistic) ............................................ 99 Reported Cases of Chicken Pox (Logistic)............................................................................... 100 Mosquito Mortality Rate for Conventional Net (Logistic)........................................................... 101 Stay-at-home Mothers (Logistic) .............................................................................................. 102 US Army Personnel (Logistic) .................................................................................................. 103
PIE CHARTS ..................................................................................... 104
Subway and McDonalds Nutrition Comparisons − Fat (Pie Chart)........................................... 105 Subway and McDonalds Nutrition Comparisons − Sodium (Pie Chart)................................... 106 Subway and McDonalds Nutrition Comparisons − Protein (Pie Chart) ................................... 107

Make It Real Book of Mathematical Models

Make It Real Book of Mathematical Models
© Frank C. Wilson For noncommercial use 1
Linear Function Models

Make It Real Book of Mathematical Models
2 For noncommercial use © Frank C. Wilson
Marketing Labor Cost for Farm Foods (Linear)
Source: Statistical Abstract of the United States, 2006, Table 842
Year
t Year
(Since 1990)
L Marketing
Labor Cost
(billions of dollars)
1990 0.0 154.0 1994 4.0 186.1 1995 5.0 196.6 1996 6.0 204.6 1997 7.0 216.9 1998 8.0 229.9 1999 9.0 241.5 2000 10.0 252.9 2001 11.0 263.8 2002 12.0 273.1 2003 13.0 285.9
Scatter Plot and Model Graph
Model Equation ( ) 10.47 146.8L t t= + Verbal Description Based on data from 1990 − 2003, the marketing labor cost for farm foods may be modeled by
( ) 10.47 146.8L t t= + billion dollars where t is the number of years since 1990 (Source: Modeled from Statistical Abstract of the United States, 2006, Table 842). Questions 1. According to the model, at what rate are food marketing labor costs increasing? 2. According to the model, when will food marketing labor costs reach 300 billion dollars? 3. According to the model, what will food marketing labor costs be in 2009?

Make It Real Book of Mathematical Models
© Frank C. Wilson For noncommercial use 3
Health Services Spending as a function of Physician Services Spending (Linear)
Source: Statistical Abstract of the United States, 2006, Table 121
t Year (Since 1990)
p Per
Capita Spending
on Physician
and Clinical Services (dollars)
T Total Per
Capita Spending
on Health
Services and
Supplies (dollars)
0 619 2633 5 813 3530 8 914 3962 9 954 4154 10 1010 4389 11 1085 4733 12 1162 5115 13 1249 5452
Scatter Plot and Model Graph
Model Equation ( ) 4.495 140.4T p p= −
Verbal Description Based on data from 1990 − 2003, per capita health services and supplies spending may be modeled by
( ) 4.495 140.4T p p= − dollars where p is the per capita spending on physician and clinical services (Source: Statistical Abstract of the United States, 2006, Table 121).
Questions 1. According to the model, what appears to happen to health services spending as physician services spending increases? 2. What would be a reasonable domain for this model? 3. According to the model, what will be the per capita spending on health services and supplies when per capita physician and clinical services spending is $1500?

Make It Real Book of Mathematical Models
4 For noncommercial use © Frank C. Wilson
Carbon Monoxide Pollutant Concentrations (Linear)
Source: Statistical Abstract of the United States, 2006, Table 359
t Year (Since 1990)
P Carbon
Monoxide Pollutant
Concentration (parts per million)
0 6 5 4.7 9 3.9 10 3.4 11 3.2 12 3 13 2.8
Scatter Plot and Model Graph
Model Equation ( ) 0.248 5.99P t t= − +
Verbal Description Based on data from 1990 − 2003, carbon monoxide pollution may be modeled by
( ) 0.248 5.99P t t= − + parts per million where t is the number of years since 1990 (Source: Statistical Abstract of the United States, 2006, Table 359).
Questions 1. According to the model, is carbon monoxide pollution increasing or decreasing? 2. According to the model, when will carbon monoxide pollution drop below 1 ppm? 3. According to the model, at what rate is carbon monoxide pollution changing?

Make It Real Book of Mathematical Models
© Frank C. Wilson For noncommercial use 5
Carbon Dioxide Emissions as a function of Greenhouse Gas Emissions (Linear)
Source: Statistical Abstract of the United States, 2006, Table 362
t Year (Since 1990)
g Greenhouse
Gas Emissions (million metric tons)
C Carbon Dioxide
Emissions(million metric tons)
0 6156 5006 5 6470 5319 9 6795 5686 10 6957 5854 11 6829 5748 12 6862 5796
Scatter Plot and Model Graph
Model Equation ( ) 1.095 1743C g t= −
Verbal Description Based on data from 1990 − 2002, carbon dioxide emissions may be modeled by
( ) 1.095 1743C g t= − million metric tons where g is the number of metric tons of greenhouse gas emissions (in millions) (Source: Statistical Abstract of the United States, 2006, Table 336).
Questions 1. What does the slope of this function mean? 2. According to the model, what will be the carbon dioxide emissions when greenhouse gas emissions are 7000 million metric tons? 3. According to the model, what will be the greenhouse gas emissions when the carbon dioxide emissions are 7000 million metric tons?

Make It Real Book of Mathematical Models
6 For noncommercial use © Frank C. Wilson
Private College Enrollment as a function of Public College Enrollment (Linear)
Source: Statistical Abstract of the United States, 2006, Table 204
t Year
x Public College
Enrollment (thousands)
P Private College
Enrollment (thousands)
2000 11,753 3,560 2001 12,233 3,695 2002 12,752 3,860
2003, proj 12,952 3,958 2004, proj 13,092 4,003 2005, proj 13,283 4,068 2006, proj 13,518 4,146 2007, proj 13,752 4,223 2008, proj 14,034 4,316 2009, proj 14,251 4,389 2010, proj 14,380 4,436 2011, proj 14,494 4,478 2012, proj 14,612 4,520 2013, proj 14,730 4,560
Scatter Plot and Model Graph
Model Equation ( ) 0.340 457P x x= −
Verbal Description Based on data from 2001 − 2003 and projections for 2004 − 2013, private college enrollment may be modeled by
( ) 0.340 457P x x= − thousand students where x is the number of public college students enrolled (in thousands) (Source: Statistical Abstract of the United States, 2006, Table 204).
Questions 1. What is the real world meaning of the slope of the linear model? 2. What will be the public college enrollment when the private college enrollment reaches 5 million students? 3. What will be the private college enrollment when the public college enrollment reaches 16 million students?

Make It Real Book of Mathematical Models
© Frank C. Wilson For noncommercial use 7
Apple Computer Net Sales as a function of Cost of Sales (Linear)
Source: Apple Computer Corporation, Five-Year Financial History http://www.apple.com/investor/
t Year (since 2000)
c Cost of Sales
(million dollars)
S Net Sales (million dollars)
1 4128 5363 2 4139 5742 3 4499 6207 4 6020 8279 5 9888 13,931
Scatter Plot and Model Graph
Model Equation ( ) 1.45 408S c c= −
Verbal Description Based on data from 2000 − 2005, Apple Computer Corporation net sales may be modeled by
( ) 1.45 408S c c= − million dollars where c is the cost of sales (in million dollars) (Source: Apple Computer Corporation, Five-Year Financial History).
Questions 1. What does the slope of this function mean? 2. According to the model, when the cost of sales reaches 1 billion dollars what will be the net sales? 3. What is the horizontal intercept of this model and what does it mean?

Make It Real Book of Mathematical Models
8 For noncommercial use © Frank C. Wilson
Chipotle Mexican Grill Food and Labor Costs (Linear)
Source: Chipotle Mexican Grill, Inc, 2005 Annual Report, p. 24
t Year (Since 2000)
f Food,
Beverage, and
Packaging Costs
(thousand dollars)
L Labor Costs
(thousand dollars)
1 45,236 46,048 2 67,681 66,515 3 104,921 94,023 4 154,148 139,494 5 202,288 178,721
Scatter Plot and Model Graph
Model Equation ( ) 0.8454 7865L f f= +
Verbal Description Based on data from 2000 − 2005, Chipotle Mexican Grill labor costs may be modeled by
( ) 0.8454 7865L f f= + thousand dollars where f is the cost of food, beverages, and packaging (in thousand dollars) (Source: Chipotle Mexican Grill, Inc, 2005 Annual Report, p. 24)
Questions 1. What does the slope of this function mean? 2. According to the model, when the food, beverages, and packaging cost reaches 300 million dollars, what will be the labor cost? 3. What is the meaning of the vertical intercept? Does this make sense in its real world context?

Make It Real Book of Mathematical Models
© Frank C. Wilson For noncommercial use 9
Death Rate Due to Heart Disease (Linear)
Source: Statistical Abstract of the United States, 2006; Table 106
Years (since 1980)
t
Age-Adjusted Death Rate
Due to Heart Disease
(deaths/100,000 people)
r
0 412.1 1 397.0 2 389.0 3 388.9 4 378.8 5 375.0 6 365.1 7 355.9 8 352.5 9 332.0 10 321.8 11 313.8 12 306.1 13 309.9 14 299.7 15 296.3 16 288.3 17 280.4 18 272.4 19 267.8 20 257.6 21 247.8
Scatter Plot and Model Graph
22 240.8 Model Equation 23 232.1 ( ) 7.597 407.4R t t= − +
Verbal Description Based on data from 1980 − 2003, the age-adjusted death rate due to heart disease may be modeled by
( ) 7.597 407.4R t t= − + deaths per 100,000 people where t is the number of years since 1980. (Source: Statistical Abstract of the United States, 2006; Table 106)
Questions 1. If you were a public health official, of what value would this model be to you? 2. According to the model, at what rate is the death rate due to heart disease decreasing? 3. According to the model, when will deaths due to heart disease be eliminated? Is this reasonable?

Make It Real Book of Mathematical Models
10 For noncommercial use © Frank C. Wilson
Children Under 5 Sleeping Under Insecticide Treated Nets − Chad (Linear)
Source: http://www.afro.who.int/malaria/country-profile/chad.pdf
Year t
Proportion of Children Under 5 Sleeping under Insecticide
Treated Nets (ITN) C
2000 ( 0)t = 2% 2001 ( 1)t = 6.7% 2005 Goal 60%
Scatter Plot and Model Graph
Model Equation ( ) 4.7 2.0C t t= +
Verbal Description Based on data from 2000 − 2001, the percentage of children under 5 years of age in Chad sleeping under insecticide treated nets may be modeled by
( ) 4.7 2.0C t t= + percent where t is the number of years since 2000 (Source: Modeled from World Health Organization data).
Questions 1. What does the slope of this function mean? 2. According to the model, will the goal of having 60% of the children under 5 years of age in Chad sleeping under insecticide treated nets by 2005 be reached? Explain. 3. Nothing But Nets is a humanitarian effort of the UN Foundation that is purchasing and distributing insecticide treated nets to families in Africa as a part of the international effort to curb malaria. Visit www.nothingbutnets.net then explain what you can do to make a difference.

Make It Real Book of Mathematical Models
© Frank C. Wilson For noncommercial use 11
Long Lasting Insecticidal Nets − Olyset® Net (Linear)
Source: http://www.who.int/malaria/docs/UpdateLLIN_4.pdf
Years (since
first use) t
Permethrin Content
(% of initial amount)
p 0 100 5 50 7 35
Scatter Plot and Model Graph
Model Equation ( ) 9.423 99.36p t t= − +
Verbal Description The amount of permethrin remaining in an Olyset ® Net insecticide treated net may be modeled by
( ) 9.423 99.36p t t= − + percent of the initial amount where t is the number of years since first use. (Source: Modeled from World Health Organization data).
Questions 1. What does the slope of this function mean? 2. Does a linear or exponential function seem more appropriate in this situation? Explain. 3. According to the model, how many years will it take for all of the initial permethrin to be lost?

Make It Real Book of Mathematical Models
12 For noncommercial use © Frank C. Wilson
Forecast of Snow Runoff Volumes (Linear)
Source: NWS California Nevada River Forecast Center / California Department of Water Resources; http://www.cnrfc.noaa.gov/products/snowmelt/snowmelt.pdf
Day of
June 2006
Maximum unimpaired water flow
volume expected over the next five days in American River at Folsum (1000 acre feet)
7 114 12 100.1 17 86.8 22 75
Scatter Plot and Model Graph
Model Equation ( ) 2.606 131.8v t t= − +
Verbal Description Based on data from June 2006, the forecast for maximum five-day snow runoff volumes for the American River at Folsom may be modeled by
( ) 2.606 131.8v t t= − + thousand acre feet where t is the number of days since the end of May 2006 (Source: Modeled from National Weather Service data).
Questions 1. What does the slope of this function mean? 2. What is a reasonable domain for this function? Explain. 3. What is the practical meaning of the vertical and horizontal intercepts of this function?

Make It Real Book of Mathematical Models
© Frank C. Wilson For noncommercial use 13
Cigarettes and Heart Disease (Linear)
Source: www.cdc.gov, Statistical Abstract of the United States, 2006, Table 106
Year t
People Who
Smoke Cigarettes (percent)
P
Heart Disease Death Rate
(deaths per
100,000 people)
D 1974 36.9 458.8 1979 33.1 401.6 1983 31.6 388.9 1985 30 375 1987 28.8 355.9 1988 28.1 352.5 1990 25.4 321.8 1991 25.8 313.8 1992 26.3 306.1 1993 24.7 309.9 1994 24.9 299.7 1995 24.5 296.3 1997 24 280.4 1998 23.4 272.4 1999 22.7 267.8 2000 22.6 257.6 2001 22 247.8
Scatter Plot and Model Graph
2002 21.4 240.8 Model Equation 2003 21.1 232.1 ( ) 14.08 53.87D p p= −
Verbal Description Based on data from 1974 − 2003, the death rate due to heart disease (in deaths per 100,000 people) may be modeled by
( ) 14.08 53.87D p p= − where p is the percentage of people who smoke (Source: Modeled from CDC and Census Bureau data).
Questions 1. What does the slope of this function mean? 2. According to the model, what would be the heart disease death rate if 0% of the population smoked? 3. A classmate claims that this model and data set show that smoking causes heart disease. Is this a valid conclusion based on the evidence presented?

Make It Real Book of Mathematical Models
14 For noncommercial use © Frank C. Wilson
US Resident Population as a function of US Population (Linear)
Source: Statistical Abstract of the United States, 2006; Table 2 Years (since 1990)
t
US Population (thousands)
p
Resident Population (thousands)
r 0 250,132 249,623 1 253,493 252,981 2 256,894 256,514 3 260,255 259,919 4 263,436 263,126 5 266,557 266,278 6 269,667 269,394 7 272,912 272,647 8 276,115 275,854 9 279,295 279,040 10 282,402 282,192 11 285,329 285,102 12 288,173 287,941 13 291,028 290,789 14 293,907 293,655
Scatter Plot and Model Graph
Model Equation ( ) 1.006 1869r p p= −
Verbal Description Based on data from 1990 − 2004, the resident population of the United States may be modeled by
( ) 1.006 1869r p p= − thousand people where p is the total US population (in thousands) (Source: Statistical Abstract of the United States, 2006; Table 2).
Questions 1. What does the slope of this function mean? 2. What is the inverse function of this model? 3. What is the meaning of the inverse function of this model?

Make It Real Book of Mathematical Models
© Frank C. Wilson For noncommercial use 15
Families as a function of Households (Linear)
Source: Statistical Abstract of the United States, 2006; Table 53
Year Households (Thousands)
Families (Thousands)
1980 80,776 59,550 1990 93,347 66,090 1995 98,990 69,305 2000 104,705 72,025 2002 109,297 74,329 2003 111,278 75,596 2004 112,000 76,217
Scatter Plot and Model Graph
Model Equation ( ) 0.5268 16,980f h h= +
Verbal Description Based on data from 1980 − 2004, the number of families in the United States may be modeled by
( ) 0.5268 16,980f h h= + thousand families where h is the number of households (in thousands) in the United States (Source: Statistical Abstract of the United States, 2006; Table 53).
Questions 1. What does the slope of this function mean? 2. If the number of households increases by 100,000, by how much will the number of families increase? 3. According to the model, how many households will there be when there are 80 million families?

Make It Real Book of Mathematical Models
16 For noncommercial use © Frank C. Wilson
Consumer Spending on Farm Foods (Linear)
Source: Statistical Abstract of the United States 2007, Table 818
Year t
At-home spending on farm
foods (billion dollars)
h
Away-from-home
spending on farm
foods (billion dollars)
a 1995 316.9 212.6 1996 328.0 218.7 1997 339.2 227.3 1998 346.8 238.2 1999 370.7 254.6 2000 390.2 270.9 2001 403.9 283.6 2002 416.8 292.6 2003 437.2 307.0 2004 463.5 325.4
Scatter Plot and Model Graph
Model Equation ( ) 0.7905 38.36a h h= −
Verbal Description Based on data from 1995 − 2004, the amount of money spent by civilian consumers on farm foods away-from-home may be modeled by
( ) 0.7905 38.36a h h= − billion dollars where h is the amount of money spent on farm foods at-home (in billion dollars). (Source: Modeled from Statistical Abstract of the United States 2007, Table 818)
Questions 1. What does the slope of this function mean? 2. Between 1995 and 2004, civilian spending on farm foods at-home and away from home increased every year. From the model, is it possible to tell whether spending was increasing more rapidly at home or away from home? 3. What is the inverse function of the model and what does it represent?

Make It Real Book of Mathematical Models
© Frank C. Wilson For noncommercial use 17
Juvenile Arrests by Offense (Linear)
Source: Source: Statistical Abstract of the United States 2007, Table 318
Year t
Robbery (thousands)
r
Aggravated assault
(thousands)a
1995 47,240 68,523 1998 29,989 54,637 1999 26,125 50,915 2000 24,206 49,815 2001 23,408 50,462 2002 19,491 47,001 2003 18,950 45,955 2004 19,000 45,232
Scatter Plot and Model Graph
Model Equation ( ) 0.7960 30,830a r r= +
Verbal Description Based on data from 1995 − 2004, the number of juvenile aggravated assault arrests may be modeled by
( ) 0.7960 30,830a r r= + thousand arrests where r is the number of juvenile robbery arrests (in thousands). (Source: Modeled from Statistical Abstract of the United States 2007, Table 318.)
Questions 1. What does the slope of this function mean? 2. Do you think that aggravated assault offenses and robbery offenses are related as suggested by the model? Explain. 3. Of what practical value would this model be to a state official responsible for the juvenile correction system?

Make It Real Book of Mathematical Models
18 For noncommercial use © Frank C. Wilson
Late Airline Departures and Arrivals (Linear)
Source: Statistical Abstract of the United States 2007, Table 1054
Year t
Late Airline
Departures d
Late Airline
Arrivals a
1995 827.9 1039.3 1997 846.9 1083.8 1998 870.4 1070.1 1999 937.3 1152.7 2000 1131.7 1356.0 2001 953.8 1104.4 2002 717.4 868.2 2003 834.4 1057.8 2004 1187.6 1421.4 2005 1279.4 1466.1
Scatter Plot and Model Graph
Model Equation ( ) 1.037 167.9a d d= +
Verbal Description Based on data from 1995 − 2005, the number of late airline arrivals in the United States (in thousands) may be modeled by
( ) 1.037 167.9a d d= + late arrivals where d is the number of late departures (in thousands). (Source: Modeled from Statistical Abstract of the United States 2007, Table 1054.)
Questions 1. What does the slope of this function mean? 2. Do you think late airline arrivals and departures are related as the model suggests? 3. If there are 1000 late airline departures, how many late airline arrivals does the model forecast?

Make It Real Book of Mathematical Models
© Frank C. Wilson For noncommercial use 19
Quadratic Function Models

Make It Real Book of Mathematical Models
20 For noncommercial use © Frank C. Wilson
Per Capita Spending on Prescription Drugs (Quadratic)
Source: Statistical Abstract of the United States, 2006, Table 121
t Year (Since 1990)
P Per Capita
Spending on Prescription
Drugs (dollars)
0 158 5 224 8 311 9 368 10 423 11 485 12 552 13 605
Scatter Plot and Model Graph
Model Equation
( ) 22.889 2.613 158.7P t t t= − + Verbal Description
Based on data from 1990 − 2003, the amount of money spent on prescription drugs (per capita) may be modeled by
( ) 22.889 2.613 158.7P t t t= − + dollars where t is the number of years since 1990 (Source: Statistical Abstract of the United States, 2006, Table 121)
Questions 1. What is the initial value of the function and what does it represent? 2. What is the initial instantaneous rate of change of the function and what does it mean in this context? 3. Is the graph of the model concave up or concave down? Explain how you know.

Make It Real Book of Mathematical Models
© Frank C. Wilson For noncommercial use 21
Tenpin Bowling Membership as a function of Bowling Establishments (Quadratic)
Source: Statistical Abstract of the United States, 2006, Table 1234
t Year (Since 1990)
b Tenpin Bowling
Establish- ments
M Bowling
Membership(Thousands)
0 7611 6588 5 7049 4925 10 6247 3756 11 6022 3553 12 5973 3382 13 5811 3246 14 5761 3112
Scatter Plot and Model Graph
Model Equation
( ) 20.000628 6.61 20500M b b b= − + Verbal Description
Based on data from 1990 − 2004, the number of tenpin bowling memberships may be modeled by
( ) 20.000628 6.61 20500M b b b= − + where b is the number of tenpin bowling establishments (Source: Statistical Abstract of the United States, 2006, Table 1234).
Questions 1. Based on the raw data, what would you think a practical domain for this model would be? 2. According to the model, how many bowling memberships will there be when there are 6800 tenpin bowling establishments? 3. According to the model, how many bowling establishments will there be when there are 4000 tenpin bowling memberships?

Make It Real Book of Mathematical Models
22 For noncommercial use © Frank C. Wilson
Cassette Tape Value as a function of Cassette Tapes Shipped (Quadratic)
Source: Statistical Abstract of the United States, 2006, Table 1131
t Year (since 1990)
s Cassette Tapes
Shipped (millions)
V Cassette
Tape Shipment
Value (millions of
dollars) 0 442.2 3472.4 5 272.6 2303.6 8 158.5 1419.9 9 123.6 1061.6 10 76.0 626.0 11 45.0 363.4 12 31.1 209.8 13 17.2 108.1 14 5.2 23.6
Scatter Plot and Model Graph
Model Equation
( ) 20.00393 9.74 63.0V s s s= − + − Verbal Description
Based on data from 1990 − 2004, the value of all cassette tapes shipped may be modeled by ( ) 20.00393 9.74 63.0V s s s= − + − million dollars
where s is the number of cassette tapes shipped (in millions) (Source: Statistical Abstract of the United States, 2006, Table 1131).
Questions 1. Is the graph of the model concave up or concave down? 2. What does the concavity of the graph tell us about this situation? 3. What is the derivative of this function and what does it represent in this context?

Make It Real Book of Mathematical Models
© Frank C. Wilson For noncommercial use 23
Albums (LP/EP) Value as a function of Albums (LP/EP) Shipped (Quadratic)
Source: Statistical Abstract of the United States, 2006, Table 1131
t Year (since 1990)
s Albums Shipped
(millions)
V Album
Shipment Value
(millions of dollars)
0 11.7 86.5 5 2.2 25.1 8 3.4 34.0 9 2.9 31.8 10 2.2 27.7 11 2.3 27.4 12 1.7 20.5 13 1.5 21.7 14 1.3 19.2
Scatter Plot and Model Graph
Model Equation
( ) 20.111 7.91 9.21V s s s= − + + Verbal Description
Based on data from 1990 − 2004, the value of all albums (EP/LP) shipped may be modeled by ( ) 20.111 7.91 9.21V s s s= − + + million dollars
where s is the number of albums (EP/LP) shipped (in millions) (Source: Statistical Abstract of the United States, 2006, Table 1131).
Questions 1. Is the graph of the model concave up or concave down? 2. What does the concavity of the graph tell us about this situation? 3. What is the derivative of this function and what does it represent in this context?

Make It Real Book of Mathematical Models
24 For noncommercial use © Frank C. Wilson
iPod Sales Revenue as a function of Units Sold (Quadratic)
Source: Apple Computer Corporation 2005 Annual Report, p. 31 − 32
Data Scatter Plot and Model Graph
Model Equation
Apple Computer Corporation has captured the attention of millions of consumers with its innovative iPod digital music player. The company published the following in its 2005 Annual Report to the Securities and Exchange Commission.
Net sales of iPods rose $3.2 billion or 248% during 2005 compared to 2004. Unit sales of iPods totaled 22.5 million in 2005, which represents an increase of 409% from the 4.4 million iPod units sold in 2004. (Source: Apple Computer Corporation 2005 Annual Report, p. 32).
The report further indicated that iPod sales revenue was $1.3 billion in 2004 and that in 2003, 0.9 million iPod units were sold generating $0.3 billion in revenue.
( ) 25.043 312.4 22.89s u u u= − + +
Verbal Description Based on data from 2003 − 2005, the amount of money generated from iPod sales may be modeled by
( ) 25.043 312.4 22.89s u u u= − + + million dollars where u is the number of iPod units sold (in millions) (Source: Modeled from Apple Computer Corporation 2005 Annual Report, p. 31 − 32.).
Questions 1. The graph of this model is initially increasing and concave down. What does this mean in the context of iPod sales? 2. It is commonly accepted that lowering an item’s price often increases the number of items sold. Does this model support that idea? Explain. 3. What is the derivative of this function and what does it represent in this context?

Make It Real Book of Mathematical Models
© Frank C. Wilson For noncommercial use 25
Apple Macintosh Sales Revenue as a function of Units Sold (Quadratic)
Source: Apple Computer Corporation 2005 Annual Report, p. 31 − 32
Data Scatter Plot and Model Graph
Model Equation
Apple Computer Corporation published the following in its 2005 Annual Report.
Total Macintosh net sales increased $1.4 billion or 27% during 2005 compared to 2004. Unit sales of Macintosh systems increased 1.2 million units or 38% during 2005 compared to 2004. (Source: Apple Computer Corporation 2005 Annual Report, p. 32).
The report further indicated that 3.3 million Macintosh computers were sold in 2004 generating sales revenue of $4.9 billion. In 2003, 3.0 million Macintosh systems were sold generating $4.5 billion in revenue.
2( ) 0.1111 2.033 0.6000s m m m= − + − Verbal Description
Based on data from 2003 − 2005, the amount of money generated from iPod sales may be modeled by
2( ) 0.1111 2.033 0.6000s m m m= − + − billion dollars where m is the number of Macintosh systems sold (in millions) (Source: Modeled from Apple Computer Corporation 2005 Annual Report, p. 31 − 32.).
Questions 1. The graph of this model is initially increasing and concave down. What does this mean in the context of Macintosh sales? 2. It is commonly accepted that lowering an item’s price often increases the number of items sold. Does this model support that idea? Explain. 3. What is the derivative of this function and what does it represent in this context?

Make It Real Book of Mathematical Models
26 For noncommercial use © Frank C. Wilson
Chipotle Mexican Grill Revenue Sources (Quadratic)
Source: Chipotle Mexican Grill, Inc, 2005 Annual Report, p. 24
t Year
f Franchise Royalties and Fees ($1000s)
s Restaurant
Sales ($1000s)
2001 267 131,331 2002 753 203,892 2003 1,493 314,027 2004 2,142 468,579 2005 2,618 625,077
Scatter Plot and Model Graph
Model Equation
( ) 20.05196 54.89 120, 000s f f f= + + Verbal Description
Based on data from 2001 − 2005, the restaurant sales of Chipotle Mexican Grill may be modeled by
( ) 20.05196 54.89 120, 000s f f f= + + thousand dollars where f is the amount of money earned from franchise royalties and fees (in thousand dollars) (Source: Chipotle Mexican Grill, Inc, 2005 Annual Report, p. 24).
Questions 1. What is the practical meaning of the coefficient 54.89 in the context of this model 2. What does the concavity of the graph tell us about this situation? 3. What is the derivative of this function and what does it represent in this context?

Make It Real Book of Mathematical Models
© Frank C. Wilson For noncommercial use 27
Projected National Health Expenditures: Public vs. Private (Quadratic)
Source: Statistical Abstract of the United States, 2006, Table 118
t Year
p Private
Expenditures Insurance and Out-of-Pocket
(billion dollars)
G Public
ExpendituresFederal and
State (billion dollars)
1960 20 7 1965 31 10 1970 45 28 1975 75 55 1980 141 105 1985 252 175 1990 414 283 1995 533 457 2000 718 592 2001 772 655 2002 841 718 2003 913 766
proj 2004 981 824 proj 2005 1045 891 proj 2006 1078 1000 proj 2007 1156 1077 proj 2008 1241 1158
Scatter Plot and Model Graph
proj 2009 1330 1243 Model Equation proj 2010 1421 1333 2( ) 0.000172 0.712 7.01G p p p= − −
Verbal Description Based on data from 1960 − 2003 and projections for 2004 − 2010, the amount of public money spent on health care may be modeled by
2( ) 0.000172 0.712 7.01G p p p= − − billion dollars where p is the amount of private money (out-of-pocket and private insurance) spent on health care (in billion dollars) (Source: Statistical Abstract of the United States, 2006, Table 118).
Questions 1. Of what practical value is this mathematical model? 2. Public health expenditures are funded by the public through taxes. At what rate are public expenditures expected to be increasing when the amount of private expenditures reaches 1500 billion dollars? 3.What does the concavity of this model indicates about health spending?

Make It Real Book of Mathematical Models
28 For noncommercial use © Frank C. Wilson
Medicare Enrollees (Quadratic)
Source: Statistical Abstract of the United States, 2006, Table 132
t Year
(Since 1980)
M Medicare Enrollees (millions)
0 28.4 10 34.3 15 37.6 20 39.7 21 40.1 22 40.5 23 41.1 24 41.7
Scatter Plot and Model Graph
Model Equation
( ) 20.00472 0.663 28.4M t t t= − + + Verbal Description
Based on data from 1980 − 2004, the number of Medicare enrollees (in millions) may be modeled by
( ) 20.00472 0.663 28.4M t t t= − + + million enrollees where t is the number of years since 1980 (Source: Modeled from Statistical Abstract of the United States, 2006, Table 132).
Questions 1. Of what value would this model be to a federal government policy maker? 2. At what rate is the number of Medicare enrollees projected to be increasing in 2010? 3. What is the practical meaning of the coefficient 0.663 in this model?

Make It Real Book of Mathematical Models
© Frank C. Wilson For noncommercial use 29
Prescriptions as a function of Medicare Enrollees (Quadratic)
Source: Statistical Abstract of the United States, 2006; Tables 126, 132 Years (since 1995)
t
Medicare Enrollees (Millions)
m
Prescriptions (millions)
p 0 37.6 2125 5 39.7 2865 6 40.1 3009 7 40.5 3139 8 41.1 3215 9 41.7 3274
Scatter Plot and Model Graph
Model Equation
( ) 243.74 3754 77180p m m m= − + − Verbal Description
Based on data from 1995 − 2004, the number of prescriptions (in millions) may be modeled by ( ) 243.74 3754 77180p m m m= − + −
where m is the number of Medicare enrollees (in millions) (Source: Modeled from Statistical Abstract of the United States, 2006; Tables 126, 132).
Questions 1. What does the concavity of the graph tell us about this situation? 2. According to the model, how many prescriptions will be written when there are 43 million Medicare employees? 3. How many Medicare Enrollees were there when 2500 million prescriptions were written?

Make It Real Book of Mathematical Models
30 For noncommercial use © Frank C. Wilson
Malaria Cases in Children Under 5 − Ghana (Quadratic)
Source: http://www.afro.who.int/malaria/country-profile/ghana.pdf
Years (since 1998)
t
Clinical Malaria Cases Reported
in Children under 5 years
C 0 576,563 1 1,126,807 2 1,303,685 3 1,316,724 4 966,923
Scatter Plot and Model Graph
Model Equation
( ) 2140,281 658,186 583,452C t t t= − + + Verbal Description
Based on data from 1998 − 2002, the number of clinical malaria cases reported in children under 5 years of age in Ghana may be modeled by
( ) 2140,281 658,186 583,452C t t t= − + + cases where t is the number of years since 1998 (Source: www.afro.who.int)
Questions 1. What is the vertex of the model and what does it mean in its real world context? 2. What is the practical meaning of the vertical intercept of the model? 3. What is the practical meaning of the coefficient 658,186 in this model?

Make It Real Book of Mathematical Models
© Frank C. Wilson For noncommercial use 31
Children Under 5 Sleeping Under Insecticide Treated Nets − Chad (Quadratic)
Source: http://www.afro.who.int/malaria/country-profile/chad.pdf
Year t
Proportion of Children Under 5
Sleeping under Insecticide Treated
Nets (ITN) C
2000 ( 0)t = 2%
2001 ( 1)t = 6.7%
2002 ( 2)t = 10.0%
2005 Goal 60.0%
Scatter Plot and Model Graph
Model Equation
( ) 21.725 2.975 2.000C t t t= + + using t = 0,1, 5
( ) 20.70 5.4 2.0C t t t= − + + using t = 0,1, 2 Verbal Description
Based on data from 2000 − 2001 and a goal for 2005, the proportion of children under 5 in Chad sleeping under insecticide treated nets may be modeled by
( ) 21.725 2.975 2.000C t t t= + + cases where t is the number of years since 2000 (Source: www.afro.who.int).
Based on data from 2000 − 2002, the proportion of children under 5 in Chad sleeping under insecticide treated nets may be modeled by
( ) 20.70 5.4 2.0C t t t= − + + cases where t is the number of years since 2000 (Source: www.afro.who.int).
Questions 1. What does the concavity of each model tell us about the rate at which the percentage of children sleeping under the ITNs in Chad is changing? 2. Of what value would these models be to a health worker combating malaria in Chad? 3. What is the difference between the average rates of change of the two models on the interval [0,5]?

Make It Real Book of Mathematical Models
32 For noncommercial use © Frank C. Wilson
Child Population in Madagascar (Quadratic)
Source: http://www.afro.who.int/malaria/country-profile/madagascar.pdf Years (since 1990)
t
Children Under 5 (thousands)
C 0 2120 7 2630 8 2707 9 2787 10 2859 11 2946 12 3036
Scatter Plot and Model Graph
Model Equation
( ) 20.6902 67.65 2120C t t t= + + Verbal Description
Based on data from 1990 − 2002, the number of children under 5 years of age in Madagascar may be modeled by
( ) 20.6902 67.65 2120C t t t= + + thousand children where t is the number of years since 1990 (Source: Modeled from World Health Organization data).
Questions 1. According to the model, what was the 1990 population of children under 5 years of age? 2. What is the derivative of the model and what does it represent? 3. What is the practical meaning of the coefficient 67.65 in this model?

Make It Real Book of Mathematical Models
© Frank C. Wilson For noncommercial use 33
Population in Equatorial Guinea (Quadratic) Source: www.afro.who.int
Years (since 1990)
t
Population (thousands)
P 0 352 7 421 8 432 9 444 10 457 11 470 12 483
Scatter Plot and Model Graph
Model Equation
( ) 20.2235 8.245 352.0P t t t= + + Verbal Description
Based on data from 1990 − 2002, the population of Equatorial Guinea may be modeled by ( ) 20.2235 8.245 352.0P t t t= + + people
where t is the number of years since 1990 (Source: www.afro.who.int). Questions
1. In 1990, there were 25,552 clinical malaria cases reported in Equatorial Guinea. If the same percentage of the population contracted malaria in 2010 as in 1990, how many people would be infected with the disease in 2010? 2. What is the practical meaning of the vertical intercept of the model? 3. According to the model, when will the population first reach 1,000,000?

Make It Real Book of Mathematical Models
34 For noncommercial use © Frank C. Wilson
US Population (Quadratic)
Source: Statistical Abstract of the United States, 2006; Table 2 Years (since 1990)
US Population (thousands)
0 250,132 1 253,493 2 256,894 3 260,255 4 263,436 5 266,557 6 269,667 7 272,912 8 276,115 9 279,295 10 282,402 11 285,329 12 288,173 13 291,028 14 293,907
Scatter Plot and Model Graph
Model Equation 2( ) 19.56 3407 250,100P t t t= − + +
Verbal Description Based on data from 1990 − 2004, the population of the United States may be modeled by
2( ) 19.56 3407 250,100P t t t= − + + thousand people where t is the number of years since 1990 (Source: Statistical Abstract of the United States, 2006; Table 2).
Questions 1. What is the meaning of the vertical intercept of the model? 2. What would be a practical domain for this model? 3. What is the derivative of this function and what does it represent in a real world context?

Make It Real Book of Mathematical Models
© Frank C. Wilson For noncommercial use 35
Wal−Mart Net Sales (Quadratic)
Source: Wal-Mart Annual Report, 2006, p.18 − 19
Year (since 1996)
Net Sales (billions of
dollars) S
0 89 1 100 2 112 3 131 4 156 5 181 6 204 7 230 8 256 9 285 10 312
Scatter Plot and Model Graph
Model Equation 2( ) 0.8636 14.39 84.72s t t t= + +
Verbal Description Based on data from 1996 − 2006, the net sales of Wal-Mart may be modeled by
2( ) 0.8636 14.39 84.72s t t t= + + billion dollars where t is the number of years since 1996 (Source: Modeled from Wal-Mart Annual Report, 2006, p.18 − 19).
Questions 1. What are the predicated net sales of Wal-Mart for 2010? 2. According to the raw data, what was the average rate of change in sales between 2000 and 2006? 3. What is the value of (7)s′ and how does it compare to the average rate of change computation in question (2)?

Make It Real Book of Mathematical Models
36 For noncommercial use © Frank C. Wilson
Hospital Beds as a function of Hospitals (Quadratic)
Source: Health, United States, 2006, p. 364 Year
t Hospitals
h Beds
b 1975 7,156 1,465,828 1980 6,965 1,364,516 1985 6,872 1,317,630 1990 6,649 1,213,327 1991 6,634 1,201,529 1992 6,539 1,177,848 1993 6,467 1,163,460 1994 6,374 1,128,066 1995 6,291 1,080,601 1996 6,201 1,061,688 1997 6,097 1,035,390 1998 6,021 1,012,582 1999 5,890 993,866 2000 5,810 983,628 2001 5,801 987,440 2002 5,794 975,962
2003 5,764 965,256
Scatter Plot and Model Graph
2004 5,759 955,768 Model Equation 2( ) 0.1457 1527 4,931,000b h h h= − +
Verbal Description Based on data from 1975 − 2004, the number of hospital beds as a function of the number of hospitals may be modeled by
2( ) 0.1457 1527 4,931,000b h h h= − + where h is the number of hospitals (Source: Health, United States, 2006, p. 364 ).
Questions 1. From the graph of the model, it appears that the hospital bed function is concave up and increasing. Nevertheless, from the data we see that the number of hospital beds has been decreasing every year. Do the graph and the raw data conflict? Explain. 2. According to the model, what is the minimum number of hospital beds that there will ever be and how many hospitals will there be at that time? 3. If we modeled hospitals as a function of hospital beds, what would be the concavity of the resultant graph? Explain.

Make It Real Book of Mathematical Models
© Frank C. Wilson For noncommercial use 37
Non-Federal Hospitals as a Function of Federal Hospitals (Quadratic)
Source: Health, United States, 2006
Year t
Federal Hospitals
f
Non-Federal
Hospitalsn
1975 382 6,774 1980 359 6,606 1985 343 6,529 1990 337 6,312 1991 334 6,300 1992 325 6,214 1993 316 6,151 1994 307 6,067 1995 299 5,992 1996 290 5,911 1997 285 5,812 1998 275 5,746 1999 264 5,626 2000 245 5,565 2001 243 5,558 2002 240 5,554 2003 239 5,525
Scatter Plot and Model Graph
2004 239 5,520 Model Equation
2( ) 0.01725 1.469 4880n f f f= − + Verbal Description
Based on data from 1975 − 2004, the number of non-federal hospitals may be modeled by 2( ) 0.01725 1.469 4880n f f f= − + non-federal hospitals
where f is the number of federal hospitals. (Source: Modeled from Health, United States 2006.)
Questions 1. From the data, what tends to happen to the number of nonfederal hospitals as the number of federal hospitals decreases? 2. At what rate is the number of nonfederal hospitals changing? 3. What does the vertical intercept of the function model mean in this context? Does its meaning make sense in a real world sense?

Make It Real Book of Mathematical Models
38 For noncommercial use © Frank C. Wilson
Consumer Spending on Books: Adult Trade (Quadratic)
Source: Statistical Abstract of the United States 2007, Table 1119
Year t
Years (since 2004)
x
Adult Trade Book
Spending (million dollars)
b 2004 0 14,952.1 2005 1 15,532.4 2006* 2 15,937.2 2007* 3 16,370.1 2008* 4 16,670.0 2009* 5 16,985.4
* projected
Scatter Plot and Model Graph
Model Equation 2( ) 31.15 556.1 14970b x x x= − + +
Verbal Description Based on data from 2004−2005 and projections for 2006 − 2009, the amount of money spent by consumers on books classified as adult trade may be modeled by
2( ) 31.15 556.1 14970b x x x= − + + million dollars where x is the number of years since 2004. (Source: Modeled from Statistical Abstract of the United States 2007, Table 1119.)
Questions 1. According to the model, it what year will the amount of money spend by consumers on adult trade books reach a maximum? 2. What is the practical meaning of the vertex of the model graph in this context? 3. What does the concavity of the graph mean in this context?

Make It Real Book of Mathematical Models
© Frank C. Wilson For noncommercial use 39
US Oil Production Versus Oil Imports (Quadratic)
Source: Statistical Abstract of the United States 2007, Table 881
Year x
Years (since1985)
t
US Oil Field Production minus Net
Imports of Oil (million barrels)
b 1985 0 2,180 1986 1 1,700 1987 2 1,396 1988 3 1,172 1989 4 698 1990 5 573 1991 6 639 1992 7 423 1993 8 58 1994 9 −111 1995 10 −199 1996 11 −342 1997 12 −608 1998 13 −856 1999 14 −997 2000 15 −1,176 2001 16 −1,280 2002 17 −1,236
Scatter Plot and Model Graph
2003 18 −1,450 Model Equation 2004 19 −1,699 2( ) 4.294 278.3 2251b t t t= − +
Verbal Description Based on data from 1985 − 2004, the difference between US oil field production and net oil imports may be modeled by
2( ) 4.294 278.3 2251b t t t= − + million barrels where t is the number of years since 1985. (Source: Modeled from Statistical Abstract of the United States 2007, Table 881)
Questions 1. What are the horizontal intercepts of the function model? Do they make sense in their real world context? 2. If you were a political leader in the United States, how could you use this model to persuade your colleagues in Congress to adopt your position on oil policy? 3. What is the derivative of the function model and what does it represent in this context?

Make It Real Book of Mathematical Models
40 For noncommercial use © Frank C. Wilson
Yogurt Production (Quadratic)
Source: Statistical Abstract of the United States 2007, Table 846
Year t
Years (since 1997)
x
Yogurt (million pounds)
y 1997 0 1,574 1998 1 1,639 1999 2 1,717 2000 3 1,837 2001 4 2,003 2002 5 2,311 2003 6 2,507 2004 7 2,707 2005 8 2,990
Scatter Plot and Model Graph
Model Equation 2( ) 14.99 62.14 1555y x x x= + +
Verbal Description Based on data from 1997 − 2005, the amount of yogurt produced in the United States annually may be modeled by
2( ) 14.99 62.14 1555y x x x= + + million pounds where x is the number of years since 1997. (Source: Modeled from Statistical Abstract of the United States 2007, Table 846.)
Questions 1. According to the model, at what rate was oil production in the United States increasing at the end of 2005? 2. According to the model, when will the yogurt production reach 4 billion pounds? 3. According to the model, what will the yogurt production be in 2010?

Make It Real Book of Mathematical Models
© Frank C. Wilson For noncommercial use 41
White Births as a function of All Births (Quadratic)
Source: Statistical Abstract of the United States 2007, Table 83
Years (since 1990
t
Total Live Births
(Thousands) b
Live Births to Women Racially
Classified as “White” (thousands)
w 0 1,165 670 5 1,254 785 9 1,308 840 10 1,347 866 11 1,349 880 12 1,366 904 13 1,416 947 14 1,470 983
Scatter Plot and Model Graph
Model Equation 2( ) 0.000919 3.45 2100w b b w= − + −
Verbal Description Based on data from 1990 − 2004, the number of births to mothers racially classified as white may be modeled by
2( ) 0.000919 3.45 2100w b b w= − + − thousand live births where b is the number of lives births of all women (in thousands). (Source: Modeled from Statistical Abstract of the United States 2007, Table 83.)
Questions 1. What does the concavity of the graph tell us about the relationship between the number of live births to “white” mothers as compared to the total number of live births? 2. What is the derivative of the model and what does it represent in its real world context? 3. When the number of live births reaches 1,500,000 per year, how many live births are projected to be to women who are racially classified as white?

Make It Real Book of Mathematical Models
42 For noncommercial use © Frank C. Wilson
Arizona Virtual Academy Enrollment (Quadratic)
Source: Arizona Virtual Academy Fact Sheet
Year t
Years (since
2003−04) x
Enrolled Students
s
2003−04 0 335 2004 −05 1 770 2005−06 2 1650 2006−07 3 2650
Scatter Plot and Model Graph
Model Equation 2( ) 141.25 358.75 318.75s x x x= + +
Verbal Description Based on data from 2003−04 through 2006-07, the number of students enrolled in the Arizona Virtual Academy may be modeled by
2( ) 141.25 358.75 318.75s x x x= + + students where x is the number of years since 2003−04. (Source: Modeled from Arizona Virtual Academy Fact Sheet)
Questions 1. According to the model, what will be the enrollment in 2008 − 2009? 2. If you were an executive at the Arizona Virtual Academy, of what value would this model be to you? 3. Do you think the model will be valid for 2020 − 2021? Explain.

Make It Real Book of Mathematical Models
© Frank C. Wilson For noncommercial use 43
USAA Net Worth (Quadratic)
Source: The Legacy of Membership: USAA 2006 Report to Members
Year t
Years (since 1999)
x
USAA Net
Worth (billion dollars)
w 1999 0 6.9 2000 1 7.1 2001 2 7.4 2002 3 7.9 2003 4 9.1 2004 5 10.1 2005 6 11.2 2006 7 13.1
Scatter Plot and Model Graph
Model Equation 2( ) 0.1238 0.004762 6.917w x x x= + +
Verbal Description Based on data from 1999 − 2006, the net worth of USAA may be modeled by
2( ) 0.1238 0.004762 6.917w x x x= + + billion dollars where x is the number of years since 1999. (Source: Modeled from The Legacy of Membership: USAA 2006 Report to Members)
Questions 1. According to the model, what will be the enrollment in 2008 − 2009? 2. If you were an executive at the Arizona Virtual Academy, of what value would this model be to you? 3. Do you think the model will be valid for 2020 − 2021? Explain.

Make It Real Book of Mathematical Models
44 For noncommercial use © Frank C. Wilson
National Football League Salaries (Quadratic)
Source: Statistical Abstract of the United States 2007, Table 1228
Year t
Years (since 2000)
x
NFL Player
Average Salary
(thousand dollars)
s 2000 0 787 2001 1 986 2002 2 1,180 2003 3 1,259 2004 4 1,331 2005 5 1,400
Scatter Plot and Model Graph
Model Equation 2( ) 20.33 221.1 790.6s x x x= − + +
Verbal Description Based on data from 2000 − 2005, the average NFL player salary may be modeled by
2( ) 20.33 221.1 790.6s x x x= − + + thousand dollars where x is the number of years since 2000. (Source: Modeled from Statistical Abstract of the United States 2007, Table 1228)
Questions 1. According to the model, what will be the enrollment in 2008 − 2009? 2. If you were an executive at the Arizona Virtual Academy, of what value would this model be to you? 3. Do you think the model will be valid for 2020 − 2021? Explain.

Make It Real Book of Mathematical Models
© Frank C. Wilson For noncommercial use 45
Aerospace Products Industry Employees (Quadratic) Source: Statistical Abstract of the United States 2007, Table 980
Year t
Years (since 1990)
x
Aerospace Products and Parts Industry
Employees (thousands)
e 1990 0 841 2000 10 517 2002 12 470 2003 13 442 2004 14 442 2005 15 456
Scatter Plot and Model Graph
Model Equation 2( ) 1.396 47.62 841.9E x x x= − +
Verbal Description Based on data from 1990 − 2005, the number of employees in the U.S. aerospace products and parts industry may be modeled by
2( ) 1.396 47.62 841.9E x x x= − + thousand employees where x is the number of years since 1990. (Source: Modeled from Statistical Abstract of the United States 2007, Table 980.)
Questions 1. According to the model, would now be a good time to pursue a degree in the aerospace products and parts industry? Explain. 2. According to the raw data, would now be a good time to pursue a degree in the aerospace products and parts industry? Explain. 3. What is the derivative of the model and what does it mean in its real world context?

Make It Real Book of Mathematical Models
46 For noncommercial use © Frank C. Wilson
Abortion Rate (Quadratic)
Source: Statistical Abstract of the United States 2007, Table 96
Year t
Years (since 1985)
x
Abortions (Per 1000
Live Births)
a 1985 0 422 1990 5 389 1995 10 350 2000 15 324 2001 16 325 2002 17 319
Scatter Plot and Model Graph
Model Equation 2( ) 0.1267 8.339 423.5a x x x= − +
Verbal Description Based on data from 1985 − 2002, the abortion rate in the United States may be modeled by
2( ) 0.1267 8.339 423.5a x x x= − + abortions per 1000 live births where x is the number of years since 1985. (Source: Modeled from Statistical Abstract of the United States 2007, Table 96.)
Questions 1. What is the vertex of the model and what does it mean in its real world context? 2. Abortion is one of the most divisive issues in American society. How could activists on
both sides of the issue benefit from the abortion rate model? 3. According to the model, when will the abortion rate stop decreasing and what will be
the abortion rate at that time?

Make It Real Book of Mathematical Models
© Frank C. Wilson For noncommercial use 47
Computer and Electronic Products Industry Employees (Quadratic)
Source: Statistical Abstract of the United States 2007, Table 980
Year t
Years (since 2000)
x
Computer and
Electronic Products Industry
Employees (thousands)
E 2000 0 1,820 2002 2 1,507 2003 3 1,355 2004 4 1,323 2005 5 1,320
Scatter Plot and Model Graph
Model Equation 2( ) 23.20 218.1 1825E x x x= − +
Verbal Description Based on data from 2000 − 2005, the number of computer and electronic products industry employees in the United States may be modeled by
2( ) 23.20 218.1 1825E x x x= − + thousand employees where x is the number of years since 2000. (Source: Modeled from Statistical Abstract of the United States 2007, Table 980.)
Questions 1. What does the model forecast will happen to the number of computer and electronics industry employees in the United States between 2005 and 2010? 2. What is the derivative of the model and what does it represent in it real world context? 3. Do you think the model is a realistic predictor for the computer and electronics
industry? Explain.

Make It Real Book of Mathematical Models
48 For noncommercial use © Frank C. Wilson
Disneyland Tickets − Adults (Quadratic)
Source: www.disneyland.com
Days in
Park d
2007 Park Hopper® Bonus
Ticket Cost (dollars)
T
1 83 2 122 3 159 4 179 5 189
Scatter Plot and Model Graph
Model Equation 2( ) 5.357 59.04 28.20T d d d= − + +
Verbal Description Based on 2007 ticket prices, the cost of an adult Disney Park Hopper® Bonus Ticket may be modeled by
2( ) 5.357 59.04 28.20T d d d= − + + dollars where d is the number of days that the ticket authorizes entrance into Disneyland and Disney California Adventure.
Questions 1. What is the practical meaning of each of the parameters of the model? 2. What is the practical domain of the function? 3. What does the concavity of the graph tells us about the additional cost for increasing the
number of days in the park by one day?

Make It Real Book of Mathematical Models
© Frank C. Wilson For noncommercial use 49
Disneyland Tickets − Children (Quadratic)
Source: www.disneyland.com
Days in
Park d
2007 Park Hopper® Bonus
Ticket Cost (dollars)
T 1 73 2 102 3 129 4 149 5 159
Scatter Plot and Model Graph
Model Equation 2( ) 3.214 41.19 34.2T d d d= − + +
Verbal Description Based on 2007 ticket prices, the cost of a child’s Disney Park Hopper® Bonus Ticket may be modeled by
2( ) 3.214 41.19 34.2T d d d= − + + dollars where d is the number of days that the ticket authorizes entrance into Disneyland and Disney California Adventure.
Questions 1. What is the practical meaning of each of the parameters of the model? 2. What is the practical domain of the function? 3. According to the model, what would be the price of a 6-day ticket, if it were offered?

Make It Real Book of Mathematical Models
50 For noncommercial use © Frank C. Wilson
Johnson and Johnson Net Income (Quadratic )
Source: Johnson and Johnson Annual Report, 2001, p. 18
t Years (Since 1990)
I Net Income (Millions of
Dollars)
0 1,195 1 1,441 2 1,572 3 1,786 4 1,998 5 2,418
6 2,958 7 3,385 8 3,798
9 4,348 10 4,998 11 5,899
Scatter Plot and Model Graph
Model Equation 2( ) 29.44 88.59 1254N t t t= + +
Verbal Description Based on data from 1990 − 2001, the net income of Johnson and Johnson Company may be modeled by
2( ) 29.44 88.59 1254N t t t= + + million dollars where t is the number of years since 1990. (Source: Johnson and Johnson Annual Report, 2001, p. 18)
Questions 1. What is the practical meaning of each of the parameters of the model? 2. According to the model, what will be the net income of Johnson & Johnson in 2007? 3. What is the derivative of the model and what does it represent?

Make It Real Book of Mathematical Models
© Frank C. Wilson For noncommercial use 51
Federal and State Prison Rate (Quadratic)
Source: Statistical Abstract of the United States, 2001; Table 332, p. 200
t Years (Since 1980)
R Rate
(prisoners per 100,000 people)
0 139 2 171 4 188 6 217 8 247 10 297
12 332 14 389 16 427
18 461
Scatter Plot and Model Graph
Model Equation 2( ) 0.3750 11.70 138.7R t t t= + +
Verbal Description Based on data from 1980 − 1998, the combined prison rate for federal and state prisons may be modeled by
2( ) 0.3750 11.70 138.7R t t t= + + prisoners per 100,000 people where t is the number of years since 1980 (Source: Statistical Abstract of the United States, 2001; Table 332, p. 200).
Questions 1. What is the projected prison rate for 2010? 2. At what rate was the prison rate expected to be increasing in 2010? 3. What do the parameters of the model represent in their real world context?

Make It Real Book of Mathematical Models
52 For noncommercial use © Frank C. Wilson
Cubic and Quartic Models

Make It Real Book of Mathematical Models
© Frank C. Wilson For noncommercial use 53
USAA Products (Cubic)
Source: The Legacy of Membership: USAA 2006 Report to Members
Year t
Years (since 1999)
x
USAA products (millions)
p 1999 0 14.7 2000 1 15.9 2001 2 16.8 2002 3 17.6 2003 4 18.4 2004 5 19.8 2005 6 21.8 2006 7 23.9
Scatter Plot and Model Graph
Model Equation 3 2( ) 0.02904 1972 1.279 14.74p x x x x= − + +
Verbal Description Based on data from 1999 − 2006, the number of products of United Services Automobile Association may be modeled by
3 2( ) 0.02904 1972 1.279 14.74p x x x x= − + + million products where x is the number of years since 1999. (Source: Modeled from The Legacy of Membership: USAA 2006 Report to Members)
Questions 1. According to the model, what will be the number of products in 2008? 2. What is the difference in the growth rate in products between 1999 and 2003 as compared to 2003 through 2006? (Explain how they are different. Don’t calculate the difference.) 3. According to the model, in what year was the number of members increasing the most slowly?

Make It Real Book of Mathematical Models
54 For noncommercial use © Frank C. Wilson
USAA Membership (Cubic)
Source: The Legacy of Membership: USAA 2006 Report to Members
Year t
Years (since 1999)
x
USAA members (millions)
m 1999 0 4.1 2000 1 4.4 2001 2 4.6 2002 3 4.8 2003 4 5.0 2004 5 5.2 2005 6 5.5 2006 7 5.9
Scatter Plot and Model Graph
Model Equation 3 2( ) 0.005808 0.05206 0.3365 4.102m x x x x= − + +
Verbal Description Based on data from 1999 − 2006, the number of members of United Services Automobile Association may be modeled by
3 2( ) 0.005808 0.05206 0.3365 4.102m x x x x= − + + million members where x is the number of years since 1999. (Source: Modeled from The Legacy of Membership: USAA 2006 Report to Members)
Questions 1. According to the model, what will be the number of members in 2008? 2. Where does the inflection point of the model occur and what does it mean in this real world context? 3. According to the model, in what year was the number of members increasing the most slowly?

Make It Real Book of Mathematical Models
© Frank C. Wilson For noncommercial use 55
Number of Nonbusiness Chapter 11 Bankruptcies(Cubic)
Source: Statistical Abstract of the United States, 2006, Table 749
t Years (Since 1998)
B Bankruptcies
0 981 1 731 2 722 3 745 4 894 5 966 6 935
Scatter Plot and Model Graph
Model Equation
( ) 3 212.58 134.1 358.8 979.2B t t t t= − + − + Verbal Description
Based on data from 1998 − 2004, the number of nonbusiness Chapter 11 bankruptcies may be modeled by
( ) 3 212.58 134.1 358.8 979.2B t t t t= − + − + bankruptcies where t is the number of years since 1998. (Source: Modeled from Statistical Abstract of the United States, 2006, Table 749)
Questions 1. According to the model, what is the expected number of nonbusiness Chapter 11
bankruptcies for 2006 and 2007? Do these predictions seem reasonable? 2. What is the derivative of the model and what does it represent in its real world context? 3. What are the relative extrema of the model and what do they represent in their real world context?

Make It Real Book of Mathematical Models
56 For noncommercial use © Frank C. Wilson
Egg Production (Cubic)
Source: Statistical Abstract of the United States, 2006, Table 842
t Year (Since 1990)
E Egg
Production (billions)
0 68.1 5 74.8 7 77.5 8 79.8 9 82.9 10 84.7 11 86.1 12 87.3 13 87.5
14 89.1
Scatter Plot and Model Graph
Model Equation
( ) 3 20.0125 0.266 0.199 68.1E t t t t= − + + + Verbal Description
Based on data from 1990 − 2004, the number of eggs produced in the United States may be modeled by
( ) 3 20.0125 0.266 0.199 68.1E t t t t= − + + + billion eggs where t is the number of years since 1990 (Source: Statistical Abstract of the United States, 2006, Table 842)
Questions 1. According to the model, how many eggs were produced in 1996? 2. According to the model, what will be the maximum number of eggs produced between 1990 and 2010? 3. What is the inflection point of the model and what does it represent in its real world context?

Make It Real Book of Mathematical Models
© Frank C. Wilson For noncommercial use 57
Per Capita Consumer Spending on Physician Services by Year (Cubic)
Source: Statistical Abstract of the United States, 2006, Table 121
t Year
(Since 1990)
P Per Capita
Spending on Physician and
Clinical Services (dollars)
0 619 5 813 8 914 9 954 10 1010 11 1085 12 1162 13 1249
Scatter Plot and Model Graph
Model Equation
( ) 3 20.3639 5.252 55.3 619.3P t t t t= − + + Verbal Description
Based on data from 1990 − 2003, the per capita spending on physician and clinical services in the United States may be modeled by
( ) 3 20.3639 5.252 55.3 619.3P t t t t= − + + dollars where t is the number of years since 1999. (Source: Modeled from Statistical Abstract of the United States, 2006, Table 121)
Questions 1. According to the model, what was the per capita spending in 1997? 2. Where does the inflection point of the model occur and what does it mean in this real
world context? 3. What does the concavity of the model graph tell us about the rate at which per capita
spending on physician and clinical services is increasing?

Make It Real Book of Mathematical Models
58 For noncommercial use © Frank C. Wilson
Per Capita Spending on Health Services and Supplies by Year (Cubic)
Source: Statistical Abstract of the United States, 2006, Table 121
t Year
(Since 1990)
T Total Per Capita
Spending on Health Services
and Supplies (dollars)
0 2633 5 3530 8 3962 9 4154 10 4389 11 4733 12 5115 13 5452
Scatter Plot and Model Graph
Model Equation
( ) 3 21.676 24.69 257.3 2635T t t t t= − + + Verbal Description
Based on data from 1990 − 2003, the per capita spending on health services and supplies in the United States may be modeled by
( ) 3 21.676 24.69 257.3 2635T t t t t= − + + dollars where t is the number of years since 1999. (Source: Modeled from Statistical Abstract of the United States, 2006, Table 121)
Questions 1. According to the model, what was the per capita health service and supply spending in 2002? 2. Where does the inflection point of the model occur and what does it mean in this real
world context? 3. What does the concavity of the model graph tell us about the rate at which per capita
spending on health service and supply spending is increasing?
Make It Real Book of Mathematical Models
© Frank C. Wilson For noncommercial use 59
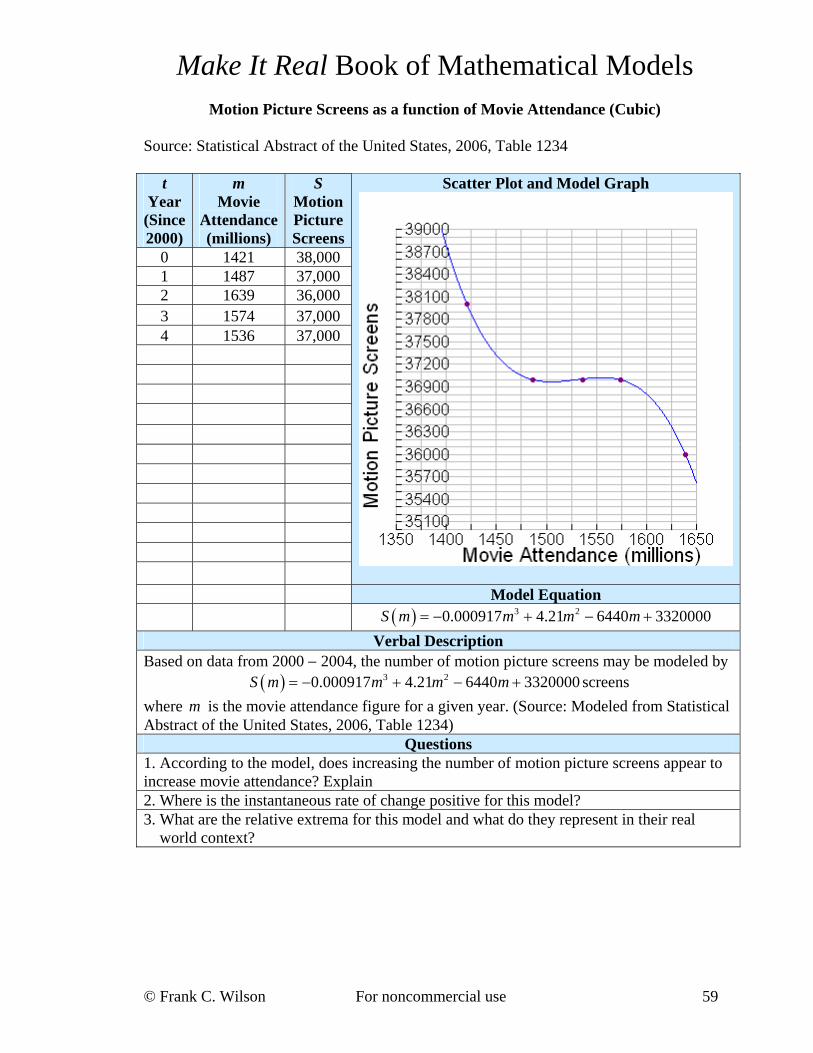
Motion Picture Screens as a function of Movie Attendance (Cubic)
Source: Statistical Abstract of the United States, 2006, Table 1234
t Year (Since 2000)
m Movie
Attendance (millions)
S Motion Picture Screens
0 1421 38,000 1 1487 37,000 2 1639 36,000 3 1574 37,000 4 1536 37,000
Scatter Plot and Model Graph
Model Equation
( ) 3 20.000917 4.21 6440 3320000S m m m m= − + − + Verbal Description
Based on data from 2000 − 2004, the number of motion picture screens may be modeled by ( ) 3 20.000917 4.21 6440 3320000S m m m m= − + − + screens
where m is the movie attendance figure for a given year. (Source: Modeled from Statistical Abstract of the United States, 2006, Table 1234)
Questions 1. According to the model, does increasing the number of motion picture screens appear to increase movie attendance? Explain 2. Where is the instantaneous rate of change positive for this model? 3. What are the relative extrema for this model and what do they represent in their real
world context?

Make It Real Book of Mathematical Models
60 For noncommercial use © Frank C. Wilson
Pager Sales as a function of Cell Phone Sales (Cubic)
Source: Statistical Abstract of the United States, 2006, Table 1003
t Year (since 2000)
p Pager Sales
(millions of dollars
C Cell
Phone Sales
(millions of
dollars) 0 750 8995 1 790 8651 2 810 8106 3 729 9163 4 675 10538
Scatter Plot and Model Graph
Model Equation
( ) 3 20.002745 6.173 4633 1,169,000C p p p p= − + − + Verbal Description
Based on data from 2000 − 2004, cell phone sales may be modeled by ( ) 3 20.002745 6.173 4633 1,169,000C p p p p= − + − + million dollars
where p is the pager sales (in millions of dollars) for the same year. (Source: Modeled from Statistical Abstract of the United States, 2006, Table 1003)
Questions 1. Does it seem reasonable that cell phone and pager sales are related? Explain. 2. When pager sales are around 730 million dollars, the concavity of the graph changes.
What does this imply in the real world context? 3. Does this model have any relative extrema? Explain.

Make It Real Book of Mathematical Models
© Frank C. Wilson For noncommercial use 61
Male Life Expectancy as a function of Female Life Expectancy (Cubic)
Source: Statistical Abstract of the United States, 2006, Table 96
t Birth Year
m Male Life
Expectancy (years)
f Female
Life Expectancy
(years) 1980 70.0 77.4 1982 70.8 78.1 1983 71.0 78.1 1984 71.1 78.2 1985 71.1 78.2 1986 71.2 78.2 1987 71.4 78.3 1988 71.4 78.3 1989 71.7 78.5 1990 71.8 78.8 1991 72.0 78.9 1992 72.3 79.1 1993 72.2 78.8 1994 72.3 79.0 1995 72.5 78.9 1996 73.0 79.0 1997 73.6 79.4 1998 73.8 79.5 1999 73.9 79.4 2000 74.3 79.7 2002 74.5 79.9 2003 74.8 80.1
Scatter Plot and Model Graph
2005 74.9 80.7 Model Equation
2010 75.6 81.4 ( ) 3 20.045645 9.9292 720.34 17350f m m m m= − + − Verbal Description
Based statistical data, the life expectancy of an American female may be modeled by ( ) 3 20.045645 9.9292 720.34 17350f m m m m= − + − years
where m is the life expectancy of an American male (in years). (Source: Modeled from Statistical Abstract of the United States, 2006, Table 96)
Questions 1. The model is increasing everywhere. What does this mean in its real world context? 2. At what male life expectancy is the female life expectancy increasing most slowly? 3. What does the concave up portion of the graph tell us about the relationship between male
and female life expectancies?

Make It Real Book of Mathematical Models
62 For noncommercial use © Frank C. Wilson
Per Capita Pineapple Consumption as a function of Other Fruit Consumption
(Cubic)
Source: Statistical Abstract of the United States, 2006, Table 203
t Year
f Other fruits*
(pounds)
p Pineapple (pounds)
1999 7.6 3.0 2000 8.1 3.2 2001 8.3 3.2 2002 8.8 3.8 2003 9.0 4.4
*Apricots, avocados, cherries, cranberries, kiwifruit, mangoes, papayas, and honeydew melons.
Scatter Plot and Model Graph
Model Equation 3 2( ) 1.462 35.40 285.9 766.4p f f f f= − + −
Verbal Description Based on data from 1999 − 2003, the number of pounds of pineapple eaten per person may be modeled by
3 2( ) 1.462 35.40 285.9 766.4p f f f f= − + − pounds where f is the average number of pounds of apricots, avocados, cherries, cranberries, kiwifruit, mangoes, papayas, and honeydew melons eaten per person in a given year. (Source: Modeled from Statistical Abstract of the United States, 2006, Table 203)
Questions 1. According to the model, will the rate of change in pineapple consumption ever be zero? 2. Where is the instantaneous rate of change positive for this model? 3. What is the second derivative of the model and what does it represent in its real world
context?

Make It Real Book of Mathematical Models
© Frank C. Wilson For noncommercial use 63
Chipotle Mexican Grill Earnings Per Share (Cubic)
Source: Chipotle Mexican Grill, Inc, 2005 Annual Report, p. 24
t Year (Since 2001)
E Earnings per
Common Share (dollars)
0 −1.49 1 −0.87 2 −0.34 3 0.24 4 1.43
Scatter Plot and Model Graph
Model Equation
( ) 3 20.0583 0.265 0.857 1.50E t t t t= − + − Verbal Description
Based on data from 2001 − 2005, the earnings per share of Chipotle Mexican Grill may be modeled by
( ) 3 20.0583 0.265 0.857 1.50E t t t t= − + − dollars where t is the number of years since 2001. (Source: Modeled from Chipotle Mexican Grill, Inc, 2005 Annual Report, p. 24)
Questions 1. If you were an investor in Chipotle Mexican Grill, of what value would this model be to you? 2. What is the real world meaning of the horizontal and vertical intercepts of this model? 3. Where is the derivative of the model negative? What does this mean in its real world
context?

Make It Real Book of Mathematical Models
64 For noncommercial use © Frank C. Wilson
Mail Order Prescriptions as a function of Supermarket Prescriptions (Cubic)
Source: Statistical Abstract of the United States, 2006, Table 126
Years (since 1995)
t
Prescriptions Filled at
Supermarkets (millions)
s
Prescriptions Filled by
Mail Order (millions)
m 0 221 86 2 269 109 3 306 123 4 357 134 5 394 146 6 418 161 7 444 174 8 462 189 9 470 214
Scatter Plot and Model Graph
Model Equation 3 2( ) 0.00001702 0.01666 5.641 531.6m s s s s= − + −
Verbal Description Based on data from 1995 − 2004, the number of prescriptions filled by mail order may be modeled by
3 2( ) 0.00001702 0.01666 5.641 531.6m s s s s= − + − million prescriptions where s is the number of prescriptions filled by supermarkets in the same year. (Source: Modeled from Statistical Abstract of the United States, 2006, Table 126)
Questions 1. Of what practical value is the model to pharmaceutical industry executives? 2. An alternate way to write ( )m s is ( )m f s= where s is the independent variable
(representing supermarket-filled prescriptions) and m is the dependent variable (representing mail order prescriptions). What does ( )1 122 305f − = mean in its real world context?
3. What is (350)m′ and what does it represent in this context?

Make It Real Book of Mathematical Models
© Frank C. Wilson For noncommercial use 65
Prescription Retail Sales as a function of Prescriptions (Cubic)
Source: Statistical Abstract of the United States, 2006; Table 126
Years (since 1995)
t
Prescriptions (millions)
p
Prescription Retail Sales (millions of
dollars) s
0 2,125 72,200 2 2,316 93,800 3 2,481 108,700 4 2,707 125,800 5 2,865 145,600 6 3,009 164,100 7 3,139 182,700 8 3,215 203,100 9 3,274 221,000
Scatter Plot and Model Graph
Model Equation 3 2( ) 0.0001210 0.9224 2422 2072000s p p p p= − + −
Verbal Description Based on data from 1995 − 2004, the prescription retail sales may be modeled by
3 2( ) 0.0001210 0.9224 2422 2072000s p p p p= − + − million dollars where p is the number of prescriptions written (in millions) in the same year. (Source: Modeled from Statistical Abstract of the United States, 2006, Table 126)
Questions 1. Of what practical value is the model to pharmaceutical industry executives? 2. What does the concavity of the graph tell us about the rate of change in prescription retail
sales? 3. What is the instantaneous rate of change in the model at its inflection point and what does
this represent in its real world context?

Make It Real Book of Mathematical Models
66 For noncommercial use © Frank C. Wilson
Fast Food Restaurant Sales as a function of Years (Cubic)
Source: Statistical Abstract of the United States, 2006; Table 1269
Years (since 1990)
t
Restaurant Sales (millions of dollars)
S 0 69,798 5 92,901 10 107,147 12 115,717 13 121,040 14 128,182 15 134,206
Scatter Plot and Model Graph
Model Equation
( ) 3 227.42 573.4 6760 69840S t t t t= − + + Verbal Description
Based on data from 1990 − 2005, fast food restaurant sales may be modeled by ( ) 3 227.42 573.4 6760 69840S t t t t= − + + million dollars
where t is the number of year since 1990. (Source: Modeled from Source: Statistical Abstract of the United States, 2006; Table 1269)
Questions 1. According to the model, in what year between 1990 and 2005 were fast food restaurant
sales increasing most slowly? 2. What are restaurant sales predicted to be in 2008? 3. An alternate way to write ( )S t is ( )S f t= where t is the independent variable
(representing years since 1990) and S is the dependent variable (representing fast food restaurant sales). What does ( )1 107,520 10f − = mean in its real world context?

Make It Real Book of Mathematical Models
© Frank C. Wilson For noncommercial use 67
Prescription Drug Sales as a function of the US Population (Cubic)
Source: Statistical Abstract of the United States, 2006, Table 126
Year US
Population (millions)
Retail Prescription Drug Sales
(billion dollars)
1997 272.9 93.8 1998 276.1 108.7 1999 279.3 125.8 2000 282.4 145.6 2001 285.3 164.1 2002 288.2 182.7 2003 291.0 203.1 2004 293.9 221.0
Scatter Plot and Model Graph
Model Equation 3 2( ) 0.003819 3.301 944.4 89590s p p p p= − + − +
Verbal Description Based on data from 1997 − 2004, retail prescription drug sales may be modeled by
3 2( ) 0.003819 3.301 944.4 89590s p p p p= − + − + billion dollars where p is the number of people in the United States (in millions) (Source: Statistical Abstract of the United States, 2006; Tables 2, 126).
Questions 1. A classmate argues that a simpler model could be used to model this data set. What model
might she recommend and why? 2. Calculate and interpret the meaning of ( )s p′ at 290, 295, and 300p = 3. At what population level does the model forecast that retail prescription drug sales will
reach a maximum?

Make It Real Book of Mathematical Models
68 For noncommercial use © Frank C. Wilson
Consumer Spending on Books (Cubic)
Source: Statistical Abstract of the United States 2007, Table 1119
Year t
Years (since 2004)
x
Consumer Spending on Books
(million dollars) b
2004 0 49,146.6 2005 1 51,919.8 2006* 2 53,723.8 2007* 3 55,546.9 2008* 4 57,194.3 2009* 5 58,875.2
* projected
Scatter Plot and Model Graph
Model Equation 3 2( ) 41.01 416.3 2999 49180b x x x x= − + +
Verbal Description Based on data from 2004−2005 and projections for 2006 − 2009, the amount of money spent by consumers on books may be modeled by
3 2( ) 41.01 416.3 2999 49180b x x x x= − + + million dollars where x is the number of years since 2004. (Source: Modeled from Statistical Abstract of the United States 2007, Table 1119.)
Questions 1. Of what practical value is the model to book retailers? 2. On what interval(s) is the function increasing? 3. On what interval(s) is the graph of the function concave up?

Make It Real Book of Mathematical Models
© Frank C. Wilson For noncommercial use 69
Television Sets (Cubic) Source: Statistical Abstract of the United States 2007, Table 1111
Year t
Years (since 1992)
x
Television Sets in Homes
(millions) T
1992 0 192 1993 1 201 1994 2 211 1995 3 217 1996 4 223 1997 5 229 1998 6 235 1999 7 240 2000 8 245 2001 9 248 2002 10 254 2003 11 260 2004 12 268 2005 13 287
Scatter Plot and Model Graph
Model Equation 3 2( ) 0.06680 1.276 12.46 190.7T x x x x= − + +
Verbal Description Based on data from 1992 − 2005, the number of television sets in U.S. homes may be modeled by
3 2( ) 0.06680 1.276 12.46 190.7T x x x x= − + + million sets where x is the number of years since 1992. (Source: Statistical Abstract of the United States 2007, Table 1111.)
Questions 1. Based on the model, what does the concavity of the graph tell us about the rate at which
television sets in homes are increasing? 2. The population of the United States was 273 million in 1997 and 294 million in 2004.
Which grew more rapidly between 1997 and 2004, the number of TV sets or the number of people?
3. Assuming the population of the United States grows linearly, when will the number of televisions in the United States equal the population? (The population of the United States was 273 million in 1997 and 294 million in 2004.)

Make It Real Book of Mathematical Models
70 For noncommercial use © Frank C. Wilson
Hospital Bed Availability (Quartic)
Source: Statistical Abstract of the United States, 2006, Table 126
Years (since 1990)
t
Hospital Bed
Availability (beds per thousand people)
b
0 4.852 1 4.751 2 4.584 3 4.473 4 4.289 5 4.049 6 3.933 7 3.791 8 3.670 9 3.563 10 3.489 11 3.463 12 3.389 13 3.316
Scatter Plot and Model Graph
14 3.252 Model Equation
4 3 2( ) 0.0001365 0.004153 0.03504 0.06320 4.847b t t t t t= − + − − +Verbal Description
Based on data from 1990 − 2004, the number hospital beds in the United States may be modeled by
4 3 2( ) 0.0001365 0.004153 0.03504 0.06320 4.847b t t t t t= − + − − + beds per thousand people where t is the number of years since 1990. (Source: Statistical Abstract of the United States, 2006, Table 2; Health, United States, 2006)
Questions 1. Of what practical value is the model to medical insurance companies? 2. What is the predicted hospital availability in 2010? 3. What is the second derivative of this model and what does it represent in its real world
context?

Make It Real Book of Mathematical Models
© Frank C. Wilson For noncommercial use 71
Average Hourly Earnings for a Ford Motor Company Employee ( Quartic)
Source: Ford Motor Company 2001 Annual Report, p. 71
t Years (Since 1990)
W Hourly Wage
(dollars)
1 19.10 2 19.92 3 20.94 4 21.81 5 21.79 6 22.30 7 22.95 8 24.30 9 25.58 10 26.73 11 27.38
Scatter Plot and Model Graph
Model Equation 4 3 2( ) 0.003931 0.1005 0.8295 3.188 16.48W t t t t t= − + − + +
Verbal Description Based on data from 1990 − 2001, the average hourly wage of a Ford Motor Company employee may be modeled by
4 3 2( ) 0.003931 0.1005 0.8295 3.188 16.48W t t t t t= − + − + + dollars where t is the number of years since 1990. (Source: Ford Motor Company 2001 Annual Report, p. 71)
Questions 1. According to the model, what will be the average wage in 2002? 2007? 2012? 2. What are the inflection points of the model and what do they represent? 3. At what instantaneous rate were wages increasing in 2000?

Make It Real Book of Mathematical Models
72 For noncommercial use © Frank C. Wilson
Columbia River Flow Below Priest Rapids Dam (Quartic)
Source: U.S. Geologic Survey
(waterdata.usgs.gov/wa/nwis/uv?format=rdb&period=1&site_no=12472800)
t Time
(hours since 5:45
a.m. on 11/22/02)
f Streamflow
(Cubic feet/sec)
0 160,000 0.25 120,000 0.50 103,000 0.75 90,600 1.00 81,300 1.25 74,000 1.50 68,100 2.00 63,300 2.25 62,000
Scatter Plot and Model Graph
Model Equation 4 3 2( ) 14, 430 79,740 167,300 179,900 158,800f t t t t t= − + − +
Verbal Description Based on data from 1990 − 2001, the stream flow of the Columbia River below the Priest Rapids Dam on November 22, 2002, may be modeled by
4 3 2( ) 14, 430 79,740 167,300 179,900 158,800f t t t t t= − + − + Cubic feet per second where t is the number of hours since 5:45 a.m.. (Source: US Geologic Survey)
Questions 1. Why do you think the stream flow changed so dramatically? 2. What is the derivative of the model and what does it represent in its real world context? 3. According to the model, what was the stream flow at 5:45 p.m.? Does this seem reasonable?

Make It Real Book of Mathematical Models
© Frank C. Wilson For noncommercial use 73
Exponential Function Models

Make It Real Book of Mathematical Models
74 For noncommercial use © Frank C. Wilson
DVD Players Sold as a function of Price (Exponential)
Source: Consumer Electronics Association (http://www.ce.org/Research/Sales_Stats/1219.asp)
t Year
p Average
Price (dollars)
D DVD
Players (thousands)
1997 489.97 349 1998 390.18 1079 1999 270.00 4072 2000 201.55 8499 2001 165.00 12707 2002 142.00 17090 2003 123.00 21994 2004 108.60 19990
Scatter Plot and Model Graph
Model Equation
( ) ( )77100 0.989 pD p = Verbal Description
Based on data from 1997 − 2004, the number of DVD players sold may be modeled by ( ) ( )77100 0.989 pD p = thousand DVD players
where p is the average price per DVD player. (Source: Modeled from Consumer Electronics Association data)
Questions 1. What is the relationship between DVD player price and DVD player sales? 2. What is the practical meaning of the growth factor and initial value of the model? 3. When 25 million DVD players are sold, what is the projected price per DVD player?

Make It Real Book of Mathematical Models
© Frank C. Wilson For noncommercial use 75
Rwanda Population (Exponential)
Source: World Health Statistics 2006, World Health Organization
Country Population
(2005) (thousands)
Average Annual Growth
Rate (1995−2004)
percent Rwanda 9,038 5.0
Model Graph
Model Equation
( )( ) 9038 1.05 tR t = Verbal Description
Based on data from 1995 − 2005, the population of Rwanda may be modeled by ( ) ( )9038 1.05 tR t = thousand people where t is the number of years since 2005 (Source:
World Health Statistics 2006, World Health Organization). Questions
1. What is the practical meaning of the initial value and growth factor? 2. What is the derivative of the model and what does it represent? 3. What is the projected average rate of change in the population between 2005 and 2010?

Make It Real Book of Mathematical Models
76 For noncommercial use © Frank C. Wilson
Hungary Population (Exponential)
Source: World Health Statistics 2006, World Health Organization
Country Population
(2005) (thousands)
Average Annual Growth
Rate (1995−2004)
percent Hungary 10,098 −0.2
Model Graph
Model Equation
( )( ) 10,098 0.998 tH t = Verbal Description
Based on data from 1995 − 2005, the population of Hungary may be modeled by ( )( ) 10,098 0.998 tH t = thousand people where t is the number of years since 2005 (Source:
World Health Statistics 2006, World Health Organization). Questions
1. What is the practical meaning of the initial value and growth factor? 2. What is the derivative of the model and what does it represent? 3. What is the projected average rate of change in the population between 2005 and 2010?

Make It Real Book of Mathematical Models
© Frank C. Wilson For noncommercial use 77
Cambodia Population (Exponential)
Source: World Health Statistics 2006, World Health Organization
Country Population
(2005) (thousands)
Average Annual Growth
Rate (1995−2004)
percent Cambodia 14,071 2.0
Model Graph
Model Equation
( )( ) 14,071 1.02 tC t = Verbal Description
Based on data from 1995 − 2005, the population of Cambodia may be modeled by ( )( ) 14,071 1.02 tC t = thousand people where t is the number of years since 2005 (Source:
World Health Statistics 2006, World Health Organization). Questions
1. What is the practical meaning of the initial value and growth factor? 2. What is the derivative of the model and what does it represent? 3. What is the projected average rate of change in the population between 2005 and 2010?

Make It Real Book of Mathematical Models
78 For noncommercial use © Frank C. Wilson
Kazakhstan Population (Exponential)
Source: World Health Statistics 2006, World Health Organization
Country Population
(2005) (thousands)
Average Annual Growth
Rate (1995−2004)
percent Kazakhstan 14,825 − 0.7
Model Graph
Model Equation
( )( ) 14,825 0.993 tK t = Verbal Description
Based on data from 1995 − 2005, the population of Kazakhstan may be modeled by ( )( ) 14,825 0.993 tK t = thousand people where t is the number of years since 2005 (Source:
World Health Statistics 2006, World Health Organization). Questions
1. What is the practical meaning of the initial value and growth factor? 2. What is the derivative of the model and what does it represent? 3. What is the projected average rate of change in the population between 2005 and 2010?

Make It Real Book of Mathematical Models
© Frank C. Wilson For noncommercial use 79
Bangladesh Population (Exponential)
Source: World Health Statistics 2006, World Health Organization
Country Population
(2005) (thousands)
Average Annual Growth
Rate (1995−2004)
percent Bangladesh 141,822 1.8
Model Graph
Model Equation
( )( ) 141,822 1.018 tB t = Verbal Description
Based on data from 1995 − 2005, the population of Bangladesh may be modeled by ( )( ) 141,822 1.018 tB t = thousand people where t is the number of years since 2005 (Source:
World Health Statistics 2006, World Health Organization). Questions
1. What is the practical meaning of the initial value and growth factor? 2. What is the derivative of the model and what does it represent? 3. What is the projected average rate of change in the population between 2005 and 2010?

Make It Real Book of Mathematical Models
80 For noncommercial use © Frank C. Wilson
Russian Federation Population (Exponential)
Source: World Health Statistics 2006, World Health Organization
Country Population
(2005) (thousands)
Average Annual Growth
Rate (1995−2004)
percent Russian
Federation 143,202 − 0.3
Model Graph
Model Equation
( )( ) 143,202 0.997 tR t = Verbal Description
Based on data from 1995 − 2005, the population of Russian Federation may be modeled by ( )( ) 143,202 0.997 tR t = thousand people where t is the number of years since 2005 (Source:
World Health Statistics 2006, World Health Organization). Questions
1. What is the practical meaning of the initial value and growth factor? 2. What is the derivative of the model and what does it represent? 3. What is the projected average rate of change in the population between 2005 and 2010?

Make It Real Book of Mathematical Models
© Frank C. Wilson For noncommercial use 81
Indonesia Population (Exponential)
Source: World Health Statistics 2006, World Health Organization
Country Population
(2005) (thousands)
Average Annual Growth
Rate (1995−2004)
percent Indonesia 222,781 1.2
Model Graph
Model Equation
( )( ) 222,781 1.012 tI t = Verbal Description
Based on data from 1995 − 2005, the population of Indonesia may be modeled by ( )( ) 222,781 1.012 tI t = thousand people where t is the number of years since 2005 (Source:
World Health Statistics 2006, World Health Organization). Questions
1. What is the practical meaning of the initial value and growth factor? 2. What is the derivative of the model and what does it represent? 3. What is the projected average rate of change in the population between 2005 and 2010?

Make It Real Book of Mathematical Models
82 For noncommercial use © Frank C. Wilson
United States Population (Exponential)
Source: World Health Statistics 2006, World Health Organization
Country Population
(2005) (thousands)
Average Annual Growth
Rate (1995−2004)
percent United States 298,213 0.9
Model Graph
Model Equation
( )( ) 298,213 1.009 tU t = Verbal Description
Based on data from 1995 − 2005, the population of the United States may be modeled by ( )( ) 298,213 1.009 tU t = thousand people where t is the number of years since 2005 (Source:
World Health Statistics 2006, World Health Organization). Questions
1. What is the practical meaning of the initial value and growth factor? 2. What is the derivative of the model and what does it represent? 3. What is the projected average rate of change in the population between 2005 and 2010?

Make It Real Book of Mathematical Models
© Frank C. Wilson For noncommercial use 83
India Population (Exponential)
Source: World Health Statistics 2006, World Health Organization
Country Population
(2005) (thousands)
Average Annual Growth
Rate (1995−2004)
percent India 1,103,371 1.5
Model Graph
Model Equation
( )( ) 1,103,371 1.015 tI t = Verbal Description
Based on data from 1995 − 2005, the population of the India may be modeled by ( )( ) 1,103,371 1.015 tI t = thousand people where t is the number of years since 2005 (Source:
World Health Statistics 2006, World Health Organization). Questions
1. What is the practical meaning of the initial value and growth factor? 2. What is the derivative of the model and what does it represent? 3. What is the projected average rate of change in the population between 2005 and 2010?

Make It Real Book of Mathematical Models
84 For noncommercial use © Frank C. Wilson
China Population (Exponential)
Source: World Health Statistics 2006, World Health Organization
Country Population
(2005) (thousands)
Average Annual Growth
Rate (1995−2004)
percent China 1,323,345 0.7
Model Graph
Model Equation
( )( ) 1,323,345 1.007 tC t = Verbal Description
Based on data from 1995 − 2005, the population of the China may be modeled by ( )( ) 1,323,345 1.007 tC t = thousand people where t is the number of years since 2005 (Source:
World Health Statistics 2006, World Health Organization). Questions
1. What is the practical meaning of the initial value and growth factor? 2. What is the derivative of the model and what does it represent? 3. What is the projected average rate of change in the population between 2005 and 2010?

Make It Real Book of Mathematical Models
© Frank C. Wilson For noncommercial use 85
Insecticide Treated Net Distribution in African Region (Exponential)
Source: www.afro.who.int/malaria/publications/section4.pdf
Years (since 1999)
t
Total Number of Insecticide Treated
Nets Sold or Distributed in Africa
(thousands) N
0 538 1 886 2 2228 3 4346 4 9485
Scatter Plot and Model Graph
Model Equation
( )( ) 491.6 2.081 tN t = Verbal Description
Based on data from 1999 − 2003, the number of insecticide treated nets distributed in the African Region may be modeled by
( )( ) 491.6 2.081 tN t = thousand nets where t is the number of years since 1999. (Source: Modeled from World Health Organization data)
Questions 1. At what annual percentage rate is the distribution of nets increasing? 2. According to the model, how many nets will be distributed in 2008? 3. When will the number of nets distributed annually first exceed 20 million?

Make It Real Book of Mathematical Models
86 For noncommercial use © Frank C. Wilson
Netto Extra Treated Net Insecticide Residue (Exponential)
Source: www.nettogroup.com/newsproduct.php The Netto Extra Treated Net was launched by Netto Manufacturing CO, to meet the high demand for insecticide treated nets. The company issues the following certificate of analysis with its nets.
Specification: Deltamethrin residue (mg/m2) as a function of washes ( ) ( )35 0.9255 wD w =
Result: Deltamethrin residue (mg/m2) as a function of washes ( ) ( )50.40 0.9398 wD w = 1. According to the test result, approximately what percentage of the detamethrin residue is lost
with each washing of the net? 2. According to the model, ( ) ( )50.40 0.9398 wD w = , how many times can the Netto Extra
Treated Net be washed before the Deltamethrin residue (mg/m2) drops below 22 mg/m2? 3. In terms of mg per square meter per wash, at what rate is the delatmethrin residue decreasing
after 10 washes?

Make It Real Book of Mathematical Models
© Frank C. Wilson For noncommercial use 87
Long Lasting Insecticidal Nets − Olyset® Net (Exponential)
Source: www.who.int/malaria/docs/UpdateLLIN_4.pdf Raw Data from WHO publication
Years (since
first use) t
Permethrin Content (% of initial
amount) p
0 100 5 50 7 35
Scatter Plot and Model Graph
Model Equation
( )( ) 101.0 0.8626 tp t = Verbal Description
The amount of permethrin remaining in a long lasting insecticide treated net may be modeled by ( )( ) 101.0 0.8626 tp t = percent where t is the number of years since first use. (Source: Modeled from WHO data)
Questions 1. Would this exponential model or a linear model better represent this situation? Explain. 2. When will the permethrin content drop first drop below 10 percent? 3. Of what value would this model be to World Health Organization planners?

Make It Real Book of Mathematical Models
88 For noncommercial use © Frank C. Wilson
Average Brand Name Prescription Drug Prices (Exponential)
Source: Statistical Abstract of the United States, 2006; Table 126 Years (since 1995)
Average Brand Drug Price
(dollars)
0 40.22 2 49.55 3 53.51 4 60.66 5 65.29 6 69.75 7 77.49 8 85.57 9 95.86
Scatter Plot and Model Graph
Model Equation
( )( ) 40.63 1.098 td t = Verbal Description
Based on data from 1995 − 2004, the average cost of brand name prescription drugs may be modeled by
( )( ) 40.63 1.098 td t = dollars where t is the number of years since 1995 (Source: Statistical Abstract of the United States, 2006; Table 126).
Questions 1. At what percentage rate are drug prices increasing? 2. A person is said to be on a “fixed income” if their income does not change over time.
If a person on a fixed income is currently spending 10% of their income on brand name drugs, how much of their income will be spent on brand name drugs ten years from now?
3. When will brand name drug prices first exceed $125?

Make It Real Book of Mathematical Models
© Frank C. Wilson For noncommercial use 89
Future Value of a Certificate of Deposit (Exponential)
Source: USAA Federal Savings Bank URL: www.usaa.com
Model Graph
Model Equation 1 year: ( ) 1000(1.0485)tF t = 3 years: ( ) 1000(1.0495)tT t =
7 years: ( )( ) 1000 1.0525 tS t =
Verbal Description Based on percentage rate data from March 31, 2007, the future value of a $1000 investment in a certificates of deposit of varying lengths at USAA Federal Savings Bank are given by
1 year: ( ) 1000(1.0485)tF t = 3 years: ( ) 1000(1.0495)tT t =
7 years: ( )( ) 1000 1.0525 tS t = where t is the number of years of the CD is opened.
Questions 1. Assuming that the one year CD is renewed at the same rate annually, what will be the difference in the account values when the 3-year CD matures? 2. What factors should a consumer consider when deciding on a certificate of deposit? 3. How many years will it take for each account to first exceed $1300? (Assume interest is
only paid at the end of the year.)
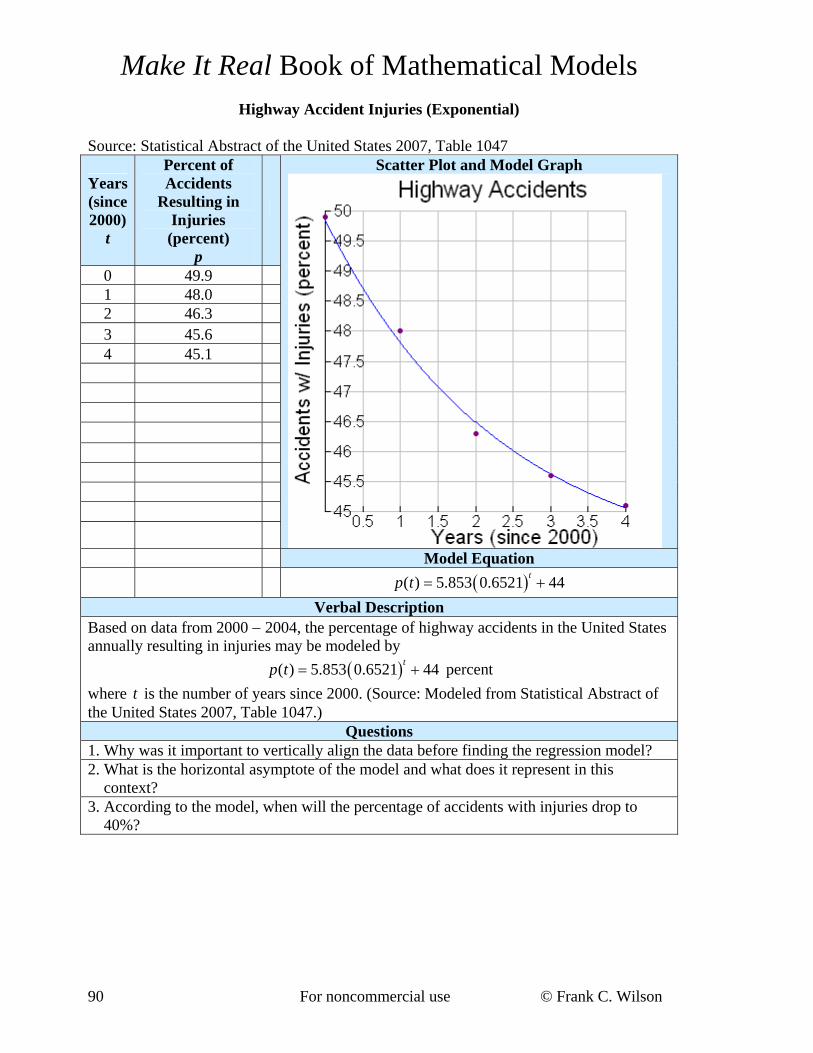
Make It Real Book of Mathematical Models
90 For noncommercial use © Frank C. Wilson
Highway Accident Injuries (Exponential)
Source: Statistical Abstract of the United States 2007, Table 1047
Years (since 2000)
t
Percent of Accidents
Resulting in Injuries (percent)
p
0 49.9 1 48.0 2 46.3 3 45.6 4 45.1
Scatter Plot and Model Graph
Model Equation
( )( ) 5.853 0.6521 44tp t = + Verbal Description
Based on data from 2000 − 2004, the percentage of highway accidents in the United States annually resulting in injuries may be modeled by
( )( ) 5.853 0.6521 44tp t = + percent where t is the number of years since 2000. (Source: Modeled from Statistical Abstract of the United States 2007, Table 1047.)
Questions 1. Why was it important to vertically align the data before finding the regression model? 2. What is the horizontal asymptote of the model and what does it represent in this
context? 3. According to the model, when will the percentage of accidents with injuries drop to
40%?

Make It Real Book of Mathematical Models
© Frank C. Wilson For noncommercial use 91
Power and Piecewise Models

Make It Real Book of Mathematical Models
92 For noncommercial use © Frank C. Wilson
Custom Greeting Card Costs (Piecewise)
Source: www.simplyfreshdesigns.com
Custom Greeting Card Costs
Design, Print, & Ship $1.00/card $.75/card for orders of 50 or more
white 3 1
4 24 6× envelope included
(25 minimum order)
$6 shipping fee on all orders Source:
www.simplyfreshdesigns.com
Scatter Plot and Model Graph
Model Equation
6 25 50( )
0.75 6 50x x
C xx x+ ≤ <⎧
= ⎨ + ≥⎩
Verbal Description Based on pricing data from 2006, the cost of purchasing x custom-made, 4 x 6 photo greeting cards from Simply Fresh Designs is given by
6 25 50( )
0.75 6 50x x
C xx x+ ≤ <⎧
= ⎨ + ≥⎩ dollars
(Source: www.simplyfreshdesigns.com). Questions
1. How much will it cost to buy 50 cards? 2. If you have $44 to spend, what is the maximum number of cards you can afford to buy? 3. What is the domain of this function?

Make It Real Book of Mathematical Models
© Frank C. Wilson For noncommercial use 93
Asparagus Plant Cost (Piecewise)
Source: www.henryfields.com Jersey Supreme Hybrid Asparagus Plant Costs
(2007 Catalog)
Plants Cost per plant (dollars)
10 0.995 20, 30 0.925 40 or more 0.875
Scatter Plot and Model Graph
Model Equation
9.95 10( ) 0.925 20 30
0.875 40
xC x x x
x x
=⎧⎪= ≤ ≤⎨⎪ ≥⎩
Verbal Description Henry Fields Seed & Nursery Company offered their Jersey Supreme Hybrid asparagus in 10-plant groupings in their 2007 catalog. The total cost of purchasing x plants is given by
9.95 10( ) 0.925 20 30
0.875 40
xC x x x
x x
=⎧⎪= ≤ ≤⎨⎪ ≥⎩
dollars
(Note: Plants may only be purchased in blocks of 10 plants.) Questions
1. If I need 45 plants for my garden, what will it cost me? 2. What is the domain of the function? 3. Is the function model continuous or discrete? Explain.

Make It Real Book of Mathematical Models
94 For noncommercial use © Frank C. Wilson
Late Airline Departures and Arrivals (Power)
Source: Statistical Abstract of the United States 2007, Table 1054
Year t
Late Airline
Departures (thousands)
d
Late Airline
Arrivals (thousands
a 1995 827.9 1039.3 1997 846.9 1083.8 1998 870.4 1070.1 1999 937.3 1152.7 2000 1131.7 1356.0 2001 953.8 1104.4 2002 717.4 868.2 2003 834.4 1057.8 2004 1187.6 1421.4 2005 1279.4 1466.1
Scatter Plot and Model Graph
Model Equation 0.8706( ) 2.952a d d=
Verbal Description Based on data from 1995 − 2005, the number of late airline arrivals in the United States (in thousands) may be modeled by
0.8706( ) 2.952a d d= late arrivals where d is the number of late departures (in thousands). (Source: Modeled from Statistical Abstract of the United States 2007, Table 1054.)
Questions 1. Why is it reasonable that late airline departures and late airline arrivals are related? 2. What is the concavity of this model and what does it mean in its real world context? 3. What is the derivative of the function model and what does it represent?

Make It Real Book of Mathematical Models
© Frank C. Wilson For noncommercial use 95
Logistic Function Models

Make It Real Book of Mathematical Models
96 For noncommercial use © Frank C. Wilson
Number of Golf Courses (Logistic)
Source: Statistical Abstract of the United States, 2004 – 2005, Table 1240 t
Years (Since 1980)
G Golf Facilities
0 12005 5 12346 6 12384 7 12407 8 12582 9 12658 10 12846 11 13004 12 13210
13 13439 14 13683 15 14074 16 14341 17 14602 18 14900 19 15195 20 15489 21 15689
Scatter Plot and Model Graph
22 15827 Model Equation 23 15899
( ) 0.2567
4633 12,0001 59.97 tg t
e−= ++
Verbal Description Based on data from 1980 − 2003, the number of golf course facilities in the United States may be modeled by
( ) 0.2567
4633 12,0001 59.97 tg t
e−= ++
golf facilities
where t is the number of years since 1980. (Source: Statistical Abstract of the United States, 2004 – 2005, Table 1240.)
Questions 1. What does the variable rate of change of the model tell us about the number of golf
course facilities? 2. Why was it important to vertically align the data before finding the logistic model? 3. To whom would this model be of practical value?

Make It Real Book of Mathematical Models
© Frank C. Wilson For noncommercial use 97
Blank Audio Cassette Tape Sales (Logistic)
Source: Statistical Abstract of the United States, 2006, Table 1003
t Year (since 1990)
C Cassette Tape
Sales (millions of
dollars)
0 376 5 334 10 162 11 129 12 98 13 77 14 66
Scatter Plot and Model Graph
Model Equation
( ) 0.5277
327.2 501 0.01003 tC t
e= +
+
Verbal Description Based on data from 1990 − 2004, blank audio cassette tape sales may be modeled by
( ) 0.5277
327.2 501 0.01003 tC t
e= +
+ million dollars
where t is the number of years since 1990. (Source: Modeled from Statistical Abstract of the United States, 2006, Table 1003)
Questions 1. From the model equation, how can you tell if the graph is increasing or decreasing? 2. What is the inflection point of the model and what does it represent in its real world
context? 3. What are the projected sales for 2010?

Make It Real Book of Mathematical Models
98 For noncommercial use © Frank C. Wilson
Drug Prescriptions as a function of Year (Logistic)
Source: Statistical Abstract of the United States, 2006; Table 126
Years (since 1995)
t
Prescriptions (millions)
P
0 2,125 2 2,316 3 2,481 4 2,707 5 2,865 6 3,009 7 3,139 8 3,215 9 3,274
Scatter Plot and Model Graph
Model Equation
( ) 0.6872
1194 21001 17.04 tP t
e−= ++
Verbal Description Based on data from 1995 − 2004, the number of drug prescriptions in the United States may be modeled by
( ) 0.6872
1194 21001 17.04 tP t
e−= ++
million prescriptons
where t is the number of years since 1995. (Source: Modeled from Statistical Abstract of the United States 2006, Table 126.)
Questions 1. Why was it important to vertically align the data before finding the regression model? 2. What are the horizontal asymptotes of the model and what does it represent in this
context? 3. According to the model, when are the number of prescriptions increasing the most
rapidly?

Make It Real Book of Mathematical Models
© Frank C. Wilson For noncommercial use 99
Death Rate Due to Chronic Liver Disease and Cirrhosis (Logistic)
Source: Statistical Abstract of the United States, 2006; Table 106
Years (since 1970)
t
Age-Adjusted Death Rate
Due to Chronic Liver
Disease and Cirrhosis
(deaths/100,000 people)
r 0 17.8 5 16.7 10 15.1 15 12.3 20 11.1 25 10.0 30 9.5 33 9.2
Scatter Plot and Model Graph
Model Equation
0.1771
9.900( ) 91 0.1181 tr t
e= +
+
Verbal Description Based on data from 1970 − 2003, the death rate due to chronic liver disease and cirrhosis may be modeled by
0.1771
9.900( ) 91 0.1181 tr t
e= +
+ deaths per 100,000 people
where t is the number of years since 1970. (Source: Modeled from Statistical Abstract of the United States, 2006; Table 106.)
Questions 1. Why was it important to vertically align the data before finding the regression model? 2. What are the horizontal asymptotes of the model and what does it represent in this
context? 3. What does the concavity of the model represent in its real world context?

Make It Real Book of Mathematical Models
100 For noncommercial use © Frank C. Wilson
Reported Cases of Chicken Pox (Logistic)
Source: Statistical Abstract of the United States, 2006; Table 177
Years (since 1985)
t
Reported Cases of Chicken Pox
(Thousands) C
0 178.2 5 173.1 10 120.6 14 46 15 27.4 16 22.5 17 22.8 18 20.9
Scatter Plot and Model Graph
Model Equation
( ) 0.6230
157.6 201 0.001096 tC t
e= +
+
Verbal Description Based on data from 1985 − 2003, the number of cases of Chicken Pox in the United States may be modeled by
( ) 0.6230
157.6 201 0.001096 tC t
e= +
+ thousand cases
where t is the number of years since 1985. (Source: Modeled from Statistical Abstract of the United States 2006, Table 177.)
Questions 1. A chicken pox vaccine became widely available in the United States in 1995.
According to the model, does the vaccine appear to be having an effect? 2. With a vaccine available, it is possible to completely eradicate the disease. Does the
model project that chicken pox will be eradicated? Explain. 3. Did the number of chicken pox cases decrease more rapidly between 1985 and 1995 or
1995 and 2003? Explain.

Make It Real Book of Mathematical Models
© Frank C. Wilson For noncommercial use 101
Mosquito Mortality Rate for Conventional Net (Logistic)
Source: www.sumivector.com/images/pdf/olyset.pdf
Net Washings
w
Mosquito (Anopheles stephensi)
Mortality Rate Conventional Net
(percent) c
0 100 1 70 2 27.5 3 10 4 6.25 5 5
Scatter Plot and Model Graph
Model Equation
A study on the effectiveness of the Olyset Net versus a Conventional Net was published in March 2006 in the Journal of the American Mosquito Control Association, Volume 22, p. 107 − 110. The study was sponsored by M/s Sumitomo Chemical India Pvt Ltd Mumbaithe, a company involved in the production of the Olyset Net. The study revealed the above data. 1.695
107.30( ) 41 0.1164 wc w
e= +
+
Verbal Description The mosquito mortality rate of a conventional insecticide treated net may be modeled by
1.695
107.30( ) 41 0.1164 wc w
e= +
+ percent
where w is the number of net washings. (Source: Modeled from data at www.sumivector.com)
Questions 1. According to the model, what effect does washing the net have on the mosquito
mortality rate? 2. Does each washing change the mortality rate at a constant or variable rate? Explain. 3. What is the long-term mortality rate for the net?

Make It Real Book of Mathematical Models
102 For noncommercial use © Frank C. Wilson
Stay-at-home Mothers (Logistic)
Source: Statistical Abstract of the United States, 2006; Table 59
Years (since 1999)
Married Couple Families with Stay-at-Home Mothers
(thousands)
0 4731 1 4785 2 4934 3 5206 4 5388 5 5571
Scatter Plot and Model Graph
Model Equation
1.110
948.2( ) 47001 27.23 tM t
e−= ++
Verbal Description Based on data from 1999 − 2004, the number of married couple families with stay-at-home mothers may be modeled by
1.110
948.2( ) 47001 27.23 tM t
e−= ++
thousand mothers
where t is the number of years since 1999. (Source: Modeled from Statistical Abstract of the United States 2006, Table 59.)
Questions 1. Does the increase in stay-at-home mothers mean that a greater percentage of all
married couple families now have stay-at-home mothers? Explain. 2. At what rate was the number of stay-at-home mothers increasing in 2004? 3. What is the projected number of stay-at-home mothers in 2009?

Make It Real Book of Mathematical Models
© Frank C. Wilson For noncommercial use 103
US Army Personnel (Logistic)
Source: Statistical Abstract of the United States, 2001; Table 500, p. 329
t Years (Since 1980)
P Personnel
(thousands)
0 777 2 780 4 780 6 781 8 772 10 732 12 610 14 541 16 491
18 484 20 482
Scatter Plot and Model Graph
Model Equation
0.7731
302.2( ) 4801 0.0001047 tP t
e= +
+
Verbal Description Based on data from 1980 − 2000, the number of personnel in the US Army may be modeled by
0.7731
302.2( ) 4801 0.0001047 tP t
e= +
+ thousand people
where t is the number of years since 1980. (Source: Statistical Abstract of the United States, 2001; Table 500, p. 329.)
Questions 1. Between 1980 and 2000, in what year was the number of personnel decreasing the
most rapidly? 2. Between 1980 and 2000, in what year was the number of personnel decreasing the
most slowly? 3. What is the projected number of US Army personnel in 2009?

Make It Real Book of Mathematical Models
104 For noncommercial use © Frank C. Wilson
Pie Charts

Make It Real Book of Mathematical Models
© Frank C. Wilson For noncommercial use 105
Subway and McDonalds Nutrition Comparisons − Fat (Pie Chart)
Source: www.mcdonalds.com, www.subway.com
Entrée Fat (g)
McDonalds Double Quarter Pounder w/ Cheese 40 McDonalds Chicken Selects
Premium Breast Strips (10 pc) 66 Subway 6-inch Veggie Delight 3
Subway 6-inch Double Meat Meatball Marinara 42
Model Graph
Model Equation N/A
Verbal Description Based on nutrition data from the restaurants, the fat content of various menu items may be compared and contrasted with a pie chart.
Questions 1. Which product has seven times more fat than the Subway 6-inch Veggie Delite? 2. What percentage of the combined fat content of the four menu items is found in the
McDonalds Double Quarter Pounder with Cheese? 3. What percentage of the combined fat content of the four menu items is found in the
Subway 6-inch Double Meat Meatball Marinara?

Make It Real Book of Mathematical Models
106 For noncommercial use © Frank C. Wilson
Subway and McDonalds Nutrition Comparisons − Sodium (Pie Chart)
Source: www.mcdonalds.com, www.subway.com
Entrée Sodium (mg)
McDonalds Double Quarter Pounder w/ Cheese 1330 McDonalds Chicken Selects
Premium Breast Strips (10 pc) 3100 Subway 6-inch Veggie Delight 520
Subway 6-inch Double Meat Meatball Marinara 2490
Model Graph
Model Equation N/A
Verbal Description Based on nutrition data from the restaurants, the sodium content of various menu items may be compared and contrasted with a pie chart.
Questions 1. What percentage of the combined sodium content of the four menu items is found in the
McDonalds Double Quarter Pounder with Cheese? 2. How many times more sodium do the chicken strips have than the Veggie Delite? 3. What percentage of the combined fat content of the four menu items is found in the Subway
6-inch Double Meat Meatball Marinara?

Make It Real Book of Mathematical Models
© Frank C. Wilson For noncommercial use 107
Subway and McDonalds Nutrition Comparisons − Protein (Pie Chart)
Source: www.mcdonalds.com, www.subway.com
Entrée Protein (g)
McDonalds Double Quarter Pounder w/ Cheese 47 McDonalds Chicken Selects
Premium Breast Strips (10 pc) 77 Subway 6-inch Veggie Delight 9
Subway 6-inch Double Meat Meatball Marinara 37
Model Graph
Model Equation N/A
Verbal Description Based on nutrition data from the restaurants, the protein content of various menu items may be compared and contrasted with a pie chart.
Questions 1. What percentage of the combined protein content of the four menu items is found in the
McDonalds Double Quarter Pounder with Cheese? 2. How many times more protein do the chicken strips have than the Veggie Delite? 3. What percentage of the combined protein content of the four menu items is found in the
Subway 6-inch Double Meat Meatball Marinara?

Make It Real Book of Mathematical Models
108 For noncommercial use © Frank C. Wilson
This page intentionally blank.


Additional complimentary classroom support
materials may be freely downloaded from
www.makeitreallearning.com