make it pop - loex conferenceloex2013_'make it pop... · make it pop integrating visual ......
TRANSCRIPT
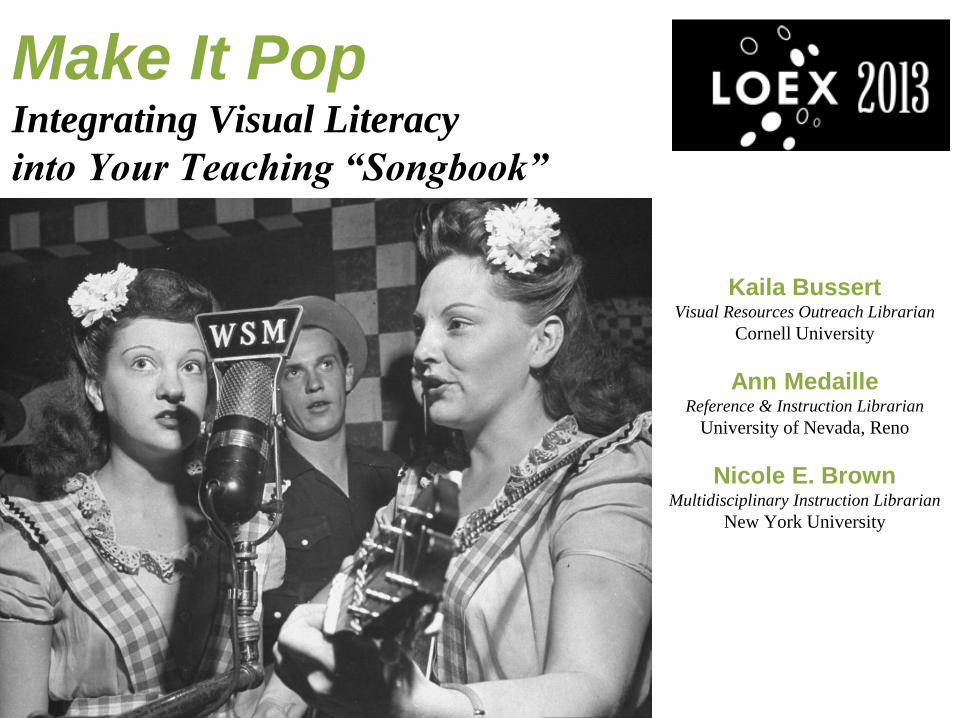
Make It Pop Integrating Visual Literacy
into Your Teaching “Songbook”
Kaila Bussert Visual Resources Outreach Librarian
Cornell University
Ann Medaille Reference & Instruction Librarian
University of Nevada, Reno
Nicole E. Brown
Multidisciplinary Instruction Librarian
New York University

Picture
Superiority
Effect
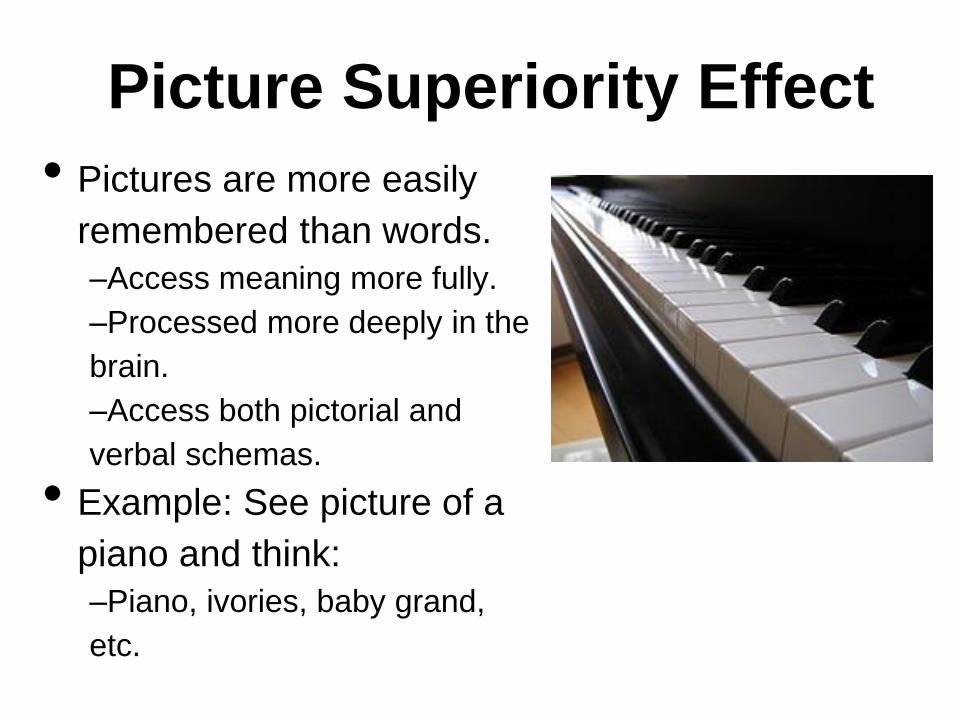
Picture Superiority Effect
• Pictures are more easily
remembered than words.
–Access meaning more fully.
–Processed more deeply in the
brain.
–Access both pictorial and
verbal schemas.
• Example: See picture of a
piano and think:
–Piano, ivories, baby grand,
etc.
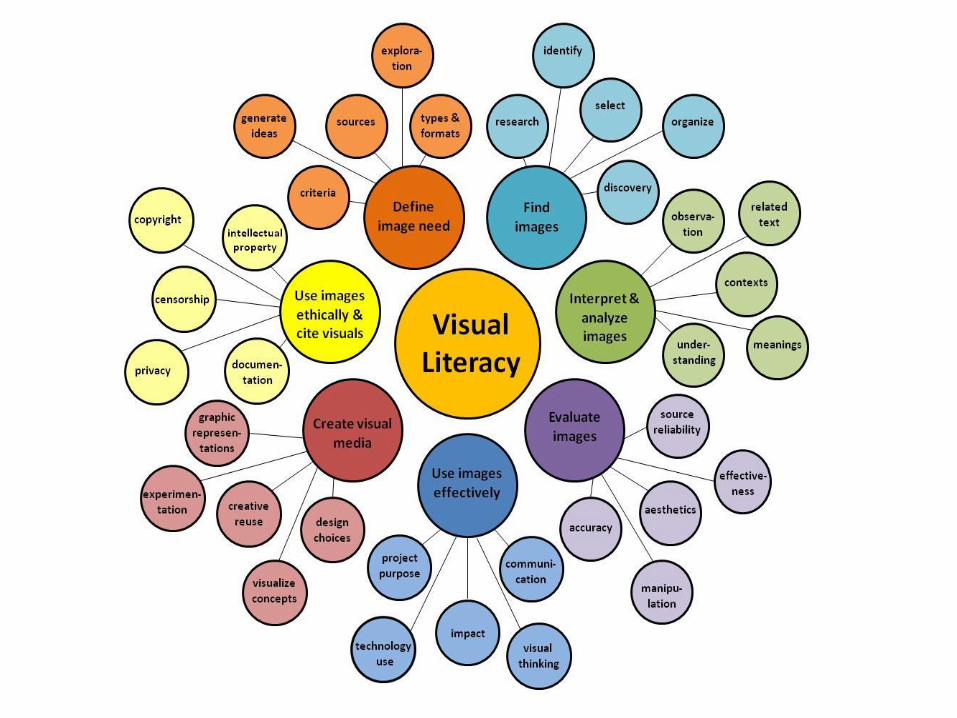
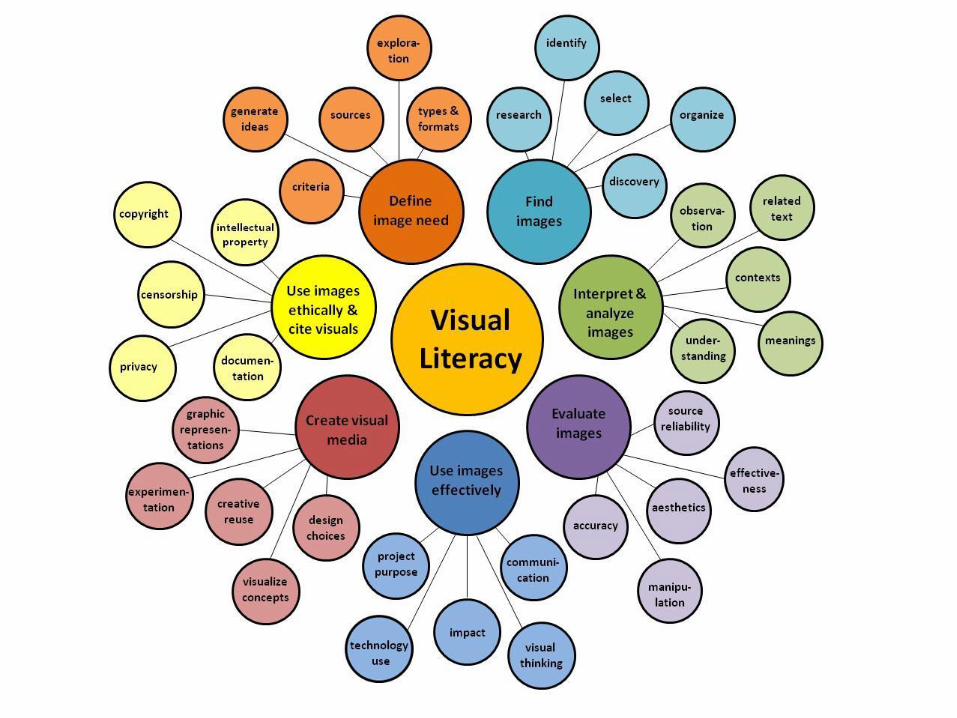
"A set of abilities that enables an
individual to effectively find,
interpret, evaluate, use, and
create images and visual media."
ACRL Visual Literacy Competency
Standards for Higher Education
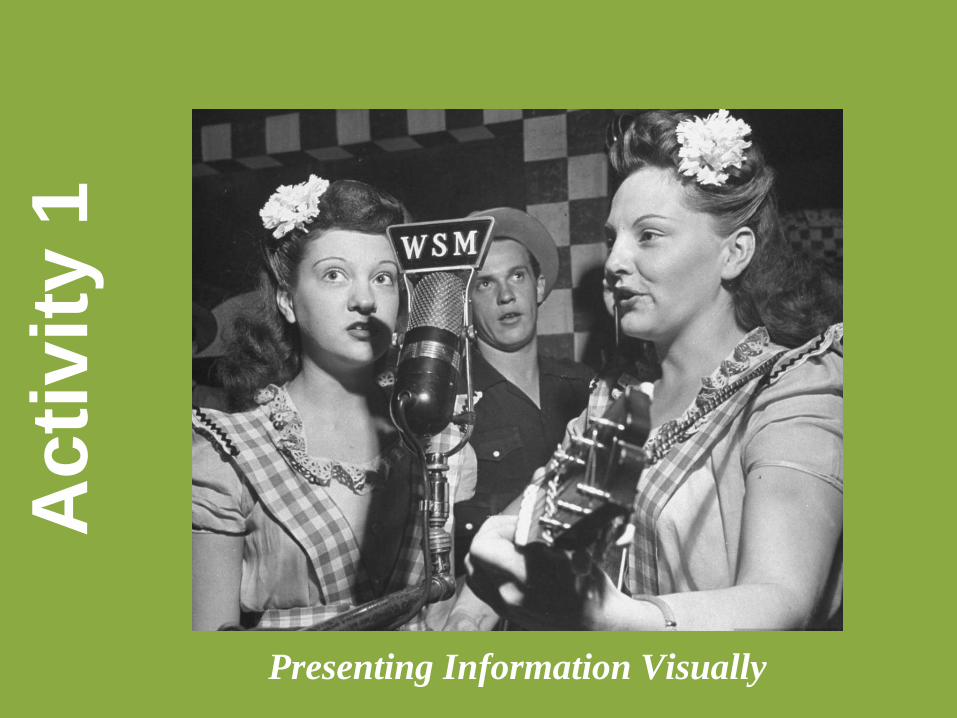
Acti
vit
y 1
Presenting Information Visually
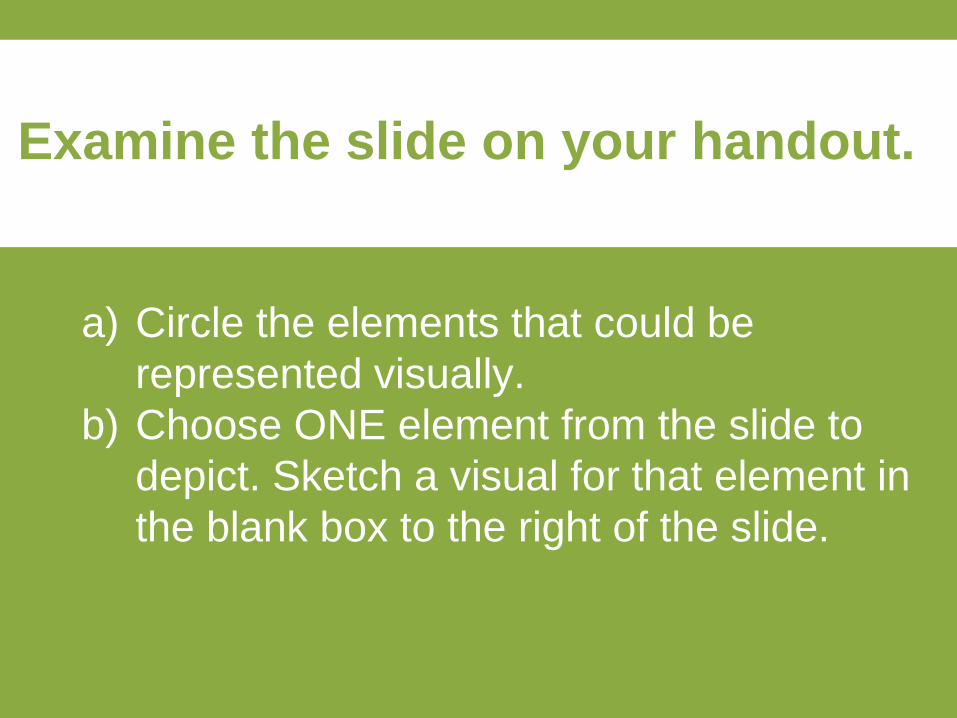
a) Circle the elements that could be
represented visually.
b) Choose ONE element from the slide to
depict. Sketch a visual for that element in
the blank box to the right of the slide.
Examine the slide on your handout.
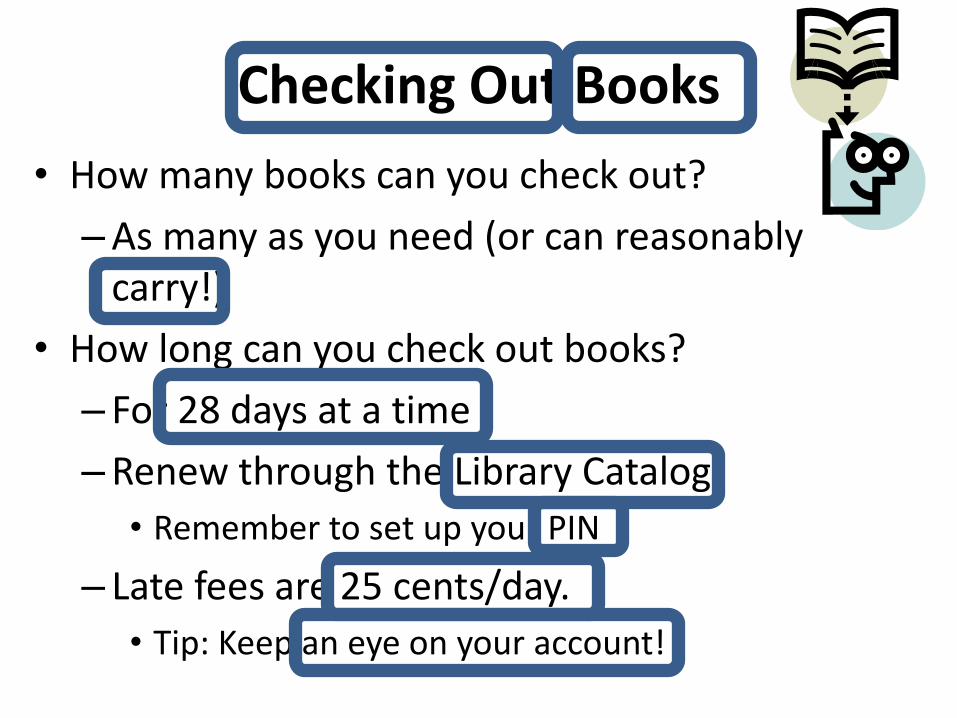
Checking Out Books
• How many books can you check out?
– As many as you need (or can reasonably carry!)
• How long can you check out books?
– For 28 days at a time
– Renew through the Library Catalog
• Remember to set up your PIN
– Late fees are 25 cents/day.
• Tip: Keep an eye on your account!
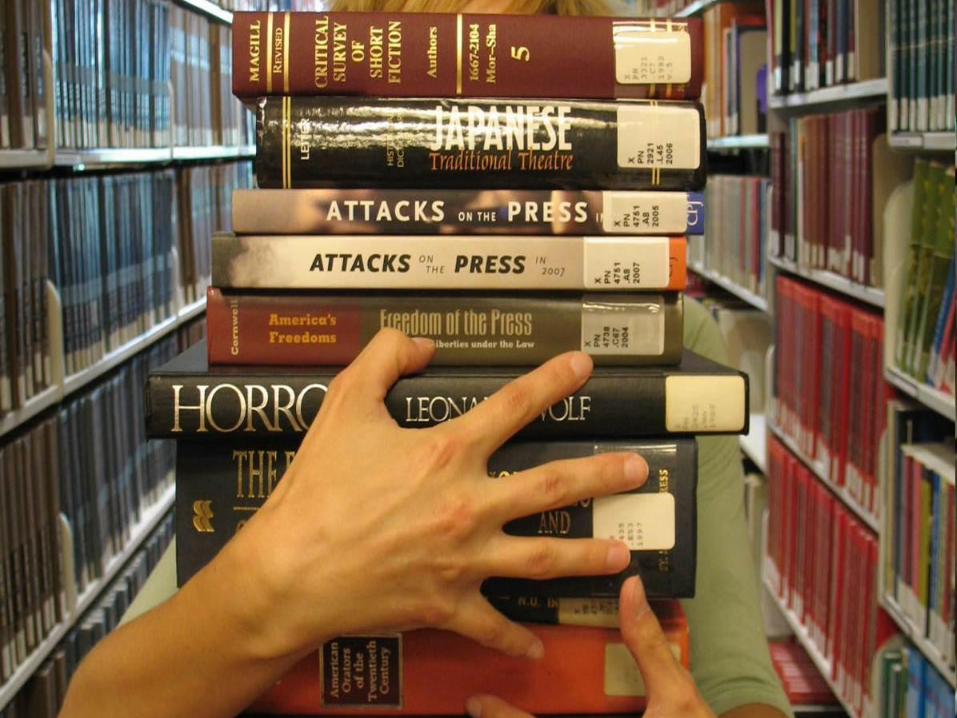

Undergraduate students
28 days
+ Renew online!
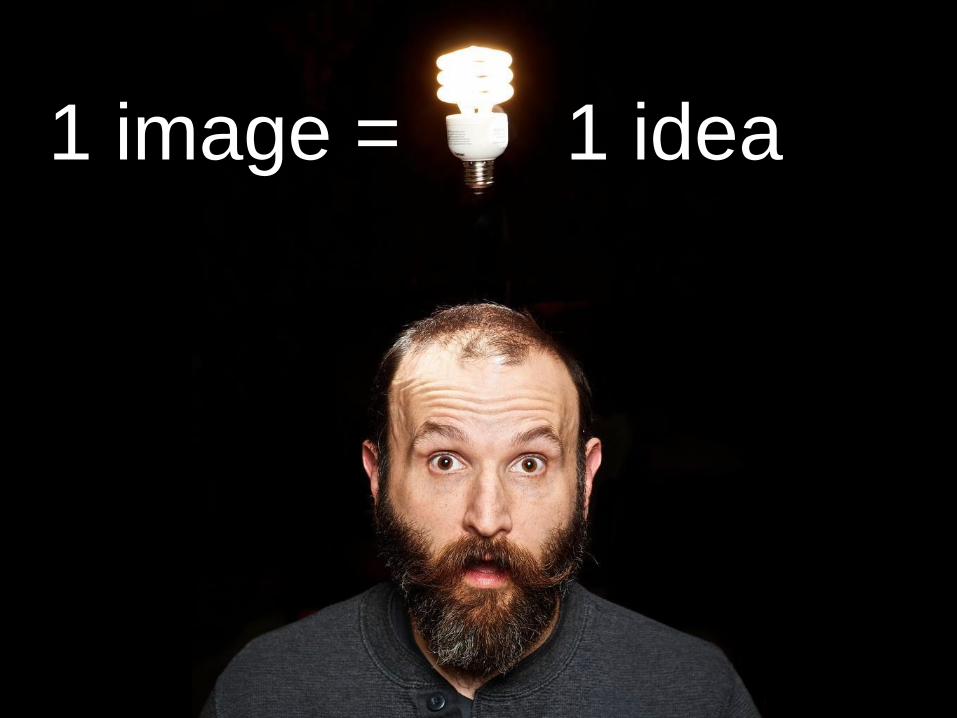
1 image = 1 idea
The visually literate student
uses images and visual
media effectively.
Sta
nd
ard
5.1
1. Uses images effectively for
different purposes.
The visually literate student
designs and creates
meaningful images and visual
media.
Sta
nd
ard
6.2
2a. Creates images and visual
media to represent and
communicate concepts,
narratives, and arguments.

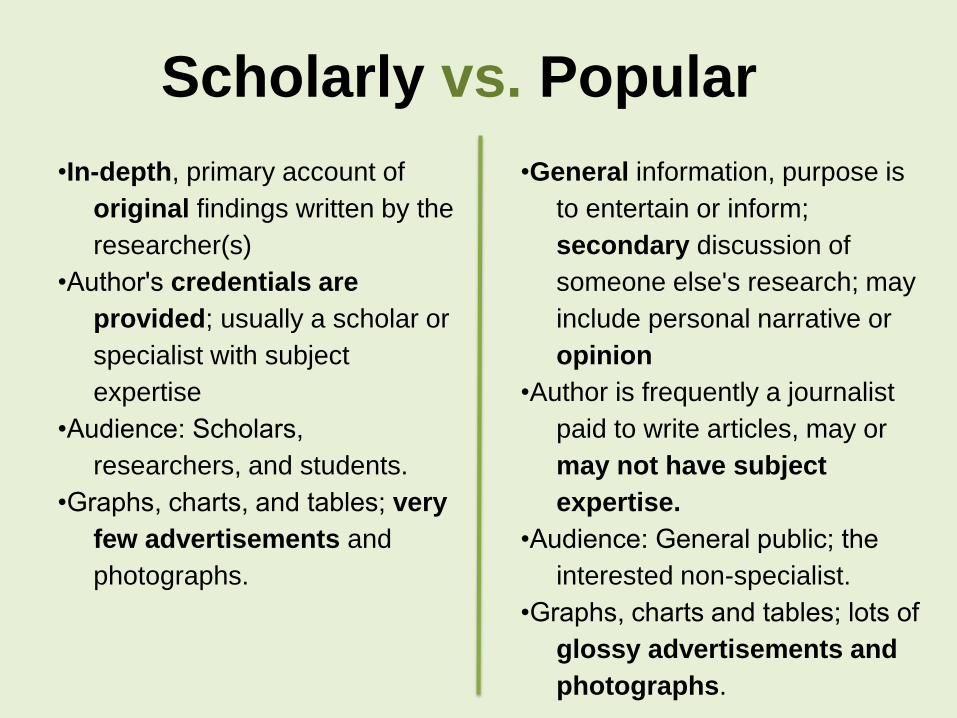
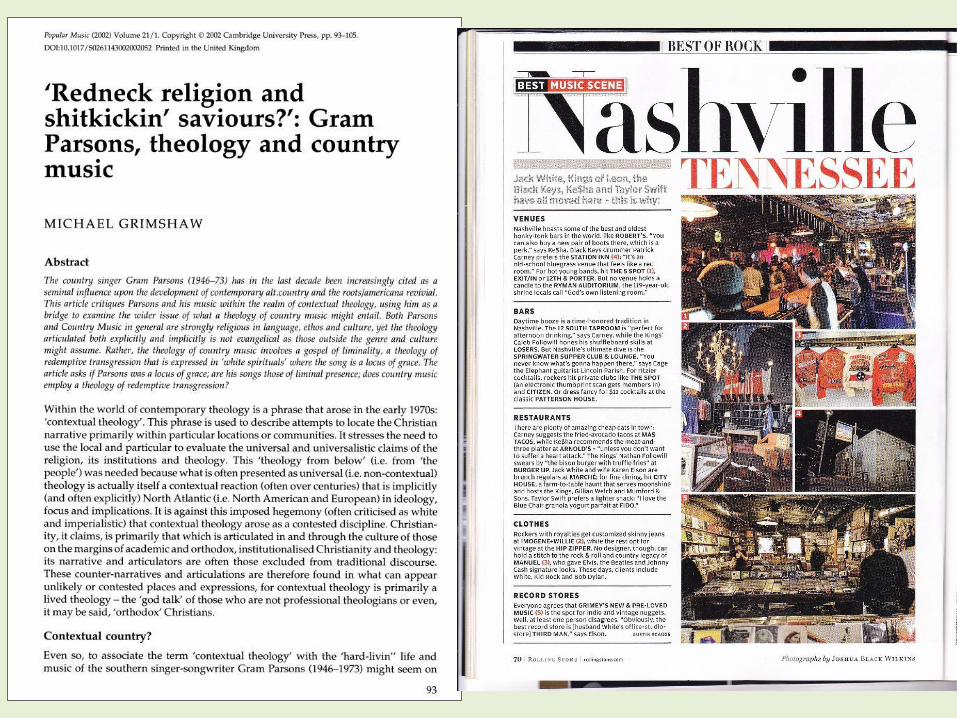
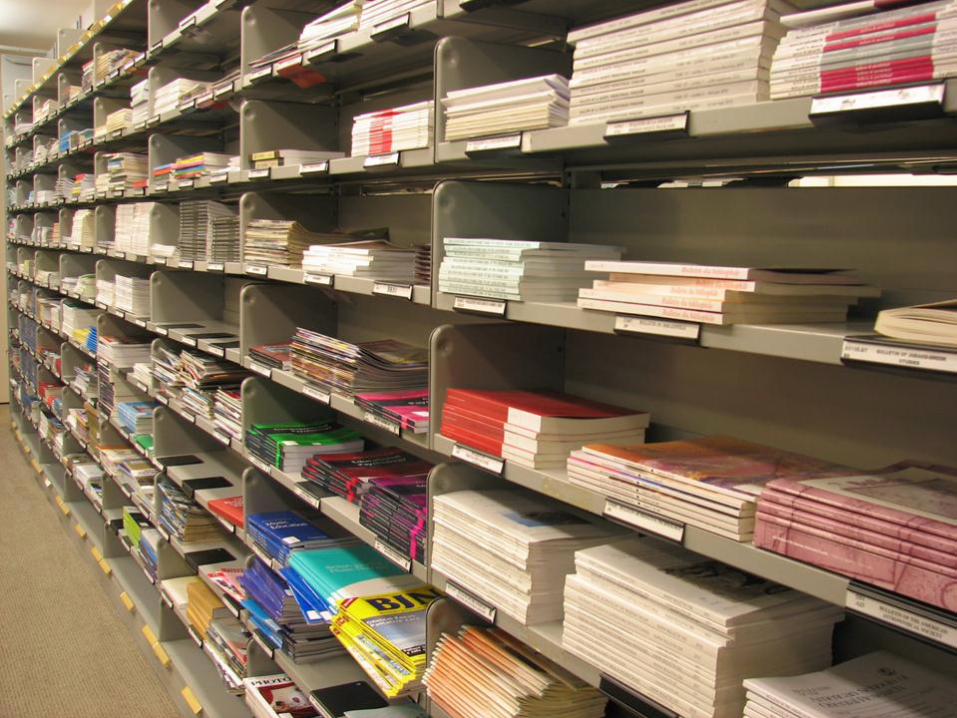
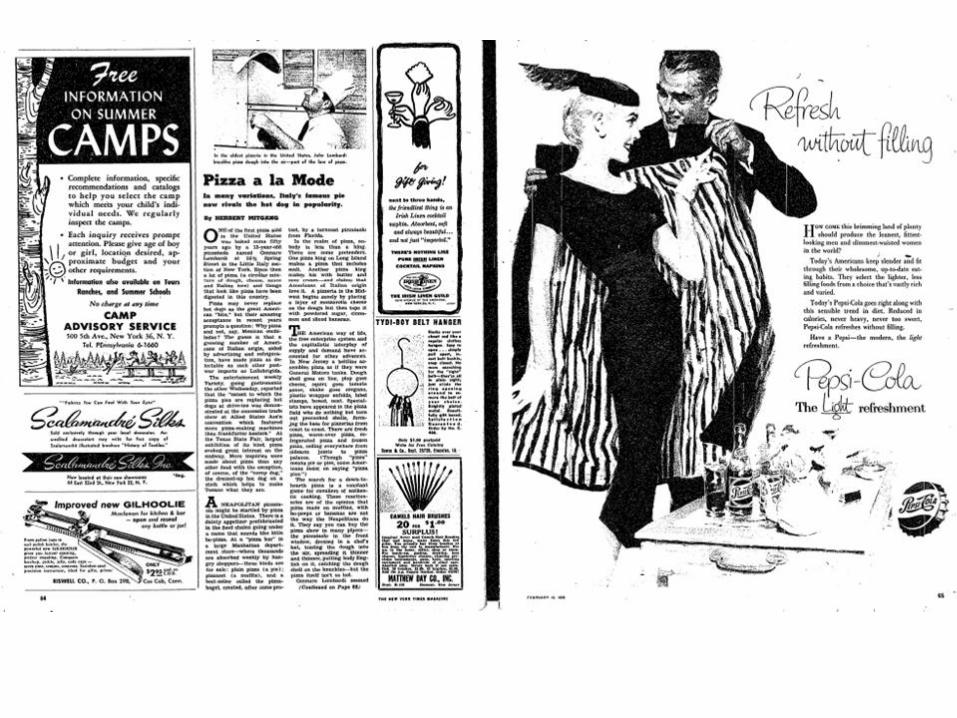
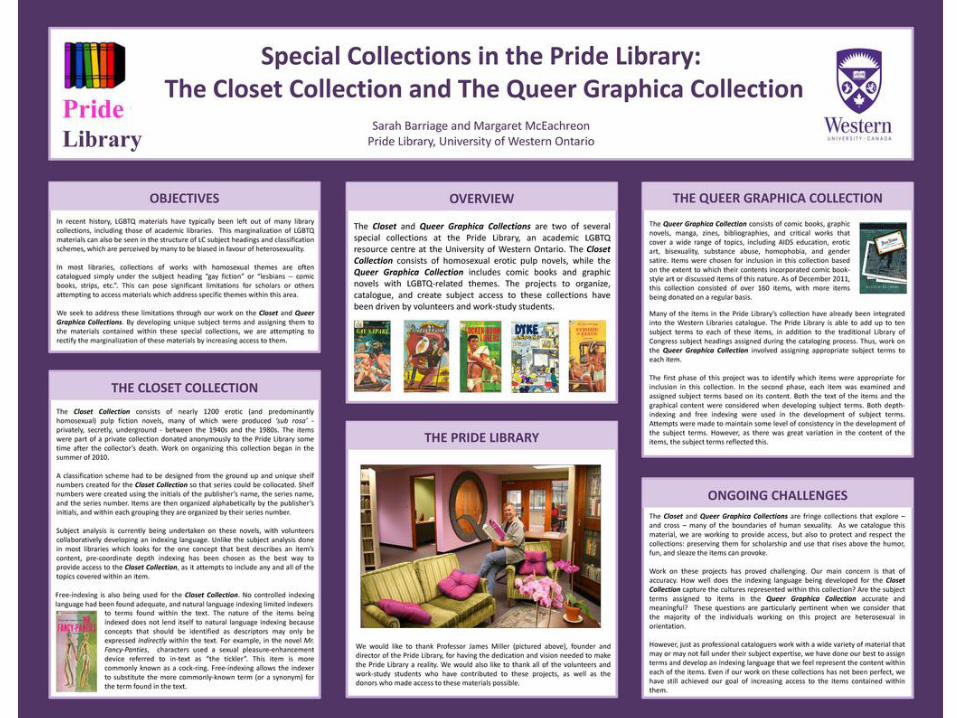
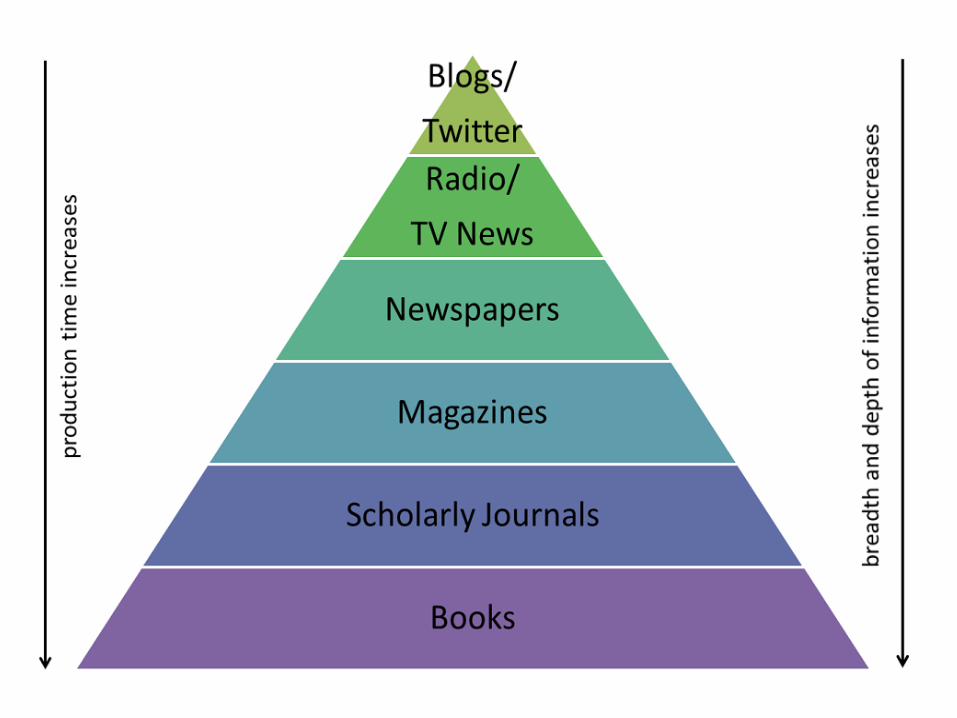
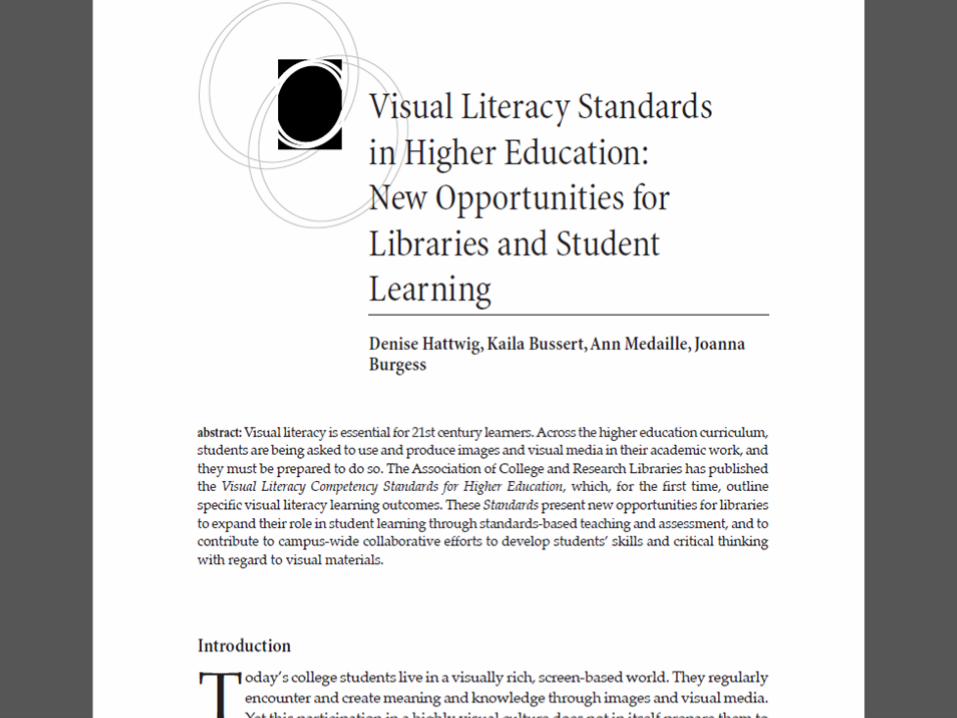
Scholarly vs. Popular
•In-depth, primary account of
original findings written by the
researcher(s)
•Author's credentials are
provided; usually a scholar or
specialist with subject
expertise
•Audience: Scholars,
researchers, and students.
•Graphs, charts, and tables; very
few advertisements and
photographs.
•General information, purpose is
to entertain or inform;
secondary discussion of
someone else's research; may
include personal narrative or
opinion
•Author is frequently a journalist
paid to write articles, may or
may not have subject
expertise.
•Audience: General public; the
interested non-specialist.
•Graphs, charts and tables; lots of
glossy advertisements and
photographs.


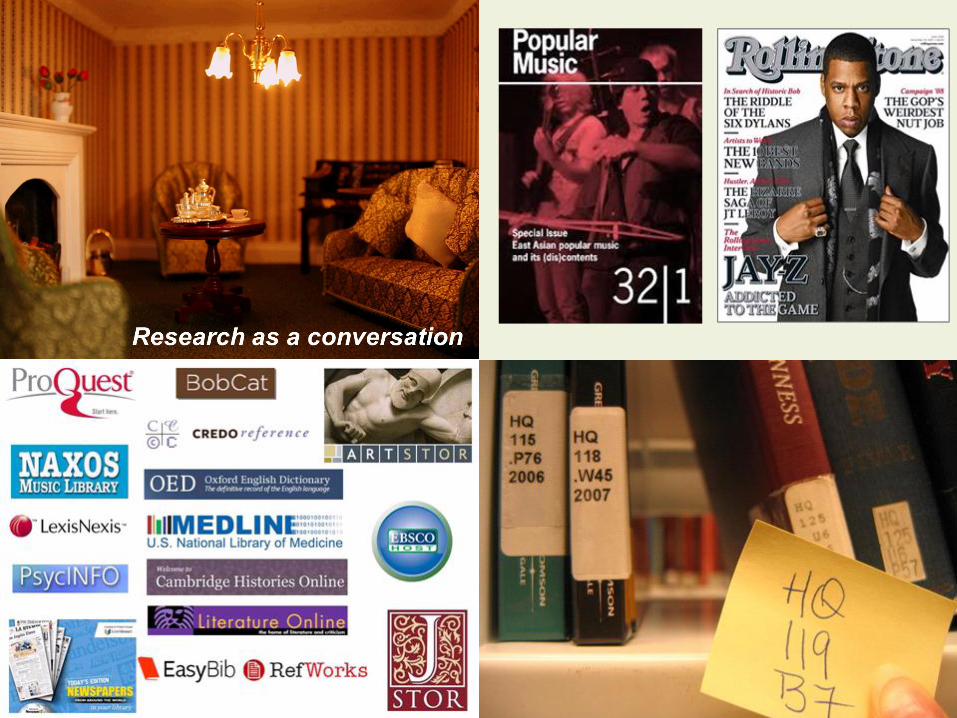
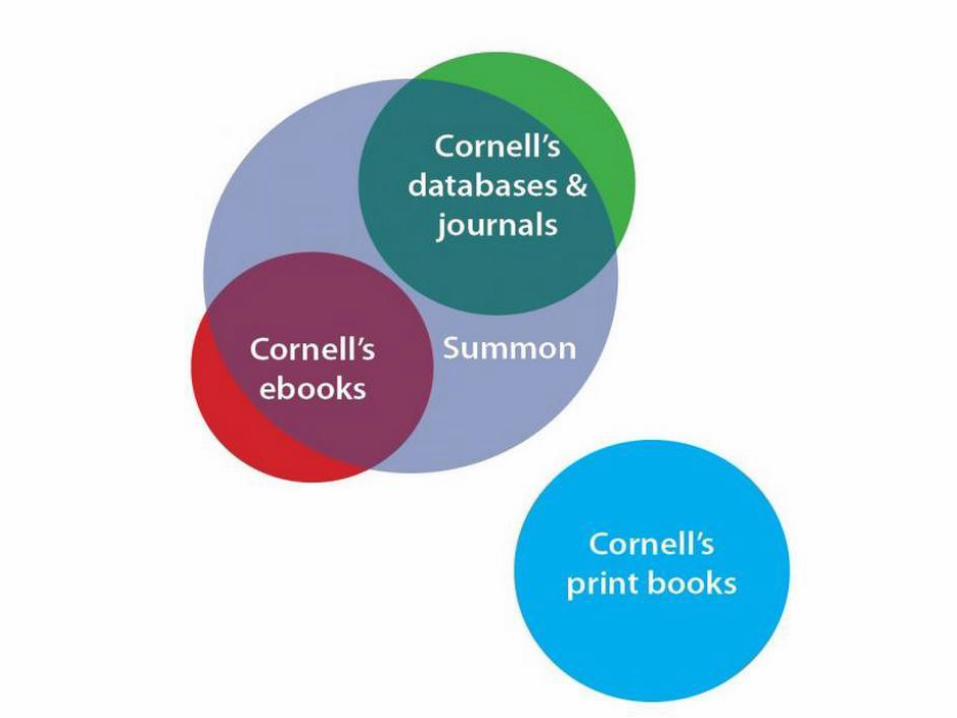
Research as a conversation

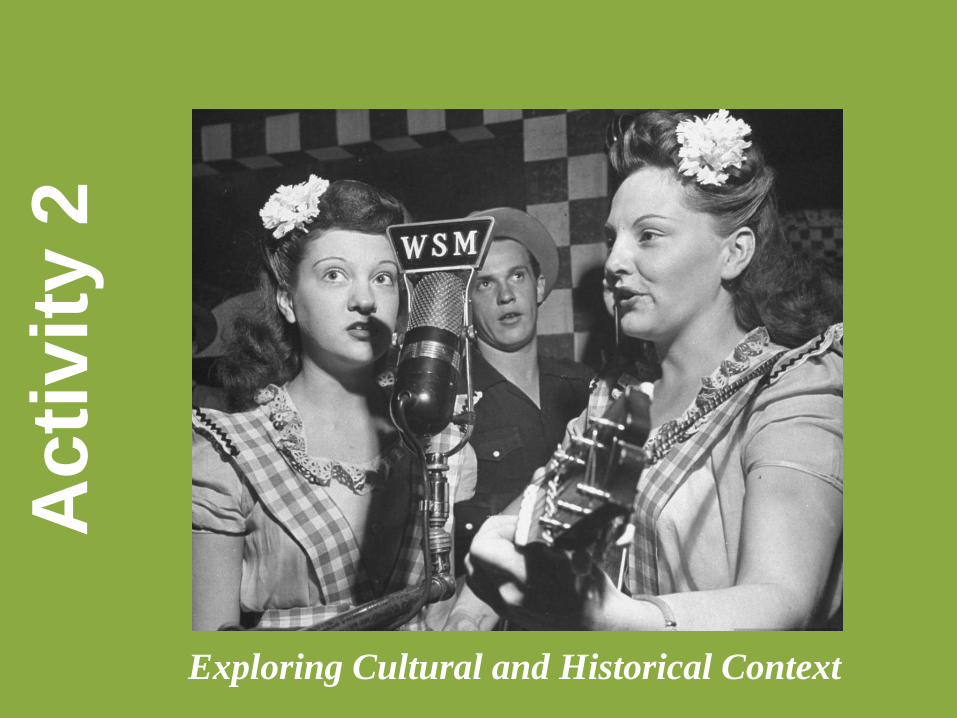
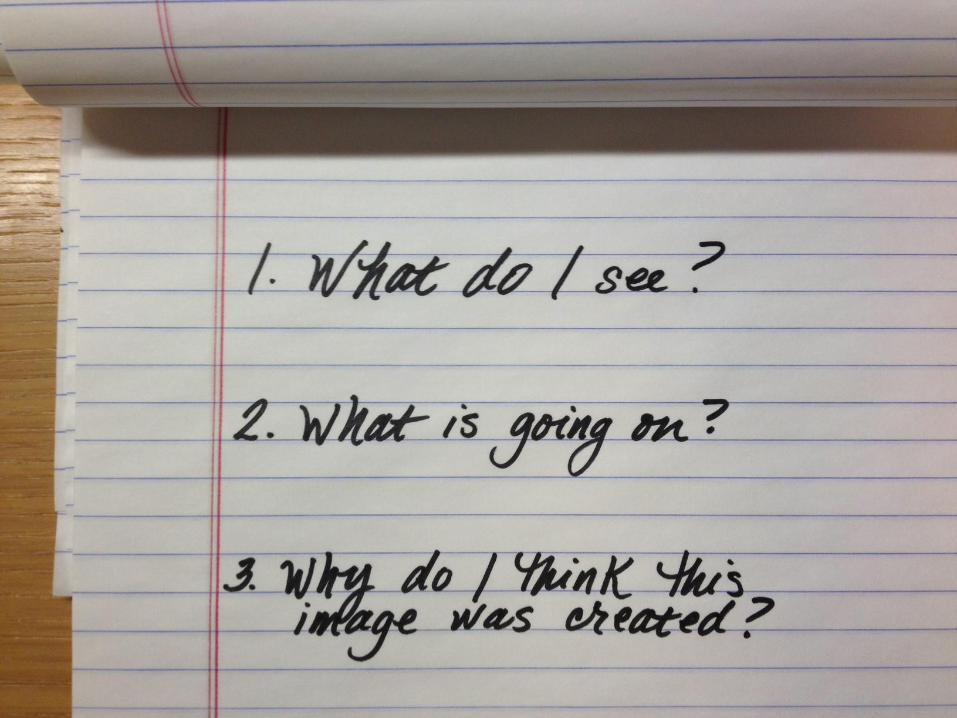
Acti
vit
y 2
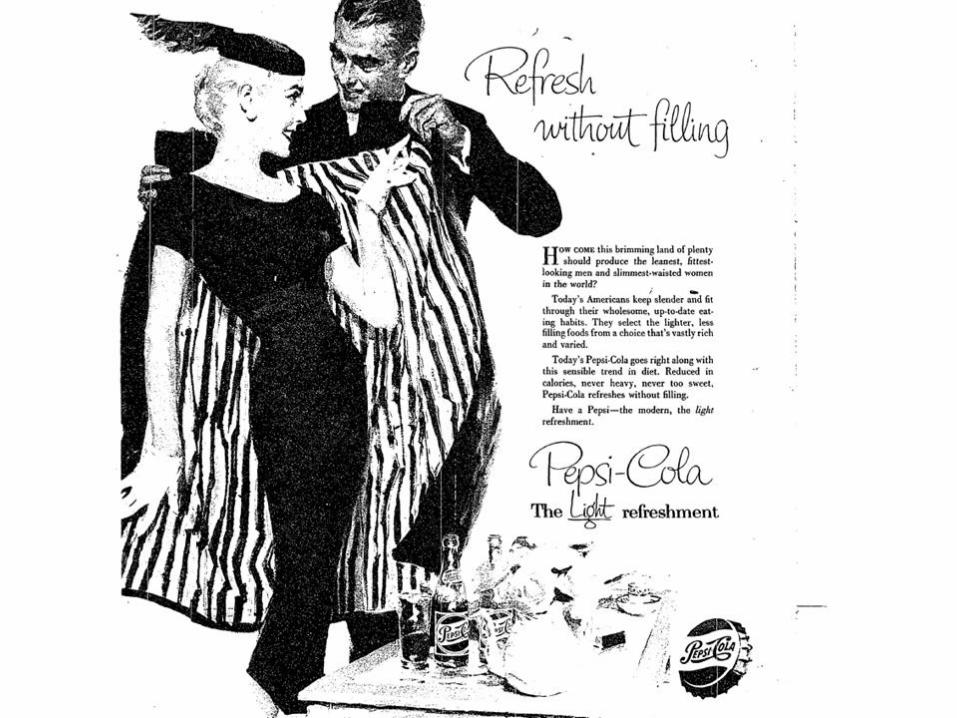
Exploring Cultural and Historical Context

Examine the image and metadata.
a) Write down all of the questions that come
to mind.
b) Share with your neighbor. What new
questions emerge?
The visually literate student
interprets and analyzes the
meanings of images and
visual media.
Sta
nd
ard
3.2
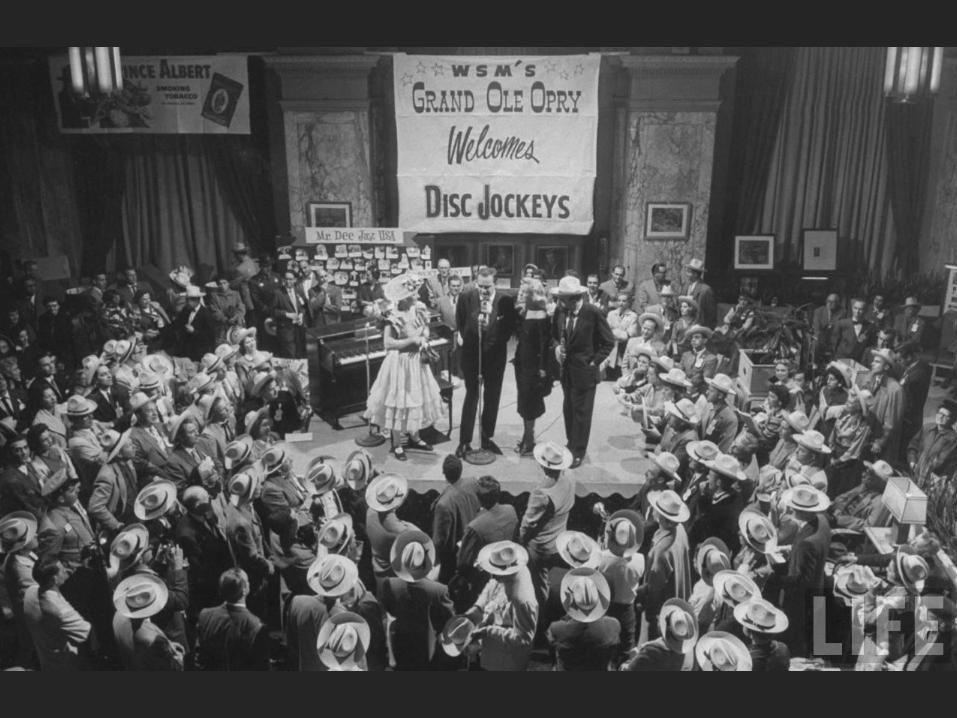
2. Situates an image in its
cultural, social, and historical
contexts.


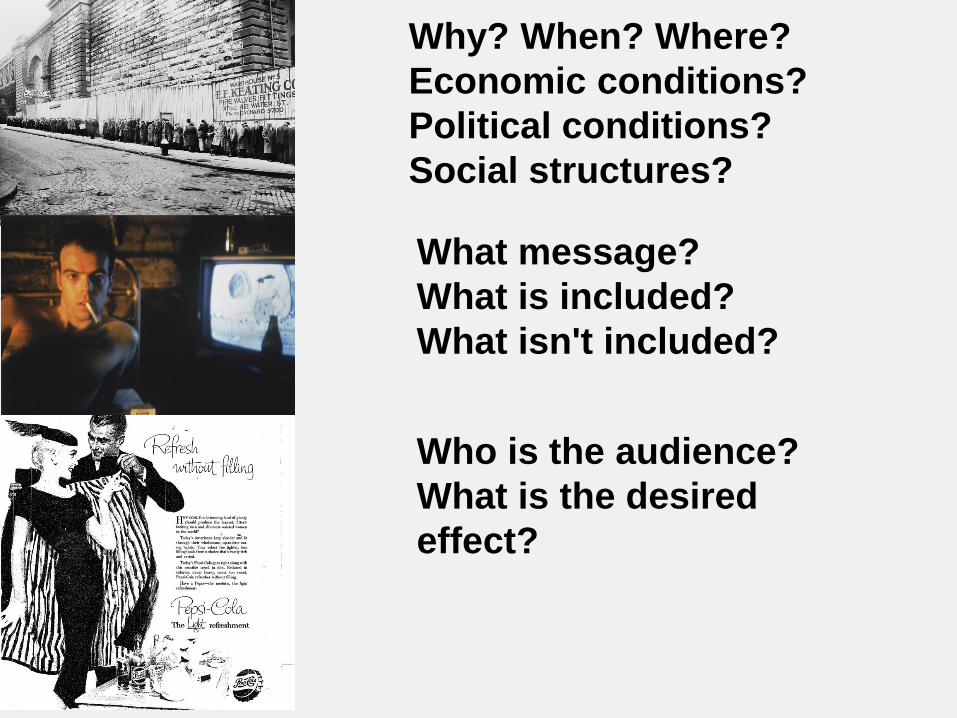
Why? When? Where?
Economic conditions?
Political conditions?
Social structures?
What message?
What is included?
What isn't included?
Who is the audience?
What is the desired
effect?
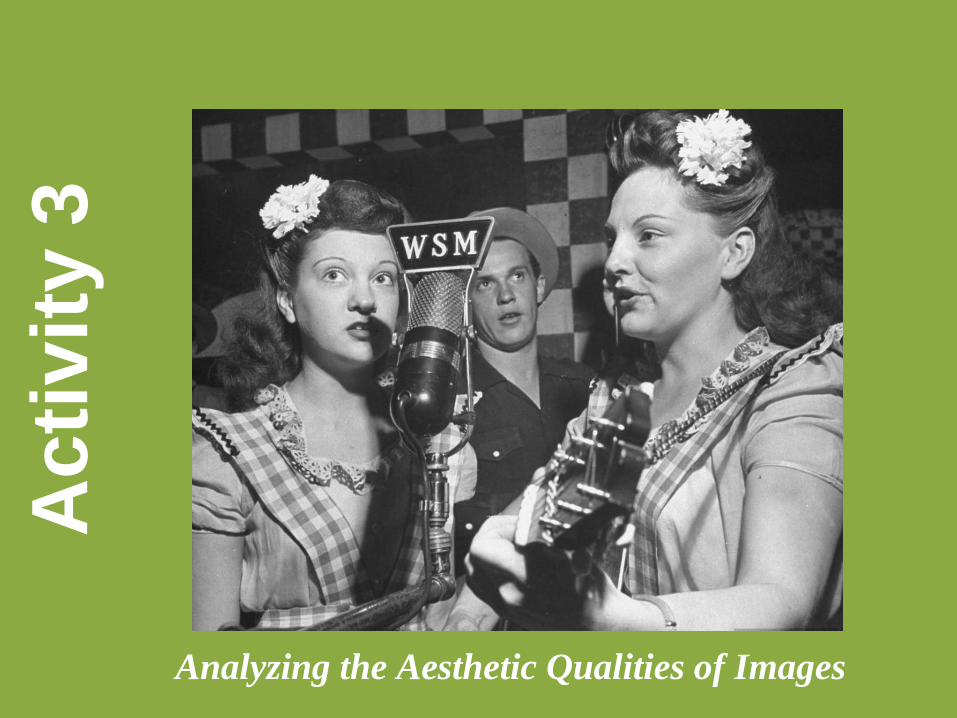
Acti
vit
y 3
Analyzing the Aesthetic Qualities of Images
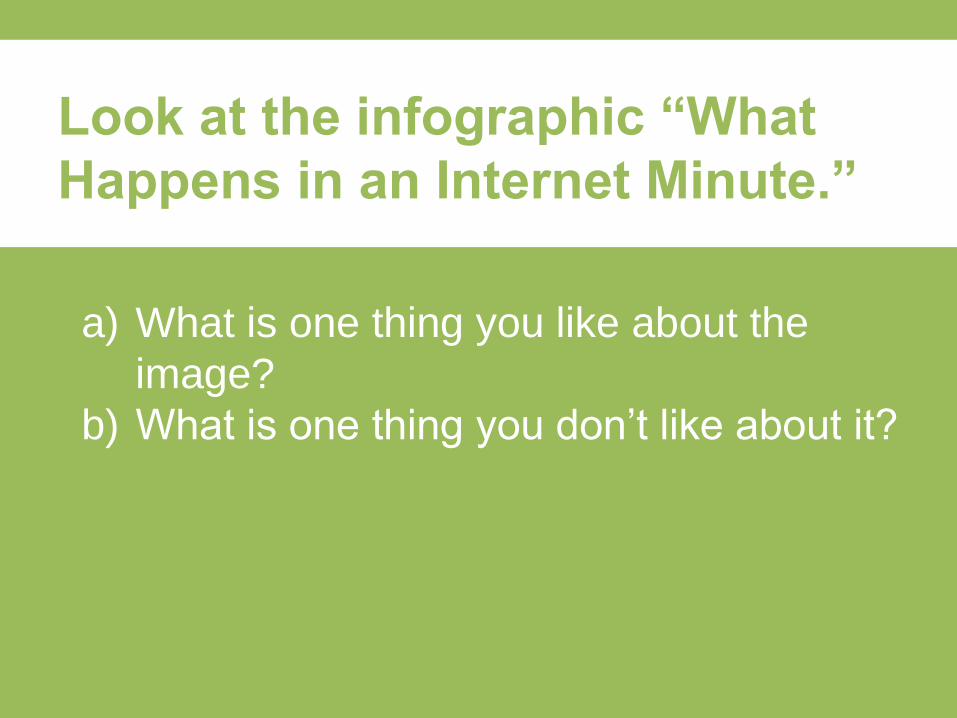
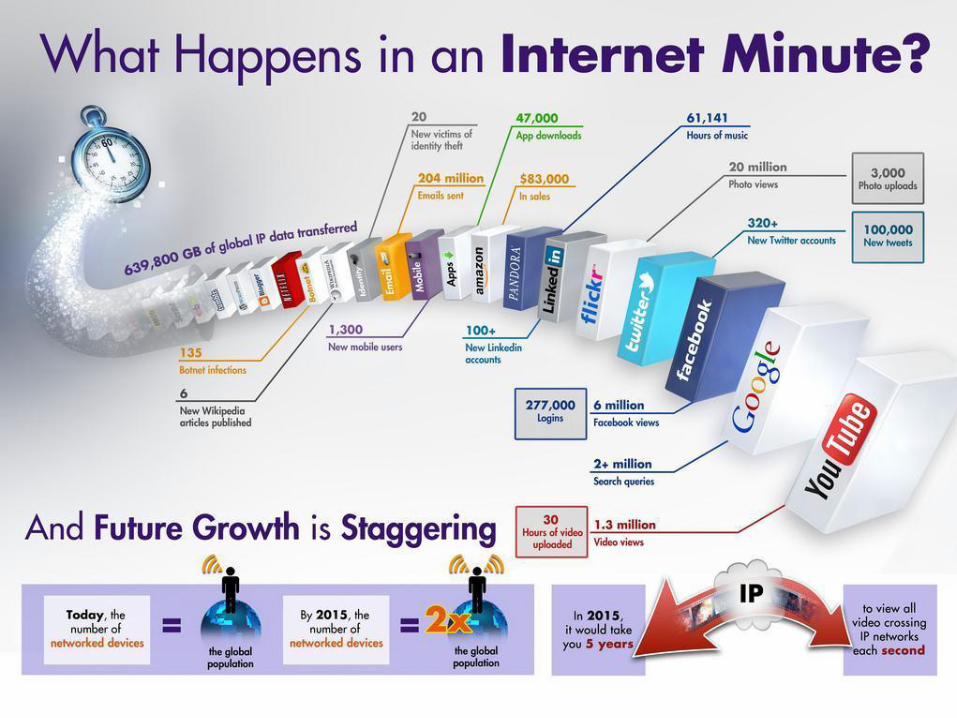
a) What is one thing you like about the
image?
b) What is one thing you don’t like about it?
Look at the infographic “What
Happens in an Internet Minute.”
The visually literate student
evaluates images and their
sources.
Sta
nd
ard
4.2
2. Evaluates the aesthetic and
technical characteristics of
images.


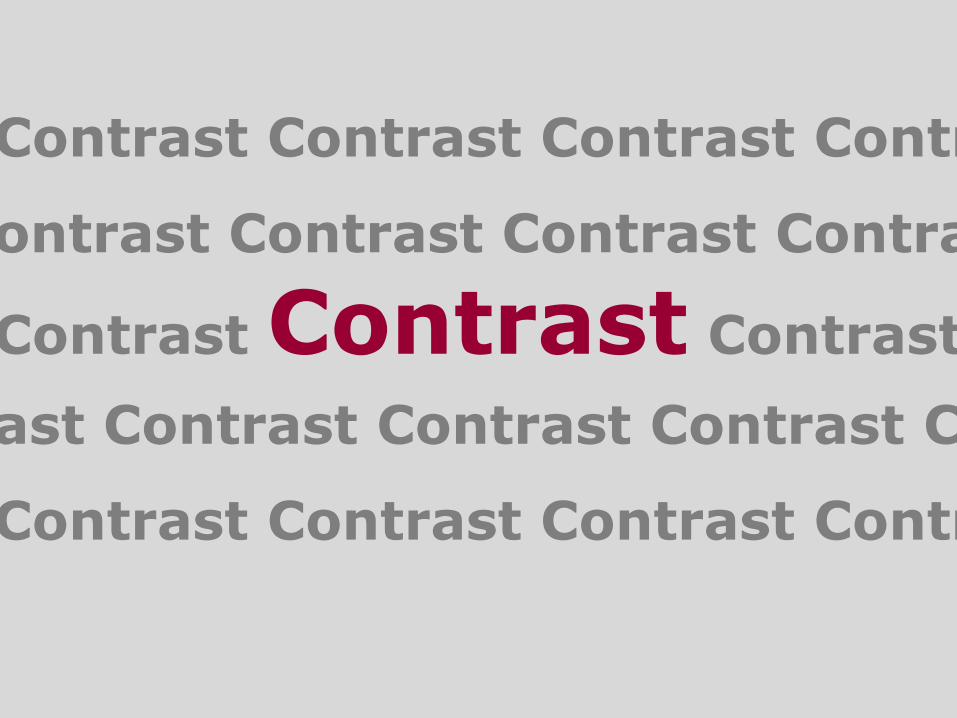
Contrast Contrast Contrast Contr
ontrast Contrast Contrast Contra
Contrast Contrast Contrast
ast Contrast Contrast Contrast C
Contrast Contrast Contrast Contr

Where does your eye go?

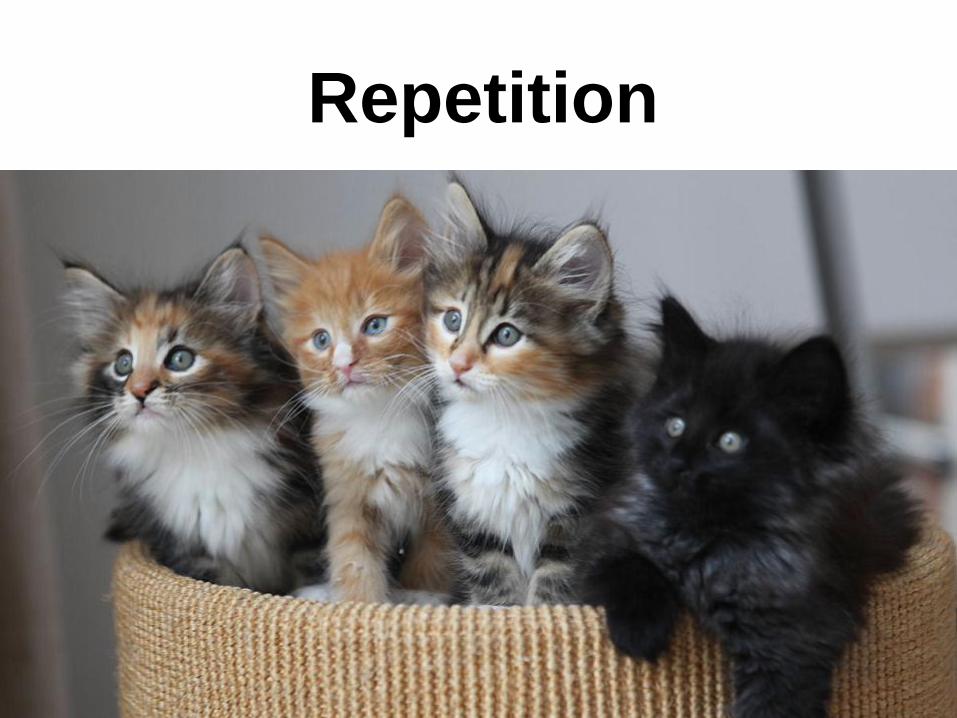
Repetition
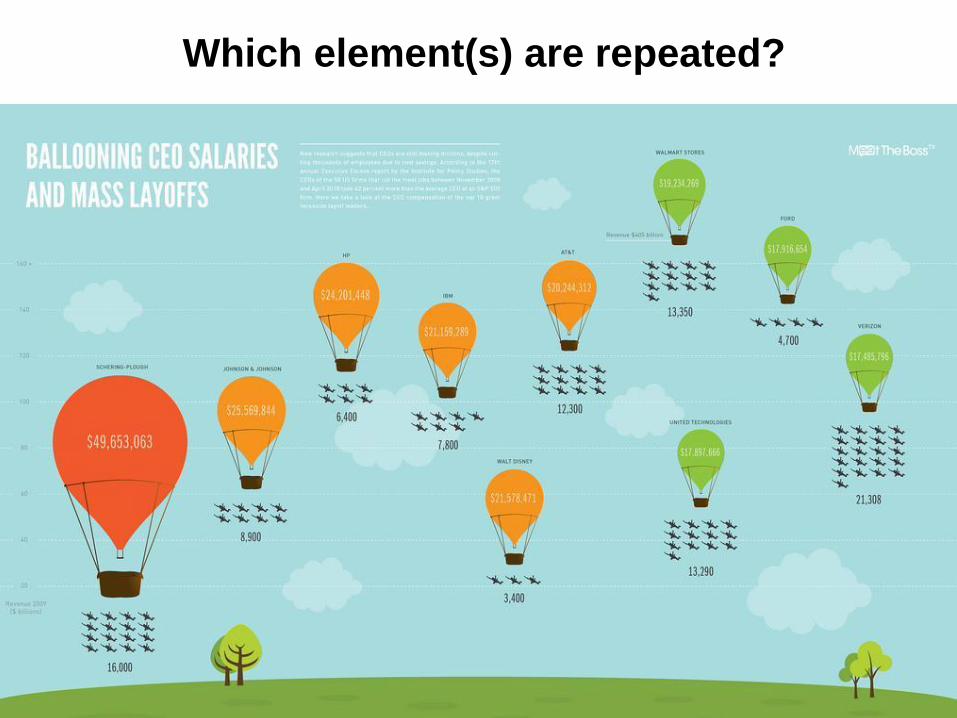
Which element(s) are repeated?
X`
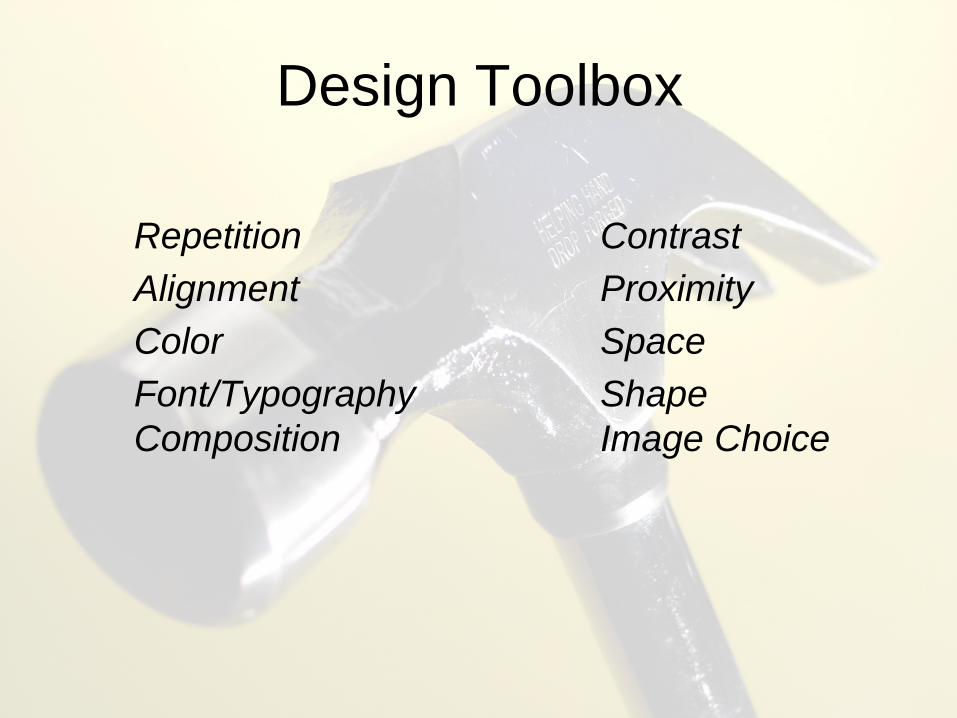
Design Toolbox
Repetition Contrast
Alignment Proximity
Color Space
Font/Typography Shape
Composition Image Choice
graph example here - e.g. venn diagram or something else

Topic/
Main Idea
Related
Issue
Related
Issue
Related
Issue
Detail/
example
Detail/
example
Concept Maps for Research Topics
Related
Issue
Detail/
example


Clo
sin
g R
efl
ec
tio
n
What is one thing you
learned today that you
can put into practice?
Imag
e C
red
its
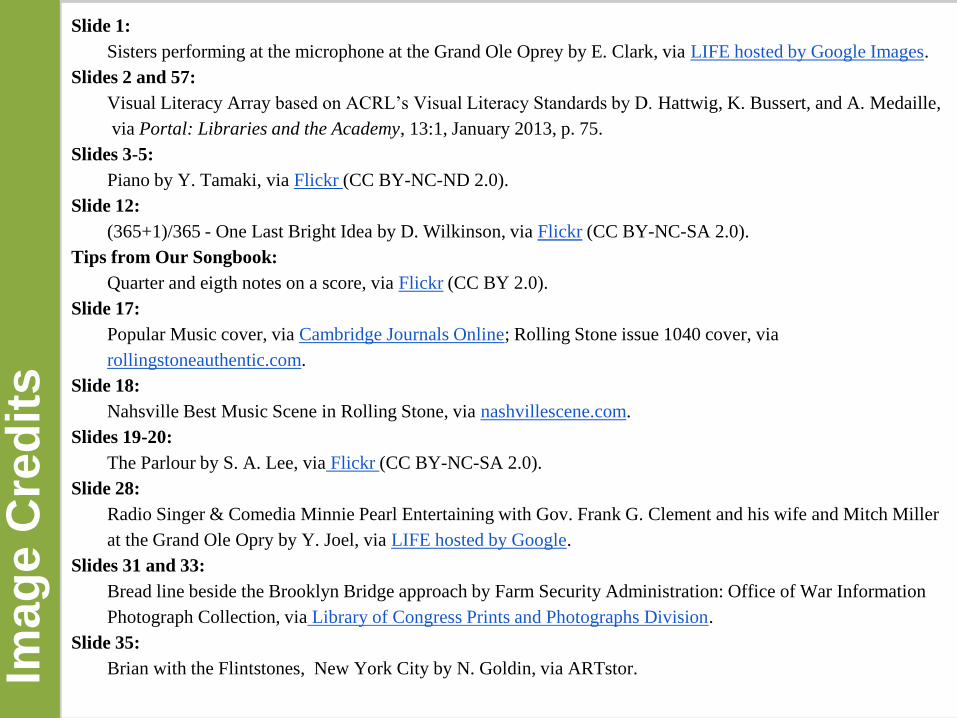
Slide 1:
Sisters performing at the microphone at the Grand Ole Oprey by E. Clark, via LIFE hosted by Google Images.
Slides 2 and 57:
Visual Literacy Array based on ACRL’s Visual Literacy Standards by D. Hattwig, K. Bussert, and A. Medaille,
via Portal: Libraries and the Academy, 13:1, January 2013, p. 75.
Slides 3-5:
Piano by Y. Tamaki, via Flickr (CC BY-NC-ND 2.0).
Slide 12:
(365+1)/365 - One Last Bright Idea by D. Wilkinson, via Flickr (CC BY-NC-SA 2.0).
Tips from Our Songbook:
Quarter and eigth notes on a score, via Flickr (CC BY 2.0).
Slide 17:
Popular Music cover, via Cambridge Journals Online; Rolling Stone issue 1040 cover, via
rollingstoneauthentic.com.
Slide 18:
Nahsville Best Music Scene in Rolling Stone, via nashvillescene.com.
Slides 19-20:
The Parlour by S. A. Lee, via Flickr (CC BY-NC-SA 2.0).
Slide 28:
Radio Singer & Comedia Minnie Pearl Entertaining with Gov. Frank G. Clement and his wife and Mitch Miller
at the Grand Ole Opry by Y. Joel, via LIFE hosted by Google.
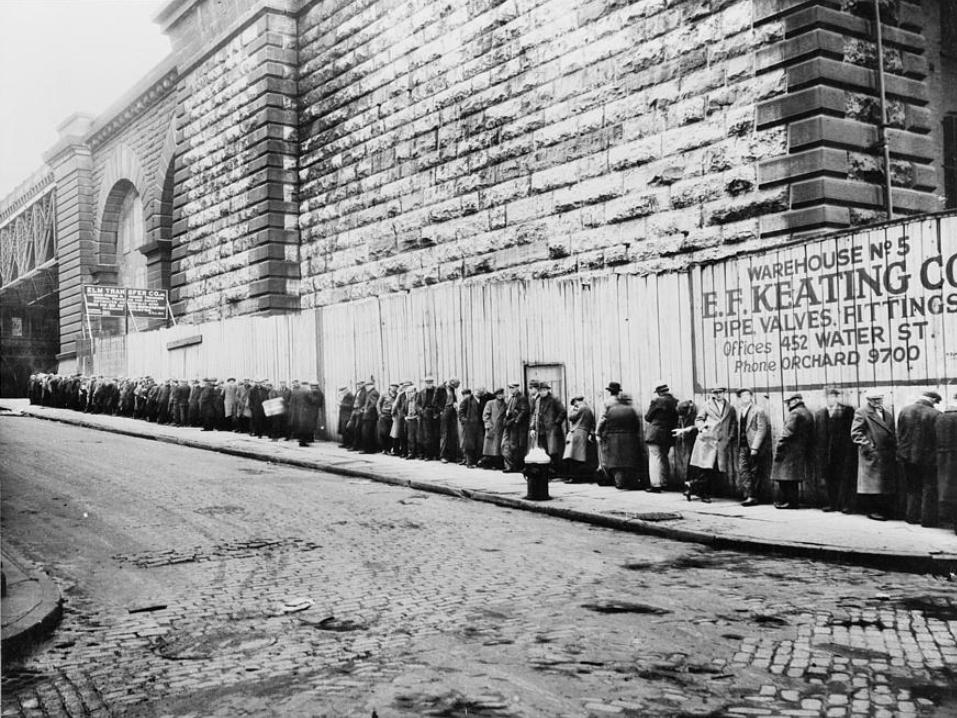
Slides 31 and 33:
Bread line beside the Brooklyn Bridge approach by Farm Security Administration: Office of War Information
Photograph Collection, via Library of Congress Prints and Photographs Division.
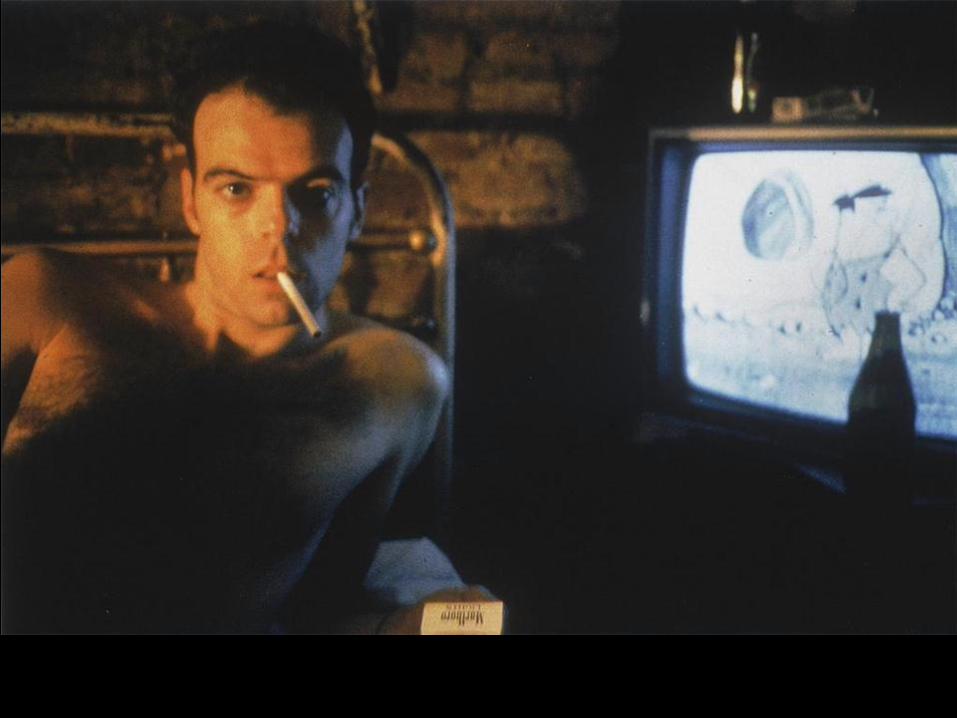
Slide 35:
Brian with the Flintstones, New York City by N. Goldin, via ARTstor.
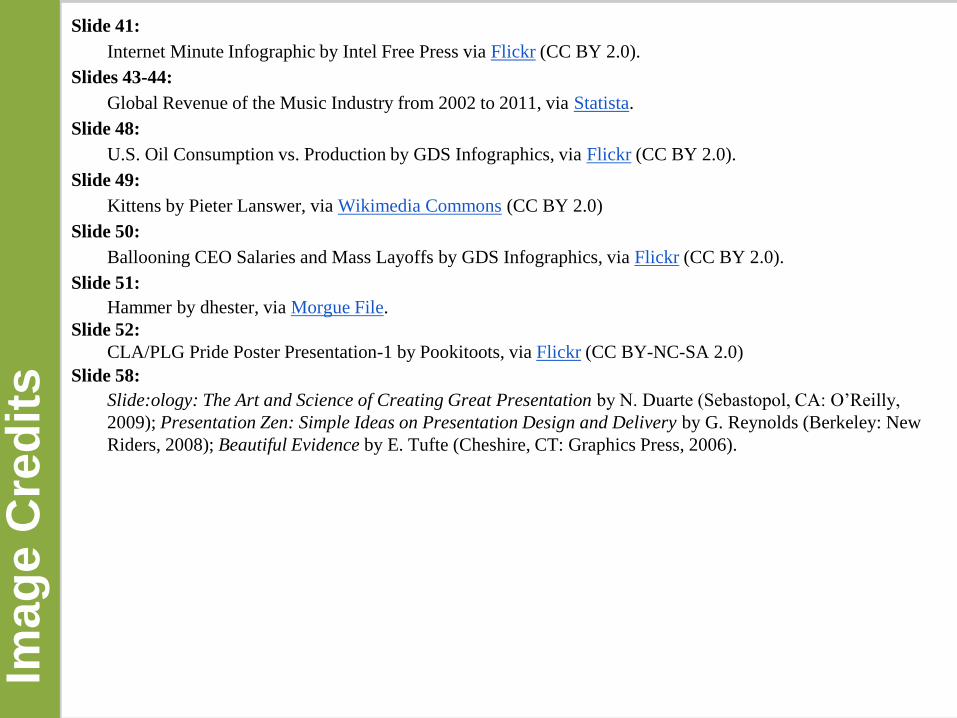
Imag
e C
red
its
Slide 41:
Internet Minute Infographic by Intel Free Press via Flickr (CC BY 2.0).
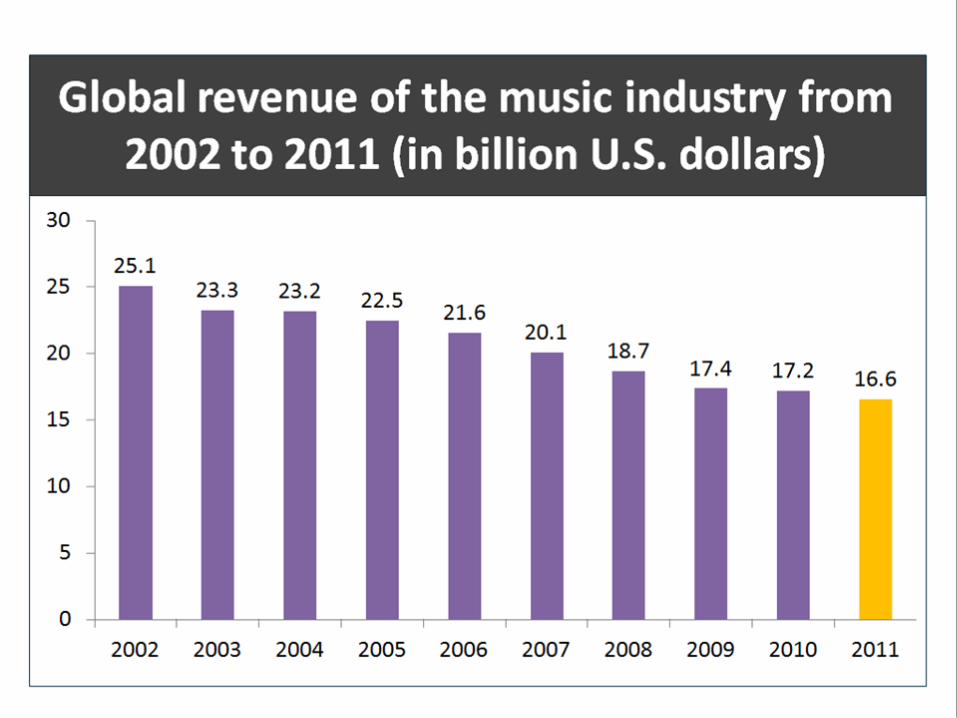
Slides 43-44:
Global Revenue of the Music Industry from 2002 to 2011, via Statista.
Slide 48:
U.S. Oil Consumption vs. Production by GDS Infographics, via Flickr (CC BY 2.0).
Slide 49:
Kittens by Pieter Lanswer, via Wikimedia Commons (CC BY 2.0)
Slide 50:
Ballooning CEO Salaries and Mass Layoffs by GDS Infographics, via Flickr (CC BY 2.0).
Slide 51:
Hammer by dhester, via Morgue File.
Slide 52:
CLA/PLG Pride Poster Presentation-1 by Pookitoots, via Flickr (CC BY-NC-SA 2.0)
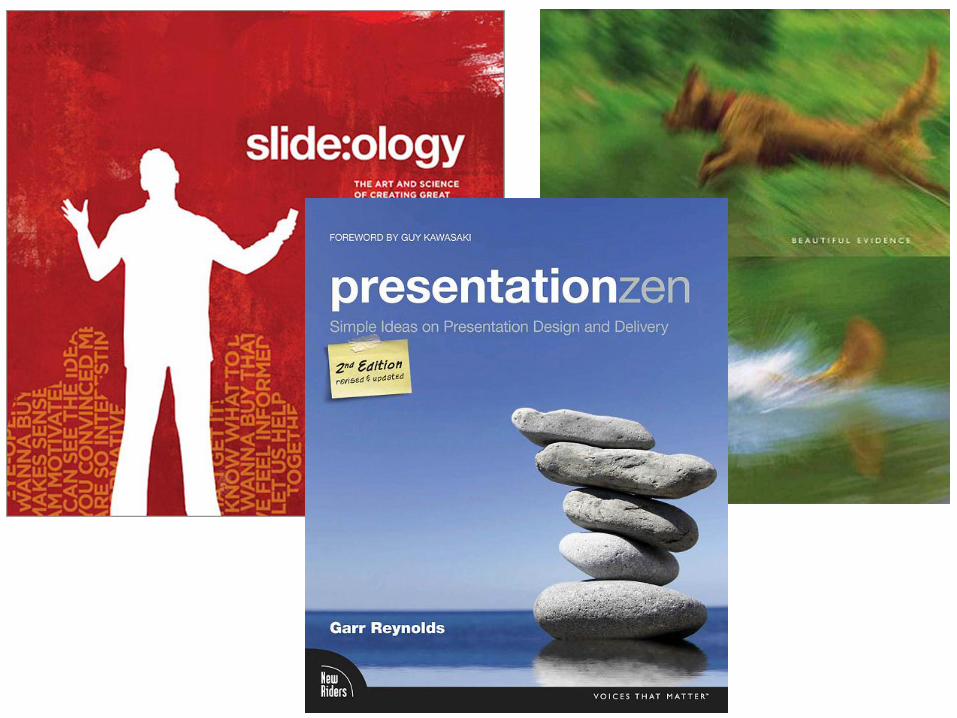
Slide 58:
Slide:ology: The Art and Science of Creating Great Presentation by N. Duarte (Sebastopol, CA: O’Reilly,
2009); Presentation Zen: Simple Ideas on Presentation Design and Delivery by G. Reynolds (Berkeley: New
Riders, 2008); Beautiful Evidence by E. Tufte (Cheshire, CT: Graphics Press, 2006).