make japan great again - wordpress.com 02, 2015 · make japan great again ... a town in fukushima...
TRANSCRIPT

Page 1 INTELLIGENCE, INDEPENDENCE, INTEGRITY www.analogica.jp
Make Japan Great Again
How to halt mass migration out of Japan’s prefectures
Mike Newman President & CEO Analogica K.K.
February 8th, 2017

Page 2 INTELLIGENCE, INDEPENDENCE, INTEGRITY www.analogica.jp
The sad tale of Yubari City
Economic woes
Hokkaido in trouble
Akita the oldest prefecture in
Japan
Flocking to the big smoke
Merging towns
Tohoku most troubled
Depopulation
The state of inter-prefectural migration – a disturbing summary
The campaign poster on the cover page is from Yubari City in Hokkaido – “No money but love.”
Yubari is notable for five things. First, it is the region that produces Japan’s most expensive melons,
the type you see beautifully encased in a satin-lined pine box with a price label of US$200. Second,
it had to declare bankruptcy in 2007. Third, its population has fallen from 117,000 in the 1960s to
around 21,000 in the 1990s to less than 8,900 today, falling 19% in the last 5 years alone. Fourth,
the average age of the city’s residents is set to hit 65 by 2020. Fifth, taxable income continues to fall
with estimates that government coffers will swell by a woozy 25% of the levels seen 20 years ago.
Their claim that Yubari has the lowest divorce rate in Japan doesn’t seem to be stopping residents
from divorcing it. In fact, as we learnt in our Crime in Japan series, economic woes are preventing
more couples from divorcing but even some that break their vows end up living under the same roof.
The problem is so prevalent that the National Police Agency had to invent a new category for
domestic violence to tally the sharp rise in cases in 2014 of divorced couples living together.
Hokkaido’s woes are not just limited to Yubari. Sadly, the northern island holds 6 of the top 15
prefectures across Japan experiencing an exodus of its citizens. Hokkaido has 85 villages with less
than 5,000 residents. Over the last 5 years in percentage terms, Yubari has seen a greater flood of
people than Minamisoma, a town in Fukushima Pref. on the 30km exclusion zone border to the north
of the crippled Fukushima Daiichi nuclear reactor.
Akita Prefecture has the highest percentage of 65yo+ citizens in Japan at 33.2% of the prefectural
total. Over 27% of its workforce is in construction and manufacturing. In what world, can a community
avert such a skewed employment picture? If the working aged populace is leaving with their kids
(high school enrolment is down 22% in 5 years), one of the highest natural population declines and
Akita has the second highest prefectural debt per capita what need is there for new construction
projects or the rationale for a corporate to expand local production?
Perhaps not surprising, many citizens are seeking new fortunes in the major cities – Tokyo, Osaka,
Nagoya, Yokohama, Saitama and Chiba are capturing the socio-economic spoils. One name that
did surprise was Fukuoka in the southern island of Kyushu. Fukuoka Pref. can claim 3 of the top 20
fastest growing cities in Japan.
Around 20 years ago, the Japanese government embarked on a program known as
‘Shichosongappei’ (市町村合併)which loosely translates as mergers of cities and towns. However
as much as that plan to sensibly merge public services was – e.g. waste collection, councils, schools
and hospitals – the cities (especially to the north) have continued to shrink. Age is a big factor which
shows up in prefectural GDP/capita as well as suicide rates.
Cities in the northern prefectures (Tohoku) face the biggest challenges. The Great East Japan
Disaster of March 2011 has only exacerbated the move out of these areas. Eight of the top 10 places
for fastest rates of depopulation are in Tohoku. Shikoku, and cities on the Japan Sea coast are also
at the mercy of residents pulling up roots. We colour code these prefectures to show how our ‘basket’
correlates highly.
Our biggest concern in summary
Our biggest concern remains that of rapid acceleration of depopulation going forward. Things seem
normal until the Rubicon is crossed. Then the damned flood can’t be dammed. As the productive

Page 3 INTELLIGENCE, INDEPENDENCE, INTEGRITY www.analogica.jp
Similar to German
reunification
Japan’s policies failing
Debt: Resident
Detroit
workforce looks to abandon its roots in search of sustainability we fear that corporates also face a
big dilemma. As was experienced with German reunification workers flocked to more economically
viable areas in the West scorching those businesses in the East. East German regions had to hike
wages significantly to stem the tide, ruining profitability. Even today the East has significantly higher
unemployment rates than the former West as businesses in the former communist bloc went to the
wall (no pun intended).
The Japanese government’s plans to revitalise the regions are not working because economic
reversals all hinges on confidence. The chicken and egg argument is simple. If corporates fear not
enough workers will remain to justify production and workers think long term quality of life will be far
more sustainable in economically healthier areas, growth won’t happen in the regions.
As regional Japan continues to shrink, the pressure will then be put back on the fiscal status of the
prefectural governments. The Japan Local Government Bond Association (JLGBA) highlights that
the financial strength index (FSI) of Shimane is the poorest in Japan. To put that in the context of
Detroit, which declared bankruptcy in 2013. Detroit has approximately $30,000 debt per resident
today. Looking at Shimane Prefecture its citizens carry around $14,000 prefectural government debt
per resident. Given the working age population of 54% (and falling) that number balloons to around
$26,000 per working age resident. Debt servicing (around 16% in Shimane) is one thing but in the
last 6 months, yields have begun to climb. As we know debt financing can turn on a dime.
Source: Custom Products Research, Japan Statistics Bureau
Although Detroit is incomparable on most measures to Japan it does highlight what a city can look
like when economic fortunes reverse. 30% of Detroit’s residents disappeared in 15 years. From the
highest per capita income in America during the 1960s it now languishes toward the bottom. 40%
live in poverty and the state suffered the ignominy of half the 350,000 home owners paid no property
taxes in 2011.
3,719,103
0
500,000
1,000,000
1,500,000
2,000,000
2,500,000
3,000,000
3,500,000
4,000,000
Shim
ane
Aki
ta
Toku
shim
a
Ko
chi
Tott
ori
Toya
ma
Iwat
e
Yam
anas
hi
Fuku
i
Ish
ikaw
a
Yam
agat
a
Ho
kkai
do
Niig
ata
Wak
ayam
a
Kag
osh
ima
Ao
mo
ri
Yam
agu
chi
Miy
azak
i
Oit
a
Kag
awa
Nag
asak
i
Saga
Ku
mam
oto
Nar
a
Hyo
go
Ehim
e
Nag
ano
Hir
osh
ima
Mie
Gif
u
Oka
yam
a
Kyo
to
Fuku
shim
a
Shiz
uo
ka
Shig
a
Ibar
aki
Miy
agi
Fuku
oka
Aic
hi
Osa
ka
Gu
nm
a
Toch
igi
Sait
ama
Ch
iba
Oki
naw
a
Kan
agaw
a
Toky
o
Fig. 1 - Prefectural Debt/30% fall in working age Citizens (¥)
Legend:Yellow -TohokuGrey - HokkaidoMauve - Shikoku/Kyushu/Japan SeaGreen - Fukuoka

Page 4 INTELLIGENCE, INDEPENDENCE, INTEGRITY www.analogica.jp
Polish style tax reform
The sorry tale of Yubari
The Solution – Polish style tax reform
Our solution is to adopt a Polish style tax reform which simplifies the system and gets the 70% of
corporations that don’t pay tax to contribute. Poland doubled corporate tax revenues on a halving of
tax rates in short order as a result of making tax avoidance (not evasion) no longer worth it. Japan
must take risks – it has nothing to lose.
Source: Custom Products Research
Let’s look at the problem and solutions more deeply.
Here yesterday, gone today
Yubari City is a tragedy. Its population is 90% lower than it was in the 1960s. Yet its legacy is likely
to be repeated as other cities fade out. These ghost towns are not merely dying because its elderly
citizens are shuffling off this mortal coil, the youth and working aged population are seeing little
prospects for the future and are congregating in the more populous areas which offer much more
viable economic scope.
Let us begin with the fastest depopulating cities in Fig.3.
-0.027
-0.295
0.619
0.559
0.260
0.184 0.175
0.059
-0.400
-0.200
0.000
0.200
0.400
0.600
0.800
Iwat
e A
kita
Ao
mo
ri Y
amag
uch
i Y
amag
ata
Oki
naw
a T
ott
ori
To
yam
a N
agan
o S
him
ane
Ho
kkai
do
Eh
ime
Osa
ka H
yogo
Kag
osh
ima
Nar
a K
um
amo
to O
ita
Fu
kush
ima
Ko
chi
Sag
a T
oku
shim
a F
uku
i N
agas
aki
Niig
ata
Sh
iga
Kag
awa
Yam
anas
hi
Ibar
aki
Oka
yam
a M
ie M
iyaz
aki
Gu
mm
a H
iro
shim
a F
uku
oka
Kan
agaw
a K
yoto
Ch
iba
Sh
izu
oka
To
chig
i S
aita
ma
Gif
u M
iyag
i W
akay
ama
Aic
hi
Ish
ikaw
a T
oky
oJa
pan
Fig. 2: 10yr current bond yields by prefecure (%) vs 10yr yields 6mths prior
Generic 10yr Yield - July 2016 Generic 10yr Yield - Jan 2017
Legend:Yellow -TohokuGrey - HokkaidoMauve - Shikoku/Kyushu/Japan SeaGreen - Fukuoka

Page 5 INTELLIGENCE, INDEPENDENCE, INTEGRITY www.analogica.jp
Hokkaido & Akita..
Aged population
skewed
Source: Custom Products Research, Japan Statistics Bureau
While many of these cities in Fig. 3 are relatively small (ranging from 3,500 to 65,000) the larger
cities in Hokkaido (Chitose and Sapporo have moved a mere +2% in the past 5 years) while all
others are at stall speed or falling. In the case of Akita Pref. all cities are in retreat, Fig.4.
Source: Custom Products Research, Japan Statistics Bureau
When we analyse the population pyramid we note that Akita tops the highest 65yo+ population in
the nation at 33%, Fig. 8. In the following charts, we’ll highlight Fukuoka (especially Fukuoka City)
as a hot spot outside the main metropoles. As the largest city in Kyushu it seems to be attracting
firm population growth which looks sustainable.
-19.0-18.5
-18.2
-15.2
-14.0
-12.2 -12.1 -11.9-11.7 -11.7 -11.5
-20.0
-19.0
-18.0
-17.0
-16.0
-15.0
-14.0
-13.0
-12.0
-11.0
-10.0 Yubari Minamisoma Utashinai Rikuzentakata Tosashimizu Akabira Oga Kumano Ashibetsu Kesennuma Bibai
Hokkaido Fukushima Pref Hokkaido Iwate Pref Kochi Pref Hokkaido Akita Pref Mie Pref Hokkaido Miyagi Pref Hokkaido
Fig.3 : % Rate of population change (2010-15)
Wiped out by tsunami in Mar 2011
On the 30km exclusion zone border north of Fukushima Daiichi nuclear plant
28,39533,230
46,620
25,330
54,746
32,057 27,530
82,77392,214
79,993 74,153
33,098
315,374
-12.1
-8.7-8.3 -8.0
-7.3 -7.0-6.9
-6.3 -6.3 -6.1 -6.1
-3.9-2.5
-14.0
-12.0
-10.0
-8.0
-6.0
-4.0
-2.0
0.0
0
50,000
100,000
150,000
200,000
250,000
300,000
350,000
Oga Kitaakita Yuzawa Nikaho Noshiro Kazuno Semboku Daisen Yokote Yurihonjo Odate Katagami Akita
Fig. 4: Disappearing Akita Prefecture (2010-2015) - fall in population over 5 years
Population % Rate of population change (2010-15)

Page 6 INTELLIGENCE, INDEPENDENCE, INTEGRITY www.analogica.jp
Fukuoka looks vibrant
Osaka anomaly
Age a factor
Source: Custom Products Research, Japan Statistics Bureau
We can see in Fig. 5 that quite a lot of Fukuokan towns have seen solid growth over the past 5
years. If we roll out the 15-year average we can clearly see that Fukuoka Pref has been the strongest
regional area of all. It should come as no surprise that the metropoles of Tokyo, Yokohama
(Kanagawa Pref), Saitama, Chiba Pref and Nagoya (Aichi Pref) has claimed the bulk of the exodus.
As Fig.6 shows, only 9 out of 47 prefectures have experienced net annual population inflows over
the last 15 years.
Even Osaka saw average outflows of 7,200 per annum although part of that is to do with its close
proximity to Hyogo & Nara prefectures and rising numbers of commuters taking advantage of
cheaper property and relatively short journeys to work in Japan’s second largest city.
Source: Custom Products Research, Japan Statistics Bureau
Boiling down deeper into the data we see how age is a factor. When looking at the 0-14yo and 65yo+
populations by prefecture there is little surprise, Figs. 7-8. All of Tohoku has a 0-14yo population
below the national average and 5 out of 6 have 65yo+ populations above the national average.
Fukuoka Prefecture is the opposite. Hokkaido falls on the wrong side of both categories.
192,554 228,200 206,974
58,808
1,538,510
306,014
99,575 110,767
255,852 217,943
72,200
7.97.4 7.1
6.1
5.14.7 4.7
3.73.5
3.0
2.4
0.0
1.0
2.0
3.0
4.0
5.0
6.0
7.0
8.0
9.0
0
200,000
400,000
600,000
800,000
1,000,000
1,200,000
1,400,000
1,600,000
1,800,000
Chuo-ku Hakata-ku Nishi-ku Fukutsu Fukuoka Higashi-ku Onojo Kasuga Minami-ku Sawara-ku Dazaifu
Fig. 5: Fighting Fukuoka Pref (2010-2015)
Population % Rate of population change (2010-15)
66,653
3,650
903
-9,772
-20,000
-10,000
0
10,000
20,000
30,000
40,000
50,000
60,000
70,000
80,000
Toky
o
Kan
agaw
a
Sait
ama
Ch
iba
Aic
hi
Fuku
oka
Shig
a
Oki
naw
a
Miy
agi
Toch
igi
Toya
ma
Ish
ikaw
a
Tott
ori
Oka
yam
a
Kag
awa
Ko
chi
Shim
ane
Gu
mm
a
Yam
anas
hi
Toku
shim
a
Mie
Fuku
i
Saga
Oit
a
Hyo
go
Ku
mam
oto
Nag
ano
Kyo
to
Wak
ayam
a
Miy
azak
i
Hir
osh
ima
Ehim
e
Nar
a
Kag
osh
ima
Ibar
aki
Yam
agu
chi
Yam
agat
a
Iwat
e
Gif
u
Aki
ta
Shiz
uo
ka
Fuku
shim
a
Niig
ata
Ao
mo
ri
Nag
asak
i
Osa
ka
Ho
kkai
do
Fig. 6: Average Annual Prefectural Migration over the last 15 years

Page 7 INTELLIGENCE, INDEPENDENCE, INTEGRITY www.analogica.jp
Okinawa the youngest
Shimane the same as 1920
Source: Custom Products Research, Japan Statistics Bureau
Okinawa is the prefecture with the youngest population. As far as its towns are concerned, Okinawa
is still seeing mild net migration. The largest city of Naha has grown 1.1% over the last 5 years
although smaller towns are growing faster. Only Miyakojima is sliding.
Source: Custom Products Research, Japan Statistics Bureau
When we look at population growth in the period since 1920, some sad tales are told. Shimane
Prefecture on the Japan Sea coast has not grown at all in almost 100 years. Kanagawa Prefecture
on the other hand has ballooned almost 6x, Fig.9. All prefectures in Tohoku, bar Miyagi (Sendai)
have seen population growth rates under the national average over the respective period.
17.0%
12.9%
12.5% 12.4%12.1%
11.9%
11.3%
11.2%
11.2%
10.5%
10.0%
11.0%
12.0%
13.0%
14.0%
15.0%
16.0%
17.0%
18.0%
Oki
naw
a
Shig
a
Saga
Aic
hi
Ku
mam
oto
Miy
azak
i
Kag
osh
ima
Gif
u
Fuku
i
Hir
osh
ima
Shiz
uo
ka
Toch
igi
Nag
ano
Gu
mm
a
Oka
yam
a
Ish
ikaw
a
Mie
Fuku
oka
Hyo
go
Nag
asak
i
Tott
ori
Ibar
aki
Kag
awa
Kan
agaw
a
Oit
a
Jap
an
Ch
iba
Sait
ama
Toya
ma
Miy
agi
Osa
ka
Yam
anas
hi
Shim
ane
Nar
a
Yam
agu
chi
Ehim
e
Yam
agat
a
Kyo
to
Niig
ata
Wak
ayam
a
Iwat
e
Ko
chi
Toku
shim
a
Ao
mo
ri
Fuku
shim
a
Ho
kkai
do
Toky
o
Aki
ta
Fig.7: Japan's 2015 Population - 0-14yo
Legend:Yellow -TohokuGrey - HokkaidoMauve - Shikoku/Kyushu/Japan SeaGreen - Fukuoka
33.2%
30.5% 30.2%29.5%
28.9% 28.7%
26.3%25.5%
25.0%
19.5%
15.0%
17.0%
19.0%
21.0%
23.0%
25.0%
27.0%
29.0%
31.0%
33.0%
35.0%
Aki
ta
Ko
chi
Shim
ane
Yam
agu
chi
Wak
ayam
a
Yam
agat
a
Toku
shim
a
Toya
ma
Iwat
e
Ehim
e
Oit
a
Niig
ata
Ao
mo
ri
Nag
ano
Kag
awa
Tott
ori
Nag
asak
i
Ho
kkai
do
Kag
osh
ima
Miy
azak
i
Fuku
shim
a
Ku
mam
oto
Fuku
i
Nar
a
Oka
yam
a
Yam
anas
hi
Hir
osh
ima
Gif
u
Saga
Shiz
uo
ka
Ish
ikaw
a
Mie
Gu
mm
a
Kyo
to
Hyo
go
Jap
an
Ibar
aki
Osa
ka
Ch
iba
Toch
igi
Fuku
oka
Miy
agi
Sait
ama
Shig
a
Kan
agaw
a
Aic
hi
Toky
o
Oki
naw
a
Fig.8: Japan's 2015 Population - 65yo+
Legend:Yellow -TohokuGrey - HokkaidoMauve - Shikoku/Kyushu/Japan SeaGreen - Fukuoka

Page 8 INTELLIGENCE, INDEPENDENCE, INTEGRITY www.analogica.jp
GDP/Capita
Crime
Source: Custom Products Research, Japan Statistics Bureau
When digging a bit deeper into the economics of the prefectures, it is clear to see that those with a
GDP/capita below the national average are those seeing an exodus of population, Fig.10. Naturally
all of Tohoku and Hokkaido are on the wrong side of the curve.
Source: Custom Products Research, Japan Statistics Bureau, Ministry of Finance
Two other sets of data to analyse the plight of these regions is the incidence of crime and suicide
rates by prefecture, Figs. 11-12.
In a somewhat counter-intuitive looking chart for a law-abiding country, perhaps a good indicator for
relative economic strength is crimes committed. The economic rationale for crime would be the
ability for the ‘second hand’ grey market to thrive in stolen goods. In the Tohoku region, crimes
committed per 100,000 population take the bottom four places which is unlikely to be solely down to
the inability of pensioners to literally outrun the law.
58
3.9
%
44
5.1
%
36
5.3
%
25
5.7
%
25
4.6
%
24
2.5
%
14
8.0
%
144.
1%
14
3.5
%
14
2.9
%
14
2.7
%
13
3.4
%
13
1.8
%
12
8.8
%
12
0.0
%
11
6.7
%
104.
8%
94
.5%
92
.0%
90
.7%
85
.5%
81
.6%
74
.3%
73
.5%
59
.7%
57.2
%
56
.6%
51
.0%
48
.9%
48
.0%
47
.4%
46
.9%
39
.4%
39
.2%
37
.7%
36
.7%
34
.6%
33
.7%
33
.6%
29
.5%
26
.1%
25
.6%
20
.8%
20
.6%
20
.5%
17
.2%
13
.9%
0.3
%
0.0%
100.0%
200.0%
300.0%
400.0%
500.0%
600.0%
700.0%
Kan
agaw
aSa
itam
aC
hib
aTo
kyo
Aic
hi
Osa
kaN
ara
Miy
agi
Oki
naw
aSh
izu
oka
Hyo
goH
okk
aid
oFu
kuo
kaJa
pan
Ibar
aki
Shig
aK
yoto
Gif
uTo
chig
iG
um
ma
Hir
osh
ima
Ao
mo
riM
iyaz
aki
Mie
Oka
yam
aIw
ate
Ish
ikaw
aTo
yam
aFu
kush
ima
Yam
anas
hi
Ku
mam
oto
Kag
awa
Yam
agu
chi
Oit
aN
agan
oEh
ime
Fuku
iN
iigat
aW
akay
ama
Tott
ori
Saga
Nag
asak
iA
kita
Yam
agat
aK
ago
shim
aTo
kush
ima
Ko
chi
Shim
ane
Fig.9: Population change in the prefectures between 1920 & 2013 (%)
Legend:Yellow -TohokuGrey - HokkaidoMauve - Shikoku/Kyushu/Japan SeaGreen - Fukuoka
4,423
2,9722,795
2,035
2,000
2,500
3,000
3,500
4,000
4,500
5,000
Toky
o
Aic
hi
Shiz
uo
ka
Ibar
aki
Shig
a
Toya
ma
Toch
igi
Hir
osh
ima
Nat
ion
al A
vera
ge
Kyo
to
Osa
ka
Yam
agu
chi
Mie
Kan
agaw
a
Gu
mm
a
Kag
awa
Ish
ikaw
a
Yam
anas
hi
Ch
iba
Sait
ama
Fuku
i
Fuku
oka
Wak
ayam
a
Toku
shim
a
Niig
ata
Oka
yam
a
Gif
u
Miy
agi
Hyo
go
Nag
ano
Fuku
shim
a
Iwat
e
Yam
agat
a
Oit
a
Ho
kkai
do
Ehim
e
Aki
ta
Ku
mam
oto
Ao
mo
ri
Saga
Nag
asak
i
Nar
a
Kag
osh
ima
Shim
ane
Miy
azak
i
Ko
chi
Tott
ori
Oki
naw
a
Fig. 10: GDP/Capita by Prefecture (¥1,000)
Legend:Yellow -TohokuGrey - HokkaidoMauve - Shikoku/Kyushu/Japan SeaGreen - Fukuoka

Page 9 INTELLIGENCE, INDEPENDENCE, INTEGRITY www.analogica.jp
Suicide
Residents to teacher
Source: Custom Products Research, Japan National Police Agency
Perhaps a more depressing statistic is to analyse the incidence of suicides in the prefectures. Sadly,
our worst fears are confirmed yet again. All of Tohoku is above the national average. Clearly, many
see little way out of hardship. We note the Japanese National Police Agency records that suicides
by age group show the 65yo+ age group to represent 40% of the total in 2014 up from 27% in the
early 1980s. Tohoku as we showed earlier has population rates of elderly above the national
average.
Source: Custom Products Research, Japan National Police Agency
We took a slightly more abstract way of looking at the state of prefectures using the incidence of the
number of residents per teacher. Once again, the idea that teachers would look to seek schools in
regions with a sustained future, Fig. 13. Fukuoka is once again the standout among the regional
areas by a substantial margin. Despite Kyushu possessing higher than national average 0-14yo
populations, the teacher numbers seem to be lagging growth.
1424.4
831
394.8
0
200
400
600
800
1000
1200
1400
1600
1800
Osa
ka
Fuku
oka
Aic
hi
Hyo
go
Toky
o
Ch
iba
Sait
ama
Ibar
aki
Kyo
to
Gif
u
Mie
Oka
yam
a
Shig
a
Wak
ayam
a
Toch
igi
Gu
nm
a
Ehim
e
Ko
chi
Yam
anas
hi
Kag
awa
Saga
Nar
a
Shiz
uo
ka
Kan
agaw
a
Miy
agi
Hir
osh
ima
Ho
kkai
do
Oki
naw
a
Niig
ata
Kag
awa
Yam
agu
chi
Miy
azak
i
Fuku
shim
a
Tott
ori
Ku
mam
oto
Nag
ano
Fuku
i
Ish
ikaw
a
Shim
ane
Kag
osh
ima
Toya
ma
Nag
asak
i
Oit
a
Ao
mo
ri
Yam
agat
a
Iwat
e
Aki
ta
Fig. 11: Crimes Committed per 100,000 by Prefecture (%) in 2014
Legend:Yellow -TohokuGrey - HokkaidoMauve - Shikoku/Kyushu/Japan SeaGreen - Fukuoka
30.3
28.9
26.4
26.1
24.
8
24.7
24.5
23.8
23.6
22.7
22.6
22.4
22.3
22.3
22.1
22.1
21.9
21.8
21.8
21.6
21.3
21.2
21.1
20.6
20.3
20.3
20.3
20.1
20.0
19.8
19.8
19.8
19.7
19.5
19.4
19.4
19.1
19.1
18.9
18.9
18.7
18.3
18.2
18.1
17.2
16.9
15.7
15.7
15
17
19
21
23
25
27
29
31
33
Yam
anas
hi
Iwat
e
Aki
ta
Niig
ata
Miy
azak
i
Toya
ma
Fuku
shim
a
Ko
chi
Shim
ane
Kag
osh
ima
Nag
ano
Ao
mo
ri
Miy
agi
Ehim
e
Gif
u
Yam
agat
a
Toku
shim
a
Jap
an
Toch
igi
Gu
mm
a
Fuku
oka
Ho
kkai
do
Nag
asak
i
Hyo
go
Shiz
uo
ka
Shig
a
Wak
ayam
a
Oki
naw
a
Hir
osh
ima
Toky
o
Oit
a
Saga
Tott
ori
Ch
iba
Ibar
aki
Mie
Sait
ama
Yam
agu
chi
Kyo
to
Ku
mam
oto
Aic
hi
Kag
awa
Fuku
i
Nar
a
Ish
ikaw
a
Oka
yam
a
Kan
agaw
a
Osa
ka
Fig. 12: Suicide rates by Prefecture (per 100,000) - 2014
Legend:Yellow -TohokuGrey - HokkaidoMauve - Shikoku/Kyushu/Japan SeaGreen - Fukuoka

Page 10 INTELLIGENCE, INDEPENDENCE, INTEGRITY www.analogica.jp
Teachers/ School
Change in schools
Source: Custom Products Research, Ministry of Education, Culture, Sports, Science and Technology.
Teachers per school in each prefecture paints a similar picture. Fukuoka comes up positively on this
measure. Much of Kyushu on the other hand slips below the national average. Shikoku and the
Japan Sea prefectures also feature poorly.
Source: Custom Products Research, Ministry of Education, Culture, Sports, Science and Technology
Analysing the net change in the number of middle/high schools in 2015 vs 2009 also backs up the
claim that many of the identified regions are not only bleeding teachers and students but scuttling
schools. The sixteen highest percentage school closures by prefecture in that period were in Tohoku,
Shikoku, Kyushu and Japan Sea coast towns, Fig. 15.
2823.6
2411.3
2195.9
1968.6
1848.6
1686.7
1379.3
1000.0
1200.0
1400.0
1600.0
1800.0
2000.0
2200.0
2400.0
2600.0
2800.0
3000.0K
och
iK
ago
shim
aSh
iman
eSa
gaO
kin
awa
Iwat
eM
iyaz
aki
Nag
asak
iYa
man
ash
iA
om
ori
Tott
ori
Wak
ayam
aYa
mag
ata
Oit
aFu
kush
ima
Kag
awa
Toku
shim
aA
kita
Fuku
iTo
yam
aK
um
amo
toIs
hik
awa
Nag
ano
Yam
agu
chi
Oka
yam
aM
ieEh
ime
Shig
aK
yoto
Gif
uH
okk
aid
oM
iyag
iIb
arak
iN
iigat
aG
un
ma
Nar
aH
iro
shim
aTo
chig
iSh
izu
oka
Hyo
goN
atio
nal
Ave
rage
Osa
kaFu
kuo
kaA
ich
iC
hib
aSa
itam
aTo
kyo
Kan
agaw
a
Fig. 13 - Population: Teacher ratio per prefecture (2015)
Legend:Yellow -TohokuGrey - HokkaidoMauve - Shikoku/Kyushu/Japan SeaGreen - Fukuoka
58.6
52.2
47.6
37.4
30.0
35.0
40.0
45.0
50.0
55.0
60.0
65.0
Osa
ka
Sait
ama
Oki
naw
a
Aic
hi
Kan
agaw
a
Ch
iba
Fuku
oka
Kag
awa
Mie
Shiz
uo
ka
Kyo
to
Yam
anas
hi
Miy
azak
i
Nar
a
Hyo
go
Toch
igi
Shig
a
Miy
agi
Ku
mam
oto
Ibar
aki
Nat
ion
al A
vera
ge
Saga
Gu
nm
a
Oka
yam
a
Kag
osh
ima
Wak
ayam
a
Yam
anas
hi
Fuku
i
Toky
o
Ko
chi
Toku
shim
a
Oit
a
Ish
ikaw
a
Nag
ano
Toya
ma
Ehim
e
Niig
ata
Tott
ori
Yam
agat
a
Hir
osh
ima
Nag
asak
i
Aki
ta
Ao
mo
ri
Fuku
shim
a
Iwat
e
Shim
ane
Yam
agu
chi
Ho
kkai
do
Fig.14 - Teachers per school by prefecture (2015)
Legend:Yellow -TohokuGrey - HokkaidoMauve - Shikoku/Kyushu/Japan SeaGreen - Fukuoka

Page 11 INTELLIGENCE, INDEPENDENCE, INTEGRITY www.analogica.jp
Akita seen a 22% fall in
students
I
Fiscal state of prefectures
Source: Custom Products Research, Ministry of Education, Culture, Sports, Science and Technology
If we dig one level deeper into students enrolled in middle/high school, the impacts are even worse,
Fig. 16. Akita has seen a 22% decline in high school students over the last 6 years versus the
national average of -4% and Fukuoka at -2.2%. 18 of the worst 21 prefectures once again fall into
the basket of what we have identified as depopulating zones.
Source: Custom Products Research, Ministry of Education, Culture, Sports, Science and Technology
The Statistics Bureau also posts some interesting subject matter on the fiscal state of the
prefectures. Put simply, the danger faced by state and local governments is simple. While everyone
faces a national tax levy in some form (income and/or consumption tax), local taxes are only paid if
one lives there on Dec 31st. This paints a rather disturbing picture because the worse off fiscally a
prefecture is, the higher the likelihood of crimped services thanks to higher debt burdens. However,
a resident can pull up the tent pegs and relocate to a healthier prefecture and there is nothing the
incumbent prefecture can do about it. Therefore, the future burden is exacerbated and the likelihood
of further local bankruptcies is heightened.
-17.5%
-10.5%
-4.9%
-2.3% -1.6%
-20.0%
-15.0%
-10.0%
-5.0%
0.0%
5.0%
10.0%
Yam
agat
aIw
ate
Aki
taK
ago
shim
aK
agaw
aK
um
amo
toN
agas
aki
Ish
ikaw
aH
okk
aid
oK
och
iFu
kush
ima
Ehim
eM
iyag
iA
om
ori
Saga
Shim
ane
Oki
naw
aIb
arak
iH
iro
shim
aTo
chig
iYa
mag
uch
iW
akay
ama
Gu
mm
aM
ieG
ifu
Oka
yam
aN
atio
nal
Ave
rage
Oit
aN
iigat
aYa
man
ash
iN
ara
Fuku
oka
Hyo
goM
iyaz
aki
Toya
ma
Kan
agaw
aN
agan
oK
yoto
Toky
oC
hib
aO
saka
Tott
ori
Toku
shim
aSa
itam
aSh
iga
Shiz
uo
kaA
ich
iFu
kui
Fig. 15 - % change in number of Middle/High schools (2015 vs 2009) by prefecture
Legend:Yellow -TohokuGrey - HokkaidoMauve - Shikoku/Kyushu/Japan SeaGreen - Fukuoka
-21.6%
-16.7%
-10.2%
-4.0%
-2.2%
-25.0%
-20.0%
-15.0%
-10.0%
-5.0%
0.0%
5.0%
Aki
ta
Ao
mo
ri
Fuku
shim
a
Nag
asak
i
Yam
anas
hi
Niig
ata
Wak
ayam
a
Miy
azak
i
Yam
agat
a
Kag
osh
ima
Iwat
e
Shim
ane
Ho
kkai
do
Ehim
e
Ko
chi
Fuku
i
Oit
a
Toku
shim
a
Ku
mam
oto
Yam
agu
chi
Saga
Nar
a
Nag
ano
Gu
mm
a
Tott
ori
Ibar
aki
Miy
agi
Hir
osh
ima
Mie
Gif
u
Nat
ion
al A
vera
ge
Toch
igi
Shiz
uo
ka
Toya
ma
Oki
naw
a
Ish
ikaw
a
Oka
yam
a
Hyo
go
Fuku
oka
Kyo
to
Sait
ama
Osa
ka
Toky
o
Ch
iba
Aic
hi
Kag
awa
Kan
agaw
a
Shig
a
Fig. 16: Net % change in students enrolled in High School 2015 vs 2009
Legend:Yellow -TohokuGrey - HokkaidoMauve - Shikoku/Kyushu/Japan SeaGreen - Fukuoka

Page 12 INTELLIGENCE, INDEPENDENCE, INTEGRITY www.analogica.jp
Future burden ratio
Financial strength index
Bond yields
Source: Custom Products Research, Japan Statistics Bureau, Ministry of Finance
The future burden ratio is the ratio of the debt currently held by local governments (the amount of
repayment of municipal bonds and the amount equivalent thereto) as a percentage of fiscal intake.
It is considered to be dangerous waters if it exceeds 400% in prefectural governments and 350% in
the municipalities. In FY2011, Yubari City had a future burden ratio of 891%.
Source: Custom Products Research, Japan Statistics Bureau, Ministry of Finance
The financial strength index (FSI) reflects the financial strength of local and prefectural governments.
It is derived by dividing basic financial revenue by financial spending. An FSI closer to or exceeding
one is considered healthy. Closer to zero is a poor score. Once again, the FSI by prefecture shows
the depopulating prefectures are suffering much greater than those growing. It makes sense. Higher
populations should lead to improving tax take.
Looking at the current 10-year bond yields we note that the usual suspects have seen the sharpest
rises and highest levels, Fig.19. While the Japan Local Government Bond Association (JLGBA)
333.0
247.7 241.2
187.0
49.7
0.0
50.0
100.0
150.0
200.0
250.0
300.0
350.0
Hyo
goH
okk
aid
oN
iigat
aTo
yam
aK
yoto
Fuku
oka
Hir
osh
ima
Aki
taIb
arak
iIw
ate
Yam
agat
aSh
izu
oka
Kag
osh
ima
Ish
ikaw
aYa
mag
uch
iYa
man
ash
iA
ich
iO
saka
Sait
ama
Oka
yam
aSh
iga
Gif
uK
um
amo
toK
agaw
aM
ieW
akay
ama
Toku
shim
aM
iyag
iN
atio
nal
Ave
rage
Nag
asak
iN
agan
oSh
iman
eFu
kui
Nar
aO
ita
Ch
iba
Gu
nm
aEh
ime
Ko
chi
Ao
mo
riK
anag
awa
Fuku
shim
aM
iyaz
aki
Saga
Tott
ori
Toch
igi
Oki
naw
aTo
kyo
Fig. 17: Future Burden Ratio by Prefecture (%)
Legend:Yellow -TohokuGrey - HokkaidoMauve - Shikoku/Kyushu/Japan SeaGreen - Fukuoka
0.93
0.60
0.47
0.40
0.280.23
0.00
0.10
0.20
0.30
0.40
0.50
0.60
0.70
0.80
0.90
1.00
Toky
oA
ich
i
Kan
agaw
aC
hib
aSa
itam
aO
saka
Shiz
uo
ka
Ibar
aki
Hyo
go
Fuku
oka
Toch
igi
Gu
nm
aH
iro
shim
a
Mie
Miy
agi
Kyo
toSh
iga
Gif
uO
kaya
ma
Nat
ion
al A
vera
geFu
kush
ima
Nag
ano
Ish
ikaw
a
Kag
awa
Toya
ma
Niig
ata
Yam
agu
chi
Nar
a
Ho
kkai
do
Ehim
e
Yam
anas
hi
Fuku
i
Ku
mam
oto
Oit
a
Yam
agat
aIw
ate
Ao
mo
riSa
ga
Wak
ayam
aK
ago
shim
a
Miy
azak
iN
agas
aki
Toku
shim
aO
kin
awa
Aki
taTo
tto
ri
Ko
chi
Shim
ane
Fig. 18: Financial strength index by Prefecture (%) - 2015
Legend:Yellow -TohokuGrey - HokkaidoMauve - Shikoku/Kyushu/Japan SeaGreen - Fukuoka

Page 13 INTELLIGENCE, INDEPENDENCE, INTEGRITY www.analogica.jp
Shotgun weddings
What industries employ?
Source: Custom Products Research
Switching gears to the prevalence of marriage during pregnancy or post child-birth (i.e. shotgun
weddings) our depopulating prefectures have a higher incidence. With a falling population,
businesses find it harder to justify operating there no doubt leaving residents with fewer things to do
compared to the cities.
Source: Custom Products Research, Ministry of Health, Labor & Welfare (MHLW)
This would also point to the prevalence of job opportunities in each prefecture. As two extreme
examples, we look at Akita and Aomori and look at Tokyo and Kanagawa as bellwethers. Fukuoka
is for illustrative purposes only. What sort of jobs employ in each prefecture?
-0.027
-0.295
0.619
0.559
0.260
0.184 0.175
0.059
-0.400
-0.200
0.000
0.200
0.400
0.600
0.800
Iwat
e A
kita
Ao
mo
ri Y
amag
uch
i Y
amag
ata
Oki
naw
a T
ott
ori
To
yam
a N
agan
o S
him
ane
Ho
kkai
do
Eh
ime
Osa
ka H
yogo
Kag
osh
ima
Nar
a K
um
amo
to O
ita
Fu
kush
ima
Ko
chi
Sag
a T
oku
shim
a F
uku
i N
agas
aki
Niig
ata
Sh
iga
Kag
awa
Yam
anas
hi
Ibar
aki
Oka
yam
a M
ie M
iyaz
aki
Gu
mm
a H
iro
shim
a F
uku
oka
Kan
agaw
a K
yoto
Ch
iba
Sh
izu
oka
To
chig
i S
aita
ma
Gif
u M
iyag
i W
akay
ama
Aic
hi
Ish
ikaw
a T
oky
oJa
pan
Fig.19: 10yr current bond yields by prefecure (%) vs 6m prior yields
Generic 10yr Yield - July 2016 Generic 10yr Yield - Jan 2017
Legend:Yellow -TohokuGrey - HokkaidoMauve - Shikoku/Kyushu/Japan SeaGreen - Fukuoka
42.4
37.
5
36.
736
.2
36.0
34.6
33
.5
33.0
32.9
32.
6
31
.4
31.2
30.6
30.2
30.1
29
.9
29.8
29.
4
29.
4
29.2
27.9
27.7
27.7
27.7
27.
6
27.4
27.3
26.
92
6.7
26
.6
26
.6
26.2
25
.3
25.2
24
.92
4.8
24.
3
24.0
22.9
22
.82
2.8
22.6
22.5
21.8
21.
7
21.6
19.5
19.5
15.0
20.0
25.0
30.0
35.0
40.0
45.0
50.0
Oki
naw
a
Saga
Fuku
shim
a
Ao
mo
ri
Ku
mam
oto
Nag
asak
i
Miy
azak
i
Aki
ta
Iwat
e
Yam
agat
a
Ibar
aki
Kag
osh
ima
Oit
a
Shim
ane
Ko
chi
Tott
ori
Fuku
oka
Miy
agi
Wak
ayam
a
Ehim
e
Fuku
i
Ho
kkai
do
Gu
nm
a
Niig
ata
Oka
yam
a
Toch
igi
Yam
agu
chi
Toku
shim
a
Mie
Ish
ikaw
a
Yam
anas
hi
Shiz
uo
ka
Nat
ion
al A
vera
ge
Kag
awa
Hir
osh
ima
Gif
u
Nag
ano
Osa
ka
Toya
ma
Sait
ama
Ch
iba
Nar
a
Hyo
go
Aic
hi
Shig
a
Kyo
to
Toky
o
Kan
agaw
a
Fig. 20: % of Marriages as a result of unplanned pregnancy (shotgun wedding) - 2009
Legend:Yellow -TohokuGrey - HokkaidoMauve - Shikoku/Kyushu/Japan SeaGreen - Fukuoka

Page 14 INTELLIGENCE, INDEPENDENCE, INTEGRITY www.analogica.jp
Akita skewed unsustainably
Source: Custom Products Research, Ministry of Health, Labor & Welfare (MHLW)
It is evident that Akita has too large a percentage of its populace in agriculture and with over one
quarter of workers in construction and manufacturing, the risk of depopulation should mean that
building projects (especially private sector) and manufacturing sustainability would be poor. Visits
several years back to companies such as Takeuchi (6432) and Hokuto (1379) in Nagano Pref have
highlighted the risks of losing employees and escalating wages to keep them. In Takeuchi’s case
line workers needed to have special qualifications to move its digging equipment which meant that
they had to hike wages double digit percentages to keep workers from moving out of Nagano. On
top of that it was actively hiring foreign labourers to address the looming shortfall. Akita will
undoubtedly face more acute problems.
Ag/Fishery MiningConstructi
onManufact
uringUtilities IT/Comm Transport
Wholesale/Retail
Financial/Insurance
RealEstate
ScienceRelated
Hotel/Bar/restaurant
DailyServices
EducationHealth/W
elfareCompound Services
Other
Aomori 1.63% 0.12% 10.34% 12.72% 0.42% 1.25% 6.16% 22.86% 2.98% 1.81% 2.19% 8.55% 5.37% 2.39% 13.52% 0.82% 7.16%
Akita 1.62% 0.12% 10.26% 16.95% 0.41% 0.93% 5.01% 21.24% 2.86% 1.41% 1.89% 8.35% 4.53% 2.22% 14.08% 1.22% 6.68%
Fukuoka 0.39% 0.03% 7.26% 11.68% 0.41% 2.67% 6.53% 22.34% 2.99% 2.62% 2.53% 9.70% 4.51% 3.31% 13.79% 0.46% 8.78%
Japan 0.64% 0.04% 6.94% 16.56% 0.36% 2.91% 5.91% 21.04% 2.85% 2.64% 2.98% 9.71% 4.56% 3.08% 11.07% 0.61% 8.10%
Kanagawa 0.19% 0.01% 6.41% 14.45% 0.25% 3.35% 6.17% 19.61% 2.05% 3.26% 4.54% 10.41% 4.84% 3.56% 12.04% 0.42% 8.42%
Tokyo 0.04% 0.01% 5.41% 8.17% 0.36% 9.09% 5.41% 22.18% 4.78% 3.97% 4.88% 9.84% 4.04% 3.72% 7.45% 0.23% 10.41%
0.00%
5.00%
10.00%
15.00%
20.00%
25.00%
Fig. 21: Employment sectors by prefecture as % of total (2012)
Aomori Akita Fukuoka Japan Kanagawa Tokyo
2.67%
0.64%
0.39%
0.06%
0.00%
0.50%
1.00%
1.50%
2.00%
2.50%
3.00%
Miy
azak
i
Iwat
e
Kag
osh
ima
Ho
kkai
do
Sh
iman
e
Ko
chi
Oit
a
Ao
mo
ri
Aki
ta
Niig
ata
Nag
ano
To
tto
ri
Nag
asak
i
Ku
mam
oto
Eh
ime
To
kush
ima
To
yam
a
Yam
agat
a
Sag
a
Yam
agu
chi
Kag
awa
Fu
kui
Ibar
aki
Fu
kush
ima
Mie
Gif
u
Ish
ikaw
a
Gu
mm
a
Hir
osh
ima
Wak
ayam
a
Miy
agi
To
chig
i
Sh
iga
Yam
anas
hi
Jap
an
Oka
yam
a
Oki
naw
a
Ch
iba
Sh
izu
oka
Fu
kuo
ka
Kyo
to
Hyo
go
Nar
a
Aic
hi
Sai
tam
a
Kan
agaw
a
Osa
ka
To
kyo
Fig. 22: Agriculture/Fisheries - Employment as a % of total by prefecture (2012)
Legend:Yellow -TohokuGrey - HokkaidoMauve - Shikoku/Kyushu/Japan SeaGreen - Fukuoka

Page 15 INTELLIGENCE, INDEPENDENCE, INTEGRITY www.analogica.jp
German reunification
Source: MHLW
It also brings to light the subject of the reunification of Germany in 1989. Workers in the former East
saw the employment opportunities in the West were far more lucrative and abandoned on masse
leading to large employment shortages and rising bankruptcies in the former communist bloc. The
situation became so acute that businesses in the East were forced to raise wages significantly to
stem the flow. Unfortunately, they were left with lower skilled workers and today unemployment rates
are much higher than the average because of the brain drain to the West.
While Japan faces this challenging demographic the plight of bankruptcy of towns from depopulation
will be exacerbated, Fig. 25.
10.34%
9.20%
7.26%6.94%
5.10%
4.00%
5.00%
6.00%
7.00%
8.00%
9.00%
10.00%
11.00%
Ao
mo
ri S
him
ane
Aki
ta N
iigat
a Iw
ate
Miy
agi
Fu
kush
ima
Yam
agat
a F
uku
i H
okk
aid
o O
ita
Yam
agu
chi
Ko
chi
To
yam
a T
ott
ori
Kag
osh
ima
Miy
azak
i S
aga
Ibar
aki
Nag
asak
i O
kin
awa
Wak
ayam
a N
agan
o Y
aman
ash
i E
him
e Is
hik
awa
Oka
yam
a K
um
amo
to C
hib
a T
oku
shim
a K
agaw
a F
uku
oka
Gif
u T
och
igi
Sai
tam
aJa
pan
Gu
mm
a H
iro
shim
a S
hiz
uo
ka K
anag
awa
Mie
Aic
hi
Sh
iga
Osa
ka H
yogo
To
kyo
Nar
a K
yoto
Fig.23: Construction - Employment as a % of total by prefecture (2012)
Legend:Yellow -TohokuGrey - HokkaidoMauve - Shikoku/Kyushu/Japan SeaGreen - Fukuoka
13.79%
9.71% 9.70%
8.24%
7.00%
8.00%
9.00%
10.00%
11.00%
12.00%
13.00%
14.00%
15.00%
Oki
naw
a Y
aman
ash
i K
yoto
Ko
chi
Ch
iba
Hyo
go N
ara
Nag
ano
Nag
asak
i K
anag
awa
Ish
ikaw
a H
okk
aid
o T
ott
ori
Miy
azak
i O
ita
Osa
ka G
ifu
To
kyo
Wak
ayam
a K
ago
shim
aJa
pan
Fu
kuo
ka K
um
amo
to A
ich
i S
hiz
uo
ka S
aita
ma
Mie
To
kush
ima
Sag
a T
och
igi
Eh
ime
Yam
agu
chi
Fu
kui
Sh
iga
Niig
ata
Kag
awa
Miy
agi
Sh
iman
e Y
amag
ata
Fu
kush
ima
Ao
mo
ri G
um
ma
Hir
osh
ima
Aki
ta Iw
ate
Oka
yam
a Ib
arak
i T
oya
ma
Fig.24: Hotel/Bar/Restaurant - Employment as a % of total by prefecture (2012)
Legend:Yellow -TohokuGrey - HokkaidoMauve - Shikoku/Kyushu/Japan SeaGreen - Fukuoka

Page 16 INTELLIGENCE, INDEPENDENCE, INTEGRITY www.analogica.jp
Source: Custom Products Research, Japan Statistics Bureau, Ministry of Finance
126,193
91,933
42,860
27.5%
41.3%
25%
27%
29%
31%
33%
35%
37%
39%
41%
43%
30,000
50,000
70,000
90,000
110,000
130,000
150,000
2016
2017
2018
2019
2020
2021
2022
2023
2024
2025
2026
2027
2028
2029
2030
2031
2032
2033
2034
2035
2036
2037
2038
2039
2040
2041
2042
2043
2044
2045
2046
2047
2048
2049
2050
2051
2052
2053
2054
2055
2060
2065
2070
2075
2080
2085
2090
2095
2100
2105
2110
Fig. 25: Japan's projected population ('000s) and the % of 65yo+ demographic
Population 65yo + (%)
60.2%
49.6%
45%
47%
49%
51%
53%
55%
57%
59%
61%
0
10,000
20,000
30,000
40,000
50,000
60,000
70,000
80,000
2016
2017
2018
2019
2020
2021
2022
2023
2024
2025
2026
2027
2028
2029
2030
2031
2032
2033
2034
2035
2036
2037
2038
2039
2040
2041
2042
2043
2044
2045
2046
2047
2048
2049
2050
2051
2052
2053
2054
2055
2060
2065
2070
2075
2080
2085
2090
2095
2100
2105
2110
Fig. 26: Japan's dwindling Labour Force ('000s)
Labour Force Labour force as % of total population

Page 17 INTELLIGENCE, INDEPENDENCE, INTEGRITY www.analogica.jp
Economic plans are
unrealistic
Part-time growing
Employment agencies
Source: Japan Institute for Labour Policy & Training
Comparing Fig. 18 to Figs. 27-28 and we see why the plight of regions such as Akita and those
suffering demographic challenges will be crushed even with the government’s own optimistic ‘zero
growth’ and ‘economic revival’ scenarios. While much of these scenarios rely on productivity growth
the sad reality is that in the industrial areas Akita relies on now will see sharp declines of 10-40%
over the next 15 years. Hardly the most helpful stats to arrest further depopulation. What is worse is
that slowing activity only compounds on the downside.
Add to that the prospect of a higher incidence of part-time work and the ability for the elderly to trade
out of a terrifying retirement is worsened, meaning consumption is curtailed and pinching at the one
area that could help create jobs.
One dilemma in the data is the employment referrals by government unemployment agencies for
middle or advanced aged staff (45yo+) shows that around 25% of them end up with work in a fixed
term capacity of more than 4 months, Fig. 29. That is to say around 30,000 get placed per annum,
hardly a positive statistic. Perhaps the following statement explains part of the problem.
-40.0%
-30.0%
-20.0%
-10.0%
0.0%
10.0%
20.0%
30.0%Fig. 27: The employment outlook on the 'economic revival' scenario (%)
Economic Revival (2020) Economic Revival (2030)
-60.0%
-50.0%
-40.0%
-30.0%
-20.0%
-10.0%
0.0%
10.0%
20.0%
30.0% Fig. 28: The employment outlook on the 'zero growth' scenario (%)
Zero growth (2020) Zero growth (2030)

Page 18 INTELLIGENCE, INDEPENDENCE, INTEGRITY www.analogica.jp
Inflexible workers
The dole shop
Impact of PT vs FT
Former Jobu University Professor and economist Nobuo Ikeda commented on the problems and
shortcomings of Japan’s lifetime employment system, “Salarymen, who are typically hired right out
of school in a batch . . . will start by learning (elementary skills) on the job. These include company
specific skills learned by watching more experienced workers, like personal skills, meaning they
aren’t useful in other companies…as companies rarely hire mid-career.”
Source: Statistics Bureau
In an interview with the government employment agency, Hello Work, in January 2016 the agency
noted the dilemma of dealing with Sharp’s voluntary redundancies. Of the 820 former Sharp workers
that registered with the Nara Prefecture agency, only 261 had found alternative employ. The biggest
issue is that 80% of those are over 50 years old and many have false expectations on their ‘real
value’ expecting the next job will pay similar salaries, benefits and title. Most still have housing loans
and education expenses outstanding.
Fig. 30 bears this out even better. The long running trend of full-time work in a regular capacity has
given way to a lot more part-time (lower paying) jobs which involves less other costs like insurance,
retirement and so on. This change puts pressure on the household budget.
0.0
5.0
10.0
15.0
20.0
25.0
30.0
0
50,000
100,000
150,000
200,000
250,000
300,000
350,000
1995 1996 1997 1998 1999 2000 2001 2002 2003 2004 2005 2006 2007 2008 2009 2010 2011 2012 2013
Fig.29: Mid career introductions of unemployed persons (45yo+) and employment success ratio
Cases of Introduction Ratio of introductions where people found employment

Page 19 INTELLIGENCE, INDEPENDENCE, INTEGRITY www.analogica.jp
Women in workforce
Employment quality falling
Save on wages
Source: Statistics Bureau
Fig. 31 shows that since 2003 more women are employed part time than full time. With PM Abe
looking to encourage more women back into the workforce to offset the declining (working)
population by expanding day-care centre places, job prospects will increasingly be part time.
Source: Statistics Bureau
What we can deduce is that the quality of employment is deteriorating. While the employment rate
in the recent decade has fallen contrary to1997-2003, the instance of lower paid part-time work has
grown since then from 30% to 37.4% of the total. For women, this is now 56%. If PM Abe wishes to
grow the economy, higher numbers of part-time workers will make the journey that much harder.
PM Abe has acknowledged that issue. This coming May he wishes to introduce a policy which
requires equal wages for full-time and contract hires. However, recruitment by firms will only be
marginalised should the law be introduced.
The Japanese Institute for Labour Policy & Training (JILPT) makes the case for employer’s reasons
to hire non-regular employees clear in Fig. 32. “To economise on wages” and “to economise on non-
labour costs” are the two highest categories.
0.0%
10.0%
20.0%
30.0%
40.0%
50.0%
60.0%
70.0%
80.0%
90.0%
Fig. 30: Full-time vs. Part-Time Trend as a % of total employees in Japan (%)
0
200
400
600
800
1000
1200
1400
1600
Fig. 31 : Full time vs Part-time Female Employees ('000 people)
Women Regular Employees Women Non-regular employees

Page 20 INTELLIGENCE, INDEPENDENCE, INTEGRITY www.analogica.jp
Lack of Opportunities
Why females work part time
Fig. 32: Employer’s Reasons for Hiring non-regular employees (%)
Source: Japan Institute for Labour Policy & Training
While convenient work hours are a high factor for part-time workers note that “lack of regular
employment opportunities” is the most consistently high factor for male employees selecting non-
regular jobs, Fig. 33.
Fig. 33: Male Employee’s Reasons for selecting non-regular employment (%)
Source: Japan Institute for Labour Policy & Training
Female non-regular employees showed similar trends to that of men with regards to being unable
to secure regular employment, but “domestic reasons” (38%) was a high factor however 47% said
that “supplementing household income” was second to convenience in work hours (50.7%). In short
the labour market is preventing stable employment which adds to individual concerns.
It is the smell of fear. Pressure to prevent losing one’s job is a factor in the steady increase in labour
disputes. Between 2002 and 2013, labour disputes almost trebled, Fig.34. Bullying and harassment
Page 21 INTELLIGENCE, INDEPENDENCE, INTEGRITY www.analogica.jp
Lessons from Detroit
Poverty
Cut in services
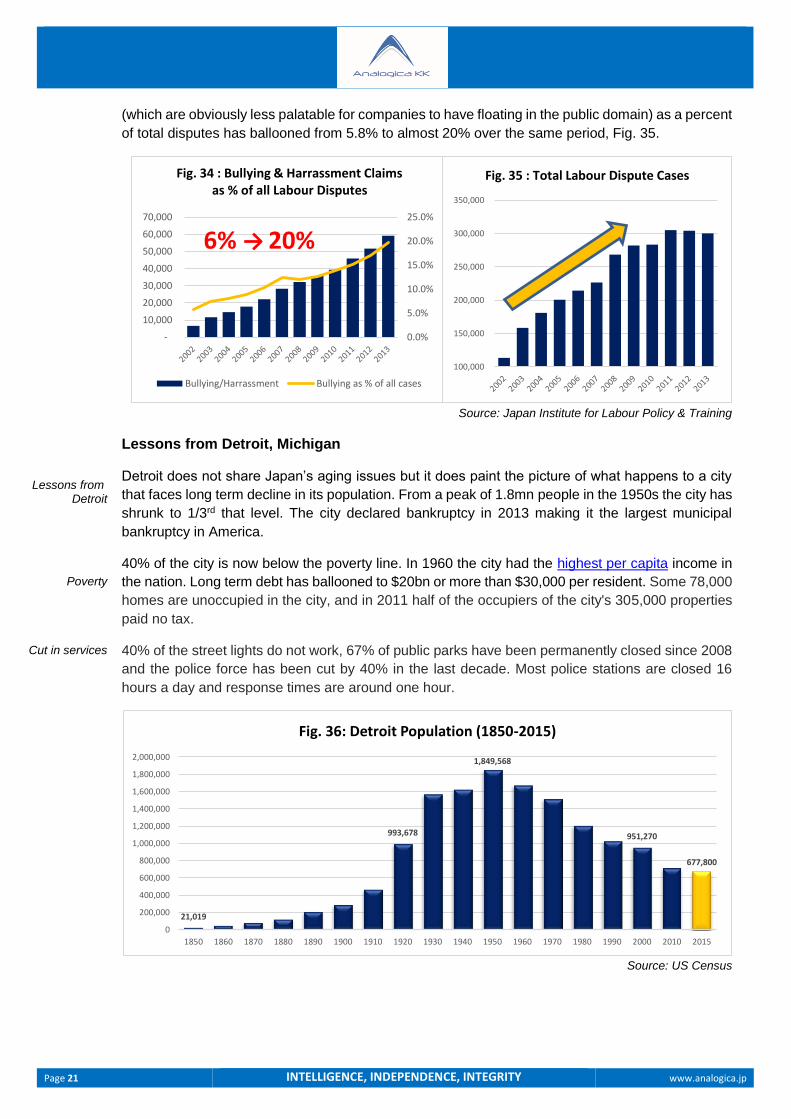
(which are obviously less palatable for companies to have floating in the public domain) as a percent
of total disputes has ballooned from 5.8% to almost 20% over the same period, Fig. 35.
Source: Japan Institute for Labour Policy & Training
Lessons from Detroit, Michigan
Detroit does not share Japan’s aging issues but it does paint the picture of what happens to a city
that faces long term decline in its population. From a peak of 1.8mn people in the 1950s the city has
shrunk to 1/3rd that level. The city declared bankruptcy in 2013 making it the largest municipal
bankruptcy in America.
40% of the city is now below the poverty line. In 1960 the city had the highest per capita income in
the nation. Long term debt has ballooned to $20bn or more than $30,000 per resident. Some 78,000
homes are unoccupied in the city, and in 2011 half of the occupiers of the city's 305,000 properties
paid no tax.
40% of the street lights do not work, 67% of public parks have been permanently closed since 2008
and the police force has been cut by 40% in the last decade. Most police stations are closed 16
hours a day and response times are around one hour.
Source: US Census
0.0%
5.0%
10.0%
15.0%
20.0%
25.0%
-
10,000
20,000
30,000
40,000
50,000
60,000
70,000
Fig. 34 : Bullying & Harrassment Claims as % of all Labour Disputes
Bullying/Harrassment Bullying as % of all cases
6% → 20%
100,000
150,000
200,000
250,000
300,000
350,000
Fig. 35 : Total Labour Dispute Cases
21,019
993,678
1,849,568
951,270
677,800
0
200,000
400,000
600,000
800,000
1,000,000
1,200,000
1,400,000
1,600,000
1,800,000
2,000,000
1850 1860 1870 1880 1890 1900 1910 1920 1930 1940 1950 1960 1970 1980 1990 2000 2010 2015
Fig. 36: Detroit Population (1850-2015)

Page 22 INTELLIGENCE, INDEPENDENCE, INTEGRITY www.analogica.jp
America’s population is still
growing
Debt: GDP
Interest payments
While Japanese prefectures maybe depopulating a la Detroit, they lack the ability to recover even if
incentives are implemented as the American population continues to grow in numbers while Japan
shrinks. Detroit has shrunk 30% in the last 15 years. In Fig. 37, we note the number of towns that
have less than 5,000 people. Nara is home to 5 villages that have fallen 20% in the last 5 years.
While the scale is different, the rate of decline hits a certain point and heads into freefall most likely
as supermarkets, post offices, banks and petrol stations can’t justify serving such tiny markets.
Source: Custom Products Research, Japan Statistics Bureau
Is it really that bad?
Of course, it is easy to postulate that the plight of the regions is bleak. However, looking at pure
prefectural debt/GDP ratios it is not awful optically.
Source: Custom Products Research, Japan Statistics Bureau
Shimane has a prefectural debt: GDP ratio of 60%. It pays 16% of its tax intake on interest payments.
This is not the highest in Japan by any stretch but bond markets are fickle things. Sure, the Bank of
Japan can increase prefectural bond purchases to prevent the rate from going higher but the exodus
is not slowing. Shimane has lost 10% of its middle/high school pupils in the past 5 years. While some
85
28
16 15 13 128 8 8 7 7 6 6 5 5 5 5 4 4 4 4 4 3 3 3 2 2 2 2 2 1 1 1 1 1 1
0
10
20
30
40
50
60
70
80
90
Ho
kkai
do
Nag
ano
Oki
naw
a
Ko
chi
Nar
a
Fuku
shim
a
Ku
mam
oto
Ao
mo
ri
Toky
o
Gu
nm
a
Yam
anas
hi
Oka
yam
a
Wak
ayam
a
Miy
azak
i
Kag
osh
ima
Aki
ta
Niig
ata
Gif
u
Kyo
to
Shim
ane
Tott
ori
Toku
shim
a
Aic
hi
Iwat
e
Yam
agu
chi
Kag
awa
Yam
agat
a
Oit
a
Fuku
i
Fuku
oka
Ehim
e
Miy
agi
Sait
ama
Kan
agaw
a
Nag
asak
i
Toya
ma
Fig. 37: Towns in Japan with less than 5,000 people (2015) by Prefecture
60%
24%
0%
10%
20%
30%
40%
50%
60%
70%
Shim
ane
Aki
ta
Tott
ori
Ko
chi
Iwat
e
Ho
kkai
do
Toku
shim
a
Kag
osh
ima
Yam
agat
a
Yam
anas
hi
Miy
azak
i
Ao
mo
ri
Niig
ata
Fuku
i
Ish
ikaw
a
Toya
ma
Wak
ayam
a
Nag
asak
i
Oit
a
Saga
Nar
a
Ku
mam
oto
Yam
agu
chi
Kag
awa
Ehim
e
Hyo
go
Nag
ano
Fuku
shim
a
Gif
u
Oka
yam
a
Miy
agi
Mie
Hir
osh
ima
Kyo
to
Shig
a
Fuku
oka
Ibar
aki
Shiz
uo
ka
Oki
naw
a
Osa
ka
Gu
nm
a
Aic
hi
Toch
igi
Sait
ama
Ch
iba
Kan
agaw
a
Toky
o
Fig. 38: Prefectural Debt/Prefectural GDP (%) - 2014

Page 23 INTELLIGENCE, INDEPENDENCE, INTEGRITY www.analogica.jp
When it goes pear shaped
Lacking assets in Regions
How they derive tax
Future Burden Ratio
may have graduated, it would be safe to assume they are relocating to other prefectures with their
working age parent(s).
Were we to see a similar exodus from Shimane as has happened in Detroit (or Yubari for that matter)
debt/working person would grow to $33,000. Shimane’s 16% debt servicing ratio would likely head
north of 30% of annual tax revenue even when conservatively estimating refinancing rates and lower
tax revenue intake. Moreover debt: GDP would balloon because relative GDP would decline as well
putting upward pressure on effective future borrowing costs. Within the prefectures, smaller villages
and towns may head the way of Yubari and suddenly bad debt could spill over into a domino effect.
Recall Yubari’s tax collections are only one-quarter of what they were two decades ago so in the
more acutely aging areas, we could well see assumptions on a prefecture like Shimane over the
long term become unsustainable.
Therein lies the problem. The debt is not likely to change much yet the revenue side of the ledger
will continue to slide. Of course, the ¥200 trillion of prefectural/municipal debt (relatively unchanged
for a decade) pales in comparison to the national debt of ¥840 trillion. Yet many of the regions do
not possess the same level of asset creation that can reduce the net burden.
34% of tax revenues by prefectures derives from resident’s tax and 42% of municipalities fill their
coffers by fixed asset taxes, Figs. 39-40. If tax payers migrate to new prefectures they not only hit
the prefecture revenue collection (note you need to be resident on Dec 31st to have to pay residents
tax. If you move to another prefecture between Jan 1-Dec 30th the residents tax is paid to your new
place of residence. If more people look to leave depopulating regions, then the natural impact on
fixed assets will fall in lockstep.
Source: Ministry of Finance
As the JLGBA and Ministry of Finance note it is considered to be dangerous waters if the future
burden ratio (FBR) exceeds 400% in prefectural governments and 350% in the municipalities. As
we mentioned earlier, Yubari’s tax revenues fell 75% in two decades. Hokkaido would only need to
have a 20.7% fall in tax revenues to trigger the 400%.Akita would require just under 40% cut in tax
revenues.
Individual Residents Tax, 34%
Local Consumption
Tax, 18%Automobile
Tax, 10%
Others, 14%
Corporate Enterprise Tax, 18%
Corporate Residents Tax, 6%
Fig. 39: Prefectures Tax Revenue
Fixed Asset Tax, 42%
Individual Residents Tax, 34%
City Planning Tax, 6%
Others, 8%
Corporate Residents Tax, 10%
Fig. 40: Municipalities Tax Revenue

Page 24 INTELLIGENCE, INDEPENDENCE, INTEGRITY www.analogica.jp
Rescue Plan
Who pays tax?
Source: Custom Products Research, Japan Statistics Bureau, Ministry of Finance
What did Yubari do?
To be fair, Yubari became a pilot case for how to handle a bankruptcy. In the FY2009-2029 Financial
Rebuilding Plan, public officials would be cut from 269 in FY2006 to 134 in FY2009 to 103 by
FY2010. Standard salaries for public servants would be cut 30% and subsidies would be trimmed
40%. The tax rate on fixed income was lifted to 1.45% from 1.4% and municipal income tax from 6%
to 6.5%. Services such as garbage collection are separate charges. Yubari City issued a ¥32.2bn
special deficit covering bond. Yubari’s real debt repayment ratio is ranging between 80-90% of tax
revenue per year until 2026.
The bigger issue will be what might happen if a string of Yubari’s come under similar bankruptcy
proceedings.
What should Japan do?
In Japan, 97% of the income tax burden is borne by the top 47% of earners. Over two-thirds of
Japanese SMEs (corporations capitalised under ¥100mn) pay no tax. While the government has
progressively eased the corporate tax rate from north of 50% in the 1990s to just over 40% during
most of the 2000s to under 30% by 2018 companies have avoided chipping in to the national coffers.
Fig.1 shows clearly that despite corporate tax rates coming down, the impact on the number of
corporates reporting losses to the tax office remains largely unchanged.
Source: Custom Products Research
16.8%
20.7%
39.7%
55.7%
73.2%
87.6%
0.0%
10.0%
20.0%
30.0%
40.0%
50.0%
60.0%
70.0%
80.0%
90.0%
100.0%
Hyo
go
Ho
kkai
do
Niig
ata
Toya
ma
Kyo
to
Fuku
oka
Hir
osh
ima
Aki
ta
Ibar
aki
Iwat
e
Yam
agat
a
Shiz
uo
ka
Kag
osh
ima
Ish
ikaw
a
Yam
agu
chi
Yam
anas
hi
Aic
hi
Osa
ka
Sait
ama
Oka
yam
a
Shig
a
Gif
u
Ku
mam
oto
Kag
awa
Mie
Wak
ayam
a
Toku
shim
a
Miy
agi
Jap
an
Nag
asak
i
Nag
ano
Shim
ane
Fuku
i
Nar
a
Oit
a
Ch
iba
Gu
mm
a
Ko
chi
Ehim
e
Ao
mo
ri
Kan
agaw
a
Fuku
shim
a
Miy
azak
i
Saga
Tott
ori
Toch
igi
Oki
naw
a
Toky
o
Fig. 41: % fall in Prefectural Tax Revenue required to trigger 400% danger level FBR
69.6% 69.2% 69.4% 69.9%69.5% 68.8% 68.4% 67.8% 68.0%
71.1% 72.6%67.9%
37.0%
38.0%
39.0%
40.0%
41.0%
42.0%
43.0%
0.0%
10.0%
20.0%
30.0%
40.0%
50.0%
60.0%
70.0%
80.0%
1999 2000 2001 2002 2003 2004 2005 2006 2007 2008 2009 2013
Fig. 42 : Do Corporate Tax Rates really influence Corporate Behaviour?
Total # of Corporates Filing Losses (LHS) Corporate Tax Rate (%) RHS
GFC GFC

Page 25 INTELLIGENCE, INDEPENDENCE, INTEGRITY www.analogica.jp
Poland’s plan
Japan drip feeds tax cuts
Japan & Poland demographics
similar
Poland faced similar issues but in 2004 introduced sensible taxation reform which lured long term
tax avoiders/evaders from their lairs. Authorities introduced a flat business tax (19%) and its impacts
were so favourable that the government saw a 50% increase in income reported by those corporates
in higher tax brackets before the change and a 50% increase in reported income from individuals
that fell into upper income tax brackets. In 2009 income tax rates at the top were slashed from 40%
from 32% Despite this income tax receipts jumped 17%. Since 2004 tax receipts soared 56.4%. It
clearly proved that lowering taxes created much higher tax compliance. There was a psychological
factor at play – the cut ‘encouraged’ honesty.
Japan on the other hand continues to drip feed corporate tax cuts at such slow rates that there is
little perceivable reason to change behaviour. Instead of burying the dwindling number of diligent
tax payers ever more Japan must reform its tax code. We estimate a flat tax with similar outcomes
to what Poland experienced would shrink the annual budget deficit by two thirds.
Poland’s population has similar dynamics to Japan, albeit a few decades behind. Population
numbers have stagnated at around 38 million in the last decade and the Central Statistical Office of
Poland (CSOP) is forecasting by 2050 that it falls to around 34 million. Poland’s 65+ year old
demographic will be one-third the total population versus 2/5ths in Japan by 2050.
Source: Central Statistical Office of Poland (CSOP), Statistics Bureau
14.99% 13.06% 12.14%
70.27%63.69%
55.17%
14.73%23.25%
32.69%
0%
20%
40%
60%
80%
100%
2013 2030 2050
Fig. 43: Polish population by age cohort
0-14 15-64 65+
31,000,000
32,000,000
33,000,000
34,000,000
35,000,000
36,000,000
37,000,000
38,000,000
39,000,00020
14
2016
2018
2020
2022
2024
2026
2028
2030
2032
2034
2036
2038
2040
2042
2044
2046
2048
2050
Fig. 44: Polish Population to 2050
12.5% 10.3% 9.7%
60.7%58.1%
51.5%
26.8% 31.6%38.8%
0%
10%
20%
30%
40%
50%
60%
70%
80%
90%
100%
2015 2030 2050
Fig. 45: Japanese population by age cohort
0-14 15-64 65+80,000,000
85,000,000
90,000,000
95,000,000
100,000,000
105,000,000
110,000,000
115,000,000
120,000,000
125,000,000
130,000,000
2015
2017
2019
2021
2023
2025
2027
2029
2031
2033
2035
2037
2039
2041
2043
2045
2047
2049
Fig. 46: Japanese Population by 2050

Page 26 INTELLIGENCE, INDEPENDENCE, INTEGRITY www.analogica.jp
Tax payer
pool shrinking
Consumers lack confidence
Benefits of tax cuts
Impacts
Personal income tax
Naturally Japan’s income tax payer pool is shrinking as the working population declines. None-the-
less if Japanese authorities stick to orthodox tax policies and try to squeeze more revenue from
wherever it can by raising taxes it will only discourage growth and stagnate the economy further.
Put simply Japan must put its fortunes into the hands of its citizens. Note I did not say ‘back’ in the
hands. The government has rarely extended the private sector a free hand but the statistics speak
for themselves. Fewer Japanese are paying income tax and even fewer corporates are even
bothering to report profit so they are not stupid. The government must come to the conclusion that
lowering tax rates considerably will be the only antidote.
If taxes came into line with Singapore or Hong Kong it would make Japan a far more desirable place
for multinationals to establish headquarters in the region. This would kill three birds. It would
stimulate much needed skilled foreign migration, drive property market transactions and provide
employment which all leads to more tax dollars. As capital attracts capital were Japan to reform in
such a major way, Japan’s equity markets would react to this new-found sense of purpose.
While we can applaud the direction of corporate tax in Japan, effective tax rates when a company
adds local taxes, municipal taxes, prefectural taxes, enterprise taxes becomes closer to 40%, Fig. 6
more than double its Asian rivals. Proposals to trim large sized national corporate tax rates from
25.5% to 23.9% have been agreed. SMEs earning less than ¥8mn are subject to a 19% tax rate but
will stay at 15% until April 1st, 2017. We don’t wish to trawl into the intricacies of local tax law but
Japan needs a change that “jolts” people and corporations to action which is not a one-way street.
We run through the psychology of taxes in a later section.
Fig. 47 : Tax burden on corporate income in Japan (2014)
Source: National Tax Agency(NTA)
For Personal Income Tax (PIT) in Japan, rates are effectively 50% in the top bracket when local
taxes and the 2.1% special income tax for reconstruction (i.e. to pay for the 2011 Great East Japan
Disaster) which ends in 2037 are added on top. None-the-less Japan’s income tax burden is being
increasingly borne by the wealthy. In 2012, half of total earners paid no direct tax, Fig. 48.

Page 27 INTELLIGENCE, INDEPENDENCE, INTEGRITY www.analogica.jp
Tax take
Source: Japanese Ministry of Finance
Mind the Gap - Japanese tax collection as it stands
Japan’s national deficit struggles to close. Expenditures, post the bubble period have comfortably
exceeded tax revenue, Fig. 49.
Source: Ministry of Finance (MoF)
In 2015, the consumption tax comprised the largest component of filling the Japanese government
coffers. Personal income tax has also declined from a peak of 40% toward 30% of the total tax take.
In 2015 corporations made up around 20% of total tax take. While higher than it was in 2009, it is
still well below the peak of 2008 (38%), Fig. 48. Corporate taxes are below the level of 2001.
Share of Tax (1974) Share of Tax (1988) Share of Tax (2012)Share of Income
(1974)Share of Income
(1988)Share of Income
(2012)
Top 0.7% 20.5% 26.40% 29.18% 17.4% 15.19% 15.58%
Top 6.3% 58.5% 57.21% 65.74% 42.9% 33.67% 38.19%
Top 8.8% 64.2% 72.72% 73.00% 47.2% 45.57% 44.37%
Top 27.6% 86.1% 89.87% 92.99% 69.0% 68.85% 70.53%
Top 47.1% 89.8% 95.26% 97.14% 74.5% 82.21% 83.91%
Bottom 52.9% 10.2% 4.7% 2.86% 25.5% 17.8% 16.09%
0.0%
20.0%
40.0%
60.0%
80.0%
100.0%
120.0%
Fig 48: Japanese Share of Taxes & Income by Tax filings (Individuals)
Top 0.7% Top 6.3% Top 8.8% Top 27.6% Top 47.1% Bottom 52.9%
01 02 03 04 05 06 07 08 09 10 11 12 13 14 15
Corporate Tax 11.8 11.2 9.1 9.4 10.2 13.1 16.4 16.7 10.6 6.0 7.8 8.8 8.7 10.0 11.0
Personal Income Tax 18.6 15.8 13.8 13.8 13.2 12.8 16.5 16.3 15.6 12.6 13.5 13.5 13.9 14.8 16.4
Consumption Tax 9.8 9.5 9.7 10 10.6 10.5 10.3 10 9.8 10 10.2 10.4 10.6 15.3 17.1
Total Expenditures 84.8 83.7 82.4 84.9 85.5 81.4 81.8 84.7 101 95.3 100.7 97.1 100.2 95.9 96.3
Tax Revenue 47.9 43.8 43.3 45.6 49.1 49.1 51 44.3 38.7 41.5 42 42.3 43.1 50 54.5
0
20
40
60
80
100
120Fig 49: Japan Tax Revenue by type & Expenditure (¥ trillion)
MIND THE GAP
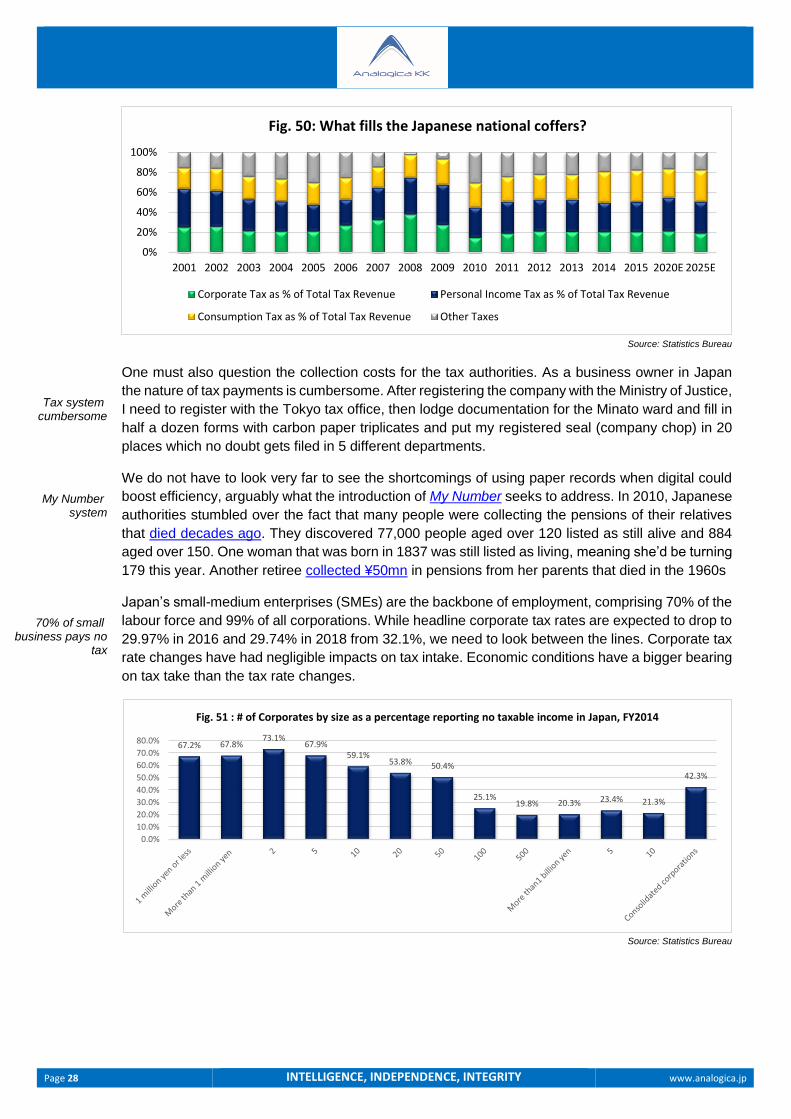
Page 28 INTELLIGENCE, INDEPENDENCE, INTEGRITY www.analogica.jp
Tax system cumbersome
My Number system
70% of small business pays no
tax
Source: Statistics Bureau
One must also question the collection costs for the tax authorities. As a business owner in Japan
the nature of tax payments is cumbersome. After registering the company with the Ministry of Justice,
I need to register with the Tokyo tax office, then lodge documentation for the Minato ward and fill in
half a dozen forms with carbon paper triplicates and put my registered seal (company chop) in 20
places which no doubt gets filed in 5 different departments.
We do not have to look very far to see the shortcomings of using paper records when digital could
boost efficiency, arguably what the introduction of My Number seeks to address. In 2010, Japanese
authorities stumbled over the fact that many people were collecting the pensions of their relatives
that died decades ago. They discovered 77,000 people aged over 120 listed as still alive and 884
aged over 150. One woman that was born in 1837 was still listed as living, meaning she’d be turning
179 this year. Another retiree collected ¥50mn in pensions from her parents that died in the 1960s
Japan’s small-medium enterprises (SMEs) are the backbone of employment, comprising 70% of the
labour force and 99% of all corporations. While headline corporate tax rates are expected to drop to
29.97% in 2016 and 29.74% in 2018 from 32.1%, we need to look between the lines. Corporate tax
rate changes have had negligible impacts on tax intake. Economic conditions have a bigger bearing
on tax take than the tax rate changes.
Source: Statistics Bureau
0%
20%
40%
60%
80%
100%
2001 2002 2003 2004 2005 2006 2007 2008 2009 2010 2011 2012 2013 2014 2015 2020E 2025E
Fig. 50: What fills the Japanese national coffers?
Corporate Tax as % of Total Tax Revenue Personal Income Tax as % of Total Tax Revenue
Consumption Tax as % of Total Tax Revenue Other Taxes
67.2% 67.8%73.1%
67.9%59.1%
53.8% 50.4%
25.1%19.8% 20.3% 23.4% 21.3%
42.3%
0.0%
10.0%
20.0%
30.0%
40.0%
50.0%
60.0%
70.0%
80.0%
Fig. 51 : # of Corporates by size as a percentage reporting no taxable income in Japan, FY2014

Page 29 INTELLIGENCE, INDEPENDENCE, INTEGRITY www.analogica.jp
Tax loss carry
forwards
Tax burden skewed
Tax losses could be carried forward 9 years and offset up to 80% of each year’s taxable income. To
slow down companies using this method, tax authorities have reduced this to 65% for fiscal years
between April 1st, 2015 and March 31st 2017 and 50% thereafter.
Source: Statistics Bureau (FY2014)
Fig.51 shows that 98% of companies in Japan pay only 24% of the corporate tax intake. That’s right
– 2.5mn corporations pay less than one-quarter of the tax burden.
Breaking this down by industry we can see clearly (Fig. 53) that the tax burden is shared pretty
unevenly. Consolidated corporations make up 0.1% of all companies in Japan yet paid 12.8% of the
tax burden in FY2014. The construction industry made up almost 16% of corporations by number
but only paid 5.3% in tax. Of course this is skewed by the revenue base of each industry, Fig. 55.
Source: Statistics Bureau
1 millionyen or
less
Morethan 1million
yen
2 5 10 20 50 100 500
Morethan1billion
yen
5 10Consolcorps
Taxes paid by corporates as % of total 1.1% 0.1% 3.3% 7.7% 3.4% 8.4% 7.8% 9.7% 3.9% 9.0% 5.5% 27.2% 12.8%
% Corporations 9.29% 1.70% 45.54% 28.95% 5.96% 5.84% 1.84% 0.56% 0.07% 0.12% 0.03% 0.04% 0.05%
0.0%5.0%
10.0%15.0%20.0%25.0%30.0%35.0%40.0%45.0%50.0%
Fig. 52: % of corporates by size paying tax & their tax burden as % of total
0.0% 5.0% 10.0% 15.0% 20.0% 25.0% 30.0%
Consolidated corporations
Mining
Textile manufacturing
Agriculture, forestry and fisheries
Chemical manufacturing
Printing and publishing
Food manufacturing
Finance and insurance
Iron, steel and metal manufacturing
Machinery manufacturing
Transport, communication and public utilities
Other manufacturing
Drinking and eating places, hotels
Wholesale trade
Real estate
Retail trade
Construction
Service
Fig. 53 : % of Corporate Tax paid by industry
% of Corporations Taxes paid by corporates

Page 30 INTELLIGENCE, INDEPENDENCE, INTEGRITY www.analogica.jp
F&B tax dodge
Consolidated tax
Broken down by the type of industry we can see that 80% of restaurants, bars and hotels report no
tax payment. While running, successful restaurants poses a challenge one could argue that high
levels of cash transactions would potentially lead to grey economic practices.
Source: Statistics Bureau
Fig. 54 shows the average revenue base of companies by industry in millions of yen. Consolidated
corporations are naturally much larger businesses compared to mom & pop real estate agencies,
restauranteurs, or farmers.
Source: Statistics Bureau
Of interest, Fig. 56, of the few corporates that actually pay tax, average tax rates are skewed.
Perhaps mining companies wrote off more tax losses from previous years or had more aggressive
42.3%
64.1%
65.4%
65.8%
65.9%
66.0%
66.2%
66.2%
66.4%
68.6%
68.6%
71.3%
73.4%
73.7%
74.3%
78.5%
79.0%
79.5%
0.0% 10.0% 20.0% 30.0% 40.0% 50.0% 60.0% 70.0% 80.0% 90.0%
Consolidated corporations
Real estate
Finance and insurance
Service
Construction
Chemical manufacturing
Transport, communication and public utilities
Wholesale trade
Mining
Iron, steel and metal manufacturing
Machinery manufacturing
Agriculture, forestry and fisheries
Other manufacturing
Retail trade
Food manufacturing
Printing and publishing
Textile manufacturing
Drinking and eating places, hotels
Fig. 54 : % of Corporates reporting losses by industry
129.8
178.8
213.5
246.4
256.0
378.3
433.2
435.7
445.4
647.3
848.5
1,003.4
1,007.8
1,048.9
1,645.9
1,682.7
1,703.8
236,375.0
- 50,000.0 100,000.0 150,000.0 200,000.0 250,000.0
Real estate
Drinking and eating places, hotels
Agriculture, forestry and fisheries
Construction
Service
Other manufacturing
Printing and publishing
Retail trade
Textile manufacturing
Iron, steel and metal manufacturing
Food manufacturing
Transport, communication and public utilities
Wholesale trade
Machinery manufacturing
Mining
Finance and insurance
Chemical manufacturing
Consolidated corporations
Fig. 55: Average Revenue (¥mn)/# of corporates

Page 31 INTELLIGENCE, INDEPENDENCE, INTEGRITY www.analogica.jp
Poland tax jolt
write off cycles for fixed assets. Old economy style industrials tend to dominate the lower tax
brackets.
Source: Statistics Bureau
What is clear is that current tax policy is having little effect on behaviour. 70% paying no tax over
many decades despite the drip feed cuts requires more heavy handed responses.
The Polish experience with Flat Tax – this is how a ‘jolt’ works
Poland had long been suffering from a lack of tax receipts no thanks to high levels of corporate and
personal income tax rates which pushed more money into the ‘grey economy’. Poland took the bold
step by surmising if they cut tax rates by a large enough amount (cut to a flat rate of 19% from the
progressive 19%, 30% & 40% brackets) businesses would stop bothering to go out of their way to
dodge the tax man, Fig. 57. The effects were profound.
Source: Ministry of Finance, Eurostat
4.7%
15.2%
18.1%
19.8%
19.8%
21.1%
21.4%
21.6%
22.1%
22.3%
22.4%
22.4%
22.4%
22.9%
23.1%
23.1%
23.3%
24.0%
0.0% 5.0% 10.0% 15.0% 20.0% 25.0% 30.0%
Mining
Consolidated corporations
Finance and insurance
Chemical manufacturing
Machinery manufacturing
Textile manufacturing
Iron, steel and metal manufacturing
Agriculture, forestry and fisheries
Construction
Printing and publishing
Food manufacturing
Real estate
Other manufacturing
Drinking and eating places, hotels
Transport, communication and public utilities
Service
Wholesale trade
Retail trade
Fig. 56: Average National Corp Tax rates (%) paid by companies by industry (2014)
20,000
30,000
40,000
50,000
60,000
70,000
80,000
90,000
1995 1996 1997 1998 1999 2000 2001 2002 2003 2004 2005 2006 2007 2008 2009 2010 2011 2012 2013 2014
Fig. 57 : Tax Collection - Polish jolt vs. Japanese halt
Polish Tax Receipts (EUR mn) Japanese Tax Receipts (JPY bn)
Poland introduces corporate flat tax reform
GFC

Page 32 INTELLIGENCE, INDEPENDENCE, INTEGRITY www.analogica.jp
Tax jumped on tax
cut
Simple is best
Personal (PIT) and Corporate income tax (CIT) receipts behaved in the following way. Since 2004,
PIT receipts jumped 69% and CIT by 45%. The lift in economic activity driven by the changes drove
consumption tax intake by over 55%. Over the same period, Japan’s PIT rose a measly 5%, CIT fell
17.2% and consumption tax receipts were flat, Fig. 58.
Source: OECD
Poland’s population faces similar long term demographic challenges as Japan does but at 50%
gross debt to GDP its economy is in a less risky position, Fig. 59.
Source: IMF
While Poland (which still uses the zloty) benefitted from EU accession since 2004, tax reforms were
a key factor in driving positive tax collections. Although progressive tax rates remained in force for
personal income tax, the Polish made provisions that allowed individuals of these businesses, at
their request, to pay a 19% flat tax which carried certain restrictions on other benefits. Poland has
also made it clear that taxpayers that do not disclose sources of revenue and income will be taxed
75%. Transparency is clear. Japan should adopt a similar system to capture a wider share.
0
5,000
10,000
15,000
20,000
25,000
30,000
35,000
40,000
45,000
0
50,000
100,000
150,000
200,000
250,000
2005 2006 2007 2008 2009 2010 2011 2012 2013
Fig. 58: Poland Tax Progression (Zloty mn)
Consumption Tax (LHS) Personal Income tax/Capital Gains
OtherTaxes Corporate Income Tax/Capital Gains
+69%
+55%
+45%
+55%
-20
0
20
40
60
80
100
120
140
1995 1996 1997 1998 1999 2000 2001 2002 2003 2004 2005 2006 2007 2008 2009 2010 2011 2012 2013 2014 2015 2016 2017 2018 2019 2020
Fig. 59: Net Debt: GDP (%) - Japan vs Poland
Poland Japan

Page 33 INTELLIGENCE, INDEPENDENCE, INTEGRITY www.analogica.jp
Unemployment rates in Poland plummeted in 2004 from around 20% to around 6.5% before the
GFC and in recent years trended back to those lows.
Source: Eurostat
Poland has a two-tier PIT with 18% up to c.US$22,000 (ZLN85,528) and 32% above it, reduced from
40% in 2009. Other taxes are as follows;
private lease (at the taxpayer’s request - 8.5 per cent tax on registered income);
dividends (19 per cent flat tax),
interest on savings (19 per cent flat tax),
gains from capital funds (19 per cent income tax);
gains from the sale of securities (19 per cent income tax);
selling private properties (as a rule, 19 per cent income tax);
awards in competitions, gambling, premium sale (10 per cent flat tax);
income of controlled foreign company (19 per cent income tax).
Poland has a 23% consumption tax which generates around 22% of total tax receipts versus Japan
at 8% and 31% respectively. Tax receipts in Japan have risen steadily since the collapse of Lehman
Brothers but expenditure far outstrips collection leaving further debt raising to fill the gap, Fig.49.
0
5
10
15
20
25
Jan
-01
May
-01
Sep
-01
Jan
-02
May
-02
Sep
-02
Jan
-03
May
-03
Sep
-03
Jan
-04
May
-04
Sep
-04
Jan
-05
May
-05
Sep
-05
Jan
-06
May
-06
Sep
-06
Jan
-07
May
-07
Sep
-07
Jan
-08
May
-08
Sep
-08
Jan
-09
May
-09
Sep
-09
Jan
-10
May
-10
Sep
-10
Jan
-11
May
-11
Sep
-11
Jan
-12
May
-12
Sep
-12
Jan
-13
May
-13
Sep
-13
Jan
-14
May
-14
Sep
-14
Jan
-15
May
-15
Sep
-15
Jan
-16
Fig 60: Polish Unemployment Rate (%)
Flat tax introduced

Page 34 INTELLIGENCE, INDEPENDENCE, INTEGRITY www.analogica.jp
Polish health contributions
Add back other taxes
If Japan copied Poland
Fig. 61: Other contributions paid by employee/employer in Poland
Source: http://www.paiz.gov.pl/polish_law/taxation/pit
So even if Poles end up paying 9.76% of their gross salary in retirement insurance or 9% in health
insurance there is a sense that there is a direct benefit rather than pouring it into a vacuous pot.
Fig. 62: National tax burden on personal income in Japan
Source: National Tax Agency(NTA)
Japan’s national income tax rates are high. The rates in Fig. 61 do not account for local taxes (c. 10-
11%) or the special tax for reconstruction (2.1%). So, a top bracket earner would pay around 50%+
income tax. Throw on property taxes, consumption tax and vehicle taxes and all of a sudden, we are
nudging 60%+
If Japan copied Poland’s example
If Japan replicated the success of Poland’s tax reforms and was able to achieve similar growth rates
in receipts, then the annual Japanese national budget deficit would more than halve to around ¥15bn

Page 35 INTELLIGENCE, INDEPENDENCE, INTEGRITY www.analogica.jp
A 19% flat tax
Listed stocks by prefecture
Source: NTA, Custom Products Research
If Japan introduced a 19% flat tax (including all other regional, local and other taxes) and corporates
reported a 50% higher income (those companies incorporated below ¥1bn) and 50% of the non-tax
paying corporates paid ¥1.5mn in tax then Japan would collect around ¥12.5 trillion yen (+¥2.4bn)
based on FY2013 tax take. If we analyse the general recurring margins of around 4.3% for the
majority of smaller companies, any efficiency uptake through competition by 1% would see this
number at around ¥15 trillion.
Prefectural Stock Performance
When we analyse stocks and performance by HQ location, we see that companies in Fukuoka
appear way down the list. In market cap terms, Toto Ltd ranks 156th in Japan. In outright performance
over 12 months the best performer Kyudenko ranks 62nd. Of course, the bulk of companies reside
in the Big Smoke but we think that the population statistics are very telling as to where future relative
growth will be experienced. Naturally many Japanese companies do not exclusively sell ‘at home’
as it were but if there was ever a more telling signal of ‘faith’ in the future Fukuoka looks to be lit up
in neon.
2001 2002 2003 2004 2005 2006 2007 2008 2009 2010 2011 2012 2013 2014 2015 2020E 2025E
Total Expenditures 84.8 83.7 82.4 84.9 85.5 81.4 81.8 84.7 101 95.3 100.7 97.1 100.2 95.9 96.3 100.0 100.0
Tax Revenue 47.9 43.8 43.3 45.6 49.1 49.1 51 44.3 38.7 41.5 42 42.3 43.1 50 54.5 83.1 85.7
0
20
40
60
80
100
120
Fig. 63: Japanese National Budget Deficit (¥trillion)

Page 36 INTELLIGENCE, INDEPENDENCE, INTEGRITY www.analogica.jp
Fig. 64; Prefectural Performance – 3~5 year returns (aggregated where companies have HQ)
Average Median Average Above 100¥bn
Mkt-cap Median Above 100¥bn
Mkt-cap
Prefecture 3-Year Return
5-Year Return
3-Year Return
5-Year Return
3-Year Return
5-Year Return
3-Year Return
5-Year Return
Aichi 37.2 146.6 24.1 112.4 46.1 183.8 32.4 140.7
Akita 36.5 69.9 36.5 69.9 na na na na
Aomori 28.2 58.6 28.2 58.6 na na na na
Chiba 40.2 135.0 25.8 70.0 50.0 165.8 54.5 188.5
Ehime 39.1 53.3 32.5 26.6 45.7 80.0 45.7 80.0
Fukui 57.2 303.1 48.9 256.2 48.9 256.2 48.9 256.2
Fukuoka 60.9 269.8 41.4 150.5 59.1 188.6 29.6 122.3
Fukushima 18.7 34.3 23.5 21.4 36.3 92.7 36.3 92.7
Gifu 48.7 197.9 30.9 121.7 48.3 209.8 43.0 104.3
Gunma 40.9 112.3 32.7 87.0 60.9 106.7 81.9 55.5
Hiroshima 23.4 109.1 28.6 75.1 23.1 137.5 33.3 148.7
Hokkaido 53.3 216.4 17.7 207.4 64.0 246.7 25.6 326.7
Hyogo 59.8 184.1 25.9 121.7 80.7 250.4 30.6 138.8
Ibaraki 38.9 57.2 38.9 57.2 39.3 40.4 39.3 40.4
Ishikawa 85.9 376.9 41.6 203.3 118.3 675.6 118.3 675.6
Iwate -7.4 39.5 -7.4 39.5 na na na na
Kagawa 34.4 101.9 25.6 122.8 11.5 62.2 8.6 47.1
Kagoshima -2.1 8.4 21.1 -21.5 25.0 131.6 25.0 131.6
Kanagawa 49.6 165.9 44.1 140.4 56.7 178.7 59.4 149.5
Kochi 83.5 166.8 83.5 166.8 na na na na
Kumamoto na na na na na na na na
Kyoto 49.3 171.4 37.3 131.8 54.9 175.2 42.0 139.3
Mie 99.6 191.4 17.3 54.4 17.3 54.4 17.3 54.4
Miyagi 38.0 70.1 20.7 72.4 20.7 83.6 20.7 83.6
Miyazaki 28.6 94.8 28.6 94.8 na na na na
Nagano 38.3 274.0 11.5 66.6 53.9 370.3 15.1 76.9
Nagasaki 49.4 77.6 49.4 77.6 na na na na
Nara 16.7 2.3 16.7 2.3 16.7 2.3 16.7 2.3
Niigata 52.2 122.3 36.5 97.5 42.5 146.7 36.7 156.7
Oita 20.5 86.9 20.5 86.9 na na na na
Okayama 40.1 98.4 36.1 91.5 3.8 23.2 3.8 23.2
Okinawa 46.7 115.2 26.6 82.6 64.4 134.2 71.3 82.6
Osaka 46.8 168.5 34.0 107.6 47.7 150.5 38.7 117.0
Saga 24.0 68.1 24.0 68.1 12.6 80.1 12.6 80.1
Saitama 44.9 141.3 25.4 117.3 87.7 154.7 81.9 132.6
Shiga 25.3 138.6 17.7 172.3 19.7 134.6 17.0 186.0
Shimane 36.1 68.5 36.1 68.5 36.1 68.5 36.1 68.5
Shizuoka 36.7 133.0 35.0 100.8 55.6 162.2 50.2 145.0
Tochigi 73.7 145.8 58.9 110.2 90.2 211.4 90.2 211.4
Tokushima 39.1 36.0 39.1 36.0 39.1 36.0 39.1 36.0
Tokyo 42.9 191.3 26.2 123.3 46.9 193.2 31.1 128.9
Tottori 199.0 493.4 199.0 493.4 na na na na
Toyama 21.9 66.0 3.6 34.5 -1.7 27.2 -3.1 30.4
Wakayama 54.8 229.7 36.8 192.2 68.2 346.9 68.2 346.9
Yamagata 15.2 27.0 15.2 27.0 na na na na
Yamaguchi 23.0 110.7 15.8 57.6 28.6 148.6 23.6 144.5
Yamanashi 21.2 96.8 24.9 77.1 21.2 96.8 24.9 77.1
Source: Custom Products Research

Page 37 INTELLIGENCE, INDEPENDENCE, INTEGRITY www.analogica.jp
Aging society
Debt service ratios
Poland seems a simple way
forward
Summary
The 10th anniversary of Yubari’s bankruptcy occurs this year. However, our studies seem to confirm
that the trend of depopulation in many of Japan’s prefectures will accelerate. Whether it be plunging
high school student numbers, an exodus of working age residents seeking longer term job security
or incompatible employment by industry trends.
Gaining access to municipal budgets and balance sheets is opaque. At a prefectural level we get
some idea of what is going on with budgets but the sharper rate of depopulation could well become
a bigger issue sooner than the considered norm.
An aging society only tips the apple cart of dependency ratios on a smaller workforce. Even the
‘economic revival’ scenario of the government points to rapid deceleration in traditional industries
putting further pressure on tax revenue collection at local, prefectural and national levels.
While the JLGBA paints a rosy picture about sustainability of debt service ratios, future burden ratios,
fiscal strength indicators and recent bond market moves show how rapidly things can change when
confidence is rattled While not anywhere near concerning levels yet, a succession of municipal
bankruptcies could well skew refinancing options. As it stands now bond markets are mildly pricing
in differences. The law of low interest rates means that any panic in bond markets could cause not
only more punitive interest payments but the slowdown in growth would make their impact on
budgets more acute. Taxing Japanese citizens more is not the answer. 70% of SME’s do not pay
tax for the very reason they are too high and complex. Poland had similar problems and they worked
out cutting corporate taxes fro 40% to 19% would free up the grey economy and the result was a
doubling of tax revenues.
Poland offers far better longer term tax solutions to Japan. Burying Japanese in higher taxes is the
wrong way. While headline rates are championed as being cut, a wealth of stealthy local and other
taxes take back what was supposed to be gained. It needs to stoke the entrepreneurial spirit because
frankly there is no other alternative and nationalising the debt via the BoJ will ultimately backfire.
The mass ETF buying by the BoJ which was supposed to push equities to levels which would
encourage Mrs Watanabe to spend her winnings in Mitsukoshi have been shoved between the
mattress. Japan’s authorities inspire very little in the way of new methods of reversing decades of
stagnation. Power has to be put back in the hands of the people as public policy has failed and will
continue to fail. Without swift action the depopulation and pressure on the prefectures will
exacerbate.
Make Japan Great Again (#MJGA)

Page 38 INTELLIGENCE, INDEPENDENCE, INTEGRITY www.analogica.jp
Important Disclosures:
This material was prepared for you and is for your information and use only. This material should only be distributed to other members of that organization on a need to know basis and should not be distributed or disseminated to any other person or entity.
This material is for information purposes only and it should not be regarded as an offer to sell or as a solicitation of an offer to buy the securities or other instruments mentioned in it. This material is based on current public information that Analogica KK ("Analogica") considers reliable, but we make no representation that it is accurate or complete, and it should not be relied on as such. No investment opinion or advice is provided, intended, or solicited. Analogica offers no warranty, either expressed or implied, regarding the veracity of data or interpretations of data included in this report. This material is provided with the understanding that Analogica is not acting in a fiduciary capacity. Opinions expressed herein reflect the opinion of Analogica and are subject to change without notice.
The products mentioned in this document may not be eligible for sale in some states or countries, and they may not be suitable for all types of investors. The value of and the income produced by products may fluctuate, so that an investor may get back less than they invested. Value and income may be adversely affected by exchange rates, interest rates, or other factors. Past performance is not necessarily indicative of future results. If a product is income producing, part of the capital invested may be used to pay that income. © 2015 Analogica KK. All rights reserved.
Tokyo 17/F Roppongi Hills North Tower 6-2-31 Roppongi, Minato-ku, Tokyo Japan 106-0032
Office Locations
Tokyo Michael Newman President & CEO Analogica KK
+81-80-4446-8200 [email protected]
Contact
Headquarters 942 Win Aoyama 2-2-15 Minamiaoyama, Minato-ku, Tokyo Japan 107-0062