makerere university - worldfish · (rastrineobola argentea) during different processing methods by...
TRANSCRIPT
MAKERERE UNIVERSITY
QUALITY ATTRIBUTES AND DRYING RATE OF SILVER CYPRINID
(RASTRINEOBOLA ARGENTEA) DURING DIFFERENT PROCESSING METHODS
By
Omagor Isaac Olila
BSc Industrial Chemistry
Reg. No. 2015/HD02/593U
SUPERVISORS
Prof. Charles Muyanja
Dr. Julia Kigozi
A THESIS SUBMITTED TO THE DIRECTORATE OF RESEARCH AND GRADUATE
TRAINING IN PARTIAL FULFILLMENT OF THE REQUIREMENTS FOR THE
AWARD OF THE DEGREE OF MASTER OF SCIENCE IN FOOD SCIENCE AND
TECHNOLOGY
May, 2018
ii
DECLARATION
I declare that, to the best of my knowledge, this research is original, and that the work contained
in this thesis has not been published and/or submitted for any other degree award to any other
university before.
OMAGOR ISAAC OLILA
Signature
Date
APPROVAL
This thesis has been submitted with the approval of the supervisors below:
Prof. Muyanja Charles
Signature
Date
Dr. Julia Kigozi
Signature
Date

iii
DEDICATION
I dedicate this work to my dad, Deo Olila and mum, Ameja Margaret.

iv
ACKNOWLEDGEMENTS
My heartfelt gratitude goes to my supervisors, Prof. Charles Muyanja, Department of Food Science
and technology and Dr. Julia Kigozi. Department of Agricultural and Biosystems Engineering for
their relentless support and technical guidance throughout the process of this research. I would
also love to appreciate my lecturers, Prof. Byaruhanga, Dr. Mukisa, Dr. Nakimbugwe, Dr. Magala-
Nyago, Prof. Kaaya, Prof. Mugisha and Prof. Nabasirye for the knowledge bestowed upon me that
was directly or indirectly applied in this research. I sincerely thank the staff of the research lab
Emmanuel Okalany, Deo Busulwa, Racheal Byarugaba, and Stellah Byakika for the support during
the lab analyses.
I am highly grateful to World Fish for funding this research through Dr. Sloans Chimatiro, the Fish
Trade Program Manager. Their resources were well utilized for the completion of this thesis.
Special thanks goes to the silver cyprinid processors and the fisheries officers in the landing sites
that were visited for their tireless cooperation during data collection and field experiments.
On the same note I would like to extend my sincere gratitude to my family Daniel, Esther, Rebekah,
Sarah, Hannah, and friends, Mary, Davis, Abubakar, Joseph, Christine, Juliet, Egide, Catherine,
Hadijah, Winifred, for their support and encouragement during the course of this research and
entire study. Thank you for your prayers and blessing. May God richly bless you.
Above all I appreciate The Almighty God, the giver and sustainer of life, strength and wisdom.
v
TABLE OF CONTENTS
DECLARATION ............................................................................................................................ ii
APPROVAL ................................................................................................................................... ii
DEDICATION ............................................................................................................................... iii
ACKNOWLEDGEMENTS ........................................................................................................... iv
LIST OF FIGURES ....................................................................................................................... ix
LIST OF ABBREVIATIONS ........................................................................................................ xi
ABSTRACT .................................................................................................................................. xii
CHAPTER ONE: INTRODUCTION ............................................................................................. 1
1.1: Background .......................................................................................................................... 1
1.2: Statement of the problem ..................................................................................................... 4
1.3: Objectives ............................................................................................................................. 5
1.4: Hypotheses ........................................................................................................................... 5
1.5: Justification of the study ...................................................................................................... 6
CHAPTER TWO: LITERATURE REVIEW ................................................................................. 7
2.1: Fish as a healthy food ........................................................................................................... 7
2.2: Contribution of fish to the reduction of prevalent hunger.................................................... 9
2.3: Silver Cyprinid ................................................................................................................... 10
2.4: Spoilage mechanisms of fish .............................................................................................. 11
2.4.1: Enzymatic spoilage ...................................................................................................... 11
2.4.2: Lipid oxidation ............................................................................................................ 12
2.4.3: Microbial spoilage ....................................................................................................... 15
2.5: Factors that speed up fish spoilage..................................................................................... 16
2.5.1: Nutrient and moisture composition of the fish ............................................................ 16
2.5.2: Temperature ................................................................................................................. 17

vi
2.5.3: Aeration ....................................................................................................................... 17
2.6: Processing and preservation ............................................................................................... 18
2.6.1: Salting .......................................................................................................................... 18
2.6.3: Drying .......................................................................................................................... 18
2.7: Drying kinetics ............................................................................................................... 19
CHAPTER THREE: METHODS AND PROCEDURE .............................................................. 21
3.1: Study area ........................................................................................................................... 21
3.2: Assessment of the processing methods employed by silver cyprinid processors along Lake
Victoria in Uganda .................................................................................................................... 22
3.3: Determination the effect of the silver cyprinid drying practices on the quality attributes and
drying rate of silver cyprinid fished from Lake Victoria in Uganda ......................................... 24
3.3.1: Proximate composition analysis .................................................................................. 24
3.3.2: Determination of lipid oxidation ................................................................................. 26
3.3.3. Microbial count and spoilage ...................................................................................... 27
3.3.4: Drying rate of fish samples .......................................................................................... 30
3.4: Evaluation of the effect of different salting concentrations and time on the quality attributes
and drying rate of silver cyprinid fished from Lake Victoria in Uganda. ................................. 31
3.4.1: Experimental design for brine experiments in the field .............................................. 32
3.5: Statistical analysis .............................................................................................................. 33
CHAPTER FOUR: RESEARCH RESULTS ............................................................................... 34
4.1: Assessment of the processing methods employed by the selected Silver Cyprinid processors
at community level on the shores of Lake Victoria in Uganda ................................................. 34
4.1.1: Drying and pretreatment methods used ....................................................................... 34
4.1.2: Challenges faced by processors and the coping mechanisms developed .................... 38
4.1.3: Final consumer of the fish ........................................................................................... 40
4.1.4: Indicators for end of drying. ........................................................................................ 41

vii
4.1.5: Critical control points and losses experienced by processors ..................................... 42
4.1.6: Drying procedure employed by the processors in the selected landing sites .............. 45
4.2: Determination of the effect of the prevalent silver cyprinid drying practices on the quality
attributes and drying rate of silver cyprinid fished from Lake Victoria in Uganda .................. 46
4.2.1: Variation in proximate changes in different sites at the end of drying of silver cyprinid
by the processors ................................................................................................................... 46
4.2.2: Variation in microbiological changes in different sites at the end of drying by the silver
cyprinid processors ................................................................................................................ 46
4.2.3: Proximate changes and extent of lipid oxidation brought about by drying method at the
end of drying by processors ................................................................................................... 48
4.2.4: Microbiological changes brought about by drying method by the end of drying by
processors .............................................................................................................................. 48
4.2.5: Quality changes brought about by pretreatment by the end of drying by the processors
............................................................................................................................................... 50
4.2.6: Drying rate of silver cyprinid fished from Lake Victoria under the prevalent drying
practices on selected landing sites along Lake Victoria in Uganda ...................................... 53
4.3: Evaluation of the effect of different salting concentrations and time on the quality attributes
and drying rate of silver cyprinid fished from Lake Victoria in Uganda .................................. 55
4.3.1: Quality changes as affected by salting time and concentration on fresh silver cyprinid
samples .................................................................................................................................. 55
4.3.2: Quality changes in silver cyprinid as affected by salting time and concentration after
drying ..................................................................................................................................... 56
4.3.3: Drying kinetics for the fish salted to 4g and 10g of salt per 100g of wet fish offshore
and onshore in Kiyindi .......................................................................................................... 58
CHAPTER 5: DISCUSSION OF RESULTS ............................................................................... 60
5.1: Assessment of the processing methods employed by the selected Silver Cyprinid processors
at community level on the shores of Lake Victoria in Uganda ................................................. 60
5.1.1: Drying techniques and pretreatment used ................................................................... 60

viii
5.1.2: Drying time and indicators of end of drying ............................................................... 61
5.1.3: Challenges faced by Silver cyprinid processors .......................................................... 61
5.1.4: Critical control points during the drying operation ..................................................... 62
5.1.5: Final consumer of the product ..................................................................................... 63
5.2: Determination of the effect of the prevalent silver cyprinid drying practices on the quality
attributes and drying rate of silver cyprinid fished from Lake Victoria in Uganda .................. 64
5.2.1: Changes in proximate composition after drying ......................................................... 64
5.2.2: Lipid oxidation changes after drying ........................................................................... 66
5.2.3: Microbial spoilage after drying ................................................................................... 67
5.3: Evaluation of the effect of different salting concentrations and time on the quality attributes
and drying rate of silver cyprinid fished from Lake Victoria in Uganda .................................. 68
5.3.1: Proximate, microbial and lipid oxidation changes in the fresh fish by the time it reaches
the shore ................................................................................................................................. 68
5.3.2: Proximate, microbial and lipid oxidation changes of silver cyprinid at the end of drying
............................................................................................................................................... 69
CHAPTER 6: CONCLUSIONS AND RECOMMENDATIONS ................................................ 71
6.1: Conclusions ........................................................................................................................ 71
6.2: Recommendations .............................................................................................................. 72
REFERENCES ............................................................................................................................. 73
APPENDIX ................................................................................................................................... 85
Appendix A: Gallery ................................................................................................................. 85
Appendix B: Regression curves showing drying rates.............................................................. 95
Appendix C: Questionnaire for processors of silver cyprinid fished from Lake Victoria in
Uganda ...................................................................................................................................... 97

ix
LIST OF FIGURES
Figure 1: Autoxidation the polyunsaturated fatty acid (Huss, 1995) ............................................ 13
Figure 2: Primary hydrolytic reactions of triglycerides and phospholipids. Enzymes: PL1 & PL2
phospholipases; TL, triglyceride lipase ........................................................................................ 14
Figure 3: Geographical location of selected landing sites along the shores of Lake Victoria ...... 22
Figure 4: A pie chart showing the different drying techniques used by artisanal fishermen in four
sites along the shores of Lake Victoria in Uganda. ...................................................................... 34
Figure 5: A graph showing the reasons as to why artisanal processors in four landing sites along
Lake Victoria in Uganda dry their fish ......................................................................................... 36
Figure 6: A graph showing reasons as to why artisanal processors in four landing sites along the
shores of Lake Victoria in Uganda chose a specific technique of drying to dry their fish ........... 37
Figure 7: A pie chart showing reasons as to why artisanal processors in four landing sites along
the shores of Lake Victoria in Uganda chose to either salt or not to salt their fish. ..................... 38
Figure 8: A graph showing the challenges faced by silver cyprinid artisanal processors in four
landing sites along the shores of Lake Victoria in Uganda .......................................................... 39
Figure 9: A graph showing the coping mechanisms to overcome challenges used by artisanal silver
cyprinid processors in four landing sites along the shores of Lake Victoria in Uganda .............. 40
Figure 10: A graph showing the reasons as to why artisanal silver cyprinid processors chose to sell
their fish for either human consumption or animal feed ............................................................... 41
Figure 11: A graph showing the indicators used by artisanal silver cyprinid processors in four
landing sites along the shores of Lake Victoria in Uganda to judge end of drying ...................... 42
Figure 12: A pie chart showing the points at which the artisanal silver cyprinid processors in four
landing sites along the shores of Lake Victoria in Uganda expected contamination ................... 43
Figure 13: A graph showing the various reasons given by the artisanal silver cyprinid processors
in four landing sites along the shores of Lake Victoria in Uganda for the losses experienced .... 44
Figure 14: A graph showing the rate of drying of salted and unsalted silver cyprinid dried in
Kiyindi .......................................................................................................................................... 54
Figure 15: A graph showing the drying rate of silver cyprinid dried in Kasekulo on two raised
racks, (RR1, and RR2) .................................................................................................................. 54
Figure 16: A graph showing the rate of drying of drying on silver cyprinid fished and salted to 4 g
and 10 g per 100 g of wet fish on shore and offshore from Kiyindi landing site Uganda. ........... 59

x
LIST OF TABLES
Table 1: A table showing the composition of fish .......................................................................... 8
Table 2: Table showing the different processing methods utilized in four landing sites visited along
the shores of Lake Victoria in Uganda ......................................................................................... 35
Table 3: Comparison of quality of fish in its fresh form and its dry form fished from Lake Victoria
and dried in four landing sites along the shores of Lake Victoria in Uganda ............................... 47
Table 4: Quality of Silver cyprinid dried by artisanal processors in four landing sites along the
shores of Lake Victoria in Uganda using the two main approaches of drying ............................. 49
Table 5: Quality of Silver cyprinid dried by artisanal processors in three landing sites without
Kasekulo along the shores of Lake Victoria in Uganda using the two main approaches of drying
....................................................................................................................................................... 50
Table 6: Quality of Silver cyprinid dried with and without salt as a pre-treatment by the silver
cyprinid artisanal processors in four landing sites along the shores of Lake Victoria in Uganda 51
Table 7: Quality of Silver cyprinid dried with and without salt as a pre-treatment by the silver
cyprinid artisanal processors in three landing sites (excluding Kasekulo) along the shores of Lake
Victoria in Uganda ........................................................................................................................ 52
Table 8: Summary of the drying kinetics of salted and unsalted silver cyprinid dried in Kasekulo
and Kiyindi.................................................................................................................................... 53
Table 9: Comparison of quality parameters of different concentrations and times of salting dried
on raised rack in Kiyindi landing site in Uganda .......................................................................... 57
Table 10: Summary of the drying kinetics of fish fished and salted to 4 g and 10 g salt per 100 g
of wet fish onshore and offshore from Kiyindi landing site, Uganda. .......................................... 58

xi
LIST OF ABBREVIATIONS
DFR: Department of Fisheries Resources
DHA: Docohexanoic Acid
DSIP: Development Strategy and Investment Plan
EPA: Eicosapentanoic acid
FAO: Food and Agriculture Organisation
FFA: Free Fatty Acids
LVEMP: Lake Victoria Environment Management Plan
MAAIF: Ministry of Agriculture, Animal Industry and Fisheries
MUFA: Monounsaturated fatty acids
PUFA: Polyunsaturated fatty acids
PV: Peroxide Value
TBARS: Thiobarbituric acid reactive substances
TMA: Tri methyl amine

xii
ABSTRACT
The handling and processing of the highly perishable silver cyprinid (Rastrineobola argentea)
could contribute towards alleviation of food insecurity by directly acting as a food resource and
through employment for income generation among vulnerable groups. Despite the many
processing techniques used, the quality and value of silver cyprinid still remains low. This research
was therefore carried out to establish the most effective combination of brining concentration,
time, and drying strategy for artisanal processing of high quality Silver cyprinid fished from Lake
Victoria in Uganda. This was done by comparing the effect of the current artisanal processing
methods on the quality attributes and the drying rate of silver cyprinid in four major landing sites
(Kiyindi, Kasekulo, Katosi, and Ssenyondo) along the shores of Lake Victoria in Uganda. The
quality attributes measured were proximate composition (moisture, fat, ash and protein content),
lipid oxidation (FFA, PV, and TBARS), microbial counts (yeasts and molds, total bacteria and
total coliforms), and microbial spoilage (TMA). The drying rate was calculated by fitting the
drying data into the Henderson and Pabis model. It was observed that drying on nets placed on the
ground (most prevalent at 41.7%) and on raised racks were the two main strategies for human
grade silver cyprinid. Salting was carried out mainly on silver cyprinid for export. Raised rack
drying gave better microbial and lipid oxidation results than nets placed on the ground. Fish from
all the sites was highly nutritious as evidenced by the high protein (52.4 ± 5.4 g/100g) and fat
content (9.7 ± 1.7 g/100g). The ash content of the fish in all the sites was lower than the standard
15 %. The average moisture content (20.5 ± 5.4 %), PV (5.2 ± 3.7 meqO2/Kg), FFA (3.3 ± 0.8
mgNaOH/g), total bacteria (7.0 ± 0.9 logcfu/g), total coliforms (3.7 ± 0.9 logcfu/g) and fungi (4.3
± 0.9 logcfu/g) were higher for all the sites than the standard values (12 %, 5 meqO2/Kg, 5
mgNaOH/g, 5 logcfu/g, undetectable, and 4 logcfu/g for each respectively). Kiyindi had better
quality silver cyprinid than all the other sites. The rate of drying of salted fish (0.228 Kg water/Kg
db, hour) was lower, under the same conditions than the rate of drying of the unsalted fish (0.251
Kg water/Kg db, hour). Salt reduced the microbial load, TMA and FFA and increased the PV and
TBARS of the silver cyprinid. Salting offshore gave better microbial results than onshore though
it led to a greater extent of lipid oxidation. A reduction in drying rate was observed with increase
in salt concentration. 4g of salt per 100g of wet fish was chosen as the optimum concentration of
salt that would effectively reduce the microbial load while not entirely compromising on the extent
of lipid peroxidation.
1
CHAPTER ONE: INTRODUCTION
1.1: Background
Silver Cyprinid (Rastrineobola Argentea) is a species of ray finned fish in the family Cyprinidae,
the only member of the genus Rastrineobola. It is found in Lake Victoria, Kyoga and the River
Nile and commonly known as mukene (Uganda), dagaa (Tanzania), omena (Kenya), ndagala
(Burundi), and sambaza (Rwanda) (East African Standard., 2014). In Lake Victoria, silver cyprinid
(Rastrineobola Argentea) is the third commercially important specie accounting for 60 % of the
total fisheries biomass and 42 % of the total fish catches in Uganda. (DFR, 2012)
The harvesting, handling, and processing of silver cyprinid (Rastrineobola Argentea) provides
livelihood for many people near the lake and could alleviate the hidden hunger among vulnerable
groups (Delgade, Wada, Rosegran, & Ahmed, 2003.; Kawarazuka & Be´ne, 2011). The fish
industry has, therefore, been identified as one of the sectors that if improved would effectively
contribute towards alleviation of food insecurity by directly contributing as a food resource and
through employment and income generation. (Owaga, Onyango, & Njoroge, 2010)
Increased consumption of silver cyprinid would lower the prevalence of undernutrition that is
partly attributed to a limited intake of animal source nutrient dense foods (Kabahenda, Amega,
Okalany, Husken, & Heck, 2011). The per capita consumption of animal source nutrient dense
food is estimated at about 12 Kg in Uganda. Though higher than the African average (10.1 Kg)
this consumption is below the world average of 38 Kg (FAO, 2018).Generally small sized fish
species become important commercial species in lakes where they occur when catches of preferred
large size table fish start to show signs of decline. They provide a cheap source of animal protein
for human and animal consumption. (Wandera, 1991).
Fish protein is highly digestible with ten essential amino acids in desirable quantities for human
consumption (Usydus, Szlinder-Richert, & Adamczyk, 2009). Fish also has vitamins A, B, D and
minerals such as calcium, iron, potassium, and iodine which are required for supplementing infant
and adult diets. The high poly unsaturated fatty acids (n-3 fatty acids, EPA and DHA) content of
fish is associated with improving health more so for the elderly. (Kabahenda et al., 2011)

2
Nevertheless fish is a highly perishable commodity and hence susceptible to high physical and
quality post-harvest losses which translate into losses in nutritional contribution of fish to the total
diet and health of the populations. Physical and quality losses of silver cyprinid alone are valued
at 1.5 – 18.9 % in Kenya, 20 – 40 % in Tanzania, and 26 – 40 % in Uganda respectively (FAO,
2008) and these have a major implication on the nutritional quality and availability of fish products
to local populations. The major factors that affect the nutritive value of fish are related to how fish
is handled, processed, preserved and stored (Ibengwe, 2010)
Due to the high levels of long chain poly unsaturated fatty acids, fish products are susceptible to
oxidation which is a common phenomenon with fish that is exposed to air. Oxidation of lipids is
associated with a decrease in triacylglycerol and phospholipids and an increase in free fatty acids
(Augood, 2008) and often results in the development of off flavors. Also because of its high protein
and moisture content, fish provides a perfect media for microbial growth leading to spoilage which
is estimated at about 10 % of fish catches worldwide hence impacts on the availability of nutrients
from fish products. Most processing methods that dehydrate fish also reduce the rate of microbial
spoilage slowing down degradation and associated nutrient loss. (Ghaly, Dave, Budge, & Brooks,
2010)
Preservation methods such as salting, blanching, drying, and smoking therefore have been
developed to increase the shelf life of fish and guarantee a sustainable supply all year round. In
general sun drying, is mostly used to process small fish such as silver cyprinid. (Masette &
Kwetegyeka, 2013). Fish is typically sundried for three to ten days but drying periods of one to
three days are common. The ideal weather is dry with low humidity and clear skies when drying
can be done in one day (Kabahenda et al., 2011).
Salting preserves fish and significantly reduces microbial growth as the salt penetrates the fish and
extracts water by osmosis thus making it inaccessible to microorganisms. However salted sundried
silver cyprinid is prone to lipid oxidation (Ayub et al., 2011). According to (Smith & Hole, 2006),
browning and associated lipid oxidation and amino acid loss have been found to be possible at
temperatures as low as 25°C in the presence of moisture. These conditions are typical of the
weather conditions around Lake Victoria. (Kabahenda, Omony, & Hüsken, 2009)
3
Due to the increasing demand for silver cyprinid for human consumption, better techniques that
are both cheap in terms of investment costs and produce better quality silver cyprinid such as solar
tent and solar tunnel drying incorporated with salting or blanching have been introduced.
Regardless of this, the quality of silver cyprinid is still lacking as a large fraction, 80 % (Legros &
Masette, 2010), is still not fit for human consumption. There is therefore need to investigate where
the challenges are and carry out an in-depth research to have a better understanding of the drying
kinetics so as to suggest better solutions. This research is therefore aimed at drawing a comparison
of a combination of pretreatment and drying methods in terms of their effect on the quality
attributes and drying kinetics of silver cyprinid fished from Lake Victoria in Uganda.

4
1.2: Statement of the problem
Many processing methods have been applied to process silver cyprinid in an effort to reduce post-
harvest loss and increase its safety, shelf life, and value (Masette & Kwetegyeka, 2013). However
the current traditional methods, characterized by poor drying practices and facilities, coupled with
unpredictable weather conditions predispose the silver cyprinid to contamination and spoilage
(Kabahenda & Hüsken, 2009; Onyango et al., 2015) As a result the product has a bitter taste
associated with poor quality hence contributing to the low acceptability and value (Bille &
Shemkai, 2006). Market rejection of poorly processed silver cyprinid results in about 80 % of the
total annual harvest being diverted to production of animal foods or used as bait for catching bigger
fish (Legros & Masette, 2010) This therefore means a great nutrient loss to the population. (Owaga
et al., 2010)
The use of solar driers, solar tents, convectional driers, and raised racks have been presented as
techniques that incorporate low investment costs with faster drying rates and better quality
products (Oduor-Odote, Shitanda, Obiero, & Kituu, 2010; Basunia, Al-Handali, Al-Balushi,
Rahman, & Mahgoub, 2011; Immaculate, Sinduja, & Jamila, 2012). A combination of these
techniques with pre-treatments such as salting and blanching has been done in an attempt to avail
silver cyprinid that is of acceptable and wholesome quality without drastically increasing its cost.
(Cyprian et al., 2015; Dagne, Guya, Abera, & Bekele, 2016)
Despite the different drying methods introduced, the quality of silver cyprinid still remains low
affecting the value of the silver cyprinid and the economic benefit of its processors (Legros &
Masette, 2010; Onyango et al., 2015). Additionally little has been studied with respect to the
quality attributes and drying rate of silver cyprinid as affected by different drying methods. A
comparison should therefore be drawn to establish the most appropriate method for the consumers’
safety and economic benefit of the processors who depend on the silver cyprinid for their
livelihood.

5
1.3: Objectives
General objective
Establish the most effective combination of brining concentration, time and drying
methods for silver cyprinid fished from lake Victoria in Uganda
Specific objectives
To assess the processing methods employed by the selected Silver Cyprinid processors at
community level on the shores of Lake Victoria in Uganda
To determine the effect of the prevalent silver cyprinid drying practices on the quality
attributes and drying rate of silver cyprinid fished from lake Victoria in Uganda
To evaluate the effect of different salting concentrations and time on the quality attributes
and drying rate of silver cyprinid fished from Lake Victoria in Uganda.
1.4: Hypotheses
There is no variation in the processing methods employed by the silver cyprinid processors
at community level in selected landing sites along the shores of Lake Victoria in Uganda
The prevalent silver cyprinid drying practices have no effect on the quality attributes and
drying rate of silver cyprinid fished from lake Victoria in Uganda
Salting concentration and time have no effect on the quality attributes and drying rate of
silver cyprinid fished from Lake Victoria in Uganda
6
1.5: Justification of the study
Due to the declining catch of preferred large sized table fish, about 10 % for Nile perch and 42 %
for tilapia between 2005 and 2010 (Muhoozi & Mbabazi, 2010) the demand for the small fishes
such as silver cyprinid has escalated. About 5.3 Million people are directly or indirectly dependent
on the fisheries subsector as a main source of household income. Silver cyprinid and other small
fishes have become an important means of addressing the prevalent lack of micronutrients in about
34.5 Million Ugandans (DFR, 2012). Despite the fact that the silver cyprinid landings are high,
post-harvest losses are high due to poor processing resulting in a low value of the silver cyprinid
(Onyango et al., 2015).
Utilization of better techniques (solar tent, rack, oven and solar tunnel drying) ought to make silver
cyprinid more available to the population in an acceptable and wholesome quality and therefore
address the problem of low value. Information on the effect of these new techniques on the quality
attributes and drying rate of silver cyprinid will therefore help the processors utilize them in a more
informed perspective to increase the value of their catch.

7
CHAPTER TWO: LITERATURE REVIEW
Lake Victoria (68,800 Km2) is the second largest fresh water body in the world and the largest in
Africa. Tanzania takes the largest part, 51 % (35,088 Km2) followed by Uganda, 43 % (29,584
Km2) then Kenya, 6 % (4,128 Km2). The length of the lake’s shoreline is 3,450 km with Tanzania
having 1,150 Km (33 %), Uganda with 1,750 Km (51 %), and Kenya having 550 Km (16%).
(Muhoozi & Mbabazi, 2010; FAO, 2018).
There are about 1,490 landing sites along the shoreline of Lake Victoria (Kenya (297), Tanzania
(596) and Uganda (597)) which are major area of socio economic activity for the fishing
communities (Muhoozi & Mbabazi, 2010). According to the DFR (2012) annual report, Katebo
and Ssenyondo (Mpigi), Kikondo and Kiyindi (Buikwe), Katosi (Mukono), and Kasekulo
(Kalangala) were selected and processing infrastructure (drying racks, dip frying, and smoking
kilns) was installed to improve the quality of silver cyprinid for human consumption.
2.1: Fish as a healthy food
Fish provides a good source protein rich in essential amino acids (lysine, methionine, cysteine,
threonine, and tryptophan), micro and macro elements (calcium, phosphorous, fluorine, iodine,
iron), fats which are valuable sources of energy, fat soluble vitamins (A, D, E, and K) and
unsaturated fatty acids that are vital for the healthy functioning of the body. (Usydus et al., 2008)

8
Table 1: A table showing the composition of fish
Composition White fish e.g. haddock Oily fish e.g. herring
Energy (KJ) 321 970
Protein (g) 17 17
Fat(g) 07 18
Water (g) 82 64
Calcium (mg) 16 33
Iron (mg) 0.3 08
Vitamin A (μa) 0 45
Thiamine (mg) 0.07 0
(FAO, 2008)
The content of essential and non-essential amino acids, the mutual proportions of specific essential
amino acids which should preferably be similar to that found in body proteins, the energy supplied
which is essential for protein synthesis and the digestibility of the protein are the factors that
determine the nutritive quality of any food protein. (Usydus et al., 2009). The nutritional
superiority of the animal source proteins over the plant source proteins is because animal source
proteins contain a better balance of dietary essential amino acids.
Fish protein contains an amino acid composition that scores over 0.9 against the WHO protein
standard predominantly lysine and leucine for the essential amino acids and aspartic acid and
glutamic acid for the nonessential ones (Usydus et al., 2009). Fish protein has a digestibility of
over 75 % (Usydus et al., 2008). The difference between fish muscle and the muscle from land
animals stems from the difference in muscle structure required for swimming and buoyancy and
because of this, the fish muscle has less connective tissue and thus a more tender texture.
(Kristinsson & Rasco, 2000 )

9
Fish oils are rich in poly unsaturated fatty acids especially those of n-3 family such as
eicosapentaenoic acid (EPA) and docosahexaenoic acid (DHA). Despite the fact that n-3 fatty
acids can also be found in foods like flaxseed, walnut and chia, the most beneficial form of n-3
containing the two fatty acids, DHA and EPA are most commonly found in fish (Mwanja, Nyende,
Kagoda, Munguti, & Mwanja, 2010). These have very important roles in health(Liu, Zhang, Hong,
& Ji, 2005) because of their ability to lower serum tri acyl glycerol and cholesterol and their
conversion to eicosanoids, which are known to reduce thrombosis (Chol, 2005). Additionally,
these fatty acids play an important role in the prevention and possible treatment of coronary heart
disease, hypertension, arthritis and other inflammatory and auto immune disorders (Uauy &
Valenzuela, 2000; Abeywardena & Head, 2001) DHA is particularly important for brain
development (Garcia, Aguilar, Alvarado, & Garcia, 2004).
2.2: Contribution of fish to the reduction of prevalent hunger
The fisheries subsector contributes 12 % to the agricultural GDP in Uganda and employs 1.2
million people directly while supporting another 1.4 million livelihoods (Muhoozi & Mbabazi,
2010). Fish, estimated at 50 %, is the leading supply of dietary animal protein in Uganda and is
ranked first in the contribution of foreign exchange earnings among nontraditional agriculture
exports. It therefore is one of the 15 commodities being targeted for development in the
implementation of the Ministry of Agriculture, Animal Industry and Fisheries (MAAIF)
Development Strategy and Investment Plan (DSIP) (Bucyanayandi, 2011).
In most developing countries, of which Uganda is part, food insecurity is an issue of national
concern. The fish industry has therefore been identified as one of the sectors that if improved could
effectively contribute towards alleviation of food insecurity since fish has a high nutritive value.
(Owaga et al., 2010; Ogonda, Muge, Mulaa, & Mbatia, 2014). Proposed strategies to improve fish
supply for human consumption include increased use of underutilized species such as silver
cyprinid and reduction of fish wastage in form of unintended bycatch and postharvest losses.
(Sverdrup-Jensen, 1997)

10
An increase in the consumption of fish would therefore elevate the per capita consumption of
animal source nutrient dense food which is reported to be low in Uganda (Speedy, 2003) and
therefore lower the prevalence of undernutrition that is partly attributed to a limited intake of
nutrient dense foods (Kabahenda et al., 2011).
2.3: Silver Cyprinid
Silver cyprinid (Rastrineobola Argentea) is a species of ray finned fish in the family Cyprinidae,
the only member of the genus Rastrineobola. It is found in Lake Victoria, Kyoga and the River
Nile and commonly known as mukene (Uganda), dagaa (Tanzania), omena (Kenya), ndagala
(Burundi), and sambaza (Rwanda). (East African Standard., 2014)
According to Mwanja et al., 2010, Silver cyprinid contains a total of 20 fatty acids including EPA
and DHA, which was among the five principal fatty acids while the rest of the principal acids
included palmitic, stearic, oleic, and arachidonic acid. Silver cyprinid can be classified as a fatty
fish and due to its high protein, ash and lipid content, is a nutritionally dense fish (Ogonda et al.,
2014).
In Lake Victoria, Silver cyprinid is the third commercially important specie accounting for 60 %
of the total fisheries biomass and 42 % of the total fish catches in Uganda. (DFR, 2012). These are
harvested for direct human consumption (40 %) and form a key crude protein ingredient for
industrial as well as cottage processed human and animal feeds (Bucyanayandi, 2011). It is
considered to be relatively more affordable and accessible to the wider population compared to
tilapia and Nile perch and would therefore be an important food for low income households
(Owaga et al., 2010).
The continued decrease of the predatory species especially Nile perch have led to an increase in
catch of small fishes in the last few years to become a significant source of livelihood in Lakes
Victoria, Albert and Kyoga. On Lake Victoria in Uganda, silver cyprinid contributed 40 % (70,000
tonnes) to the total catch (173,023 tonnes) by weight although the value was only 8 % (19,049
million shillings) in 2008 whereas for Lake Albert between 2007 and 2008, the average catch of
the silver cyprinid recorded contributed 80 % (116,372 tonnes) of the total catch and the value was
26,949 million shillings (49 %). Lake Kyoga recorded 5,300 tonnes in 2008. It is also estimated

11
that production of silver cyprinid in other waters is about 5,000 tonnes annually .They are
processed using simple methods (sun-drying) and provide employment especially to women who
are the majority (60 %) in the postharvest sector. (Muhoozi & Mbabazi, 2010; Bucyanayandi,
2011)
2.4: Spoilage mechanisms of fish
The spoilage process of fresh fish after it has been caught can be very rapid, within 12 hours of
their catch in the high ambient temperatures of the tropics. Digestive enzymes such as proteases
and lipases, microbial spoilage as a result of surface bacteria, and oxidation, are the main spoilage
pathways for fish. The new compounds formed from the breakdown of various components during
fish spoilage are responsible for the changes in odor, flavor and texture of fish meat (Ghaly et al.,
2010).
2.4.1: Enzymatic spoilage
Enzymatic breakdown of major fish molecules leads to chemical and biological changes in dead
fish characterized by the reduction in the textural quality along with the production of
hypoxanthine and formaldehyde. The proteolytic enzymes found in the muscles and viscera of fish
degrade the proteins in a process known as proteolysis leading to solubilization and contributing
to the post mortem degradation of fish muscle (Huss, 1995). The peptides and free amino acids
produced lead to spoilage of fish meat as an outcome of microbial growth and production of
biogenic amines. Lipases such as tri acyl lipase split the glycerides of the lipids in the process
known as lipolysis forming free fatty acids that lead to rancidity and reduction in oil quality. (Ghaly
et al., 2010)
The first changes in fish tissue are as a result of autolytic reactions controlled by native enzymes
such as in the adenosine triphosphate (ATP) breakdown process. The pathway of ATP catabolism
in fish muscle has been extensively documented as degradative sequence to adenosine di phosphate
(ADP), adenosine monophosphate (AMP), inosine monophosphate (IMP), inosine (Ino) and
hypoxanthine (Hx) (Wen-Ching & Kuo-Chiang, 2001; Sabrina da Costa, Teixeira, Luiz de
Oliveira, Maia, & Conte, 2014). The concentration of ATP and its degradation products, singly
and in combination are used as indices of freshness in fish (Ozogul, Taylor, Peter, Quantick, &
12
Ozogul, 2000). Some ATP derivatives are related with the taste of fish and fish products. A high
content of Hx for example is related with the bitter off taste of spoiled fish and IMP evokes a meaty
taste sensation. (Ryder, 1985; Veciana-Nogues, Izquierdo-Pulido, & Vidal-Carou, 1996)
2.4.2: Lipid oxidation
Regardless of the benefits obtained from fish fats, these fats can easily undergo oxidation.
Oxidation of lipids is one common and frequently undesirable chemical change that may impact
flavor, aroma, nutritional quality, and, in some cases, even the texture of a product (Chol, 2005).
The chemicals produced from oxidation of lipids are responsible for rancid flavors and aromas.
Vitamins and other nutrients may be partially or entirely destroyed by highly reactive intermediates
in the lipid oxidation process. Oxidized fats can interact with proteins and carbohydrates causing
changes in texture. (Ghaly et al., 2010) Fish with a high content of polyunsaturated fatty acids are
highly susceptible to lipid oxidation as the process typically involves reaction of oxygen with the
double bonds of fatty acids. Mwanja et al., 2010 showed that silver cyprinid contains a higher
percentage of unsaturated than the saturated fatty acids with an overall percentage of 53.9 % and
46.24 % respectively. It was further reported that the PUFAs in silver cyprinid are higher than the
MUFAs at 36.85 % and 16.85 % respectively. This therefore implies that silver cyprinid is highly
susceptible to lipid oxidation.
Lipid oxidation can occur enzymatically or non-enzymatically. Non enzymatic lipid oxidation
(autoxidation) undergoes three stages, the first being the initiation stage where a labile hydrogen
atom is abstracted from a site on the fatty acyl chain with the production of a free lipid radical
which rapidly reacts with oxygen to form a peroxy radical. This initiation can be catalyzed by heat,
light, (especially U.V light) and several organic and inorganic substances including copper and
iron (usually found in common salt) (Huss, 1995; Fraser & Sumar, 1998). The second stage of
lipid oxidation is the propagation stage where the peroxy radical abstracts a hydrogen from another
hydrocarbon chain yielding a hydro peroxide and another free radical which can perpetuate the
chain reaction. The last stage is termination phase when buildup of these free radicals intensifies
to form non radical products. (Hultin, 1994; Fraser & Sumar, 1998)
Lipid hydroperoxides decompose further through free radical mechanisms to form more non
radical products. They undergo hymolysis to hydroxyl and alkoxy radicals, followed by cleavage

13
(β scission) of the fatty acid chain adjacent to the alkoxy radical producing low molecular weight
volatile compounds, many of which have distinct aromas that can affect flavor properties at
concentrations well below 1ppm (Ladikos & Lougovois, 1990). Determination of the primary
peroxides and a follow up with the secondary products (TBARs) would therefore give an
indication of the extent of lipid autoxidation.
Figure 1: Autoxidation the polyunsaturated fatty acid (Huss, 1995)
Lipid hydrolysis may either be as a result of microbial activity or by endogenous lipases. Free fatty
acids have been shown to develop more rapidly in un gutted rather than gutted fish; indicating that
the viscera contain lipolytic enzymes (Huss, 1995). Phospholipids in the fish are most readily
hydrolyzed followed by triacylglycerol to produce free fatty acids. The main effect of this activity
is the breakdown of the triacylglycerol to glycerol and fatty acids which products easily split into
aldehydes, ketones etc. which are typical of rancid flavors (Sikorski & Kolodziejska, 2002).

14
Figure 2: Primary hydrolytic reactions of triglycerides and phospholipids. Enzymes: PL1 & PL2
phospholipases; TL, triglyceride lipase
Free fatty acids, apart from being essential tools for the detection of rancidity have also been
reported to have a direct sensory impact (Boran, Karacam, & Boran, 2006). The fatty acids formed
interact with the sarcoplasmic and myofibrillar proteins causing denaturation. Apart from the
production of rancid odors and flavors, oxidation of lipids can also decrease nutritional quality and
safety by formation of secondary products that are associated with aging, membrane damage, heart
diseases and cancer (Suja, Abraham, Thamizh, Jayalekshmy, & Arumughan, 2004). Aldehydes
such as acrolein, malonaldehyde (MA), and 4-hydroxyl-2-nonenal (4-HN) produced from lipid
oxidation have been implicated in human diseases such as atherosclerosis, cataracts and aging.
(Chol, 2005). Their toxicity is due to their ability to crosslink with proteins and bind covalently to
nucleic acids thereby decreasing the digestive utilization of protein, amino acids and fats which
may affect weight gain (Varela, Muniz, & Cuest, 1995).
One of the main factors that influence autoxidation is water activity. Studies have shown that the
reaction rate is high for both dehydrated and highly hydrated foods but is minimal as water activity
is lowered towards the monolayer moisture. (Rhee & Ziprin, 2001). Salt lowers the water activity
of foods and therefore would lower the rate of lipid oxidation at both low and high concentrations
as was shown by (Rhee & Ziprin, 2001; Guizani, Rahman, Al-Ruzeiqi, Al-Sabahi, &
Sureshchandran, 2014) where peroxide value showed an inverse relationship with salt content of
tuna samples after smoking. Samples treated with 10 % salt had significantly higher peroxide
values than those treated with either 5 % or 15 % salt.

15
Various methods of determining the extent of lipid oxidation have been utilized, based either on
the increase in concentration of products of lipid oxidation or on the amount of reactants lost due
to lipid oxidation. These methods include, peroxide value, chromatography, oxygen uptake,
conjugated diene, thiobabituric acid, accelerated oxidation tests, and acid value. Peroxide value,
Acid value and thiobabituric acid methods will be used in this research since they give a
comprehensive view of the extent of lipid oxidation in fish. (Bligh & Dyer, 1959; Hultin, 1994;
Ceirwyn, 1995; AOAC, 2005; Nielsen, 2010; Nielsen, 2010)
2.4.3: Microbial spoilage
Fresh fish from water has got a microflora composition similar to that in the water from which it
was withdrawn. Microbial activity in fish depends on a number of factors, such as the composition
of the fish (intrinsic factors) like moisture content and nutrients, and other physical factors such as
surrounding atmosphere, temperature, and handling (Gram & Dalgaard, 2002)
Microbial growth and metabolism causes undesirable changes in fish that lead to spoilage in
various sensory attributes such as flavor (putrid and sour), texture due to the breakdown of
polymers and outlook through discoloration. The nutritional value of the fish also deteriorates
break up of protein amino acids into biogenic amines such as putrescine, histamine, organic acids,
sulphides, alcohol, aldehydes, and ketones with unpleasant and unacceptable off-flavors.
Furthermore, microbial activity poses a serious concerns through food borne infections from
pathogenic microorganisms such as listeria and toxicity from toxins such as aflatoxins (Krisen,
Setiaji, Trisunaryanti, & Pranowo, 2014; Cyprian et al., 2015).
Microbial deterioration is universally determined using trimethylamine (TMA). Fish utilize
trimethylamine oxide (TMAO) as an osmo-regulant to avoid dehydration in marine waters and
tissue water logging in fresh water. Bacteria such as Shewanella Putrefaciens obtain energy by
reducing TMAO to TMA thereby creating an ammonia like off flavor. (Krisen et al., 2014) TMA
is most commonly assayed using Trichloroacetic acid (TCA) extract by steam distillation (Malle
& Poumeyrol, 1989) with formaldehyde in the distillation tube to block the primary and secondary
amines whilst leaving only the tertiary amines to react. (Malle & Tao, 1987).

16
2.5: Factors that speed up fish spoilage
Various factors are known to speed up the spoilage process of fish, and these include, nutrients of
the fish, temperature, light, aeration, pH, moisture content, and action of endogenous enzymes
(Nyamwaka, 2014)
2.5.1: Nutrient and moisture composition of the fish
Many spoilage processes are nutrient specific given that various nutrients have got different
degradation mechanisms and end products (Ghaly et al., 2010). For example fatty fishes will be
more prone to lipid oxidation spoilage process that lean fishes. Silver cyprinid being a fatty fish
and at the same time having a high concentration of other nutrients such as proteins will be prone
to spoilage quickly if not processed immediately.
Moisture content is an important aspect in foods as it has a direct correlation with various factors
that affect the acceptability of the food. Water is an inexpensive ingredient in food that boosts the
weight of the food and therefore increase economic gain for the processor. Water also has a direct
influence on the sensory characteristics of food such as texture, appearance and taste making the
knowledge of moisture content important in the prediction of the behavior of the food during
processing for example, mixing, drying, flow through a tube, or packaging (Gustavo, Anthony, Jr.,
Shelly, & Theodore, 2007).
On the other hand, because the propensity of microorganisms to flourish in foods depends on their
moisture content, it is imperative that high moisture content foods ought to either be dried below
some critical moisture content or be kept in conditions that will deter microbial growth for example
cold storage or chemical preservation (Tortora, Funke, & Case, 2010).
Various factors affect the rate at which water is lost from food including the size and the shape of
the food sample. The greater the surface area of the food sample the higher the rate at which water
is lost from the food. Unfortunately powdery foods have got a tendency to clump together to form
a semi permeable crust that prevents moisture from escaping from the inside area which greatly
compromises on moisture loss. (Isengard, 2007). The presence of volatile substances can also have
an overestimating effect on the mass recorded as moisture loss

17
Water in food is divided into free water and bound water because of the level of interaction of the
water with the components of the food. Free water can easily be lost using the conventional
methods whereas the bound water will require extreme conditions to free itself. These extreme
conditions are also detrimental to the food and would affect the final moisture content when
chemical reactions such as decomposition and absorption take place (Pittpher, 2010). Certain food
components such as carbohydrates decompose to produce water and thus overestimate the
moisture content while others like glucose absorb water to under estimate the moisture content.
(Ormay & Novotny, 2011).
The huge number of water molecules involved makes it impossible to directly measure the number
of water molecules present in the food sample. This is therefore why a number of analytical
techniques commonly use the mass of water present in a known mass of sample to determine
moisture content in food (Gustavo et al., 2007). Total nutrient composition of the fish is most
commonly determined by carrying out a proximate analysis of the moisture, crude protein, crude
fat, ash, total carbohydrate content, gross energy, and the mineral composition. (Ceirwyn, 1995;
AOAC, 2005; S. Nielsen, 2010; S. Nielsen, 2010)
2.5.2: Temperature
This is critical as spoilage microorganisms and enzyme activity depend on prevalent temperature
to flourish. Optimum temperatures for growth of most spoilage microorganisms and action of most
endogenous enzymes is between 15 and 30oC. Temperatures higher than 40oC tend to denature
proteins in the fish, though effective too at stopping a number of spoilage processes. (Nyamwaka,
2014) It is therefore a common practice to use low temperature as in refrigeration to slow down
spoilage of fish by reducing the enzyme activity and significantly slowing microbial growth.
2.5.3: Aeration
Most spoilage microorganisms are aerobic in nature and will need oxygen to grow also the
oxidation of lipids can be catalyzed by oxygen. Inhibition of most spoilage processes is by
introducing gases that would not support the growth of spoilage bacteria though various
microorganisms use different gases to flourish as some can be anaerobic. This kind of control of
spoilage is therefore food specific. (Nyamwaka, 2014)
18
2.6: Processing and preservation
2.6.1: Salting
Salting, the addition of common salt (sodium chloride) to food, is the oldest traditional
preservation method of food. It has no adverse effects on the value of the food proteins and
bacterial growth can be significantly retarded by the presence of sufficient amounts of sodium
chloride. (Ayub et al., 2011). Due to the hypertonic nature of salt, most bacteria, fungi and other
potentially pathogenic organisms cannot survive in highly salty environments. Any living cells in
such an environment will undergo plasmolysis resulting in drying of food and death or inhibition
of microbial cells (Nguyen, Thorarinsdottir, Gudmundsdottir, Thorkelsson, & Arason, 2011).
Abeer, Manal, Samah, & Abdel, (2009) showed that salt had an inhibitory effect in microbial
growth in dried oriochromis niloticus (trewavas) due to its capacity to improve the water holding
capacity of matrix protein, to dehydrate the food, chloride ion effect, oxygen removal and
proteolytic enzymes. Higher concentrations cause greater preservation and drying effects (Tortora
et al., 2010) but a balance has to be met to prevent various side effects such as salty urine, water
retention leading to edema and elevated blood pressure (Fred, 2007).
2.6.3: Drying
A combination of heat from the sun and the movement of air around the fish causes the fish to dry.
Traditionally, whole small fish or small chops of large fish are usually spread on the ground, on
nets or on raised racks (Masette & Kwetegyeka, 2013). Sun drying does not allow very much
control over drying times and it also exposes the fish to attack by vermin or insects, and allows
contamination by sand and mud. These traditional techniques are totally dependent on weather
conditions, the ideal being dry weather with low humidity and clear skies. (Legros & Masette,
2010)
19
According to Onyango et al., (2015) the silver fish landed by the fishermen has a high total plate
count citing cross contamination in the boat and that the traditional sun drying methods of silver
fish practiced along the shores of lake Victoria in Tanzania don’t arrest bacterial growth but rather
provide an enabling environment for proliferation. It was also reported that the traditional drying
processes do not eliminate pathogenic microbes that may be present in the fish products although
the population levels reduce slightly due to UV light.
The use of solar or artificial dryers where drying takes place in an enclosed chamber and integrated
solar dryers incorporating desiccants, blowers and thermal systems have been tabled by a number
of researchers as improved alternatives to this open sun drying method in order to curb the
challenges faced. From their research it has been shown that by achieving increased drying
temperatures and reduced humidity, solar dryers can increase drying rate and produce a low
moisture content in the final products with improved quality compared with the traditional open
sun drying technique. For instance according to Immaculate et al., (2012), fish racks assisted
drying sun dried and solar dryer dried sardines were of better quality and dried for a shorter time
than the sardines dried directly on the sand, on mats, and on leaves. This quality improvement and
time saving can help the poor fisher folk get better prices for their fish and enhance the preferences
of consumers.
Ibengwe, (2010) also reported that the drying racks project in Tanzania had a positive net value
and would therefore reduce post-harvest losses and also provide sustainable livelihood to poor
fishers as well as increase regional trade and foreign exchange earnings. The initial investment in
controlled drying systems is high but dried fish is stable for long periods of storage and safe for
consumption throughout storage with a high value. (Reza, Bapary, & Islam, 2009; Basunia et al.,
2011; Immaculate et al., 2012; Dagne et al., 2016)
2.7: Drying kinetics
During drying, there is simultaneous heat and mass transfer, evaporation of water from the surface
and mass transfer of water from the interior to the surface of the fish takes place as heat dries the
fish. The vapor pressure difference between the fish and the surrounding medium leads to the
evaporation of water. (Jain, 2006; Jain & Pathare, 2007). Drying generally goes through two
periods, the constant rate period and the falling rate period that are controlled by temperature, air

20
velocity and the relative humidity. Drying continues at a constant rate equal to the rate of water
evaporation from the surface in the constant rate period as it governed by evaporation from the
surface or the near surface area. Water is transferred mainly by molecular diffusion from the inner
areas of the fish to the outer surface of the fish during the falling rate period. (Reza et al., 2009;
Oduor-Odote et al., 2010).
Using tilapia fish (Kituu, Shitanda, Silayo, Odote, & Bongyereire, 2007) showed that the drying
rate of fish decreases with increase in salt concentration during the first twenty hours of drying.
But this rate was not significantly different in the different brining concentrations after the twenty
hours. Also the moisture diffusivity of tilapia decreased as the brine concentration increased.
(Kituu et al., 2009) also concluded that although brining achieves osmotic dehydration, it results
in a reduction of drying rate.
To study drying kinetics, the major parameter of interest is moisture content. After the
determination of moisture content M, based on the newton model of thin layer drying for material
drying under varying relative humidity as in solar drying, the moisture ratio and the drying rate
can be calculated. Using the moisture ratio, the effective diffusivity can then be calculated. (Jain
& Pathare, 2007; Oduor-Odote et al., 2010; Cyprian et al., 2015)

21
CHAPTER THREE: METHODS AND PROCEDURE
In this study, the processing methods employed by the processors at the landing sites along Lake
Victoria was assessed to establish how they affect the quality attributes and drying kinetics of
silver cyprinid. A pilot survey in was carried out to establish the sites to be selected. In this survey
key informants in the Ministry of Agriculture, Animal Industry and Fisheries, and selected landing
sites were interviewed and the questionnaire pretested at Kasenyi landing site in Wakiso district
for modification to include relevant issues as in Appendix C.
On establishing the landing sites for the actual study, a survey was carried out to assess the various
methods used to process silver cyprinid for human consumption and challenges faced by these
processors. During the course of drying at the landing sites, samples were withdrawn hourly up to
the end of drying to assess the drying kinetics while a sample was withdrawn both at the start and
the end of drying from each of the selected processors in order to assess the effect of the drying
method on the quality attributes of the fish.
Quality attributes assessment was done by measuring the proximate composition, lipid oxidation,
enzymatic spoilage, microbial load, vitamins, and mineral composition, color and texture. The
drying kinetics was established by measuring the moisture content, humidity and drying
temperature and calculating the drying rates, moisture ratio to come up with drying curves.
3.1: Study area
This study was conducted in four landing sites along the shores of Lake Victoria in the Uganda
side including Kiyindi, Katosi, Ssenyondo and Kasekulo landing sites. These were purposively
selected for the study as they were the key silver cyprinid processing sites in Uganda from the
information obtained from key informants. The study sites geographical location is as shown
below;

22
Figure 3: Geographical location of selected landing sites along the shores of Lake Victoria
3.2: Assessment of the processing methods employed by silver cyprinid processors along
Lake Victoria in Uganda
The target population for this survey was the processors of silver cyprinid that was destined for
human consumption. Key informant interviews, semi structured questionnaires, photography and
onsite observation were used to get details on the methods used by the selected silver cyprinid
processors, main landing seasons, source of knowledge on the processing of silver cyprinid,
utilization of this knowledge, challenges faced during the processing of silver cyprinid, main
consumers of the silver cyprinid, drying times and a rough estimate of the losses experienced.
3.2.1: Sample size determination.
Information from the key information interviews with the fisheries officers and the chiefs of the
silver cyprinid processors per site was used in the sample size calculation. The sample size was
calculated using the equation given by Rose, Spinks & Conhoto (2015).
23
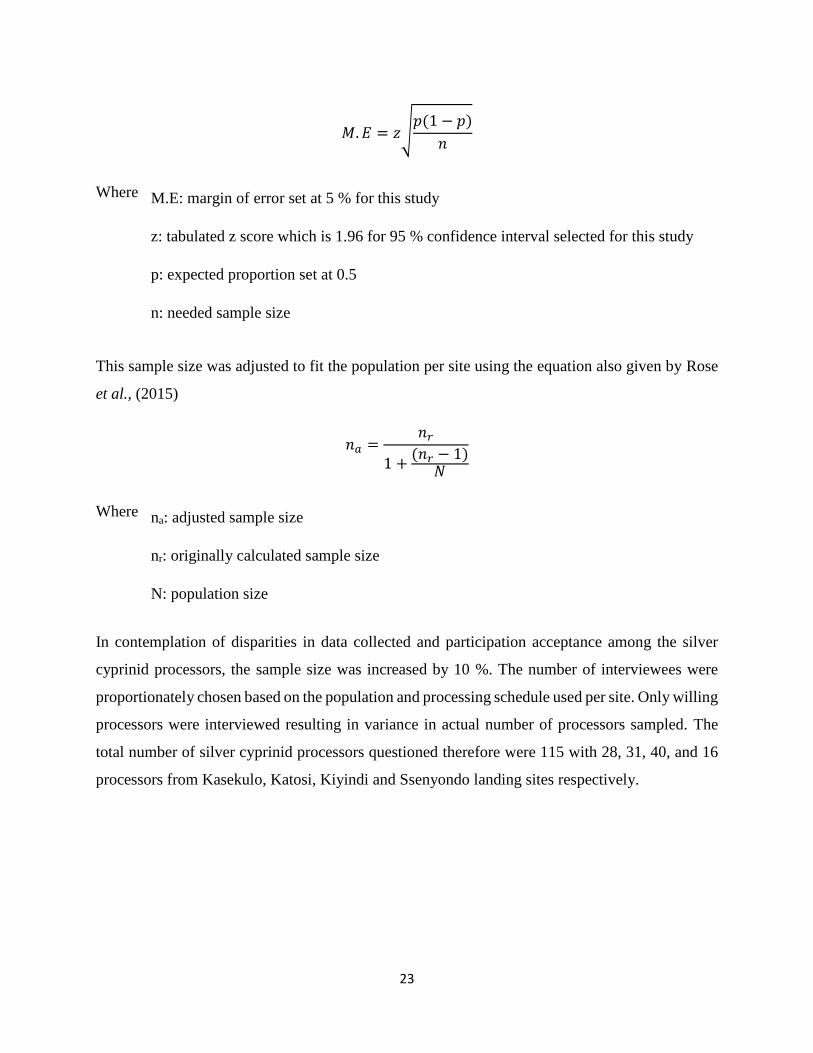
𝑀. 𝐸 = 𝑧√𝑝(1 − 𝑝)
𝑛
Where
This sample size was adjusted to fit the population per site using the equation also given by Rose
et al., (2015)
𝑛𝑎 =𝑛𝑟
1 +(𝑛𝑟 − 1)
𝑁
Where
In contemplation of disparities in data collected and participation acceptance among the silver
cyprinid processors, the sample size was increased by 10 %. The number of interviewees were
proportionately chosen based on the population and processing schedule used per site. Only willing
processors were interviewed resulting in variance in actual number of processors sampled. The
total number of silver cyprinid processors questioned therefore were 115 with 28, 31, 40, and 16
processors from Kasekulo, Katosi, Kiyindi and Ssenyondo landing sites respectively.
M.E: margin of error set at 5 % for this study
z: tabulated z score which is 1.96 for 95 % confidence interval selected for this study
p: expected proportion set at 0.5
n: needed sample size
na: adjusted sample size
nr: originally calculated sample size
N: population size

24
3.3: Determination the effect of the silver cyprinid drying practices on the quality attributes
and drying rate of silver cyprinid fished from Lake Victoria in Uganda
Using the same formula for sample size calculation as in section 3.2.1 above, processors from
those that were interviewed were sampled for this part of this study taking into account technique
of drying and whether or not one applied a pretreatment. Silver cyprinid that is destined to be dried
by the processors was sampled prior and at the end of drying in triplicate, packed in freezer bags
and placed inside cooler boxes. The samples were transported to Makerere University School of
Food Technology, Nutrition and Bioengineering research labs and kept in deep freezer (-12°C)
awaiting analysis. The following tests were carried out on these samples in the lab.
3.3.1: Proximate composition analysis
The fat, protein, ash, carbohydrate, vitamin A, moisture content and energy were determined by
the methods and procedures described below.
a. Moisture content
Moisture content was determined using AOAC, (2005). 3 ± 0.5 g of sample was weighed onto a
pre-conditioned Petri-dish and dried in a hot air oven at 100°C for about 18 hours. Dry sample was
cooled in a desiccator for 30 minutes and weighed. The loss in weight was taken as moisture
content of the sample and calculated as percentage of the total.
𝑀𝑜𝑖𝑠𝑡𝑢𝑟𝑒 𝑐𝑜𝑛𝑡𝑒𝑛𝑡 % = 𝑊2 − 𝑊3
𝑊2 − 𝑊1 × 100
Where, W1 is weight of empty dish, W2 is weight of wet sample and dish; W3 is weight of dry
sample and dish
b. Crude protein
The Kjeldahl method was used as described by Kirk & Sawyer, (1991). Sample (0.2 g) was
transferred into well labeled digesting test tubes. An aliquot of 10 ml of concentrated sulphuric
acid and a little Kjeldahl catalyst was added to each tube. They were digested at 420°C on a
digesting block to convert the nitrogen in the protein to ammonium ions. Exactly 80 ml of distilled
water was then be added to each tube and then loaded onto the distillation unit of the Kjeltec auto

25
analyzer. A blank, containing no sample was also run at this time. About 50 ml of 40 % sodium
hydroxide was added into each tube and the liberated ammonia distilled in the excess of 2 % boric
acid solution. The distillate was titrated against 0.05 M hydrochloric acid to determine the
ammonia absorbed by boric acid. Protein content was calculated as shown below.
% 𝐶𝑟𝑢𝑑𝑒 𝑝𝑟𝑜𝑡𝑒𝑖𝑛 = (𝑉2 − 𝑉1)𝑀𝐻𝐶𝑙
𝑊 × 14 × 6.25 × 100
Where, V2 = the volume (ml) of hydrochloric acid solution required for the sample, V1 = Volume
of hydrochloric acid required for the blank test, MHCL = Morality of Hydrochloric acid, W
=Weight in grams of test sample, 6.25 = Nitrogen conversion factor of protein, 14 = Atomic mass
of Nitrogen
c. Crude Fat
Soxhlet extraction method was used as described in AOAC, (2005). About 3 ± 0.5 g of sample
was mixed with about 50 ml of extraction solvent (Petroleum Ether) in thimbles which was later
fixed in Soxhlet equipment. Fat extraction was done by boiling the samples for about an hour. The
solvent was distilled off and the fat extracted dried in an air oven at 100°C for 30 minutes. The oil
collected in the beakers was weighed. Crude fat content was calculated as follows.
𝑇𝑜𝑡𝑎𝑙 𝑓𝑎𝑡 (%) = 𝑊1 − 𝑊2
𝑊0 × 100
Where; W0 = Weight of the sample (g), W2 =Weight of the empty beaker (g) and W1 = Weight
of the beaker and fat (g)
d. Ash content
About 3 ± 0.5 g of sample was ignited in a muffle furnace at 500-600°C for 6 hours as
recommended in AOAC, (2005). Ash remains as a residue in crucibles. Ash in crucible was cooled
in a desiccator for 30 minutes and weighed. Ash content was calculated as a percentage of the
total.
% 𝐴𝑠ℎ = 𝑊3 − 𝑊1
𝑊2 − 𝑊1 × 100

26
Where; W1 is weight of crucible, W2 is weight of sample and crucible, W3 is weight of ash and
crucible
3.3.2: Determination of lipid oxidation
Degree of lipid oxidation was determined using Acid value test, Thiobarbituric Acid test and
peroxide value. Acid value test, measures any acid present in the food that is extracted by organic
solvent. Thiobarbituric acid number measures secondary oxidation (Huss, 1995)
a. Peroxide value
Peroxide value was done according to the method published by Egan, Kirk, & Sawyer, (1981).
Sample (3±0.5 g) was weighed into a 250 ml stoppered conical flask and flashed with inert
nitrogen. Chloroform (20ml) was added to the sample and the mixture stirred to extract the oil.
The mixture was then filtered and washed with 30 ml of acetic acid. Freshly prepared saturated
potassium iodide (1 ml) was added to the mixture and the mixture kept in the dark for five minutes.
After five minutes the solution was withdrawn from the dark and starch solution (5 %) added. The
resultant blue black solution was titrated against sodium thiosulphate (0.1 M) and the titer value
recorded. The peroxide value was calculated using the following equation.
𝑝𝑒𝑟𝑜𝑥𝑖𝑑𝑒 𝑣𝑎𝑙𝑢𝑒 𝑎𝑠𝑚𝑒𝑞 𝑝𝑒𝑟𝑜𝑥𝑖𝑑𝑒
1000𝑔 𝑠𝑎𝑚𝑝𝑙𝑒=
(𝑆 − 𝐵)(𝑁)(1000)
𝑤𝑒𝑖𝑔ℎ𝑡 𝑜𝑓 𝑠𝑎𝑚𝑝𝑙𝑒
Where, B – titration of blank, S – titration of sample, N – normality of Na2S2O3 solution
b. Acid value
Acid value was determined according to Pomeranz & Meloan, (2000). Diethyl ether (25 ml) was
mixed with absolute ethanol (25 ml) and 1ml phenolphthalein solution (1 %, prepared by
dissolving 1 g phenolphthalein indicator in 100 ml ethanol). The mixture was carefully be
neutralized using sodium hydroxide (0.1 M). The sample (3 ± 0.5 g) was dissolved in the mixed
neutral solvent and titrated with aqueous 0.1 M sodium hydroxide with constant shaking until a
pink color that persists for 15 seconds was obtained. The acid value was calculated as shown
below:

27
𝐴𝑐𝑖𝑑 𝑣𝑎𝑙𝑢𝑒 =𝑡𝑖𝑡𝑟𝑎𝑡𝑖𝑜𝑛 (𝑤𝑙) × 𝑐𝑜𝑛𝑐𝑒𝑛𝑡𝑟𝑎𝑡𝑖𝑜𝑛 𝑜𝑓 𝑁𝑎𝑂𝐻 × 40.0
𝑤𝑒𝑖𝑔ℎ𝑡 𝑜𝑓 𝑠𝑎𝑚𝑝𝑙𝑒
c. Thiobarbituric Acid (TBA) number
TBA number was determined according to Pomeranz & Meloan, (2000). Sample (0.2 g) was
weighed into a 25 ml volumetric flask. The sample was homogenized in a small volume of 1-
butanol and made to volume before mixing. Supernatant (2.5 ml) was pipetted into a dry stoppered
test tube and 2.5 ml of TBA reagent (200 mg of 2-thiobarbituric acid in 100 ml 1-butanol) added.
The mixture was stoppered, mixed and placed in a water bath at 95°C for 120 minutes. The mixture
was cooled, absorbance (AB) of the blank and samples was run at 530 nm. The TBA value was
calculated as shown below:
𝑇𝐵𝐴 𝑣𝑎𝑙𝑢𝑒 = 50 × (𝐴𝑠 − 𝐴𝑏 )
𝑀
Where: As= Absorbance of sample, Ab= Absorbance of blank; M= Mass of sample
3.3.3. Microbial count and spoilage
3.3.3.1: Microbial count analysis
The diluent was prepared by dissolving one tablet of ringer’s phosphate in 500 ml of distilled
water. This diluent was pipetted into 9 to 90 ml diluent bottles and autoclaved at 121°C for 15
minutes. This was used for the serial dilutions preparations with the sample for the microbial count
analyses.
3.3.3.1.1: Total plate count
The total plate count was enumerated using the pour plate technique in the ISO 4833:2013 method.
Plate count agar was prepared by dissolving 11.75 g of the agar powder (1056.00, CONDA
Pronodisa Laboratories Conda U.S.A) into distilled water (500 ml) and sterilized by autoclaving
at 121°C for 15 minutes then allowed to cool to about 47°C using a water bath (Grants instrument
Ltd, Shepreth, England). Serial dilutions (10-1 to 10-7) of the sample solutions were made.
28
Inoculum (1 ml) from each selected dilution was aseptically transferred to petri dishes and about
20 ml of molten agar poured into each petri dish containing the inoculum. This inoculum was
carefully mixed with the agar by rotating the petri dishes and then allowed to solidify. The dishes
were then inverted after solidification of the agar and incubated at 37°C for 24 hours. Plates with
colonies ranging from 30 to 300 were considered for counting using the colony counter (Stuart
SC6, UK) and the results expressed as colony forming units (cfu)/g.
3.3.3.1.2: Total coliforms
The total coliforms were determined using the pour plate technique in ISO 4832:2006. Violet Red
Bile Lactose (VRBL) agar (M581-500G. Hi-Media Laboratories Pvt. Ltd.) was prepared by
weighing 20.75 g of media powder into 500ml of distilled water. The mixture was heated on a
Bunsen burner flame until boiling and allowed to boil for 2 minutes then immediately cooled to
47°C using a water bath. Serial dilutions (10-1 to 10-7) of the fish samples was made and 1 ml of
inoculum from each dilution transferred aseptically to petri dishes.
Molten agar (20 ml) was poured into each of the petri dishes containing inoculum and carefully
mixed by rotating the petri dishes. After solidification, agar (5 ml) was poured over the surface of
the previously solidified mixture and left to solidify again to create an anaerobic atmosphere. The
dishes were then inverted and incubated at 37°C for 24 hours. After 24 hours, the purplish colonies,
which were considered to be typical coliform colonies, ranging from 30 to 300 were counted using
the colony counter and results expressed in colony forming units (cfu)/g.
3.3.3.1.3: Yeasts and mold counts
Yeasts and molds were enumerated using the surface spread technique in ISO 21527 – 2:2009.
About 15.8 g of Dichloran Rose Bengal Chloramphenicol (DRBC) agar (M588-500G, Hi-Media
Laboratories Pvt. Ltd.) was weighed and mixed with distilled water (500 ml). This mixture was
sterilized by autoclaving at 121°C for 15 mins and immediately cooled in a water bath to about
47°C. Molten agar (20 ml) was aseptically poured into the petri dish and allowed to set.
The petri dish was inverted to avoid the dripping back of condensed water onto the solidified agar.
Inoculum (0.1 ml) from the serial dilutions (10-1 to 10-7) of the fish samples was aseptically
transferred onto the center of the solidified agar and evenly spread over the surface of the agar
29
using a sterile wire loop. This set up was incubated at room temperature for 5 days. Colonies
between 30 and 300 were taken and counted using the colony counter and results expressed as
cfu/g.
Calculations
The microbial counts, represented as colony forming units per gram (cfu/g), were calculated
according to the formula
𝐶 = ∑𝑋
𝑉 [𝑛1 + 𝑛2(0.1)]𝑑
Where C – sum of all the counted colonies, ∑X – sum of all counted colonies, n1 – number of petri
dishes at which the which the first counting was done, n2 – number of petri dishes at which the
second counting was done, d – dilution factor at which the first counting was done
3.3.3.2: Microbial spoilage: Determination of TMA/TMAO
Trimethylamine (TMA) determination was conducted using method published by Malle & Tao,
(1987) with a minor modification. Silver cyprinid powder for the dry fish or paste for the wet fish
(5 ± 0.5 g) was homogenized with 10ml of 7.5 % aqueous trichloroacetic acid (TCA) solution and
the homogenate centrifuged at 4400 rpm for 40 min. The supernatant liquid was then be filtered
through Whatman No 1 filter paper into the conical flask. Filtrate (2.5 ml) was transferred into
Kjeldahl distillation tube followed by 0.5 ml of 10 % sodium hydroxide solution and 2 ml of 35 %
(v/v) formaldehyde. (Malle & Poumeyrol, 1989). The receiving flask contained 15 ml of 4 % boric
acid and 15 drop of indicator (methyl red mix with bromocresol green).
The distillation tube was attached in the Kjeldahl distillation apparatus and 5 ml of distillate
collected in the receiving flask. Each distillate was titrated against an aqueous 0.05 M sulphuric
acid solution with constant shaking until a pink colour persists for 15 seconds. The amount of
TMA was calculated from the volume of 0.05 M sulphuric acid (n ml) used for titration and the
results expressed in mg nitrogen 100 g-1 of sample.
TMA = n x 16.8 mg N 100 g-1

30
3.3.4: Drying rate of fish samples
Samples of silver cyprinid from each drying procedure were withdrawn in triplicate hourly and
taken to the lab for moisture content analysis (3.3.1 (a)). Ambient air temperature and relative
humidity was also measured. This went until the processors deemed the product ready to be sold.
After the determination of moisture content M, based on the newton model of thin layer drying for
material drying under varying relative humidity as in solar drying, the moisture ratio equation used
was
𝑀𝑟 = 𝑀 − 𝑀𝑒
𝑀𝑜 − 𝑀𝑒
But because the value of the dynamic equilibrium moisture content Me is very small and the
relative humidity of drying air is continuously changing during sun drying, the moisture ration was
written as
𝑀𝑟 = 𝑀
𝑀𝑜
The drying rate which is proportion to the difference in moisture content between the material to
be dried and the equilibrium moisture content was calculated using the following equation
𝐷𝑟 = 𝑑𝑀
𝑑𝑡= 𝑀𝑡 −
𝑀𝑡 + ∆𝑡
∆𝑡
Where
Dr – drying rate at any given time of drying (Kg water/Kg db, hour), dM – change in moisture
content (Kg water/Kg db), dt – change in time (hour), Mt + ∆t – moisture content at t = t +∆t, Mt
– moisture content at t = t, Mo – initial moisture content (Kg water/Kg db), Me – equilibrium
moisture content (Kg water/Kg db), t – Drying time (s)

31
3.4: Evaluation of the effect of different salting concentrations and time on the quality
attributes and drying rate of silver cyprinid fished from Lake Victoria in Uganda.
Fishermen were selected and different concentrations of salt were given to them with instruction
on application offshore. Containers were brought the next day with the different treatments and a
control. Application of salt onshore was done on racks and the fish allowed to dry until the moisture
content remained constant. The fish was sampled before salting in the lake, the state at shore and
after drying, packed in freezer bags and placed inside cooler boxes. The samples were transported
to Makerere University School of Food Technology, Nutrition and Bioengineering research labs
and kept in deep freezer (-12°C) awaiting analysis.
Tests on proximate composition were carried out using the procedures elaborated above in section
3.3.1 including moisture, crude protein, crude fat and ash. The extent of lipid oxidation was also
tested using the procedures shown in section 3.3.2 above including values for thiobabituric acid
reactive substances content, acid value, and peroxide value. The microbial account and spoilage
(using TMAO reduction) analysis was carried out as laid out in section 3.3.3 above. The drying
kinetics were studied using the procedure presented in section 3.3.4 above.
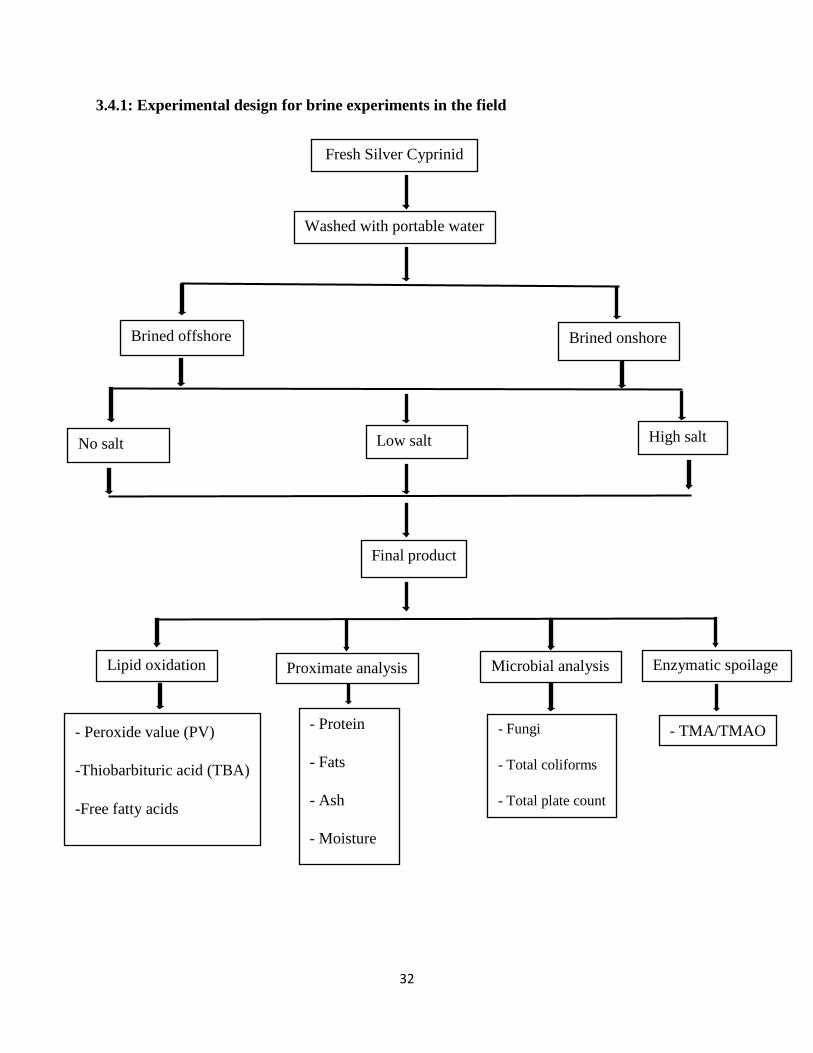
32
3.4.1: Experimental design for brine experiments in the field
Washed with portable water
Brined offshore Brined onshore
No salt Low salt High salt
Final product
Fresh Silver Cyprinid
Lipid oxidation Proximate analysis Enzymatic spoilage Microbial analysis
- Peroxide value (PV)
-Thiobarbituric acid (TBA)
-Free fatty acids
- Protein
- Fats
- Ash
- Moisture
- Fungi
- Total coliforms
- Total plate count
- TMA/TMAO
33
3.5: Statistical analysis
The difference in proximate composition, vitamins and minerals content, lipid oxidation, enzyme
activity and microbial load before after each pretreatment and drying method was analyzed using
one way ANOVA on a completely randomized block design and the mean differences were
compared using the least significant difference method to affirm whether there was a significant
difference between the effect of the various preservation methods on the quality attributes of silver
cyprinid at 5 % (P ≤ 0.05) level of significance
A linear regression analysis was done to find the relationship between drying rate and hourly mean
moisture content. The coefficient of determination for each drying method curve was used to
establish the most efficient drying method.
IBM SPSS V21 statistics software was used.

34
CHAPTER FOUR: RESEARCH RESULTS
4.1: Assessment of the processing methods employed by the selected Silver Cyprinid
processors at community level on the shores of Lake Victoria in Uganda
Seventy five of the processors questioned were females while the age speciation amongst the
processors questioned was 85, 23, and 7 for those between 30 and 60, below 30 and above 60 years
of age respectively.
4.1.1: Drying and pretreatment methods used
All the processors questioned dried their fish under direct sunlight with the highest fraction drying
their fish on a net on the ground (41.7 %). Others dried on the raised racks (37.4) while the least
percentage was still drying directly on the sand on the beach (20.9 %) as shown below in Fig. 3.
Figure 4: A pie chart showing the different drying techniques used by artisanal fishermen in four
sites along the shores of Lake Victoria in Uganda.
Salting of silver cyprinid was only observed in Kiyindi and Ssenyondo. Katosi processors dried
fish entirely on nets placed on the ground whereas Ssenyondo dried the fish only on raised racks
apart from during periods of high catch when the raised racks were not enough to dry all the fish.
In Kiyindi processors dried their fish both on raised racks and on nets placed on the ground whereas
ground net ground sand raised rack

35
in Kasekulo the fish was dried directly on the sand on the beach and on raised racks as shown in
Table 2 below;
Table 2: Table showing the different processing methods utilized in four landing sites visited along
the shores of Lake Victoria in Uganda
Site Pretreatment used Drying strategy utilized
Brining Net Rack Sand
Katosi
Kiyindi
Ssenyondo
Kasekulo
The major reason as to why the artisanal processors dry the silver cyprinid is because that is what
their customers demand for (47.0 %). The other reason is because drying is more affordable (30.4
%) than other methods such as freezing, deep frying and smoking since the sun’s heat is free of
charge. Others dried because that is how they found it being done and do so to keep the norm (11.3
%). A very small percentage of those processors asked gave reasons such as to improve quality
and shelf life (2.6 %), because the method was fast and easy (2.6 %), and availability of drying
space (3.5 %).
Pretreatment / drying strategy
happens here
Pretreatment / drying strategy does
not take place

36
Figure 5: A graph showing the reasons as to why artisanal processors in four landing sites along
Lake Victoria in Uganda dry their fish
The main reason as to why silver fish processors, who dried their fish for human consumption,
dried their fish the way they did was because they expected that the method they used (raised racks
and nets on ground) would ensure clean fish (56.5 %). Others dried that way because their
customers demanded the fish dried that way (16.5 %). Most of those questioned that were
processing for animals dried their fish directly on the ground in order to increase the weight of the
fish with sand since the fish was sold in kilograms (10.4). The others claimed that chicken need
stones in their feed (3.5 %). The rest of the processors gave reasons such as, enforcement (2.6 %),
norm (3.5 %), fast (2.6 %), and affordability of the processing methods (2.6 %). As shown in Fig.
6 below:
0.0
10.0
20.0
30.0
40.0
50.0
60.0
Norm improve
quality and
shelflife
fast and easy customer
preference
availability of
space
affordablePer
centa
ge
of
pro
cess
ors
that
gav
e th
e
spec
ific
rea
son
Reasons for drying

37
Figure 6: A graph showing reasons as to why artisanal processors in four landing sites along the
shores of Lake Victoria in Uganda chose a specific technique of drying to dry their fish
An overall mean of 78.3 % of the processors did not salt their fish while the remaining 21.7 did
across all the landing sites. Salting was done due to various reasons as shown in Fig. 7.The main
reason as to why the processors pretreated their fish is because their customers want the fish treated
that way (62.3 %) followed by the fact that that is what they found happening and just joined in to
pretreat thus (32.4 %). The lowest percentage of those questioned said the particular pretreatment
they are using is more affordable than the other (5.3 %).
0.0 10.0 20.0 30.0 40.0 50.0 60.0
affordability
chicken need stones
chicken feed weighed in kilograms
cleanliness
customer
fast
norm
porosity of the net
enforcement
Percentage of processors who gave specific reason
Rea
sons
for
spec
ific
tec
hniq
ue
of
dry
ing

38
Figure 7: A pie chart showing reasons as to why artisanal processors in four landing sites along
the shores of Lake Victoria in Uganda chose to either salt or not to salt their fish.
4.1.2: Challenges faced by processors and the coping mechanisms developed
The highest percentage of the processors sited weather conditions (58.1 %) as the main challenge
faced during drying followed by birds and other animals (19.4 %) as they would eat their fish and
trample over it. The others found the cost of drying (8.5 %) in terms of drying space rent and
equipment acquisition high. Other challenges were high boat prices (6.2 %), the seasonality of fish
(0.8 %), lack of market (3.9 %), presence of bycatch (2.3 %) and dirty drying areas (0.8 %).
customer preference affordable norm
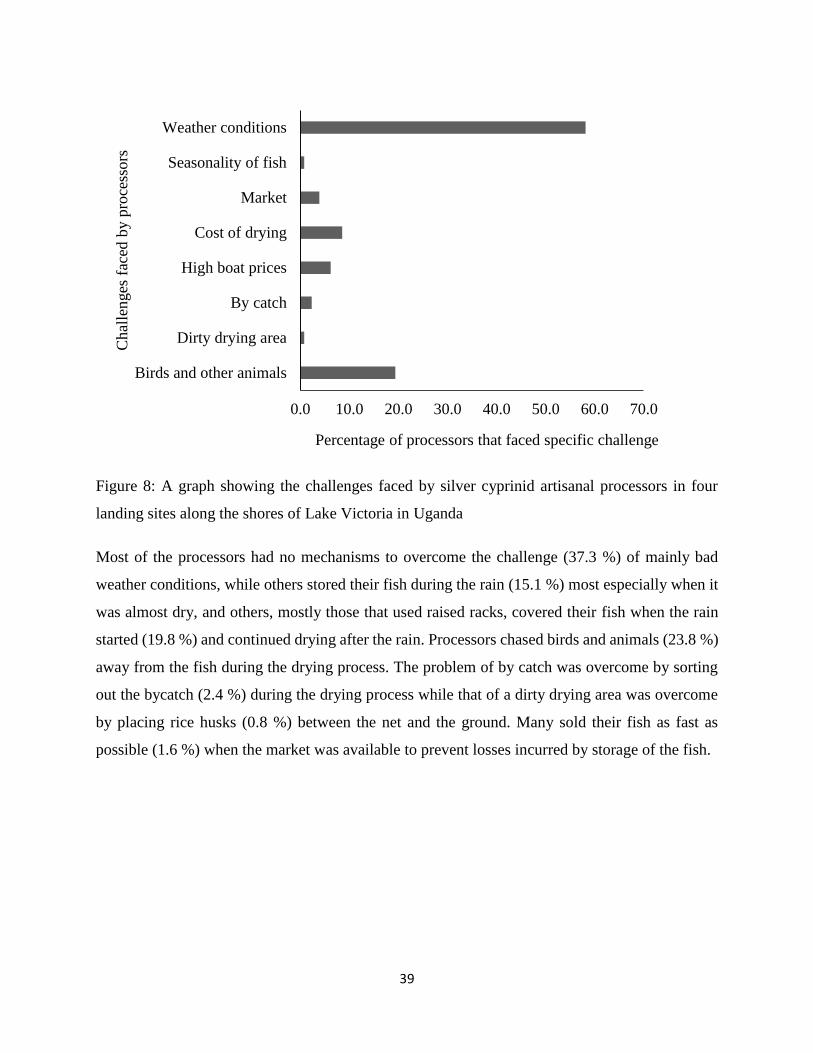
39
Figure 8: A graph showing the challenges faced by silver cyprinid artisanal processors in four
landing sites along the shores of Lake Victoria in Uganda
Most of the processors had no mechanisms to overcome the challenge (37.3 %) of mainly bad
weather conditions, while others stored their fish during the rain (15.1 %) most especially when it
was almost dry, and others, mostly those that used raised racks, covered their fish when the rain
started (19.8 %) and continued drying after the rain. Processors chased birds and animals (23.8 %)
away from the fish during the drying process. The problem of by catch was overcome by sorting
out the bycatch (2.4 %) during the drying process while that of a dirty drying area was overcome
by placing rice husks (0.8 %) between the net and the ground. Many sold their fish as fast as
possible (1.6 %) when the market was available to prevent losses incurred by storage of the fish.
0.0 10.0 20.0 30.0 40.0 50.0 60.0 70.0
Birds and other animals
Dirty drying area
By catch
High boat prices
Cost of drying
Market
Seasonality of fish
Weather conditions
Percentage of processors that faced specific challenge
Chal
lenges
fac
ed b
y p
roce
ssors

40
Figure 9: A graph showing the coping mechanisms to overcome challenges used by artisanal silver
cyprinid processors in four landing sites along the shores of Lake Victoria in Uganda
4.1.3: Final consumer of the fish
Much of the fish processed in these sites was meant for human consumption (79.3 %) while the
rest (20.7 %) was processed for animal food for the reasons (Fig. 10). The highest percentage of
the artisanal processors sold their fish for human consumption for the profit that goes with it (41.9
%). Others would not sell their fish for animal consumption because it is hygienically dried and
hence clean (25.0 %).
Many of those that dried their fish for chicken feed said they did so because it was a less labor
intensive option (14.7 %). Many sold fish that was formally destined for human feed to animal
feed middlemen because of lack of market while others changed to the human market for the
presence of market (4.3 %). The rest did not have a reason for selling their fish to the exact
consumer (6.9 %).
0.0 5.0 10.0 15.0 20.0 25.0 30.0 35.0 40.0
Chasing birds and animals
Cover the fish when the rain starts
None
Putting the net on rice husks
Sell as fast as possible
Sorting
Store during the rain
Percentage of processors that gave specific mechanism
Mec
han
ism
s to
over
com
e ch
alle
nges

41
Figure 10: A graph showing the reasons as to why artisanal silver cyprinid processors chose to sell
their fish for either human consumption or animal feed
4.1.4: Indicators for end of drying.
The majority of the processors used the appearance of the fish (40.6 %) as an indicator of end of
drying. The silver shine of the dry fish is more profound than the wet fish. Brittleness of the fish
(17.2 %) and its texture (16.4 %) were also being used as indicators of end of drying. The other
indicators included the absence of surface soil (10.9%) for the ground sand dried fish, wetness of
the fish (7.0 %), its size (3.9 %), weight (1.6 %), aroma (1.6 %), and stiffness (0.8 %).
0.0
10.0
20.0
30.0
40.0
50.0
60.0
profit less labour
intensive
market none clean fish
Per
centa
ge
of
pro
cess
ors
that
gav
e th
e
spec
ifc
reas
on
reasons for end user preference

42
Figure 11: A graph showing the indicators used by artisanal silver cyprinid processors in four
landing sites along the shores of Lake Victoria in Uganda to judge end of drying
4.1.5: Critical control points and losses experienced by processors
The largest majority of the processors were keener on quality when the fish reached the drying
area (56.1 %), followed by those that found the boat (30.3 %) as the determinant of the final quality
of the fish. Others thought the washing of basins and cleaning of the drying area (7.6 %) were good
enough for quality of the fish. The rest (6.1 %) did not mind the quality of their fish.
0.0
5.0
10.0
15.0
20.0
25.0
30.0
35.0
40.0
45.0P
erce
nta
ge
of
pro
cess
ors
that
use
d s
pec
ific
indic
ator
Indicators used for end of drying

43
Figure 12: A pie chart showing the points at which the artisanal silver cyprinid processors in four
landing sites along the shores of Lake Victoria in Uganda expected contamination
By catch (48.0 %) was the major reason cited for the losses experienced by the artisanal processors
of silver cyprinid followed by weather uncertainties (33.6 %). Other losses experienced were
attributed to high boat prices of fish (8.8 %), insufficient drying of the fish (4.8 %), and the birds
and animals (4.8 %).
Boat Drying surface Never drying area and amenities

44
Figure 13: A graph showing the various reasons given by the artisanal silver cyprinid processors
in four landing sites along the shores of Lake Victoria in Uganda for the losses experienced
0.0
10.0
20.0
30.0
40.0
50.0
60.0
Birds andother
animals
By catch High boat
prices
Weather
conditions
Insufficient
drying
Per
centa
ge
of
pro
cess
ors
that
gav
e
spec
ific
rea
son
Reasons for loss experienced
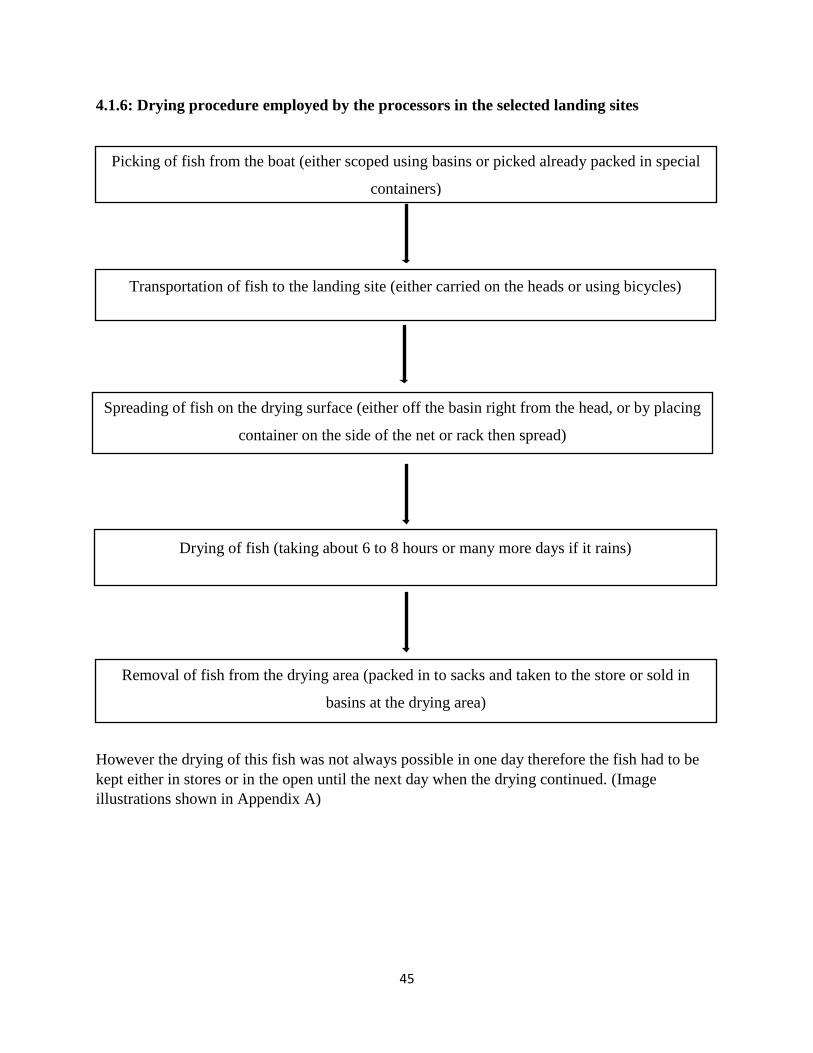
45
4.1.6: Drying procedure employed by the processors in the selected landing sites
However the drying of this fish was not always possible in one day therefore the fish had to be
kept either in stores or in the open until the next day when the drying continued. (Image
illustrations shown in Appendix A)
Picking of fish from the boat (either scoped using basins or picked already packed in special
containers)
Transportation of fish to the landing site (either carried on the heads or using bicycles)
Spreading of fish on the drying surface (either off the basin right from the head, or by placing
container on the side of the net or rack then spread)
Drying of fish (taking about 6 to 8 hours or many more days if it rains)
Removal of fish from the drying area (packed in to sacks and taken to the store or sold in
basins at the drying area)

46
4.2: Determination of the effect of the prevalent silver cyprinid drying practices on the
quality attributes and drying rate of silver cyprinid fished from Lake Victoria in Uganda
4.2.1: Variation in proximate changes in different sites at the end of drying of silver cyprinid
by the processors
Kiyindi had a significantly higher moisture content (27.7 %, P ˂ 0.05) than the rest of the sites
after drying while Kasekulo had the lowest moisture content (17.6 %). The fat content for all sites
was not significantly different (P > 0.05) though Kasekulo registered the highest mean fat content
of 10.2 %. The ash content of Kiyindi, Ssenyondo and Kasekulo were not significantly different
(P > 0.05) but significantly higher (P ˂ 0.05) than that of Katosi. The protein content was
significantly higher for the dry fish in all sites than in the fresh fish and significantly highest in
Kasekulo (60.1 ± 5.2 g/100g).
All dry fish had significantly higher Peroxide values that the fresh fish. Kiyindi had a significantly
higher peroxide value (8.6 meqO2/Kg, P ˂ 0.05) than the rest of the sites with Katosi having the
lowest (1.5 meqO2/Kg). There was no significant difference between the free fatty acid (FFA)
content in all sites though Kasekulo had the highest acid value of 3.6 mgNaOH/g. The TBARs
value was significantly different for all sites with Kasekulo having the highest value of 93.5
μmolMDA/g and Ssenyondo the least with 51.1 μmolMDA/g. The TBARs value of the fresh fish
(60.1 μmolMDA/g) was not significantly different from the value of the sites apart from Kasekulo.
(Table 3)
4.2.2: Variation in microbiological changes in different sites at the end of drying by the silver
cyprinid processors
Kasekulo fish had the highest total microorganism count (8.8 ± 1.1 log cfu/g) whereas Kiyindi fish
had the least (5.9 ± 0.6 log cfu/g). Apart from Kasekulo’s, which had a significantly higher total
microbial count (P ≤ 0.05), all the dry fish from the other sites had a significantly lower total
microbial count than the fresh fish (P ≤ 0.05). Kiyindi fish had a significantly lower (P ≤ 0.05)
total coliform count (2.0 ± 0.6 log cfu/g) than all the other sites with Kasekulo’s having the highest
(4.9 ± 0.9 log cfu/g). Dry fish from all the sites apart from Kasekulo, though also lower but not
significantly, had a significantly lower total coliform count than the fresh fish (5.1 ± 1.9 log cfu/g).

47
The mold count was highest in Katosi fish (5.1 ± 0.5 log cfu/g) and lowest in Kiyindi fish (3.8 ±
1.1 log cfu/g). The mold count was significantly higher in the dry samples than in the wet samples
from all sites (P ≤ 0.05) apart from in Kiyindi where, though higher, was not significantly different
(P = 0.11). The dry fish from all sites showed no significant difference from the fresh fish in
quantities of trimethylamine though they all had higher quantities than the fresh fish (1.7 ± 0.0
mgN/100g). Kasekulo had a significantly higher quantity of trimethylamine than all other sites
(12.8 ± 9.2 mgN/100g) while Kiyindi had the lowest (2.5 ± 1.9 mgN/100g). (Table 3)
Table 3: Comparison of quality of fish in its fresh form and its dry form fished from Lake Victoria
and dried in four landing sites along the shores of Lake Victoria in Uganda
Site code Fresh fish Katosi Kiyindi Ssenyondo Kasekulo
Moisture (g/100g) 77.2 ± 2.2* 22.7 ± 3.7a** 27.7 ± 8.1b** 19.1 ± 4.9c** 17.6 ± 4.7c**
Fat (g/100g) 8.3 ± 0.0* 9.8 ± 0.6a** 9.6 ± 2.8a* 9.2 ± 1.8a* 10.2 ± 1.6a*
Ash (g/100g) 3.8 ± 1.7* 11.3 ± 0.6a** 14.7 ± 5.2b** 13.5 ± 3.1b** 14.6 ± 4.4b**
PV (mEqO2/kg) 0.8 ± 0.8* 1.5 ± 0.9a** 8.6 ± 5.6b** 5.1 ± 2.5c** 5.5 ± 5.9c**
FFA (mgNaOH/g) 1.9 ± 0.3* 3.3 ± 0.4a** 3.2 ± 1.2a** 3.2 ± 0.4a** 3.6 ± 1.0a**
Protein (g/100g) 19.0 ± 0.9* 52.4 ± 3.1a** 46.4 ± 8.1b** 50.9 ± 5.2a** 60.1 ± 5.2c**
TBA (μmolMDA/g) 60.1 ± 6.3* 59.0 ± 10.2a* 66.7 ± 13.4b* 51.1 ± 13.0c* 93.5 ± 17.6d**
TMA (mgN/100g) 1.7 ± 0.0* 6.9 ± 4.3a* 2.5 ± 1.9b* 7.1 ± 6.3a* 12.8 ± 9.2c*
Log TPC (cfu/g) 7.4 ± 1.2* 6.7 ± 0.8a** 5.9 ± 0.6b** 6.5 ± 0.9a** 8.8 ± 1.1c**
Log TC (cfu/g) 5.1 ± 1.9* 4.2 ± 0.7a** 2.0 ± 0.6b** 3.7 ± 1.2c** 4.9 ± 0.9d*
Log Y&M (cfu/g) 3.5 ± 0.7* 5.1 ± 0.5a** 3.8 ± 1.1b* 4.4 ± 0.7c* 3.9 ± 1.3b*
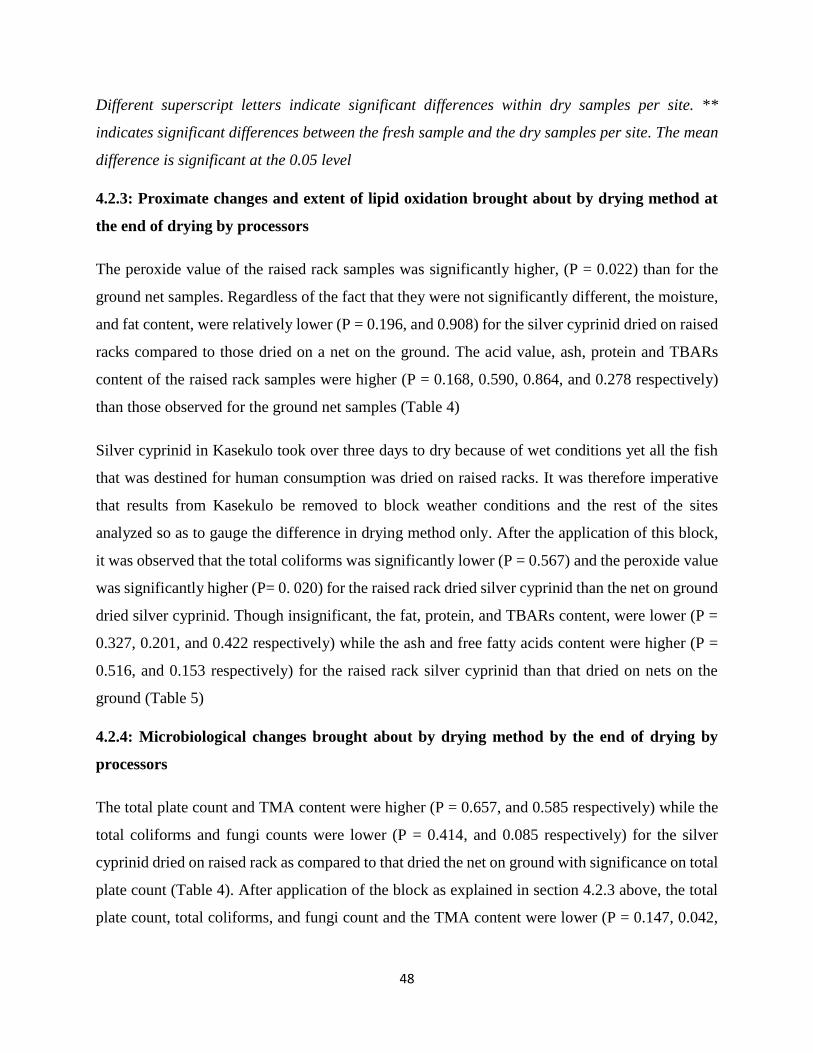
48
Different superscript letters indicate significant differences within dry samples per site. **
indicates significant differences between the fresh sample and the dry samples per site. The mean
difference is significant at the 0.05 level
4.2.3: Proximate changes and extent of lipid oxidation brought about by drying method at
the end of drying by processors
The peroxide value of the raised rack samples was significantly higher, (P = 0.022) than for the
ground net samples. Regardless of the fact that they were not significantly different, the moisture,
and fat content, were relatively lower (P = 0.196, and 0.908) for the silver cyprinid dried on raised
racks compared to those dried on a net on the ground. The acid value, ash, protein and TBARs
content of the raised rack samples were higher (P = 0.168, 0.590, 0.864, and 0.278 respectively)
than those observed for the ground net samples (Table 4)
Silver cyprinid in Kasekulo took over three days to dry because of wet conditions yet all the fish
that was destined for human consumption was dried on raised racks. It was therefore imperative
that results from Kasekulo be removed to block weather conditions and the rest of the sites
analyzed so as to gauge the difference in drying method only. After the application of this block,
it was observed that the total coliforms was significantly lower (P = 0.567) and the peroxide value
was significantly higher (P= 0. 020) for the raised rack dried silver cyprinid than the net on ground
dried silver cyprinid. Though insignificant, the fat, protein, and TBARs content, were lower (P =
0.327, 0.201, and 0.422 respectively) while the ash and free fatty acids content were higher (P =
0.516, and 0.153 respectively) for the raised rack silver cyprinid than that dried on nets on the
ground (Table 5)
4.2.4: Microbiological changes brought about by drying method by the end of drying by
processors
The total plate count and TMA content were higher (P = 0.657, and 0.585 respectively) while the
total coliforms and fungi counts were lower (P = 0.414, and 0.085 respectively) for the silver
cyprinid dried on raised rack as compared to that dried the net on ground with significance on total
plate count (Table 4). After application of the block as explained in section 4.2.3 above, the total
plate count, total coliforms, and fungi count and the TMA content were lower (P = 0.147, 0.042,

49
0.303, and 0.740 respectively) for the silver cyprinid dried on raised racks compared to that dried
on the net on ground with significance on the total coliforms. (Table 5)
Table 4: Quality of Silver cyprinid dried by artisanal processors in four landing sites along the
shores of Lake Victoria in Uganda using the two main approaches of drying
Drying method Net on ground Raised rack
Moisture (g/100g) 24.1 ± 3.7 20.8 ± 9.1
Fat (g/100g) 9.5 ± 0.8 9.6 ± 1.9
Ash (g/100g) 12.9 ± 4.2 13.6 ± 3.7
FFA (mgNaOH/g) 3.1 ± 0.7 6.8 ± 5.1
PV (mEqO2/kg)* 2.9 ± 4.3 3.5 ± 0.8
Protein (g/100g) 50.9 ± 6.0 51.4 ± 8.7
TBA (μmolMDA/g) 60.7 ± 12.0 68.1 ± 23.1
TMA (mgN/100g) 5.2 ± 4.4 3.4 ± 1.5
Log TPC (cfu/g) 6.6 ± 0.9 6.8 ± 1.5
Log TC (cfu/g) 3.8 ± 0.8 3.4 ± 1.5
Log Y&M (cfu/g) 4.4 ± 1.1 3.7 ± 1.1
* indicate significant differences between the two drying methods. The mean difference is
significant at the 0.05 level
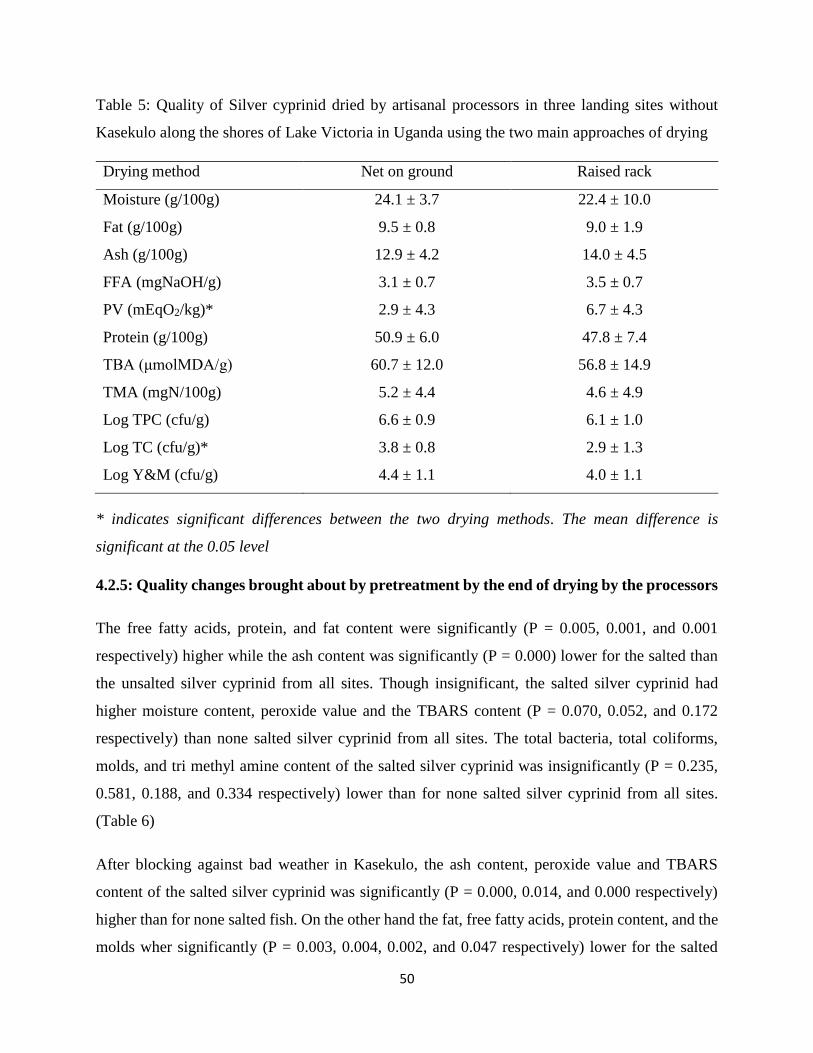
50
Table 5: Quality of Silver cyprinid dried by artisanal processors in three landing sites without
Kasekulo along the shores of Lake Victoria in Uganda using the two main approaches of drying
Drying method Net on ground Raised rack
Moisture (g/100g) 24.1 ± 3.7 22.4 ± 10.0
Fat (g/100g) 9.5 ± 0.8 9.0 ± 1.9
Ash (g/100g) 12.9 ± 4.2 14.0 ± 4.5
FFA (mgNaOH/g) 3.1 ± 0.7 3.5 ± 0.7
PV (mEqO2/kg)* 2.9 ± 4.3 6.7 ± 4.3
Protein (g/100g) 50.9 ± 6.0 47.8 ± 7.4
TBA (μmolMDA/g) 60.7 ± 12.0 56.8 ± 14.9
TMA (mgN/100g) 5.2 ± 4.4 4.6 ± 4.9
Log TPC (cfu/g) 6.6 ± 0.9 6.1 ± 1.0
Log TC (cfu/g)* 3.8 ± 0.8 2.9 ± 1.3
Log Y&M (cfu/g) 4.4 ± 1.1 4.0 ± 1.1
* indicates significant differences between the two drying methods. The mean difference is
significant at the 0.05 level
4.2.5: Quality changes brought about by pretreatment by the end of drying by the processors
The free fatty acids, protein, and fat content were significantly (P = 0.005, 0.001, and 0.001
respectively) higher while the ash content was significantly (P = 0.000) lower for the salted than
the unsalted silver cyprinid from all sites. Though insignificant, the salted silver cyprinid had
higher moisture content, peroxide value and the TBARS content (P = 0.070, 0.052, and 0.172
respectively) than none salted silver cyprinid from all sites. The total bacteria, total coliforms,
molds, and tri methyl amine content of the salted silver cyprinid was insignificantly (P = 0.235,
0.581, 0.188, and 0.334 respectively) lower than for none salted silver cyprinid from all sites.
(Table 6)
After blocking against bad weather in Kasekulo, the ash content, peroxide value and TBARS
content of the salted silver cyprinid was significantly (P = 0.000, 0.014, and 0.000 respectively)
higher than for none salted fish. On the other hand the fat, free fatty acids, protein content, and the
molds wher significantly (P = 0.003, 0.004, 0.002, and 0.047 respectively) lower for the salted

51
than for none salted silver cyprinid. Though not significant, the moisture content (P = 0.166) was
higher while the tri methyl amine content, total bacteria and total coliforms (P = 0.468, 0.647, and
0.996 respectively) of the salted silver cyprinid were lower than for none salted silver cyprinid.
(Table 7)
Table 6: Quality of Silver cyprinid dried with and without salt as a pre-treatment by the silver
cyprinid artisanal processors in four landing sites along the shores of Lake Victoria in Uganda
Pretreatment None Salted
Moisture (g/100g) 21.0 ± 7.7 27.2 ± 6.7
Fat (g/100g)* 9.9 ± 1.5 7.6 ± 0.4
Ash (g/100g)* 12.3 ± 2.8 19.7 ± 2.8
Protein (g/100g)* 52.9 ± 7.1 41.7 ± 3.7
FFA (mgNaOH/g)* 3.5 ± 0.7 2.6 ± 0.9
PV (mEqO2/kg) 4.8 ± 5.0 9.2 ± 4.6
TBA (μmolMDA/g) 63.7 ± 21.2 75.9 ± 5.3
TMA (mgN/100g) 6.4 ± 6.7 3.6 ± 3.7
Log TPC (cfu/g) 6.9 ± 1.3 6.2 ± 1.3
Log TC (cfu/g) 3.6 ± 1.1 3.3 ± 1.1
Log Y&M (cfu/g) 4.0 ± 1.1 3.4 ± 1.1
* indicates significant differences between the salted and unsalted fish. The mean difference is
significant at the 0.05 level
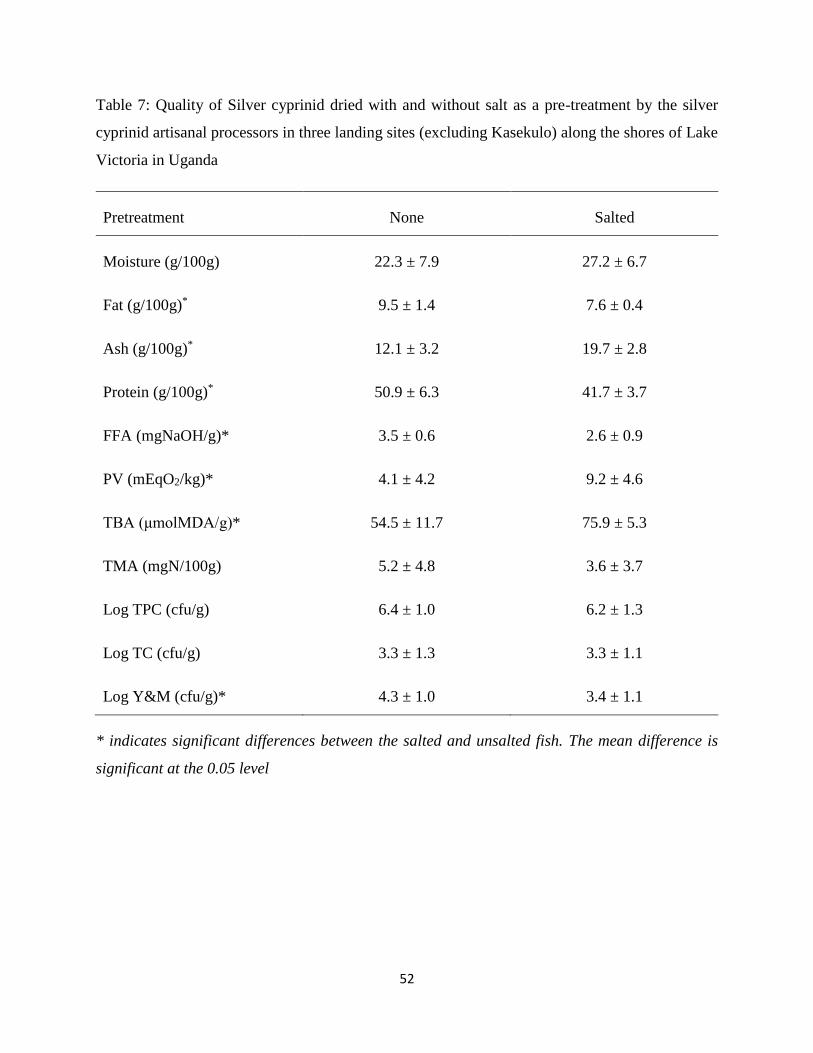
52
Table 7: Quality of Silver cyprinid dried with and without salt as a pre-treatment by the silver
cyprinid artisanal processors in three landing sites (excluding Kasekulo) along the shores of Lake
Victoria in Uganda
Pretreatment None Salted
Moisture (g/100g) 22.3 ± 7.9 27.2 ± 6.7
Fat (g/100g)* 9.5 ± 1.4 7.6 ± 0.4
Ash (g/100g)* 12.1 ± 3.2 19.7 ± 2.8
Protein (g/100g)* 50.9 ± 6.3 41.7 ± 3.7
FFA (mgNaOH/g)* 3.5 ± 0.6 2.6 ± 0.9
PV (mEqO2/kg)* 4.1 ± 4.2 9.2 ± 4.6
TBA (μmolMDA/g)* 54.5 ± 11.7 75.9 ± 5.3
TMA (mgN/100g) 5.2 ± 4.8 3.6 ± 3.7
Log TPC (cfu/g) 6.4 ± 1.0 6.2 ± 1.3
Log TC (cfu/g) 3.3 ± 1.3 3.3 ± 1.1
Log Y&M (cfu/g)* 4.3 ± 1.0 3.4 ± 1.1
* indicates significant differences between the salted and unsalted fish. The mean difference is
significant at the 0.05 level

53
4.2.6: Drying rate of silver cyprinid fished from Lake Victoria under the prevalent drying
practices on selected landing sites along Lake Victoria in Uganda
The Henderson and Pabis model was accepted for this research as it gave high values of R2,
𝑀𝑅 = 𝑎𝑒−𝑘𝑡
Where: a; drying model coefficient, k; drying constant, MR; Moisture ratio, t; drying time (h)
4.2.6.1: Drying rate for silver cyprinid salted and unsalted by the processors
The rate of drying of salted fish (0.228 Kg water/Kg db, hour) was lower, under the same
conditions than the rate of drying of the unsalted fish (0.251 Kg water/Kg db, hour). In Kasekulo
fish took over three rainy days to dry and the kinetics study stopped on the third day with the
moisture content of the fish still high, (47 % and 63 %). The rate of drying of the fish was 0.058
Kg water/Kg db, hour and 0.022 Kg water/Kg db, hour for the first and second raised rack
respectively as shown in Table 8.
Table 8: Summary of the drying kinetics of salted and unsalted silver cyprinid dried in Kasekulo
and Kiyindi
Site and sample code Drying rate (-K
Kg water/Kg
db, hour)
Equation of the curve
fitted using moisture
ratio (MR)
Coefficient of
determination
(R2)
Salted to 1g of salt per 100g of
wet fish, Kiyindi
0.228 𝑀𝑅 = 0.970 𝑒−0.228𝑡 0.974
None salted rack dried,
Kiyindi
0.251 𝑀𝑅 = 1.429 𝑒−0.251𝑡 0.950
Raised rack 1, Kasekulo (RR1) 0.058 𝑀𝑅 = 1.160 𝑒−0.058𝑡 0.620
Raised rack 2, Kasekulo (RR2) 0.022 𝑀𝑅 = 1.075 𝑒−0.022𝑡 0.620

54
Figure 14: A graph showing the rate of drying of salted and unsalted silver cyprinid dried in
Kiyindi
Figure 15: A graph showing the drying rate of silver cyprinid dried in Kasekulo on two raised
racks, (RR1, and RR2)
0
10
20
30
40
50
60
70
80
90
0 1 2 3 4 5 6 7 8
Mois
ture
con
ten
t
Duration
RR1
RR2
0
10
20
30
40
50
60
70
80
1 2 3 4 5 6
Mois
ture
Duration
1g/100g
Non salted

55
4.3: Evaluation of the effect of different salting concentrations and time on the quality
attributes and drying rate of silver cyprinid fished from Lake Victoria in Uganda
4.3.1: Quality changes as affected by salting time and concentration on fresh silver cyprinid
samples
The overall mean fat, protein, ash and moisture content, thiobarbituric acid reactive substances
(TBARs) peroxide value (PV), free fatty acids (FFA) total coliforms, and total microorganisms
were significantly different (P= 0.014, 0.037, 0.000, 0.001, 0.004, 0.044, 0.003, and 0.001
respectively) while the overall mean trimethylamine (TMA) and mold counts were not
significantly different (P = 0.984 and 0.231 respectively) for all fresh samples.
On carrying out a least significant difference test on the fresh samples, it was seen that the mean
moisture, ash, fat, and protein content, TMA, PV, FFA, total coliforms and mold counts of the fish
at capture (4) and those of the fish by the time it reached the shore (5) were not significantly
different (P = 0.701, 0.320, 0.370, 0.744, 0.119, 0.731, 0.428, 0.076 and 0.105 respectively) while
the mean TBARs and total microorganisms were significantly higher in the fish by the time it
reached the shore (P = 0.000 and 0.001 respectively).
The comparison between salted fresh fish at the shore and the unsalted fresh fish sample by the
time it reaches the shore reveals none significant differences in total microorganisms, mold counts,
TMA, protein and ash content (P = 0.067, 0.056, 0.178, 0.308, and 0.149 respectively). The total
coliforms, PV, TBARs, ash content of the salted samples were significantly higher than those of
the non-salted sample (P = 0.040, 0.030, and 0.007 respectively) while the FFA, and moisture
content of the salted samples were significantly lower than those of the non-salted sample (P =
0.20, 0.149).
The least significant test difference test on independent fresh samples showed that the non-salted
sample had the least TBARs, PV, and ash content followed by the sample that was salted to 4 g of
salt per 100 g of wet fish whereas the sample that was salted to 10 g salt per 100 g wet fish had the
highest values. The reverse of the order was observed with FFA, fat and moisture content. This
trend was the same when the same parameters were compared for the fish that was iced at capture.
The only difference is that there was some microbial spoilage as evidenced by a higher TMA mean
in the salted sample. (Table 9)

56
4.3.2: Quality changes in silver cyprinid as affected by salting time and concentration after
drying
At the end of drying, there was a significant (P ≤ 0.05) decrease in moisture content but with the
sample that was salted to 4 g of salt per 100 g of wet fish onshore having the least final moisture
content (14.9 ± 0.2 g/100 g). The Ash and protein content also significantly (P ≤ 0.05) increased
with the samples that were salted having higher ash content than the unsalted one in increasing
order of salt concentration. The fat content of the unsalted sample was significantly (P ≤ 0.05)
higher than that of all the salted samples whose differences were not significant.
The peroxide value and TBARS increased after drying for all samples with the salted samples
having higher final values and those salted onshore having even higher PV values than those salted
offshore. On the other hand, the samples salted offshore had higher TBARS content than those
salted onshore. The total extent of auto peroxidation was highest in the samples salted offshore to
10 g of salt per 100 g of wet fish (296.2 ± 5.7 μmolMDA/g) and lowest in the unsalted sample
(145.0 ± 1 μmolMDA/g). This trend was exactly opposite for the FFA content with the unsalted
sample having the highest FFA content and the sample salted to 10% weight of salt per weight of
wet fish offshore.
The total bacterial counts were highest (6.1 ± 0.1 log cfu/g) in the unsalted sample and lowest
(non-detectable) in the sample that was salted to 4 g of salt per 100 g of wet fish offshore. The
samples that were salted offshore had coliform counts below detectable limits and relatively lower
counts of yeasts and mold than those of the samples salted onshore. The unsalted fish had the
highest TMA content (5.5 ± 1.2 mgN/100 g) while the samples salted to 10 g of salt per 100 g of
wet fish offshore had the lowest (0.8 ± 0 mgN/100 g). (Table 9)

57
Table 9: Comparison of quality parameters of different concentrations and times of salting dried
on raised rack in Kiyindi landing site in Uganda
Fresh samples Dry samples
sample code 1 2 4 5 6 8 9 11 12
Moisture (g/100g) 70.9± 0.9a 66.4 ± 0.5b 76.1 ±1.3c 76.5±0.3c 15.3±0.3a 16.6±0.1b 15.1±0.1a 14.9±0.2a 16.4±0.1b
Ash (g/100g) 26.6±0.3a 10.8±0.3b 2.7±0.8c 2.2±0.1c 26.3±1.4a 25.7±0.1a 26.7±0.1a 22.1±0.3b 11.3±0.4c
PV (mEqO2/kg) 6.8±0.2abc 9.3±0.1b 2.5±0.7c 3.1±2.1c 9.0±0.5a 9.1±0.3a 14.62±2.9b 14.8±1.1b 7.5±0.7a
FFA (mgNaOH/g) 0.9±0.2a 0.6±0.0a 1.7±0.3b 1.5±0.3b 1.5±0.0a 2.2±0.0b 2.2±0.1b 2.3±0.0b 3.7±0.1c
Protein (g/100g) 15.6±0.8a 18.1±1.5b 15.6±0.4a 15.3±0.7a 49.9±0.8a 46.9±0.7b 46.3±0.8b 52.8±0.8c 48.7±0.9a
TBA (μmolMDA/g) 106.4±1.0a 166.3±0.5b 25.5±0c 49.7±1.8d 205.1±3a 296.2±5.7b 157.3±14.8c 150.7±1.1c 145.0±1c
TMA (mg N/100 g) 1.7±0a 1.7±0a 1.3±0.4a 2.1±0.4a 1.7±1.2a 0.8±0a 1.7±0a 1.7±0a 5.5±1.2b
Fat (g/100g) 12.6±0.3ab 10.9±0.9b 14.5±0.1a 13.6±0.2a 10.7±0.1a 11.1±0.2a 10.5±0.1a 11.3±0.2a 13.6±0.6b
Log TPC (cfu/g)* 6.2±0.1a 7.1±0.1b 6.7±0.0c 7.7±0.0d 0±0a 5.1±0.1b 3.7±0.1c 3.9±0c 6.1±0.1d
Log TC (cfu/g)* 3.8±0.1a 3.2±0.2b 2.2±0.1c 2.5±0.1c 0±0a 0±0a 1.3±0b 1.7±0.1b 1.3±0.3b
Log Y&M (cfu/g)* 3.2±0.1a 3.2±0.1a 3.2±0.1a 3.0±0.0a 0±0a 2.2±0.3b 2.8±0.7b 3.3±0bc 2.0±0bd
Different superscript letters in the same row indicate significant differences within the fresh and
within dry samples(P ≤ 0.05) 1 – salted offshore (4 % salt), 2 – salted offshore (10 % salt), 4 –
iced offshore immediately after catch, 5 – unsalted fish at shore, 6 – salted offshore (4 % salt), 8
– salted offshore (10 % salt), 9 – salted onshore (10 % salt), 11 – salted onshore (4 % salt), 12 –
non salted

58
4.3.3: Drying kinetics for the fish salted to 4g and 10g of salt per 100g of wet fish offshore
and onshore in Kiyindi
For the samples salted on shore, the rate of drying increased significantly (P = 0.000) with the
increase in salt concentration while the samples salted offshore showed no significant difference
(P = 0.543) though the sample salted to 10g of salt for 100g of wet fish showed a slightly higher
rate.
Table 10: Summary of the drying kinetics of fish fished and salted to 4 g and 10 g salt per 100 g
of wet fish onshore and offshore from Kiyindi landing site, Uganda.
Salt concentration
(g/100 g of wet
fish)
Time of
salting
Drying rate (- K
Kg water/Kg
db, hour)
Equation of the curve
fitted using moisture
ratio (MR)
Coefficient of
determination
(R2)
4 Offshore 0.105 𝑀𝑅 = 0.953 𝑒−0.105𝑡 0.979
Onshore 0.114 𝑀𝑅 = 1.099 𝑒−0.114𝑡 0.963
10 Offshore 0.108 𝑀𝑅 = 1.125 𝑒−0.108𝑡 0.966
Onshore 0.105 𝑀𝑅 = 0.964 𝑒−0.105𝑡 0.958

59
Figure 16: A graph showing the rate of drying of drying on silver cyprinid fished and salted to 4 g
and 10 g per 100 g of wet fish on shore and offshore from Kiyindi landing site Uganda.
0
0.2
0.4
0.6
0.8
1
1.2
1 2 3 4 5 7 8 9 10 11 12 13
Mo
istu
re r
atio
Duration
offshore 4g/100g
onshore 4g/100g
offshore 10g/100g
On shore 10g/100g

60
CHAPTER 5: DISCUSSION OF RESULTS
5.1: Assessment of the processing methods employed by the selected Silver Cyprinid
processors at community level on the shores of Lake Victoria in Uganda
5.1.1: Drying techniques and pretreatment used
All the processors questioned dried their fish under direct sunlight and this was mainly because of
customer demand and the relatively cheaper cost of the process. Preservation by drying ensures a
decrease in moisture content which has a detrimental effect on the proliferation of microbes that
depend on moisture to survive (Kilic, 2009). The ability of UV light to kill the microbes is also
taken advantage of by this process. (Onyango et al., 2015)
The main drying technique used by these processors was nets on ground citing cleanliness in terms
of no direct contact with the ground whereas a small fraction still dried their fish directly on the
beach sand. These traditional methods coupled with the poor handling practices exposes the fish
to contamination from domesticated animals (chicken, dogs and livestock) and wildlife (birds,
lizards, and flies) which are important carriers of pathogens ( Masetta & Kasiga, 2007; Jumbe,
Kibas, Kakongoro, & Tumwebaze, 2009; Oduor-Odote et al., 2010)
Drying on racks however, which was adopted by some processors has been suggested by other
researchers such as Masette, (2005); Mgawe & Mondoka, (2008) to reduce losses since fish can
easily be covered with water proof material during the rain. A higher quality product can also be
assured since pests and domestic animals or dirt cannot easily reach to contaminate the fish and a
shorter drying time because air would then pass over both sides of the fish. (Brigitte, Boogaard, &
Heijenen, 2004).
A small fraction of the processors questioned pretreated their fish with salt mainly due to customer
demand. Salting of the fish prior to drying has been recommended Mgawe & Mondoka, (2008) as
it ensures that during drying, the microorganisms are prohibited, enzyme activity is reduced and
insects and vermin are kept away (Nguyen, Dalsgaard, Phung, & Mara, 2007; Kabahenda et al.,
2009; Abeer et al., 2009; Alcicek & Atar, 2010; Ayub et al., 2011; Obodai, Nyarko, Boamponsem,
Coomson, & Aniwe, 2011)

61
5.1.2: Drying time and indicators of end of drying
Drying of fish at the landing sites selected averagely took between 7 to 9 hours after which the
processors deemed the fish dry enough to be sold. Jumbe et al.,(2009) also noted that the majority
of the artisanal processors of silver cyprinid in Mfangano and Rusinga Islands, Kenya dry their
fish for 6 – 8 hours on a good dry weather day and over 2 days otherwise. The drying time used is
typically one day on a sunny day (Kabahenda et al., 2009; Masette & Kwetegyeka, 2013).
The degree of dryness was checked by appearance and touching to feel its texture, brittleness and
dryness. According to Brigitte et al.,(2004), depending on the fish species, naturally dried fish
should take about 3 – 10 days to dry given that the conditions are good and that it does not rain. 7
– 9 hours is therefore not sufficient to bring the moisture content to 15% and below in order to
arrest the growth of molds and preserve its keeping quality.
5.1.3: Challenges faced by Silver cyprinid processors
Silver cyprinid processors faced a major challenge of bad weather conditions. It was asserted that
when it rained the drying of the fish took more than one day and this led to spoilage. Fish easily
spoils due to its high moisture content that encourages the proliferation of microbes and activity
of enzymes. This was also the main reason for losses experienced by the processors because spoilt
fish is not highly priced or diverted to animal feed. This has an effect to the poor who buy the poor
quality fish as this exposes them to potential health hazards or unwholesome products increasing
their vulnerability to disease (Akande & Diei-Ouadi, 2010).
Another major challenge these processors faced was birds and other animals walking over their
fish and eating it. This led to contamination of the fish by droppings and also loss of actual fish
through being eaten. Processors had to pay children to chase the birds away from the fish all day
and this meant that the children would miss school. This combined with high boat prices compared
to the selling price of dry fish negatively affected the economic balance of these processors.
Rotting of fish before it arrived at the shore was a challenge for the processors as they had
containers in the boats stipulated for each of them in the boat. Fish that is caught first during the
early hours of the night was either hauled directly onto the wooden plank of the boat without any
preservation strategy or placed into the containers offered to the fishermen by the processors. This

62
led to cross contamination of the fish between the fish and other fish or between the fish and the
wooden plank that was either rarely cleaned or cleaned using the contaminated lake water at the
shore hence spoilage of fresh fish by the time the fish reached the shore. According to Brigitte et
al.,(2004); Masetta & Kasiga, (2007); Bataringaya, (2007); Akande & Diei-Ouadi, (2010), to limit
the rate of deterioration, it is prudent to transport the fish to the shore as quickly as possible and it
must be kept in a clean boat and in shade or ice if possible.
To combat these challenges, processors who dry their fish on racks covered the fish with water
proof material until the rain stopped. In other instances it was hard to cover the fish and the
processors therefore the fish would usually be left to get spoilt and diverted to animal feed if the
rain doesn’t stop for the whole day. For fish that was almost dry by the time the rain started. The
processors stored it and brought it back out after the rain. Processors chased away birds by tying
strings around the drying surface, or by manually throwing stones at the birds and shouting.
Majority of the processors were satisfied with their fish and did not acknowledge losses since their
fish was sold as volumes which increased after drying or did not change if some physical losses
were faced, this observation was also witnessed by Jumbe et al., (2009)
5.1.4: Critical control points during the drying operation
Turning of fish while it is on the net and the state of the fish by the time it reaches the shore were
the main critical points assumed to affect the final quality of the fish. Turning of the fish ensured
that both sides of the fish had the chance to get in contact with the suns heat in order to have even
drying. The process of turning this fish involved the use of either a small plate on the racks or
brooms on the nets on the ground and rakes for the fish dried directly on the sand.
This turning led to injury of the fish tissue exposing it to the atmospheric air and light thence
enhancing lipid oxidation and also belly bursting causing leakage of enzymes from the viscera to
breakdown fats and proteins leading to both nutritional loss and autolytic oxidation (Bille &
Shemkai, 2006).The piling of fish in the boat without any preservation mechanisms in place, such
as cold storage, as it was being brought to the shore exposes the fish to external contamination
between the fish and also from the fishermen themselves (Bataringaya, 2007; Nguyen et al., 2007;
Jumbe et al., 2009).

63
During the drying process various avenues of contamination were cited starting with the spreading
technique utilized by the processors in Katosi. These processors used socks to cover their hands in
order to avoid scratches from the haplochromines scales. These socks were seldom washed and
would be a contamination point (Reij & Aantrekker, 2004).Throwing of fish from the height of
the top of the head to the ground would also lead to damage of the fish.(Okonkwo, Obanu, &
Oludusin, 1993)
The processors used basins to collect fish from the boat and could cause damage to the skin of the
fish as they scooped it out of the boats. During turning, using brooms on the nets on ground, or
rakes for the sand on the beach or even plates on the racks, fish is smashed against the drying
surface or the other fish and this leads to belly bursting and therefore spilling of gastral enzymes
promoting autolysis and proteolysis (Bille & Shemkai, 2006). Also during the turning process on
the nets on ground, processors sometimes step on the fish leading to even more degradation from
microbial contamination and spillage of enzymes. Another source of cross contamination is that
the fish that did not fully dry the day before is mixed with the fish that is being dried the next day.
5.1.5: Final consumer of the product
The highest percentage of the processors questioned dried their fish for human consumption citing
profit and cleanliness of the fish after using improved methods as reasons for this end user
preference. Fish for human consumption is sold at higher prices than that for animal feed. Many
projects including FAO and LVEMP have been agitating for the change in focus towards
processing this fish from animal feed to feed the human population that is low in animal protein
consumption and interventions are underway in form of racks both in Kiyindi and in Ssenyondo.

64
5.2: Determination of the effect of the prevalent silver cyprinid drying practices on the
quality attributes and drying rate of silver cyprinid fished from Lake Victoria in Uganda
5.2.1: Changes in proximate composition after drying
5.2.1.1: Sites variation
The drying process at the landing sites led to the reduction in moisture content with Kiyindi having
the highest final mean moisture content. This was partly because the processors who salted their
fish sold it by weight and loss in moisture would also mean a general loss in weight and therefore
income. The average moisture content for all sites at the end of the drying process is above the
standard 12 % (East African Standard., 2014) and the recorded 15 % which implies that the growth
of yeasts and molds is not completely stopped and would most probably affect the keeping quality
of this fish. (Oduor-Odote et al., 2010).
Processors would prefer to get their money back the same day that the fish is landed and would
therefore sell their fish after only a day’s drying which is not enough for drying which is not enough
to reduce the moisture content to below 15 %. Protein content increased after drying and this was
due to the reduction in moisture causing the aggregation of the protein in the fish. (Raman &
Mathew, 2014; Baylan et al., 2015)
The ash content was not significantly different as sodium chloride added as salt also contributed
to the ash of the fish and cannot therefore be considered as a sign of sand contamination. The ash
in all the sites was lower than the standard 15 % (East African Standard., 2014) Kasekulo’s
relatively higher fat and protein content could be explained by the lower moisture content
registered for the site since lower moisture leads to aggregation of the matrix fat and protein.
5.2.1.2: Drying methods variation
The fat content of the silver cyprinid dried on racks was higher than that dried on nets on ground
because of higher dripping of the fat from the racks (Sablani et al., 2003; Jumbe et al., 2009). This
could also be attributed to lipid oxidation (section 5.2.2) as a lot of the fat was converted into
oxyperoxides and TBARs due to increased salting. The moisture content of the fish dried on racks
was lower at the end of drying because drying on racks allows air to evenly pass on both sides of
the fish increasing the rate of evaporation. (Kabahenda et al., 2009). Regardless of this both
65
methods ended up with a moisture content that was above the standard 12 % (East African
Standard., 2014) and the stipulated 15% to completely stop microbial growth (Oduor-Odote et al.,
2010) due to the time they spent drying.
The ash content of the fish dried on the racks was higher because of salting. The largest number
of processors that salted their fish dried it on racks and this meant addition of inorganic sodium to
the fish and consequently ash (Abeer et al., 2009). All the methods ensured an ash content of below
the standard 15 % (East African Standard., 2014). The lower protein content could be attributed
dripping from rack together with the water and concentration of the proteins as moisture reduces.
(Raman & Mathew, 2014)
5.2.1.3: Pretreatment variations
The significant reduction in fat was probably due to the increased autoxidation that is caused by
salt (Byungrok et al., 2011) a lot of the fat was therefore converted to different oxidation products.
The reduction in protein content was due to the loss of salt soluble proteins during salting (Abeer
et al., 2009) addition of salt reduces the rate of drying of fish by formation of a crust (Guizani et
al., 2014) since this fish is dried for one day, the moisture content of the salted fish by the end of
the drying process will be higher than that of the unsalted one but all above the standard 12 %
(East African Standard., 2014) and the stipulated 15 % to completely stop microbial growth
(Oduor-Odote et al., 2010). The high ash is due to the presence of excess inorganic sodium metal
from the sodium chloride added to the salted fish explaining why the ash content of salted fish is
above the standard 15 % (East African Standard., 2014).

66
5.2.2: Lipid oxidation changes after drying
5.2.2.1: Sites variation
Peroxide value and the acid value were significantly higher in the dry samples which therefore
implies that drying did not completely stop peroxidation or autolysis. The high peroxide value and
low acid value in Kiyindi was probably due salt as sodium chloride has been reported to increase
the rate of autoxidation and reduce enzyme action (Medina-vivanco, Sobral, & Hubinger, 2006;
Byungrok, Cordray, & Dong, 2011). This effect is cancelled out by the poor handling practices
coupled by weather variations in Kasekulo as evidenced by the high TBARS and free fatty acid
value all the sites had a higher peroxide value and free fatty acid content than the standard 5
meqO2/Kg and 3 mgKOH/g (CODEX, 2013) respectively.
5.2.2.2: Drying methods variation
Lipid oxidation had reached more advanced stages in the overall raised rack dried silver cyprinid
than in the ground net though the differences were not significant. This could be attributed to the
addition of salt as most of the processors that did the salting dried their fish on racks and also due
to the bad weather conditions that were prevalent in Kasekulo. Without Kasekulo to remove
variation due to weather conditions, it was realized that the extent of lipid oxidation had gone
further in the net dried fish as evidenced by the higher secondary oxidation product (TBARs).
Nevertheless, the higher FFA content could be attributed to poor handling of the fish in the boats
as the initial quality of the raw fish affects its performance in processing (Abeer et al., 2009).
5.2.2.3: Pretreatment variation
Salt, being a pro-oxidant for auto oxidation by disrupting the structural integrity of the cell
membrane enabling auto oxidation catalysts to access the lipid substrates, (Byungrok et al., 2011)
could be the reason for the higher auto oxidation products (peroxides and TBARs) in the salted
fish. On the other hand salt is hygroscopic (Abeer et al., 2009) and therefore lowered the water
activity of the fish making it unavailable for enzymatic action and thus lowering the rate of
autolytic oxidation evidenced by the lower free fatty acid content in the salted fish.

67
5.2.3: Microbial spoilage after drying
5.2.3.1: Sites variation
The handling of the fish while in the boat and immediately after landing had an effect on the
microbial contamination as evidenced by the high total bacterial and total coliforms count in the
fresh fish (Masetta & Kasiga, 2007). Apart from in Kasekulo where drying took three days due to
the weather, drying of fish led to a significant decrease in total bacterial and coliforms count though
all were above the recommended 105 cfu/g and undetectable for the total bacteria and coliforms
respectively (East African Standard., 2014). The increase in counts of the yeasts and molds in all
sites was probably because yeasts and molds thrive better in lower moisture content environments.
Due to the better handling in terms of salting and raised rack drying of fish, the fish in Kiyindi had
lower yeasts and molds than the standard 104 cfu/g. (East African Standard., 2014)
Their proliferation would be greatly reduced if the moisture content of this fish was reduced to
below 15 % (Junaid, Olarubofin, & Olabode, 2010; Oduor-Odote et al., 2010) which was not the
case in all the drying sites. Though non-significant, the higher TMA content of the dry fish implied
that the fish had undergone more microbial spoilage (Krisen et al., 2014) with Kasekulo’s having
undergone the most spoilage due to the higher microbial population.
5.2.3.2: Drying method variation
The bad weather conditions in Kasekulo, where fish took over three rainy days to dry, could have
brought about the insignificantly higher total microbial counts and microbial spoilage as these
microbes thrive in high moisture content conditions that were prevalent in the fish for a longer
time in Kasekulo. On the other hand, the total coliforms, which come due to poor handling, and
the fungi counts, that thrive in low moisture content foods, were lower in the raised rack dried fish
signifying better quality.
After the removal of Kasekulo in order to exclude bad weather conditions in the analysis, it was
observed that the microbial contamination was reduced by drying the fish on raised racks. This is
in line with the observations of Brigitte et al.,(2004) and the recommendations of Masette, (2005);
Mgawe & Mondoka, (2008). Since the fish is dried above the ground, contamination from ground
microbes is prevented. Turning the fish on the racks is done using small plate as compared to the

68
brooms used for the same purpose in the nets on the ground reducing the opportunity for cross
contamination.
The processors who dried the fish on nets on the ground easily stepped on the fish during turning
using brooms, animals walked over the fish as it dried thus damaging the fish making it easier for
the microbes to enter the fish flesh. Animals also as they passed over the fish that was drying on
nets contaminated it with droppings (Appendix A, Plate 5 (a)) increasing the microbial count.
5.2.3.3: Pretreatment variation
Salt being hygroscopic (Abeer et al., 2009) lowered the water activity of the fish making it
unavailable for microbial growth. This is evidenced by the lower counts and the microbial spoilage
in terms of total bacterial counts, total coliforms, fungi and the TMA content respectively.
Artisanal salting had a positive effect on the yeasts and molds of the dry fish as their counts were
below the acceptable 104 cfu/g (East African Standard., 2014). On the other hand the total bacterial
and coliform counts were above the standard 105 cfu/g and undetectable (East African Standard.,
2014) regardless of the pretreatment used.
5.3: Evaluation of the effect of different salting concentrations and time on the quality
attributes and drying rate of silver cyprinid fished from Lake Victoria in Uganda
5.3.1: Proximate, microbial and lipid oxidation changes in the fresh fish by the time it reaches
the shore
The reduction in moisture content for fresh samples with the increase in salt concentration is
because salt is hygroscopic and therefore absorbs water molecules from the fish (Graiver, Pinotti,
Califano, & Zaritzky, 2006; Kituu et al., 2007). More salt particles are available to enter any voids
in the fish sample for the same purpose with increase in salt concentration (Kituu et al., 2009). The
increase in protein content with reduction in moisture content in the fresh samples by the time they
reached the shore was probably due to the aggregation of proteins. (Baylan et al., 2015) the
reduction in fat content with the increase in salt concentration could be explained by the fact that
this fat was oxidized to various lipid oxidation products.
The increase in PV and TBARS with the increase in salt concentration is probably because salt is
a pro-oxidant. This is because of its ability to disrupt the structural integrity of cell membrane

69
enabling catalyst easy access to lipid substrates (Byungrok et al., 2011). The ability of salt to
inhibit enzyme activity (Alcicek & Atar, 2010) could be the reason why the free fatty acid content
of the fresh samples decreased with increase in salt concentration. The increase in PV and TBARS
had a negative effect on the fat content as evidenced by the decrease in fat content with increase
in salt concentration.
The sample salted to 4 g of salt per 100 g of wet fish onshore had the highest protein content
mainly because of its lowest moisture content as this enables aggregation and concentration of
proteins. Salt, being a pro-oxidant due to its ability to release free ionic iron from iron containing
molecules (Byungrok et al., 2011) was probably the reason as to why the extent of auto
peroxidation was highest in the sample salted to 10 g of salt per 100 g of wet fish offshore and
lowest in the unsalted sample. On the other hand, salt reduces the activity of enzymes due to its
hypertonic effect and this could be why the autolysis was highest in the unsalted sample and lowest
in the sample salted to 10 g of salt per 100 g of wet fish offshore.
5.3.2: Proximate, microbial and lipid oxidation changes of silver cyprinid at the end of drying
All the samples had peroxide values above the acceptable limit of 5 meqO2/kg (CODEX, 2013),
and this increased with increasing salt concentration. The samples salted offshore also had lower
values than those salted onshore. The free fatty acid content of all the salted samples was below
the acceptable limit of 3 mgNaOH/g (CODEX, 2013) which was not so for the unsalted sample.
The salting time had an effect on both the auto oxidation and autolysis because its action begins
immediately after salting and that’s why the samples salted offshore had higher degrees of auto
peroxidation and lower levels of autolysis than those salted onshore. The same effect was observed
for the salting concentration as more salt particles were available for the above purpose with higher
concentrations of salt. The fat content of the unsalted sample by the time of drying therefore was
highest because a lot of the fat was degraded to oxyperoxides and TBARS in the salted samples.
Offshore salted samples had coliforms below detectable limits and thence met the East African
Standard, (2014) while those salted onshore and the unsalted sample had detectable coliforms. The
unsalted fish had total bacterial counts that were above the acceptable limits of 105/g (East African
Standard., 2014). All the samples had yeasts and molds below the standard 104/g (East African
Standard, 2014). TMA content reduced with increasing salt concentration. Although the unsalted

70
sample had a significantly higher TMA content than the salted ones, all the samples had a TMA
content below the acceptable limit of 15mgN/100g (Karim et al., 2015)
Salt, being hygroscopic, lowered the water activity of the fish making it unavailable for microbial
growth. This is evidenced by the higher total bacterial load in the unsalted sample. The total
coliforms that are brought about mainly by poor handling practices (Brigitte et al., 2004) and the
yeasts and molds that thrive in low moisture conditions were not significantly different according
to salt concentration time and status. The reduction of TMAO to TMA (Huss, 1995) was highest
in the unsalted fish because this reduction is carried out by bacteria that were significantly higher
in that sample.
Drying rate
The observed reduction in rate of drying with the increase in salt concentration was because excess
salt in fish can form a crust on the fish surface reducing the rate of diffusion of water from the
inside of the fish. (Guizani et al., 2014; Mujaffar & Sankat, 2006)This was also observed by
(Tanimowo, 2015) on salted snoek in South Africa. Fish in Kasekulo took over three days to reach
a moisture content of over 40% due to the wet weather conditions at the time of drying. The rate
of drying was therefore very low and this affected the overall quality of this fish.

71
CHAPTER 6: CONCLUSIONS AND RECOMMENDATIONS
6.1: Conclusions
This study revealed two main drying strategies for human grade silver cyprinid including nets on
ground and on raised racks. The largest number of processors (41.7 %) dried their fish on nets on
ground. All animal feed silver cyprinid was dried directly on the ground at the beach. Salting was
done by a few processors as per customer demand and this salted fish was mostly for export to
Rwanda and Congo.
The average moisture content (20.5 ± 5.4 %), peroxide value (5.2 ± 3.7 meqO2/Kg), free fatty acids
content (3.3 ± 0.8 mgNaOH/g), total bacteria (7.0 ± 0.9 logcfu/g), total coliforms (3.7 ± 0.9
logcfu/g), yeasts and mold counts (4.3 ± 0.9 logcfu/g) were greater for all sites than the standard
values (12 %, 5 meqO2/Kg, 3 mgNaOH/g, 5 logcfu/g, undetectable, 4 logcfu/g for moisture
content, peroxide value, free fatty acids content, total bacteria, total coliforms, and molds
respectively) which poses a health concern. Salting led to a reduction in the fat and protein content
of the fish. It also reduced all the microbiology counts and increased the extent of lipid oxidation.
There was also a reduction in the rate of drying with increase in salt concentration.
Regardless of the lower fat and protein content, raised rack drying gave better microbial and lipid
oxidation results than the net on ground drying. Salting offshore gave better microbial results. The
concentration of salt recommended for use from this study is 4 g of salt per 100 g of wet fish since
all samples produced higher peroxidation results than the standard yet 4 g of salt per 100 g of wet
fish produced acceptable microbial levels. Increasing the salt concentration to 10 g per 100 g of
wet fish would not be necessary as the microbial differences would not significantly change yet
the extent of peroxidation would increase.

72
6.2: Recommendations
Sensitization of these processors on the standard operating procedures of silver cyprinid
processing and enforcement of the same is suggested to maintain availability of high
quality silver cyprinid.
Improved drying strategies such as raised racks is suggested for enforcement as many
processors still prefer the cheaper nets on ground method to increase the quality of locally
processed human grade silver cyprinid.
The use of salt though in moderation is suggested for encouragement in order to improve
the quality of dried silver cyprinid.
Need to form innovation platforms where the people dealing in this fish can come
together devise means of improving the quality and hence value.
Further studies are needed to determine the effect of the more improved methods including
solar tent and solar tunnel and convectional drying on the quality attributes and drying
kinetics of silver cyprinid.

73
REFERENCES
Abeer, M. H. K., Manal, M. A. A. E., Samah, M. F. E., & Abdel, K. S. A. (2009). Effects of Sun
Drying and Salting on the Nutritive Value of Oreochromis niloticus (Trewavas). Journal
of Graduate Studies, vol. 4 retrieved on the 20th of August, 2017 from
http://repository.neelain.edu.sd:8080jspui/bitstream/123456789/1392/1/4_3.pdf
Abeywardena, M. Y., & Head, R. H. (2001). Longchain n-3 porlyunsaturated fatty acids and blood
vessel function. Cardiovascular Research, 52, 361-371.
Akande, G., & Diei-Ouadi, Y. (2010). Post-harvest Losses in Small-scale Fisheries: Case Studies
in Five Sub-Saharan African Countries. Fisheries and Aquaculture Technical Paper. FAO,
Rome, 550, 72.
Alcicek, Z., & Atar, H. H. (2010). The Effects of salting on chemical quality of vacuum packed
liquid smoked and traditional smoked rainbow trout (Oncorhyncus mykiss) fillets during
chilled storage. Journal of Animal and Veterinary Advances, 9(22), 2778 – 2783.
AOAC. (2005). Official Methods of Analysis (18 ed.). AOAC International Gaithersburg, MD.
Augood, C. (2008). Oily fish consumption, dietary docosahexaenoic acid and eicosapentaenoic
acid intakes, and associations with neovascular age-related macular degeneration. .
American Journal of Clinical Nutrition, 88(2), 398-406 (abstract).
Ayub, V. O., Ofulla, Jackson, H. O., Onyuka, Wagai, S., Anyona, D., Dida, O. D., Gichuki, J.
(2011). Comparison of Different Techniques for Processing and Preserving fish
Rastrineobola argentea from Lake Victoria, Kenya. International Journal of Biological,
Biomolecular, Agricultural, Food and Biotechnological Engineering, 5 (12), 906-910. doi:
scholar.waset.org/1999.1/4419
Basunia, M. A., Al-Handali, H. H., Al-Balushi, M. I., Rahman, M. S., & Mahgoub, O. (2011).
Drying of Fish Sardines in Oman Using Solar Tunnel Dryers. Journal of Agricultural
Science and Technology, B1(2011), 108-114.

74
Bataringaya, A. (2007). Analysis of quality deterioration at critical steps/points in fish handling in
uganda and iceland and suggestions for improvement. Fisheries Training Programme, The
United Nations University.
Baylan, M., Mazi, G., Ozcan, D., Ozcan, Bahri, N., Akar, M., & Conskun, A. (2015). Changes of
Electrophoretic Protein Profiles of Smoked and Marinated Rainbow Trout (Oncorhynchus
mykiss) During Refrigerated Storage. Journal of Agricultural Sciences, 21(262–269).
Bille, P. G., & Shemkai, R. H. (2006). Process development, Nutrition and sensory Characteristics
of Spiced-smoked and Sun-dried Dagaa (Rastrineobola argentea) from Lake Victoria,
Tanzania. African Journal Of Food Agriculture Nutrition and Development, 6(2), 1-12.
Bligh, E. G., & Dyer, W. S. (1959). A rapid method of total lipid extraction and purification.
Canadian J Biochem and Physio, 37, 911–917.
Boran, G., Karacam, H., & Boran, M. (2006). Changes in the quality of fish oils due to storage
temperature and time. Food Chemistry. 73, 255-261
Brigitte, M. B., Boogaard, B., & Heijenen, C. (2004). Preservation of fish and meat.
[http://www.fao.org/DOCREP/T0713E/T0713E00.htm]. retreived on the 14th of August
2017
Bucyanayandi, T. (2011). Draft National Policy on Fisheries Management and Development of
Small Fishes. Department of Fisheries Resources, Entebbe, Uganda
Byungrok, M., Cordray, J. C., & Dong, A. U. (2011). Effect of NaCl, Myoglobin, Fe(II), and
Fe(III) on Lipid Oxidation of Raw and Cooked Chicken Breast and Beef Loin. Animal
Industry Report, AS 657, ASL R2578, http://lib.dr.iastate.edu/ans_air/vol657/iss1/2.
Ceirwyn, J. S. (1995). Analytical Chemistry of Foods. First Edition. Springer Science+Business
Media Dordrecht. U.K. 178pp DOI: 10.1007/978-1-4615-2165-5
Chol, S. P. (2005). Stability and quality of fish oil during typical domestic application. Project.
Wonsan University of Fisheries, Korea.

75
CODEX. (2013). Proposed Draft CODEX Standard for Fish Oils, CODEX ALIMENTARIUS
COMMISSION, CX/FO 13/23/3.
Cyprian, O. O., Nguyen, M. V., Sveinsdottir, K., Tomasson, T., Thorkelsson, G., & Arason, S.
(2015). Influence of blanching treatment and drying methods on the drying characteristics
and quality changes in dried sardine (Sardinella gibbosa) during storage. Drying
Technology, under review.
Dagne, T., Guya, M., Abera, S., & Bekele, F. G. (2016). Effect of Drying Methods and Pre-
Treatments on Nutritional Value and Sensory Quality of Fish (Oreochromis niloticus,
Pylodictis olivaris and Cyprinus carpio) Species Commonly Used in Gambella Region.
Turkish Journal of Agriculture - Food Science and Technology, 4(1), 22-30.
Delgade, C. L., Wada, M. W. N., Rosegran, S. M., & Ahmed, M. (2003.). Fish for 2020. Supply
and demand in changing global markets. International Food Policy Research Institute,
Washington, D.C. and World Fish Centre, Penanng, Malaysia.
DFR. (2012). Department of Fisheries Resources, Annual report: Background to the Budget.
Egan, H., Kirk, R. S., & Sawyer, R. (1981). Pearson’s chemical analysis of foods, (8 ed.). Essex:
Longman Scientific and Technical.
FAO. (2008). Securing regional supply in aquatic products: prospects from the FAO postharvest
loss assessment case studies. Paper presented at the Committee for Inland Fisheries and
Aquaculture of Africa, Fifteenth Session. , Lusaka, Zambia.
Fraser, O., & Sumar, S. (1998). Compositional changes and spoilage in fish. Nutr. Food Sci., 5,
275-279.
Fred, D. H. (2007). How to Preserve Food by Salting. Precautions and Effects. Journal of Applied
Microbiology, 16(1853-1858).
Garcia, G. N., Aguilar, R. P., Alvarado, L. B., & Garcia, J. O. (2004). Characterization of the lipid
composition and natural antioxidants in the liver oil of Dasyatis brevis and Gymnura
marmoata rays. Food Chemistry, 87, 89-96.

76
Ghaly, A. E., Dave, D., Budge, S., & Brooks, M. S. (2010). Fish Spoilage Mechanisms and
Preservation Techniques: Review. American Journal of Applied Sciences, 7(7 ), 859-877.
Graiver, N., Pinotti, A., Califano, A., & Zaritzky, N. (2006). Diffusion of sodium chloride in pork
tissue. Journal of Food Engineering, 77, 910-918.
Gram, L., & Dalgaard, P. (2002). Fish spoilage bacteria — problems and solutions. Current
Opinion in Biotechnology, 13, 262–266.
Guizani, N., Rahman, M. S., Al-Ruzeiqi, M. H., Al-Sabahi, J. N., & Sureshchandran, S. (2014).
Effects of brine concentration on lipid oxidation and fatty acids profile of hot smoked tuna
(Thunnus albacares) stored at refrigerated temperature. J Food Sci Technol, 51(3), 577–
582. doi: 10.1007/s13197-011-0528-4
Gustavo, V. B., Anthony, J. F., Jr., Shelly, J. S., & Theodore, P. L. (2007). Water Activity in
Foods, Fundermentals and Applications: Blackwell Publishing Ltd.
Hultin, H. O. (Ed.). (1994). Oxidation of Lipids in Seafoods. (1 ed.). London, UK.: Blackie
Academic and Professional.
Huss, H. H. (1995). Quality and Quality Changes in Fresh Fish. FAO Fisheries Technology paper
Vol. 348. Rome.
Ibengwe, L. (2010). Reducing Post-harvest losses of Artisanal Dagaa (Rastrineobola Argentea)
Fishery in Lakee Victoria, Tanzania: A cost and benefit analysis: Fisheries Training
programme P.O. Box 1390, Skulagata 4 120 Reykjavik, Iceland.
Immaculate, J., Sinduja, P., & Jamila, P. (2012). Biochemical and microbial qualities of Sardinella
fimbriata sun dried in different methods. International Food Research Journal, 19(4),
1699-1703
Isengard, H. D. (2007). Water Content: One of the Most Important Properties of Food. Food
Control, 12(7), 395- 400.

77
Jain, D. (2006). Determination of Convective Heat and Mass Transfer Coefficients for Solar
Drying of Fish. Biosystems Engin, 94(3), 429–435. doi:
10.1016/j.biosystemseng.2006.04.006
Jain, D., & Pathare, P. B. (2007). Study the drying kinetics of open sun drying of fish. Journal of
Food Engineering, 78(2007), 1315–1319. doi: 10.1016/j.jfoodeng.2005.12.044
Jumbe, J., Kibas, P., Kakongoro, D., & Tumwebaze, R. (2009). Current State of Handling,
Processing and Quality of Omena (Rastrionebola argentea) in Mfangano and Rusinga
Islands, Kenya. Fisheries & Aquaculture Cluster Proceedings, 57 - 68. doi: 978-9970-452-
01-9
Junaid, S. A., Olarubofin, F., & Olabode, A. O. (2010). Mycotic contamination of stockfish sold
in Jos, Nigeria. Journal of Yeast and Fungal Research, 1(7), 136 – 141.
Kabahenda, M. K., Amega, R., Okalany, E., Husken, S. M. C., & Heck, S. (2011). Protein and
Micronutrient Composition of Low-Value Fish Products Commonly Marketed in the Lake
Victoria Region. World Journal of Agricultural Sciences, 7 (5 ), 521-526, .
Kabahenda, M. K., & Hüsken, S. M. C. (2009). A review of low-value fish products marketed in
the Lake Victoria region Regional Programme Fisheries and HIV/AIDS in Africa,
Investing in Sustainable Solutions: The World Fish Center Project Report.
Kabahenda, M. K., Omony, P., & Hüsken, S. M. C. (2009). Post-harvest handling of low-value
fish products and threats to nutritional quality: a review of practices in the Lake Victoria
region. Fisheries and HI V/AIDS in Africa: Investing in Sustainable Solutions: WorldFish
Center.
Karim, N. K., Nasorriah, N., Buhri, A., & Marzuki, I. (2015). Effect of salt and ozonated-slurry
ice on the quality indices of tiger grouper (Epinephelus fuscoguttatus). Journal of
Sustainability Science and Management, 10(2), 97-102.
Kawarazuka, N., & Be´ne, C. (2011). The potential role of small fish species in improving
micronutrient deficiencies in developing countries: building evidence. Public Health
Nutrition, 14(11), 1927–1938 doi: 10.1017/S1368980011000814

78
Kilic, A. (2009). Low temperature and high velocity (LTHV) application in drying: Characteristics
and effects on the fish quality. Journal of Food Engineering, 91, 173-182.
Kirk, R. S., & Sawyer, R. (1991). Pearson’s Composition and Analysis of foods. Ninth edition
Longman Scientific and Technical, Harllow. Essex. UK
Kituu, G. M., Shitanda, D., Kanali, C. L., Mailutha, J. T., Njoroge, C. K., Wainaiana, J. K., & O.,
O. P. M. (2009). Influence of Brining on the Drying Parameters of Tilapia (Oreochromis
Niloticus) in a Glass-Covered Solar Tunnel Dryer. Agricultural Engineering International:
the CIGR Ejournal., 11(1349).
Kituu, G. M., Shitanda, D., Silayo, V., Odote, P., & Bongyereire, J. (2007). Effect of brining on
the drying rate of tilapia (Oreochromis niloticus) in a solar tunnel dryer. Fisheries &
Aquaculture Cluster Proceedings, 88 - 98. doi: 978-9970-452-01-9
Krisen, S. S., Setiaji, B., Trisunaryanti, W., & Pranowo, H. D. (2014). Trimethylamine (TMA)
profile of White snapper fillet (lates calcarifer) after giving liquid smoke of coconut shell.
Asian Journal of Science and Technology, 5(9), 573-576.
Kristinsson, H. G., & Rasco, B. A. (2000 ). Fish Protein Hydrolysates: Production, Biochemical,
and Functional Properties. Critical Reviews in Food Science and Nutrition, 40(1), 43-81.
doi: 10.1080/10408690091189266
Ladikos, D., & Lougovois, V. (1990). Lipid Oxidation in Muscle Foods: A Review. Food
Chemistry, 35(1990), 295-314. doi: 0308-8146/90/$03"50
Legros, D., & Masette, M. (2010). Testing of different processing methods for Mukene for human
consumption and fish meal in Uganda. Mission Report - IND017UGA Secretariat of ACP
Group of States.
Liu, S., Zhang, C., Hong, P., & Ji, H. (2005). Concentration of docosahexaenoic acid (DHA) and
eicosapentaenoic acid (EPA) of tuna oil by urea complexation: optimization of process
parameters. Food Chemistry.

79
Malle, P., & Poumeyrol, M. (1989). A new chemical criterium for the quality control of fish:
Trimethylamine /Total Volatile Basic Nitrogen (%). Journal of Food Protection, 52, 419-
423.
Malle, P., & Tao, S. H. (1987). Rapid quantitative determination of trimethylamine using steam
distillation. . Journal of Food Protection, 50, 756–760.
Masetta, M., & Kasiga, T. (2007, 14 - 18 November, 2005). The effect of size and handling
temperatures on rigor mortis phenomenon in Nile Tilapia (Oreochromis niloticus). Paper
presented at the FAO Workshop on Fish Technology, Utilization and Quality Assurance,
Bagamoyo, United Repulic of Tanzania.
Masette, M. (2005). Low-Cost Processing technologies for Mukene (Rastrineobola argentea)
Report. Paper presented at the FAO workshop on fish technology, utilization and Quality
assurance Bagamoyo, United Republic of Tanzania, 14–18 November 2005: FAO
Fisheries Report No. 819.
Masette, M., & Kwetegyeka, J. (2013). The effect of artisanal preservation methods on nutritional
security of “Mukene” Rastrineobola argentea caught from Lakes Victoria and Kyoga in
Uganda. Uganda Journal of Agricultural Sciences,, 14 (2), 95 - 107
Medina-vivanco, M. L., Sobral, P. J. A., & Hubinger, M. D. (2006). Kinetic aspects of salting
Tilapia fillets using small volumes of brine. Brazilian Journal of Food Technology, 9(1),
9 – 17.
Mgawe, I. Y., & Mondoka, E. M. (2008). Post-Harvest Fish Loss Assessment on Lake Victoria
Sardine Fishery in Tanzania – Rastrineobola Argentea. Report presented at The FAO
Second Workshop On Fish Technology, Utilization and Quality Assurance in Africa,
Agadir, Morocco, 24–28 November 2008.
Muhoozi, L. I., & Mbabazi, D. (2010). Final report of the fisheries catch assessment survey (CAS)
in the Uganda waters of Lake Victoria. Implementation of a fisheries managemnent plan
(IFMP) project for Lake Victoria.
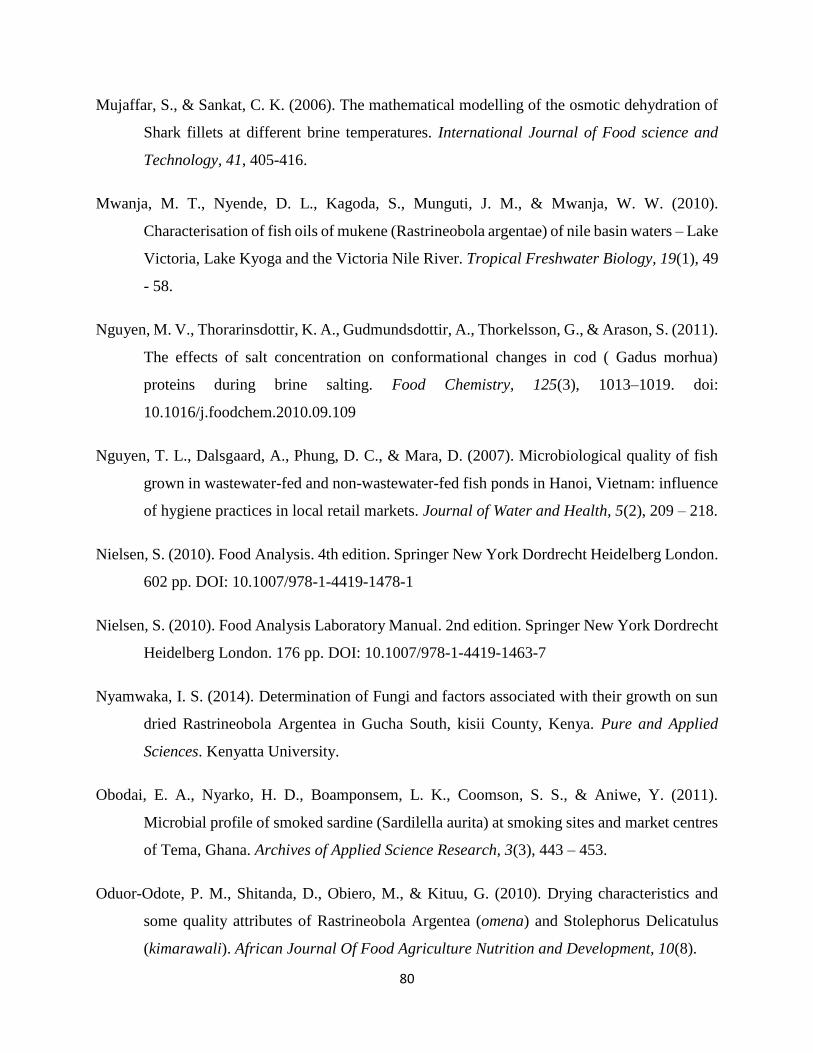
80
Mujaffar, S., & Sankat, C. K. (2006). The mathematical modelling of the osmotic dehydration of
Shark fillets at different brine temperatures. International Journal of Food science and
Technology, 41, 405-416.
Mwanja, M. T., Nyende, D. L., Kagoda, S., Munguti, J. M., & Mwanja, W. W. (2010).
Characterisation of fish oils of mukene (Rastrineobola argentae) of nile basin waters – Lake
Victoria, Lake Kyoga and the Victoria Nile River. Tropical Freshwater Biology, 19(1), 49
- 58.
Nguyen, M. V., Thorarinsdottir, K. A., Gudmundsdottir, A., Thorkelsson, G., & Arason, S. (2011).
The effects of salt concentration on conformational changes in cod ( Gadus morhua)
proteins during brine salting. Food Chemistry, 125(3), 1013–1019. doi:
10.1016/j.foodchem.2010.09.109
Nguyen, T. L., Dalsgaard, A., Phung, D. C., & Mara, D. (2007). Microbiological quality of fish
grown in wastewater-fed and non-wastewater-fed fish ponds in Hanoi, Vietnam: influence
of hygiene practices in local retail markets. Journal of Water and Health, 5(2), 209 – 218.
Nielsen, S. (2010). Food Analysis. 4th edition. Springer New York Dordrecht Heidelberg London.
602 pp. DOI: 10.1007/978-1-4419-1478-1
Nielsen, S. (2010). Food Analysis Laboratory Manual. 2nd edition. Springer New York Dordrecht
Heidelberg London. 176 pp. DOI: 10.1007/978-1-4419-1463-7
Nyamwaka, I. S. (2014). Determination of Fungi and factors associated with their growth on sun
dried Rastrineobola Argentea in Gucha South, kisii County, Kenya. Pure and Applied
Sciences. Kenyatta University.
Obodai, E. A., Nyarko, H. D., Boamponsem, L. K., Coomson, S. S., & Aniwe, Y. (2011).
Microbial profile of smoked sardine (Sardilella aurita) at smoking sites and market centres
of Tema, Ghana. Archives of Applied Science Research, 3(3), 443 – 453.
Oduor-Odote, P. M., Shitanda, D., Obiero, M., & Kituu, G. (2010). Drying characteristics and
some quality attributes of Rastrineobola Argentea (omena) and Stolephorus Delicatulus
(kimarawali). African Journal Of Food Agriculture Nutrition and Development, 10(8).

81
Ogonda, L. A., Muge, E. K., Mulaa, F. J., & Mbatia, B. N. (2014). Proximate composition of
Rastrineobola argentea (Dagaa) of Lake Victoria-Kenya. African Journal of Biochemistry
Research, 8(1), 1-6.
Okonkwo, T. M., Obanu, Z. A., & Oludusin, A. O. (1993). The safety traditionally smoked fish
products with respect to Staphylococcus aureus, Escherichia coli and Aspergillus flavus.
Proceeding of FAO expert Consultation on Fish Technology in Africa, Accra, Ghana, 22 -
25 October, 1991., 210 – 227.
Onyango, D. M., Nyirima, J., Sote, B. T., Wawire, S. A., Namuyenga, N., Otuya, P., . . . Lung’ayia,
H. (2015). Evaluation of the Effectiveness of Traditional Rastrineobola argentea Sundrying
Process Practiced along the Shores of Lake Victoria, Kenya. Food and Public Health, 5(3
), 61-69. doi: 10.5923/j.fph.20150503.01
Ormay, L., & Novotny, T. (2011). The Significance of Penicillium species in Food Poisoning in
Hungary. In: The Microbiology of Dried Food. Paper presented at the International
Symposium on Food Microbiology (2011). Haerlem, the Netherlands:.
Owaga, E. E., Onyango, C. A., & Njoroge, C. K. (2010). Influence of selected washing treatments
and drying Temperatures on proximate composition of Dagaa (Rastrineobola argentea), a
small pelagic fish species. Afr. J. Food Agric. Nutr. Dev., 10(7), 1-14.
Ozogul, F., Taylor, K. D. A., Peter, C., Quantick, & Ozogul, Y. (2000). A Rapid HPLC -
Determination of ATP related compounds and its application to herring stored under
modified atmosphere. International Journal of Food science and Technology, 35, 549-554.
Pittpher, G. L. (2010). The Effect of Dehydration on the Population of Smoked and Dried Meat
and Fish Products. Journal of Food Technology, 95(211-215).
Pomeranz, Y., & Meloan, C. E. (2000). Food Analysis: Theory and Practice. 3rd edition. Chapman
& Hall Inc. N.Y. Springer US.
Raman, M., & Mathew, S. (2014). Quality Changes During Frozen Storage and Cooking of Milk.
Journal of International Academic Research for Multidisciplinary, 2(4), 452–468.

82
Reij, M. W., & Aantrekker, E. D. (2004). Recontamination as a source of pathogens in processed
foods. International Journal of Food Microbiology, 91(1), 1 – 11.
Reza, S., Bapary, A. B. U. J., & Islam, N. (2009). Optimization of marine fish drying using solar
tunnel dryer. Journal of Food Processing and Preservation, 33(2009), 47–59.
Rhee, K. S., & Ziprin, Y. A. (2001). Pro-oxidative effects of NaCl in microbial growth-controlled
and uncontrolled beef and chicken. Meat Science, 57, 105–112.
Rose, S., Spinks, N., & Canhoto, A. I. (2014). Management Research: Applying the Principles:
Routledge Taylor & Francis Group. London and New York. 410 pp.
Ryder, J. M. (1985). Determination of adenosine triphosphate and its breakdown products in fish
muscle by high performance liquid chromatography. J. Agric. Food Chem, 33, 678-680.
Sablani, S. S., Rahman, M. S., Haffar, I., Mahgoub, O., Al-Marzouki, A. S., Al-Ruzeiqi M. H., Al-
Habsi, N. H. and Al-Belushi, R. H. (2003). Drying rates and quality parameters of fish
sardines processed using solar dryers. Journal of Agricultural and Marine Sciences 8(2):
79 – 86.
Sabrina da Costa, S. A., Teixeira, M. E., Luiz de Oliveira, R. G., Maia, R. F., & Conte, C. A. J.
(2014). Chemical Quality Indices for Freshness Evaluation of Fish. Journal of Food
Studies, 3(1), 71-87. doi: 10.5296/jfs.v3i1.6301
Sikorski, Z. E., & Kolodziejska, I. (2002). Microbial risks in mild hot smoking of fish. Critical
Reviews in Food Science and Nutrition, 42, 35-51.
Smith, G., & Hole, M. (2006). Browning of salted sun-dried fish. . Journal of the Science of Food
and Agriculture, 55(2), 291-301 (abstract).
Speedy, A. W. (2003). Global Production and Consumption of Animal Source Foods. Journal of
nutrition, 133, 4048S-4053S
East African Standard (2014). Dried fish Rastrineobola argentea-Specification DEAS 826:2014.
ICS 67.120.30.

83
Suja, K. P., Abraham, J. T., Thamizh, S. N., Jayalekshmy, A., & Arumughan, C. (2004).
Antioxidant efficacy of sesame cake extract in vegetable oil protection. Food Chemistry,
84, 393-400.
Sverdrup-Jensen, S. (1997). Fish Supply and Demand Projections. NAGA Supplement, July-
December, 77-79.
Tanimowo, E. O. (2015). Effects of salting and drying on quality attributes of snoek (Thyrsites
atun). Thesis for the degree of Master of Food Science, Stellenbosch University. Retrieved
from https://scholar.sun.ac.za on 21st of February 2017.
Tortora, G. J., Funke, B. R., & Case, C. L. (2010). Microbiology: An introduction. Fifth Edition.
The Benjamin / Cummings Publishing, Co., Inc., Redwood City, Sun Francisco. 192 pp.
Uauy, R., & Valenzuela, A. (2000). Marine oils. The health benefits of n-3 fatty acids. Nutrition,
16, 680-684.
Usydus, Z., Szlinder-Richert, J., & Adamczyk, M. (2009). Protein quality and amino acid profiles
of fish products available in Poland. Food Chemistry, 112, 139 - 145. doi:
10.1016/j.foodchem.2008.05.050
Usydus, Z., Szlinder-Richert, J., Polak-Juszczak, L., Kanderska, J., Adamczyk, J., Malesa-
Ciec´wierz, M., & al., e. (2008). Food of marine origin-between benefits and potential
risks. Part I – Canned fish on the Polish market. Food Chemistry. doi:
10.1016/j.foodchem.2008.04.018.
Varela, S. L., Muniz, F. J. S., & Cuest, C. (1995). Decreased food efficiency ratio, growth
retardation and changes in liver fatty acid composition in rats consuming thermally
oxidized and polymerized sunflower oil used for frying. Food and Chemistry Toxicology,
33 181-189.
Veciana-Nogues, M. T., Izquierdo-Pulido, M., & Vidal-Carou, M. C. (1996). Determination of
ATP related compounds in fresh and canned tuna fish by HPLC. Food Chemistry, 59 (3 ),
461-412.

84
Wandera, S. B. (1991). A study of Rastrineobola Argentea in the Ugandan lakes. Paper presented
at the Rastrineobola Argentea Symposium for the Riparian States of Lake Victoria, Kenya,
Kisumu.
Wen-Ching, K., & Kuo-Chiang, H. (2001). Changes in K Value and Microorganisms of Tilapia
Fillet during Storage at High-Pressure, Normal Temperature. Journal of Food Protection,
64(1), 94–98.
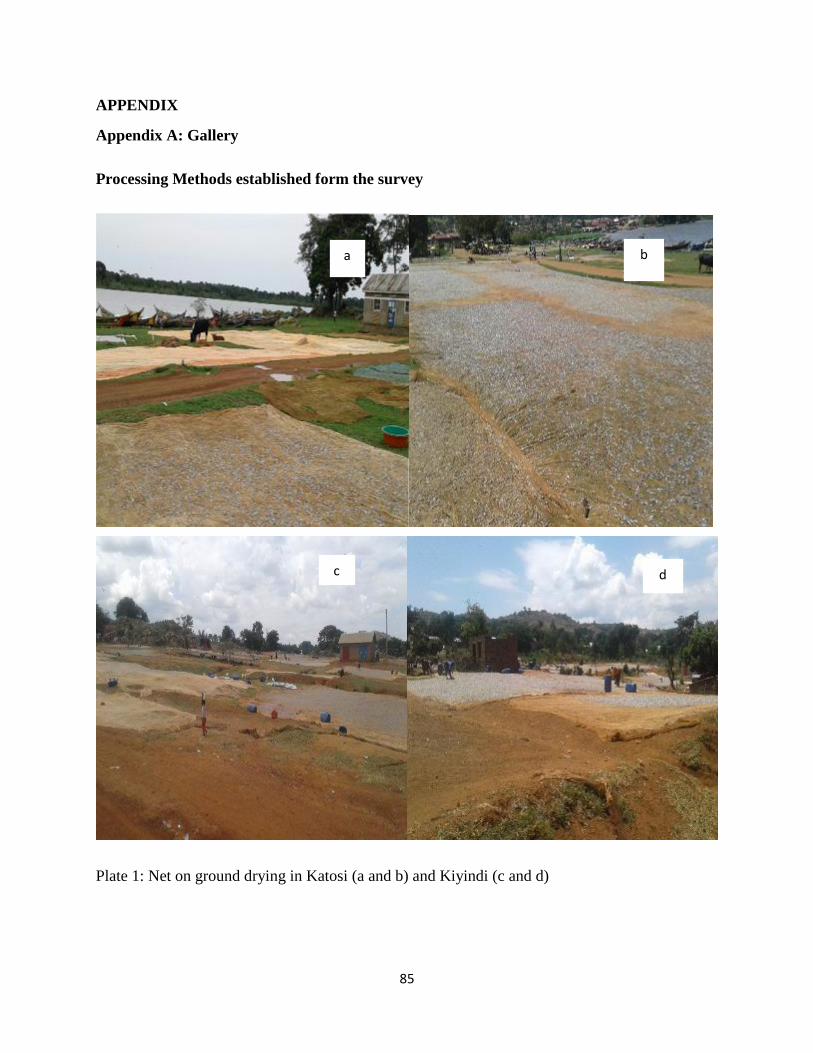
85
APPENDIX
Appendix A: Gallery
Processing Methods established form the survey
Plate 1: Net on ground drying in Katosi (a and b) and Kiyindi (c and d)
a b
c d

86
Plate 2: Sand on the beach drying in Kasekulo (a and b) raised rack drying in Kiyindi (c) and
Ssenyondo (d)
a b
c d

87
Plate 3: Raised rack drying in Kiyindi (a and b) and Kasekulo (c and d)
a b
c d
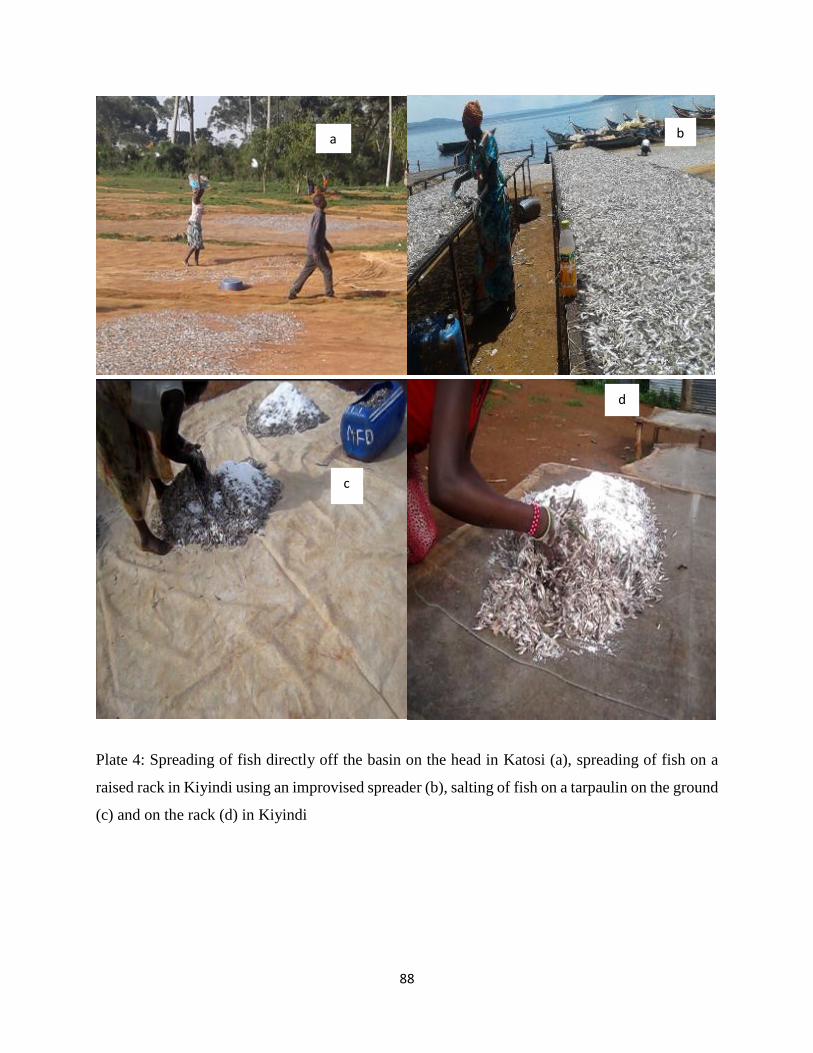
88
Plate 4: Spreading of fish directly off the basin on the head in Katosi (a), spreading of fish on a
raised rack in Kiyindi using an improvised spreader (b), salting of fish on a tarpaulin on the ground
(c) and on the rack (d) in Kiyindi
a b
c
d
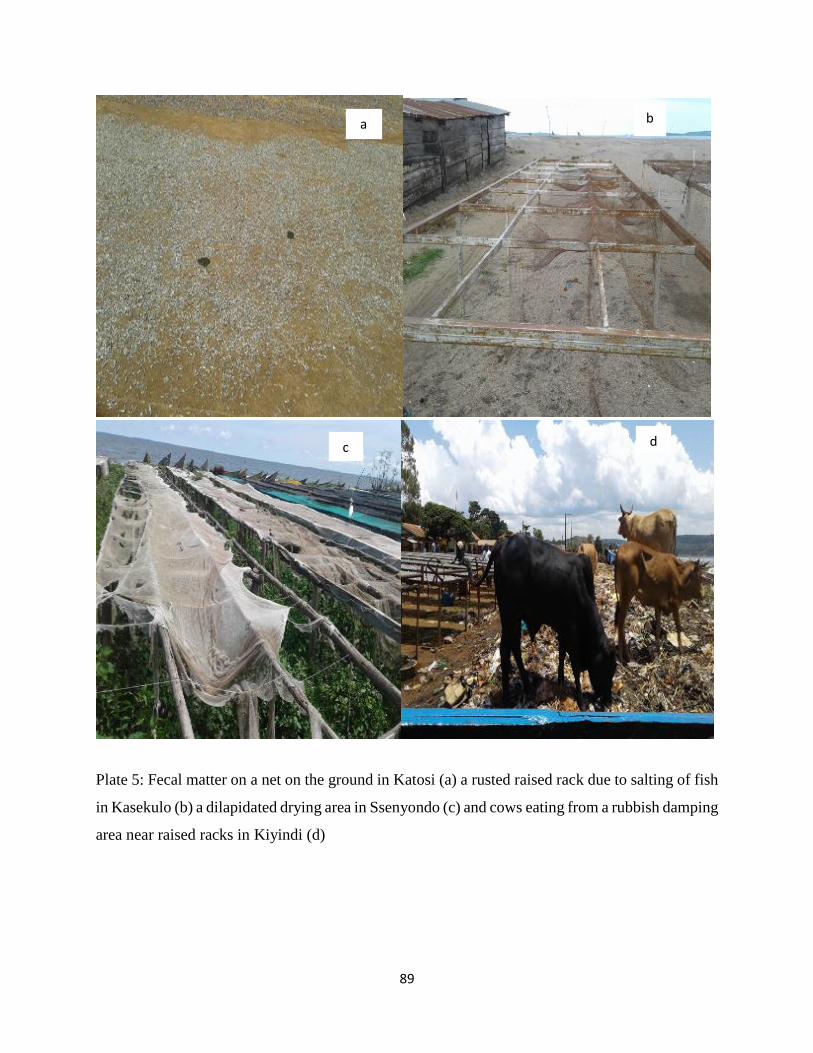
89
Plate 5: Fecal matter on a net on the ground in Katosi (a) a rusted raised rack due to salting of fish
in Kasekulo (b) a dilapidated drying area in Ssenyondo (c) and cows eating from a rubbish damping
area near raised racks in Kiyindi (d)
a b
c d

90
Plate 6: Low catch in Katosi (a) a prawn filled catch in Katosi (b), a catch with a lot of shells (c)
and birds feasting on fish on the racks in Ssenyondo (d)
a b
c d
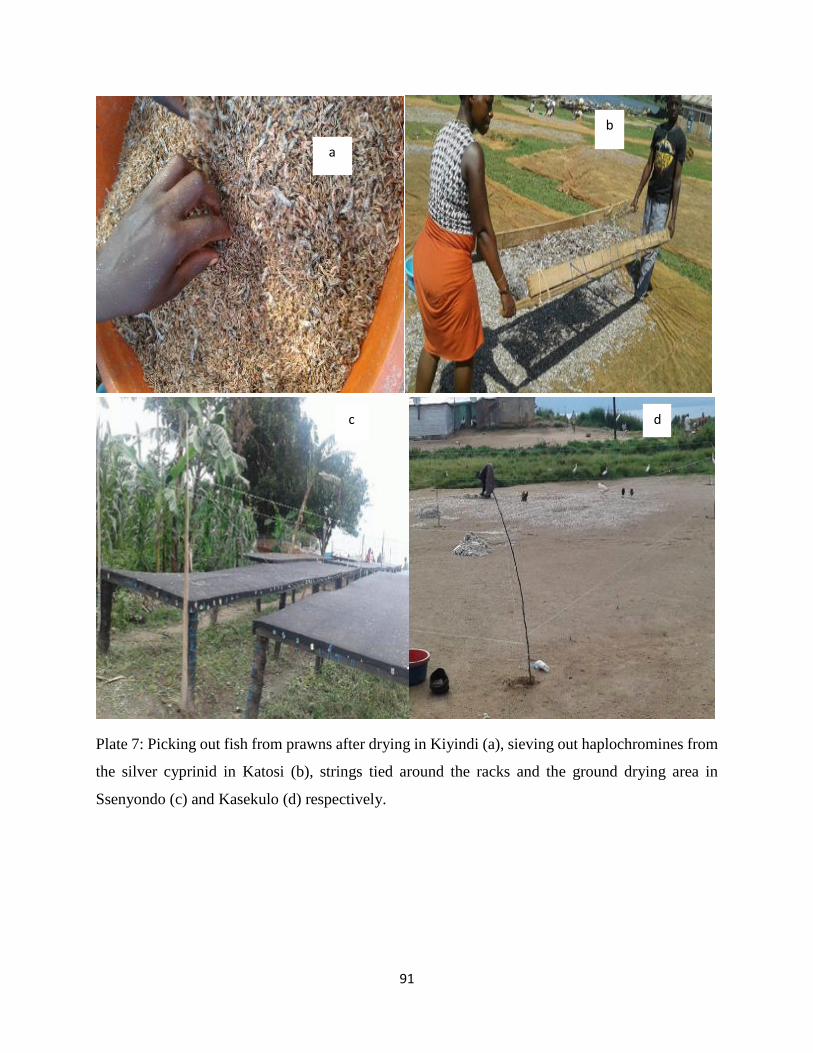
91
Plate 7: Picking out fish from prawns after drying in Kiyindi (a), sieving out haplochromines from
the silver cyprinid in Katosi (b), strings tied around the racks and the ground drying area in
Ssenyondo (c) and Kasekulo (d) respectively.
a
b
c d

92
Plate 8: Children employed to chase away birds from fish on racks in Ssenyondo (a), a boy picking
fih from the ground after drying in katosi (b), racks cleared underneath (c) and with level grass
that does not grow long (d) in Ssenyondo
a
b
c d

93
Plate 9: Fish arrival from the lake for salting experiment (a), placed on the racks ready to be spread
out (b), salted on shore to 4g and 10g salt per 100g wet fish (c), salt mixed and haplochromines
separated (d)
a b
c d

94
Plate 10: Experiment fish spread out on the racks to dry (a), covered when the rain started (b), and
brought back out the next day (c), salting experimental set up in Kiyindi (d).
a b
c d

95
Appendix B: Regression curves showing drying rates
Plate 1: Regression curves for drying kinetics of 4g of salt per 100g of wet fish offshore (a), and
on shore (b), 10g of salt per 100g of wet fish offshore (c), and onshore (d)
a b
c d
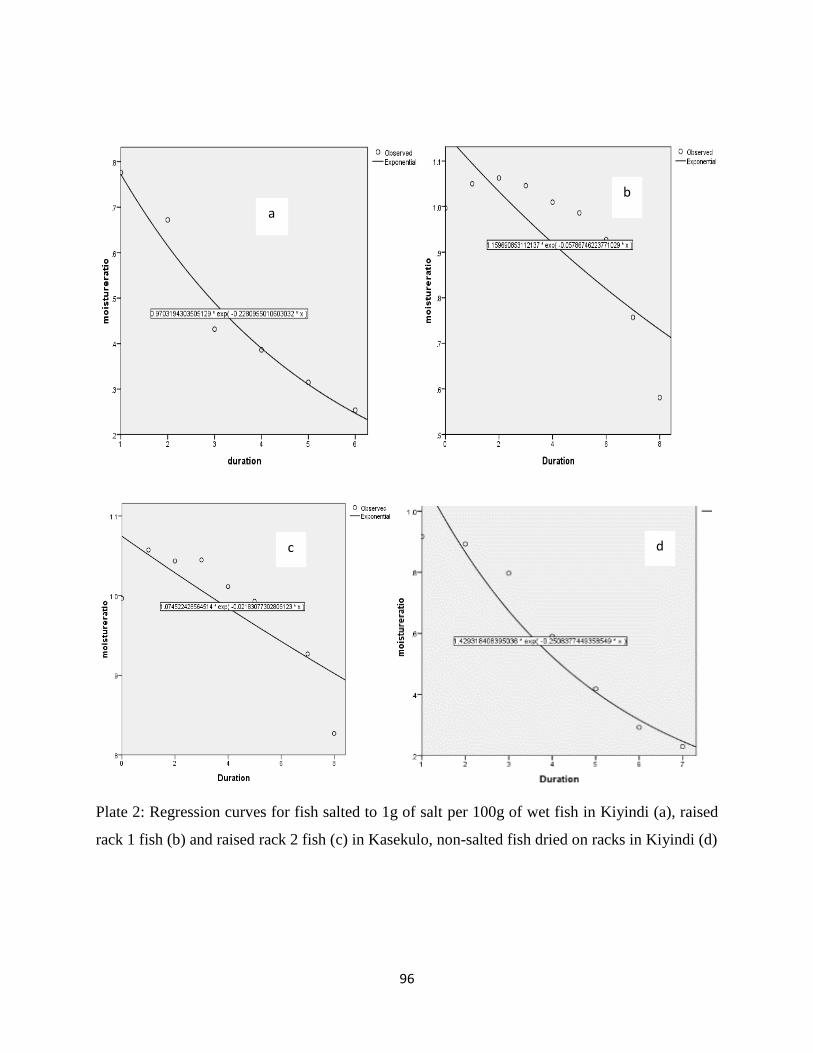
96
Plate 2: Regression curves for fish salted to 1g of salt per 100g of wet fish in Kiyindi (a), raised
rack 1 fish (b) and raised rack 2 fish (c) in Kasekulo, non-salted fish dried on racks in Kiyindi (d)
a
b
c d

97
Appendix C: Questionnaire for processors of silver cyprinid fished from Lake Victoria in
Uganda
Title: Effect of Processing Methods on the Quality Attributes and Drying Kinetics of
Rastrineobola Argentea (Silver cyprinid)
Omagor Isaac Olila
Questionnaire for processors of silver cyprinid fished from Lake Victoria in Uganda
This questionnaire is made up of two sections the first section will give the particulars of the
processing site. These particulars will be private to the processor and researcher and will only be
used to identify the site but will be not be mentioned in the thesis. The second section contains
the areas of concern of this study, analysis will be carried out using the information given in this
section.
Section I
1. Name of the processor/company
………………………………………………………………………………………………
2. District
………………………………………………………………………………………………
3. Affiliation
………………………………………………………………………………………………
4. Contact person
………………………………………………………………………………………………
5. Gender
a. Male
b. Female
6. Age
a. Below 30
b. Between 30 and 60
c. Above 60

98
Section II
Please tick where applicable
1. Processing method used
a. Deep frying
b. Freezing
c. Drying
d. Canning
e. Others
Specify
…………………………………………………………………………………………
………………………………………………
2. Reasons for utilizing specific method of processing
………………………………………………………………………………………………
………………………………………………………………………………………………
……………………………………………………..
3. Expected market of mukene per processing method
………………………………………………………………………………………………
………………………………………………………………………………………………
…………………………………………………..
4. Pretreatment used
a. Brining
Concentration of brine used
…………………………………………………………………………………………..
b. Blanching
Time of blanching
…………………………………………………………………………………………..
c. Spicing
Spices used, with concentrations
…………………………………………………………………………………………
…………………………………………………………………………………………..

99
d. Combinations
Specify with concentrations
…………………………………………………………………………………………
…………………………………………………………………………………………
e. Others
Specify
…………………………………………………………………………………………
………………………………….
5. Reasons for specific pretreatment
………………………………………………………………………………………………
………………………………………………………………………………………………
………………………………………………………………………………………………
………………………………………
6. Drying method used
a. Open sun drying
Sand drying
Rock drying
Net drying
Tarpaulin drying
Raised rack drying
b. Solar tent
c. Solar tunnel
d. Oven
e. Others
Specify
………………………………………………………………………………………......
7. Reasons for utilizing specific method of drying
………………………………………………………………………………………………
………………………………………………………………………………………………
………………………………………………
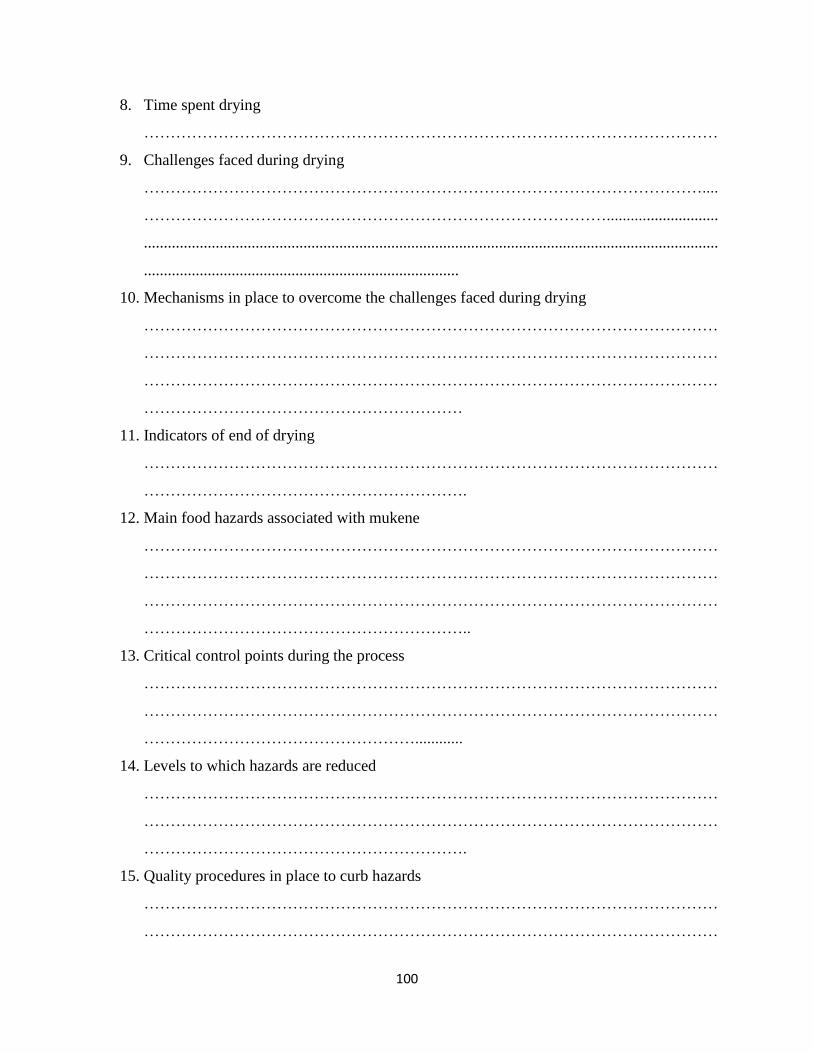
100
8. Time spent drying
………………………………………………………………………………………………
9. Challenges faced during drying
……………………………………………………………………………………………....
……………………………………………………………………………............................
................................................................................................................................................
...............................................................................
10. Mechanisms in place to overcome the challenges faced during drying
………………………………………………………………………………………………
………………………………………………………………………………………………
………………………………………………………………………………………………
……………………………………………………
11. Indicators of end of drying
………………………………………………………………………………………………
…………………………………………………….
12. Main food hazards associated with mukene
………………………………………………………………………………………………
………………………………………………………………………………………………
………………………………………………………………………………………………
……………………………………………………..
13. Critical control points during the process
………………………………………………………………………………………………
………………………………………………………………………………………………
……………………………………………............
14. Levels to which hazards are reduced
………………………………………………………………………………………………
………………………………………………………………………………………………
…………………………………………………….
15. Quality procedures in place to curb hazards
………………………………………………………………………………………………
………………………………………………………………………………………………

101
16. Average quantity before processing
………………………………………………………………………………………………
17. Average quantity lost after drying
………………………………………………………………………………………………
18. Perceived major reasons for the incidence of loss
………………………………………………………………………………………………
………………………………………………………………………………………………
………………………………………………..
19. Average quantity sold for animal feed
………………………………………………………………………………………………
20. Average quantity sold for human consumption
………………………………………………………………………………………………
21. Reasons for end user preference
……………………………………………………………………………………………....
................................................................................................................................................
............................................................
22. Source of information on quality maintenance and processing of silver cyprinid
………………………………………………………………………………………………
………………………………………………………………………………………………
…………………………………………
23. Process flow diagram