making decisions with confidence · 2012-11-02 · making decisions with confidence a history and...
TRANSCRIPT
Making Decisions with ConfidenceA history and analysis of classification and a proposal for Holdings Based Classifications and Indices
Presented byRobin ThurstonGlobal Director of Research09.24.04

Overview
• Overview and History• Prospectus Based Classification• Returns Based Style Analysis (RBSA)• “Mid-Cap or Multi-Cap”• Holdings Based Style Analysis (HBSA)• The “Why” and the “What if”
– Lipper Classification– Lipper Active Indices
• Lipper’s Holdings Based Classification in Singapore– “North American Equity Funds Case Study”– Lipper’s Plan
• Review and Benefits• Questions
Primary Uses of Fund Classifications...
• Provides a valuable first cut in performance evaluation– Helps retail users with expectations-
• What is the risk/return of this peer group? • Is this a good fund for me?• Should I stay invested in this fund?
– Used by institutions as benchmarks-• What kind of job did the advisor/manager do?• Does this type of fund fit into a pension plan?
Good Fund Classifications...
• Should provide a reasonable basis for comparison.
• Should also provide a reasonable basis for expectations.
Clients and Individuals Require Classifications That…
• Use transparent methodologies
• Are replicable
• Are stable

Traditional Classification Types
• Prospectus Based Classification
• Returns Based Style Analysis (RBSA) Classification
• Holdings Based Style Analysis (HBSA) Classification

Prospectus Based Classification
• Definition – Legal language taken from the prospectus that defines the investment objective of the fund.
– Benefits• Very Static• Written from Fund Company view
– Weaknesses• Extremely Subjective• Very Broad Definitions• Multiple Terminologies Used• No Proactive Classification is Done• Difficult to Review for All Funds
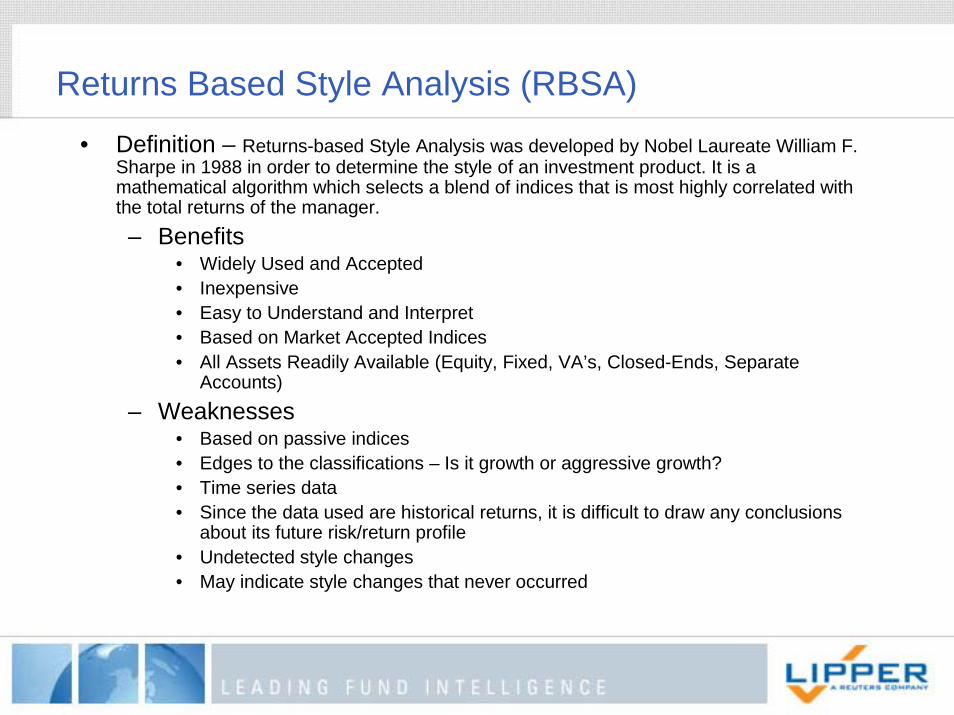
Returns Based Style Analysis (RBSA)• Definition – Returns-based Style Analysis was developed by Nobel Laureate William F.
Sharpe in 1988 in order to determine the style of an investment product. It is a mathematical algorithm which selects a blend of indices that is most highly correlated with the total returns of the manager.– Benefits
• Widely Used and Accepted• Inexpensive• Easy to Understand and Interpret• Based on Market Accepted Indices• All Assets Readily Available (Equity, Fixed, VA’s, Closed-Ends, Separate
Accounts)– Weaknesses
• Based on passive indices• Edges to the classifications – Is it growth or aggressive growth?• Time series data• Since the data used are historical returns, it is difficult to draw any conclusions
about its future risk/return profile• Undetected style changes• May indicate style changes that never occurred
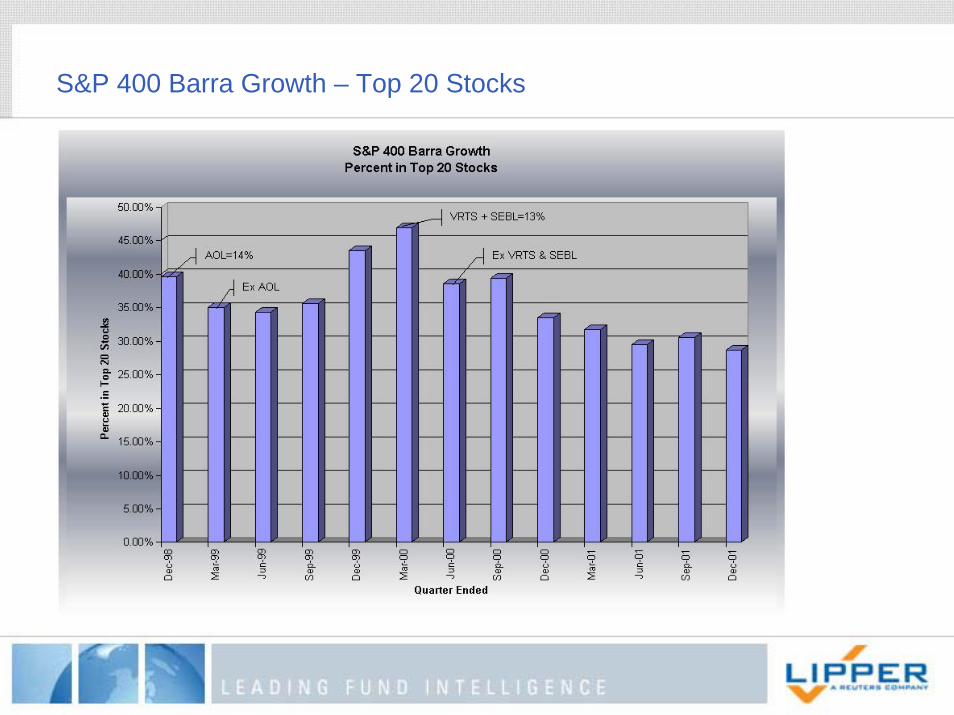
S&P 400 Barra Growth – Top 20 Stocks
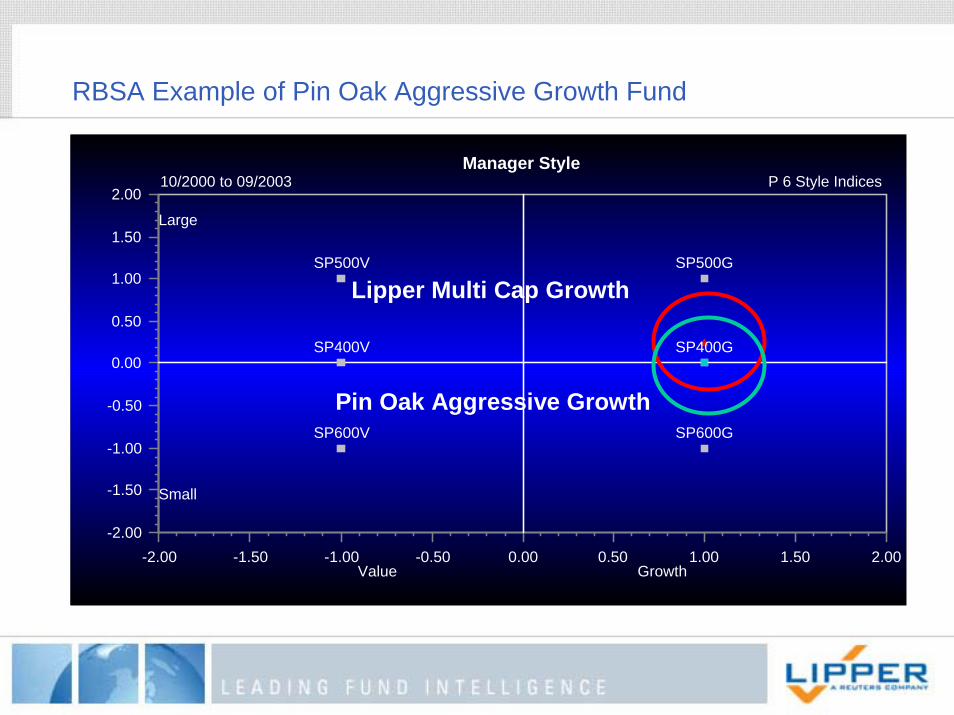
RBSA Example of Pin Oak Aggressive Growth Fund
-2.00
-1.50
-1.00
-0.50
0.00
0.50
1.00
1.50
2.00Large
Small
-2.00 -1.50 -1.00 -0.50 0.00 0.50 1.00 1.50 2.00Value Growth
SP600V SP600G
SP400V SP400G
SP500V SP500G
Manager Style10/2000 to 09/2003 P 6 Style Indices
Pin Oak Aggressive Growth
Lipper Multi Cap Growth

Show How Your Fund Stacks Up to Lipper Classifications
1 Month QTD 1 Quarter YTD 1 Year 2 Year 3 Year Entire Period
-60.00
-40.00
-20.00
0.00
20.00
40.00
60.00
80.00
100.00
120.00
UniverseLipper Mlt-Cap Growth IXPin Oak Aggressive Stock
Multi-Horizon Chart:Annualized Return10/2000 to 09/2003 Lipper US:Multi-Cap Growth
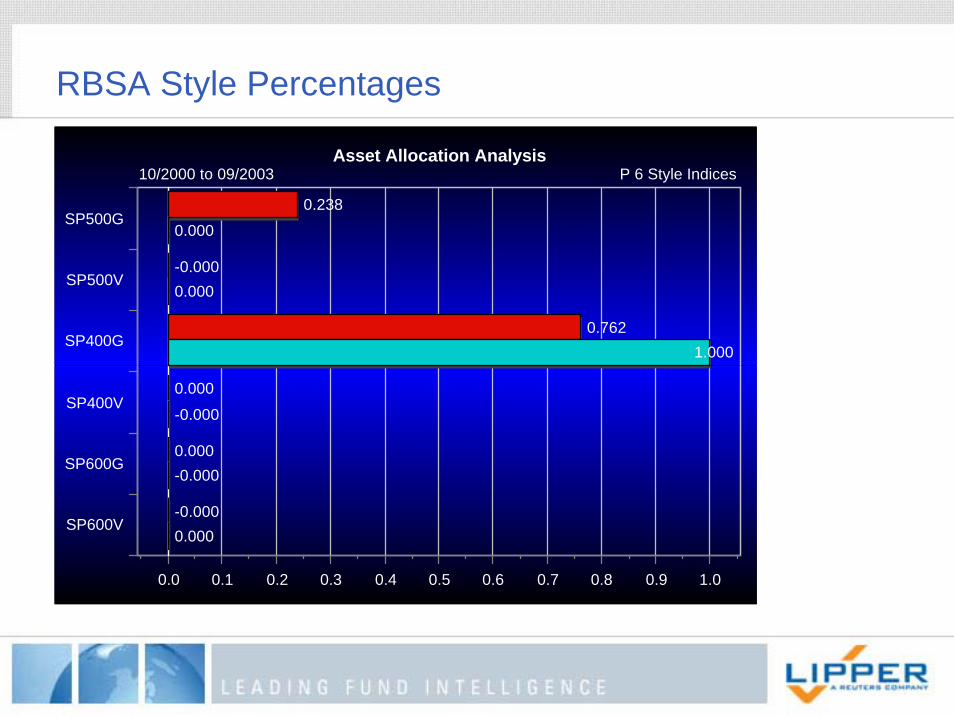
RBSA Style Percentages
SP500G
SP500V
SP400G
SP400V
SP600G
SP600V
0.0 0.1 0.2 0.3 0.4 0.5 0.6 0.7 0.8 0.9 1.0
0.238
-0.000
0.762
0.000
0.000
-0.000
0.000
0.000
1.000
-0.000
-0.000
0.000
Asset Allocation Analysis10/2000 to 09/2003 P 6 Style Indices
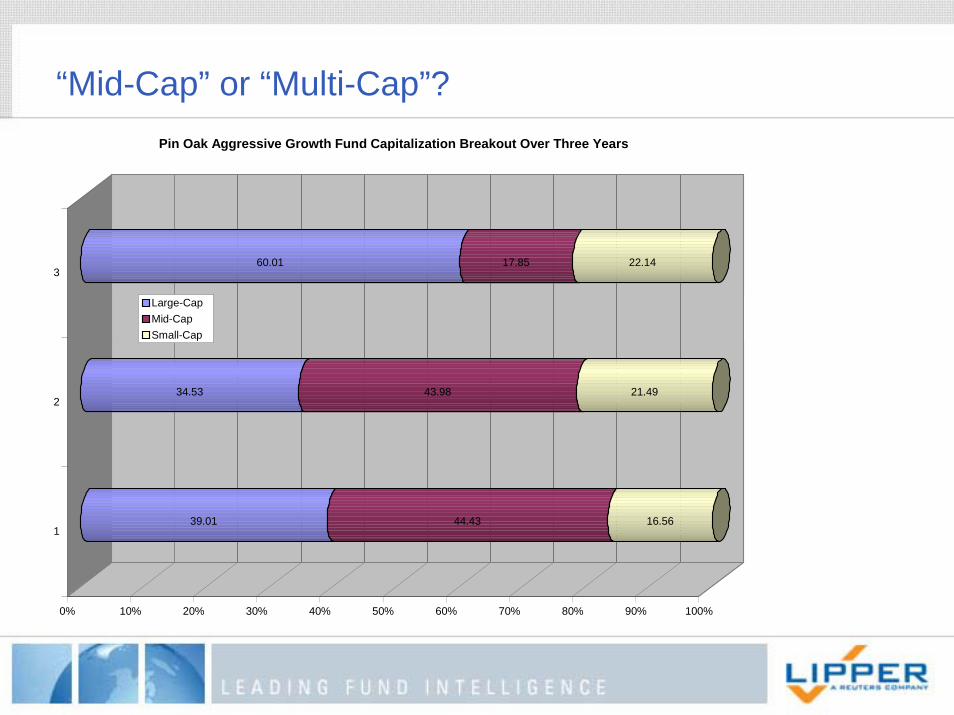
“Mid-Cap” or “Multi-Cap”?
39.01 44.43 16.56
34.53 43.98 21.49
60.01 17.85 22.14
0% 10% 20% 30% 40% 50% 60% 70% 80% 90% 100%
1
2
3
Pin Oak Aggressive Growth Fund Capitalization Breakout Over Three Years
Large-Cap Mid-Cap Small-Cap
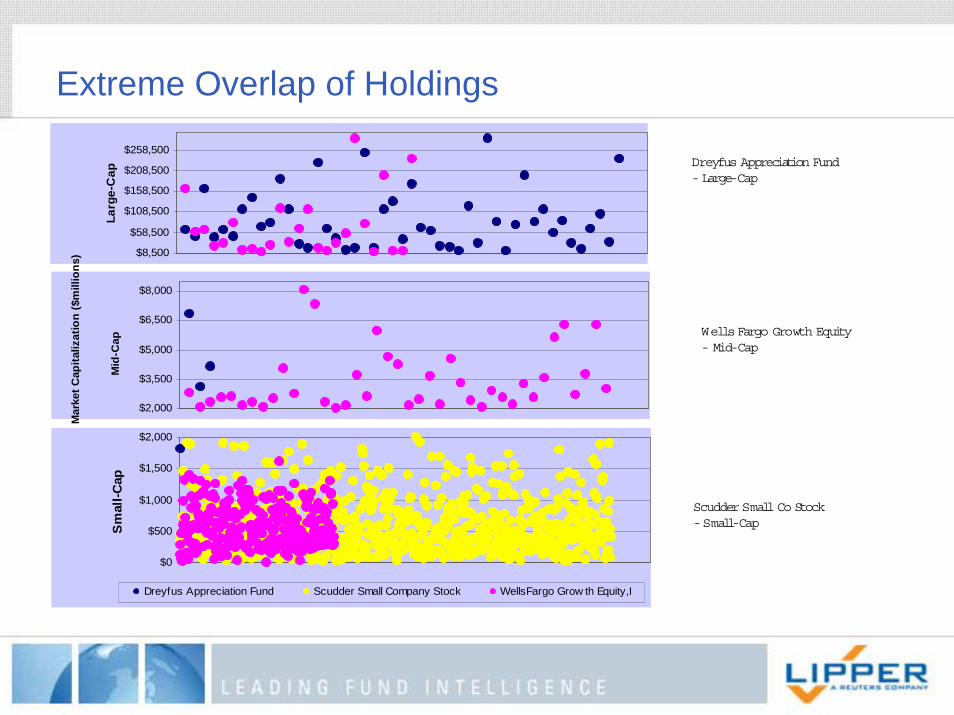
Extreme Overlap of Holdings
$8,500
$58,500
$108,500
$158,500
$208,500
$258,500
Larg
e-C
ap
$2,000
$3,500
$5,000
$6,500
$8,000
Mid
-Cap
$0
$500
$1,000
$1,500
$2,000
Sm
all-C
ap
Dreyfus Appreciation Fund Scudder Small Company Stock WellsFargo Grow th Equity,I
Mar
ket C
apita
lizat
ion
($m
illio
ns)
Dreyfus Appreciation Fund-Large-Cap
Wells Fargo Growth Equity- Mid-Cap
Scudder Small Co Stock-Small-Cap
“Mid-Cap” or “Multi-Cap”
RBSA cannot do security overlapRBSA can place investors into portfolios that have extreme overlapIn many cases RBSA can design poor asset allocation portfoliosRBSA can miss short term portfolio changes
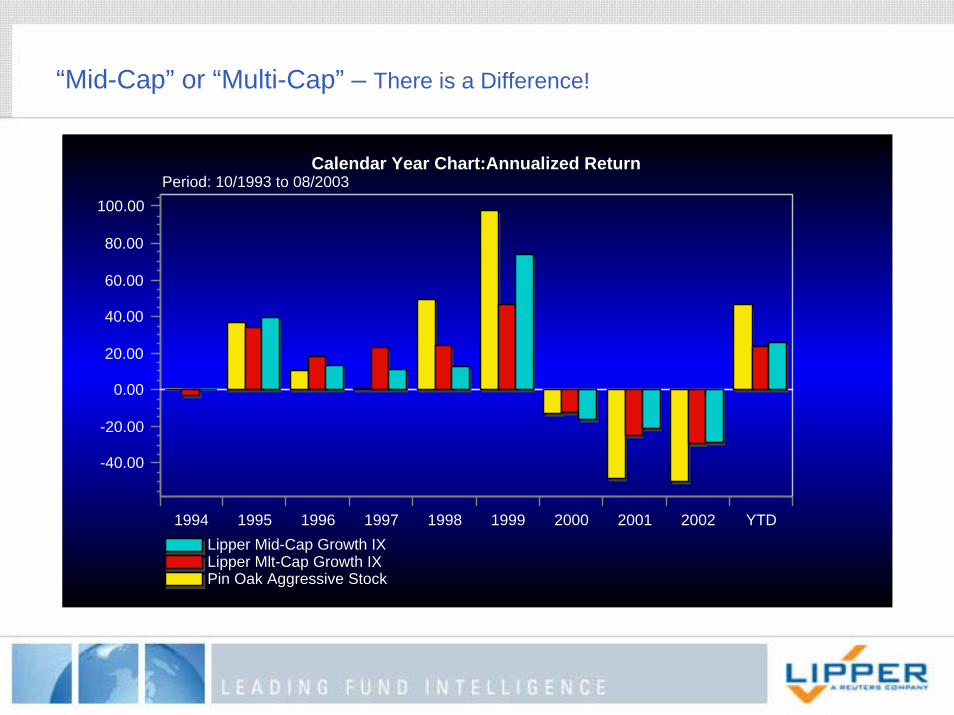
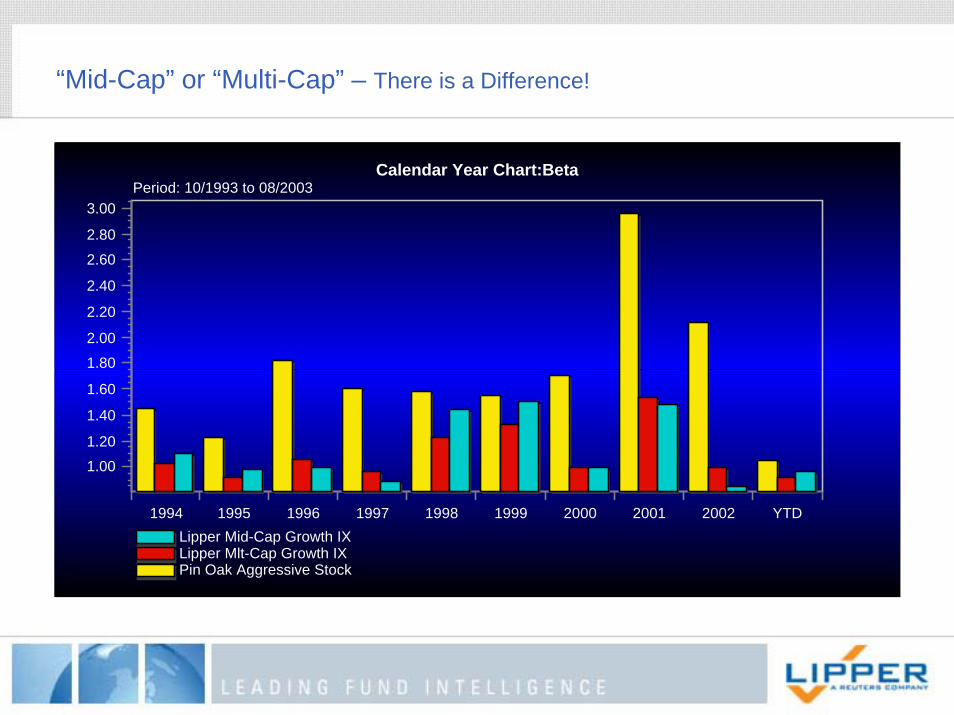
“Mid-Cap” or “Multi-Cap” – There is a Difference!
1994 1995 1996 1997 1998 1999 2000 2001 2002 YTD
-40.00
-20.00
0.00
20.00
40.00
60.00
80.00
100.00
Lipper Mid-Cap Growth IXLipper Mlt-Cap Growth IXPin Oak Aggressive Stock
Calendar Year Chart:Annualized ReturnPeriod: 10/1993 to 08/2003
“Mid-Cap” or “Multi-Cap” – There is a Difference!
1994 1995 1996 1997 1998 1999 2000 2001 2002 YTD
1.001.20
1.40
1.60
1.802.00
2.20
2.40
2.602.80
3.00
Lipper Mid-Cap Growth IXLipper Mlt-Cap Growth IXPin Oak Aggressive Stock
Calendar Year Chart:BetaPeriod: 10/1993 to 08/2003
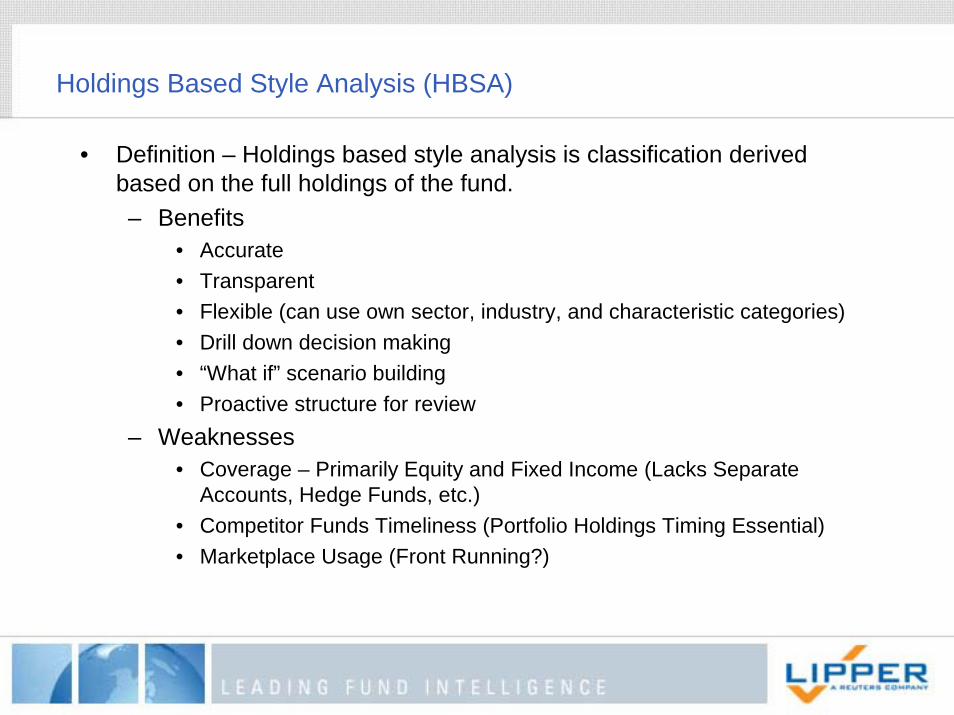
Holdings Based Style Analysis (HBSA)
• Definition – Holdings based style analysis is classification derived based on the full holdings of the fund.– Benefits
• Accurate• Transparent• Flexible (can use own sector, industry, and characteristic categories)• Drill down decision making• “What if” scenario building• Proactive structure for review
– Weaknesses• Coverage – Primarily Equity and Fixed Income (Lacks Separate
Accounts, Hedge Funds, etc.)• Competitor Funds Timeliness (Portfolio Holdings Timing Essential)• Marketplace Usage (Front Running?)
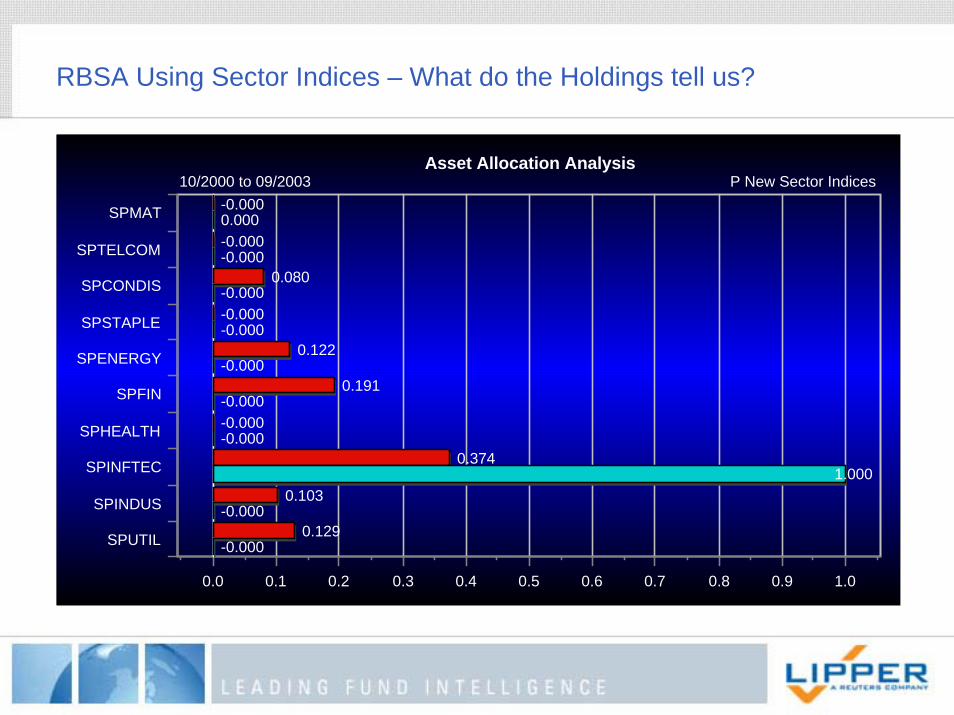
RBSA Using Sector Indices – What do the Holdings tell us?
SPMAT
SPTELCOM
SPCONDIS
SPSTAPLE
SPENERGY
SPFIN
SPHEALTH
SPINFTEC
SPINDUS
SPUTIL
0.0 0.1 0.2 0.3 0.4 0.5 0.6 0.7 0.8 0.9 1.0
-0.000
-0.000
0.080
-0.000
0.122
0.191
-0.000
0.374
0.103
0.129
0.000
-0.000
-0.000
-0.000
-0.000
-0.000
-0.000
1.000
-0.000
-0.000
Asset Allocation Analysis10/2000 to 09/2003 P New Sector Indices
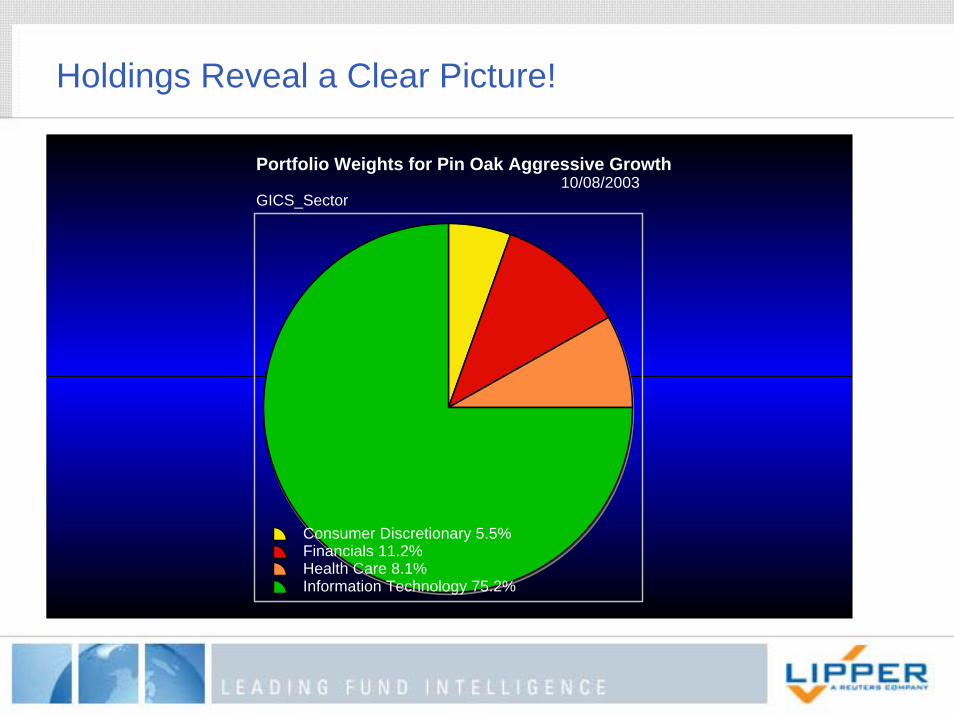
Holdings Reveal a Clear Picture!
Consumer Discretionary 5.5%Financials 11.2%Health Care 8.1%Information Technology 75.2%
Portfolio Weights for Pin Oak Aggressive Growth10/08/2003
GICS_Sector
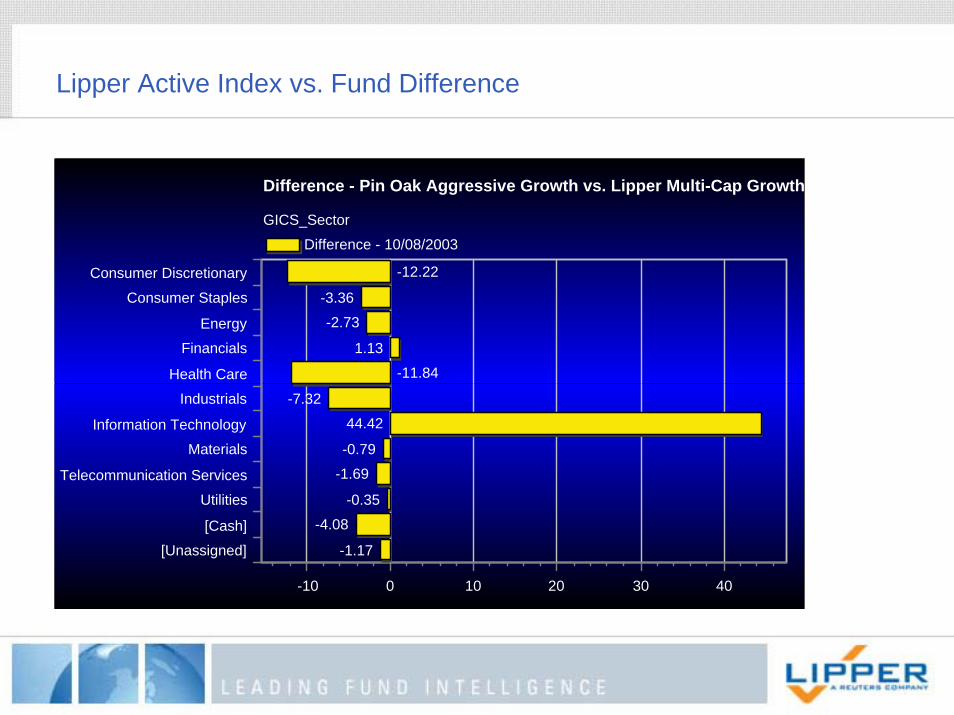
Lipper Active Index vs. Fund Difference
Consumer DiscretionaryConsumer Staples
EnergyFinancials
Health CareIndustrials
Information TechnologyMaterials
Telecommunication ServicesUtilities
[Cash][Unassigned]
-10 0 10 20 30 40
-12.22
-3.36-2.73
1.13-11.84
-7.3244.42
-0.79-1.69
-0.35-4.08
-1.17
Difference - 10/08/2003
Difference - Pin Oak Aggressive Growth vs. Lipper Multi-Cap Growth
GICS_Sector

What are Lipper Active Indices?
• Active Indices are the first indices derived from the holdings of active mangers!– Full universe within classification is optimal but not necessary
• Equal weighted average calculation• No underlying managers are revealed.• Intended to track Lipper Classification averages!
– Goal is 100bp annualized tracking error• Active Indices for Active Managers!• Each index is on a 30 day lag

Are you using a Passive Benchmark for Attribution – There is a Difference!
12/02 3/03 6/0321
22
23
24
25
26
27
28
29
30
Portfolio Weight - Information Technology - S&P BARRA GrowthBenchmark Weight - Information Technology - Lipper Multi-Cap Growth
Weights Over Time10/07/2002 - 8/29/2003

Time Series Weight Comparisons
12/02 3/03 6/03
30
40
50
60
70
Portfolio Weight - Information Technology - 1009854Benchmark Weight - Information Technology - Lipper Multi-Cap Growth
Weights Over Time10/07/2002 - 8/29/2003
Why Should You Use Lipper’s Active Indices?
• These new indices give you the first opportunity to look into your peer group down to the security!– Sector analysis– Industry analysis– Security analysis
• Explain the “why” questions– Over and under-weight positions relative to peers– Cash build up relative to peers
• Finally active managers don’t have to use passive indices to guess what their peers are doing from month to month!

How do your funds stack up?
75.20
30.2226.33
18.72
0.00
10.00
20.00
30.00
40.00
50.00
60.00
70.00
80.00
Pin Oak Aggressive Growth Lipper Multi-Cap Growth ActiveIndex
S&P 500 Growth S&P 400 Growth
Indices
Fund vs Passive and Active Indices
Information Technology

Use Portfolio Z-Scores for Historical Classification ViewsRolling Lipper Z-Scores for Pin Oak Aggessive Growth)
100
1000
10000
100000
-1.5 -1 -0.5 0 0.5 1 1.5
Portfolio Z-Score Relative to Relevant Index
Po
rtfo
lio M
edia
n M
arke
t C
ap -
Lo
gar
ith
m
Large-Cap Multi-Cap Mid-Cap Small-Cap
Current Pin Oak
VALUE CORE GROWTH
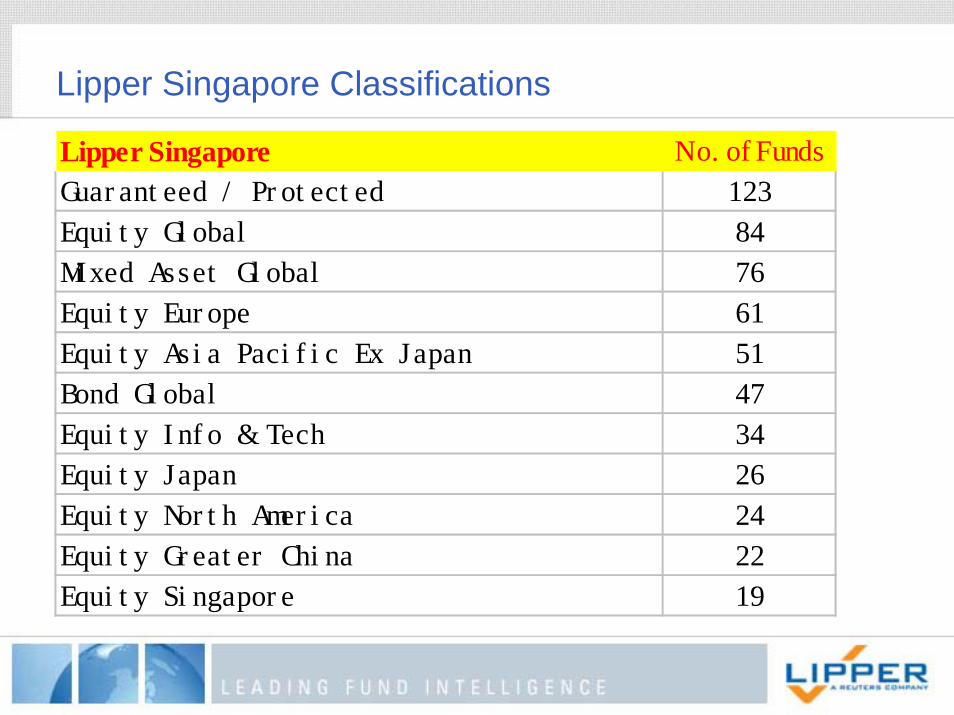
Lipper Singapore Classifications
Lipper Singapore No. of FundsGuar ant eed / Pr ot ect ed 123Equi t y Gl obal 84Mi xed Asset Gl obal 76Equi t y Eur ope 61Equi t y As i a Paci f i c Ex Japan 51Bond Gl obal 47Equi t y I nf o & Tech 34Equi t y Japan 26Equi t y Nor t h Amer i ca 24Equi t y Gr eat er Chi na 22Equi t y Si ngapor e 19
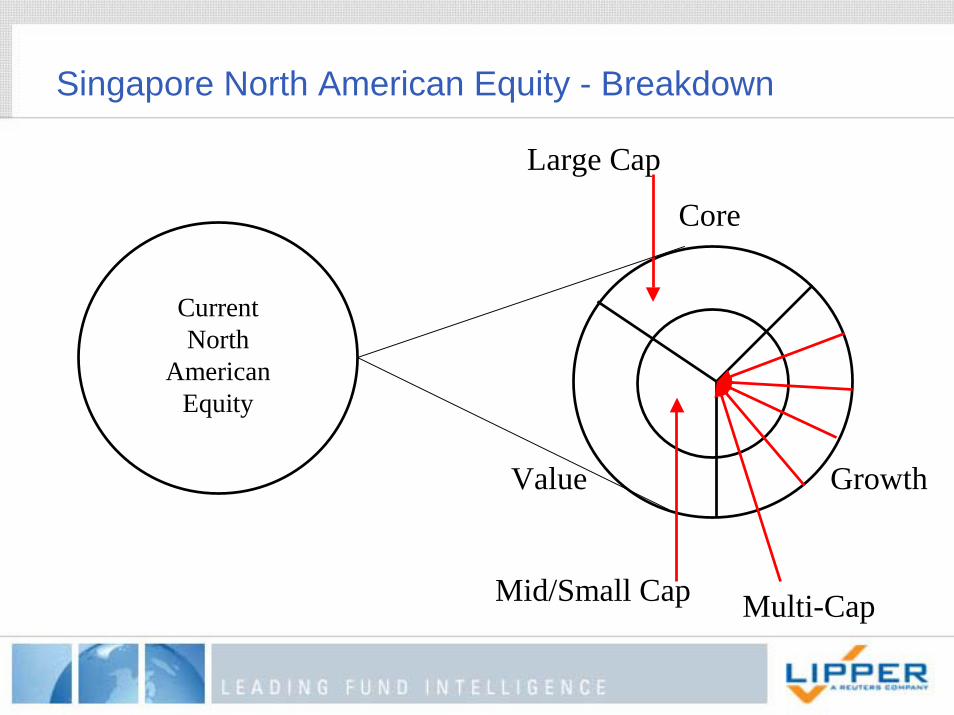
Singapore North American Equity - Breakdown
Core
Current North
American Equity
Value Growth
Mid/Small Cap
Large Cap
Multi-Cap
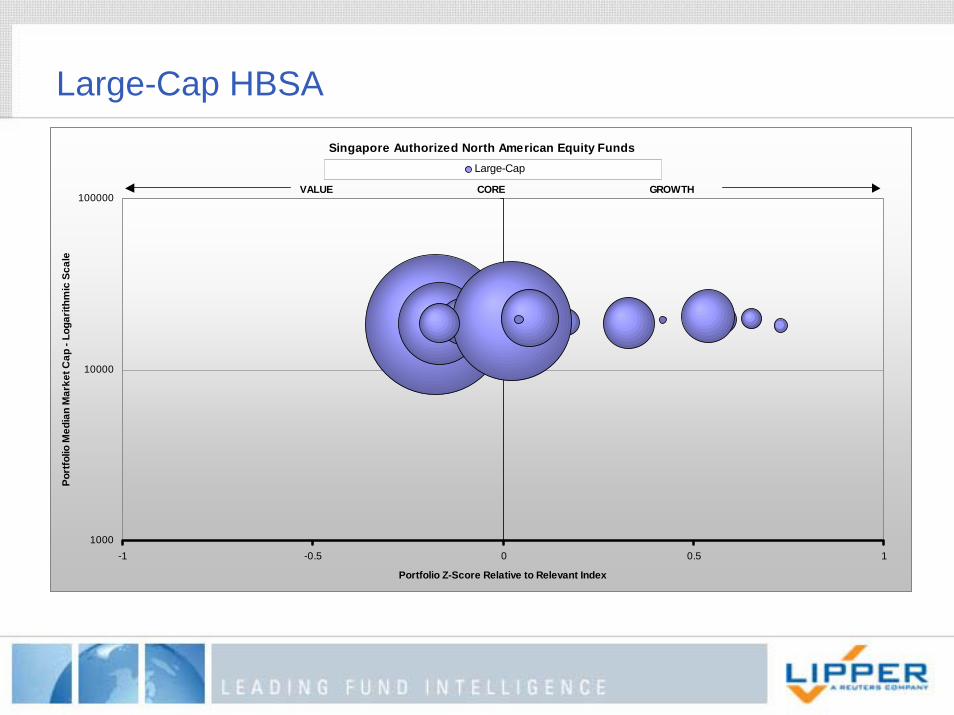
Large-Cap HBSASingapore Authorized North American Equity Funds
1000
10000
100000
-1 -0.5 0 0.5 1
Portfolio Z-Score Relative to Relevant Index
Port
folio
Med
ian
Mar
ket C
ap -
Loga
rithm
ic S
cale
Large-Cap
VALUE CORE GROWTH

Large-Cap/Mid-Small-Cap HBSA
Singapore Authorized North American Equity Funds
1000
10000
100000
-1 -0.5 0 0.5 1
Portfolio Z-Score Relative to Relevant Index
Port
folio
Med
ian
Mar
ket C
ap -
Loga
rithm
ic S
cale
Large-Cap Small-Mid Cap
VALUE CORE GROWTH
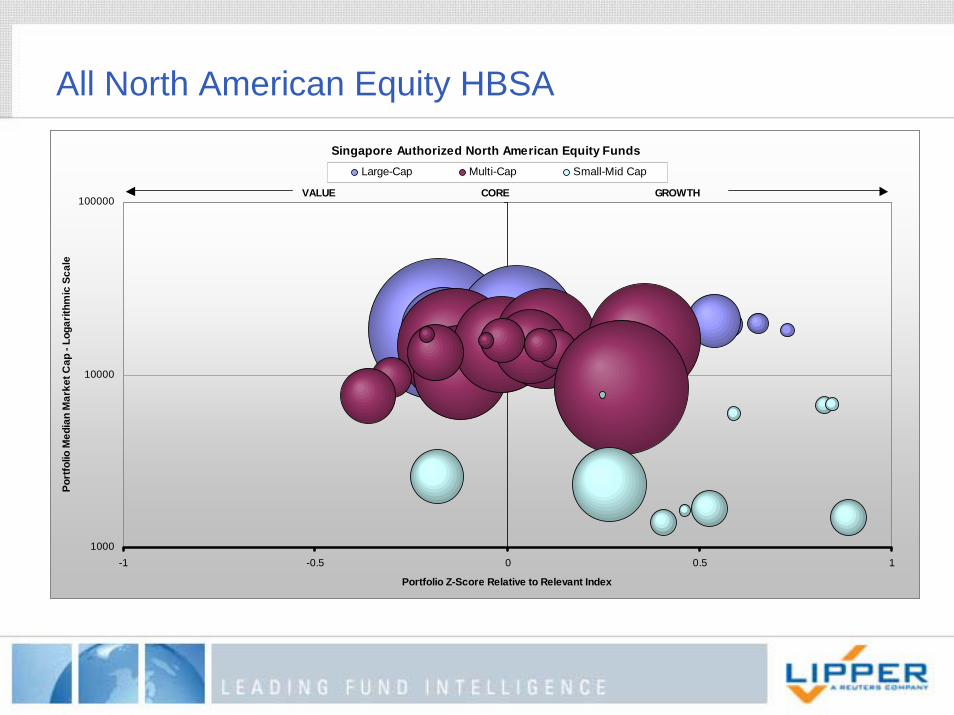
All North American Equity HBSA
Singapore Authorized North American Equity Funds
1000
10000
100000
-1 -0.5 0 0.5 1
Portfolio Z-Score Relative to Relevant Index
Port
folio
Med
ian
Mar
ket C
ap -
Loga
rithm
ic S
cale
Large-Cap Multi-Cap Small-Mid Cap
VALUE CORE GROWTH

Singapore North American Equity Analysis
Cap Style perf stdev alpha sharpeLARGE CAP GROWTH -4.19 17.02 -3.51 -0.33LARGE CAP CORE -3.66 16.98 -2.84 -0.29LARGE CAP VALUE -0.46 16.88 0.43 -0.11
MULTI CAP GROWTH -3.02 20.67 -1.92 -0.23MULTI CAP CORE -1.44 16.00 -0.77 -0.18MULTI CAP VALUE -0.54 15.68 -0.08 -0.11
SMALL/MID CAP GROWTH -1.40 21.15 -0.35 -0.12SMALL/MID CAP CORE 3.17 20.66 4.25 0.10SMALL/MID CAP VALUE 7.67 20.13 8.27 0.29
North American Equity Funds
Clear evidence is found that once all funds have been classifiedinto Cap and Style classifications there is clearer performance distinction and risk distinction!

Large Cap Performance
7,000
7,500
8,000
8,500
9,000
9,500
10,000
10,500
Aug-01
Sep-01
Oct-01
Nov-01
Dec-01
Jan-0
2Fe
b-02
Mar-02
Apr-02
May-02
Jun-0
2Ju
l-02
Aug-02
Sep-02
Oct-02
Nov-02
Dec-02
Jan-0
3Fe
b-03
Mar-03
Apr-03
May-03
Jun-0
3Ju
l-03
Aug-03
Sep-03
Oct-03
Nov-03
Dec-03
Jan-0
4Fe
b-04
Mar-04
Apr-04
May-04
Jun-0
4Ju
l-04
Aug-04
Large ValueLarge CoreLarge Growth

Multi-Cap Performance
6,500
7,000
7,500
8,000
8,500
9,000
9,500
10,000
10,500
8/31/2
0019/2
8/2001
10/31
/2001
11/30
/2001
12/31
/2001
1/31/2
0022/2
8/2002
3/29/2
0024/3
0/2002
5/31/2
0026/2
8/2002
7/31/2
0028/3
0/2002
9/30/2
00210
/31/200
211
/29/200
212
/31/200
21/3
1/2003
2/28/2
0033/3
1/2003
4/30/2
0035/3
0/2003
6/30/2
0037/3
1/2003
8/29/2
0039/3
0/2003
10/31
/2003
11/28
/2003
12/31
/2003
1/30/2
0042/2
7/2004
3/31/2
0044/3
0/2004
5/31/2
0046/3
0/2004
7/30/2
0048/3
1/2004
Multi ValueMulti CoreMulti Growth
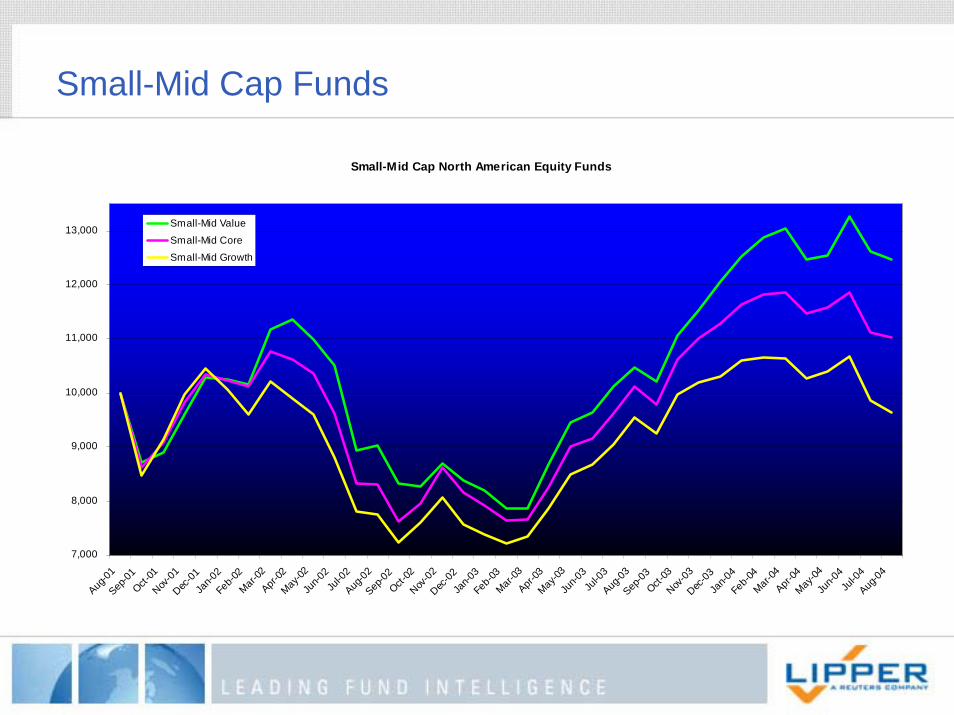
Small-Mid Cap Funds
Small-Mid Cap North American Equity Funds
7,000
8,000
9,000
10,000
11,000
12,000
13,000
Aug-01
Sep-01
Oct-01
Nov-01
Dec-01
Jan-0
2Fe
b-02
Mar-02
Apr-02
May-02
Jun-0
2Ju
l-02
Aug-02
Sep-02
Oct-02
Nov-02
Dec-02
Jan-0
3Fe
b-03
Mar-03
Apr-03
May-03
Jun-0
3Ju
l-03
Aug-03
Sep-03
Oct-03
Nov-03
Dec-03
Jan-0
4Fe
b-04
Mar-04
Apr-04
May-04
Jun-0
4Ju
l-04
Aug-04
Small-Mid ValueSmall-Mid CoreSmall-Mid Growth
Singapore Proposal for Introducing Lipper Holding Based Classifications
• Research– Complete Research on Top 5 Classifications by 12/31/2004
• Build Final Analysis by 03/31/2005• Send Client Info by 04/30/2005• Get Client Feedback• Deliver Final HBSA Classifications to the Market by 06/30/2005 for Top
5 Classifications

Review
• There are benefits to both Returns Based and Holdings Based Analysis• Together they provide a powerful tool for understanding and analyzing
your funds from both a top down and bottom up approach• For the first time you can compare funds to their active competitors and
get analysis on classifications and index for risk/return analysis with HBSA and Active Indices!
• Holdings Based Analysis provides strong benefits for monitoring and apples to apples comparisons
• Holdings Based Analysis benefits from regular full holdings disclosure but information is primarily beneficial in aggregate views – No Individual Managers holdings are released or need to be for institutions, intermediaries and individuals to benefit from the information
• We are trying to provide the ability to answer the “What If” and show the impact to your funds for investors and intermediaries to help set the best risk/reward expectations
• All of our Lipper Leader ratings are based HBSA Classifications
Questions?
Thank you