making difficult health decisions: a motivated decision by laura e
TRANSCRIPT

MAKING DIFFICULT HEALTH DECISIONS: A MOTIVATED DECISION
PROCESSING MODEL
by
Laura E. Zajac
B.S, Penn State University, 2000
M.S., University of Pittsburgh, 2007
Submitted to the Graduate Faculty of
Arts and Sciences in partial fulfillment
of the requirements for the degree of
Doctor of Philosophy
University of Pittsburgh
2011

ii
UNIVERSITY OF PITTSBURGH
College of Arts and Sciences
This dissertation was presented
by
Laura E. Zajac
It was defended on
September 13, 2010
and approved by
Cindy Bryce, Ph.D.
Julie Downs, Ph.D.
Martin Greenberg, Ph.D.
Thomas Kamarck, Ph.D.
William M. P. Klein, Ph.D.
Stephen Manuck, Ph.D.
Dissertation Chairs: Thomas Kamarck, Ph.D. and William M. P. Klein, Ph.D.

iii
Copyright © by Laura E. Zajac
2011

iv
MAKING DIFFICULT HEALTH DECISIONS: A MOTIVATED DECISION PROCESSING
MODEL
Laura E. Zajac, Ph.D.
University of Pittsburgh, 2011
This study introduces and evaluates a model of motivated health decision processing. In
this model, threatening health decision information is thought to lead to two potentially
incompatible motivations in decision makers: the desire to process information in an effortful
manner, and the desire to defend against threat. The model proposes that these dual motivations
lead to biased but effortful processing of decision options. The model was tested empirically by
experimentally manipulating exposure to threatening information and measuring decision
information processing and decision strategy selection. Participants (N = 100; age 40+) were
randomly assigned to one of two groups and exposed to either threatening or non-threatening
information about skin cancer. They were asked to read about and choose from five skin cancer
treatments; a computerized process-tracing tool recorded their pattern of information acquisition
as they perused the information. Results showed that compared to participants in the low threat
condition, participants in the high threat condition were more likely to avoid information about
death and to use an attribute-based decision strategy. Participants in the high threat condition
and participants who used an attribute-based decision strategy were also more likely to make an
accurate decision. Post hoc analyses showed that participants in the high threat condition were
more likely than participants in the low threat condition to use an effective lexicographic
decision strategy, and that anxiety and impulsivity moderated the relationship between condition
and decision strategy. The results of this study suggest that exposure to perceived threats can

v
lead to patients’ avoidance of frightening, but important, information about treatments and to the
use of heuristic decision strategies while making treatment decisions.

vi
Table of Contents
1. INTRODUCTION……………………………………………………………… 1
1.1 Motivated decision processing model………………………………. 2
1.2 Behavioral outcomes of model……………………………………..... 3
1.3 Threatening health information……………………………………... 5
1.4 Information processing……………………………………………….5
1.5 Empirical evidence…………………………………………………...8
1.5.1 Exposure to threatening information leads to
effortful processing……………………………….8
1.5.2 Exposure to threatening information leads to
defensive processing……………………………...10
1.5.3 Exposure to threatening information leads to
effortful but biased processing……………………11
1.6 Mediators……………………………………………………………..13
1.7 Decision making methodology……………………………………….14
1.8 Hypotheses……………………………………………………………16
1.9 Exploratory hypotheses……………………………………………….16
2 METHOD…………………………………………………………………………….17
2.1 Overview……………………………………………………………...17
2.2 Design………………………………………………………………...17
2.3 Pilot testing…………………………………………………………...19
2.4 Participants…………………………………………………………...21
2.5 Questionnaire measures…………………………………………...….21
2.6 Information processing measures……………………………………..22
2.7 Procedure……………………………………………………………..24
3 RESULTS…………………………………………………………………………….26
3.1 Sample……………………………………………………...…………26
3.2 Manipulation check………………………………………………...…27

vii
3.2.1 Worry/threat………………………………………27
3.2.2 Negative mood (PANAS)………………………...27
3.2.3 Decision conflict and satisfaction………………...28
3.3 Decision strategy measure……………………………………………28
3.4 Other measures………………………………………………………..30
3.5 Behavioral data……………………………………………………….30
3.6 Process data…………………………………………………………..31
3.6.1 Effortful processing………………………………32
3.6.2 Biased processing…………………………………32
3.6.3 Decision strategy………………………………….33
3.7 Alternative processing strategies……………………………………..33
3.7.1 Satisficing…………………………………………33
3.7.2 Selective exposure to information………………...35
3.8 Hypotheses………………………………………………………..…..35
3.8.1 Hypothesis 1………………………………………35
3.8.2 Hypothesis 2………………………………………36
3.8.3 Exploratory hypotheses………………………...…36
3.8.3.1 Status quo option………………….36
3.8.3.2 Mediation…………………………37
3.9 Post-hoc analyses……………………………………………………..39
3.9.1 Alternative decision strategy analyses……………40
3.9.2 Choice heuristics………………………………….42
3.9.2.1 Satisficing…………………………43
3.9.2.2 Lexicographic……………………..43
3.10 Moderators……………………………………………………..…45
3.10.1 Trait anxiety………………………………………46
3.10.2 Impulsivity…………………………..……………46
3.11 Summary of post-hoc analyses…………………………………...47
4 DISCUSSION……………………………………………………………………...…48
4.1 Unexpected findings………………………………………………….49

viii
4.2 Decision strategy……………………………………………………...51
4.3 Emotion as mediator………………………………………………….53
4.4 Implications for motivated decision processing model…………….…54
4.4.1 Threatening information leads to defensive
processing………………………………………....55
4.4.2 Threatening information leads to effortful
processing…………………………………………56
4.5 Implications for the default bias………………………………………57
4.6 Decision quality………………………………………………………58
4.7 Strengths…………………………………………………………..….60
4.8 Limitations……………………………………………………………61
4.9 Summary and future directions………………………………………66
5 References……………………………………………………………………………69
6 Appendix 1: Tables …………………………………………………………………..83
7 Appendix 2: Figures ………………………………………………………………….89

ix
LIST OF TABLES
Table 1. Illustration of Mouselab decision table for skin cancer treatment decision (high threat condition)…………………………………………………………………………..….84
Table 2. Illustration of Mouselab decision table for skin cancer treatment decision (low threat
condition)…………………………………………………………………………...…85
Table 3. Descriptive statistics and scale descriptions……………………….……..…………86
Table 4. Individual Analyses of Variance for condition predicting process measures…....…87
Table 5. Results of Chi Square test of relationship between participants who compared across the Long term risk attribute and participants who selected the optimal option……....88

x
LIST OF FIGURES
Figure 1. Motivated decision processing model……………………………………………..…89
Figure 2. Study procedure………………………………………………………………………90
Figure 3. Number of participants who selected the best option as a function of condition…….91
Figure 4. Mean time spent comparing across attributes……………………………………..…92
Figure 5. Mean time spent comparing across attributes by condition……………………….…93
Figure 6. Graph of the interaction between trait anxiety and condition…………………….…94
Figure 7. Graph of the interaction between impulsivity and condition…………………..……95

1
1.0 INTRODUCTION
With the decline of medical paternalism, patients bear an increased responsibility for
their own health decisions. Patients face treatment decisions that force them to consider
frightening and uncomfortable topics (e.g. illness, pain, and death) and prioritize their own
preferences and values (e.g. is quality of life more important than length of life?).
Current medical practice emphasizes informing patients about their treatment options and
services (Sheridan, Harris, & Woolf, 2004), but research on medical decision making suggests
that as few as half of patients deliberately process the available information (Green, Hewison,
Bekker, Bryant, & Cuckle, 2004; van den Berg, et al., 2006). Although decision aids have been
developed and researched in an attempt to encourage informed decision making and make these
decisions easier for patients (O’Connor et al., 1999), there has been little research exploring how
patients process information and choose decision strategies while making these types of difficult
health decisions. Understanding how patients work through difficult health decisions may help
providers and researchers improve patient decisions and encourage informed decision making.
Although a number of theories and studies have focused on how threatening health
information affects information processing (Chaiken, 1980; Petty & Cacioppo, 1986; Witte,
1992), existing evidence and theory does not specifically address how exposure to threatening
information affects decision information processing and the selection of treatment options. The
current study experimentally tested a model designed to predict decision processing behavior in
individuals faced with threatening health information. The study also explored how exposure to
threatening information affected the selection of treatment options.

2
1.1 Motivated Decision Processing Model
The proposed model (Figure 1) provides a framework for understanding how patients
process treatment options. The model draws from existing theories proposing that exposure to
threatening information leads to dual motivations. Several theories, including the parallel
process model (Leventhal, 1970), the extended parallel process model (Witte, 1992), and dual-
process theories of attitude change (Chaiken, 1980; Petty & Cacioppo, 1986), propose that
threatening information can have two effects: motivating intensive message processing and
motivating defensiveness. The proposed model applies the idea of dual-processes to a health
decision situation, proposing that people who are making a difficult health decision will
experience dual motivations as they process decision options. The dual motivations are thought
to lead to biased but effortful processing of decision options.
The proposed model predicts that when individuals face a difficult and serious health
decision, and are thus exposed to threatening information, they will experience two motivations:
effort motivation (a desire to engage in effortful processing of decision information) and
defensive motivation (a desire to protect the self by avoiding threats; Figure 1). To satisfy both
motivations, individuals will process decision information in a biased but effortful manner by
focusing on the reassuring parts of the treatment option information, avoiding the most
threatening information, and selecting a decision strategy that allows them to avoid making
difficult health trade-offs. In essence, patients use the decision-making process as a way of
coping with a threatening health decision. The process results in effortful but biased information
processing.
As others have observed (Lieberman & Chaiken, 1992), in order for effortful but biased
information processing to function as a successful defense mechanism, the change in processing

3
must be subtle enough for users to fool themselves. The avoidance of threatening information,
use of an avoidant decision strategy, and increased focus on reassuring information that occurs
during effortful but biased decision processing is subtle enough to result in a satisfied (i.e. self-
deceived) decision-maker.
The self-deception is possible because many people have an intuitive belief that thinking
harder equates to thinking better (Lerner & Tetlock, 2003). People also believe that a greater
effort will protect them from later feelings of regret. For example, a scenario study showed that
individuals report more regret over a failure when they have engaged in less instrumental effort
towards the outcome (van Dijk,van der Pligt, & Zeelenberg, 1999). Although some research
suggests that increased cognitive effort can reduce certain types of biases (Kennedy, 1993;
Siegel-Jacobs & Yates, 1996), thinking harder usually does not result in improved cognitive
processing or lead to better decisions (Lerner & Tetlock, 2003), and in some cases can make it
worse (Wilson & Schooler, 1991). The belief that greater effort improves decision quality
allows decision makers to feel satisfied after putting a great deal of effort into a decision while
also using an avoidant decision strategy, avoiding threatening information, and focusing effort
toward reading reassuring parts of the decision information. The current study identified the
type of decision strategy participants used and examined to which parts of the information people
paid attention in order to pick up on subtle processing changes.
1.2 Behavioral Outcomes of Model
The current study also explored how well the model predicts behavioral outcomes of the
decision process. The model has implications for two behavioral outcomes: the accuracy of the
decision option ultimately selected, and the selection of a default option.

4
According to the proposed model, patients facing threatening information while making a
difficult health decision will select an avoidant and therefore sub-optimal decision strategy.
Decision strategies that avoid trade-offs are not as effective in identifying optimal decision
options (Frisch & Clemen, 1994; Keren & Bruin de Bruin, 2003). Therefore, according to the
model, threatened individuals will be less likely than non-threatened individuals to make an
accurate decision (e.g. select the optimal option).
The study also explored whether threatened decision makers will be more likely than
non-threatened decision makers to select a default option. A general preference for avoidant
decision options has been well-documented in the literature. People are more likely to choose a
default option in many situations, from retirement investment allocation (Choi, Laibson,
Madrian, & Metrick, 2004), to living will construction (Kressel & Chapman, 2007), and organ
donor designations (Johnson & Goldstein, 2003; McKenzie, Liersch, & Finkelstein, 2006).
People also show a strong bias toward choosing the status quo option (Samuelson & Zeckhauser,
1988). Although there is evidence that a default option choice becomes more likely as a decision
task becomes more difficult and complex (Agnew & Szykman, 2005; Fleming, Thomas, &
Dolan, 2010), there has been no research specifically looking at whether threatening information
leads to greater selection of avoidant decision options. Given that one of the predictions of the
proposed model is that threatened decision makers will avoid decision conflict, then it is likely
that threatened decision makers will also be more likely than non-threatened decision makers to
select a default option. By selecting a default option, decision makers can avoid making difficult
trade-offs.

5
1.3 Threatening Health Information
Individuals facing difficult health treatment decisions face threatening health information
about possible illness, disability, and death as consequences of treatment options. However, most
research on the effect of threatening health information on information processing has not looked
at treatment decision making, but has been done in the context of persuading individuals to
pursue healthy preventive behaviors (Ruiter, Abraham, & Kok, 2001; Witte, 1992). In public
health and fear appeals research, threatening health information is designed to be persuasive, and
includes materials such as photos of diseased lungs (for smokers; White, Webster, & Wakefield,
2008) and articles or brochures about the health risks of behaviors such as smoking, overeating,
and tanning (Witte & Allen, 2000). The information is thought to be threatening because it
reminds individuals of potential illness and death that may result from their own actions.
In a decision context, decision option information is threatening when it includes
reminders of illness and death and when decision processing requires making difficult trade-offs
between important values. Individuals clearly find information about illness and death
threatening (Witte & Allen, 2000). Decision conflict and difficult trade-offs are also perceived
as threatening and anxiety-inducing (O’Connor et al., 1999, Luce, Bettman, & Payne, 1997). In
the current study, threat was manipulated by providing vivid information about illness and death,
and by experimentally manipulating the difficulty of the trade-offs in the decision.
1.4 Information Processing
In general, information can be processed in a heuristic or systematic manner. Heuristic
processing requires less effort and involves the use of heuristic shortcuts in judgment formation

6
(Chaiken, Liberman, & Eagly, 1989). Systematic processing is more comprehensive than
heuristic processing, involves greater effort, and results in greater comprehension and memory
for information (Petty & Cacioppo, 1986). In the proposed model, effortful processing is similar
to systematic processing.
Information processing can also be biased or objective. Biased processing can occur
when an individual is motivated to process only certain parts of a message. For example,
someone who receives both positive and negative feedback might only recall the positive
feedback. Individuals who feel threatened might be motivated to defend against the perceived
threat, and they are likely to focus on less threatening parts of a message (Lieberman & Chaiken,
1992). On the other hand, individuals motivated by a desire to be accurate are more likely to
process information objectively (Lundgren & Prislin, 1998). By engaging in what appears to be
a systematic approach to a decision, people can come to believe that they are being objective
(Kunda, 1990).
Processing that is both biased and effortful can be understood as careful information
processing that “spins” the information’s message to support the individual’s goals (e.g., to
reduce a perceived threat or avoid making trade-offs). In a decision context, people can process
decision options in an effortful but biased manner by choosing avoidant decision making
strategies and spending more time processing less threatening (reassuring) parts of the decision
information, while spending less time processing threatening parts of the information.
Effortful biased processing is similar to selective exposure to information. Selective
exposure research has found that people prefer to read information that is congenial to them and
that the desire to expose themselves to congenial information arises from a desire to avoid
cognitive dissonance (Hart, Albarracin, Eagly, Brechan, Lindberg, & Merril, 2009). However,

7
selective exposure research focuses on information seeking and exposure to information,
whereas effortful biased processing describes the cognitive processing of information. The
current study not only measured what information participants examined as they made the
decision (which could be explained by selective exposure), but also measured decision strategy
selection, a more processing-oriented measure that cannot be explained by selective exposure.
Biased processing is also related to satisficing. According to Simon (1957), human
cognitive limitations and the complexity of the environment lead decision makers to set a goal of
satisficing, or finding a decision option that is adequate rather than necessarily ideal. Satisficing
is thought to be an adaptive and beneficial decision behavior (Schwartz, Ward, Monterosso,
Lyubomirsky, White, & Lehman, 2002), whereas the proposed model suggests that biased
processing leads to poorer quality decisions. A decision maker who uses a satisficing strategy
eliminates options by comparing across attributes and an option that does not meet a cutoff level
for a specific attribute is eliminated (Payne & Bettman, 2001). Therefore, effortful biased
processing and satisficing can be distinguished by examining whether participants compared
across attributes first, then skipped or made only a cursory glance at options that did not meet a
cut-off on that attribute. Participants who are satisficing will compare across attributes early in
the information acquisition process and subsequently skip over eliminated options. In contrast, if
decision makers engage in effortful biased processing, they will spend more time looking at
reassuring information, less time on threatening information, and should not skip over specific
options.

8
1.5 Empirical evidence
A number of studies have examined the effect of exposure to threatening information on
information processing, but there have been no direct tests of the proposed model. There is,
however, empirical evidence supporting the following tenets of the model:
1. Exposure to threatening information leads to effortful processing;
2. Exposure to threatening information leads to defensive processing;
3. Exposure to threatening information leads to effortful but biased processing.
1.5.1 Exposure to threatening information leads to effortful processing
Empirical evidence shows that when people view threatening health information, they
process the information in an effortful manner. They spend more time focusing on the
information (Ditto & Lopez, 1992) and energetically scrutinize the quality of the information
(Eagly, Kulesa, Chen, & Chaiken, 2001; Liberman & Chaiken, 1992 ; Ditto, Scepansky, Monro,
Apanovitch, & Lockhart, 1998).
Threatened individuals also spend more time examining information. Using a fictitious
risk factor study design, Ditto & Lopez (1992) found that participants who received threatening
information about their risk of a serious pancreatic disease spent more time examining the test
results than did participants who received reassuring information.
Threatened individuals also expend a greater amount of energy examining the quality of a
message. For example, Liberman & Chaiken (1992) found that participants who read a
threatening health message about their caffeine consumption reported expending more effort

9
while reading the article when compared with participants who read a non-threatening message.
Another study played an audiotaped message that was either threatening or non-threatening to
participants’ positions on a social issue, and found that participants who listened to the
threatening message reported giving more thought and attention to the message and generated
more written thoughts when compared to participants who listened to a non-threatening message
(Eagly et al., 2001). Another study using a fictitious risk factor study design found that
participants who received threatening information about a health risk were sensitive to the
probability of alternate explanations for the findings, whereas participants who received non-
threatening information ignored information about the accuracy of the test, suggesting that
threatened individuals were more thorough in their analysis of available information (Ditto et al.,
1998). Unfortunately, none of these studies provided both reassuring and threatening
information to the same group, so it is impossible to discern whether threatened individuals
expend more effort processing all aspects of a message or whether they concentrate on the
reassuring or threatening information. The current study manipulated a threatening decision
situation while also providing reassuring and threatening decision information in order to
determine where participants focus their effort.
The empirical evidence showing that threatening information leads to effortful processing
supports the model’s tenet that in a decision context, people who receive threatening health
decision information are likely to feel motivated to process that information in an effortful
manner. The current study manipulates the level of threatening information and then uses
process variables to measure the amount of effort (operationalized as time) that participants
made in looking at decision options.

10
1.5.2 Exposure to threatening information leads to defensive processing
Empirical evidence shows that threatening information prompts defensively motivated
information processing. Threatened individuals downplay the seriousness of a threat (de Wit,
Das, & Vet, 2008; Jemmott, Ditto, & Croyle, 1986; Croyle, Sun, & Louie, 1993; Harris &
Napper, 2005;), question the accuracy of threatening information (Jemmott, et al., 1986; Croyle
et al., 1993; Kunda, 1987), and distort their memory for the message contents (Lipkus, McBride,
Pollak, Lyna, & Bepler, 2004).
Individuals who receive threatening information defensively process information by
minimizing the threat and questioning the accuracy of the threatening information. For example,
Jemmott et al. (1986) gave participants threatening information by telling them they had tested
positive for a (fictitious) risk factor linked to a serious disease, and found that compared to
participants who received negative results, those who received threatening information rated the
test lower in accuracy and the disease as less serious. A study that gave false feedback about
cholesterol status had similar findings: participants who received threatening information about
their cholesterol status rated the test as less accurate and rated high cholesterol as a less serious
threat to health than did participants who received non-threatening information (Croyle et al.,
1993).
Receiving threatening information can also prompt defensive processing in the form of
distorted memory for message contents. For example, a study that gave smokers feedback about
whether they were at increased genetic risk for lung cancer found that smokers who received
threatening information (that they had a high genetic risk for lung cancer) were less likely to

11
accurately recall their test results six months later when compared to smokers who received non-
threatening information (Lipkus et al., 2004).
Threatening information clearly leads to defensive processing in the form of downplaying
threats, questioning the accuracy of information, and misremembering threatening information.
However, decision situations involve more than simply receiving and processing information;
decisions also involve the selection of a decision strategy. Therefore, defensive processing may
occur somewhat differently in a decision context. Luce, Bettman, and Payne (1997) exposed
participants to threatening decision information by manipulating the vividness and consequences
of a decision, and found that participants who read the more threatening decision scenario used a
more attribute-based (avoidant) decision strategy when compared to participants who read a less
threatening scenario. The present study also manipulated the vividness of a decision scenario
and used process measures to identify the type of decision strategy selected by participants.
1.5.3 Exposure to threatening information leads to effortful but biased processing
According to the proposed model, dual motivations to process in an effortful and
defensive manner result in decision information processing that is both effortful and biased.
Although there is some evidence supporting effortful but biased processing in threatening
decision situations (Luce et al., 1997), most of the empirical evidence that threatening health
information leads to biased but effortful information processing comes from the persuasion
literature (Gleicher & Petty, 1992; Liberman & Chaiken, 1992; Ditto & Lopez, 1992; Lord,
Ross, & Lepper, 1979).

12
The previously mentioned study by Liberman and Chaiken (1992) found that not only did
threatened participants report expending more effort reading a threatening article, but they also
processed the message in a biased manner: they were more critical of threatening parts of the
message and less critical of reassuring parts. Unfortunately, the study did not include process
measures, so it is impossible to know whether the extra effort was spent in looking at the
threatening or reassuring parts of the message.
Other studies have found similar results. The fictitious risk factor study by Ditto and
Lopez (1992) found that not only did threatened participants expend more effort interpreting the
test results, but they were also more critical of the accuracy of the test and interpreted the
fictitious disease as less of a danger. Individuals who receive threatening health information
seem to process the information in an effortful manner, but also seem to be more critical and
defensive in their interpretation of the message.
One study specifically looked at whether expectations of reassurance affect the way
people process threatening information. Gleicher and Petty (1992) manipulated the level of
threat in a message, and found that unthreatened participants systematically read a persuasive
message, but threatened participants only processed the message systematically if they believed
it to be reassuring. The results of this study suggest that threatened individuals may expend
more effort looking at reassuring information in a message and may avoid threatening
information.
The only study that examined the effect of threatening information in a decision context
manipulated the vividness and consequences of a difficult decision and used process variables to
measure how participants processed the decision (Luce et al., 1997). Results showed that
compared to people in the low threat condition, people in the high threat condition processed

13
more extensively: they read more information and took more time to make the decision.
However, people in the high threat condition were more likely than those in the low threat
condition to choose a processing strategy that avoided explicit trade-offs. In other words,
threatening information prompted effortful processing, but it also led to avoidance of decision
conflict.
The proposed model predicts that decision makers who receive threatening health
information will be motivated to engage in effortful and defensive processing of decision
information. To satisfy both motivations, the model predicts that individuals will process
decision information in a biased but effortful manner. The evidence described above supports
separate parts of the model, but as of yet, there have been no direct tests of predictions from the
entire proposed model.
In the decision context of the current study, people who engage in effortful but biased
decision information processing were expected to select an avoidant decision strategy, spend
more time on the decision, focus on reassuring information, and avoid threatening information.
The current study used process measures to measure each of these variables.
1.6 Mediators
Although the model does not include mediators of the effect of threatening information
on decision information processing, the study included measures designed to explore mediation
of the main effect.
Negative emotion, including anxiety, worry, and fear, is widely thought to be an
important motivator of health-related information processing and behavior (Ruiter et al., 2001).

14
The current study included several measures of negative emotion in order to explore its role as a
potential mediator of the effect of threatening information on health decision making.
Anticipated regret has also been identified as a predictor of health behavior (Abraham &
Sheeran, 2004), and it is possible that threatening information may lead to a greater anticipation
of regret related to making a poor decision. Previous research suggested that people anticipate
experiencing greater regret when considering adverse consequences caused by action rather than
inaction (Ritov & Baron, 1992, 1995 ), suggesting that greater regret might lead to greater use of
heuristic (less effortful) decision strategies. However, more recent work was able to reverse that
effect by manipulating prior outcomes. Zeelenberg, van de Bos, van Dijk, & Pieters (2002)
showed that after negative outcomes, people experienced greater regret in response to inaction.
It is therefore unclear whether anticipated regret will affect decision making, and the current
study explores whether anticipated regret mediates the effect of threatening information on
decision strategy selection.
1.7 Decision Making Methodology
An individual’s selection of a decision strategy can be measured and interpreted in many
ways. Behavior decision research has established that an “ideal” decision processing strategy
(i.e. one that is systematic and accurate) is extensive (processing all the relevant information),
consistent (rather than selective) across options and option attributes, and based on comparing
options rather than comparing attributes across options (Keeney & Raiffa, 1976; Payne, Bettman,
& Johnson, 1988). For example, a potential homeowner selecting from five houses, each of
which differs on several attributes (e.g. school district, price, quality of kitchen), might carefully

15
consider all of the information about each house, process the same amount of information for
each house and each dimension, and weight each dimension, summing the weights for each
house. This type of strategy reflects systematic processing and requires the decision-maker to
make explicit trade-offs among attributes (e.g. deciding whether a higher quality school district
is worth a higher house price). Other processing strategies allow a decision-maker to avoid
making explicit trade-offs. For example, a potential homeowner could set cut-off values for
attributes (e.g. eliminating houses in poor quality school districts, regardless of price or kitchen
quality) or simply compare options across a specific important attribute (e.g. choosing the least
expensive house).
The current study measures decision strategy and distinguishes between more systematic
strategies in which the decision maker makes explicit trade-offs, and heuristic or attribute-based
strategies in which the decision maker avoids trade-offs. One of the hypotheses in the current
study is that participants in the high threat condition will be more likely than participants in the
low threat condition to select an attribute-based decision strategy, thus avoiding explicit trade-
offs.
Decision strategy selection can be measured using process tracing tools. Hypermedia
process tracing was used in the study. A computer program called MouselabWeb (Willemsen &
Johnson, 2009) was used to record the information acquisition process of each decision maker in
the study, and that information will be analyzed to determine whether participants avoided
making explicit trade-offs as they made the decision, and whether they processed information in
a systematic, extensive, and consistent manner.

16
1.8 Hypotheses
This research tested the predictions made by the motivated decision processing model.
The study manipulated threatening information in order to explore how exposure to threatening
information changes decision processes during difficult health decisions. The study tested the
entire model and used a process tracing tool to examine actual information acquisition behavior.
The study tested the main effect of exposure to threatening information on decision information
processing. Specifically, the hypotheses were:
1. Exposure to threatening information will lead to a greater focus on reassuring parts of
decision information, avoidance of threatening information, and the use of attribute-based
(trade-off avoidant) decision strategies.
2. Exposure to threatening information will lead to the increased use of effortful processing.
Evidence supporting both hypotheses would support the proposed model’s prediction that
individuals exposed to threatening health information would engage in effortful but biased
processing of decision information.
1.9 Exploratory Hypotheses
The study also tested several exploratory hypotheses: whether exposure to threatening
information will lead to the increased selection of a status quo decision option, and whether the

17
main effect of threatening information on decision processing is mediated by negative emotion
or anticipated regret.
2.0 METHOD
2.1 Overview
The study used an experimental design and manipulated participants’ level of perceived
health threat by 1) introducing a threatening or nonthreatening scenario about skin cancer and 2)
increasing the difficulty of trade-offs during a health decision. Participants made a health
treatment decision after looking at a table of information about hypothetical skin cancer
treatment options. Decision information was presented using a computerized table and a
computer program recorded participants’ information acquisition. One of the treatment options
(“Oral medication”) was designed to be better than the other options. After looking at the
treatment information, participants chose a treatment, and one option was marked as a default
choice. Participants also completed measures of mood, anticipated regret, impulsivity, decision
satisfaction, decision conflict, and perceived confidence in their own judgment of skin cancer
treatment.
2.2 Design
The study included a high threat condition and a low threat condition. The manipulation
included two components. First, in the high threat condition, participants read a vivid and
threatening scenario about a skin cancer diagnosis (e.g. “Imagine that a mole on your wrist has

18
changed in shape and become painful to the touch. You visit your physician and he takes a small
biopsy. When you return to the office a week later for the results, your physician enters the
exam room and says, ‘I have bad news.’”). Second, the decision trade-offs in this condition were
difficult. For example, two of the treatment options forced participants to choose between “some
risk of immediate death” but “low chance of recurrence” and “low risk of immediate death” but
“moderate risk of recurrence.” Participants in the low threat condition read a neutral set of
instructions on making a decision (e.g. “In the next part of the study, we will ask you to look
over five skin cancer treatment options.”) and decision trade-offs were designed to be simpler
(e.g. participants chose between one treatment that offered “low risk of immediate death” and
“low chance of recurrence” and another that offered “some risk of immediate death” and
“moderate chance of recurrence”).
Information processing was measured using a computerized decision information table
with treatment options (e.g. Deep Tissue Surgery, Laser Treatment) in rows and attributes (e.g.,
benefits, side effects) in columns (see Tables 1 and 2). Information on each attribute was hidden
and only visible by mouseover. The MouselabWeb process tracing program recorded the mouse
movements of participants, including the amount of time spent mousing over each text box, the
order in which participants moved between text boxes, and overall decision time. The table was
balanced so that each cell included 9-12 words.
In order to make it possible to measure of the quality of the decision, the decision options
were designed so that one of the options (Oral Treatment) was subtly dominant over the other
four options. The dominant option, when compared to the other four options, was a better
balance of risks and benefits (e.g. minor side effects, very low risk of cancer recurrence) and
included the highest chance of reaching the goals of avoiding cancer recurrence, death from skin

19
cancer, and major side effects. Also, in order to delay the actual decision and assess information
processing separately from the actual decision selection, participants were told that they would
see information on five treatment options, but that they would not yet know which of those five
options would be available. Participants viewed the decision information on the computer first
and then later selected a decision option on paper.
One of the decision options was pre-selected in order to act as a default option.
However, participants did not know that a default option existed while they processed the
information. The default option was randomly assigned among the four non-dominant choice
options. The decision table was pre-tested during pilot testing in order to establish clarity and
dominance of the decision option.
2.3 Pilot testing
Pilot testing was conducted to test the strength of the manipulation, clarity of the decision
table, and dominance of the optimal option. Pilot test participants were the first 20 individuals
who responded to on-campus voice-mail recruitment advertisements.
Participants in the high threat condition reported feeling significantly more worried about
skin cancer (“At this moment, how worried do you feel about skin cancer?”; scale ranged from 1
[not at all] to 7 [extremely]; high threat: M = 3.29 [1.70], low threat: M = 2.70 [1.01], t = 4.49, p
< .001) and indicated that the scenario was significantly more threatening when compared to
ratings made by the low threat participants (“How threatening is the information in this
scenario?”; scale ranged from 1 [not at all threatening] to 7 [extremely threatening]; high threat:
M = 5.00 [1.41], low threat: M = 1.50 [0.92], t = 6.45, p < .001).

20
During the debriefing, participants reported that the information in the decision table was
clear. In the decision satisfaction questionnaire, nearly all participants strongly agreed or agreed
with the statements: “I know which options are available to me” (A 5-point Likert scale ranging
from 1 [strongly agree] to 5 [strongly disagree]: M = 1.45 [.51]; 55% selected strongly agree,
45% selected agree), “I know the benefits of each option” (M = 1.65 [.59]; 40% selected strongly
agree, 55% selected agree), “I know the risks and side effects of each option” (M = 1.70 [.57];
35% selected strongly agree, 60% selected agree). The pilot results suggested that the
information about the treatment options was clear and understandable to participants.
Nearly half (45%) of the pilot participants selected the optimal option (oral medication),
suggesting that it was dominant enough without being too obvious (all of the other options were
selected at least once by participants).
Since the pilot data indicated that the manipulation had a strong effect on worry and
perceived message threat, I used the manipulation in the full study. If pilot testing had shown the
manipulation to be ineffective, I would have adjusted the manipulation and completed another
pilot study. To ensure that the pilot participants were representative of the larger sample, I
conducted manipulation check analyses on the larger sample of participants who were not
included in the pilot study. The results showed that non-pilot participants in the high threat
condition reported feeling significantly more worried about skin cancer (high threat: M = 5.55
[1.41], low threat: M = 1.93 [1.30], t = 141.69, p < .001) and indicated that the scenario was
significantly more threatening when compared to ratings made by the low threat participants
(high threat: M = 5.35 [1.90], low threat: M = 2.63 [1.61], t = 47.77, p < .001). The results of
these analyses did not differ from the manipulation check results based on the entire sample, and
so the entire sample (including the pilot participants) was used in analyses.

21
2.4 Participants
One hundred and two men and women from the community participated in the study.
Participants were recruited through advertising on an online classified ad site, a university-
affiliated research registry, a medical center staff newsletter, and a voicemail newsletter sent to
university and medical center staff. Two participants were removed from the sample because of
technical problems with the MouseLabWeb program, leaving a total sample of 100. Exclusion
criteria included a previous diagnosis of skin cancer and the inability to read English. Mean age
was 52.13 (SD = 8.01). Because the majority of people diagnosed with melanoma, the most
dangerous type of skin cancer, are over age 40 (National Cancer Institute, 2008), individuals
younger than 40 years of age were excluded from the study. The sample was largely female
(78%), white (78%), and well-educated (60% reported having a college or post-graduate degree).
Participants received $10 after participating.
2.5 Questionnaire Measures
Questionnaire measures included measures of worry about skin cancer, mood (Positive
and Negative Affect Scale (PANAS); Watson, Clark, & Tellegen, 1988), anticipated regret, trait
anxiety (State-Trait Anxiety Inventory; Spielberger, 1983; items include statements such as, “I
feel nervous and restless,” and “I am calm, cool, and collected.”), impulsivity (Barratt
Impulsiveness Scale; Patton, Stanford, & Barratt, 1995; items include statements such as, “I plan
tasks carefully” and “I have “racing” thoughts.”), Satisfaction with Decision Scale (Sainfort &
Booske, 2000; 6-item scale includes statements such as, “I am satisfied that I made a good

22
decision.”), Decisional Conflict Scale (a scale developed specifically as a way to evaluate health
care consumer decision aids; O’Connor, 1995; items include statements such as, “I know the
benefits of each option,” and “I am clear about the best choice for me.”), demographic
information, and perceived confidence in one’s own judgment of skin cancer treatment (see
Table 3).
2.6 Information Processing Measures
Several measures of information processing taken from the process tracing tool were used
to determine each participant’s level of biased systematic information processing. Measures
included the total time spent making the decision, the amount of information examined, the
proportion of time spent looking at the “Benefits of treatment” column and “Likelihood of
immediate death” column, and the decision strategy used.
First, the total time spent making the decision was calculated by adding together the time
spent mousing over boxes in the decision matrix. Participants who spent more time in the matrix
were assumed to have spent more effort looking at the information. The number of boxes a
participant moused over was also counted, with a greater number of boxes opened indicating a
greater level of effort. Previous studies have used these measures of time for calculating level of
decision effort (Drolet & Luce, 2004; Luce et al., 1997).
In order to measure the amount of biased processing that occurred, the proportion of time
participants spent looking at the reassuring parts of the information (e.g., Benefits of treatment)
was calculated. Participants in the high threat condition who processed in a biased way were
expected to spend a greater proportion of time looking at the less threatening information. The

23
proportion of time participants spent looking at the most threatening parts of the information
(e.g., likelihood of immediate death) was also calculated. Participants in the high threat
condition who processed in a biased way were expected to spend a smaller proportion of time
looking at the less threatening information.
Finally, each participant’s decision strategy was identified. By examining the pattern of
information acquisition, it was possible to determine whether participants used an extensive,
systematic, and consistent (optimal) strategy or avoidant decision strategy. In an optimal
decision strategy, participants make an overall judgment of each option, systematically looking
through each option’s attributes. For example, an optimal decision approach would be to look
through all the attributes of Treatment 1 (Benefits, Side effects, Long term risks, etc.) before
moving on the Treatment 2. In contrast, participants using an avoidant strategy would compare
each treatment option along a single dimension. For example, an avoidant strategy would be to
look through the Benefits for each treatment (Treatment 1, Treatment 2, etc.), thus avoiding
making trade-offs (since the decision maker would be able to simply select an option based on
which has the best benefits).
Decision strategy was calculated by first counting the number of times a participant made
comparisons between attributes. That number was then compared to the number of times the
participant made comparisons between treatment options. The number of times a participant
transitioned between attributes within the same treatment option (e.g., while looking at
Treatment 3, the participant first moused over a box containing information on Side effects,
followed by a mouseover of a box containing information on Long-term risk) were added
together, and the number of transitions between treatment options was subtracted from the
attribute-transition total. The sum was divided by the total number of boxes opened during the

24
experiment, and the resulting number, ranging from -1 to 1, indicated the decision strategy used
by the participant. Lower scores indicate a more attribute-based or avoidant strategy. This
method of calculating decision strategy has been used in other studies of decision processing
(Drolet & Luce, 2004; Glockner & Betsch, 2008; Luce et al., 1997; Reisen, Hoffrage, & Mast,
2008).
2.7 Procedure
A diagram illustrating the experimental procedure is in Figure 2. Participants were
randomly assigned to the high threat or low threat condition. Participants completed the study
individually. They first completed an informed consent form and learned that the purpose of the
study was to find out more about how people make health decisions. Participants in both
conditions then completed questionnaires assessing their level of fear, worry, and anxiety about
skin cancer as well as the Trait Anxiety Measure (Spielberger, 1983) and two questions designed
to assess participants’ confidence in their own judgments of skin cancer treatments (“How
confident do you feel about your judgments/assessment of skin cancer treatments”). Responses
to the items assessing confidence in treatment judgments were later examined to assess whether
that confidence affects the perception of threatening information. Questions about heart disease
were included in the questionnaire to avoid priming participants to the relevance of skin cancer.
Participants then spent several minutes learning how to use the Mouselab Web program using a
simple, non-health decision task.
Participants then received instructions for the main decision task. Participants in both
conditions were told that they would make a hypothetical decision about treatment for skin

25
cancer. However, participants in the high threat condition read a vivid description of the
decision situation (“Imagine that you have noticed that a mole on your wrist has changed in
shape and become painful to the touch…Your physician says, “This type of skin cancer is rare
and dangerous. If untreated it will quickly spread to other parts of your body and you will die
from it.”… “Right now there are 5 treatment options, but I’m not sure which ones are covered by
your insurance.” He gives you a list of treatments along with their short and long-term
outcomes, benefits, and side effects. .”)
Participants in the neutral condition received a bland and neutral description of the task
(“In the next part of the study, we will ask you to look over 5 skin cancer treatment
options…You will see information about the different treatments…Please look over the options,
and in 5 minutes, the experimenter will give you a list of which treatments are available and then
you can choose what you think is the best of the available options.”). In order to delay the actual
decision and thus assess information processing separately from the actual decision selection,
participants in both conditions were told that it was possible that not all of the options would be
available when it was time to make a decision. In order to control for level of motivation,
participants in both conditions were told that they would receive feedback on the quality of their
decision following the decision task.
Participants next completed a brief manipulation check questionnaire (“How threatening
is the information in this scenario?”; scale ranged from 1 [not at all threatening] to 7 [extremely
threatening]; “At this moment, how worried do you feel about skin cancer”; scale ranged from 1
[not at all worried] to 7 [extremely worried]). Participants were then presented with the
Mouselab Web decision matrix (see Tables 1 and 2) and given instructions to look over the
information. After they finished looking at the decision table, they completed another

26
questionnaire assessing the level of threat of the decision information (“How threatening was the
information about the skin cancer treatment options” and “How frightening was the information
about the skin cancer treatment options”; scale ranged from 1 [not at all] to 7 [extremely]), a
brief version of the PANAS (Watson et al., 1988), and a question about anticipated regret (“How
afraid are you of regretting your decision?”; scale ranged from 1 [not at all] to 5 [extremely]).
After completing the brief questionnaire they viewed a list of the treatment options with
one option selected (the status quo option). The instructions read, “You can select from any of
the 5 options. Because there are multiple options, the computer randomly selected one. You
may select a different option if you prefer.” After making their decision, participants completed
the Satisfaction with Decision Scale (Sainfort & Booske, 2000), the Decisional Conflict Scale
(O’Connor, 1995), the Barratt Impulsiveness Scale (Patton et al., 1995), and demographic
measures.
3.0 RESULTS
3.1 Sample
The high threat and low threat conditions did not differ significantly on age, gender,
education, ethnicity, or baseline level of worry about skin cancer (ps > .20).

27
3.2 Manipulation Check
3.2.1 Worry/Threat
Replicating the findings of the pilot data, the results of ANOVAs conducted on the entire
sample of 100 participants found that the manipulation was effective: participants in the high
threat group perceived the scenario as more threatening (M = 5.44 [1.42] vs M = 1.84 [1.25], t =
13.47, p < .001; “How threatening is the information in this scenario?”) and reported higher
levels of worry about skin cancer immediately after reading the scenario (M = 5.34 [1.81] vs M
= 2.64 [1.51], t = 8.09, p < .001; “At this moment, how worried do you feel about skin
cancer?”). After looking over the treatment options, participants in the high threat condition
perceived the information as more frightening (M = 3.87 [1.74] vs M = 2.98 [1.70], t = 2.52, p =
.014; “How frightening was the information about the skin cancer treatment options?”), but only
marginally more threatening (M = 3.28 [1.59] vs M = 2.76 [1.51], t = 1.68, p = .10; “How
threatening was the information about the skin cancer treatment options?”).
3.2.2 Negative mood
Participants completed the PANAS immediately after viewing the decision table. T-tests
showed that participants in the high threat group reported significantly more negative affect
when compared to the low threat group (see Table 3; M = 24.35 [10.26] vs M = 16.76 [4.91], t =
4.50, p < .01). There was no difference in positive affect between the groups.

28
3.2.3 Decision conflict and satisfaction
Two additional measures designed to assess level of decision conflict (Decisional
Conflict Scale, O’Connor, 1995) and level of decision satisfaction (Satisfaction with Decision
Scale, Sainfort & Booske, 2000) were also analyzed to assess whether the manipulation
increased the level of decision conflict experienced by participants in the high threat condition.
Contrary to expectations, there was no significant difference in reported level of decision conflict
between conditions (high threat: M = 29.36 [9.42], low threat: M = 32.62 [9.01], p = .08; higher
scores indicate greater level of reported conflict). In addition, and surprisingly, participants in
the high threat condition reported a greater level of satisfaction with their decision (M = 24.6
[3.77]) than did the low threat participants (M = 23.0 [3.50], p = .030).
3.3 Decision Strategy Measure
Prior to analyses of decision strategy, time to decision, and number of boxes opened,
demographic variables were assessed to determine whether to control for demographics.
Education level was correlated with several outcome measures (total time to decision [r = .21 , p
< .05], number of boxes opened [r = .27 , p < .01], decision strategy selection [r = -.38 , p <
.01]), and so was controlled for in most analyses.
To assess the validity of the decision strategy measure, a binary logistic regression
analysis was conducted to explore whether the decision strategy measure predicted participants’
selection of the optimal treatment option. If the decision strategy score is a valid measure of
effective information processing, a higher (i.e., more option-based and extensive) decision

29
processing score should predict selection of the optimal option. The analysis showed that the
decision strategy score significantly predicted selection of the optimal treatment option (B = -
1.60, Wald = 6.31, p < .05); however, contrary to expectations, participants with a lower (i.e.,
more attribute-based) decision strategy score were more likely to select the optimal treatment
option. In other words, participants who used an avoidant decision strategy actually made better
decisions. This finding brings into question the validity of the decision strategy measure, given
the expectations that participants who used a more extensive, option-based strategy would be
more likely to select the optimal option. Post-hoc analyses using a revised decision strategy
measure are discussed later.
The study included two measures of effortful decision processing: comparing the number
of boxes opened and the overall time to decision. A logistic regression analysis found that the
total time to decision did not predict decision strategy. However, a linear regression analysis
found that the number of boxes opened significantly predicted the type of decision strategy
participants used (β = .56, t [98] = -6.62, p < .001). Participants who looked at more information
used a more extensive decision strategy. An additional analysis, aimed at establishing the
validity of the measures of effortful decision processing, looked at whether opening more boxes
or spending more time on the decision led to greater selection of the optimal option. Results
showed that the number of boxes opened significantly predicted selection of the optimal
treatment option (B = .029, Wald = 8.72, p = .003), but that the total time spent making the
decision was not predictive of selection of the optimal option (B = .00, Wald = 2.57, p = .12).

30
3.4 Other Measures
Table 3 lists the means by condition and descriptions of the questionnaire measures used.
Measures of confidence in one’s judgment of skin cancer treatments, baseline measures of skin
cancer worry, and trait measures of anxiety and impulsivity did not predict decision strategy,
selection of the best decision option, number of boxes opened, or overall time to decision.
Therefore, these measures were not included as control variables in other analyses.
3.5 Behavioral Data
The process measures included in this study were designed to assess how participants
made their decision. However, prior to analyzing the process variables, I first examined
participants’ actual decision behavior. Which option did participants ultimately choose?
The decision options were designed so that one option (“oral treatment”) dominated the
others. In addition, for each participant, one of the four non-optimal options was randomly
selected to be a status quo selection: it was pre-checked and participants could either leave that
option selected or choose a different option.
The results of a logistic regression analysis with condition as the IV and choice of the
status quo option as the DV, controlling for education, show that contrary to the exploratory
hypothesis, participants in the high threat condition were no more likely than those in the low
threat condition to choose the status quo option (B= -.18, Wald = .16, p = .68). Level of threat
therefore did not predict selection of a status quo option. However, across conditions,

31
participants selected the status quo option significantly more frequently than expected (30% of
participants selected the status quo option (20% expected); X2 [1, N = 100] = 6.25, p = .012).
Surprisingly, participants in the high threat condition were significantly more likely than
those in the low threat condition to select the optimal option (see Figure 3). A logistic regression
analysis, controlling for education, found the difference between the groups to be significant (B=
-.92, Wald = 4.29, p < .05). This finding is contrary to expectations; according to the proposed
theory and the hypotheses, participants under high threat should process in an effortful but biased
manner, resulting in sub-optimal processing and the selection of a non-optimal option. However,
this behavioral finding shows that participants under high threat instead identified and selected
the best option.
In order to understand how high threat participants ultimately came to choose the optimal
option, we turn to the process data. What information did participants under high threat focus on
or avoid, and what type of decision strategy did they use?
3.6 Process Data
Process measures provided information on the level of effort participants made as they
processed the decision information, the amount of bias they showed in avoiding or focusing on
specific information, and the decision strategy they used.

32
3.6.1 Effortful processing
Two variables, the total time spent making the decision and the number of information
boxes opened, were used to define the level of effort participants made in processing the decision
information. Contrary to the hypotheses, ANCOVAs (controlling for education) showed that
there was no difference in either total time or number of boxes opened between the high threat
and low threat conditions (see Table 4).
3.6.2 Biased processing
In order to assess the level of biased processing participants engaged in, I calculated the
proportion of time spent looking at the “Benefits of Treatment” and “Chance of Immediate
Death” attributes. Proportion of time was calculated by dividing the amount of time each
participant spent reading the “Benefits” and “Immediate Death” attribute boxes by the total time
spent in the entire decision table. An ANCOVA (controlling for education) found that there was
no difference by condition in the proportion of time participants spent looking at the Benefits of
Treatment (F [1,98] = 2.15, p = .15; see Table 4). However, consistent with hypothesis 1,
participants in the high threat condition spent a significantly smaller proportion of time looking
at the Chance of Immediate Death attribute (High threat M = .15 (15% of time), Low threat M =
.22 (22% of time); F [1,98] = 3.86, p = .053; see Table 4).

33
3.6.3 Decision strategy
As described earlier, the decision strategy calculation was designed to assess whether
participants were making an overall judgment of each individual option and comparing options
to each other (extensive decision strategy), or whether they were looking at how options differed
along individual attributes (attribute-based strategy). The results of an ANCOVA showed that
there was no difference in decision strategy between the two conditions (F [1,98] = .007, p = .93;
see Table 4).
3.7 Alternative processing strategies
The information acquisition data were further examined to assess whether participants
were using a satisificing strategy or engaging in selective exposure to information.
3.7.1 Satisficing
Satisficing is a type of heuristic processing in which the decision maker searches for the
first available alternative that meets a certain set of criteria. If participants in this study used a
satisficing strategy, then an analysis of the process data should show that participants who were
satisficing compared across attributes, then skipped over some treatment options.
To determine whether participants compared across attributes early in the decision
process, I coded the process data to identify participants who viewed at least four attributes in a
row during the first half of their information acquisition time (e.g., a participant looked at

34
“Benefits of Treatment” boxes for Deep Tissue Surgery, Shallow Tissue Surgery, Oral
Treatment, and Laser Treatment sequentially). Twenty-nine participants viewed at least four
attributes in a row during the first half of their information acquisition (14 were in the High
threat condition and 14 were in the Low threat condition).
Next I determined whether participants skipped or only made a cursory glance at an
option. I defined “cursory glance” as one that was more than one standard deviation below the
participant’s mean time spent in each box. I first calculated the amount of time per box each
participant spent by option (e.g., participant X spent an average of 5 seconds looking at each
Laser Treatment box). Then I compared that number to the overall mean time per box for each
participant, and noted which participants spent more than 1 standard deviation below their own
mean box time in a specific option (e.g. Participant X’s overall mean box time was 7 seconds
[SD = 2], but he spent less than 5 seconds per Oral Treatment box). Participants who spent more
than 1 standard deviation below their overall mean box time viewing boxes in a specific option
were coded as having made only a cursory glance at an option (19 participants made a cursory
glance at least one option; 10 in the High threat condition and 9 in the Low threat condition).
Finally, participants were coded as to whether they used a satisficing strategy: did they
view at least four attributes in a row during the first half of their information acquisition and
make a cursory glance at a minimum of one option? Overall, 14 participants used a satisficing
strategy, but a chi-square analyses did not find a significant difference between conditions. In
short, some participants (up to 14%) may have used a satisficing strategy, yet condition did not
seem to have a differential effect on satisficing behavior.

35
3.7.2 Selective exposure to information
To assess whether high threat participants engaged in a greater level of selective
exposure to information (i.e., seeking information that was congenial to them), I examined
whether they spent more time with reassuring information without adjusting their decision
strategy. As reported earlier, high threat participants spent a significantly smaller proportion of
time looking at information on the chance of immediate death, but they did not spend more time
looking at information on the benefits of treatment. At the same time, as reported earlier, high
threat and low threat participants used the same type of decision strategy (see Table 4). Thus,
there is some support for the idea that participants in the high risk condition may have engaged
in selective exposure to information, given that they avoided threatening information without
changing their decision strategy.
3.8 Summary of main hypotheses
3.8.1 Hypothesis 1
The first hypothesis predicted that participants in the high threat condition would spend
proportionally more time looking at the reassuring information (“Benefits of treatment”), less
time looking at threatening information (“Likelihood of immediate death”), and use a more
attribute-based decision strategy. Analyses showed that there was no difference between
conditions on time spent looking at “Benefits of treatment,” that the high threat group spent a

36
smaller proportion of time looking at information about death, and that there was no difference
by condition in decision strategy (see Table 4).
3.8.2 Hypothesis 2
The second hypothesis predicted that participants in the high threat condition would
expend more effort than participants in the low threat condition by opening more boxes and
spending more time making the decision. Analyses found no difference in the amount of time or
number of boxes opened between conditions (F [1, 98] = .14, p = .71; F [1, 98] = .10, p = .76)
and found that high threat participants did avoid threatening information (e.g., “Immediate
Death” information), but did not spend more time with reassuring information.
3.8.3 Exploratory hypotheses
The study tested two exploratory hypotheses: whether exposure to threatening
information will lead to the increased selection of a status quo decision option, and whether the
main effect of threatening information on decision processing is mediated by negative emotion
or anticipated regret.
3.8.3.1 Status quo option
The results of a logistic regression analysis showed that contrary to the exploratory
hypothesis, participants in the high threat condition were no more likely than those in the low

37
threat condition to choose the status quo option (B = -.18, Wald = .16, p = n.s.). Level of threat
did not predict selection of a status quo option.
3.8.3.2 Mediation
In order to test the exploratory hypothesis that the effect of threatening information on
decision processing is mediated by negative emotion or anticipated regret, mediational analyses
were conducted. In their comparison of methods of assessing mediation effects, MacKinnon,
Lockwood, Hoffman, West, and Sheets (2002), found the Sobel test (Sobel, 1982) and its
variants to result in the most accurate Type I error rates and to have greater power than the Baron
and Kenny (1986) method to detect small and medium effect sizes. Therefore, the Sobel test
(1982) was used to assess the indirect effect of condition on intentions through reported worry.
A Statistical Package for the Social Sciences (SPSS; SPSS Inc., Chicago, Illinois) macro
developed by Preacher and Hayes (2008) was used to test whether the indirect effect of condition
on intention through worry was significantly different from zero. The macro tests the indirect
effect using the Sobel test (1982), by determining whether there is a significant difference
between the total effect (condition predicting intention) and the direct effect (condition
predicting intention with the mediator in the equation). The indirect effect of the mediator is the
difference between the total effect and the direct effect.
Negative emotion and worry. Linear regression analyses (controlling for education) found that
the main effect of negative emotion (measured by the PANAS) on the proportion of time
participants spent looking at information on the chance of immediate death and side effects was

38
not significant (immediate death: B = -.028, t = -.27, p = .79; side effects: B = -.54, t = -.53, p =
.60). Similar analyses looking at the main effect of worry (measured immediately after the
manipulation) on the two variables found that the effect was also not significant (immediate
death: B = -.074, t = -.76, p = .45; side effects: B = -.12, t = -1.25, p = .22). A linear regression
analysis looking at the main effect of negative emotion on optimal decision choice found a trend
such that the higher participants’ reported negative emotion, the more likely participants were to
select the optimal option (B = .18, t = 1.80, p = .083). However, a linear regression analysis
looking at the main effect of worry on optimal decision choice was not significant (B = .15, t =
1.51, p = .14).
Contrary to expectations, neither negative emotion (measured by the PANAS) nor worry
about skin cancer mediated the effect of condition on the proportion of time participants spent
looking at information on the chance of immediate death and side effects. Additional analyses
found that negative emotion and skin cancer worry also did not mediate the main effect of
condition on optimal decision choice.
Anticipated regret. An ANCOVA (controlling for education) found that participants in the high
threat condition reported a higher level of fear of regretting their decision (“I am afraid of
regretting my decision”; scale ranged from 1 [very slightly or not at all] to 5 [extremely]; high
threat: M = 1.98, low threat: M = 1.22; F [1, 91] = 15.7, p <.001). However, mediational
analyses found that anticipated regret did not mediate the main effect of condition on time
looking at information on death and side effects, or the main effect of condition on optimal
decision choice.

39
3.9 Post-hoc analyses
Although the results reported above partially support the hypothesis that individuals
under high threat avoid threatening information, the surprising finding that participants under
high threat made better decisions than those under low threat is thus far unexplained by the
process data. Also unexplained is why participants who used an attribute-based, avoidant
decision strategy were more likely to select the optimal option. To explore these unexpected
behavioral findings, a series of post-hoc analyses was performed.
The first set of post-hoc analyses look at two explanations for why attribute-based
decision strategy use predicted the selection of the optimal option. First, the decision strategy
measure may not have been a valid measure of attribute-based (avoidant) and option-based
(extensive) decision processing. To explore this possibility, I developed an alternative measure
of decision strategy. Second, participants may have used an effective heuristic decision strategy
that was not captured by the process measure variables reported above. I further analyzed the
process data to discover whether a satisficing or lexicographic decision strategy could explain
the behavioral data.
The second set of post-hoc analyses explore whether individual difference variables can
explain differences in the behavioral data. Subgroups of the sample, such as those with high or
low levels of trait anxiety or impulsivity, may have been differentially affected by the
manipulation.

40
3.9.1 Alternative decision strategy analyses
The decision strategy measure used in the initial analyses was used previously in decision
research about making a charitable donation decision (Luce et al., 1997) and choosing an
apartment (Drolet & Luce, 2004). Because the studies did not include an objective measure of
the validity of the decision strategy measure, it is possible that the measure is not an objectively
valid one and does not accurately measure attribute-based and option-based decision strategies.
However, the decision content of the current study is different in its level of complexity and
familiarity when compared to the decision information in previous studies, providing one
explanation for why this measure did not work well in the current study. The previous studies
used familiar attributes; in Luce et al. (1997), participants looked over information about
children and the attributes included age, intelligence level, and family size. In Drolet and Luce
(2004), participants looked over apartment options with attributes such as rent and square
footage. The attributes in previous studies were more likely to be familiar to participants than
the attributes in this study (i.e., likelihood of immediate death, benefits of treatment, short term
risks, etc.). It is possible that participants in the current study spent the first few moments of the
decision task getting acquainted with the attribute categories before settling on a decision
strategy, and that the first few boxes opened should be disregarded.
In addition, the decision strategy measure used in previous studies did not incorporate
time into the measure. Decision strategy was simply a measure of the number of times
participants compared across options or across attributes. Because the current study included
more information about each attribute than did previous studies, it is possible that incorporating a
measure of the amount of time spent comparing across attributes and across options rather than

41
simply counting the number of transitions between attributes and options would improve the
validity and accuracy of the decision processing measure.
To construct a new measure of decision processing, I looked at the raw information
acquisition data and examined the pattern of information acquisition. I found that participants
spent significantly more time looking at the first five boxes they opened when compared to the
rest of the boxes they viewed (Time in first five boxes, M = 5.00 seconds [4.48], Time in all
other boxes M = 3.35 seconds [2.75]; F [60.28], t = 8.50, df = 2079, p < .01). Participants may
have spent time getting acquainted with the attributes and options before settling on a decision
strategy. Therefore, I disregarded the first five boxes opened for all participants.
Next, to incorporate time into the decision measure, I calculated how much time
participants spent comparing sequentially within the same attribute and within the same option
(e.g. Participant X spent 15 seconds comparing across the Benefits attribute: first looking at
Benefits for Treatment 1, then Benefits for Treatment 2, and finally Benefits for Treatment 3.
Participant Y spent 20 seconds comparing Treatment 1 across several attributes: first Side
Effects for Treatment1, then Risk of Immediate Death for Treatment 1, then Benefits for
Treatment 1). This measure was designed to assess how much time participants spent comparing
within a single attribute or option.
Within participants, the attribute time was summed and the option time was summed. To
get a final measure of decision strategy, total attribute time was subtracted from total option time
to get a number representing the time spent comparing across options minus the time spent
across attributes. A larger number signifies spending more time comparing across options (a
more extensive decision strategy); smaller numbers represent greater comparison across
attributes (a more attribute-based decision strategy).
42
I conducted a logistic regression analysis with the revised decision strategy measure as
the IV and selection of the optimal option as the DV. The results showed that the revised
strategy measure did not significantly predict selection of the optimal option (B = .00, Wald =
5.039, p = .025). In a further analysis, I divided the sample into quartiles based on the revised
decision strategy measure. Looking only at participants in the top and bottom quartiles (those
who used the most extensive and most attribute-based strategies), I conducted another logistic
regression analyses with decision strategy as the IV and selection of the optimal option as the
DV. The results showed that participants using the more attribute-based strategy were more
likely to select the optimal option (B = -1.71, Wald = 6.33, p = .012).
An ANOVA assessed whether the revised decision strategy measure differed by
condition, and the results showed no significant differences in decision strategy by condition
(high threat, M = 40.64 seconds [47.69]; low threat, M = 45.21 seconds [56.68]; F [1, 99] = .19,
p =.66).
The revised decision strategy measure replicated the earlier finding that participants who
used an avoidant strategy by comparing across attributes were more likely to select the optimal
option. The next analysis looks at whether participants used an effective heuristic decision
strategy to identify the optimal option.
3.9.2 Choice heuristics
Several decision strategies have been identified in the literature (Payne & Bettman,
2001). Two of the strategies, the weighted adding strategy and the equal weight strategy, occur
when the decision maker compares across options, makes trade-offs, and processes extensively.

43
These strategies are considered normatively appropriate strategies (Frisch & Clemen, 1994) and
are the types of strategies that generally lead to more accurate decisions (Payne & Bettman,
2001). The two decision strategy measures used in the current paper assess both the frequency
and amount of time spent comparing across options and across attributes, and are therefore
effective measures of variants of the weighted adding and equal weight strategies.
Other decision strategies include choice heuristics: strategies aimed at simplifying
decisions. They include satisficing and lexicographic decision strategies. Satisficing, discussed
earlier, involves the elimination of options that do not meet a cutoff level for each attribute. A
lexicographic strategy occurs when the decision maker identifies the most important attribute,
then looks across that attribute and selects the option with the best value on that attribute (Payne
& Bettman, 2001). It is possible that participants who selected the optimal option did so after
effectively using one of the above heuristic strategies.
3.9.2.1 Satisficing
The satisficing strategy measure discussed previously in this paper was used to test
whether participants who used a satisficing strategy were more likely to select the best treatment
option. A chi-square test was not significant (X2 (1, N = 100) = .20, p = .20).
3.9.2.2 Lexicographic
A lexicographic strategy occurs when the decision maker identifies the most important
attribute, then looks across that attribute and selects the option with the best value on that

44
attribute (Payne & Bettman, 2001). To assess whether participants used a lexicographic strategy,
it was important to first assess whether participants identified a particular attribute as the most
important. An analysis of the time spent looking at individual attributes found that participants
spent significantly more time looking at the Long Term Risks attribute when compared to time
spent on the other attributes (see Figure 4). The Long Term Risks attribute included information
on the long-term risks of scarring and permanent pain, but most importantly, information on the
long-term likelihood of cancer recurrence. It seems reasonable that participants would identify
likelihood of recurrence as the most important attribute to look at when making a cancer
treatment decision1.
I analyzed lexicographic strategy both categorically (i.e. participants who used a
lexicographic strategy vs those who did not) and by looking at the amount of time participants
spent using a lexicographic strategy on a specific attribute.
In order to determine whether participants used a lexicographic strategy, I examined the
amount of time each participant spent comparing across the Long Term Risk attribute (e.g.
Participant X looked at Long Term Risk for treatment 2, then immediately afterwards for
treatment 3, and then for treatment 5, for a total time of 19 seconds). Participants were coded
categorically into those who compared across the Long Term Risk attribute (N = 74) and those
who did not (N = 26).
1 Because of its content, the “Likelihood of Immediate Death” attribute could also be objectively considered to be the most important attribute; however, participants did not spend any more time on the Death attribute than they did less important attributes such as Short Term Risks and Side Effects. I conducted an analysis to examine whether participants who did not compare across the Long Term Risk attribute instead compared across the Death attribute. A one-way ANOVA was used to test for differences in time spent comparing across the Death attribute between those who compared across the Long Term Risk attribute and those who did not. Comparison time differed significantly across groups (F(1,98) = 6.44, p = .013), but participants who compared across the Long Term Risk attribute spent significantly more time comparing across the Death attribute than did those who did not compare across the Long Term Risk attribute (M = 20.84 seconds, SD = 40.75; M = 73.30 seconds, SD = 102.30). Therefore, there did not seem to be separate groups within the sample, some of whom thought the Long Term Risk attribute to be the most important, and the other of whom thought the Death attribute to be most important.
45
A Chi Square analysis found that participants who compared across the Long Term Risk
attribute were significantly more likely to select the optimal option X2 (1, N = 100) = 11.52, p =
.001 (see Table 5). In other words, participants who used a more lexicographic strategy,
comparing across the most important option, were most likely to identify and select the best
decision option. This finding explains why previous analyses found that participants who used
an avoidant decision strategy were more likely to select the optimal option. A lexicographic
heuristic strategy is less extensive and involves comparison across attributes; therefore, the
decision strategy measure used previously would have coded any heuristic strategy as attribute-
based decision information processing.
A subsequent analysis looked at whether there were differences by condition in the
amount of time participants spent comparing across the Long Term Risk attribute. An
ANCOVA (controlling for demographics) found that participants in the high threat condition
spent significantly more time comparing across the Long Term Risk attribute (F [1, 92] = 4.62, p
= .034; see Figure 5). This finding suggests that participants in the high threat condition were
more likely to use an effective heuristic decision strategy, and, combined with the finding that
the lexicographic strategy led to the selection of an optimal decision strategy, explains why high
threat participants were more likely to select the optimal option. High threat participants were
more likely than low threat participants to use an effective heuristic decision strategy.
3.10 Moderators
To further explore the relationship between condition and the decision strategy used by
participants, I explored two potential moderators.

46
3.10.1 Trait anxiety
To explore the role of trait anxiety in participants’ information processing behavior, I
conducted linear regression analyses to assess whether the interaction of trait anxiety and
condition could further explain the relationship between condition and decision strategy
selection. I conducted two separate analyses using two measures of decision strategy: the
original decision strategy measure (smaller means more attribute-based) and the post-hoc
measure of time spent comparing within the Long Term Risk attribute.
The first model included education (as a control variable), trait anxiety level, condition,
and the cross-product of trait anxiety and condition. Trait anxiety did not significantly moderate
the relationship between condition and decision strategy, but the p-value indicated a trend toward
moderation (B = .69, t = 1.93, p = .056).
The second model included education (as a control variable), trait anxiety level,
condition, and the cross-product of trait anxiety and condition. Trait anxiety significantly
moderated the relationship between condition and Long Term Risk comparison time (B = -.86, t
= -2.33, p = .022) such that among participants with a lower level of trait anxiety, condition had
a stronger effect on time spent comparing within the Long Term Risk attribute. Participants with
higher levels of trait anxiety were less affected by the manipulation (see Figure 6).
3.10.2 Impulsivity
To explore the role of impulsivity in participants’ decision strategy selection, I conducted
a linear regression analysis to assess whether the interaction of impulsivity and condition could

47
further explain the relationship between condition and decision strategy selection. Again, I
conducted two separate analyses using two measures of decision strategy: the original decision
strategy measure (smaller means more attribute-based) and the post-hoc measure of time spent
comparing within the Long Term Risk attribute.
The first model included education (as a control variable), impulsivity, condition, and the
cross-product of impulsivity and condition. Impulsivity did not significantly moderate the
relationship between condition and decision strategy (B = .73, t = 1.02, p = .31).
The second model included education (as a control variable), impulsivity, condition, and
the cross-product of impulsivity and condition. Impulsivity significantly moderated the
relationship between condition and Long Term Risk comparison time (B = -1.52, t = -2.076, p =
.041) such that among participants with a lower level of impulsivity, condition had a stronger
effect on time spent comparing within the Long Term Risk attribute. Participants with higher
levels of impulsivity were less affected by the manipulation (see Figure 7).
3.11 Summary of post-hoc analyses
The post-hoc analyses explored the process data in order to explain why and how high
threat participants made better decisions than did low threat participants. The results suggest that
the decision strategy measure accurately differentiated between systematic and heuristic
strategies, and that high threat participants were more likely than low threat participants to use an
effective lexicographic decision strategy. The analyses also found that trait anxiety and
impulsivity moderated the relationship between condition and decision strategy.

48
4.0 DISCUSSION
Current medical practice emphasizes fully informing patients about the risks and benefits
of treatment options (Sheridan et al., 2004) and giving patients the opportunity to make their own
health care treatment decisions (American Medical Association, 2006). As patients make
treatment decisions, they are likely to confront threatening information about illness and death.
Although research and theory has focused on how threatening health information affects
information processing (Chaiken, 1980; Petty & Cacioppo, 1986; Witte, 1992), existing evidence
does not specifically address whether and how exposure to threatening information affects the
way that patients process decisions, select decision strategies, and choose options. The current
study was designed to experimentally manipulate exposure to threatening information in order to
explore how health decision processing and option selection changes under threat.
The proposed motivated decision processing model predicted that when patients face a
threatening health decision, they will experience dual motivations: effort motivation and
defensive motivation. The model predicted that these dual motivations would lead to biased but
effortful processing. Specifically, the hypotheses stated that individuals exposed to threatening
health information would focus on reassuring information, avoid threatening information, use
attribute-based decision strategies, and ultimately show an increased use of effortful but biased
processing.
Only some of the findings supported the hypotheses. As expected, participants in the
high threat condition were more likely to avoid threatening information than were participants in
the low threat condition. High threat participants did not spend more time than low threat
participants looking at reassuring information. Participants in the high threat condition were also

49
more likely to use an attribute-based decision strategy; however, this finding is difficult to
interpret because participants who used an attribute-based strategy were more likely to select the
best option. Since a fundamental assumption of the study was that participants who used an
extensive decisions strategy would select the best option, the finding that a heuristic strategy was
more accurate than a systematic strategy leads to questions about the validity of the decision task
and limits the ability to interpret the decision strategy findings.
The current findings did not support the hypothesis that participants in the high threat
condition would engage in a greater level of effortful processing. Participants in the high threat
and low threat conditions seemed to expend the same amount of effort in processing information;
they spent the same amount of time making the decision and looked at the same amount of
information. Thus, participants exposed to threatening health information did not engage in
more effortful processing, but they did seem to process the information in a biased manner.
The results did not support the exploratory hypotheses. Participants in the high threat
condition were no more likely than those in the low threat condition to select the status quo
option, and emotion variables did not mediate the relationship between condition and decision
outcome.
4.1 Unexpected findings
One of the underlying assumptions of the model was that processing in an effortful but
biased manner would lead to poorer decisions: attribute-based decision strategies allow decision
makers to avoid trade-offs, and making trade-offs is widely thought to be the hallmark of high
quality decision processing (Frisch & Clemen, 1994; Keren & Bruin de Bruin, 2003). Therefore,

50
it was surprising to find that participants who used a more attribute-based strategy were more
likely to select the best treatment option. In this specific decision situation, a heuristic strategy
was actually more accurate than a systematic strategy. Another unexpected result was the
finding that high threat participants were more likely than low threat participants to select the
best treatment option.
The study was designed so that the best option would be selected by participants who
processed systematically; therefore, the finding that participants who used a more attribute-based
strategy made more accurate decisions draws into question the validity of the decision processing
task. Many studies have found that systematic information processing is more accurate than
heuristic processing (Frisch & Clemen, 1994; Keren & Bruine de Bruin, 2003). This study found
the opposite: a heuristic strategy was more accurate than a systematic strategy. This finding
limits the interpretation of the decision processing data. I was therefore unable to accurately test
the hypothesis that threatening information led to heuristic processing of information (since, in
this study, heuristic processing led to a superior decision).
In addition to questions about the validity of the decision task, these unexpected findings
also led to additional questions about the decision strategy selected by participants. Although I
was unable to completely achieve this study’s goal of exploring whether exposure to threatening
health information affected decision strategy selection, I went on to conduct post-hoc analyses
aimed at understanding why high threat participants made better decisions and why attribute-
based processing led to better decisions.

51
4.2 Decision strategy
After finding that both high threat participants and participants using an attribute-based
strategy were more likely to select the optimal option, I explored the type of attribute-based,
heuristic strategy selected by high threat participants. Previous research using the MouseLab
process-tracing tool assessed decision strategy by looking at how frequently decision-makers
compared between options and attributes (Luce et al., 1997; Reisen, Hoffrage, & Mast, 2008),
resulting in a continuous measure of attribute-based and option-based strategy. I used this
measure in assessing decision strategy, but I was unable to find a precedent in the literature for
using MouseLab to get a more detailed picture of the type of heuristic strategy (e.g. satisficing,
lexicographic) used by participants. Using post-hoc analyses, I discovered that participants in
the high threat condition used a type of lexicographic strategy: they identified the most important
attribute (long term risks) and spent time comparing across that attribute, presumably looking for
the option with the best value on that attribute.
Participants in the high threat condition used an effective heuristic (lexicographic)
strategy, in that participants who compared across the long term risk attribute were more likely
than those who did not to select the best treatment option. Previous empirical research has
shown that in some decision contexts, heuristic decision strategies can require less effort and be
just as accurate as systematic strategies (Payne et al., 1988). This study found that a more
heuristic decision strategy was actually more accurate than a systematic strategy. However, it is
important to note that this result may be an artifact of the way the decision table was structured.
In this decision, comparing across the long term risk attribute clearly led participants to the best
option. If, however, the best option had been worse than the other options on that specific
attribute, the lexicographic strategy may not have been effective.

52
Previous research has shown that the same individual will use different decision
strategies in different decision contexts (Payne, 1982). However, little is known about what
factors predict the selection of an attribute-based decision strategy when an individual is under
threat. In post-hoc analyses, I explored whether individual differences might provide insight into
what types of individuals were most affected by the threat manipulation. Analyses showed that
both trait anxiety and impulsivity moderated the relationship between condition and decision
strategy. The interaction (Figure 6) showed that the manipulation had less of an effect on highly
anxious individuals; they used a more heuristic strategy in both the low and high threat
conditions. Analyses of impulsivity showed a nearly identical interaction pattern (Figure 7).
Individuals low in impulsivity used a more systematic decision strategy in the low threat
condition, and individuals high in impulsivity used a more heuristic strategy across both
conditions. Individuals high in trait anxiety or impulsivity seemed to use a more heuristic
strategy regardless of whether they had been exposed to threatening health information.
The impulsivity finding is consistent with work showing that a lack of perseverance, or
the inability to remain focused on a task, is one of impulsivity’s primary components (Whiteside
& Lynam, 2001). It makes sense that a general inability to focus on a decision making task
would lead to greater use of a heuristic decision strategy in both threatening and non-threatening
decisions.
The finding that higher levels of trait anxiety led to use of a heuristic decision strategy
regardless of threat condition at first seems inconsistent with previous research showing that trait
anxiety leads to an attentional bias towards threatening information (Blanchette & Richards,
2010). We may have expected participants higher in anxiety to process the information more
carefully, in a systematic manner. However, the previous research was not conducted in a

53
decision making context, and it is possible that highly anxious individuals experience decisions
as more threatening, in general, than do less anxious individuals. In the current study, trait
anxiety was significantly correlated with baseline skin cancer worry (r = .28, p = .006) and the
PANAS negative emotion scale (r = .22, p =.041); therefore, participants with higher levels of
trait anxiety may have experienced more negative emotion than less anxious participants did
while processing the decision, regardless of what condition they were in.
4.3 Emotion as a mediator Mediational analyses did not support the exploratory hypothesis that emotional variables
(e.g., worry, negative affect, anticipated regret) would mediate the relationship between
condition and biased information processing. This is surprising, given that the exposure to
threatening information did raise the level of negative emotion experienced by high threat
participants. It is possible that although exposure to threatening information raised negative
emotion, it also raised the level of an unmeasured variable, such as motivation, that led to
avoidance of threatening information and use of a heuristic decision strategy.
It is also possible that the self-report measures of emotion used in this study were not
reliable. Self-report measures of emotion have some conceptual limitations: individuals vary in
their ability to be aware of and accurately report their own emotional experience, and thus
reported emotions may have varied meaning from person to person. Self-report measures of
emotion have also been criticized for not accurately assessing the level of emotion felt in the
moment; some authors have argued that self-report measures merely reflect how the individual
felt after the manipulation (Sayette, Wertz, Martin, Cohn, Perrott, & Hobel, 2003). In this study,
worry was measured immediately after exposure to the scenario and negative affect and worry

54
were measured immediately after participants read over the decision information. Thus, the
measures may have not accurately reflected how participants felt in the very moments that they
were processing the information. For example, participants may have experienced some
moments of fear, relief, and dissonance while processing the information, but the current study’s
emotion measures only reflect how participants felt after processing the information. Because
research suggests that decision makers engage in choice justification after making a difficult
decision (Festinger, 1957), post-decision measures may not accurately reflect the emotion that
occurred during decision processing. The current study’s finding that participants in the high
threat condition reported higher levels of decision satisfaction may reflect an attempt on the part
of high threat participants to deal with the cognitive dissonance they likely experienced while
making difficult decision trade-offs. Future research could use measures such as facial affect
coding (Sayette et al., 2003), designed to assess moment by moment emotion, to assess whether
specific types of emotions that occur during decision processing could be mediating the
relationship between exposure to threatening health information and decision processing and
outcomes.
4.4 Implications for Motivated Decision Processing Model The current findings partially support the proposed motivated decision processing model.
Overall, the findings generally support the model’s proposition that individuals making a
difficult health decision process decision information in a defensive and biased manner.
However, the findings do not support the proposition that threatening health information will
lead decision makers to expend a greater overall effort towards processing decision information,
or that this processing will lead to poor decision making.

55
4.4.1 Threatening information leads to defensive processing
The model proposed that exposure to threatening health information would motivate
defensive information processing, and result in avoidance of threatening information, a focus on
reassuring information, and the use of a decision strategy that allowed decision makers to avoid
making trade-offs. Evidence supporting two of the three predicted outcomes partially supports
the idea that threatening health information leads to biased, defensive information processing.
Participants in the high threat condition did seem to avoid looking at threatening information;
compared to participants in the low threat group, they spent a smaller proportion of time looking
at the most threatening information (Chance of Immediate Death). Participants in the high threat
condition also used a more attribute-based decision strategy, supporting the model’s proposition
that the motivation to process defensively will result in the use of decision strategies that allow
decision makers to avoid making difficult trade-offs. However, the finding that participants
who used more attribute-based strategies made more accurate decisions limits interpretation of
the finding that threatening information led to the use of attribute-based decisions strategies.
Participants in the high threat condition did not spend a greater proportion of time
looking at reassuring information. The reassuring information (Benefits of Treatment) was about
the beneficial cosmetic effects of the treatment options, and it is possible that the reassuring
information was not vivid or consequential enough to draw participants’ attention. Another
possibility is that the defensive motivation only prompted avoidance of threat and trade-offs, and
it did not extend to a search for reassurance. Previous research looking at biased processing of
threatening health messages did not separate out attention to threatening information and

56
reassuring information (Gleicher & Petty, 1992; Liberman & Chaiken, 1992), so the current
finding that threatened participants did not seek out reassuring information is a new one. The
finding should be replicated.
4.4.2 Threatening information leads to effortful processing
The results did not support the model’s proposition that individuals making a threatening
health decision would expend a greater overall effort in processing decision information.
Participants in both conditions spent the same amount of time looking at the decision information
and looked at the same amount of information.
Why did participants in the high threat condition not expend more overall effort making
the decision? First, it is possible that the hypothetical decision in the current study was not
threatening or realistic enough. Patients who make a real-life medical treatment decision may be
more likely to expend greater overall effort towards the decision than patients making a less
threatening treatment decision. Another possibility is that the model is incorrect in its
proposition that threatened patients will make a greater overall effort in processing information,
and that it is more accurate to state that patients facing threatening information will make a
greater focused effort. Compared to the low threat condition, participants in the high threat
condition spent more time comparing across one of the most important attributes. Thus, they
seemed to expend more effort focusing on a specific (and important) piece of information.
I included effort motivation in the model based on evidence that 1) people believe that
thinking harder equates to thinking better (Lerner & Tetlock, 2003) and 2) threatened individuals
report or show a greater processing effort (Ditto & Lopez, 1992, Lieberman & Chaiken, 1992;

57
Luce et al., 1997). I thought that patients facing threatening health decisions would be motivated
to convince themselves that they made a good decision, and that expending greater overall effort
and processing in a biased manner would allow them to avoid threats and trade-offs while still
feeling satisfied with the decision. However, it seems that threatened participants instead
concentrated their effort on using a heuristic decision strategy. This finding is inconsistent with
previous work finding that threatened participants made a greater overall effort processing
decision information (Luce et al., 1997), but it is consistent with evidence that threatened
individuals focus their information processing effort on criticizing, defending against, or
replicating information that they find threatening (Ditto & Lopez, 1992; Eagly et al., 2001; Ditto
et al., 1998). The current evidence suggests that compared to low threat participants, high threat
participants engaged in information processing that was not more effortful, but was instead more
efficient. High threat participants expended effort in a more focused and accurate manner than
did low threat participants. At the same time, high threat participants reported greater levels of
decision satisfaction. It is possible that high threat participants felt more motivated to make a
good decision and chose a heuristic decision strategy that was efficient, accurate, and also
allowed them to avoid difficult trade-offs.
4.5 Implications for the default bias Results showed that participants selected the default option significantly more frequently
than expected, even though the default option was always a suboptimal choice. That bias,
however, was unaffected by condition; participants in both conditions were equally likely to
select the default option.

58
The overall tendency is consistent with a number of other studies that show a default or
status quo bias (Choi et al., 2004; Fleming et al., 2010; Kressel & Chapman, 2007; Johnson &
Goldstein, 2003; Moshinsky & Bar-Hillel, 2010; Samuelson & Zeekhauser, 1988). Many
experiments that offer a default or status quo option confound that option with an implicit
recommendation, and, as others have suggested (Johnson & Goldstein, 2003), people may
interpret default options as implicitly recommended by authorities. Therefore it is difficult to
know why participants choose a default. For example, Kressel and Chapman (2007) found that
the presence of a sample living will led to a biased preference for the wording expressed in the
sample. Participants may have interpreted the sample living will as an implicit recommendation
for the preferences expressed in the will, or they may have used the sample wording out of a
desire to avoid making an active decision. However, as in many of these studies, it is impossible
to separate out the motivational factors.
In the current study, the confound between implicit recommendation and pure default
was disentangled. The default option did not include an implicit recommendation and the
presence of a default option was simply and ambiguously explained by saying, “Because there
are multiple options, the computer randomly selected one. You may select a different option if
you prefer.” These results suggest that part of the preference for the status quo may result from a
desire to avoid action, and cannot be solely attributed to implicit recommendation.
4.6 Decision quality
One of the goals of this study was to gain an understanding of how exposure to
threatening information affects the quality of a decision. However, participants in the current

59
study who used an attribute-based strategy to make their decision were more likely to select the
best decision option. In other words, participants who used a less optimal decision strategy were
more likely to arrive at the optimal decision option. This finding makes it difficult to draw
conclusions as to the overall quality of their decisions. In the decision literature, measurement of
decision quality is both complicated and controversial (Keren & Bruine de Bruin, 2003). Some
researchers advocate looking at outcome to assess decision quality (Hershey & Baron, 1995),
and other researchers prefer to assess decision processing (Edwards, Kiss, Majone, & Toda,
1984).
Among researchers who discuss empirically measuring decision quality, there seems to
be a consensus that decision makers who consider and make trade-offs make better quality
decisions (Frisch & Clemen, 1994; Keren & Bruine de Bruin, 2003). By that standard,
individuals in the high threat condition in the current study made fewer trade-offs and therefore
made poorer quality decisions.
However, evaluation of quality can also depend on the decision goals, and those goals
can differ depending on the situation and the perspective of the person judging the decision. In
the case of a health treatment decision, an important goal for both the patient and provider is for
the patient to select the optimal treatment option (if there is a clearly better option). By that
standard, participants in the current study who chose the optimal option made a high quality
decision. An additional goal, from an ethical and legal perspective, is for patients who make
important treatment decisions to be fully informed of the risks and benefits of possible treatments
(e.g. deciding to undergo bariatric surgery) and to deliberately consider the treatment options.
To meet the goal of being fully informed, patients would ideally use a systematic decision
strategy.

60
The results of the current study suggest that exposure to threatening information can lead
individuals to avoid threatening information and shift to a more heuristic strategy as they assess
health decision information. Although a heuristic strategy can be accurate, the use of an
attribute-based, heuristic strategy suggests that decision makers under threat may not be carefully
considering trade-offs as they make their decision. This suggests that they may not be meeting
the ethical goal of being fully informed and engaging in deliberate processing of information.
4.7 Strengths
This study contributes to the existing research on health information processing and
decision making by identifying how exposure to threatening health information changes decision
making processes. This study is the first to experimentally manipulate level of threat and look at
the resulting changes in decision information processing. In addition, no previous studies on
health treatment decisions have used process variables to understand how decision processing
changes under threat, and this study used new analyses of process data to identify the specific
decision strategy used by participants. As a result, this study was able to demonstrate that
individuals who are exposed to threatening health information avoid threatening information and
decision trade-offs while using a more heuristic decision strategy to process information.
This study also contributed to research on the use of default options in health care.
Specifically, the study design uniquely removed the implicit recommendation from a default
health treatment option, and showed that in a health decision context, a default is attractive even
without the implicit recommendation.

61
Another strength of the study is in its assessment of moderators. This study is the first to
find that trait anxiety and impulsivity moderate the effect of threatening health information on
decision information processing.
This study’s method and use of process measures are major strengths. The detailed
process information allowed more analyses and provided a deeper understanding of how
participants processed the information than would have been possible using only outcome
measures.
4.8 Limitations The current study includes a number of limitations. The sample used in this study was a
sample of convenience, and the majority of participants worked at the University of Pittsburgh or
the University of Pittsburgh Medical Center. Thus, participants may not have been
representative of the larger community of people over the age of 40. Participants were self-
selected and volunteered for the study, therefore participants may have been more curious about
and interested in health decision making than the average community member.
A major limitation of the study arises from the finding that participants who used a more
heuristic decision strategy were more likely to select the optimal option. This finding is the
opposite of what was expected given the existing literature (Frisch & Clemen, 1994; Payne &
Bettman, 2001). It is possible that the layout of information in the decision table was such that a
heuristic style of processing made it more likely for participants to select the best option. It is
also possible that the decision processing measure did not accurately capture the level of
cognitive effort that participants put into processing the information. In either case, the result

62
that heuristic processing was more accurate when compared to systematic processing limits the
interpretation of the data.
There are also alternative explanations for the findings. First, it is possible that the
manipulations differentially affected participants’ processing capacity. Specifically, participants
who received the high threat manipulation may have experienced worried and anxious cognitions
that then led to a decrease in their ability to process information. This temporary processing
capacity deficit would have led to high threat participants being more likely to use a simple,
heuristic processing strategy. However, if high threat participants had a lower processing
capacity than low threat participants, we would have expected to see differences in the total
amount of time participants looked at information. Given that both conditions spent the same
amount of time processing the information, it is unlikely that changes in processing capacity can
explain the results.
Another alternate interpretation of the findings is based on the manipulation’s focus on
participants’ own feelings about skin cancer. Research has shown that when the level of
personal involvement is high, individuals process information more systematically than when
personal involvement is low (Borgida & Howard-Pitney, 1983). Because the current study
manipulated threat by manipulating the level of personal involvement of the participants (i.e.,
participants in the high threat condition imagined themselves making a difficult health decision
and those in the low threat condition were not instructed to do so), it is possible that the effect of
the manipulation on information processing was due to personal involvement rather than level of
threat. However, high threat participants used a more heuristic processing strategy and than did
low threat participants, and previous research on the personal involvement effect showed that

63
personal involvement led to more systematic processing. Therefore it is unlikely that the effect
of the manipulation was due to the effect of personal involvement.
The health threat manipulation used in the study consisted of two parts: a threatening
(high threat condition) or less-threatening (low threat condition) scenario prior to presentation of
the decision table, and a higher (high threat condition) or lower (low threat condition) level of
decision conflict within the decision table. Because there were two components to the
manipulation, it is not clear whether both components contributed to the observed effects or
whether only one component accounted for the observed effects. Self-report measures showed
that participants in the high threat condition perceived information in the scenario as more
threatening than information in the decision table (5.44 [1.42] vs 3.28 [1.59], t = 9.35, p < .001),
but since emotion did not mediate the effect of condition on outcomes, it is not clear that those
differences identify the scenario as the more powerful component of the manipulation. It is
possible that the higher level of decision conflict in the high threat condition prompted the use of
a heuristic strategy as a way of cognitively simplifying the decision and avoiding trade-offs,
independent of any emotional experience. Future studies could separate out the two parts of the
current manipulation in separate experiments, thus isolating the effects of each manipulation.
It is also possible that the differences in level of decision conflict between the two tables
may explain the processing differences between conditions. In order to manipulate the level of
decision conflict, the information in the low threat and high threat tables was slightly different.
In addition to affecting decision conflict, these differences may have also made the high threat
decision more cognitively challenging. Participants who faced a more cognitively challenging
decision may have changed their decision strategy and focused on different parts of the

64
information. Therefore, it is possible that the differences in processing by condition could be
explained by the differences in the decision tables rather than by the level of threat.
Several limitations are related to the fundamental limitations of using a hypothetical
decision and a structured decision table. A hypothetical decision is inherently less threatening
than a real health treatment decision, and although the manipulation in this study was effective in
inducing worry and perceived threat, it is possible that the information processing effects found
may not accurately model the way a patient processes information in a real decision context. In
addition, the decision table is a somewhat artificial way of making a health treatment decision,
and it is possible that the hypothetical nature of the decision and the format of the decision
interfered with natural decision making patterns. For example, because the decision table was
structured for the participants, the decision process did not accurately model the full decision
process. The decision table effectively eliminated the “structuring” part of the decision process,
and I was thus unable to assess whether exposure to threatening information affected the way
individuals set up a decision.
In addition, some researchers have raised questions about the external validity of
computerized process tracing tools. A recent study experimentally demonstrated that
information presented in an open style led to greater use of systematic strategies, whereas the
same information presented in a structured table format led to greater use of heuristic strategies
(Glöckner & Betsch, 2008). Replicating the current study using a more open style of
information presentation would help to establish the external validity of the findings.
The operational definitions of some of the decision process constructs used in this study
are new and have no precedent in the literature. Although the measures of effort (i.e., time spent
looking at parts of the decision table and the number of boxes opened) have been used in other

65
studies as operational definitions of effort (Drolet & Luce, 2004; Luce et al., 1997), the specific
assumption that ‘Benefits of Treatment’ is reassuring and ‘Likelihood of Death,’ is threatening is
unique to this study and has not been used in prior research. In addition, although the original
decision strategy measure that identified systematic and heuristic strategies has been used in
prior research (Drolet & Luce, 2004; Glockner & Betsch, 2008; Luce et al., 1997; Reisen et al,
2008), the post-hoc analyses included operational definitions of lexicographic and satisficing
strategies that have not been used in previous research. Thus, it is possible that some of this
study’s unique measures are not valid. Future research can explore these operational definitions
further in order to assess their validity.
The selection of skin cancer treatment as the hypothetical disease is a possible limitation.
After participating in the study, a number of participants reported to the experimenter that they
did not find skin cancer to be an especially frightening type of cancer. It is possible that a skin
cancer diagnosis would not feel as threatening to participants as, for example, a breast cancer
diagnosis. Using a more frightening type of cancer would have increased the level of threat and
may have led to a stronger effect of the manipulation. Future research in this area could explore
whether the degree of threat and type of disease have differential effects on decision processing.
A limitation of this study that may have affected the assessment of mediation between
emotional variables and outcomes is that emotion was measured by self-report. The self-report
measures may not have accurately measured how participants felt in the very moments they
looked over the decision information, and a desire to justify their own decision may have
affected how they reported their own emotions.

66
4.9 Summary and future directions Patients face health treatment decisions that are complex, difficult, and involve
information about threatening topics such as illness and death. Researchers and clinicians have
developed decision aids as a way to help patients make complex treatment decisions (O’Connor
et al., 1999), but not much is known about the decision process itself. The overarching goal of
this study was to explore how decision processing changes when patients are exposed to
threatening information during the decision making process. Consistent with previous work
showing that threat leads to defensive information processing, the results of this study showed
that exposure to threatening health information leads to the avoidance of threatening decision
information and decision trade-offs. The results also demonstrate that individuals exposed to
threatening information use a more heuristic decision strategy, however the finding that
participants who used a heuristic decision strategy were more likely to select the best option
limits the interpretation and generalizability of the finding. Replicating the current study but
manipulating which treatment option is optimal and which type of decision strategy will lead to
the optimal option will further help to determine the quality of decisions made under threat.
These results also have implications for informed consent procedures. Given the ethical
importance of informed consent in research (U.S. Office for Human Research Protections, 2010;
American Psychological Association, 2010) and medicine (Berg, Appelbaum, Parker, & Lidz,
2001), it is important to consider whether the presence of threatening information affects how
deliberately participants and patients process consent forms, and how fully they comprehend the
risks and benefits. The results suggest that people who read threatening health information may
not systematically process informed consent forms; they may avoid threatening information
about risks, and they may use a heuristic decision strategy to decide whether to consent to

67
treatment or participate in a study. Future research could focus specifically on how exposure to
threatening information affects processing of an informed consent form.
It is also important to continue exploring individual difference factors that may affect the
relationship between exposure to threatening information and decision processing. This study
found that trait anxiety and impulsivity moderated the relationship between threat and decision
processing. Given that patients who are high in trait anxiety or impulsivity may process
decisions in a more heuristic manner whether or not they have been exposed to threatening
information, health care providers may want to take extra care in ensuring that these patients
have understood all the risks of specific treatments. Patients high in trait anxiety or impulsivity
may also experience more health problems than the general population, and they may need
greater assistance with health decisions. Future research can further explore how people with
high levels of trait anxiety or impulsivity process health care decisions, and also look at other
potential moderators such as depression status.
The current study was not able to answer the question of why threatening information led
to a change in decision processing, and future research should continue to explore that question.
Adding more sophisticated measures of emotion, such as using facial coding or fMRI may
uncover the motivational factors leading to information processing changes.
One of the major limitations of the current study is that it was carried out in a lab setting
and it is not known whether the results will apply to a real life decision setting. Extending the
research into a real health decision setting will not only help us to understand the generalizability
of the findings, but may also provide insight into how decision makers under threat seek out
information and structure their decisions. For example, are people who look at threatening
information more efficient at identifying the most important aspects of the decision and

68
incorporating those attributes into their own decision structure? In addition, this study looked
only at decision information processing, but future research could explore how exposure to
threatening information changes how and where patients seek information. For example, up to
eight out of ten internet users have looked up health information online (Fox, 2006), and many
people use online health support groups to gather and discuss health information (Tannis, 2008).
Future research could explore the use of social information sources, both online and in real life,
to determine whether exposure to threatening health information changes the way people seek
out health information.
Finally, the results of this study highlight the importance of gaining an understanding of
how decision processing changes under threat. Knowing that exposure to perceived threats can
lead to patients’ avoidance of frightening, but important, information about treatments can help
researchers and clinicians develop more effective decision aids and communication tools. This
study’s successful use of process measures also demonstrates the value of incorporating process
variables into health information processing studies. Other researchers studying the effect of
threatening information and emotion on health information processing may benefit from using
process measures.

69
5.0 REFERENCES
Abraham, C., & Sheeran, P. (2004). Deciding to exercise: The role of anticipated regret.
British Journal Health Psychology, 9, 269-278.
American Medical Association. (2006). Code of medical ethics: informed consent. Retrieved
July 1, 2010 from www.ama-assn.org.
American Psychological Association. (2010). Ethical principles of psychologists and code of
conduct. Retrieved June 25, 2010 from www.apa.org.
American College of Physicians. Guidelines for counseling postmenopausal women about
preventive hormone therapy. Annals of Internal Medicine, 117, 1038-1041.
Anderson, C. J. (2003). The psychology of doing nothing: forms of decision avoidance
result from reason and emotion. Psychological Bulletin, 129, 139-167.
Agnew, J. R. & Szykman, L. R. (2005). Asset allocation and information overload: the
influence of information display, asset choice, and investor experience. The
Journal of Behavioral Finance, 6(2), 57-70.
Baron, R. M., & Kenny, D. A. (1986). The moderator-mediator variable distinction in social
psychological research: Conceptual, strategic and statistical considerations. Journal of
Personality and Social Psychology, 51, 1173-1182.
Beauvoid, J., L., & Joule, R. V. (1996). A radical dissonance theory. Briston, PA: Taylor &
Francis.
Berg, J. W., Appelbaum, P. S., Parker, L. S., & Lidz, C. W. (2001). Informed consent: legal
theory and clinical practice. New York: Oxford University Press.

70
Blanchette, I. & Richards, A. (2010). The influence of affect on higher level cognition: A review
of research on interpretation, judgment, decision making and reasoning. Cognition &
Emotion, 24, 561-595.
Bless, H., Bohner, G., Schwarz, N. & Strack, F. (1990). Mood and persuasion: A
cognitive response analysis. Personality and Social Psychology Bulletin, 16, 331-345.
Bless, H., Mackie, D. M., & Schwarz, N. (1992). Mood effects on encoding and
judgmental processes in persuasion. Journal of Personality and Social Psychology, 63,
585-595.
Borgida, E. & Howard-Pitney, B. (1983). Personal involvement and the robustness of perceptual
salience effects. Journal of Personality and Social Psychology, 45, 560-570.
Byron, M. (2004). Satisficing and maximizing: moral theorists on practical reason. Cambridge:
Cambridge University Press.
Chaiken, S. (1980). Heuristic versus systematic information processing and the use of source
versus message cues in persuasion. Journal of Personality and Social Psychology, 39,
752-766.
Chaiken, S., Liberman, A. & Eagly, A. H. (1989). Heuristic and systematic information
processing within and beyond the persuasion context. In Uleman, J. S. & Bargh, J. A.
(Eds.), Unintended thought, 212-252. New York: Guilford Press.
Choi, J., Laibson, D., Madrian, B., & Metrick, A. (2004). Saving for retirement on the
path of least resistance. In E. McCaffrey and J. Slemrod (Eds.), Behavioral Public
Finance: Toward a New Agenda (pp. 304-351). New York: Russell Sage Foundation.
Côté, S. (2005). Reconciling the feelings-as-information and hedonic contingency

71
models of how mood influences systematic information processing. Journal of Applied
Social Psychology, 35, 1656-1679.
Croyle, R. T., Sun, Y., & Louie, D. (1993). Psychological minimization of cholesterol test
results: Moderators of appraisal in college students and community residents. Health
Psychology, 12, 503-507.
Damasio, A.R. (1994). Descartes' Error: emotion, reason, and the human brain. New
York: Grosset/Putnam.
de Hoog, N. Stroebe, W. & de Wit, J. B. F. (2005). The impact of fear appeals on
processing and acceptance of action recommendations. Personality and Social
Psychology Bulletin, 31, 24-33.
de Hoog, N. Stroebe, W. & de Wit, J. B. F. (2007). The impact of vulnerabilty to and
severity of a health risk on processing and acceptance of fear-arousing communications: a
meta-analysis. Review of General Psychology, 11, 258-285.
de Wit, J. B. F., Das, E., & de Hoog, N. (2007). Self-regulation of health communications: a
motivated processing approach to risk perception and persuasion. In The Scope of Social
Psychology, Hewstone, M., Schut, H.A.W., de Wit, J.B.F., van den Bos, K., & Stroebe,
M. S. (Eds.). Taylor & Francis, New York.
de Wit, J., Das, E., & Vet, R. (2008). What works best: objective statistics or a personal
testimonial? Comparing the persuasive effects of narrative versus statistical evidence to
increase risk perception. Health Psychology, 27, 110-115.
Dhar, R. (1997). Consumer preference for a no-choice option. Journal of Consumer
Research, 24, 215-231.
Ditto, P. H., & Croyle, R. T. (1995). Understanding the impact of risk factor test results:

72
Insights from a basic research program. In R. T. Croyle (Ed.), Psychosocial effects of
screening for disease prevention and detection (pp. 144–181). New York: Oxford
University Press.
Ditto, P. H., & Lopez, D. F. (1992). Motivated skepticism: the use of differential decision
criteria for preferred and nonpreferred conclusions. Journal of Personality and Social
Psychology, 36, 568-584.
Ditto, P. H., Scepansky, J. A., Munro, G. D., Apanovitch, A. M., & Lockhart, L. K. (1998).
Motivated sensitivity to preference-inconsistent information. Journal of Personality and
Social Psychology, 75, 53-69.
Drolet, A. & Luce, M. F. (2004). The rationalizing effects of cognitive load on emotion-based
trade-off avoidance. Journal of Consumer Research, 31, 63-77. Eagly, A., Kulesa, P., Chen, S., & Chaiken, S. (2001). Do attitudes affect memory? Tests of the
congeniality hypothesis. Current Directions in Psychological Science, 10, 5-9.
Edwards, W., Kiss, I., Majone, G. & Toda, M. (1984). What constitutes “a good decision”? Acta
Psychologica, 56, 5–27.
Fox, S. (2006). Online health search 2006: Pew internet and American Life Project. Retrieved
July 2010 from www.pewinternet.org.
Faul, F., Erdfelder, E., Lang, A.-G., & Buchner, A. (2007). G*Power 3: A flexible statistical
power analysis program for the social, behavioral, and biomedical sciences. Behavior
Research Methods, 39, 175-191.
Fleming, S. M., Thomas, C. L., & Dolan, R. J. (2010). Overcoming status quo bias in the human
brain. PNAS Proceedings of the national Academy of Sciences of the United States of
America, 107, 6005-6009.

73
Frisch, D., & Clemen, R. T. (1994). Beyond expected utility: Rethinking behavioral decision
research. Psychological Bulletin 116 , 46-54.
Festinger, L. (1957). A theory of cognitive dissonance. Stanford University Press, Stanford, CA.
Gasper, K. & Clore, G. L. (2002). Attending to the big picture: mood and global versus
local processing of visual information. Psychological Science, 13, 34-40.
Gleicher, F. & Petty, R. E. (1992). Expectations of reassurance influence the nature of
fear-stimulated attitude change. Journal of Experimental Social Psychology, 28, 86-100.
Glockner, A. & Betsch, T. (2008). Multiple-reason decision making based on automatic
processing. Journal of Experimental Psychology: Learning, Memory, and Cognition, 34,
1055-1075.
Green, J.M., Hewison, J., Bekker, H.L., Bryant, L.D. & Cuckle, H.S. (2004). Psychosocial
aspects of genetic screening of pregnant women and newborns: a systematic review.
Health Technology Assessment, 8(33), 1-124.
Gurmankin, A. D., Baron, J., Hershey, J. C., & Ubel, P. A. (2002). The role of
physicians’ recommendation in medical treatment decisions. Medical Decision Making,
22, 262-271.
Hanselmann, M., & Tanner, C. (2008). Taboos and conflicts in decision making: Sacred
values, decision difficulty, and emotions. Judgment and Decision Making, 3, 51-63.
Harmon-Jones, E. (2000). Cognitive dissonance and experienced negative affect: Evidence that
dissonance increases experienced negative affect even in the absence of aversive
consequences. Personality and Social Psychology, 49, 1490-1501.
Harris, P. R. & Napper, L. E. (2005). Self-affirmation and the biased processing of threatening
health risk information. Personality and Social Psychology Bulletin, 31, 1250-1263.

74
Hart, W., Albarracin, D., Eagly, A. H., Brechan, I., Lindberg, M. J., & Merril, L. (2009). Feeling
validated versus being correct: a meta-analysis of selective exposure to information.
Psychological Bulletin, 135, 555-588.
Hershey, J.C. & Baron, J. (1995). Judgment by outcomes: When is it warranted? Organizational
Behavior and Human Decision Processes, 62, 127.
Hofmann, S., Moscovitch, D. A., Litz, B. T., Kim, H.-J., Davis, L. L., & Pizzagalli, D. A.
(2005). The worried mind: automatic and prefrontal activation during worrying. Emotion,
5(4), 464-475.
Janis, I., & Mann, L. (1977). Decision making: A psychological analysis of conflict,
choice and commitment. New York: The Free Press.
Jemmott, J.B., Ditto, P.E., & Croyle, R. T. (1986). Judging health status: effects of perceived
prevalence and personal relevance. Journal of Personality and Social Psychology, 50,
895-905.
Johnson, E. J. & Goldstein, D. (2003). Do defaults save lives? Science, 302, 1338-
1339.
Johnson, E. J., Steffel, M., & Goldstein, D. G. (2005). Making better decisions: from
measuring to constructing preferences. Health Psychology, 24, S17-S22.
Keeney, R. L., and H. Raiffa. (1976). Decisions with multiple objectives: Preferences and value
tradeoffs. New York: John Wiley & Sons.
Keren, G. & Bruin de Bruin, W. (2003). On the assessment of decision quality: considerations
regarding utility, conflict, and accountability. In D. Hardman, and L. Macchi (Eds.),
Thinking: Psychological perspectives on reasoning, judgment, and decision making. New
York: John Wiley & Sons.

75
Kennedy, J. (1993). Debiasing audit judgment with accountability: a framework and
experimental results. Journal of Accounting Research, 30, 231-45.
Kressel, L. M., & Chapman, G. B. (2007). The default effect in end-of-life medical
treatment preferences. Medical Decision Making, 27, 299-310.
Kunda, Z. (1987). Motivation and inference: Self-serving generation and evaluation of
evidence. Journal of Personality and Social Psychology, 53, 636-647.
Kunda, Z. (1990). The case for motivated reasoning. Psychological Bulletin, 108, 480-498.
Lazarus, R. S., & Folkman, S. (1984b). Stress, appraisal, and coping. New York: Springer.
Lerner, J. S., & Tetlock, P. E. (2003). Bridging individual, interpersonal, and institutional
approaches to judgment and choice: The impact of accountability on cognitive bias. In S.
Schneider & J. Shanteau (Eds.), Emerging Perspectives on Judgment and Decision
Making (pp. 431-457). Cambridge, MA: Cambridge University Press.
Leventhal, H. (1970). Findings and theory in the study of fear communications. In L. Berkowitz
(Ed.), Advances in experimental social psychology (Vol. 5, pp. 119-186). New York:
Academic Press.
Lieberman, A., & Chaiken, S. (1992). Defensive processing of personally relevant health
messages. Personality and Social Psychology Bulletin, 18, 669–679.
Lipkus, I. M., McBride, C. M., Pollak, K. I., Lyna, P., & Bepler, G. (2004). Interpretation
of genetic risk feedback among African American smokers with low socioeconomic
status. Health Psychology, 23, 178–188.
Loewenstein, G., Weber, E., Hsee, C. and Welch, N. (2001). Risk as feelings.
Psychological Bulletin, 127, 267-286.

76
Lord, C. G., Ross, L., and Lepper, M. R. (1979). Biased assimilation and attitude polarization:
The effects of prior theories on subsequently considered evidence. Journal of
Personality and Social Psychology, 37, 2098–2109
Luce, M. Bettman, J., & Payne, J. W. (1997). Choice processing in emotionally difficult
decisions. Journal of Experimental Psychology: Learning Memory, and Cognition, 23,
384-405.
Luce, M. F. (1998). Choosing to avoid: coping with negatively emotion-laden consumer
decisions. Journal of Consumer Research, 24, 409-433.
Lundgren, S. & Prislin, R. (1998) Motivated cognitive processing and attitude change.
Personality and Social Psychology Bulletin, 24, 715-726.
MacKinnon, D. P., Lockwood, C. M., Hoffman, J. M., West, S. G., & Sheets, V. (2002).
A comparison of methods to test the significance of the mediated effect. Psychological
Methods, 7(1), 83-104.
Masserman, J. H., Aarons, L., & Wechkin, S. (1963). The effect of positive-choice
conflicts on normal and neurotic monkeys. American Journal of Psychiatry, 120. 481-
484.
McKenzie, C. R. M., Liersch, M. J., & Finkelstein, S. R. (2006). Recommendations
implicit in policy defaults. Psychological Science, 17, 414-420.
Mills, J., Melzer, R., & Clark, M. (1977). Effect of number of options on recall of information
supporting different decision strategies. Personality and Social Psychology Bulletin, 3.
213-218.
Moshinsky, A. & Bar-Hillel, M. (2010). Loss aversion and status quo label bias. Social
Cognition, 28, 191-204.

77
National Cancer Institute. (2008). Melanoma of the skin: cancer fact sheets. SEER Database.
Retrieved October 2009 from seer.cancer.gov.
O’Connor, A.M. (1995). Validation of a Decisional Conflict Scale. Medical Decision Making,
5, 25-30.
O’Connor, A. M., Rostom, A., Fiset, V., Tetroe, J., Entwistle, V., Llewellyn-Thomas, Hl,
Holmes-Rovner, M., Barry, M., & Jones, J. (1999). Decision aids for patients facing
health treatment or screening decisions: Systematic review. British Medical Journal, 319,
731-734.
Patton, J. H., Stanford, M. S., Barratt, E. S., (1995). Factor structure of the Barratt
impulsiveness scale. Journal of Clinical Psychology, 51, 768-774.
Payne J. W. & Bettman, J. R. (2001). Preferential choice and adaptive strategy use. In G.
Gigerenzer & R. Selten (Eds.), Bounded rationality: the adaptive toolbox (pp. 123-145).
Massachusetts Institute of Technology.
Payne, J.W. (1982). Contingent decision behavior. Psychological Bulletin, 92, 382-402.
Payne, J.W., Bettman, J.R. & Johnson, E.J. (1988). Adaptive strategy selection in decision
making. Journal of Experimental Psychology: Learning, Memory and Cognition, 14,
534-552.
Peters, E. Lipkus, I., & Diefenbach, M. A. (2006). The functions of affect in health
communications and in the construction of health preferences. Journal of
Communication, 56, S140-S162.
Peters, E., Slovic, P., & Gregory, R. (2003). The role of affect in the WTA/WTP
disparity. Journal of Behavioral Decision Making, 16I, 309-330.

78
Petty, R. E., & Cacioppo, J. T. (1986). The elaboration likelihood model of persuasion.
In J. L. Berkowitz (Ed.), Advances in experimental social psychology (pp. 123-205). New
York: Academic Press.
Preacher, K. J., & Hayes, A. F. (2008). Asymptotic and resampling strategies for assessing
and comparing indirect effects in multiple mediator models. Behavior Research
Methods, 40, 879-891.
Redelmeier, D. A., & Shafir, E. (1995). Medical decision making in situations that offer
multiple alternatives. Journal of the American Medical Association, 273, 302-305.
Reisen, M., Hoffrage, U., & Mast, F. W. (2008). Identifying decision strategies in a consumer
choice situation. Judgment and Decision Making, 3, 31.
Ritov, I., & Baron, J. (1992). Status quo and omission biases. Journal of Risk and
Uncertainty, 5, 49-62.
Ritov, I., & Baron, J. (1995). Outcome knowledge, regret, and omission bias. Organizational
Behavior and Human Decision Processes, 64, 119-127.
Ruder, M. & Bless, H. (2003). Mood and the reliance on the ease of retrieval heuristic.
Journal of Personality and Social Psychology, 85, 20-32.
Ruiter, R. A. C., Abraham, C., & Kok, G. (2001). Scary warnings and rational
precautions: a review of the psychology of fear appeals. Psychology and Health, 16, 613-
630.
Sainfort, F. & Booske, B. C. (2000). Measuring post-decision satisfaction. Medical Decision
Making, 20, 51-61.
Samuelson, W., & Zeckhauser, R. (1988). Status quo bias in decision making. Journal
of Risk and Uncertainty, 1, 7-59.

79
Sayette, M. A., Wertz, J. M., Martin, C. S., Cohn, J. F., Perrott, M. A., & Hobel, J. (2003).
Effects of smoking opportunity on cue-elicited urge: a facial coding analysis.
Experimental and Clinical Psychopharmacology, 11, 218-227.
Schwarz, N. B., & Clore, G. L. (1983). Mood, misattribution, and judgments of well-
being: Information and directive functions of affective states. Journal of Personality and
Social Psychology, 45, 513-523.
Schwarz, N. (1990). Feelings as information: informational and motivational functions of
affective states. In E. T. Higgins & R. M. Sorrentino (Eds.), Handbook of motivation and
cognition: Foundations of social behavior (Vol. 2; pp. 527-561). New York, NY:
Guilford Press.
Schwartz, B., Ward, A. H., Monterosso, J., Lyubomirsky, S., White, K., & Lehman, D. (2002).
Maximizing versus satisficing: Happiness is a matter of choice. Journal of Personality
and Social Psychology, 83, 1178-1197.
Sheridan, S.L., Harris, R. P., & Woolf, S. H. (2004). Shared decision making about screening
and chemoprevention. a suggested approach from the U.S. Preventive Services Task
Force. American Journal of Preventative Medicine, 26, 56-66.
Siegel-Jacobs, K., & Yates, J. F. (1996). Effects of procedural and outcome
accountability on judgment quality. Organizational Behavior and Human Decision
Processes, 66, 1-17.
Simon, H. A. (1957). Models of man: Social and rational. New York: Wiley.
Slovic, P. (1995). The construction of preference. American Psychologist, 50, 364-371.
Slovic, P., Finucane, M.L., Peters, E., MacGregor, D. (2006). The Affect Heuristic. In S.

80
Lichtenstein & P. Slovic (Eds.), The Construction of Preference. (pp. 434-453). New
York: Cambridge University Press.
Slovic, P., Finucane, M. L., Peters, E., & MacGregor, D. G. (2004). Risk as analysis and
risk as feelings: some thoughts about affect, reason, risk, and rationality. Risk Analysis,
24, 311-322.
Sobel, M. E. (1982). Asymptotic confidence intervals for indirect effects in structural equation
models. In S. Leinhart (Ed.), Sociological methodology 1982, San Francisco: Jossey-
Bass.
Spielberger, C. D. (1983). Manual of the state-trait anxiety inventory form y.
Tannis, M. (2008). Health-related on-line forums: what’s the big attraction? Journal of Health
Communication, 13, 698-714.
Tversky, A., & Kahneman, D. (1991). Loss aversion in riskless choice: a reference-
dependent model. The Quarterly Journal of Economics, 106, 1039-61.
Tversky, A. & Shafir, E. (2006). Choice under conflict: the dynamics of deferred decision.
Psychological Science, 3, 358-361.
U.S. Office for Human Research Protections. (2010). Policy guidance. Accessed July 1, 2010 at
www.hhs.gov/ohrp/.
van den Berg, M., Timmermans, D., ten Kate, L., van Vugt, J., & van der Wal, G. (2006).
Informed decision making in the context of prenatal screening. Patient Education &
Counseling, 63, 110–117.
Van Dijk, W. W., Van der Pligt, J, & Zeelenberg, M. (1999). Effort invested in vain: The impact
of effort on the intensity of disappointment and regret. Motivation and Emotion, 23, 203-
220.

81
Watson, D., Clark, L. A., & Tellegen, A. (1988). Development and validation of brief
measures of positive and negative affect: The PANAS scales. Journal of Personality and
Social Psychology, 54, 1063-1070.
Wegener, D. T., & Petty, R. E. (1994). Mood management across affective states: The
hedonic contingency hypothesis. Journal of Personality and Social Psychology, 66,
1034-1048.
White, V., Webster, B., & Wakefield, M. (2008). Do graphic health warning labels have an
impact on adolescents' smoking-related beliefs and behaviours? Addiction, 103, 1562-
1571.
Whiteside S. P., & Lynam, D. R. (2001). The five factor model and impulsivity: Using a
structural model of personality to understand impulsivity, Personality and Individual
Differences, 30, 669–689.
Willemsen, M. C. & Johnson, E. (2009). MouselabWEB: a process tracing tool.
Accessed at: www.mouselabweb.org.
Wilson, T.D. & Schooler, J. W. (1991). Thinking too much: introspection can reduce the quality
of preferences and decisions. Journal of Personality and Social Psychology, 60, 181-
192.
Witte, K. (1992). Putting the fear back into fear appeals: The extended parallel process model.
Communication Monographs, 59, 329-349.
Witte, K. & Allen, M. (2000). A meta-analysis of fear appeals: Implications for effective public
health campaigns. Health Education & Behavior, 27(5), 591-615.
Yates, J. F., Veinott, E. S. & Patalano, A. L. (2003). Hard decisions, bad decisions: On

82
decision quality and decision aiding. In Schneider, S. L. & Shanteau, J. (Eds.). Emerging
perspectives on judgment and decision research. (pp. 13-63).Cambridge University
Press: New York.
Zajac, L. E., & Klein, W. M. P. (2007). The effect of health worry on processing of health
information, behavioral intentions, and behavior. Unpublished manuscript, University of
Pittsburgh.
Zeelenberg, M., van den Bos, K., van Dijk, E. & Pieters, R. (2002). The inaction effect in the
psychology of regret. Journal of Personality and Social Psychology, 82, 314-327.

83
6.0 APPENDIX 1: TABLES

84
Table 1. Illustration of Mouselab decision table for skin cancer treatment decision (high threat
condition).
Treatments Side effects Risk of immediate death
Short-term risks
Long-term risks
Benefits of treatment
Deep tissue surgery
Severe pain at site of treatment; spend one week in hospital
There is some risk of immediate death during surgery procedure
Prominent scarring; excellent chance that all cancer cells removed.
Permanent scarring; there is a low risk of cancer recurrence
This is a brief course of treatment; no need for follow-up care
Shallow tissue surgery
Moderate pain at site of treatment; spend one morning in hospital
There is some risk of immediate death during surgery procedure
Temporary visible scarring; Very good chance that all cancer cells removed
Moderate risk of mild permanent scarring; low risk of cancer recurrence
Minimal scarring; outpatient procedure; can be back to regular life right away
Laser removal
Red marks at site of treatment; skin around treatment site can become itchy
There is a low risk of immediate death during treatment procedure
Temporary visible scarring; Very good chance that all cancer cells removed.
Moderate risk of cancer recurrence; Low risk of permanent pain in area.
This treatment produces no scarring and is a painless procedure
Topical medication
Itchiness and moderately painful burning sensation at treatment site
Very low risk of immediate death from allergic reaction to medication
Temporary visible scarring; Very good chance that all cancer cells killed.
Moderate risk of recurrence; moderate risk of permanent pain in area.
Little scarring; also reduces appearance of fine lines and wrinkles.
Oral medication
Mild joint pain and headaches for duration of treatment (ten weeks)
Low risk of immediate death from allergic reaction to medication
Mild headache for one week. Excellent chance that all cancer cells killed.
Low risk of permanent scarring; Very low risk of cancer recurrence
This treatment produces little scarring; also reduces facial acne.

85
Table 2. Illustration of Mouselab decision table for skin cancer treatment decision (low threat
condition).
Treatments Side effects Risk of immediate death
Short-term risks
Long-term risks
Benefits of treatment
Deep tissue surgery
Moderate pain at site of treatment; spend one week in hospital
There is a low risk of immediate death during surgery procedure
Some scarring; excellent chance that all cancer cells removed.
Permanent scarring; there is a low risk of cancer recurrence
This is a brief course of treatment; no need for follow-up care
Shallow tissue surgery
Severe pain at site of treatment; spend one morning in hospital
There is some risk of immediate death during surgery procedure
Temporary visible scarring; Good chance that all cancer cells removed
Moderate risk of mild permanent scarring; moderate risk of cancer recurrence
Minimal scarring; outpatient procedure; can be back to regular life right away
Laser removal
Red marks at site of treatment; skin around treatment site can become itchy
There is some risk of immediate death during treatment procedure
Temporary visible scarring; Very good chance that all cancer cells removed.
Moderate risk of cancer recurrence; Low risk of permanent pain in area.
This treatment produces no scarring and is a painless procedure
Topical medication
Itchiness and moderately painful burning sensation at treatment site
Low risk of immediate death from allergic reaction to medication
Temporary visible scarring; Good chance that all cancer cells killed.
Moderate risk of recurrence; moderate risk of permanent pain in area.
Little scarring; also reduces appearance of fine lines and wrinkles.
Oral medication
Mild joint pain and headaches for duration of treatment (ten weeks)
Low risk of immediate death from allergic reaction to medication
Mild headache for one week. Excellent chance that all cancer cells killed.
Low risk of permanent scarring; Very low risk of cancer recurrence
This treatment produces little scarring; also reduces facial acne.
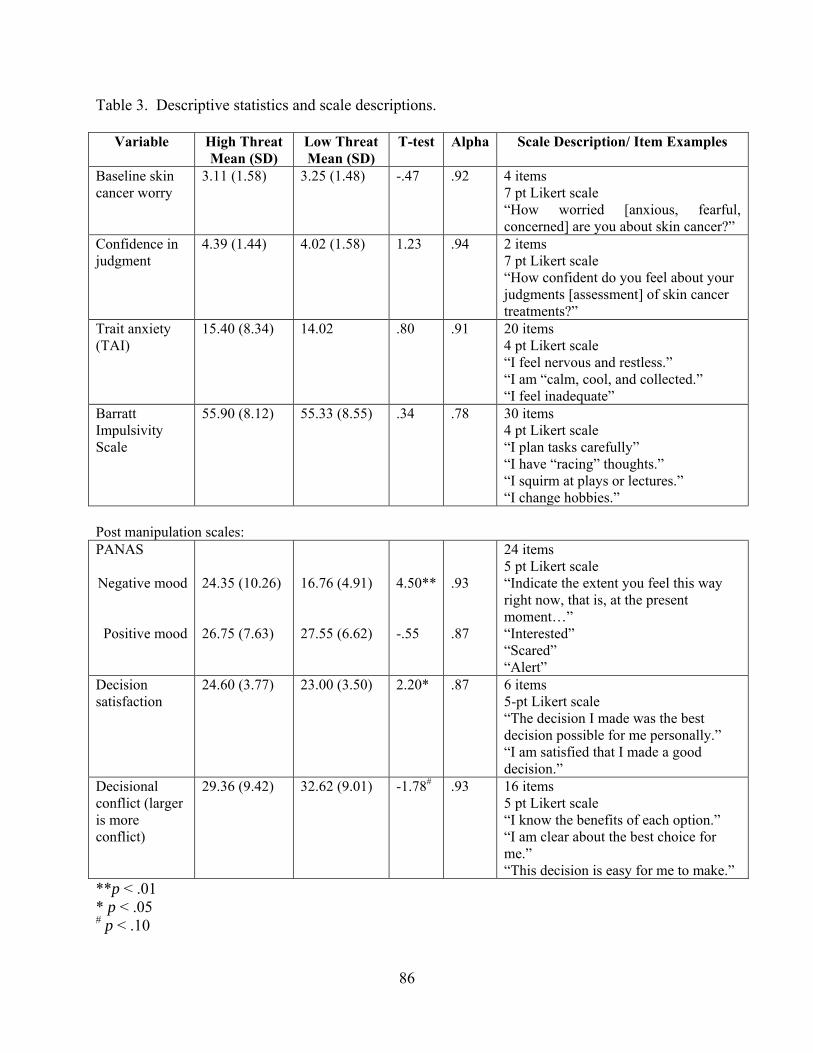
86
Table 3. Descriptive statistics and scale descriptions.
Variable High Threat Mean (SD)
Low Threat Mean (SD)
T-test Alpha Scale Description/ Item Examples
Baseline skin cancer worry
3.11 (1.58) 3.25 (1.48) -.47 .92 4 items 7 pt Likert scale “How worried [anxious, fearful, concerned] are you about skin cancer?”
Confidence in judgment
4.39 (1.44) 4.02 (1.58) 1.23 .94 2 items 7 pt Likert scale “How confident do you feel about your judgments [assessment] of skin cancer treatments?”
Trait anxiety (TAI)
15.40 (8.34) 14.02 .80 .91 20 items 4 pt Likert scale “I feel nervous and restless.” “I am “calm, cool, and collected.” “I feel inadequate”
Barratt Impulsivity Scale
55.90 (8.12) 55.33 (8.55) .34 .78 30 items 4 pt Likert scale “I plan tasks carefully” “I have “racing” thoughts.” “I squirm at plays or lectures.” “I change hobbies.”
Post manipulation scales: PANAS Negative mood
Positive mood
24.35 (10.26) 26.75 (7.63)
16.76 (4.91) 27.55 (6.62)
4.50** -.55
.93 .87
24 items 5 pt Likert scale “Indicate the extent you feel this way right now, that is, at the present moment…” “Interested” “Scared” “Alert”
Decision satisfaction
24.60 (3.77) 23.00 (3.50) 2.20* .87 6 items 5-pt Likert scale “The decision I made was the best decision possible for me personally.” “I am satisfied that I made a good decision.”
Decisional conflict (larger is more conflict)
29.36 (9.42) 32.62 (9.01) -1.78# .93 16 items 5 pt Likert scale “I know the benefits of each option.” “I am clear about the best choice for me.” “This decision is easy for me to make.”
**p < .01 * p < .05 # p < .10

87
Table 4. Individual Analysis of Variance for Condition Predicting Process Measures.
Source
df
F
p
Time to decision
1
.14
.71
Number of boxes opened
1 .10 .76
Proportion of time spent looking at Benefits
1 2.15 .15
Proportion of time spent looking at Chance of Immediate Death
1 3.86* .053
Proportion of time spent looking at Side Effects
1
6.53**
.012
Decision strategy
1
.007
.93
Note. Each analysis reported above was completed separately. All analyses controlled for education. Proportion of time variables were calculated by dividing the amount of time spent looking at Benefits or Death information by the total time spent making the decision. *p = .05. **p = .01

88
Table 5. Results of the Chi Square test of the relationship between participants who compared across the Long Term Risk attribute and participants who selected the optimal option. The table includes observed and expected frequencies. Observed Select best option?
Yes
No Total
Compared across Long Term Risk attribute?
Yes
33 (25.9)
41 (48.1)
74
No
2 (9.1)
24 (16.9)
26
Total
35
65
100
Note. Expected frequencies in parentheses.

89
7.0 APPENDIX 2: FIGURES
Figure 1: Motivated decision processing model
Exposure to threatening
health information
Effort motivation
Defensive motivation
Biased systematic processing

90
Figure 2. Study procedure
Qs: Skin cancer worry,
confidence in judgment;
risk perceptions;
TAI
Participant reads scenario: Experimental and Control
Manipulation check (How threatening
was scenario?;
How worried are you about skin cancer?)
Participant views
decision table
Manipulation check: (How frightening was info?;
How threatening was info?;
PANAS)
Participant makes
decision
Qs: Decision satisfaction; impulsivity;
demographics; Decision
Conflict Scale

91
Figure 3. Number of participants who selected the best option as a function of condition.
*p<.05
37*
28
13
22
0
5
10
15
20
25
30
35
40
High threat Low threat
Number of participants who selected optimal option
Number of participants who selected non-optimal option
Condition

92
Figure 4. Mean time spent comparing across attributes
**p<.01
**
0
5000
10000
15000
20000
25000
Long termrisks
Side effects Risk ofimmediate
death
Short termrisks
BenefitsMe
an t
ime
sp
en
t co
mp
arin
g ac
ross
at
trib
ute
(in
mill
ise
con
ds)
Attribute

93
Figure 5. Mean time spent comparing across attributes by condition.
*p < .05
All analyses controlled for demographics (age, education, income)
*
*
*
*
0
5000
10000
15000
20000
25000
30000
Long termrisks
Side effects Risk ofimmediate
death
Short termrisks
Benefits
Me
an t
ime
sp
en
t co
mp
arin
g at
trib
ute
s
Attribute
High threat
Low threat

94
Figure 6. Graph of the interaction between trait anxiety and condition.
-2.5
-2
-1.5
-1
-0.5
0
0.5
1
1.5
Tim
e s
pe
nt
com
par
ing
acro
ss L
on
g-te
rm r
isk
attr
ibu
te
Condition
Low anxiety
High anxiety
-1 Low threat
1 High threat
-1 Low threat
1 High threat
-1 Low threat
1 High threat
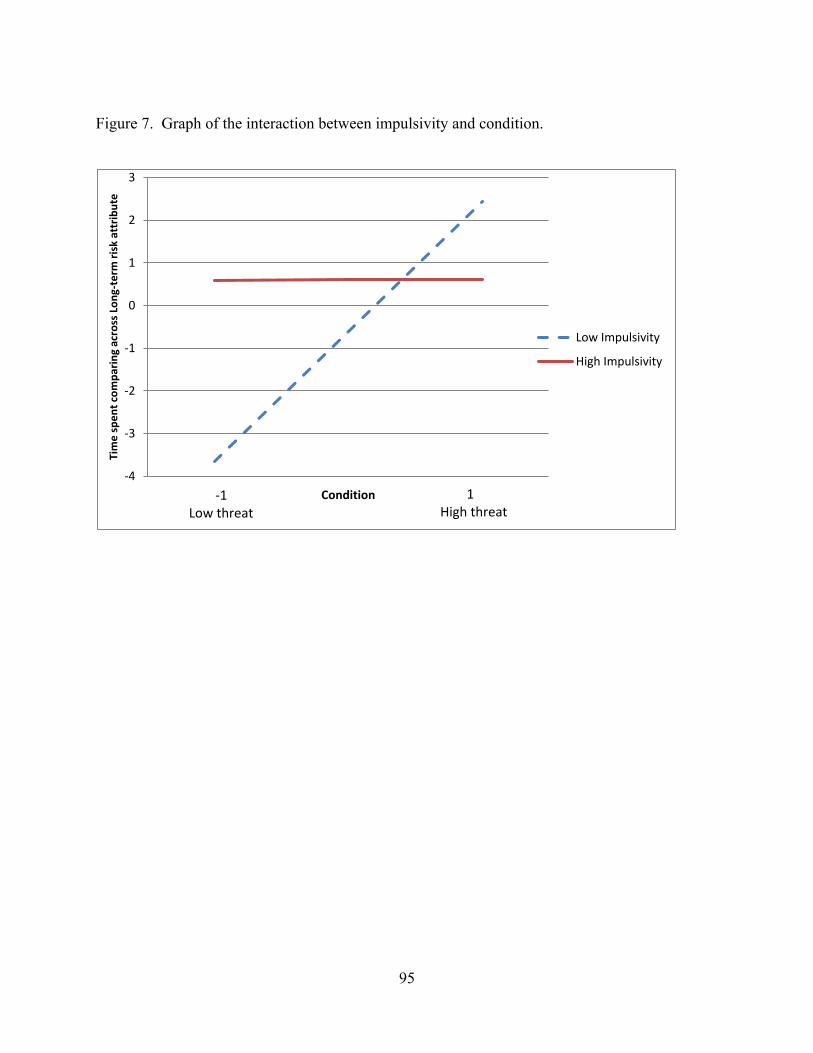
95
Figure 7. Graph of the interaction between impulsivity and condition.
-4
-3
-2
-1
0
1
2
3
Tim
e s
pe
nt
com
par
ing
acro
ss L
on
g-te
rm r
isk
attr
ibu
te
Condition
Low Impulsivity
High Impulsivity
-1 Low threat
1 High threat