making great food affordable - corporate - morrisons annual report... · making great food...
TRANSCRIPT

Annual report and financial statements 2011/12
Wm Morrison Supermarkets PLC
Making great food affordable

Introduction What matters to us
Business and strategy review Wm Morrison Supermarkets PLC
About us
We are the UK’s fourth largest food retailer by sales, with an annual turnover in excess of £17bn. We have 475 stores across Britain, ranging in size from 3,000 to over 40,000 square feet. Over 11 million customers visit our stores each week, served by more than 131,000 employees.
Our business
Our strategy
Our financial performance
We are proud of what makes us different – a distinctive offer to customers centred around fresh food, craft skills and food production through our manufacturing business; the way we lead and support our colleagues; and our unique heritage. It is our vision to be ‘Different and Better than Ever’, being ‘different’ means building on these advantages; and being ‘better than ever’ is about improving the way we do business.
Chief Executive’s business and strategy review — page 4
We have developed a strategy based on our view of how the market will evolve, what will be most appealing to our customers and how we make best use of our internal capabilities. Our strategy is based on six convictions (outlined on page 7), and we have a clearly defined set of initiatives that will deliver our strategy grouped by our objectives of ‘driving topline’, ‘increasing efficiency’ and ‘capturing growth’.
Our strategic objectives — page 12
Our financial performance in 2011/12 was strong in what remains a challenging environment for the consumer. We continued to invest in the long term growth of the business and to deliver increasing returns to shareholders, whilst maintaining a strong balance sheet. The business is well placed to deliver sustainable long term growth.
Group Finance Director’s financial review — page 8
Financial performanceGroup turnover
£17.7bn up 7%
Like-for-like sales (ex-fuel, ex-VAT)
1.8%
Profit before tax
£947m up 8%
Basic earnings per share
26.7p up 11%
Net debt
£1,471mTotal dividend per share
10.7p up 11%
Note: Throughout the Directors’ report and business review(1) Unless otherwise stated, 2011/12 refers to
the 52 week period ended 29 January 2012 and 2010/11 refers to the 52 week period ended 30 January 2011. 2011 and 2012 refer to calendar years.
(2) Underlying profit is defined as profit before one off costs and credits, property transactions and IAS19 pension interest, as reconciled in note 1 of the Group financial statements.

1Annual report and financial statements 2011/12
What’s in our report
Richard PennycookOur strong financial performance positions us well for sustainable long term growth.
Page 8
Sir Ian GibsonWe are committed to making food shopping fresh, friendly and affordable.
Page 2
Johanna WaterousA strong performance culture, long term shareholder value and competitive positioning remain key principles.
Page 46
Dalton PhilipsA clear strategy is in place that is delivering our objectives.
Page 4
Investor relations websitewww.morrisons.co.uk/corporate
Corporate responsibility review 2011/12
Also see...
Features Directors’ report and business review
Introduction2 Chairman’s statement
Business and strategy review4 Chief Executive’s business and strategy review8 Group Finance Director’s financial review12 Our strategic objectives
Performance review26 Key performance indicators28 Risks and uncertainties30 Corporate responsibility33 Our people
Governance36 Board of Directors and Management Board40 Corporate governance report46 Directors’ remuneration report56 General information59 Statement of Directors’ responsibilities
Financial statements
60 Group financial statements 60 Independent auditor’s report 61 Consolidated statement
of comprehensive income 62 Consolidated balance sheet 63 Consolidated cash flow statement 64 Consolidated statement of changes in equity 65 Group accounting policies 70 Notes to the Group financial statements
95 Company financial statements 95 Company balance sheet 96 Company accounting policies 99 Notes to the Company financial statements
Investor information108 Five year summary of results109 Supplementary information110 Investor relations and financial calendar
Annual review2011/12

2 Wm Morrison Supermarkets PLCBusiness and strategy review
Chairman’s statementIntroduction from the Chairman
Sir Ian GibsonChairman
Against the backdrop of a very challenging environment for the consumer, where value, freshness and quality are key, I am pleased to report another year of good progress for Morrisons.
Record numbers of customers visited our stores, demonstrating that Morrisons unique offer is in tune with the needs of consumers in these uncertain times. The delivery of good earnings growth and the resultant increase in the dividend demonstrates resilience of our business model in a tough economic environment.
Group highlightsUnderlying profit before tax
£935mUnderlying earnings per share
25.6pFinal dividend per share
7.53pProfit share pool for colleagues
£49mRaised for Save the Children charity
£2.3m
See our reportvisit: www.morrisons.co.uk/corporate/ar2012
3Annual report and financial statements 2011/12
At the start of the year, we outlined a range of initiatives to grow our sales profitability, make our business more efficient and develop further growth opportunities that would deliver enhanced value to shareholders. The management team has made good progress in all these areas and we are on track to deliver our vision to make Morrisons ‘Different and Better than Ever’.
ResultsProfit before tax was £947m, an increase of £73m (8%) when compared with £874m last year. Underlying profit before tax, which we regard as the true measure of business performance, was up 8% to £935m. Statutory basic earnings per share increased by 11% over the previous year to 26.7p, with underlying basic earnings per share up by 11% to 25.6p.
Our policy is to increase the dividend in line with underlying earnings growth subject to a minimum increase of 10% in each of the three years to 2013/14. In line with this policy, the Board is therefore recommending a final dividend of 7.53p per share, to bring the total dividend for the year to 10.7p, an increase of 11% on 2010/11. The dividend is covered 2.4 times by underlying earnings.
Cash flow from operations of £1,264m was up by £123m (11%), when compared to the previous year. Capital expenditure and investments of £901m was £306m higher than the previous year. This was the result of a planned acceleration in our store opening programme, the addition of a new regional distribution centre at Willow Green, Bridgwater, and investments to support our expansion ambitions for online shopping and vertical integration. We expect capital expenditure to be higher in 2012/13 as we continue to invest for future growth. £368m was invested into our equity retirement programme, and we are on track to meet our objective of returning £1bn to shareholders over the two years to March 2013, in addition to normal dividends.
These investments, together with an increased dividend payment, resulted in a rise in net debt to £1,471m (2010/11: £817m), to leave gearing at 27%. At this level it remains low for the sector. At the year end the Group had undrawn, committed facilities of £725m and a credit rating of A3 from Moody’s. This is a strong investment grade which is only held by two other European retailers.
Community and the environmentOur customers expect us to trade responsibly, and we are committed to managing resources carefully, maintaining ethical standards and working with the communities in which
we operate. During the year, we have continued to undertake research projects through the Morrisons Farming Programme, have been enthusiastic supporters of the Government’s Public Health Responsibility Deal and have made good progress towards our long term energy reduction targets. Our Let’s Grow programme, now in its fifth year, continues to help school children throughout the UK to get out of the classroom and learn about the food cycle first hand.
It is a source of pride that our colleagues and customers always go out of their way to support our charitable activities, and I am delighted that Save the Children was selected by our colleagues, for the second successive year, as our charity partner. Specifically, we have helped fund its award-winning Families and Schools Together (FAST) programme across the UK, which is designed to give the most disadvantaged children a chance of a better future. With an array of fundraising activities, we have raised £2.3m for FAST this year, successfully funding 24 programmes, as well as Save the Children’s emergency appeals in Japan and East Africa.
Industry recognitionMorrisons commitment to providing customers with an outstanding shopping experience and making it a great place to work for colleagues has again been recognised with numerous industry awards. These included nine The Grocer Own Label Food and Drink Awards, Fresh Produce Retailer of The Year (multiple category) at the Retail Industry Awards and Employer of the Year from both Retail Week and The Grocer Gold Awards.
Our colleaguesThese awards are testimony to the passion and hard work of our 131,000 colleagues, who are making Morrisons ‘Different and Better than Ever’ for our customers every day.
I am delighted that our growth during the year will provide a profit share pool for them of £49m, an increase of 8% over last year.
We continue to invest in training and skills. Our award-winning Morrisons Academy provides specialist training to help colleagues develop new skills or work towards a nationally recognised qualification such as QCF. Over 100,000 colleagues were successfully accredited during the year and, at the time of rising youth unemployment, I am pleased that 40,000 of our colleagues are aged 16 to 24.
On behalf of the Board, I want to express our thanks to every one of our colleagues for their dedication, professionalism and service throughout the year.
We are committed to making food shopping fresh,
friendly and affordableIt underpins our unique promise to every single household in the UK – the best service and the freshest food for less.
Business and strategy review
Perform
ance review
Governance
Financial statements
Investor information

4 Wm Morrison Supermarkets PLCBusiness and strategy review
This has been Morrisons best year yet, with another good financial performance and growth ahead of the market. Customers were having a tough time, but we responded with a new M savers brand for budget conscious shoppers, promotions that customers understood, and industry leading service.
We know that 2012 will be tough, and we will be working hard to deliver even better value for our customers. At the same time, we have ambitious plans for the long term development of the business, through new supermarkets, convenience stores and the development of our multi-channel capabilities.
Chief Executive’s business and strategy review
Operational highlightsCustomer numbers
up 0.4m per week
Market share
12.8%*
Stores opened (including one replacement)
37Gross profit
£1,217m up 6%
Average basket spend
£22.67
*Source: Kantar Worldpanel◆Source: ONS/Economic & Fiscal Outlook, OBR, November 2011
Dalton PhilipsChief Executive
Our strategic objectivesPage 12
How our KPIs link to our strategyPage 26
See our reportvisit: www.morrisons.co.uk/corporate/ar2012

5Annual report and financial statements 2011/12
Turnover analysis
Like-for-like stores
Othersales
2011/12Total
2010/11Total
In-store (£m) 13,112 324 13,436 12,937Fuel (£m) 4,009 30 4,039 3,426Other sales (£m) – 188 188 116Total turnover (ex-VAT) (£m) 17,121 542 17,663 16,479In-store salesSales per square foot (£) 21.05 12.83 20.74 20.80Customer numbers per week (m) 11.0 0.4 11.4 11.0Customer spend (£) 22.82 17.69 22.67 22.67
Business and strategy review2011/12 was another good year for Morrisons. Against the backdrop of a difficult environment for the consumer, our unique fresh, quality and value offer made Morrisons a natural destination and more customers visited our stores than ever before. We continued to improve our financial performance whilst investing for future growth.
Turnover growthTotal turnover was £17.7bn, an increase of £1.2bn (7%). Our store sales (excluding fuel) grew by 3.9% to £13.4bn, with a record 11.4m customers coming into our stores each week. Sales from new stores contributed 2.1% of our total growth. Like-for-like sales grew by 1.8%, customer numbers were up by 1.3% and average basket spend up 0.6%. Whilst sales growth was strongest in London and the South East, we were pleased with our sales performance in all regions of the country.
For the second year in a row, consumers were faced with increases in the price of oil, exacerbated by ongoing Sterling weaknesses. With unleaded prices at the pump up by 15.4p per litre and diesel increasing by 18.5p, motorists were paying an average of 15% more per litre at the pump than they did last year. The demand for fuel is relatively inelastic and, whilst motorists continue to use their cars in times of austerity, they take time to shop around for the best deals, such as our ‘Fuel Brittania’ programmes. As a result, our volume sales increased by 4.8%. Overall, like-for-like fuel sales were up 18% in the year.
Inflationary effects took their toll on disposable incomes during the year, with the unwelcome impact of high oil prices feeding through, not just at the petrol pumps, but also throughout the supply chain. Other core commodities increased in price too, adding to the pressure. Market prices for beef and lamb rose by 15% and 11% respectively over the year, and average wheat prices were up by 32%.◆ The increase in fuel prices alone reduced our customers’ disposable income by some £600m, income that could otherwise have been spent in our stores. In this environment, consumers looked around for value and found it at Morrisons, where our sharp pricing, supported by innovative promotions, was welcomed by customers.
We maintain a prudent approach to adding new space to our estate and only approve investments that meet the required financial hurdle rate. As a result, our space opening programme, whilst being ahead of our published targets, was less, in relative terms, than our major competitors. Despite this, with good like-for-like sales, we maintained our market share.*
Throughout the year, we noted the rise of the ‘professional shopper’, with customers taking time to shop around and look very carefully at pricing and offers in order to search out value. This trend played to Morrisons strengths. Our value proposition of everyday low prices, coupled with industry leading offers, and the flexibility of our vertical integration enabled us to meet our customers’ need for great fresh food at affordable prices. Offers such as our 49p produce deal and our two loaves of bread for £1 promotion helped our customers manage on tight budgets. The market remained highly promotional, and our innovative promotions such as ‘Pay Day Price Crunch’ and ‘Morrisons Millions’ really caught the mood of the nation.
A clear strategy is in place that is delivering our objectives
The strategy we have pursued, and the investment choices we have made, have set our business up to produce sustainable rates of growth.
Business and strategy review
Perform
ance review
Governance
Financial statements
Investor information

6 Wm Morrison Supermarkets PLCBusiness and strategy review
Chief Executive’s business and strategy review – continued
Operating results
Summary income statement2011/12
£m2010/11
£mChange
%
Turnover 17,663 16,479 7Gross profit 1,217 1,148 6Gross profit margin 6.9% 7.0% (0.1)Other operating income 86 80 8Administrative expenses (329) (323) 2Underlying operating profit 974 905 8Property transactions (1) (1) –Operating profit 973 904 8Operating profit margin 5.5% 5.5% –Net finance charges (26) (30) (13)Taxation (257) (242) 6Profit for the period 690 632 9
Gross profit grew by 6% to £1,217m during the year. The gross profit margin was 6.9%, a fall of 10bps against last year due to the increased proportion of low margin fuel sales in the mix this year. After cost of goods sold, the Group’s two largest cost areas are store wages and distribution costs. We continued to manage costs and improve efficiency in both areas whilst maintaining excellent standards and customer service levels. As a result, we again improved our store labour costs relative to sales, with in-store labour productivity up by 2.9%. Distribution productivity improved by 4.3%, reflecting the benefits of the investment we have made in systems improvement.
Other operating income grew by 8% to £86m, primarily because of increased recycling credits.
Administrative expenses increased by 2%, well below the rate of profit and sales growth in the year. This reflects the strong cost control culture that exists throughout the business.
Although the operating margin of 5.5% was in line with the prior year’s, the underlying result was an improvement of 20bps, after adjusting for the increased proportion of low margin fuel sales.
Market overviewThe UK grocery market continues to operate in a very tough economic climate, with consumer confidence close to record lows during the year. In 2011, the market was worth £97bn, up by 4.2% on the previous year.* Whilst this appears to be solid growth, it should be noted that space growth was approximately 4%, a historically high figure. Within these figures, online grocery grew disproportionately, with 17% of UK adults buying food or groceries online, up from 10% three years ago. The convenience market, which is measured separately, grew 4.6% to £34bn in 2011, and is expected to continue growing at a faster rate than the traditional grocery market for some time to come.♠
Retail grocery volumes were flat in the year and it was inflation, averaging 5.5% through the year, which drove growth. CPI food inflation, as measured by the Office of National Statistics, was above 6% for much of the year but started to come down through the last quarter, reaching 3.4% in January 2012. Categories that saw particularly high inflation include oils and fats (10%), coffee and tea (10%), and meat (6%).◆
Value at the forefront of shoppers’ mindsHousehold incomes were squeezed throughout 2011, due to the previously mentioned commodity and energy price pressures, and also as a result of the Government’s fiscal measures, particularly the rise in VAT to 20%. Cost pressures ran well ahead of wage settlements, with the result that disposable incomes overall fell 2.3% in 2011. A general unease about current and future expectations for the economy and for personal finances also saw shoppers managing more closely to a budget.
As a result, pricing and overall value have become increasingly important factors in purchasing decisions. More shoppers now regard price as their first consideration when choosing between products, compared with a year ago, with almost seven out of ten now saying they make the majority of their grocery shopping decisions before they get to store. This is an increase of 40% since 2008. Promotions are increasingly important when shoppers are deciding which stores to shop at and what products to buy. 70% of shoppers say promotions play a very important role in determining which stores they shop in, compared to 64% of shoppers in December 2010.▲ The grocery retail market has responded to these customer needs through an increased weight of promotional activity on branded goods. Additionally, retailer own brand sales, which carry a lower average unit price, have been performing more strongly than branded products as shoppers look for ways to manage their expenditure.
♠ Source: IGD ▲ Source: IGD ShopperVista *Source: Kantar Worldpanel◆Source: ONS/Economic & Fiscal Outlook, OBR, November 2011

7Annual report and financial statements 2011/12
AboveFresh food with exceptional customer service is helping us be better than ever.
StrategyIn 2010, we outlined our vision to make Morrisons ‘Different and Better than Ever’. We are proud of what makes us different – a distinctive offer to customers centred around fresh food, craft skills and vertical integration through our manufacturing business; the way we lead and support our colleagues; and our unique heritage. Being ‘different’ means building on these advantages, which set us apart from all our competitors and position us to win. Being ‘better than ever’ is about improving the way we do business – doing more of the things that matter for our customers – making great food, offering outstanding service and being more efficient so we can pass on the best savings possible. It also means seizing opportunities to grow the business profitably through new formats, channels and categories, to meet more of our existing customers’ needs and to reach new customers.
Our strategy reflects our view of how the market will evolve, what will be most appealing to our customers and how we make best use of our internal capabilities. It is based on six convictions about the type of business that our customers want us to be.
1 — Food focused not generalist
We want to be the number one destination in the UK for fresh food at outstanding value for money. Fresh food is at the heart of the supermarket shopping experience and customers are seeking freshness, quality and provenance at great value as well as becoming more conscious about healthy eating.
Our manufacturing capabilities, unique craft skills, in-store food preparation, flexible supply chain and farming links all give us competitive advantage. We will continue to build on these to create a unique shopping experience offering customers the best fresh food in the UK, unrivalled value for money and fantastic service.
2 — Experiential over purely functional
Customers are seeking a deeper engagement with food and food shopping and moving away from a purely functional experience. They want to see, touch and smell the food. We want it to look different and feel different when customers shop at Morrisons.
3 — Value is forever
The world is changing but some things are for ever – value is one of them. This means offering an experience which is ‘fun and frugal’ through a combination of great range, quality and service, combined with great prices on everyday products and industry leading deals. We are already well known for delivering great value and we will keep this at the heart of our offer.
4 — Skills not just drills
Our great store colleagues are a competitive advantage we can build on. Customer experience is driven by friendly, knowledgeable service delivered through a skilled and engaged workforce who are all committed to offering customers a fantastic shopping experience.
5 — General merchandise – clicks not bricks
General merchandise is increasingly migrating online, and always from ‘big box’ supermarkets and the traditional high street. We believe therefore that the future for general merchandise is in ‘clicks not bricks’.
6 — Multi-format, multi-channel
We will serve the evolving needs of our customers by expanding into new channels and formats, tailoring our offer to suit the needs of different customers.
Better technology and busy lifestyles are changing the way customers shop. Different customers in different locations want different products. They shop using different channels, going online, via kiosks and on their smartphones, and also visit different formats, doing their weekly shop in larger stores, topping up in convenience stores and seeking out specific products or expertise in speciality stores. To serve more customers, more of the time, we need to be multi-format and multi-channel, tailoring our offer to suit the needs of different customers.
We have developed a clear set of strategic objectives to deliver our vision and strategy, these along with our 2011/12 initiatives are set out on page 12. KPIs and the risks to achieving our vision are set out on pages 26 to 29.
Business and strategy review
Perform
ance review
Governance
Financial statements
Investor information

8 Wm Morrison Supermarkets PLCBusiness and strategy review
Financial review
Group highlightsCash generated from operations
£1,264mGearing
27%
Capital investment, including capital expenditure, investments and acquisitions
£901mOur credit rating
A3Investment in equity retirement programme
£368m
Morrisons financial performance was strong, in what remains a challenging environment for the consumer. We continued to invest in the long term growth of the business and to deliver increasing returns to shareholders, whilst maintaining a strong balance sheet. The business is well placed to deliver sustainable long term growth.
The Group’s financial strategy continues to be to deliver improved margins, whilst positioning for long term growth.
Richard PennycookGroup Finance Director
Our risks and uncertaintiesPage 28
Our Group financial statementsPage 61
See our reportvisit: www.morrisons.co.uk/corporate/ar2012
Financial strategy The underlying principles behind this strategy are:
growing sales ahead of market; delivering earnings that meet the expectations of shareholders; and
maintaining a strong investment grade balance sheet.
We are meeting these principles by: increasing our customer appeal and growing sales organically and opening new stores;
converting sales growth into profitable growth; and investing to yield an appropriate rate of return.

9Annual report and financial statements 2011/12
Interest and taxInterestNet interest paid of £49m was slightly higher than prior year (2010/11: £47m), reflecting a higher average level of net debt during the year. The Group’s effective interest rate of 4.0% was in line with prior year. Interest was covered 37 times (2010/11: 30 times). Excluding net pension interest income, interest was covered 25 times (2010/11: 25 times).
TaxCorporation tax paid in the year was £281m. This cash outflow represented 50% of the total tax bill for the year to 30 January 2011, and 50% of the tax for the year to 29 January 2012.
The effective tax rate for the year was 27.1% (2010/11: 27.7%), which is slightly above the prevailing corporation tax rate of 26%. A combination of non-qualifying depreciation, and expenses for which the Group is unable to obtain a tax deduction for, increases our tax rate above the prevailing rate. Offsetting this, the change in corporation tax rate to 26% from 28% had the effect of reducing the rate compared to the prior year.
Our in-house tax department’s primary focus is on ensuring that the Group continues to pay the appropriate level of tax at the right time. The Group, which is predominantly UK based, operates a simple business model. We aim to be transparent in all our activities, and we do not engage in sophisticated tax planning structures.
Capital expenditureThe Group continues to invest in the infrastructure to support our long term growth. This includes building new stores, the ongoing replacement of our IT systems and the strengthening of our supply chain. Total capital expenditure of £796m during the period included £330m for the planned acceleration of our new store space and the enhancement of our existing estate, £54m for the ongoing development of our IT infrastructure and £59m for the completion of a new RDC for the South West, at Bridgwater.
During the period, we opened a further 37 new stores, of which one was a replacement and three were our new M local convenience format. We also improved our estate through the acquisition of new sites to support our planned future growth, the extension of 15 stores and the refurbishment of the first seven stores to incorporate our new fresh foods concepts. Overall, our net selling space increased by 5.2% during the year.
At 30 Jan2011
Newstores1
Storeextensions
At 29 Jan
2012
Number of core stores
439 33 15 472
Number of convenience stores
– 3 – 3
Total number of stores
439 36 152 475
Total area in square feet (‘000)
12,261 536 107 12,904
Number of petrol filling stations
296 4 – 300
1 Net of replacements.2 Number of store extensions is included in total number of stores.
The Business and strategy review on page 4 contains information about the Group’s financial performance for the year, in particular turnover growth, like-for-like sales growth and operating profit. The review also contains information on selling space increases and our future space expansion programme.
Underlying profit is the measure we use to assess normal underlying business performance and trends. Earnings are adjusted to remove volatile or one-off costs and credits. A reconciliation of underlying profit is provided in note 1 of the Group financial statements.
Summary cash flow
2011/12£m
2010/11£m
Cash generated from operations 1,264 1,141Tax, interest and servicing of finance (330) (238)Capital expenditure (796) (592)Proceeds from sale of plant, property and equipment
4 8
Acquisitions (including debt acquired)
(74) (7)
Investments (31) –Dividends paid (301) (220)Equity (retirement)/issues (368) 16Net cash (outflow)/inflow (632) 108Non-cash movements (22) (1)Opening net debt (817) (924)Closing net debt (1,471) (817)
In line with our planning assumptions, we saw a net cash outflow during the period.
Cash generated from operationsCash from operating activities increased by £123m as a result of the overall increase in profits, which was partly offset by an increase in working capital. During the year, stocks increased by £117m, reflecting our overall sales growth, as well as the acquisition of Kiddicare and the addition of our new regional distribtuion centre (RDC) at Willow Green, Bridgwater.
Our performance against this financial strategy was: sales growth ahead of the market in the year of 0.5%*; underlying EPS of 25.6p, an increase over the prior year of 11%; and
the Group’s balance sheet continues to reflect our strong financial position:
– 90% of our estate is freehold; – we maintain low levels of gearing; – we use prudent assumptions to value our defined
benefit pension schemes; and – adequate and balanced long term financing facilities
are in place to cover our planned investments.
*Source: Kantar Worldpanel
Business and strategy review
Perform
ance review
Governance
Financial statements
Investor information
10 Wm Morrison Supermarkets PLCBusiness and strategy review
In November 2011, we concluded a US private placement with Metropolitan Life Insurance of America Inc. This provided the Group with $250m of committed funding through to November 2026, and was swapped into Sterling at a fixed interest rate for the duration of the term.
In December 2011, the Group issued a 12 year Sterling bond to institutional investors, which provided £400m of funding through to December 2023.
The Group ended the year with a well diversified and mature funding base.
GearingAs anticipated, our gearing ratio increased slightly during the year, but at 27% (2010/11: 15%), it is still well below our sector average. The continuing strength of our balance sheet has been recognised by Moody’s, a leading credit ratings agency, who has confirmed an investment grade A3 rating. We continue to be one of only three European retailers to have this strong rating.
Pensions The Group sponsors two defined benefit pension arrangements and both of these pension schemes are managed externally to, and independently of, the Group’s operations. Our approach to valuing our defined benefit pension obligations remains prudent.
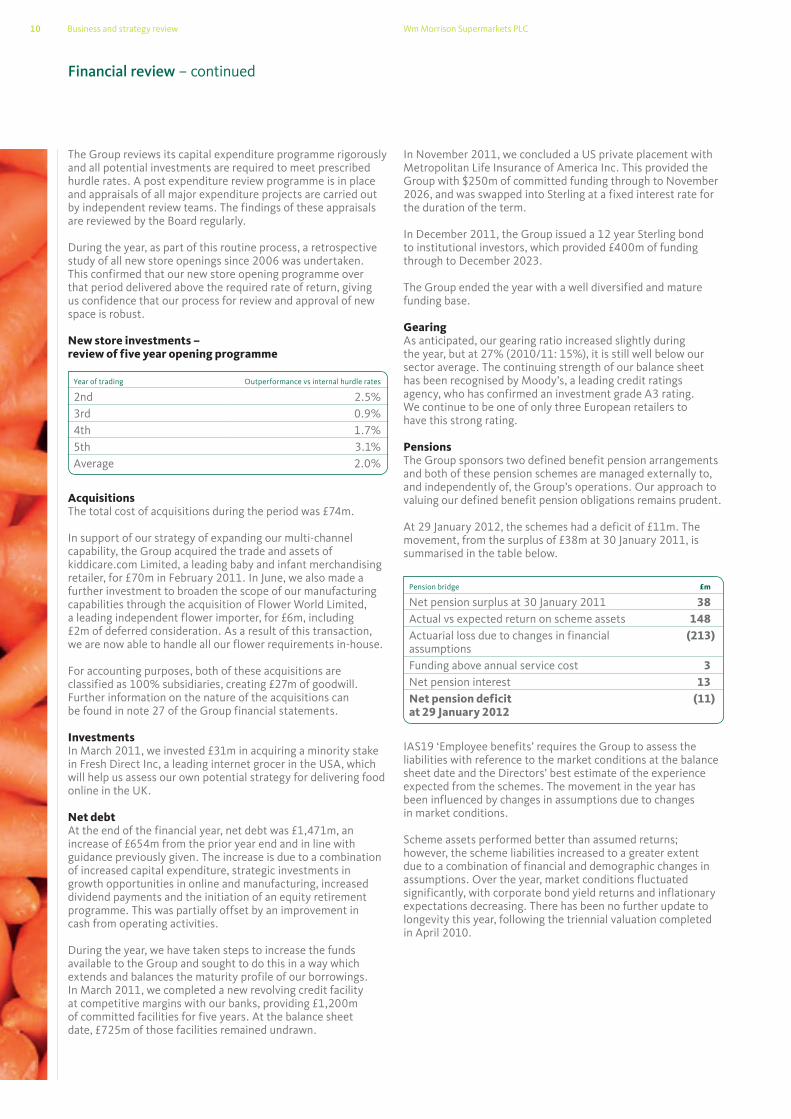
At 29 January 2012, the schemes had a deficit of £11m. The movement, from the surplus of £38m at 30 January 2011, is summarised in the table below.
Pension bridge £m
Net pension surplus at 30 January 2011 38Actual vs expected return on scheme assets 148Actuarial loss due to changes in financial assumptions
(213)
Funding above annual service cost 3Net pension interest 13Net pension deficit at 29 January 2012
(11)
IAS19 ‘Employee benefits’ requires the Group to assess the liabilities with reference to the market conditions at the balance sheet date and the Directors’ best estimate of the experience expected from the schemes. The movement in the year has been influenced by changes in assumptions due to changes in market conditions.
Scheme assets performed better than assumed returns; however, the scheme liabilities increased to a greater extent due to a combination of financial and demographic changes in assumptions. Over the year, market conditions fluctuated significantly, with corporate bond yield returns and inflationary expectations decreasing. There has been no further update to longevity this year, following the triennial valuation completed in April 2010.
The Group reviews its capital expenditure programme rigorously and all potential investments are required to meet prescribed hurdle rates. A post expenditure review programme is in place and appraisals of all major expenditure projects are carried out by independent review teams. The findings of these appraisals are reviewed by the Board regularly.
During the year, as part of this routine process, a retrospective study of all new store openings since 2006 was undertaken. This confirmed that our new store opening programme over that period delivered above the required rate of return, giving us confidence that our process for review and approval of new space is robust.
New store investments – review of five year opening programme
Year of trading Outperformance vs internal hurdle rates
2nd 2.5%3rd 0.9%4th 1.7%5th 3.1%Average 2.0%
AcquisitionsThe total cost of acquisitions during the period was £74m.
In support of our strategy of expanding our multi-channel capability, the Group acquired the trade and assets of kiddicare.com Limited, a leading baby and infant merchandising retailer, for £70m in February 2011. In June, we also made a further investment to broaden the scope of our manufacturing capabilities through the acquisition of Flower World Limited, a leading independent flower importer, for £6m, including £2m of deferred consideration. As a result of this transaction, we are now able to handle all our flower requirements in-house.
For accounting purposes, both of these acquisitions are classified as 100% subsidiaries, creating £27m of goodwill. Further information on the nature of the acquisitions can be found in note 27 of the Group financial statements.
Investments In March 2011, we invested £31m in acquiring a minority stake in Fresh Direct Inc, a leading internet grocer in the USA, which will help us assess our own potential strategy for delivering food online in the UK.
Net debtAt the end of the financial year, net debt was £1,471m, an increase of £654m from the prior year end and in line with guidance previously given. The increase is due to a combination of increased capital expenditure, strategic investments in growth opportunities in online and manufacturing, increased dividend payments and the initiation of an equity retirement programme. This was partially offset by an improvement in cash from operating activities.
During the year, we have taken steps to increase the funds available to the Group and sought to do this in a way which extends and balances the maturity profile of our borrowings. In March 2011, we completed a new revolving credit facility at competitive margins with our banks, providing £1,200m of committed facilities for five years. At the balance sheet date, £725m of those facilities remained undrawn.
Financial review – continued
11Annual report and financial statements 2011/12
Returns to shareholdersDividendsAt our preliminary results announcement in March 2011, we set out a policy of maintaining a progressive dividend, whereby dividend growth would be in line with underlying EPS growth. Additionally, we confirmed that, in each of the three years to 2013/14, the year-on-year increase would be at least 10%. We also announced that we would rebalance the split between the interim and final dividend payments on 30:70.
In line with this policy, the Board has recommended a final dividend of 7.53p per share, making the total dividend for the year 10.7p per share, an increase of 11%. As a result of increasing the interim percentage of the full year dividend, which was applied for the first time at our interim results in September, the recommended final dividend is 10% lower than last year. Dividend cover was 2.4 times (2010/11: 2.4 times).
Payment of the final dividend will be made on 20 June 2012 for shareholders registered on 18 May 2012.
2011/12 2010/11 Change
Interim dividend paid 3.17p 1.23p +158%Final dividend proposed 7.53p 8.37p -10%Total dividend for the year 10.70p 9.60p 11%
In the five year period to 2011/12, the Group has increased its dividend by 168%. This compares with increases of 54% for the food and drug retail sector and 16% for the FTSE over the same period.
Equity retirementIn March 2011, we announced an equity retirement plan to purchase £1bn of ordinary shares in the market over the coming two years, for subsequent cancellation. During the year, £368m was invested in this ongoing programme and 125.7m shares were repurchased and cancelled.
Basic underlying EPS for the year was 25.6p, an increase of 11% over the prior year. On a pro-forma basis, and applying the actual average purchase price of the shares acquired in the year and the average interest rate on that investment, had the full £1bn equity retirement programme been in place from the beginning of this financial year, underlying EPS would have been 27.4p, an increase of 19% over the prior year and 7% over the actual 2011/12 position.
Shareholder investment and returnsOn 29 January 2012, the Company’s share price had risen to 293p, an increase of 27p (10%) from the start of the year. This compares to falls of 4% and 16% in the FSTE 100 and sector indices, respectively, over the same period.
Total shareholder return measures the value of £100 invested over time. In the five years from January 2007, Morrisons shareholders have seen a return of 15%, compared to a rise in the same period of 10% for the FTSE 100 and a fall of 4% for the FTSE food and drugs sector.
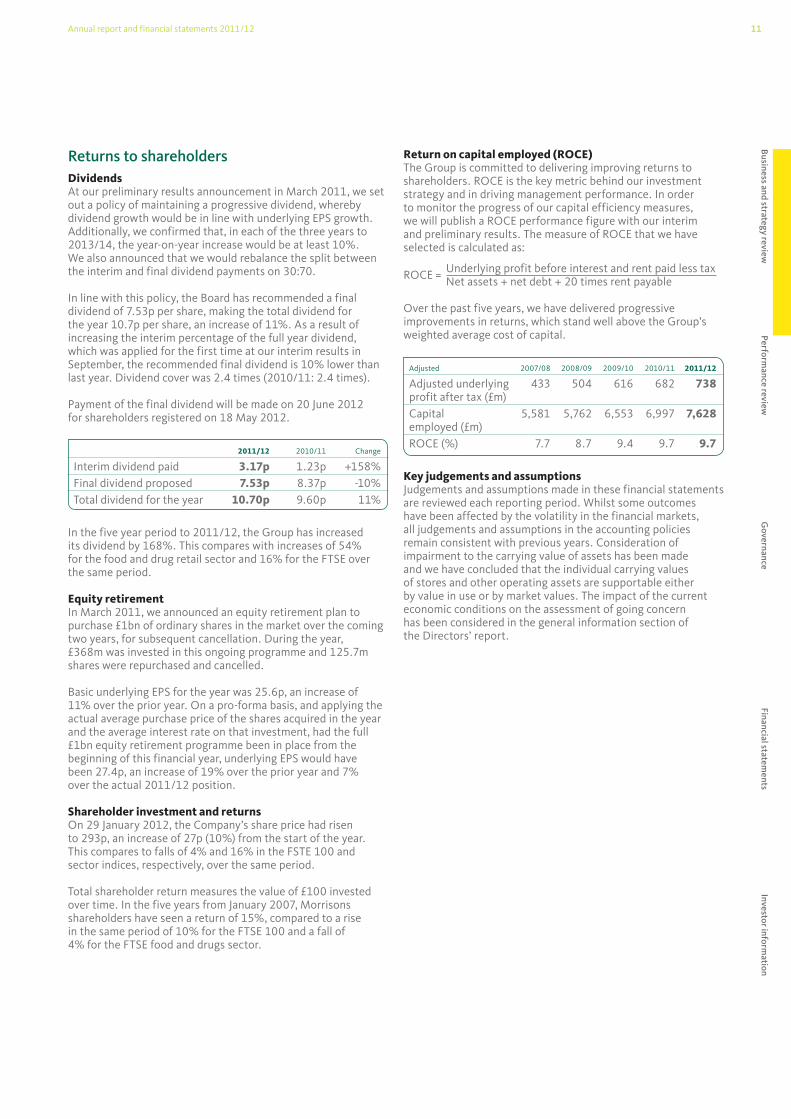
Return on capital employed (ROCE)The Group is committed to delivering improving returns to shareholders. ROCE is the key metric behind our investment strategy and in driving management performance. In order to monitor the progress of our capital efficiency measures, we will publish a ROCE performance figure with our interim and preliminary results. The measure of ROCE that we have selected is calculated as:
ROCE = Underlying profit before interest and rent paid less tax Net assets + net debt + 20 times rent payable
Over the past five years, we have delivered progressive improvements in returns, which stand well above the Group’s weighted average cost of capital.
Adjusted 2007/08 2008/09 2009/10 2010/11 2011/12
Adjusted underlying profit after tax (£m)
433 504 616 682 738
Capital employed (£m)
5,581 5,762 6,553 6,997 7,628
ROCE (%) 7.7 8.7 9.4 9.7 9.7
Key judgements and assumptionsJudgements and assumptions made in these financial statements are reviewed each reporting period. Whilst some outcomes have been affected by the volatility in the financial markets, all judgements and assumptions in the accounting policies remain consistent with previous years. Consideration of impairment to the carrying value of assets has been made and we have concluded that the individual carrying values of stores and other operating assets are supportable either by value in use or by market values. The impact of the current economic conditions on the assessment of going concern has been considered in the general information section of the Directors’ report.
Business and strategy review
Perform
ance review
Governance
Financial statements
Investor information

12 Wm Morrison Supermarkets PLCBusiness and strategy review
The convictions which underpin our objectives are set out on page 7.
Our strategy is in place
Increasing our efficiency
– Revamping our systems– Tackling indirect procurement– Increasing network efficiency– Driving in-store productivity
See pages 18 to 21 for further information
2
Capturing growth
– Exploring convenience – Vertical integration– Moving online
See pages 22 to 25 for further information
3
Our strategic objectives
Our vision for the business, to be ‘Different and Better then Ever’, is anchored by our convictions, and we have a clearly defined set of strategic initiatives that will deliver it. We have grouped these initiatives under the three strategic objectives of ‘driving the topline’, ‘increasing our efficiency’ and ‘capturing growth’.
Driving the topline
– Strengthening our brand– Moving further ahead on fresh– Optimising space– Enhancing our service culture– Completing National to Nationwide
See pages 14 to 17 for further information
1

13Annual report and financial statements 2011/12
Tackling indirect procurementIndirect procurement is an area where we have been working hard to strip out unnecessary cost.
Increasing network efficiencyThe opening of our new regional distribution centre at Willow Green, Bridgwater, completes our network efficiency initiative.Driving in-store productivityWe are continually working to improve our in-store processes to drive productivity whilst improving customer service.
We are upgrading our core IT systems through our Evolve initiative, a major six year programme of work. This will unlock efficiency savings and give us the solid platform we need to grow our existing business and seize new opportunities.
Revamping our systems Page 18
Vertical integrationFood production is a key differentiator and central to our ability to provide fresh food at affordable prices. We have increased our capabilities further in the year.
Moving onlineThe way customers shop is changing – they are becoming more and more accustomed to buying online. We have an exciting online agenda, building on the acquisition of Kiddicare and our stake in Fresh Direct.
The convenience sector is a significant opportunity for Morrisons, accounting for over £30bn sales and growing at twice the rate of the rest of the UK retail market. We entered this market in 2011/12 with our first M local stores.
Exploring convenience Page 22
Moving further ahead on freshWe aim to be the number one destination for fresh food in the UK at outstanding value for money.
Optimising spaceWe aim to get the best use out of every square foot in our store. We have been testing how we free up ambient space to give more space to fresh food and allow us to introduce new categories such as children’s clothing.
Enhancing our service cultureWe are enhancing our service culture and ensuring that our customers always get a warm and friendly experience in our stores.Completing National to NationwideWe aim to enable more customers across the country to be able to shop at Morrisons and have set out ambitious plans to increase our space.
Having a strong brand can be a real point of difference; we have set out to give customers an own brand range worth switching supermarkets for. We have made great progress in 2011/12, including the launch of our acclaimed M Kitchen range.
Strengthening our brand Page 14
Business and strategy review
Perform
ance review
Governance
Financial statements
Investor information

14 Wm Morrison Supermarkets PLCBusiness and strategy review
Traditional beefWe also launched our traditional beef breeds programme. This is a longer term programme, working in partnership with over 100 farmers to bring an exclusive range to our customers. The range will be available all year round at guaranteed quality and at an affordable price.
M saversIn January 2012, we launched M savers, our new entry price-point range, which is designed to be a clear proposition of good quality at the best price, in strong support of our conviction that value is forever.
We have increased our range to over 500 lines, competing with the broadest offer in the market and enabling customers to do a full value-led shop, should they choose to do so.
Coming upIn 2012/13, we will begin to deliver solutions across home and leisure, and other general merchandise categories. We will continue to leverage the expertise of our team of chefs to ensure our products and brands are consistently delivering quality, value and relevant innovation. In 2012/13, we aim to further increase own brand participation.
By the end of the journey, we will have a market-leading own brand, which customers trust to bring them everything from the best value, to unrivalled produce, to fabulous restaurant-quality meals at Morrisons prices. Customers will also be much more aware of the products we make and prepare in-store as well as those we manufacture ourselves in our own factories. Our new proposition will give us the relevant points of difference in every part of our store to support our positioning as a great food retailer, reaffirm our fresh credentials and offer unbeatable value to our customers.
Evolving the Morrisons experience
We are building on what we do best to be the number one destination for fresh food.
Strengthening our brand
We believe that having great own brand products can give consumers a reason to switch supermarkets, and we are ambitious to create an industry leading range.
Much work was done during the year, starting with a detailed benchmarking of existing Morrisons products against competitors. In blind taste testing, we found that our quality was already high, and overall was better than the average of our direct competitors. As always, there was room for improvement, particularly in going beyond just having a set of good own label products, to having a family of great relevant brands that influence consumer behaviour.
2011/12 saw the start of a three year programme of new product development, and we made good progress. Informed by research and customer insight, we built a plan, created a talented team and began the execution that will see 5,000 new products introduced this year and more than 10,000 products relaunched by Christmas 2013.
Our own brand is a major pillar in delivering our brand promise of ‘Friendly People Making Great Food Affordable for Everyone’.
M Kitchen launchWe commenced the rollout with our M Kitchen range in October 2011, launching over 600 products in a category where we knew that we were performing below the market.
Product quality is exceptional. Through close co-operation with suppliers and inspiration from great chefs including Pierre Koffman and Aldo Zilli, we have developed an innovative and exciting range with exceptional product quality.
The response from customers has been extremely positive and M Kitchen sales have increased 40% over the same categories last year.
In addition to the M Kitchen launch, we also relaunched our bread range, introducing new products, improving quality and finding ways to show our customers that we make our own bread. This has been really successful and we have seen own brand participation increase by 10%.
1 — Driving the topline

15Annual report and financial statements 2011/12
BelowHeadchef, Neil Nugent (right) and
in-house chef, Robert Craggs (left) creating new recipes.
An own brand range worth switching supermarkets for
“The new M Kitchen range means I have a fantastic home cooked style meal with minimal effort, in no time at all. Perfect!”Lindsey ScahillMorrisons customer, Leeds
Own brand facts
Sales increase in categories where M Kitchen was launched
40%
Number of M savers lines launched
500M Kitchen partners
Nigel Haworth, Atul Kochhar, Pierre Koffmann, Bryn Williams and Aldo Zilli
Business and strategy review
Perform
ance review
Governance
Financial statements
Investor information

16 Wm Morrison Supermarkets PLCBusiness and strategy review
Driving the topline – continued
Moving further ahead on fresh, optimising space and enhancing our service culture
These initiatives combine in our ‘Fresh Formats’, focused on offering customers the best fresh food in the UK, unrivalled value for money and fantastic service from an environment that really feels different. This initiative is a key part of our strategy and is underpinned by our core convictions that customers want fresh food, great value and a more experiential and engaging shopping environment.
We have brought together a number of separate strands of work to create a new shopping experience for our customers.
HOT service is an initiative to enhance our service culture and ensure that our customers always get a warm and friendly experience in our stores. Over 110,000 store colleagues have received service skills coaching – the largest training programme of its kind in the UK (read more in Our people, page 33).
During the year, we transformed 12 of our stores using this new thinking. We knocked down walls so that customers could see our craft skills in practice, introduced 350 more fruit and vegetable products, moved complementary products next to each other and rationalised the space given over to ambient grocery items. The results to date have been strong, with produce sales up 14% and sales in the delicatessen up over 40%. Where we rationalised ambient space, we successfully maintained sales and margin.
The work done in the Lab stores has enabled us to create a series of modules capable of being applied to our existing estate and to our new stores. In 2012/13, we will tailor the core concept to different locations and store sizes, ensuring that we provide customers with the elements they really want while maximising the benefits from our investment. This continuing evaluation will see around 15% of our space operating all or most of the new concept by the end of the first half of the year, with total capital expenditure per store of c.£1.7m. This is contained within our 2012/13 capital expenditure targets.
Our Space Lab, where we have found ways to work our space harder and eliminate duplicated items. The Lab has shown that we can ‘liberate’ up to 750,000 square feet of our existing store space, which will be available for an expanded fresh food offer and new ranges such as restaurant quality ready meals and children’s clothing.
Our Fresh Lab, where we have created a fantastic fresh food environment, transforming our produce and flowers sections, introducing new ranges and revitalising our counters.

17Annual report and financial statements 2011/12
Market overview
Own label growth
Retailer own brand sales have been performing more strongly than branded products as consumers look for ways to manage their budget. This is a positive trend for our business as we continue with the relaunch of our own brand range over the next two years.
Throughout 2011, retailer own brand value ranges have seen an increase in growth levels, outperforming other tiers. Coming into 2012, premium ranges have seen resurgence in growth.
8
10
6
4
2
0
-2
-4
-6
12 w
eeks
’ sal
es g
row
th v
s la
st y
ear %
23 Jan2011
20 Mar2011
Value
Source: Kantar Worldpanel
15 May2011
10 Jul2011
27 Nov2011
4 Sep2011
22 Jan2012
Premium
Consumer confidenceConsumer confidence remained fragile in 2011.The end of the year saw confidence close to an all-time low. 2012 is expected to continue to be challenging.
-20
-15
-25
-30
-35
-40
GFK
Con
sum
er C
onfid
ence
Jan2011
Mar2011
Source: GFK NOP Consumer Confidence
May2011
Jul2011
Nov2011
Sep2011
Jan2012
Completing National to Nationwide
We aim to offer customers throughout Great Britain easy access to a Morrisons store.
Currently, there are still approximately 6.6m households which do not have a Morrisons store in close proximity. This gives us significant headroom for growth, particularly in the South, where we are less well represented.
During the year, we opened a total of 37 new stores, including one replacement and three in our new convenience format. 19 of the new stores were previously operated by Netto. They have an average size of 8,000 square feet and are therefore much smaller than the majority of the Morrisons estate, which averages 27,100 square feet. Their success under the Morrisons brand, and the performance of our new convenience format, reinforce our confidence that we can operate effectively in smaller store sizes, where previously we had very few stores below 10,000 square feet.
Our net selling space increased by 643,000 square feet (5.2%) during the year, slightly ahead of our previously announced target of 600,000 square feet, through a combination of new stores, acquisitions and extensions. Of this, 107,000 square feet came from extending 15 stores in our existing estate. We ended the year with 12.9m square feet of net retail space and an estate of 475 stores.
In March 2011, we announced an accelerated space opening programme of 2.5m square feet of new space over the next three years to 2013/14. This year, we exceeded our first year target. In 2012/13, we expect to add a further 700,000 square feet and we are on track to meet our three year expansion objective.
BelowOpening our Wrexham store in November 2011.
Business and strategy review
Perform
ance review
Governance
Financial statements
Investor information

18 Wm Morrison Supermarkets PLCBusiness and strategy review
With two years in planning and 16 months in rollout, all the produce sites have invested in a huge collaborative process. The three month readiness programme before each go-live covered everything from leadership through to infrastructure. This, along with the commitment shown by colleagues, was the key success factor.
The new produce solution: provides advanced, centralised planning and scheduling; orders from the sales management system; checks raw material inventory and creates a demand for manufacturing and replenishment stocks from suppliers; and sets hourly schedules for production lines. We have automated the processes for bringing raw materials to site, receipt of orders and marrying up our resources. We now have consistent methods for planning and scheduling, and standard reporting.
The dispatch process is also more efficient, with produce allocation and picking lists generated automatically, meaning stock visibility has improved across the business. We can produce a report at any time to show exactly what is in every area of the business, and in what state, replacing the need for continual counts.
The new solution supports our drive for quality in fresh produce. It allows us to monitor the ongoing quality of all products, enabling better supplier management. Better visibility of stock also increases the focus on reducing inventory in the supply chain, which helps to ensure freshness.
In 2012/13, we aim to deliver benefits of £1.3m through improved labour efficiency and yield. The major benefit, however, is derived from improving sales order fulfilment against quantity and time. This will lead to improved availability in our stores for customers. The overall benefit is estimated at £2.7m a year.
Next up – meatOur meat manufacturing solution is going live to our first abattoir in the second half of 2012/13, with rollout to the other two sites by early 2013/14. The meat solution is necessarily more complex than produce, yet builds on the same model. Productivity and efficiency savings are expected, with an overall benefit of £2.2m year-on-year once the system is complete.
Innovative systems to realise efficiencies
We have been looking at every aspect of our business, from field to fork, to see where we can increase efficiency.
Revamping our systems
Our Evolve programme started in 2008 and is now approximately halfway to completion. Evolve is all about making sure we have the right systems in place to support our business processes, increase sales and efficiency, and compete strongly in today’s retail market as well as creating flexibility for the future. In short, making a well run business run better.
With a team of over 700 people, the programme has already delivered:
a new central accounting system and a single payroll system for colleagues;
12,500 new touchscreens on tills; a solution for simplifying cash reconciliations in-store; and voice picking in our distribution centres to increase the accuracy of deliveries.
A key focus in 2011/12 has been the introduction of a new produce manufacturing solution to our five manufacturing produce sites to improve efficiency.
Produce manufacturing solutionProduce manufacturing is central to the Morrisons commitment to quality from field to fork. Employing 2,700 people, our produce sites produce 29m packs of fresh fruit and vegetables every week for sale in our stores. Until 2010/11, each site was planning independently against daily orders and managing stock levels accordingly using manual systems. Visibility of inventory levels and yields was limited.
The Evolve programme means more than just new systems. With over 75% of the workforce set to use the new solution, skill levels across the entire division were raised. “We had to change the way people operate – and their mindset”, says Andy Joynson, Manufacturing Director for Produce, “we introduced more robust processes, structure and organisation – driven by better solutions.”
2 — Increasing our efficiency

19Annual report and financial statements 2011/12
Innovating our systems to make a well run business run better
“Improving availability in-store through better service means £2.7m each year to the business.”Andy JoynsonManufacturing Director for Produce
Produce Evolve facts
Locations in the UK
Cutler, Flaxby, Gadbrook, Rushden and Thrapston
Order fulfilment improved by
2%
BelowColleagues using the new
technology at Cutler Heights.
Business and strategy review
Perform
ance review
Governance
Financial statements
Investor information

20 Wm Morrison Supermarkets PLCBusiness and strategy review
Tackling indirect procurement
Our indirect procurement programme has a target of saving £100m by 2013/14 and we made good progress during the year, delivering £40m of benefit.
We reviewed every area of spend – both revenue and capital expenditure, and looked at a variety of ways to reduce cost, including the use of e-auctions, rate negotiations, consolidating spend and reducing consumption.
Examples of savings achieved include: renegotiation and re-specification of packaging across stores and manufacturing;
the consolidation of waste contracts across stores and packhouses; and
a significant reduction in marketing print costs.
We also undertook an exercise to reduce the build and fit out costs of new stores opening our first ‘Lean Store’ at Newport in November and achieved a saving of £2m against our original estimates, the equivalent of c.30% of the total store build and fit out cost. Around half of the savings are already being applied to all new build stores. The remaining 50% will be trialled further and implemented when we are confident that we can take the cost out without compromising our high standards.
Increasing network efficiency
Our network optimisation initiative, which was launched in 2007, has focused on building capacity, reducing costs and increasing efficiency throughout our supply chain.
In the final quarter of the year, we completed the original programme with the opening of a new, state-of-the-art RDC for the South West at Willow Green, Bridgwater. This 800,000 square foot site, which replaces a number of smaller centres, was opened ahead of schedule to enable us to manage the busy Christmas period and will become fully operational in the first quarter of 2012/13. The new RDC, a capital investment of £105m, enables us to consolidate service into one efficient centre and will deliver savings of £20m annually from 2014/15.
AboveBuilding our new Lean Store at Newport.
AboveOur new Willow Green RDC, completed ahead of schedule.
Increasing our efficiency – continued
Key Willow Green statistics
Site size
800,000 square feet
Volume throughput expected at
110m cases per year
Colleagues to be employed (on an FTE basis)
1,000Stores serviced through Willow Green at full maturity
63

21Annual report and financial statements 2011/12
AboveOpening our counters later means customers can see our craftspeople at work.
Driving in-store productivity
Great companies continually strive to be more efficient. Morrisons has a number of initiatives underway which will drive efficiency and cut unnecessary cost out of our business.
Every hour per day we save in all of our stores equates to approximately £1.4m of annual cost saving – so even small changes can deliver big benefits. In March 2011, we launched an initiative to focus on store productivity and have delivered savings of £25m in the year. Good progress was made on a number of initiatives, including opening our specialist counters later in the morning, which reduced labour cost but also allows our customers to see our craftspeople setting up for the day; automating the receipt of news and magazines, which avoids manual checking and administration; and changing the way bananas are displayed to reduce the labour cost whilst also reducing the wastage that arises from handling the fruit too much. During the coming year, we will continue to trial and roll out new ideas and we are on track to deliver our target of £100m by 2013/14.
Market overview
Value at the forefront of shoppers’ minds
Household incomes have come under pressure throughout 2011 as rising commodity and energy prices have resulted in CPI inflation rising above 5%.
As as result, pricing and overall value have become increasingly important factors in purchasing decisions.
Shoppers are becoming increasingly price conscious, with almost seven out of ten now saying they make the majority of their grocery shopping decisions before they get to store, an increase of 40% since 2008.
ABC1 55%
77%C2DE
Source: GFK NOP Consumer Confidence
Percentage who state how much they spend is the most important thing in their grocery shopping(Customer demographic ABC1 and C2DE)
The groups that are most conscious about how much they spend are families facing the pressure of lower incomes.
Extent to which shoppers plan their grocery shop
2011 67%
47%2008
Source: IGD ShopperVista
Business and strategy review
Perform
ance review
Governance
Financial statements
Investor information

22 Wm Morrison Supermarkets PLCBusiness and strategy review
Not only do we offer a truly market leading fresh proposition, but by staying true to our commitment to great value, we guarantee our customers will not pay more for their fresh produce, meat, fish and key ambient essentials than they do in our larger stores.
We are delighted with the results and customer feedback has been very positive. Sales and margins are both ahead of our business case, own label participation is 7% higher than in our core estate and fresh participation is 12% higher.
After only eight weeks of opening, we were highly commended in the prestigious NACS International Convenience Awards for innovation with fresh food in a small footprint, an accolade that no other top four multiple grocery retailer has achieved.
The key to success in the convenience sector is being flexible and ensuring that we adapt and are able to meet the differing needs of each local area.
A flexible conceptIn January 2012, we opened our third M local store at Grafton Street, close to The University of Manchester. This is our first suburban convenience format with high transient footfall, operating from 4,250 square feet, which is larger than our neighbourhood convenience formats. All the usual elements of M local are included, but we have specifically tailored our offer to the student population – extending our ‘hot food to go’ and fresh food and meal solution ranges, whilst flexing the grocery offer to include student essentials from a wide range of stationery, to home essentials.
There is also a prominent service counter, additional self scan customer checkouts and an external seating area enabled with free Wi-Fi where customers can sit and enjoy food and drinks they have purchased in our store.
Although we are still trialling these formats, the results to date have been ahead of our expectations, with very positive customer feedback.
We will continue to open more M locals during the course of 2012/13 and adapt our formats to cater for market opportunities and local customer needs, such as city centre formats and petrol station solutions. As our convenience estate grows, we will be investing in the infrastructure required to support a larger network of convenience stores.
Capturing growth throughfresh opportunities
We are expanding into new channels and formatsto serve the evolving needs of our customers.
Exploring convenience
The UK convenience market presents an opportunity for Morrisons to expand its business. It accounts for over £30bn of sales, represents £1 in every £5 spent on grocery and is growing at twice the rate of the rest of the UK retail market.♥
Customers are seeking easier ways to shop and want to be able to top up on items they need without having to travel to their nearest large supermarket. This is particularly true at a time when budgets are tight and customers are looking to spend less per shopping trip and save on fuel costs.
We believe that no one else is currently offering a truly great convenience shopping experience; too often convenience is about compromise – poor quality, bad value and limited choice.
Morrisons therefore has the opportunity to create something different by leveraging its vertical integration and great fresh and value credentials to develop a really distinctive and compelling fresh food experience, offering customers great food at affordable prices at a location which is convenient for them.
As planned, we opened three trial stores. They offer a very different convenience experience and are fresh led, with fresh prices in line with prices available across all our stores.
The M local propositionOver 50% of space is dedicated to fresh food and scratch cooking; significantly more than the industry average of 36%. We offer customers c.2,500 lines, including over 100 fruit and vegetable products, a broad range of meat, fish, bakery and deli, as well as freshly prepared sandwiches.
We also offer a salad bar, freshly baked bread delivered daily, freshly squeezed orange juice, a good range of locally sourced products and the option for customers to grind their own coffee in-store. We even offer an order and collect service, enabling customers to order products by 11.00 a.m. to be collected the same day. This is unique in the market and gives us great availability of fresh produce.
3 — Capturing growth
♥Source: BRC

23Annual report and financial statements 2011/12
Fresh food and convenience, it’s why our customers keep coming back...
“I’ve been really impressed with our new M local store – fresh food, convenient opening times, friendly staff and much better value than the alternative nearby shops.” Rachel GriffenM local customer, Ilkley
M local facts
Space dedicated to fresh food
over 50%
Number of fresh products delivered from a hub store each day
125Number of new M local stores to open in 2012/13
20
BelowOur M local store at Ilkley.
Business and strategy review
Perform
ance review
Governance
Financial statements
Investor information

24 Wm Morrison Supermarkets PLCBusiness and strategy review
Vertical integration
Vertical integration gives us a true source of competitive advantage and is crucial to our ambition of leading in fresh food – reinforcing our credentials around provenance and sourcing, giving us flexibility to run industry leading promotions and supporting Group profitability.
In 2010, we set out our strategic objective to increase the scope of our vertical integration and to invest £200m in additional capacity for relevant fresh categories over three years. Over the last two years, we have expanded into several new categories.
In June 2011, we acquired Flower World, adding fresh flowers to our range of fresh competencies and, in January 2012, we agreed to acquire a pork and lamb retail meat packing facility from Vion Group in Winsford. This 105,000 square foot site will enable us to gain greater control over the quality and provenance of our packed meat products by bringing more production in-house. In March 2012, we announced our intention to establish a seafood processing capability by the end of the year in order to further expand our authority in fish. We remain well on track to achieve our goal of extending our vertical integration further into new categories.
Capturing growth – continued
Our business model Where possible, we source locally and manufacture in our own sites. We distribute to our stores through our own network. The benefits are consistent freshness at a reduced cost whilst being in control of the supply chain.
AboveAll in-store flowers are now supplied by our Flower World subsidiary.
AboveHaving our own abattoirs increases the freshness of our food in-store.
1 From selection...
Being close to source means we can control the provenance and quality of our food, ensuring it has been sourced ethically and in a sustainable way.
2 To packhouse...
Our manufacturing facilities reduce our supply chain lead times, allowing us to maximise the freshness of food in-store and reduce waste.
3 Distributed and delivered to...
Operating our own transport fleet provides flexibility in moving products from suppliers to RDCs and from our food manufacturing sites to our stores. This ensures freshness and cost control.
4 All our stores
As we prepare food in-store, we can react to customer trends throughout the day. This allows us to reduce our waste and costs, and keep our prices low.

25Annual report and financial statements 2011/12
Moving online
The way customers shop is changing – they are becoming more and more accustomed to buying online.
The total online market in the UK is almost £70bn and growing at 16%, and the online grocery market is worth £6bn and growing at 19%.�
There is a clear opportunity for Morrisons and we have taken the first steps in our journey to developing both an online food and general merchandise offer.
Online general merchandiseGeneral merchandise is migrating online, away from the high street and from ‘big box’ supermarkets. We intend to complement our core supermarket offer with an online general merchandise offer in categories which have appeal and relevance to our customers. We have started this year with the acquisition of Kiddicare – the most successful online baby retail business in the UK. We are expanding Kiddicare as a genuine ‘multi-channel’ business and, during the year, announced plans for ten flagship stores throughout the UK. We are also leveraging our 11.4m weekly customers in Morrisons by increasing their awareness of the Kiddicare business, leading to strong growth. Additionally, using the industry leading operating platform acquired with Kiddicare, Morrisons.com will launch its first categories in the final quarter of 2012.
Online foodThe online food market is growing fast and is expected to reach £11.2bn by 2016, some 6% of the total grocery market.♠ Morrisons does not yet offer an online service, as we do not believe any retailer in the UK has achieved the right balance of service to customers and profitable returns for shareholders. In 2011, we took an initial step in online grocery through acquiring a minority stake in Fresh Direct, a leading fresh food, online retailer in New York. We have established a very positive relationship with them, including the embedding of a team into the business in order to understand it in great detail before bringing it back to the UK. We will outline our plans for online food towards the end of 2012/13.
AboveOur Kiddicare showroom gives customers the option of shopping in-store as well as online.
Actual Forecast
Key facts
Customers who have used the Morrisons app
900,000Visits to the Morrisons mobile website in Q4 2011/12
481,000
�Source: IMRG E-Business Information and IGD♠Source: IGD
Market overview
New channels to market
The market place is continually evolving, and a key trend has been the growth of different retailing channels and the rise of the multi-channel retailer.
Between 2011 and 2016, market sales through local convenience stores are anticipated to grow by 26% and online sales are estimated to grow by 90%. As we develop these areas, they provide further opportunity for us to grow and meet the needs of our customers.
Convenience sales £bn
2011 33.6
42.22016
Online sales £bn
2011 5.9
11.22016
Source: IGD
Business and strategy review
Perform
ance review
Governance
Financial statements
Investor information

26 Wm Morrison Supermarkets PLCPerformance review
How do we identify our KPIs?There are many internal and external factors affecting the performance of our business. We have focused on a few key indicators that are measurable, comparable, and can be acted on to reflect the performance and progress of our business.
Read more about business performance — page 4
Strategic objectives
1 Driving the toplinea Strengthening our brandb Moving further ahead on freshc Optimising spaced Enhancing our service culturee Completing National to
Nationwide
2 Increasing our efficiencyf Revamping our systemsg Tackling indirect procurementh Increasing network efficiencyi Driving in-store productivity
3 Capturing growthj Moving onlinek Exploring conveniencel Vertical integration
What is important to our colleagues?Over 105,000 colleagues participated in our opinion survey to give their thoughts on life at Morrisons.
See page 33
We have identified a number of measures that are important to the success of the Group’s financial performance and operational excellence, and to our stakeholders, customers, suppliers and colleagues. Below are the measures the Board consider to be key to the achievement of the Group’s strategy.
Financial KPIs Key Definition
Like-for-like sales a b c d Measures store-based sales on the same basis as the previous year, excluding the impact of new store openings, store disposals and the impact of major refurbishments and extensions. The measure excludes fuel sales and VAT.
UK grocery market share
e j k l The Group’s percentage of retail sales in the UK grocery sector, as measured by Kantar Worldpanel at the end of January.
Underlying profit e f g h i
Measures the normal underlying business performance. Profits are adjusted to remove volatile or one-off costs and credits.A reconciliation of underlying profit is provided in note 1 of the Group financial statements.
Underlying basic earnings per share (EPS)
a b c d e f g h
i
The EPS measure uses underlying profits, as defined above, divided by the weighted average number of shares in issue at the year end date. A calculation is provided in note 9 of the Group financial statements.
Dividend cover a b c d e f g h
i
Calculated as underlying basic earnings per share,as defined above, divided by total dividend per share for the year.
Net debt g h The Group’s overall debt position at the year end. A summary of net debt is provided in note 25 of the Group financial statements.
Capital investment
g e j k Measured as additions to property, plant and equipment, investment properties, intangible assets and investments.
Return on capital employed (ROCE)
g h i The Group measures ROCE as underlying profit before interest and rent paid less tax divided by the sum of net assets, net debt and 20 times rent.
Non-financial KPIs Key Definition
Carbon footprint reduction
h Our carbon footprint includes energy, waste, refrigeration and transport for our stores, offices, manufacturing and packing facilities.
Waste to landfill reduction
i Any remaining waste from our stores that we are unable to recycle or have processed, expressed as a percentage of total waste compared to the prior year.
Measuring performance against our strategy

27Annual report and financial statements 2011/12
A strategy linked to sustainabilityWhen we consider our future outlook and the goals we wish to achieve, we focus our attention on those areas of greatest significance to our business. We assess whether there are any potential sustainability issues relating to these areas and make a direct link between the sustainability challenges we face and our business strategy. We recognise the importance of developing the right sustainability KPIs, so that we can evaluate our performance against our strategy.
Read more about our commitment to sustainability — page 30
Performance Data
Sales growth, particularly organic growth, is essential to retail success and long term expansion. Our like-for-like sales were, once again, ahead of the market and we saw particularly strong growth in the South of England. Looking forward, we aim to maintain momentum by strengthening our own brand and moving ahead in our fresh food offering, while enhancing the service we provide to our customers.
2011/12 1.8%
2010/11 0.9%
2009/10 6.0%
Independent data shows that we held our market share during the period. We aim to grow our share in the market by investing in our store opening programme and our multi-channel offering, as we look to move online and explore the convenience store market.
2011/12 12.8%
2010/11 12.8%
2009/10 12.6%
Underlying profit before tax increased by £66m, driven by strong like-for-like sales performance as well as store openings during the year. We aim to increase underlying profit by realising further efficiencies in our network, driving our productivity in stores and integrating our new businesses.
2011/12 £935m
2010/11 £869m
2009/10 £767m
Underlying basic EPS has increased 11% to 25.6p. Our earnings should meet the expectations of our shareholders and we aim to grow our underlying EPS in line with underlying profit.
2011/12 25.6p
2010/11 23.0p
2009/10 20.5p
Dividend growth has increased by 11%, compared to last year, with dividend cover of 2.4 times. Our aim is to maintain a prudent level of dividend by achieving growth in line with our underlying EPS, or as a minimum, a 10% growth.
2011/12 2.4 times
2010/11 2.4 times
2009/10 2.5 times
Net debt has increased by £654m, reflecting our planned acceleration in capital expenditure, investment in a multi-channel capability and our equity retirement programme. Our credit rating remains one of the strongest retail ratings in the world, at A3 for the third year running, and we will look to maintain our strong investment grade balance sheet going forward.
2011/12 £1,471m
2010/11 £817m
2009/10 £924m
Capital investment was higher than the prior year as a result of a planned acceleration in our new store programme, the addition of our new RDC at Willow Green, Bridgwater, and investment to support our expansion into online and vertical integration. We expect our investment to increase in 2012/13 as we continue to invest for our future growth.
2011/12 £901m
2010/11 £592m
2009/10 £906m
Whilst underlying earnings have increased year-on-year, there has also been an increase in capital expenditure in the year; the return on these investments is expected to show through improvements in ROCE as these investments mature.
2011/12 9.7%
2010/11 9.7%
2009/10 9.4%
Performance Data
We have set a long term commitment to reduce emissions in absolute terms by 30% by 2020 (2005 baseline). Progress slowed against continued business expansion but remains on a downward trend. We started measuring absolute reduction in 2010/11.
2011/12 14.6%
2010/11 12.0%
Our new commitment is to reduce direct waste to landfill to zero by 2013. Previously we reported on volume of waste to landfill as a percentage of total waste.
2011/12 5.6%
Why link our KPIs with our strategic objectives?By linking our KPIs with our strategic objectives we are able to monitor and focus on areas that can be improved to increase sales, efficiency and growth in the future and help us achieve our vision of being ‘Different and Better than Ever’.
Read more about our strategy — page 12
Business and strategy review
Perform
ance review
Governance
Financial statements
Investor information

28 Wm Morrison Supermarkets PLCPerformance review
Our approach to risk management
As with all businesses, we face risk and uncertainty, which could impact the delivery of our strategy. The Board has overall accountability for ensuring that risks are effectively managed across the Group, and that there is a system for internal control. The Management Board is responsible for implementing and maintaining the system of controls.
Managing the risk management processThe Board believes a successful risk management framework balances risk and reward, and applies reasoned judgement and consideration of likelihood and impact in determining the Group’s principal risks.
Risks and uncertainties
Risk
Business interruption Our distribution and systems infrastructures are fundamental to ensuring the normal continuity of trading in our stores. If a major incident occurred to this infrastructure or another key facility, this could have a detrimental impact on the business’s ability to operate effectively.
Business strategy In the long term, effectively managing the strategic risks that the Group faces will deliver benefits to all our stakeholders. The Board understands that, if the strategy and vision are not properly formulated or communicated, then the long term aims of the Group will not be met and the business may suffer.
Colleague engagement and retention The continued success of the Group relies heavily on the investment in the training and development of our 131,000 colleagues. This is a critical element of the quality of service we offer to our customers.
Corporate citizenship Morrisons is committed to taking good care and, if we fail to act as a responsible corporate citizen or misjudge the ‘mood of the nation’, this could damage our reputation and, therefore, potentially lose the trust of our stakeholders and increase costs.
Customer proposition We operate in a very competitive industry. Also, our customers’ shopping habits are influenced by broader economic factors that our business does not control. If we fail to keep our proposition aligned with customers’ expectations, then they may choose not to shop with us and sales will suffer.
Financial and treasury The main financial risks that the Group is exposed to relate to the availability of funding, the loss of a financial counter party and the uncertainty produced by fluctuations in interest and foreign exchange rates. All of these things have the potential to undermine the Group’s ability to finance its trading activities and its financial results.
Food and product safety We are aware that, if we fail to deliver excellent standards of hygiene and safety in our products, there is a potential to harm our customers and damage our business reputation. Our business focuses on fresh food and we have a vertically integrated business model; therefore, food safety is of paramount importance.
Property The business is growing the size of its retail space through acquisition and by modernising and extending existing stores and facilities. If we fail to adequately grow our space in an earnings enhancing way, we will lose market share and our profits will suffer.
Regulation The Group operates in an environment governed by strict regulations to ensure the safety and protection of customers, shareholders, colleagues and other stakeholders, and the operation of an open and competitive market. These regulations include alcohol licensing, health and safety, the handling of hazardous materials, data protection, the rules of the stock exchange and competition law. In all cases, the Board takes its responsibilities very seriously, and recognises that breach of regulation can lead to reputational and financial damage to the Group.
Systems and change The Board identified that many of the existing systems were approaching the end of their useful lives and that a comprehensive programme of replacement was required. This programme of work is expected to take a number of years to complete. The Board is aware of the risks faced by any organisation seeking to successfully implement new systems.
1 Develop and communicate strategy and objectives
Our strategy informs the setting of objectives across the business and is widely communicated through the use of our scorecard.
2 Identify and evaluate risks
Risks are identified by colleagues from all business areas through a variety of mechanisms, including facilitated workshops. The likelihood and impact of identified risks is considered and captured.
3 Mitigation of risks
Responsibility for actions to mitigate risks is delegated to appropriate colleagues within the business, and risks and controls are recorded in the functional risk registers.
4 Review and monitoring success of actions
The Management Board considers the risks reported in the functional risk registers and, with assistance from Risk and Internal Audit, prepares a Group risk register. This is reviewed and approved by the Board of Directors.
29Annual report and financial statements 2011/12
Mitigation
To reduce the chances of this happening and also to reduce the impact of such an event if it were to happen, we have developed recovery plans and invested in the creation of a remote IT disaster recovery site.
Recognising the importance of formulating and implementing a successful strategy, the strategy is developed by the Chief Executive and senior executives. It is considered and approved by the Board, which takes time each year to review and monitor its delivery through formal time set aside for this purpose. To ensure that the strategy is communicated and understood, the Group engages with a wide range of stakeholders, including shareholders, colleagues, suppliers and other groups. This continual process helps to ensure that it remains relevant and improves the likelihood of success.
The Group’s employment policies, remuneration and benefits packages are designed to be competitive with other companies, as well as to provide colleagues with fulfilling career opportunities. During the year, over 100,000 colleagues went through our Academy programme. The Group continually engages with colleagues across the business to ensure that we keep strengthening our team at every level.
The appropriate management evaluation and verification systems are integrated into operational management activities and these are overseen by the Management Board and the Corporate Compliance and Responsibility Committee. Delivery against targets and key performance indicators is regularly monitored and reported. Further information is available in our Corporate responsibility review at www.morrisons.co.uk/cr
The business uses data and analysis to provide insights that help explain what customer needs and wants are. This informs product ranging, marketing, advertising and also the location of stores. The importance of getting this right is the reason that we invest in the development of our colleagues in order to make the right choices for our customers.
The Group’s treasury operations are controlled centrally by the Treasury Committee in accordance with clearly defined policies and procedures that have been authorised by the Board. The Treasury Committee has certain approved delegated authorities and reports twice a year to the Audit Committee on its activities. See note 18 of the Group financial statements.
As a manufacturer of food products, we have established strict standards and monitoring processes to manage the risks associated with food safety throughout our Group and its supply chain. Our food manufacturing businesses are ISO 22000 accredited, which provides an effective framework for the control of internal processes. Food hygiene practices are taken very seriously throughout our Group, and are monitored both through internal audit procedures and external bodies such as environmental health departments. We also maintain regular supplier assessments for food and general merchandise categories. Our stock withdrawal procedures operate throughout our supply chain to minimise the impact to customers of any supplier recalls.
We have a property strategy that develops stores to a well proven format and we operate a formal capital approval process which is overseen by the Investment Board.
There is clear, ultimate accountability with the Directors for compliance with all areas of regulation, and the Corporate Compliance and Responsibility Committee provides oversight over many of these areas. The business designs its policies and procedures to accord with relevant laws and regulations. In respect of Competition Law and the Grocery Supply Code of Practice, these are monitored and reported on by the Company Secretary and Head of Legal Services.
To maximise the likelihood of successful delivery, the Group has chosen to partner with some of the world’s leading technology companies for key projects. Also, our business, like other similar businesses, has a capacity to absorb a level of change without having a detrimental impact on continuing business operations. Change programmes within the Group are designed with this in mind and are structured and governed in a manner that allows the Board to monitor their impact. Specifically, a sub-committee of the Audit Committee monitors the progress of the largest programme (Evolve) and receives regular reports from management, Risk and Internal Audit and other specialists.
Business and strategy review
Perform
ance review
Governance
Financial statements
Investor information

30 Wm Morrison Supermarkets PLCPerformance review
Corporate responsibility
Our commitment
At Morrisons, the success of our business is not just measured in monetary terms. We invest in our people, products and systems, so that we can meet future needs and be resilient to change. We recognise that resource management and being a positive influence in society is central to sustainable growth.
How we manage corporate responsibility (CR)Management and responsibility for delivery of our core published commitments is led by Group Directors who sit on our Management Board. Formal reports on innovation, progress, integration and challenges are made to both our Management Board and Corporate Compliance and Responsibility Committee.
Ongoing management is driven from our corporate services division, which incorporates corporate responsibility, policy, corporate affairs, technical, regulatory and media.
Stakeholder engagementAn essential part of our CR programme is our engagement with key stakeholders, including investors, customers, government, non-governmental organisations, colleagues, communities and suppliers. Corporate services is the centre point for stakeholder engagement in its widest sense and this enables us to identify issues and opportunities, respond to changing needs and adhere to regulatory and best practice. This two way dialogue ensures that our programme has relevance and vitality by incorporating informed views.
Our 2011/12 reviewDetails about our full CR programme can be found in our Corporate responsibility review 2011/12 at www.morrisons.co.uk/cr
Above rightOur store colleagues are trained in craft skills and have a good understanding of our products.
Here, we highlight work undertaken over the last year in relation to three of our core commitments.
Making great foodOur commitment to nutritional developmentThis year has seen a number of developments in our work to provide customers with the information and products they need to make healthier choices, including further investment in our nutrition and food innovation teams.
Morrisons signed up to the Government’s Public Health Responsibility Deal and, amongst other commitments, pledged to meet 2012 salt reduction targets and to put calorie information on our out of home eating options.
Our in-store café menus and counter items now provide calorie information at point of choice, so that our customers can make informed decisions about the food they enjoy.
Behind the scenes, a nutrition tool was designed to assist our developers in the creation of healthier products across our portfolio. We continue to reduce saturated fat, alongside our salt content, without compromising on taste.
Customers who shop from Market Street can now find nutrition information for those products on our website. This is initially available for core products within Bakery, Cake Shop, Oven Fresh and Fresh 2 Go and will be extended throughout 2012/13.
Visit: www.morrisons.co.uk/market-street/nutritional-information

31Annual report and financial statements 2011/12
Affordable – efficiency through responsible sourcing The Morrisons Farming ProgrammeThe Morrisons Farming Programme is now in its third year of operation and is consistently delivering tangible benefits for British agriculture and the Morrisons business.
We now have a network of producer groups across the farming spectrum, from red meat to poultry to dairy, the length and breadth of Great Britain.
There is a clear focus for every applied research project that we commission and fund: to help build a sustainable British farming industry that is capable of supplying quality yet affordable food for future generations.
As the retailer closest to farming, we can work hand in hand with our farmers to help them make the changes at farm level that can improve efficiency, save money, reduce carbon footprint and improve quality of life for farmed animals.
The reason we do this work is to help our farmers and further improve the quality of fresh food in-store for our customers. The recognition we are increasingly receiving from Government Ministers, the National Farming Unions and animal welfare groups is an added bonus.
Animal welfareAnimal welfare is important to Morrisons, our customers and our farmers. During the year, we have completed a number of industry leading projects. For example, we moved all our standard fresh chicken to higher welfare production methods, raised in houses with windows providing natural light and environmental enrichment in the form of bales, perches and pecking objects.
Sustainable farmingIncreasingly, farmers are recognising that the most efficient and profitable farms are those with the lowest carbon footprint. We are continuing to develop projects that help more and more of our farmers improve their environmental stewardship.
We completed stage one of a project with our Dairy Crest producer group that recorded and analysed the carbon footprint of 110 farms.
Grass is the farmer’s greatest asset, yet conservative estimates say at least 30% of British grassland is under utilised. Our Arla dairy farmer group wanted better information on grassland management in a format that farmers can easily reference and understand. The result was an innovative document showcasing a unique, farmer designed format, enabling them to get quick answers to their questions.
Driving innovationThis year, we have upgraded our Morrisons farmer’s website to enable them to easily access a wide range of data compiled on the carcass of the cattle, sheep or pig they have supplied. The information will be a valuable tool to help our farmers make adjustments that can improve herd technical performance.
The Morrisons Farm at Dumfries HouseOur farm in Scotland continues to be a valuable resource in promoting the benefits of British produce and providing a clear understanding around the challenges of farming. We pioneered our traditional beef programme at Dumfries House and have a number of projects around sustainable animal feed and pasture management. We will open our doors to fellow farmers in June 2012, as we host the flagship event in the British sheep industry’s calendar, ScotSheep.
The Morrisons farming conferenceIn March 2012, we will hold our first Morrisons farming conference inviting over 600 of our suppliers to join with us and debate how best to drive and deliver sustainable farming practices.
AboveWe work closely with farmers to help improve food quality.
Business and strategy review
Perform
ance review
Governance
Financial statements
Investor information

32 Wm Morrison Supermarkets PLCPerformance review
Corporate responsibility – continued
Corporate responsibility highlights
On target for a 30% absolute reduction in carbon emissions by 2020 (2005 baseline)
14.6% achieved to date
On target to achieve zero waste direct to landfill by 2013
5.6% remaining
Exceeded target of raising at least £1m per annum for our Charity of the Year – Save the Children
£2.3m raised
AboveGetting out of the classroom and learning about food with Let’s Grow.
AboveOur Raise a Smile campaign has engaged colleagues and customers.
For everyoneEngaging in communitiesSince Let’s Grow began in 2008/09, in response to work carried out by DEFRA indicating children’s lack of knowledge around fruit and vegetables, Morrisons has given over five million children the ability to get out of the classroom to learn about growing food and the food cycle first hand. Since we began the programme, we have given away over £12m worth of gardening and cooking equipment, from wellies to wheelbarrows, spades to spatulas and gloves to greenhouses.
Since 2008/09 we have given away over: 11,000 wellies; 34,000 watering cans; 361,000 packets of seeds; 64,000 trowels; 8,900 greenhouses; and 364,000 plant pots.
Schools are also encouraged to bring Let’s Grow into the curriculum via our online teaching resources, including tutorial videos, lesson plans, activity sheets and assembly guides. Let’s Grow also supports schools, should they wish to visit their local Morrisons store, and our store managers work with schools to develop fun and engaging store visits, assemblies and lessons, bringing the food story to life and showing them how their produce goes from field to fork.
Now moving into its fifth year, Let’s Grow continues to work with over 26,500 schools across the country. In 2012/13, Let’s Grow is looking to extend the programme out into the wider community, and provide schools with more of what they need to get children out and learn about the food cycle for themselves.
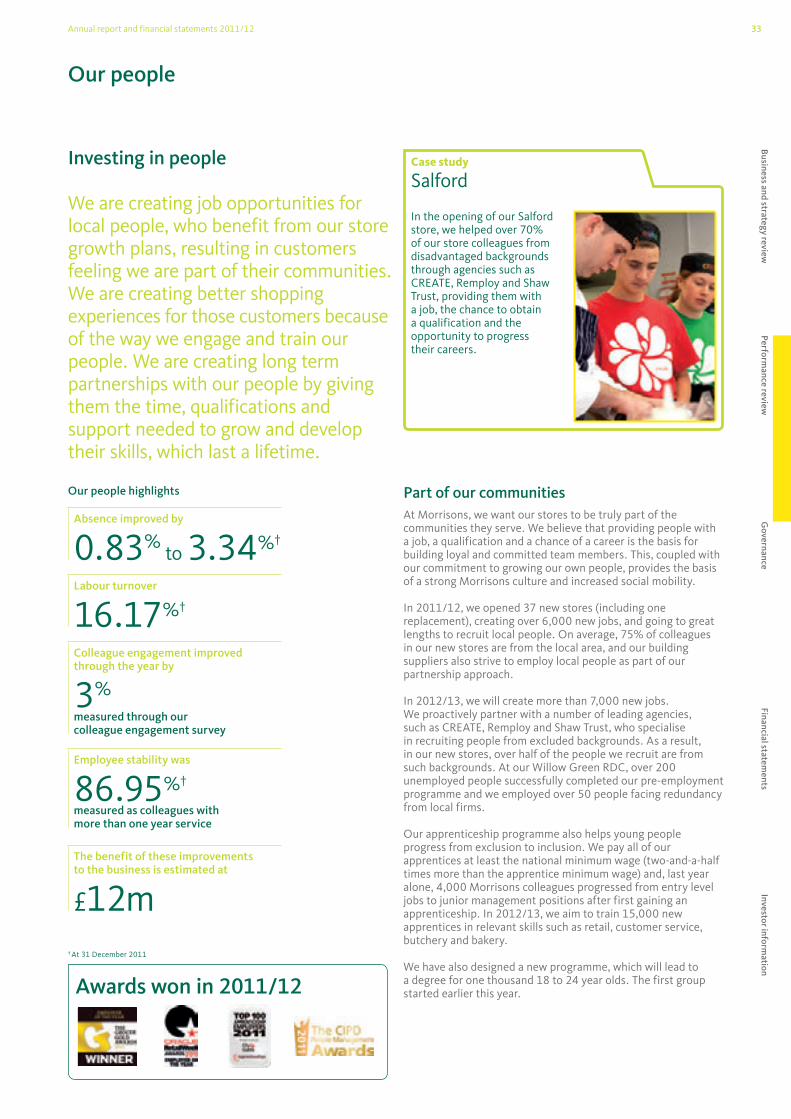
33Annual report and financial statements 2011/12
Case study
Salford
Our people
Investing in people
We are creating job opportunities for local people, who benefit from our store growth plans, resulting in customers feeling we are part of their communities. We are creating better shopping experiences for those customers because of the way we engage and train our people. We are creating long term partnerships with our people by giving them the time, qualifications and support needed to grow and develop their skills, which last a lifetime.
Part of our communities At Morrisons, we want our stores to be truly part of the communities they serve. We believe that providing people with a job, a qualification and a chance of a career is the basis for building loyal and committed team members. This, coupled with our commitment to growing our own people, provides the basis of a strong Morrisons culture and increased social mobility.
In 2011/12, we opened 37 new stores (including one replacement), creating over 6,000 new jobs, and going to great lengths to recruit local people. On average, 75% of colleagues in our new stores are from the local area, and our building suppliers also strive to employ local people as part of our partnership approach.
In 2012/13, we will create more than 7,000 new jobs. We proactively partner with a number of leading agencies, such as CREATE, Remploy and Shaw Trust, who specialise in recruiting people from excluded backgrounds. As a result, in our new stores, over half of the people we recruit are from such backgrounds. At our Willow Green RDC, over 200 unemployed people successfully completed our pre-employment programme and we employed over 50 people facing redundancy from local firms.
Our apprenticeship programme also helps young people progress from exclusion to inclusion. We pay all of our apprentices at least the national minimum wage (two-and-a-half times more than the apprentice minimum wage) and, last year alone, 4,000 Morrisons colleagues progressed from entry level jobs to junior management positions after first gaining an apprenticeship. In 2012/13, we aim to train 15,000 new apprentices in relevant skills such as retail, customer service, butchery and bakery.
We have also designed a new programme, which will lead to a degree for one thousand 18 to 24 year olds. The first group started earlier this year.Awards won in 2011/12
In the opening of our Salford store, we helped over 70% of our store colleagues from disadvantaged backgrounds through agencies such as CREATE, Remploy and Shaw Trust, providing them with a job, the chance to obtain a qualification and the opportunity to progress their careers.
Our people highlights
Absence improved by
0.83% to 3.34% †
Labour turnover
16.17% †
Colleague engagement improved through the year by
3%measured through our colleague engagement survey
Employee stability was
86.95% †
measured as colleagues with more than one year service
The benefit of these improvements to the business is estimated at
£12m† At 31 December 2011
Business and strategy review
Perform
ance review
Governance
Financial statements
Investor information

34 Wm Morrison Supermarkets PLCPerformance review
In 2011/12, we also delivered a step change in our customer service. Every one of our store colleagues has been involved in our HOT service programme (‘hello’, ‘offer’, ‘thank’), delivering the largest service programme of its kind in the UK. At its heart, our managers are trained to coach for service, helping to create the right environment and championing the new HOT service ethos.
When we get it right, HOT promotes a warm, friendly and natural service for our customers, who are already telling us they are seeing the difference. In the last 12 months, we have accomplished a 21% increase in the degree to which customers would recommend us to others, and a 56% increase in the number of compliments we receive. We have also recorded leading service scores in the ‘mystery shopper’ exercises carried out by renowned industry publication The Grocer.
Cultivating a winning environmentMorrisons thrives by having people in place who know how the business works and how to do a good job. We have a strong record of developing our own people: 95% of our store general managers are promoted from within and 30% of our senior management team started on the shop floor. This means our leaders have a rich vein of experience from which to coach and develop their people and, continuing this tradition, in 2011/12 alone, over 5,500 colleagues progressed from the shop floor to managerial positions.
Cultivating an environment in which everyone can grow to be the best, they can be starts with enabling our managers to be great leaders and coaches. Last year, over 4,000 managers from across the business attended our revolutionary Coaching for Performance programme. The programme, developed in partnership with Leeds Metropolitan University and Leeds Carnegie, is the centrepiece of our Centre of Excellence for Coaching, and translates parallels from winning sports teams into success in the business environment.
The resultant common mindset approach to motivating, training and rewarding our people has become a way of life at Morrisons. Through the skills they acquire from the programme, our managers are better able to offer meaningful support to colleagues and ‘coach on the go’.
Morrisons was also the first major business to respond to the Lord Davies review into women on boards. In 2011/12, we paid particular attention to supporting women in our organisation. We have already met the criteria for the Davies report; over 25% of our main Board are female. In the past 12 months, we have increased the number of our female senior managers by 7% to 20%, and are making strong progress on reaching our target of 30% representation by 2014/15.
Last year, we also won the Chartered Institute of Personnel and Development award for Organisational Development for our Advanced Leadership Programme, which prepares members of our senior management team to become the executive directors of the future.
In 2012/13, we will further develop our talent pipeline to fuel our future growth. We will offer opportunities for graduates and school leavers through our M Futures programme and, through our accelerated development programme, we will grow our store general managers and business leaders of the future.
We have more craft trained people than any other retailer. To further reinforce the role these colleagues play in making our great food, in 2011/12 we launched our Mastercraft competition. Over 1,000 of our butchers, bakers, fishmongers and cheesemongers entered and, in the final, the best of the best showcased their skills in Masterchef style. In 2012/13, the four winners, pictured, will spend time in their respective industry further honing their skills and expertise.
Case study
Mastercraft
Friendly people making great food We know that, by investing in our colleagues and building their skills, we can create an unrivalled shopping experience; one that is delivered by friendly and knowledgeable people; one that new customers switch supermarkets for; one that existing customers recommend to others and come back to.
As a business, we believe that the skills of our people give us an edge over our competition. We have more craft trained people than any other retailer, making great food and sharing their expertise with our customers.
In our stores, every colleague has the opportunity to achieve a QCF (NVQ) Level 2 Retail Skills qualification (equivalent to GCSEs). We now have over 100,000 store colleagues who have been successfully accredited with this industry-recognised qualification. Many of our colleagues leave school with few qualifications and through this programme we have created opportunities for people who would otherwise not aspire to progression.
Through the Morrisons Academy, our suite of training and development tools and processes, we have delivered over one million training days in the last 12 months, providing our people with specialist skills for their function, as well as consistent core skills. All our training interventions are linked to our values, ensuring we strengthen and preserve the unique Morrisons culture as we grow our business.
Our people – continued

35Annual report and financial statements 2011/12
In 2011/12, we introduced our Morrisons Plus retirement club, so that we keep in touch with, and provide benefits and support to, our retired colleagues. In 2011/12, 5,000 colleagues signed up to Morrisons Plus. In 2012/13, we’re introducing a new pensions scheme, available to all colleagues to help provide for retirement.
Case study
Retirement
In 2011/12, we paid particular attention to supporting women in our organisation. Through our participation in the Women in Business initiative (for which Morrisons hosted the inaugural event, pictured), our talented women can network with other leading groups to foster partnerships, and lead and coach other women in business. Through this programme, we are preparing a pipeline of future senior female leaders.
Case study
Women in BusinessLifetime partnerships We want to build lifetime partnerships with our people – by helping them to grow and develop through the Morrisons Academy and by making Morrisons a great company to work for. The result will see our colleagues staying with us for longer and developing a deep understanding of our business.
This makes sense for our people, our customers and our shareholders; we know that colleagues who are engaged with our business deliver better service, leading to increased satisfaction and sales.
In 2011/12, over 105,000 colleagues participated in our colleague opinion Climate Survey to give their thoughts on life at Morrisons. As a result of their feedback, we have invested in our family friendly policies, making our maternity and paternity policies industry leading and significantly enhancing our bereavement, sickness and compassionate leave policies.
We believe that, if we look after our colleagues, they will look after our customers. Our commitment to colleagues’ health and wellbeing is exemplified through our effective occupational health team, who supports our colleagues and makes recommendations to help them return to work when they are well enough. As a result of this collaborative approach, our absence rates are at an all time low.
We have already seen proof that our commitment to building lifetime partnerships by investing in our people is making a positive difference. In our 2011/12 Climate Survey, we witnessed a 10% increase in our colleague engagement levels and, since we launched the Morrisons Academy in 2009, we have seen a 7% increase in productivity and a 6% improvement in staff retention.
We will keep on listening to our colleagues to understand how we can further build and enhance our people proposition. Each month, over 12,000 colleagues are invited to complete our monthly Pulse Survey, a shorter colleague opinion survey, of which we see a 90% return.
Key facts
Increase in the number of female senior managers
7%
People progressing from shop floor to managerial positions in 2011/12
5,500People participating in our annual colleague opinion survey
105,000
Business and strategy review
Perform
ance review
Governance
Financial statements
Investor information

36 Governance Wm Morrison Supermarkets PLCGovernance
Board of Directors and Management Board
Key to imageBoard of Directors Management Board
1 3 5 7 92 4 6 8 10 11 12 13 14

37Annual report and financial statements 2011/12
1 Johanna Waterous 2 Nigel Robertson 3 Penny Hughes 4 Philip Cox 5 Sir Ian Gibson
6 Dalton Philips 7 Richard Pennycook8 Neal Austin9 Martyn Fletcher10 Mark Harrison
11 Terry Hartwell12 Richard Hodgson13 Martyn Jones 14 Norman Pickavance
Nomination Committee Remuneration Committee Corporate Compliance and Responsibility Committee Audit Committee
Business and strategy review
Perform
ance review
Governance
Financial statements
Investor information
Biographies of both Boardsturn to pages 38 and 39
View online atwww.morrisons.co.uk/corporate/ar2012

38 Governance Wm Morrison Supermarkets PLCGovernance
Sir Ian Gibson 5
ChairmanSir Ian joined the Group as Non-Executive Deputy Chairman in September 2007. He was appointed Chairman in March 2008. Sir Ian is Chair of the Board’s Nomination Committee and a member of its Remuneration Committee and Corporate Compliance and Responsibility Committee. He is a Non-Executive member of the Public Interest Body of the UK firm of PricewaterhouseCoopers LLP and will be stepping down from his current role as Non-Executive Chairman of Trinity Mirror Plc in August 2012. Previous Board appointments include Chairman of BPB Plc, Deputy Chairman of Asda Group Plc, and Director of Chelys Limited, GKN Plc, Greggs Plc and Northern Rock Plc. He is also a former member of the Court of the Bank of England. Sir Ian enjoyed a distinguished 30-year career in the motor industry, most recently as President of Nissan Europe.
Richard Pennycook 7
Group Finance DirectorRichard joined the Board as Group Finance Director in October 2005 and has responsibility for finance, IT, strategy and multi-channel development. Prior to that, he was the Group Finance Director of RAC Plc, the quoted specialist motoring and vehicle management company. Previous senior roles include Group Finance Director of HP Bulmer Holdings Plc, Laura Ashley Plc and JD Wetherspoon Plc, and Chief Executive of Welcome Break Holdings Plc. He is also Senior Independent Director and Chairman of the Audit Committee of Persimmon Plc.
Philip Cox 4
Chair of the Audit CommitteePhilip joined the Group as a Non-Executive Director in April 2009. He is a member of the Audit Committee and became its Chair in September 2009, and is also a member of the Remuneration Committee and the Nomination Committee. He is also Chief Executive Officer of International Power Plc, a position that he has held since 2003, when he was promoted from his previous role of Chief Financial Officer (2000 to 2003). He is a member of the President’s Committee of the CBI. He was a Non-Executive Director at Wincanton Plc from 2001 to 2009, having chaired its Audit Committee from 2001 to 2008, and was Chair of its Remuneration Committee from 2008. His previous Board position was as Chief Financial Officer at Siebe Plc.
Johanna Waterous 1
Chair of the Remuneration CommitteeJohanna joined the Group as a Non-Executive Director in February 2010. She is a member of the Audit, Nomination, Remuneration and Corporate Compliance and Responsibility Committees. Johanna was appointed as Chair of the Remuneration Committee with effect from March 2011. She is currently Non-Executive Director of RSA Group Plc and Chairman of Sandpiper CI, as well as being an Operating partner of Duke Street LLP. Her previous experience includes 22 years with McKinsey & Co, London, ultimately as co-leader of the firm’s Global Marketing and Sales Practice. She is a Non-Executive Director of the Kew Foundation and of Kew Enterprises Ltd. Between 1998 and 2006, she was Chairman of Tate Enterprises.
Dalton Philips 6
Chief ExecutiveDalton joined the Group as Chief Executive in March 2010. He is a member of the Board’s Nomination Committee and Corporate Compliance and Responsibility Committee. Prior to joining Morrisons, Dalton was Chief Operating Officer of Loblaw Companies Limited, Canada’s largest food distributor and a leading provider of general merchandise, pharmacy and financial products and services. Prior to that position, he was Chief Executive of Irish department store group Brown Thomas. Between 1998 and 2005, he worked for Wal-Mart’s international division holding a range of commercial positions, rising to Chief Operating Officer in Germany. Dalton started his career as a Store Manager in New Zealand with Jardine Matheson and was later Regional Director of the company’s Spanish supermarket division.
Nigel Robertson 2
Senior Independent DirectorNigel joined the Group as a Non-Executive Director in July 2005. In March 2011, he was appointed Senior Independent Director. He is a member of the Nomination, Remuneration, Audit and Corporate Compliance and Responsibility Committees, and was Chair of the Corporate Compliance and Responsibility Committee from September 2009 to March 2011. Working in the private equity sector, he is the Group Chief Executive of Health and Surgical Holdings Ltd. Until the business was sold in 2007, he was the Chief Executive Officer of Chelsea Stores Holdings Ltd and he was previously the Managing Director of Ocado, the online grocery shopping business set up in partnership with Waitrose. Prior to this, he held senior positions in Marks & Spencer Group plc both in the UK and USA.
Penny Hughes 3
Chair of the Corporate Compliance and Responsibility CommitteePenny joined the Group as a Non-Executive Director in January 2010. She is a member of the Audit, Corporate Compliance and Responsibility, Nomination and Remuneration Committees. With effect from March 2011, Penny was appointed as Chair of the Corporate Compliance and Responsibility Committee. Penny is currently a Non-Executive Director of Cable & Wireless Worldwide Plc, The Royal Bank of Scotland Plc and a trustee of the British Museum. Penny’s previous experience includes ten years with Coca-Cola GB and Ireland, and various Non-Executive roles, including Body Shop International Plc, GAP Inc, Reuters Plc, Skandinaviska Enskilda Banken, Trinity Mirror Plc, Vodafone Plc and Home Retail Group plc.
Board of Directors
Board of Directors
1 2 3 4 5 6 7

39Annual report and financial statements 2011/12
Management Board
Neal Austin 8
Group Logistics and Supply Chain DirectorNeal joined the Management Board in October 2010 and is responsible for logistics and supply chain. He joined Morrisons in October 2006 from MFI, where, as Logistics Director, he was involved in the sale of the retail business to private equity. Neal began his career in 1989 with Tesco as a graduate trainee in the buying division, where he undertook a number of buying and marketing roles, progressing to senior wine buyer. He then took a role with Asda as a senior buyer and progressed through the supply chain in a number of roles before being appointed Supply Director.
Mark Harrison 10
Group Retail DirectorMark joined the Management Board in October 2010 and was appointed Group Retail Director in June 2011. His responsibilities are retail operations, central retail operations, retail fuel, retail related projects and group-wide security. He joined the Group in 1980 as a management trainee and quickly progressed to Store General Manager. After a successful career in store management, he held progressively senior positions of regional management between 1996 and 2004. In 2004 he became Stores Director.
Richard Hodgson 12
Group Commercial DirectorRichard was appointed as Group Commercial Director and joined the Management Board in October 2010 with responsibility for trading, marketing, brand and services. He has broad experience across all areas of the UK grocery market and has held key roles in both the premium and value sectors. He was previously with Waitrose, initially as Director of Buying and, from January 2008, as Commercial Director, which added marketing, international development and merchandising to his responsibilities. Prior to that, he spent ten years at Asda in a number of senior roles, most recently as Brand and Marketing Director.
Norman Pickavance 14
Group HR DirectorNorman was appointed to the Management Board in October 2010 with responsibility for HR. He joined Morrisons as Group HR Director in July 2007. Previously, he worked for Northern Foods Plc as Group HR and Corporate Services Director. Norman began his career with Grand Metropolitan Plc’s European food business and then proceeded to spend 13 years working in the high-tech sector on an international basis, working with organisations delivering transformation and growth development. Outside of Morrisons Norman is currently Chair of CREATE, one of the UK’s leading social enterprises helping the homeless back to work and is actively involved with supporting children and youth development in the community and charitable sectors.
Martyn Fletcher 9
Group Manufacturing DirectorMartyn became a member of the Management Board in October 2010 and is responsible for the Group’s food manufacturing operations, including abattoirs, bakeries, processing and packing facilities. He joined the Group in 1985 and has held a number of roles within stores and in head office. In 1988, he was appointed as Purchasing Manager and promoted to Purchasing Director in 1995. In 2002, he was appointed to Production Director, responsible for the food manufacturing operation, before being appointed as Group Manufacturing Director in 2007.
Terry Hartwell 11
Group Property DirectorTerry was appointed to the Management Board in October 2010 after joining the Group in May 2009 as Group Property Director. Prior to joining Morrisons, Terry was Group Property Director for the worldwide operations at Kingfisher Plc. He spent 25 years with Kingfisher Plc and, during that time, held a number of senior property positions, including a spell in front line operations, running the new depot division in the mid 1990s. He is a Chartered Surveyor with experience in all aspects of commercial property development, retail acquisition and property management.
Martyn Jones 13
Group Corporate Services Director Martyn was appointed to the Management Board in October 2010 as Group Corporate Services Director, and is responsible for policy and technical standards. He joined Morrisons in 1990 as Trading Manager and was promoted to Trading Operations Director in 1993, Grocery Director in 1997 and then Senior Trading Director in 2002. Martyn spent three years on the Board as Group Trading Director before changing role at the end of 2010 to Group Corporate Services Director on the Management Board. Prior to joining Morrisons, he spent eight years with J. Sainsbury Plc before moving into manufacturing with RHM Plc and then Campbells, gaining wide buying, marketing and product development experience in fresh and frozen foods.
Management Board
86 7 9 10 11 12 13 14
Business and strategy review
Perform
ance review
Governance
Financial statements
Investor information

40 Governance Wm Morrison Supermarkets PLC
Sir Ian GibsonChairman
Corporate governance report
UK Corporate Governance CodeThe Board has prepared this report with reference to the UK Corporate Governance Code issued by the Financial Reporting Council in June 2010.
During the year, the Board’s Corporate Compliance and Responsibility Committee reviewed and updated, and the Board approved, its Corporate Governance Compliance Statement, which sets out how the Group complies with each of the provisions of the UK Corporate Governance Code (the ‘Code’). In light of the fact that there were relatively few changes to the Code in the year, there were no significant changes to the Corporate Governance Compliance Statement. That document also sets out the statement of the division of responsibilities between the Chairman and the Chief Executive, the list of matters reserved to the Board, the membership of the Board and of the various Board committees, together with the terms of reference of the various standing Board committees. This document is available in the investor relations section of the Group’s website, www.morrisons.co.uk/corporate
The BoardMembershipOn 29 January 2012, the Board comprised a Non-Executive Chairman, two Executive Directors and four Non-Executive Directors.
There is a clear division of responsibilities between the Chairman and the Chief Executive, which has been set out in writing and agreed by the Board.
As reported in the 2010/11 Annual report and financial statements, during the year three directors left the Board. Paul Manduca stepped down on 9 March 2011, and Brian Flanagan and Mark Gunter stepped down on 9 June 2011 following the Company’s AGM. There were no new appointments to the Board. Throughout the period, the majority of the Board consisted of independent Non-Executive Directors. Details of appointments, roles and backgrounds of the Directors are set out on page 38.
Board diversityAs the Company confirmed in its Interim results announcement in September 2011, the Board welcomes the proposals set out by Lord Davies in his review into Women on Boards. The Board currently includes two women members, 28% of its total composition. The Board’s policy is that female representation should be maintained at not less than 20% and aspires that this should be higher than 30%. This policy will continue to be considered as part of the Nomination Committee’s regular review of the Board’s composition and skills.
Performance evaluation and trainingThe performance of the Board, its committees and its Directors are assessed and appraised regularly. The Chairman is responsible for monitoring the performance of the Chief Executive, who in turn is responsible for monitoring the performance of the Executive Directors.
Independent Board reviewA full independent external review of the Board was carried out during the financial year by Boardroom Review (which has no other association with the Company). The review took the form of:
confidential interviews with each of the members of the Board and the Company Secretary;
a review of Board papers; and observation of Board and Board committee meetings.
In this section40 UK Corporate Governance Code40 The Board 40 Membership 40 Performance evaluation and training 41 Senior Independent Director 42 Non-Executive Directors 42 Board responsibilities42 Management Board42 Committees of the Board 42 Nomination Committee 42 Remuneration Committee 43 Audit Committee 45 Corporate Compliance and
Responsibility Committee45 Shareholder relations45 Share capital and control

41Annual report and financial statements 2011/12
The effectiveness of the Board was considered within the context of three key criteria:
• the Board’s ability to achieve its objectives, particularly with regard to the development of strategy, the oversight of risk and control, the monitoring of executive performance, and the protection of shareholder and stakeholder interests;
• the Board’s ability to work together effectively; and
• the Board’s ability to maximise its use of time.
The conclusions of that review were that the Board demonstrated six areas of strength: its approach to strategy, its knowledge of stakeholder views, its development of internal controls and risk management, its approach to remuneration, its positive culture and contribution, and its combination of formal and informal meetings throughout the year.
The review suggested that there were two issues which related to the future, and which might have affected the Board’s capacity for impact and effectiveness in the longer term, being preparation for organisational change and the approach to executive succession planning.
These matters were already in the Board’s schedule of matters for regular review, and the Nomination Committee and full Board have, since the report was received, considered both of these matters in detail. Detailed plans have been reviewed and approved.
The Board has accepted the recommendation of the Corporate Compliance and Responsibility (CCR) Committee that there will be a further evaluation process of the Board and its principal committees (Audit, Nomination, Remuneration and CCR) carried out in the current financial year by the Chairman, supported by the Chair of the CCR Committee and the Company Secretary, and in the following financial year, a further independently facilitated external evaluation.
The Board is satisfied that the arrangements for review and appraisal of the performance of the Board, its committees and individual Directors are appropriate. The Board is also confident that the initiatives which have been implemented already or which are in progress will enable the Group to satisfy the best practice recommendations of the Code in relation to Board evaluation.
During the course of the 2011/12 financial year, the Group has continued with its series of Board training sessions, presented by the Group’s external advisers on various key issues of importance to the Group. This training was designed to address matters of specific relevance to the Group and covered a range of topics.
Board training 2011/12The Board has received training during the year on topics including:
health and safety compliance; food safety compliance; the Bribery Act and the Group’s compliance procedures; changes to the Takeover Code, the UK Listing Rules and the Code;
competition compliance and merger control; a governance and technical update on the role of the Audit Committee; and
the operations of financial markets.
These training programmes have also been shared, as appropriate, with the Group’s Management Board to ensure that there is the necessary knowledge and support at the highest levels of the Group’s management. In relation to the Group’s compliance processes to address bribery and corrupt practices, training has been provided across the management of the Group and the Group’s policies, which were revised and brought up to date to reflect the introduction during the year of the Bribery Act and the requirement for high level sponsorship and support for those policies.
During the year, Nigel Robertson assumed the role as Senior Independent Director, Johanna Waterous was appointed as Chair of the Remuneration Committee and Penny Hughes was appointed Chair of the CCR Committee. Prior to these Directors each taking up those roles, they received a detailed induction from the Company Secretary, supported by meetings with key and relevant members of the Group’s management team and with the Group’s principal external advisers. The aim of these induction programmes was to ensure that they each had a clear and thorough understanding of the particular requirement of those specific roles and a detailed familiarity with the particular issues relating to their new areas of responsibility.
The training programme will continue, so that regular updates are provided to the Board on corporate governance, legal issues, accounting issues and new developments.
Senior Independent DirectorNigel Robertson assumed the role of Senior Independent Director on 10 March 2011 when Paul Manduca stepped down from the Board. Nigel joined the Board as a Non-Executive Director in July 2005 and, on appointment, had no prior association with the Company. He has gained extensive knowledge of the Group’s business and its activities. Throughout his period of tenure as Senior Independent Director, he has been available to shareholders as an alternative to the Chairman, the Chief Executive and the Group Finance Director. He will continue to be available to meet shareholders and will report any relevant issues to the Board or the Chairman. Nigel also co-ordinates the review of the performance of the Chairman by the Non-Executive Directors, the latest having been carried out in February 2012.
Business and strategy review
Perform
ance review
Governance
Financial statements
Investor information

42 Governance Wm Morrison Supermarkets PLC
Corporate governance report – continued
Non-Executive DirectorsThe Non-Executive Directors provide a varied range of skills and experience to the Group. Details of their experience outside the Group are set out in their respective biographies on page 38. The Board is satisfied that all Non-Executive Directors, including the Non-Executive Chairman, remain independent according to the definition contained in the Code. No Non-Executive Director:
• has previously been employed by the Group within the last five years;
• has had a material business relationship with the Group within the last three years;
• receives remuneration other than Director’s fees;
• has close family ties with any of the Group’s advisers, Directors or senior employees;
• holds cross-directorships or has significant links with other directors through involvement in other companies or bodies;
• represents a significant shareholder; or
• has served on the Board for more than nine years.
All Directors are provided with a comprehensive, formal and tailored induction to the business. The minimum time commitment expected of the Non-Executive Directors is one day per month attendance at meetings, together with attendance at the AGM, Board away days and site visits, plus adequate preparation time. The Board is satisfied that each of the Non-Executive Directors commits sufficient time to the business of the Group and contributes to the governance and operations of the Group. This has been confirmed by the independent Board effectiveness evaluation referred to earlier in this report.
During the year, the Non-Executive Directors met six times without management present to discuss the performance of the business and management, and the wider economic, commercial and social environment in which the Group operates. The Chairman arranges for there to be regular discussions between all the Non-Executive Directors (including himself) as a group. These are not part of a strict timetable, as they are influenced by the circumstances from time to time. However, these discussions take place, roughly, at or around every alternate Board meeting. The Senior Independent Director has also co-ordinated a meeting of the Non-Executive Directors which carried out an appraisal of the Chairman’s performance. As part of this process, he also sought the views of the Executive Directors.
Board responsibilitiesThe Board is responsible for setting and approving the strategy and key policies of the Group, and for monitoring the progress towards achieving these objectives. It monitors financial performance, critical operational issues and risks, including regular review and formal approval of the Group’s risk register. The Board also approves all circulars, listing particulars, resolutions and correspondence to shareholders, including the Annual report and financial statements, half-yearly financial report and interim management statements.
The formal schedule of matters reserved for the Board remains unaltered and further details are available in the Corporate Governance Compliance Statement set out in the investor relations section of the Group’s website, www.morrisons.co.uk/corporate
Management BoardThe Management Board is made up of representatives of the senior management of the Group and is chaired by the Chief Executive. It has detailed terms of reference and has responsibility for the day-to-day operations of the Group. This includes development and implementation of strategy (subject to overall supervision by the Board), financial performance, reporting and control, risk management, operational improvement programmes, the entry by the Group into major contracts and commitments, the development of corporate policies and procedures, and the ongoing review and supervision of the operational activities of the business of the Group. It reviews and makes recommendations to the Board in respect of budgets and long term planning and dividend levels, as well as reviewing proposed announcements, whether financial or related to ad hoc events. It also keeps under supervision the Group’s senior management talent, capabilities and succession plans.
The Company Secretary organises the appropriate level of insurance cover for all Directors to defend themselves against legal claims and civil actions. The level of cover is currently £75m in aggregate.
Committees of the BoardThe principal committees of the Board are the Audit, Remuneration, Nomination and CCR Committees.
Full terms of reference of the Board’s committees are available on request and in the Corporate Governance Compliance Statement set out in the investor relations section of the Group’s website, www.morrisons.co.uk/corporate
a) Nomination CommitteeDuring the year, the activities of the Committee were focused on advice to the executive management on the establishment and composition of the Management Board and on senior management succession planning. The Committee has engaged an executive search agency, MWM Consulting, to assist in the process of identification of potential candidates to join the Board as and when appropriate.
b) Remuneration CommitteeThe objective of the Group’s remuneration policy is to encourage a strong performance culture and an emphasis on long term shareholder value creation. The intention is to position remuneration arrangements competitively against the market with a clear reward structure to enable the Group to attract, retain and motivate the best talent who are key to the Group’s recent and future success.
The Group HR Director has advised the Group on all remuneration related matters, including pensions and Executive Directors’ contracts. Where necessary, this advice was supplemented by external advisers.

43Annual report and financial statements 2011/12
b) Remuneration Committee (continued) The Committee also receives advice from its appointed advisers on remuneration matters: Pension Capital Strategies Limited (a member of the Jardine Lloyd Thompson Group) in respect of pensions, and Ashurst LLP in respect of Executive Directors’ contracts. During the year, the Remuneration Committee carried out a review of its external advisers and, after carrying out an extensive selection process, decided to appoint PricewaterhouseCoopers LLP as its remuneration advisers. The new advisory firm was appointed in October 2011 and replaced the previous advisers, New Bridge Street.
The activities of the Remuneration Committee during the year are set out in more detail in the Remuneration report from page 48.
c) Audit CommitteeThe Board has delegated to the Audit Committee the responsibility for reviewing on its behalf and making recommendations to the Board as to:
• the integrity of financial reports;
• the effectiveness of the Group’s internal control and risk management system; and
• the independence of the external auditor.
The Audit Committee’s responsibilities have not changed during the year.
The Audit Committee regularly considers the professional development needs of its members, and whether adequate technical information is being provided. Where necessary, it will seek independent external advice at the Group’s expense, with such arrangements made through the Company Secretary. In particular, in October 2011, the Company’s auditors, KPMG Audit Plc (KPMG), presented a training session to the Committee on governance and technical issues relating to the role and function of the Committee. The presentation covered the following areas:
• accounting standards and how these are evolving and their impact on Morrisons;
• the role and function of the Financial Reporting Council;
• current developments and proposals from the Department for Business Innovation and Skills;
• the roles and functions of the Audit Inspection Unit and the Financial Reporting Review Panel;
• current issues in relation to audit policy; and
• developments in the EU Corporate Governance Framework.
During the year, the membership of those Committees was:
Committee membership
Name Nomination Remuneration Audit CCR
Sir Ian Gibson ✓1 ✓ ✓
Dalton Philips ✓ ✓
Philip Cox ✓ ✓ ✓1
Penny Hughes ✓ ✓ ✓ ✓3
Nigel Robertson ✓ ✓ ✓2
Johanna Waterous ✓ ✓3 ✓ ✓
Paul Manduca (until 9 March 2011) ✓ ✓2 ✓
Brian Flanagan (until 9 June 2011) ✓ ✓ ✓
1 Chair of the Committee 2 Chair of the Committee until 9 March 2011 3 Chair of the Committee from 10 March 2011
The Directors attended the following number of Board and Committee meetings:
Number of meetings Board Nomination Remuneration Audit CCR
Sir Ian Gibson 10/10 3/3 9/9 4/4Dalton Philips 10/10 3/3 4/4Richard Pennycook 10/10Philip Cox 9/10 3/3 7/9 6/6Penny Hughes 8/10 3/3 8/9 5/6 3/3Nigel Robertson 10/10 2/3 7/9 4/4Johanna Waterous 10/10 3/3 9/9 5/6 4/4Paul Manduca 1/2 2/3Brian Flanagan 3/3 1/1 3/5 3/3Mark Gunter 3/3
Business and strategy review
Perform
ance review
Governance
Financial statements
Investor information

44 Governance Wm Morrison Supermarkets PLC
The Audit Committee is chaired by Philip Cox, who has the requisite recent and relevant financial experience. The Chairman, the Chief Executive, the Group Finance Director, the Head of Risk and Internal Audit, and other finance department representatives have attended meetings by invitation.
(i) Overview of actions taken by the Audit Committee in discharging its duties
The Committee has received and reviewed reports and presentations from senior management to fulfil its terms of reference. To meet its responsibilities in this respect, the Committee considered:
• interim and preliminary announcements, together with any other formal announcements relating to financial performance;
• the accounting principles, policies and procedures adopted in the Group’s financial statements, including, where necessary, challenging the judgements made; and
• the potential effects of tax and pensions accounting, and other significant judgemental and complex accounting issues dealt with in the financial statements.
The Audit Committee oversees the Group’s relationship with the external auditor. Private meetings are held with the external auditor, without management present. The purpose of these meetings is to understand their views on the control and governance environment and management’s effectiveness within it. To fulfil its responsibilities in respect of the independence and effectiveness of the external auditor, the Committee reviewed:
• the terms, areas of responsibility, duties and scope of work of the external auditor as set out in the engagement letter;
• the external auditor’s work plan for the Group;
• the detailed findings of the audit, including a discussion of any major issues that arose during the audit;
• the letter from KPMG confirming its independence and objectivity; and
• the audit fee and the extent of non-audit services provided by the external auditor.
In this period, the external auditor has continued to provide a significant level of non-audit work, primarily to provide the Board with independent assurance in respect of IT systems replacement. The Board believes that this activity is a reasonable extension of the auditor’s statutory work and that there are safeguards in place to avoid a threat to the auditor’s independence or objectivity. The Board has a policy on the engagement of the external auditor to supply non-audit services and the Committee has reviewed the scope of non-audit services provided by the external auditor to ensure that there was no impairment of objectivity. A copy of the non-audit services policy is available in the Corporate Governance Compliance Statement set out in the investor relations section of the Group’s website at www.morrisons.co.uk/corporate. This non-audit services policy is designed to assist the Company and each of its subsidiaries in ensuring that the engagement of the external auditor to provide non-audit services:
• is only carried out in appropriate circumstances;
• is transparent; and
• does not impair the judgement or independence of the external auditor.
When assessing the non-audit services for approval, the Audit Committee will take the following into consideration:
• whether the skills and experience of the audit firm make it the most suitable supplier of the non-audit service;
• whether there are safeguards in place to ensure that there is no threat to the objectivity or independence in the conduct of the audit resulting from the provision of such services by the external auditor;
• the nature of the non-audit services, the related fee levels and the fee levels, individually and in aggregate, relative to the audit fee; and
• the criteria which govern the compensation of the individuals performing the audit.
KPMG also follows its own ethical guidelines and continually reviews its audit team to ensure that its independence is not compromised.
The Audit Committee has determined that it will review, not less than annually whether the incumbent auditor should remain in place or whether an auditor selection process should be initiated.
(ii) Internal controlThe Board is responsible for setting a system of internal controls for the Group and reviewing its effectiveness. Executive management is responsible for implementing and maintaining the system of controls. This system is intended to manage rather than eliminate the risk of not meeting the Group’s strategic objectives, whilst recognising that certain inherent risks may be outside the Group’s control. The Board recognises that any system of internal control can only seek to provide reasonable, not absolute, assurance against material misstatement or loss.
The Board delegates to the Audit Committee the review of the effectiveness of the Group’s internal controls and risk management systems. During the year, the Committee discharged this responsibility by:
• receiving and considering regular reports from the Risk and Internal Audit function on the status of internal control and risk management systems across the Group. The Committee also reviewed the department’s findings, annual plan and the resources available to it to perform its work;
• reviewing the external auditor’s management letters on internal financial control;
• seeking reports from senior management on the effectiveness of the management of key risk areas; and
• monitoring the adequacy and timeliness of management’s response to identified audit issues.
The Audit Committee receives regular reports from the Head of Risk and Internal Audit on any whistleblowing activity in respect of concerns expressed by colleagues about possible malpractice or wrongdoing. Whilst there were no significant concerns raised by colleagues, all actions required were discussed and agreed with the Committee.
The Audit Committee also reviews the progress of the Group’s systems and, in particular, it receives regular reports from a sub-committee of the Audit Committee which monitors the Group’s systems replacement programme.
Corporate governance report – continued

45Annual report and financial statements 2011/12
The Board confirms that, if significant weaknesses had been identified during this review, the Board would have taken the necessary steps to remedy them.
The Group’s internal controls over the financial reporting and consolidation processes are designed under the supervision of the Group Finance Director to provide reasonable assurance regarding the reliability of financial reporting, and the preparation and fair presentation of the Group’s published financial statements for external reporting purposes in accordance with International Financial Reporting Standards (IFRS).
Due to its inherent limitations, internal control over financial reporting cannot provide absolute assurance, and may not prevent or detect all misstatements, whether caused by error or fraud.
The Group’s internal control over financial reporting and the preparation of consolidated financial information includes policies and procedures that provide reasonable assurance that transactions have been recorded and presented accurately. Management regularly conducts reviews of the internal controls in place in respect of the processes of preparing consolidated financial information and financial reporting.
d) Corporate Compliance and Responsibility (CCR) Committee
The CCR Committee, chaired by a Non-Executive Director, Penny Hughes, reviews and oversees the development and implementation of policy in relation to health and safety, environmental, competitive and ethical compliance, corporate responsibility (CR), including the Group’s engagement with community organisations and charitable bodies, and governance and other reputational management issues.
The Committee’s remit does not cover operational matters, but it performs an oversight, monitoring and advisory role in relation to these key areas in the Company’s governance and development.
The Committee, which reports to the Board, met four times during the financial year and, as well as reviewing its terms of reference, it received presentations on the Group’s CR, health and safety, and competition compliance policies and procedures.
Shareholder relationsThe Chief Executive and the Group Finance Director meet regularly with analysts and institutional shareholders. The Investor Relations Director also carries out a regular programme of work that reports to the Board the views and information needs of institutional and major investors. This is part of the regular contact that the Group maintains with its institutional shareholders.
The Chairman regularly meets with major shareholders and he actively encourages major shareholders to contact him if they wish to discuss any aspect of the Group or its governance arrangements with him.
Additionally, the Group’s brokers sought independent feedback from investors following the 2010/11 annual and 2011/12 interim results. This feedback was reported to the Board.
All Directors, Executive and Non-Executive, attend the AGM unless unavoidably unable to do so. The Chairman and the Chairs of the Audit, Nomination, Remuneration and CCR Committees are available to answer any questions.
Code complianceThe Board is confident that its corporate governance policies and procedures are appropriate and that the Company is fully compliant with the Code. In line with the best practice recommendation set out in Code Principle B.7.1, all Directors will be submitted for re-election at its AGM.
Share capital and controlDetails relating to share capital and control are contained within the General information section on page 56.
Internal controlThe Board is satisfied that a continual process for identifying, evaluating and managing significant risks has been in place for the financial year and up to the date of this Annual report and financial statements. To date, no material financial problems have been identified that would affect the results reported in these financial statements.
CR assuranceOur CR programme is published in our 2011/12 Corporate responsibility review, produced concurrently with this report. The programme has been independently assured by Two Tomorrows under the AA1000AS (2008) framework. See www.morrisons.co.uk/cr
Business and strategy review
Perform
ance review
Governance
Financial statements
Investor information

46 Governance Wm Morrison Supermarkets PLC
Directors’ remuneration report
Major points to highlight from the 2011/12 Remuneration report are:
No major changes to remuneration structure for Executive Directors for 2012/13.
Dalton Philips’ base salary was increased from £800,000 to £850,000 with effect from 1 July 2011.
Following a review in February 2012, the Committee decided that there will be no base salary increases for Executive Directors in 2012/13.
Annual bonus payments for the year 2011/12 were 180% of salary for Dalton Philips and for Richard Pennycook, reflecting strong underlying profit before tax growth of 7.6% and achievement against the strategic scorecard and personal objectives. 50% of the bonus is deferred into shares to provide a long term link to value creation.
The LTIP for the 2009/12 cycle vested at 97% of maximum as a result of 51% EPS growth over the period and strong sales performance relative to our competitors.
A policy to adjust all outstanding long term incentive awards (including 2009/12 cycle) to remove the impact of the equity retirement programme.
A policy to adjust the 2011/12 annual bonus to remove the impact of the equity retirement programme.
Appointment of new independent advisers to the Remuneration Committee.
We pay for performance – our principles encourage a strong performance culture; emphasise long term shareholder value creation; and position pay competitively in relation to our major peers.
This structure means that a significant portion of remuneration is variable and tied to stretching performance targets.
Key performance indicators
2011/12 2010/11
PBT growth over one year 8.4% 1.9%EPS growth over one year 10.9% 12.5%Average share price growth 4.4% 6.6%Dividend payment 10.7p 9.6p
Pay for performance at MorrisonsThe Remuneration Committee is confident that executive remuneration is aligned to performance at Morrisons. The overall relationship is shown in the graph below.
Notes1. No Chief Executive bonus paid in year due to departure of Marc Bolland2. Dalton Philips appointed as Chief Executive during year (salary and bonus
shown on annualised basis for 2010/11)3. 2010/11 bonus opportunity increased to 200% to reflect competitive
benchmarks; and introduction of bonus deferral into shares to reinforce the linkage of pay to long term shareholder value
To ensure consistent comparison, the chart excludes LTIP awards as Dalton Philips has not been in role for a full LTIP cycle.
The Remuneration Committee believe that the current executive remuneration policy and the supporting reward structure provide clear alignment with the performance of Morrisons. To maintain this relationship, the Remuneration Committee constantly review Morrisons business priorities and the environment in which the Company operates.
Morrisons share priceThe below graph shows the increase in Morrisons share price over the last three years.
Based on average share price over a rolling three month period
How Executive Director pay is structured at MorrisonsThe major elements of executive pay are:
base salary; annual bonus plan, based on underlying profit before tax, strategic scorecard and personal objectives, of which 50% of any payment is deferred in shares for three years; and
long term incentive plan (LTIP) delivered in shares, based 75% on earnings per share (EPS) growth and 25% on like-for-like sales over three years.
Wm Morrison Supermarkets PLC
300320
280260240220200
Shar
e pr
ice
(p)
Jan 2009
Jul 2
011
Oct 2011
Jan 2012
Apr 2011
Jan 2011
Oct 2010
Jul 2
010
Apr 2010
Jan 2010
Oct 2009
Jul 2
009
Apr 2009
Share price performance over the last three years
PBT versus total remuneration (base salary + cash bonus) for Chief Executive and Group Finance Director during the period 2007/08 to 2011/12
PBT
£700£800
£600£500£400£300£200£100
£0
£3,500£3,000
£4,000£900 £4,500
£1,000 £5,000
£2,500£2,000£1,500£1,000£500£0
2007/08 2008/09 2009/10 2010/11 2011/12
PBT
(£m
)
Base
sal
ary
+ ca
sh b
onus
(£00
0)
Base salary + cash bonus
(1)(2)(3)
Remuneration summary

47Annual report and financial statements 2011/12
Directors’ remuneration reportIntroduction from the Chair
Dear ShareholderAs the new Chair of the Remuneration Committee, I am pleased to present the Directors’ remuneration report for the financial year ended 29 January 2012, for which we will be seeking approval from shareholders in June 2012. Since taking over this role, I have met with many of our largest shareholders and have been pleased to hear that they feel our incentive arrangements for the management team are consistent with our stated policy of reinforcing shareholder value creation.
Encouraging a strong performance culture, emphasising long term shareholder value creation and competitive positioning remain the key underlying principles of the Committee’s consideration of executive remuneration. As a Committee, we are mindful of our responsibilities and review executive remuneration arrangements with a critical eye in the context of the current environment.
We aim to put the Company in a position to attract, motivate and retain the highest calibre talent to deliver value for shareholders. Following extensive consultation with shareholders, we implemented bespoke retention arrangements for Richard Pennycook in March 2011. These were considered vital, following the departure of the former Chief Executive and were fully disclosed in last year’s Directors’ remuneration report.
During the year, we increased Dalton Philips’ base salary from £800,000 to £850,000 with effect from 1 July 2011. This was his first salary review since appointment in March 2010, at which time his salary was set at a conservative level against the market. The Committee decided that an increase was appropriate to reflect Dalton’s ongoing contribution to the success of the Company since his appointment. There will be no base salary increase for 2012/13.
Annual bonus payments for the year 2011/12 were 180% of salary for Dalton Philips and 180% of salary for Richard Pennycook, reflecting underlying profit growth of 7.6%. LTIP for the 2009/12 cycle vested at 97% of maximum, which also reflects the close link to earnings and sales growth over the past three years, which have been reflected in the increased share price despite continuing tough trading conditions.
We place a great deal of importance on performance-based pay and incentive arrangements are based on measures that support the creation of shareholder value by linking directly to our strategic objectives; driving the top line, increasing our efficiency and capturing growth. Short term incentives are based on a combination of underlying profit before tax targets, strategic corporate scorecard measures and personal objectives which align bonuses with key strategic objectives. Long term incentives are based on EPS and like-for-like sales growth to support a sustainable approach to growth. The mix of the total remuneration package and the use of stretching performance targets ensures that there is alignment between pay and performance.
The Committee considered the impact of the equity retirement programme on the 2011/12 Annual Bonus Plan and on outstanding LTIP awards where the targets had been agreed before the programme was announced. The Committee agreed to apply a consistent approach to all outstanding incentives and adjust actual vesting outcomes appropriately. Further details are included in the following pages of this Directors’ remuneration report.
In determining bonus payouts for 2011/12, the Committee agreed to exclude the impact of the equity retirement programme in assessing the extent to which the underlying profit before tax target had been met.
In respect of the 2009/12 LTIP, although the level of EPS growth was adjusted downwards to exclude the impact of the equity retirement programme, the EPS growth after adjustment remained above the level required to achieve full vesting.
There have been no significant changes to remuneration policy for 2012/13, although the Committee will review the LTIP performance measures in 2012/13 to ensure they remain closely aligned to our strategy as our business evolves, and we will liaise with major shareholders if the review suggests any significant changes are warranted.
Mark Gunter stepped down from the Board at the 2011 AGM, and Brian Flanagan and Paul Manduca stepped down as Non-Executive Directors during the year.
I would like to thank Paul Manduca, as former Chair of the Committee, for his contribution. I would also like to thank my fellow Committee members for their support as I take on this important responsibility.
Johanna WaterousChair of the Remuneration Committee
Johanna WaterousChair of the Remuneration Committee
Business and strategy review
Perform
ance review
Governance
Financial statements
Investor information

48 Governance Wm Morrison Supermarkets PLC
Directors’ remuneration report – continued
The Group is required to prepare a Directors’ remuneration report for the 52 weeks ended 29 January 2012 and put that report to a shareholder vote. A resolution to approve this report will be proposed at the AGM of the Company to be held on 14 June 2012.
The auditor is required to report on part of the Directors’ remuneration report and to state whether, in their opinion, that part of the report has been properly prepared in accordance with the Companies Act 2006 and Schedule 8 of the Large and Medium-Sized Companies and Groups (Accounts and Reports) Regulations 2008. The report has, therefore, been divided into separate sections for unaudited and audited information.
Unaudited informationRemuneration Committee: membership and remitDuring the year, the following individuals were members of the Remuneration Committee.
Membership
Name of Director From To
J Waterous(Chair from 10 March 2011)
1 Feb 2010 To date
P Manduca (Chair to 9 March 2011)
6 Sep 2005 9 Mar 2011
P Cox 1 Apr 2009 To dateB Flanagan 1 Jul 2005 9 Jun 2011I Gibson 1 Sep 2007 To dateP Hughes 1 Jan 2010 To dateN Robertson 1 Jul 2005 To date
The remit of the Committee covers the total remuneration of the Executive Directors and other senior managers comprising the Management Board. The full terms of reference for the Committee, which are reviewed annually, can be obtained from the Company Secretary and can be found on the Company’s website at www.morrisons.co.uk/corporate
The Committee has access to external advice as required. PricewaterhouseCoopers LLP was selected and appointed by the Committee to provide external advice on executive remuneration from October 2011 onwards. Prior to this, New Bridge Street (formerly known as Hewitt New Bridge Street) had been the Committee’s executive reward adviser. Pension Capital Strategies Limited (a member of the Jardine Lloyd Thompson Group) also provided advice in respect of pensions and Ashurst LLP provided legal advice to the Committee on senior executive contracts. PricewaterhouseCoopers LLP also provide a range of unrelated human resource consulting services and advice on tax and accounting. Pension Capital Strategies provide advice to management on relevant pension matters and Ashurst LLP provide other legal services to the Company.
The Chief Executive, the Group Human Resources Director, and other HR representatives are also invited to attend meetings (other than where their own remuneration is being discussed) by invitation. The Company Secretary acts as secretary to the Committee.
The Committee met on nine occasions during the year and the meeting attendance record is set out on page 43 within the Corporate governance report.
The Remuneration Committee addressed the following main issues during the year:
• consideration and approval of the bonus payments for Executive Directors and senior managers, and approval of associated share awards under the Deferred Share Bonus Plan;
• performance test for LTIP awards due to vest and approval of the resulting vesting of awards;
• setting annual incentive targets and ranges (including scorecard measures and personal objectives);
• awards made under the LTIP and approval of the performance condition;
• annual review of Executive Directors’ base salaries and Chairman’s fee review;
• approval of sharesave invitation, including assessment of ABI limits on share issue guidelines;
• consideration and approval of the restricted share plan award made to Richard Pennycook;
• a review of the base salary, annual bonus and LTIP framework for the Management Board, and approval of resulting changes in line with the reward policy;
• consideration and approval of a salary increase for the Chief Executive; and
• consideration of the impact of the equity retirement programme on existing incentive arrangements.
Remuneration policyThe Remuneration Committee remains of the view that the Company’s executive remuneration policies:
• should encourage a strong performance culture and emphasise long term shareholder value creation, with clear links between executive performance goals and business strategy; and
• need to be positioned competitively to enable it to attract, retain and motivate the best talent, which has been key to the Company’s success over the last few years and will be critical to its future performance.
To achieve this, the Committee aims to:
• position base salaries competitively;
• operate a competitive and stretching suite of annual and long term incentives, so that a substantial proportion of total remuneration is subject to performance and so that executives are aligned with shareholders through share awards and share ownership; and
• ensure that total remuneration packages are competitive, reward stretching performance and are aligned to the Company’s strategy.
In determining remuneration policy, the Remuneration Committee is mindful of environmental, social and governance concerns, and the approach to pay and conditions taken within the Group. The Committee seeks to ensure that remuneration arrangements do not encourage inappropriate behaviour.
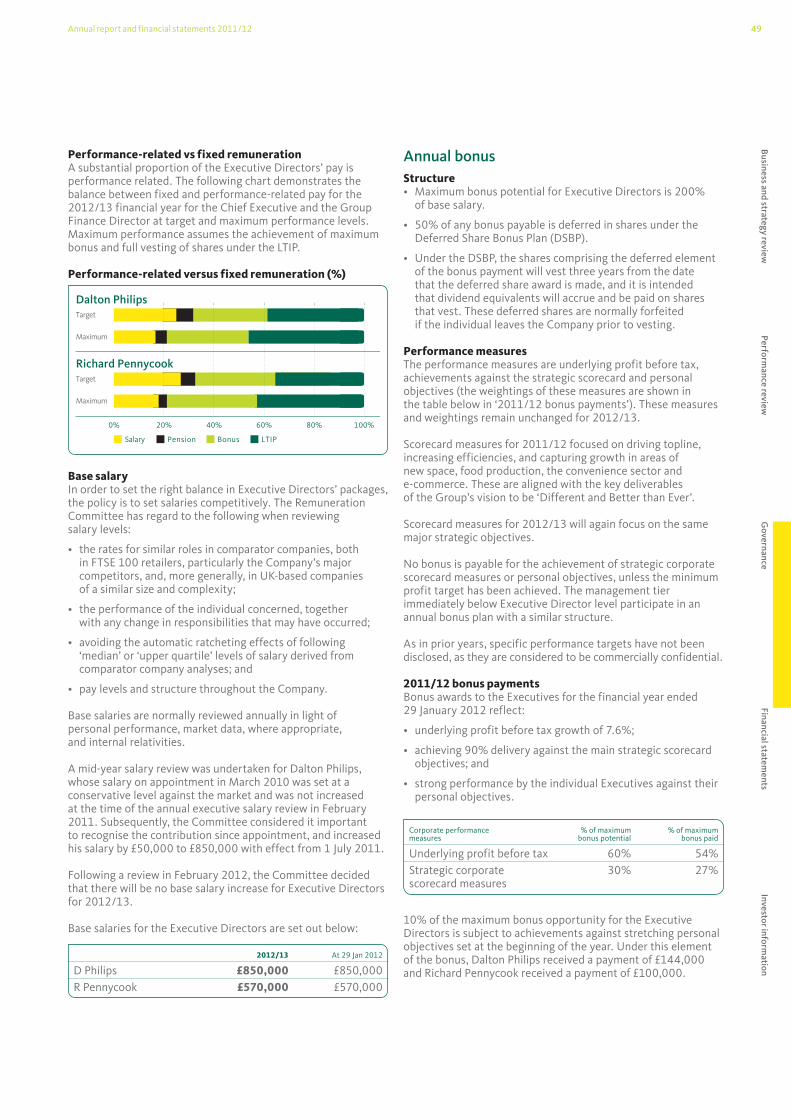
49Annual report and financial statements 2011/12
Performance-related vs fixed remunerationA substantial proportion of the Executive Directors’ pay is performance related. The following chart demonstrates the balance between fixed and performance-related pay for the 2012/13 financial year for the Chief Executive and the Group Finance Director at target and maximum performance levels. Maximum performance assumes the achievement of maximum bonus and full vesting of shares under the LTIP.
Performance-related versus fixed remuneration (%)
Salary Bonus LTIPPension
0% 100%80%60%40%20%
Target
Maximum
Dalton Philips
Target
Maximum
Richard Pennycook
Base salaryIn order to set the right balance in Executive Directors’ packages, the policy is to set salaries competitively. The Remuneration Committee has regard to the following when reviewing salary levels:
• the rates for similar roles in comparator companies, both in FTSE 100 retailers, particularly the Company’s major competitors, and, more generally, in UK-based companies of a similar size and complexity;
• the performance of the individual concerned, together with any change in responsibilities that may have occurred;
• avoiding the automatic ratcheting effects of following ‘median’ or ‘upper quartile’ levels of salary derived from comparator company analyses; and
• pay levels and structure throughout the Company.
Base salaries are normally reviewed annually in light of personal performance, market data, where appropriate, and internal relativities.
A mid-year salary review was undertaken for Dalton Philips, whose salary on appointment in March 2010 was set at a conservative level against the market and was not increased at the time of the annual executive salary review in February 2011. Subsequently, the Committee considered it important to recognise the contribution since appointment, and increased his salary by £50,000 to £850,000 with effect from 1 July 2011.
Following a review in February 2012, the Committee decided that there will be no base salary increase for Executive Directors for 2012/13.
Base salaries for the Executive Directors are set out below:
2012/13 At 29 Jan 2012
D Philips £850,000 £850,000R Pennycook £570,000 £570,000
Annual bonusStructure• Maximum bonus potential for Executive Directors is 200%
of base salary.
• 50% of any bonus payable is deferred in shares under the Deferred Share Bonus Plan (DSBP).
• Under the DSBP, the shares comprising the deferred element of the bonus payment will vest three years from the date that the deferred share award is made, and it is intended that dividend equivalents will accrue and be paid on shares that vest. These deferred shares are normally forfeited if the individual leaves the Company prior to vesting.
Performance measuresThe performance measures are underlying profit before tax, achievements against the strategic scorecard and personal objectives (the weightings of these measures are shown in the table below in ‘2011/12 bonus payments’). These measures and weightings remain unchanged for 2012/13.
Scorecard measures for 2011/12 focused on driving topline, increasing efficiencies, and capturing growth in areas of new space, food production, the convenience sector and e-commerce. These are aligned with the key deliverables of the Group’s vision to be ‘Different and Better than Ever’.
Scorecard measures for 2012/13 will again focus on the same major strategic objectives.
No bonus is payable for the achievement of strategic corporate scorecard measures or personal objectives, unless the minimum profit target has been achieved. The management tier immediately below Executive Director level participate in an annual bonus plan with a similar structure.
As in prior years, specific performance targets have not been disclosed, as they are considered to be commercially confidential.
2011/12 bonus paymentsBonus awards to the Executives for the financial year ended 29 January 2012 reflect:
• underlying profit before tax growth of 7.6%;
• achieving 90% delivery against the main strategic scorecard objectives; and
• strong performance by the individual Executives against their personal objectives.
Corporate performance measures
% of maximum bonus potential
% of maximum bonus paid
Underlying profit before tax 60% 54%Strategic corporate scorecard measures
30% 27%
10% of the maximum bonus opportunity for the Executive Directors is subject to achievements against stretching personal objectives set at the beginning of the year. Under this element of the bonus, Dalton Philips received a payment of £144,000 and Richard Pennycook received a payment of £100,000.
Business and strategy review
Perform
ance review
Governance
Financial statements
Investor information

50 Governance Wm Morrison Supermarkets PLC
• For the 2012/15 LTIP, the measures and weightings have remained the same. However, in respect of the EPS measure, the Committee has agreed a more stretching performance requirement for the maximum award to vest at growth of RPI +12% p.a. The Committee has considered market expectations, strategic plan and general economic conditions in determining EPS targets.
Measure Proportion of award
Target1
Underlying earnings per share (EPS) growth
75% of maximum award
• 25% of EPS element vests at growth of RPI + 4% p.a.
• 35% of EPS element vests at growth of RPI + 5% p.a.
• 90% of EPS element vests at growth of RPI + 9% p.a.
• 100% of EPS element vests at growth of RPI + 12% p.a.
Like-for-like non-fuel sales growth relative to the Institute of Grocery Distribution (IGD) index
25% of maximumaward
• 25% of sales growth element vests for matching the index
• 100% of sales growth element vests for outperforming the index by at least 2% over the three year period
1 Vesting is on a straight line basis between each of the above points.
• To guard against the possibility of individuals receiving value from the LTIP as a result of sales targets being hit but EPS targets being missed, no awards can vest under the sales targets, unless the minimum EPS target has been met.
• Underlying EPS will be as referred to in note 9 of the Group financial statements. The Group will report EPS in this way in its Annual report and financial statements.
• Like-for-like sales are defined as the reported sales from existing space, less total fuel sales (measured on a consistent basis to the IGD index).
The performance measures were selected as they provide direct alignment between performance against the objectives set out in the Group’s strategy and the outcomes under the plan. This provides participants with a clear line of sight between performance and their reward.
Vesting outcomesPartial vesting of the award granted in 2008/09 occurred on 14 April 2011. Following the end of the 2010/11 financial year, the Remuneration Committee was satisfied that the EPS performance (based on our audited figures) of 23.0p delivered approximately 90% vesting of the EPS element and that the sales measure was met in full. Approximately 93% of the total 2008 LTIP award therefore vested.
Directors’ remuneration report – continued
In deciding the actual level of bonus payout, the Committee also considered the impact of the equity retirement programme. As the cost of the equity retirement programme was not included in the original targets, it was agreed to exclude the impact of the programme in assessing the extent to which the underlying profit before tax target had been met. This is in line with the Committee’s policy to apply a consistent approach to all outstanding incentive awards. As a result, the 2011/12 interest cost of £8m relating to the programme was added back to underlying profit for the purpose of bonus assessment.
Bonus payments for the financial year ending 29 January 2012 therefore were 180% of base salary for Dalton Philips and 180% of base salary for Richard Pennycook. Half of the bonus is awarded as deferred shares under the DSBP. Details of the actual cash amounts paid for 2011/12 are set out in the Directors’ emoluments table on page 53.
Long term incentive planThe long term incentive plan is designed to reward management for achieving the Group’s strategic objectives and to provide an appropriate level of long term performance pay. Each year, participants receive conditional awards of shares in the Group, which will normally vest three years after they are awarded subject to the satisfaction of performance conditions, measured over a three year period, and continued service. The plan’s individual annual limit is 300% of salary (face value of shares).
Award levels• An award of shares worth 275% of salary was made
to Dalton Philips and an award worth 240% of salary was made to Richard Pennycook, both in April 2011.
• 2012/13 awards will be made at the same levels.
• For tiers below Executive Director, awards are made at lower levels dependent upon seniority.
• In 2011/12, awards were made to 1,021 participants, including Executive Directors, their direct reports and management tiers below (including supermarket store managers).
Performance measures• Performance under the plan is measured over three years.
• For the 2009/12, 2010/13 and 2011/14 LTIP awards, the following performance conditions apply:
Measure Proportion of award
Target1
Underlying earnings per share (EPS) growth
75% of maximum award
• 25% of EPS element vests at growth of RPI + 4% p.a.
• 100% of EPS element vests at growth of RPI + 10% p.a.
Like-for-like non-fuel sales growth relative to the Institute of Grocery Distribution (IGD) index
25% of maximumaward
• 25% of sales growth element vests for matching the index
• 100% of sales growth element vests for outperforming the index by at least 2% over the three year period
1 Vesting is on a straight line basis between each of the above points.

51Annual report and financial statements 2011/12
The awards granted in 2009/10 will vest in 2012/13 at 97% of the maximum award. The EPS measure was met in full with growth over three years of RPI + 12.4% p.a. (based on an EPS of 25.11p after a downward adjustment to our audited figures to reflect the impact of the equity retirement programme as described below). This compared to the stretch target of RPI + 10% p.a. Strong like-for-like sales outperformed the IGD index by 1.7%, resulting in vesting of 88% of maximum for this element.
The Committee considered the impact of the equity retirement programme on the EPS performance targets for outstanding incentives where those performance targets were agreed by the Committee before the programme was announced. The Committee agreed in principle to adjust the vesting outcome of outstanding LTIP awards so as to exclude the impact of the programme and therefore any resulting enhancement of EPS. This will mean that the vesting calculation of any LTIP vesting in 2012, 2013 or 2014 will reflect a reduction for any EPS enhancement which is directly attributable to the equity retirement programme. In respect of the 2009/12 LTIP, although the level of EPS growth was adjusted downwards to exclude the impact of the equity retirement programme, the EPS growth after adjustments remained above the level required to achieve full vesting on the EPS element of the performance condition.
Restricted share awards Dalton Philips and Richard Pennycook hold awards over restricted shares which were made in March 2010 and March 2011, respectively. Full details of these awards were set out in prior year reports.
• Dalton Philips holds an award over 120,965 shares which was made to facilitate his recruitment, compensating him for share awards forfeited on leaving his previous employer. This award will vest on 25 March 2012 subject to continued employment (designed to replace a restricted share award where vesting was dependent upon continued employment but with no performance conditions).
• In March 2011, an award over 456,037 restricted shares (worth £1,250,000, based on the dealing day before the grant date) was made to Richard Pennycook, designed to secure his services as Group Finance Director. The award will vest on the second anniversary of grant, subject to continued employment and the Group’s underlying EPS growth meeting or exceeding the growth in the RPI over the period to the end of the 2012/13 financial year. In line with the Committee’s decisions to adjust outstanding incentives for the impact of the equity retirement programme, the Committee will adjust this award to reflect the impact of the equity retirement programme at the end of the performance period and report any adjustment in the relevant Directors’ remuneration report.
All employee sharesave schemeThe Group operates a sharesave scheme which is approved by HM Revenue & Customs. All eligible employees, including Executive Directors, may be invited to participate on similar terms to save up to a maximum of £250 each month for a fixed period of three years. At the end of the savings period, individuals may use their savings plus a tax-free bonus to buy ordinary shares in the Company at a discount capped at up to 20% of the market price, set at the relevant launch date. A grant was made under the plan during 2011/12 at the maximum 20% discount, details of which are set out in note 26 of the Group financial statements.
Share ownership guidelinesThe Group operates share ownership guidelines for Executive Directors. Under the guidelines, Executive Directors are expected to retain 50% of vested share awards (net of tax), including shares from the deferred element of the annual bonus, until such time as they own shares worth 100% of their salary, after which point they will be expected to retain, as a minimum, this level of holding. The Remuneration Committee will review Executive Directors’ shareholdings annually in the context of this policy.
The table below sets out the Executive Directors’ shareholding as at 29 January 2012. Outstanding awards under the long term incentive plan, the deferred bonus share plan and restricted share awards are not included in the Directors’ shareholding figures.
Dalton PhilipsBase salary1 £850,000Shareholding as at 29 January 2012 188,183Value of shareholding2 £550,623 Percentage of base salary 65%Shareholding requirement 100%
Richard PennycookBase salary1 £570,000Shareholding as at 29 January 2012 441,440 Value of shareholding2 £1,291,653Percentage of base salary 226%Shareholding requirement 100%
Notes1 Base salary is as at 29 January 20122 Value of shareholding calculated using the closing mid-market price on the last
trading day of the financial year ending 29 January 2012 of £2.93
Richard Pennycook exceeded the shareholding requirement at 29 January 2012. Dalton Philips has fully complied with the shareholding requirement in respect of the one share award that has vested since he was appointed in March 2010.
Pension arrangementsDalton Philips received a salary supplement equal to 25% of base salary during the year.
Richard Pennycook and Mark Gunter participate in the Morrisons defined benefit pension scheme. Their pension entitlement accrues at the rate of a maximum of 3% for each year under career average revalued earnings (CARE). Accrued benefits, including those preserved from the former final salary arrangement, increase in line with the RPI to the date of leaving the Group.
The maximum pension of two-thirds pensionable pay at age 62 has been retained for CARE accrual. Pensionable pay for the Executive Directors is annual salary as at 6 April each year. Mark Gunter (who stepped down from the Board on 9 June 2011) and Richard Pennycook are both subject to the Company’s maximum earnings limit, which is currently £129,600 and is reviewed annually from 1 April in line with RPI. Both received a cash supplement of 15% of basic salary in excess of the Company maximum earnings limit in 2011/12.
Business and strategy review
Perform
ance review
Governance
Financial statements
Investor information
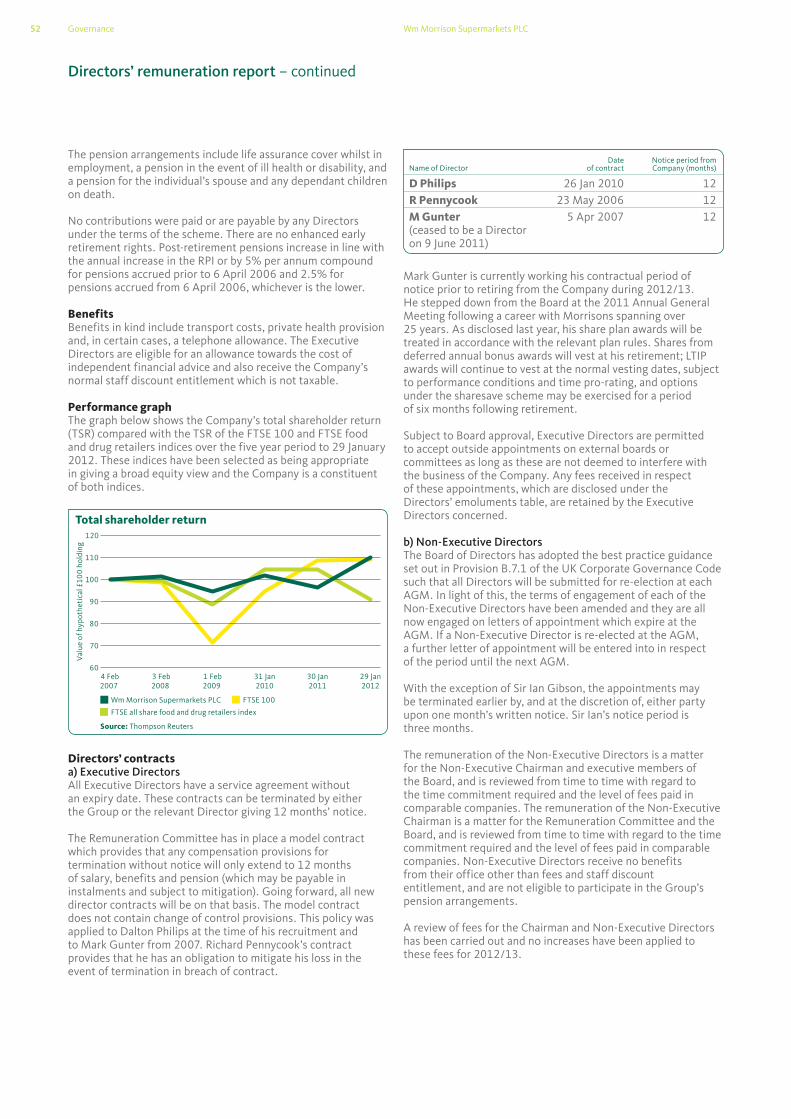
52 Governance Wm Morrison Supermarkets PLC
The pension arrangements include life assurance cover whilst in employment, a pension in the event of ill health or disability, and a pension for the individual’s spouse and any dependant children on death.
No contributions were paid or are payable by any Directors under the terms of the scheme. There are no enhanced early retirement rights. Post-retirement pensions increase in line with the annual increase in the RPI or by 5% per annum compound for pensions accrued prior to 6 April 2006 and 2.5% for pensions accrued from 6 April 2006, whichever is the lower.
BenefitsBenefits in kind include transport costs, private health provision and, in certain cases, a telephone allowance. The Executive Directors are eligible for an allowance towards the cost of independent financial advice and also receive the Company’s normal staff discount entitlement which is not taxable.
Performance graphThe graph below shows the Company’s total shareholder return (TSR) compared with the TSR of the FTSE 100 and FTSE food and drug retailers indices over the five year period to 29 January 2012. These indices have been selected as being appropriate in giving a broad equity view and the Company is a constituent of both indices.
Directors’ contractsa) Executive DirectorsAll Executive Directors have a service agreement without an expiry date. These contracts can be terminated by either the Group or the relevant Director giving 12 months’ notice.
The Remuneration Committee has in place a model contract which provides that any compensation provisions for termination without notice will only extend to 12 months of salary, benefits and pension (which may be payable in instalments and subject to mitigation). Going forward, all new director contracts will be on that basis. The model contract does not contain change of control provisions. This policy was applied to Dalton Philips at the time of his recruitment and to Mark Gunter from 2007. Richard Pennycook’s contract provides that he has an obligation to mitigate his loss in the event of termination in breach of contract.
Name of DirectorDate
of contractNotice period from Company (months)
D Philips 26 Jan 2010 12R Pennycook 23 May 2006 12M Gunter(ceased to be a Director on 9 June 2011)
5 Apr 2007 12
Mark Gunter is currently working his contractual period of notice prior to retiring from the Company during 2012/13. He stepped down from the Board at the 2011 Annual General Meeting following a career with Morrisons spanning over 25 years. As disclosed last year, his share plan awards will be treated in accordance with the relevant plan rules. Shares from deferred annual bonus awards will vest at his retirement; LTIP awards will continue to vest at the normal vesting dates, subject to performance conditions and time pro-rating, and options under the sharesave scheme may be exercised for a period of six months following retirement.
Subject to Board approval, Executive Directors are permitted to accept outside appointments on external boards or committees as long as these are not deemed to interfere with the business of the Company. Any fees received in respect of these appointments, which are disclosed under the Directors’ emoluments table, are retained by the Executive Directors concerned.
b) Non-Executive DirectorsThe Board of Directors has adopted the best practice guidance set out in Provision B.7.1 of the UK Corporate Governance Code such that all Directors will be submitted for re-election at each AGM. In light of this, the terms of engagement of each of the Non-Executive Directors have been amended and they are all now engaged on letters of appointment which expire at the AGM. If a Non-Executive Director is re-elected at the AGM, a further letter of appointment will be entered into in respect of the period until the next AGM.
With the exception of Sir Ian Gibson, the appointments may be terminated earlier by, and at the discretion of, either party upon one month’s written notice. Sir Ian’s notice period is three months.
The remuneration of the Non-Executive Directors is a matter for the Non-Executive Chairman and executive members of the Board, and is reviewed from time to time with regard to the time commitment required and the level of fees paid in comparable companies. The remuneration of the Non-Executive Chairman is a matter for the Remuneration Committee and the Board, and is reviewed from time to time with regard to the time commitment required and the level of fees paid in comparable companies. Non-Executive Directors receive no benefits from their office other than fees and staff discount entitlement, and are not eligible to participate in the Group’s pension arrangements.
A review of fees for the Chairman and Non-Executive Directors has been carried out and no increases have been applied to these fees for 2012/13.
110
120
100
90
80
70
60
Val
ue o
f hyp
othe
tica
l £10
0 ho
ldin
g
4 Feb2007
3 Feb2008
Wm Morrison Supermarkets PLC FTSE 100
FTSE all share food and drug retailers index
Total shareholder return
Source: Thompson Reuters
1 Feb2009
31 Jan2010
30 Jan2011
29 Jan2012
Directors’ remuneration report – continued

53Annual report and financial statements 2011/12
Current fee levels are as follows:
NameBase
£000
Committee Chairmanship
£000
Senior Independent Director
£000Total £000
I Gibson 375 – – 375P Cox 60 20 – 80P Hughes 60 10 – 70N Robertson 60 – 20 80J Waterous 60 20 – 80
Audited informationDirectors’ emoluments and pension entitlementsThe emoluments of the Directors were as follows:
Name
Directors’ salaries/fees
£000
Benefitsin kind4
£000
Pensionsupplement
£000
Annualcash bonus5
£000
Total year to29 Jan 2012
£000
Total year to30 Jan 2011
£000
Non-Executive ChairmanI Gibson 375 – – – 375 344Executive DirectorsD Philips 829 26 207 720 1,782 1,557R Pennycook 570 30 66 512 1,178 981M Gunter1 195 12 22 243 472 976Non-Executive DirectorsP Cox 80 – – – 80 73B Flanagan2 22 – – – 22 60P Hughes 69 – – – 69 60P Manduca2 11 – – – 11 93N Robertson 79 – – – 79 70J Waterous 78 – – – 78 60Former Directors M Bolland3 – – – – – 304M Jones3 – – – – – 492Total 2,308 68 295 1,475 4,146 5,070
1 On 9 June 2011, Mark Gunter stepped down from the Board. During his subsequent contractual period of notice, Mr Gunter’s base salary, pension and benefit arrangements remain unchanged. Mr Gunter’s salary, benefits in kind and pension supplement have been pro-rated in the table above to reflect his time during the year as an Executive Director. Mr Gunter’s bonus was adjusted to reflect that he was not in role for the full year. The bonus figure in the above table is the total cash bonus payment Mr Gunter received for the 2011/12 year.
2 Paul Manduca resigned from the Board with effect from 9 March 2011 and Brian Flanagan resigned from the Board with effect from 9 June 2011.3 Marc Bolland resigned from the Board with effect from 1 February 2010. On 9 September 2010, Martyn Jones stepped down from the Board following his
appointment as Group Corporate Services Director. Mr Jones has received no additional payments as a consequence of this change and his ongoing remuneration package reflects his new below-Board responsibilities.
4 Details of benefits in kind are set out on page 52 of this Directors’ remuneration report and comprise transport costs, private health provision and, in certain cases, a telephone allowance.
5 For all Executive Directors, 50% of the total bonus earned is paid in cash, as shown in the table with 50% deferred in shares for three years under the Deferred Share Bonus Plan. Details of this plan are described under the annual bonus section on page 49 of this Directors’ remuneration report. The deferred share awards in respect of the 2011/12 annual bonus will be granted in March 2012 and details of the shares comprising these awards will be included in next year’s Directors’ remuneration report. Further details of the bonus payments to the Executive Directors are set out on page 49 of this Directors’ remuneration report.
In addition to the emoluments detailed above, a charge of £3.9m has been made to the income statement in respect of Directors’ share-based payments. None of the Directors has a material interest in any contract significant to the Group’s business. For the period 2011/12, Richard Pennycook received cash fees from Persimmon Plc of £58,800 for his role as Non-Executive Director.
The following Directors had accrued entitlements under defined benefit pension schemes as follows:
Name
Accrued pension entitlement at
30 Jan 2011 £000
Accrued pension entitlement at
29 Jan 2012 £000
Additional pension earned during
the period £000
Additional pension earned during the
period above inflation
£000
Transfer value of accrued pension at
30 Jan 2011 £000
Transfer value of accrued pension at
29 Jan 2012 £000
Transfer value of increase in accrued pension during the
period above inflation
£000
Executive DirectorsR Pennycook 22 27 5 4 245 316 46M Gunter 58 621 4 1 858 8981 15Total 80 89 9 5 1,103 1,214 61
1As at 9 June 2011.
Business and strategy review
Perform
ance review
Governance
Financial statements
Investor information

54 Governance Wm Morrison Supermarkets PLC
Share awardsAs at 29 January 2012, Directors’ interests under the Long Term Incentive Plan (LTIP), shares awarded under the Deferred Share Bonus Plan (DSBP), and restricted share awards were as follows:
NoteDate
of grant
Share price on date awards
grantedAt
30 Jan 2011Shares
grantedShareslapsed
Sharesvested5
At 29 Jan 2012
Share price at date awards
vested5Vesting
date
D PhilipsRestricted Share Award
4 31 Mar 2010
293.50p 120,965 – – – 120,965 – 25 Mar 2012
LTIP 2 22 Apr 2010
296.80p 744,148 – – – 744,148 – 22 Apr 2013
LTIP 2 18 Apr 2011
284.50p – 772,309 – – 772,309 – 18 Apr 2014
DSBP 3 28 Mar 2011
270.20p – 173,517 – – 173,517 – 28 Mar 2014
865,113 945,826 – – 1,810,939R PennycookLTIP 1 14 Apr
2008277.25p 374,410 – 26,995 347,415 – 284.78p 14 Apr
2011LTIP 2 9 Apr
2009260.25p 415,562 – – – 415,562 – 9 Apr
2012LTIP 2 29 Jan
2010289.10p 184,770 – – – 184,770 – 29 Jan
2013LTIP 2 22 Apr
2010296.80p 438,979 – – – 438,979 – 22 Apr
2013LTIP 2 18 Apr
2011284.50p – 480,235 – – 480,235 – 18 Apr
2014DSBP 3 28 Mar
2011270.20p – 123,409 – – 123,409 – 28 Mar
2014Restricted Share Award
4 16 Mar 2011
272.20p – 456,037 – – 456,037 – 16 Mar 2013
1,413,721 1,059,681 26,995 347,415 2,098,992M GunterLTIP 1 14 Apr
2008277.25p 390,010 – 28,120 361,890 – 284.78p 14 Apr
2011LTIP 2 9 Apr
2009260.25p 415,562 – – – 415,562 – 9 Apr
2012LTIP 2 29 Jan
2010289.10p 184,770 – – – 184,770 – 29 Jan
2013LTIP 2 22 Apr
2010296.80p 438,979 – – – 438,979 – 22 Apr
2013DSBP 3 28 Mar
2011270.20p – 123,017 – – 123,017 – 28 Mar
20141,429,321 123,017 28,120 361,890 1,162,328
1 LTIP awards granted in 2008 were subject to three year performance targets, measured to 30 January 2011. Performance measures were: 75% based on EPS (25% of the EPS related component of the award will vest if the Group’s EPS in 2010/11 is 19.6p per share rising on a pro-rata basis until 100% vests for an EPS of 23.5p per share) and 25% based on like-for-like non-fuel sales growth (25% of the sales growth related component will vest if the Group’s like-for-like non-fuel sales grow by 3% per annum compound rising on a pro-rata basis until there is 100% vesting for growth of 5% per annum compound). As noted on page 50, 93% of the shares comprising the awards granted in 2008 vested during 2011. Recipients also received a cash sum as payment for the dividends that would have been paid on the vested shares between the grant and vesting dates. Richard Pennycook received £67,242 and Mark Gunter received £70,044.
2 LTIP awards granted in 2009, 2010 and 2011 are subject to three year performance targets. Performance measures are: 75% based on EPS and 25% based on like-for-like non-fuel sales growth against the IGD Index. 25% of the EPS related component of the award will vest if the Group’s underlying EPS grows in line with the growth in the RPI plus an average of 4% per annum, rising on a pro-rata basis until 100% vests for outperforming the Index by at least 10% per annum over three years. 25% of the sales growth related component will vest if the Group’s like-for-like non-fuel sales match the IGD Index, rising on a pro-rata basis until 100% vests for outperforming the Index by at least 2% over three years. No awards can vest under the sales targets unless the threshold EPS target has been met. As noted on page 51, 97% of the 2009 LTIP award will vest on 9 April 2012.
3 Shares awarded under the DSBP, details of which are set out on page 49 of this Directors’ remuneration report. Awards under the DSBP will ordinarily vest three years after the date of award, subject to continued employment. No other performance conditions apply. The number of shares comprising each amount is determined using the average share price for the five dealing days immediately proceeding the grant date.
4 Further details of the Restricted Share Awards granted to Dalton Philips and Richard Pennycook are set out on page 51 of this Directors’ remuneration report. 5 The monetary value of awards that have vested will be calculated by multiplying the relevant number of shares by the market price at the date of vesting.
Directors’ remuneration report – continued

55Annual report and financial statements 2011/12
Share optionsOptions granted to Directors to acquire ordinary shares in the Company under the sharesave scheme are as follows:
Number of options during the 52 weeks ended 29 Jan 2012 Exercisable
Date of grant
At 31 Jan 2011 Granted Exercised Lapsed
At 29 Jan 2012
Exercise price
Market price on day of exercise
Gain on exercise
£000 From To
D Philips17 May 2011 – 3,958 – – 3,958 228p – – 1 Jul
20141 Jan 2015
– 3,958 – – 3,958 –R Pennycook17 May 2011 – 3,958 – – 3,958 228p – – 1 Jul
20141 Jan 2015
– 3,958 – – 3,958 –M Gunter14 May 2009 4,621 – – – 4,621 198p – – 1 Jul
20121 Jan 2013
4,621 – – – 4,621 –
The ordinary share mid-market price ranged from 266.5p to 328.0p and averaged 295.2p during the period. The price on 29 January 2012 was 292.6p, compared to 266.5p on 31 January 2011.
Dilution and share usageAwards under the Group’s share option scheme (under which no options remain outstanding) and the SAYE scheme are satisfied by the issue of new shares within the limits agreed by shareholders when the plans were approved. These limits comply with the Association of British Insurers’ guidelines restricting dilution from employee share plans. The overall limits under the guidelines are that no more than 10% of a Group’s issued share capital may be used in any ten year period. Within the 10% limit, up to 5% may be used for discretionary share plans. As at 29 January 2012, the Group’s share usage against these limits was 5.2% and 1.18%, respectively.
It is currently intended that awards made under the LTIP will be satisfied by market purchased shares which are held in an Employee Benefit Trust. Market purchase shares will also be used to satisfy awards made under the Deferred Share Bonus Plan and restricted share plans.
Directors’ interestsThe beneficial interests of the Directors and their families in the shares of the Company were as follows:
29 Jan 2012 ordinary shares
30 Jan 2011 ordinary shares
I Gibson 108,055 108,055D Philips 188,183 188,183R Pennycook 441,440 275,043P Cox – –P Hughes – –N Robertson – –J Waterous 6,716 6,716
There were no changes in the above interests in the period from 29 January 2012 to 7 March 2012.
ApprovalThis report, in its entirety, has been approved by the Remuneration Committee and the Board of Directors, and signed on its behalf by
Johanna WaterousChair of the Remuneration Committee7 March 2012
Business and strategy review
Perform
ance review
Governance
Financial statements
Investor information

56 Wm Morrison Supermarkets PLCGovernance
The Directors’ report and business reviewPages 2 to 59, inclusive, of this Annual report and financial statements consist of a Directors’ report and business review that has been drawn up and presented in accordance with, and in reliance on, English company law. The liabilities of the Directors in connection with that Directors’ report and business review shall be subject to the limitations and restrictions provided by the Companies Act 2006.
Forward-looking statementsThe Directors’ report and business review is prepared for the members of the Company and should not be relied upon by any other party or for any other purpose. Where the Directors’ report and business review includes forward-looking statements, these are made by the Directors in good faith based on the information available to them at the time of their approval of this report. Consequently, such statements should be treated with caution due to the inherent uncertainties, including both economic and business risk factors, underlying such forward-looking statements and information.
Result and dividendThe profit for the period after taxation attributable to the owners of the Company amounted to £690m (2010/11: £632m). The Directors have declared and recommend the following dividends:
£m
Paid interim dividend of 3.17p per share (2010/11: 1.23p)
81
Recommended final dividend of 7.53p per share (2010/11: 8.37p)
191
The final dividend, if approved by shareholders at the Annual General Meeting (AGM), is to be paid on 20 June 2012 to ordinary shareholders on the register of members at close of business on 18 May 2012. If the final dividend is approved by shareholders, the total ordinary dividend for the year will be 10.7p per share.
AuditorA resolution to re-appoint KPMG Audit Plc as auditor and a separate resolution to authorise the Directors to set their remuneration is to be proposed at the forthcoming AGM.
Annual General MeetingThe notice of the 2012 AGM of the Company (to be held at the Company’s headquarters at Gain Lane in Bradford on 14 June 2012) is to be sent to shareholders with an accompanying explanatory letter from the Chairman. The Directors believe each of the resolutions to be proposed at the AGM are in the best interests of the Group and recommend shareholders to vote in favour of each of them. Shareholders will also receive notification of the availability of the results on the Group’s website, unless they have positively elected to receive a printed version of the results.
Share capitalThe authorised and called-up share capital of the Company, together with details of shares allotted during the year, are shown in note 22 of the Group financial statements.
At the AGM of the Company held in 2011, a special resolution was passed to renew the authority given at the AGM held in June 2010 for the purchase by the Company of up to 263,378,576
ordinary shares representing approximately 10% of the issued ordinary share capital at that time. This authority remained valid on 29 January 2012. During the period, the Company purchased 125,699,939 of its own shares pursuant to that authority, which will expire at the close of the 2012 AGM.
In addition, 245,378 ordinary shares were issued during the period to employees exercising share options.
Borrowing powersThe Articles of Association of the Company restrict the borrowings of the Company and its subsidiary undertakings to a maximum amount equal to twice the share capital and consolidated reserves.
Substantial shareholdingsAs at 7 March 2012, the Company has been notified by the following shareholders (excluding Directors) that they have interests in 3% or more of the issued share capital of the Company:
Number of shares % of holding
Black Rock Inc 265,248,903 10.60Investco 133,357,656 5.33Brandes Investment Partners LP 132,155,077 5.28Ameriprise Financial Inc 131,284,252 5.25Walter Scott & Partners Ltd 107,775,155 4.31Legal & General Group Plc 104,976,462 4.19Zurich Financial Services 81,286,130 3.25
The number of shares appearing above is that appearing in the relevant notification to the Company. The percentage appearing above is the percentage that number represents of the issued share capital of the Company as at 7 March 2012.
Relating to beneficial owners of shares with ‘information rights’Beneficial owners of shares who have been nominated by the registered holder of those shares to receive information rights under section 146 of the Companies Act 2006 are required to direct all communications to the registered holder of their shares rather than to the Company’s registrar, Capita Registrars, or to the Group directly.
DirectorsThe current Directors of the Group and their biographies are shown on pages 38 and 39. Paul Manduca retired from the Board on 9 March 2011. Brian Flanagan and Mark Gunter retired from the Board at the AGM on 9 June 2011.
In line with the best practice guidance of Provision B.7.1 of the UK Corporate Governance Code, the Board has resolved that all Directors will submit themselves for re-election annually. Accordingly, all of the current Directors, being eligible, will offer themselves for re-election at the 2012 AGM.
The interests of the Executive and Non-Executive Directors of the Company and their immediate families in the shares of the Company, along with share options, are contained in the Directors’ remuneration report set out on pages 46 to 55.
At no time during the year did any of the Directors have a material interest in any significant contract with the Company or any of its subsidiaries.
General information

57Annual report and financial statements 2011/12
Employee relationsMorrisons is an equal opportunities employer. Equal opportunities are offered to all regardless of race, colour, nationality, ethnic origin, sex (including gender reassignment), marital or civil partnership status, disability, religion or belief, sexual orientation, age or trade union membership.
The Group gives full and fair consideration to applications for employment made by people with disabilities. The policy is to offer equal opportunity to all disabled candidates and employees who have a disability or become disabled in any way during the course of their employment. A full assessment of the individual’s needs is undertaken and reasonable adjustments are made to the work environment or practices in order to assist those with disabilities.
All candidates and employees are treated equally in respect of recruitment, promotion, training, pay and other employment policies and conditions. All decisions are based on relevant merits and abilities.
Political and charitable donationsDuring the period, the Group made charitable donations amounting to £0.1m (2010/11: £0.1m). The donations were mainly small donations to support local communities. In addition, the Group supported various charities and, in the year, over £2.3m (2010/11: £1.3m) was raised by customers and colleagues for the Charity of the Year. No political donations were made, which is Group policy.
Disclosure of information to the auditorThe Directors who held office at the date of approval of this Directors’ report confirm that, so far as they are each aware, there is no relevant audit information of which the Group’s auditor is unaware; and each Director has taken all steps that he or she ought to have taken as a Director to make himself or herself aware of any relevant audit information and to establish that the Group’s auditor is aware of that information.
Going concernThe Directors’ assessment of the Group and the Company’s ability to continue as a going concern has taken into consideration the effect that the current economic climate has on the Group.
The Group’s ability to borrow cash has not been adversely affected by the continuing lack of liquidity in the financial markets and the Group has negotiated, and has available to it, committed, competitive facilities that will meet the Group’s needs in the short and medium term.
The principal risks that the Group is challenged with have been set out on page 28, along with how the Directors mitigate these risks in the current economic climate.
After reviewing the Group’s financial forecasts, including an assessment of working capital and other medium term plans, the Directors are confident that the Company and the Group have adequate financial resources available to continue in operational existence for the foreseeable future. The going concern basis has continued to be adopted in the preparation of the financial statements.
Payment to creditorsSupplier credit is an important factor in the success of the business. It is Group policy to ensure all payments are made within mutually agreed credit terms. Where disputes arise, the Group attempts to sort these out promptly and amicably to ensure delays in payment are kept to a minimum. Trade creditors for the Group at the financial year end represented 30 days of purchases (2010/11: 32 days).
Groceries Supply Code of PracticeThe Groceries Supply Code of Practice (GSCOP) came into effect on 4 February 2010 and applies to all grocery retailers with an annual turnover in excess of £1bn.
The Group undertook a number of measures to ensure compliance before commencement, including a Code Compliance Officer (CCO), amending our standard terms and conditions of purchase to incorporate the Code, and undertaking a full training regime for our buyers and associated supporting colleagues. Over the last year, we built on our initial work by undertaking a full retraining programme for all relevant colleagues and have had all of our supporting processes reviewed by our internal audit team.
Alleged breaches are dealt with in accordance with GSCOP and escalated internally up to, and including, the CCO, where required. These matters are reported to both our Management Board and CCR Committee.
Since the GSCOP came into effect, we have successfully worked with suppliers to resolve disputes that have arisen with reference to its provisions. Details of such disputes have been reported to the Office of Fair Trading (OFT) periodically on request as part of the OFT’s monitoring. No matters that have arisen during our reporting period have progressed to arbitration.
Health and safety policy It is the Group’s intention, so far as is reasonably practicable, to ensure the health, safety and welfare of all its employees, customers and visitors to its premises. In order to achieve this, a comprehensive health and safety manual is in place for each division of the Company and subsidiary companies within the Group. Each health and safety manual contains the policy and procedures for complying with the Health and Safety at Work Act 1974, including the provision, based on risk assessment, of safe working practices for all work activities across the Group. The Group’s health and safety policy is approved by the Management Board. The Group has adopted the national targets set by the Health and Safety Commission for the reduction of workplace accidents and work-related ill health, and is on course to meet or exceed these targets. Health and safety performance is monitored to ensure continuous improvement in all areas.
Additional shareholder informationAdditional information for shareholders is required by the implementation of the EU Takeover Directive into UK law.
Pursuant to section 992 of the Companies Act 2006, the Company is required to disclose certain additional information. Such disclosures, which are not covered elsewhere in this report, include the following paragraphs. The disclosures set out below are in some cases a summary of the relevant provisions of the Company’s Articles of Association and the relevant full provisions can be found in the Articles which are available for inspection at the Company’s registered office.
Business and strategy review
Perform
ance review
Governance
Financial statements
Investor information

58 Wm Morrison Supermarkets PLCGovernance
Share capital and rights attaching to the Company’s sharesUnder the Company’s Articles of Association, any share in the Company may be issued with such rights or restrictions, whether in regard to dividend, voting, return of capital or otherwise as the Company may from time to time by ordinary resolution determine (or, in the absence of any such determination, as the Directors may determine).
At a general meeting of the Company, every member has one vote on a show of hands and, on a poll, one vote for each share held. The notice of general meeting specifies deadlines for exercising voting rights either by proxy or present in person in relation to resolutions to be passed at a general meeting.
No member is, unless the Board decides otherwise, entitled to attend or vote either personally or by proxy at a general meeting, or to exercise any other right conferred by being a shareholder if they or any person with an interest in shares has been sent a notice under section 793 of the Companies Act 2006 (which confers upon public companies the power to require information with respect to interests in their voting shares) and they or any interested person failed to supply the Company with the information requested within 14 days after delivery of that notice. The Board may also decide that no dividend is payable in respect of those default shares and that no transfer of any default shares shall be registered. These restrictions end seven days after receipt by the Company of a notice of an approved transfer of the shares or all the information required by the relevant section 793 notice, whichever is the earlier.
The Directors may refuse to register any transfer of any share which is not a fully-paid share, although such discretion may not be exercised in a way which the Financial Services Authority regards as preventing dealings in the shares of the relevant class or classes from taking place on an open or proper basis. The Directors may likewise refuse to register any transfer of a share in favour of more than four persons jointly. The Company is not aware of any other restrictions on the transfer of shares in the Company other than certain restrictions that may from time to time be imposed by laws and regulations (for example, insider trading laws).
The Company is not aware of any agreements between shareholders that may result in restrictions on the transfer of securities or voting rights.
Appointment and powers of DirectorsDirectors are appointed by ordinary resolution at a general meeting of ordinary shareholders. The Directors have the power to appoint a Director during the year, but any person so appointed must be put up for appointment at the next AGM.
Subject to its Articles of Association and relevant statutory law, and to such direction as may be given by the Company in general meeting by special resolution, the business of the Company shall be managed by the Directors, who may exercise all powers of the Company which are not required to be exercised by the Company in general meeting.
Articles of AssociationThe Company’s Articles of Association may only be amended by a special resolution at a general meeting of shareholders.
Other disclosuresThere are no persons with whom the Group has contractual or other arrangements which are essential to the business of the Group.
The Company is not party to any significant arrangements which take effect, alter or terminate upon a change of control of the Company following a takeover bid.
The Company does not have any employee share schemes where the shares to which the scheme relates have rights with regard to the control of the Company which are not exercisable by employees.
By the order of the Board
Greg McMahonCompany Secretary7 March 2012
General information – continued

59Annual report and financial statements 2011/12B
usiness and strategy review
Performance review
G
overnanceFinancial statem
entsInvestor inform
ation
The Directors are responsible for preparing the Annual report and the Group and Parent Company financial statements in accordance with applicable law and regulations.
Company law requires the Directors to prepare Group and Parent Company financial statements for each financial year. Under that law they are required to prepare the Group financial statements in accordance with IFRSs as adopted by the EU and applicable law and have elected to prepare the Parent Company financial statements in accordance with UK Accounting Standards and applicable law (UK Generally Accepted Accounting Practice).
Under company law the Directors must not approve the financial statements unless they are satisfied that they give a true and fair view of the state of affairs of the Group and Parent Company and of their profit or loss for that period. In preparing each of the Group and Parent Company financial statements, the Directors are required to:
• select suitable accounting policies and then apply them consistently;
• make judgements and estimates that are reasonable and prudent;
• for the Group financial statements, state whether they have been prepared in accordance with IFRSs as adopted by the EU;
• for the Parent Company financial statements, state whether applicable UK Accounting Standards have been followed, subject to any material departures disclosed and explained in the Parent Company financial statements; and
• prepare the financial statements on the going concern basis unless it is inappropriate to presume that the Group and the Parent Company will continue in business.
Responsibility statementWe confirm that to the best of our knowledge:
• the financial statements, prepared in accordance with the applicable set of accounting standards, give a true and fair view of the assets, liabilities, financial position and profit or loss of the Company and its subsidiaries included in the consolidation as a whole; and
• the Directors’ report includes a fair review of the development of the business and the position of the Company and its subsidiaries included in the consolidation taken as a whole, together with a description of the principal risks and uncertainties that they face.
By order of the Board
Greg McMahonCompany Secretary7 March 2012
Statement of Directors’ responsibilities in respectof the Annual report and financial statements
The Directors are responsible for keeping adequate accounting records that are sufficient to show and explain the Parent Company’s transactions and disclose with reasonable accuracy at any time the financial position of the Parent Company and enable them to ensure that its financial statements comply with the Companies Act 2006. They have general responsibility for taking such steps as are reasonably open to them to safeguard the assets of the Group, and to prevent and detect fraud and other irregularities.
Under applicable law and regulations, the Directors are also responsible for preparing a Directors’ report, Directors’ remuneration report and Corporate governance statement that complies with that law and those regulations.
The Directors are responsible for the maintenance and integrity of the corporate and financial information included on the Company’s website. Legislation in the UK governing the preparation and dissemination of financial statements may differ from legislation in other jurisdictions.

60 Financial statements Wm Morrison Supermarkets PLC
We have audited the financial statements of Wm Morrison Supermarkets PLC for the 52 week period ended 29 January 2012 set out on pages 61 to 107. The financial reporting framework that has been applied in the preparation of the Group financial statements is applicable law and International Financial Reporting Standards (IFRSs) as adopted by the EU. The financial reporting framework that has been applied in the preparation of the Parent Company financial statements is applicable law and UK Accounting Standards (UK Generally Accepted Accounting Practice).
This report is made solely to the Company’s members, as a body, in accordance with Chapter 3 of Part 16 of the Companies Act 2006. Our audit work has been undertaken so that we might state to the Company’s members those matters we are required to state to them in an auditor’s report and for no other purpose. To the fullest extent permitted by law, we do not accept or assume responsibility to anyone other than the Company and the Company’s members, as a body, for our audit work, for this report, or for the opinions we have formed.
Respective responsibilities of directors and auditorAs explained more fully in the Directors’ responsibilities statement set out on page 59, the Directors are responsible for the preparation of the financial statements and for being satisfied that they give a true and fair view. Our responsibility is to audit, and express an opinion on, the financial statements in accordance with applicable law and International Standards on Auditing (UK and Ireland). Those standards require us to comply with the Auditing Practices Board’s (APB’s) Ethical Standards for Auditors.
Scope of the audit of the financial statementsA description of the scope of an audit of financial statements is provided on the APB’s website at www.frc.org.uk/apb/scope/private.cfm
Opinion on financial statementsIn our opinion:• the financial statements give a true and fair view of the state
of the Group’s and of the Parent Company’s affairs as at 29 January 2012 and of the Group’s profit for the 52 week period then ended;
• the Group financial statements have been properly prepared in accordance with IFRSs as adopted by the EU;
• the Parent Company financial statements have been properly prepared in accordance with UK Generally Accepted Accounting Practice; and
• the financial statements have been prepared in accordance with the requirements of the Companies Act 2006; and, as regards the Group financial statements, Article 4 of the IAS Regulation.
Independent auditor’s report to the members of Wm Morrison Supermarkets PLC
Opinion on other matters prescribed by the Companies Act 2006In our opinion:• the part of the Directors’ remuneration report to be audited
has been properly prepared in accordance with the Companies Act 2006; and
• the information given in the Directors’ report for the financial period for which the financial statements are prepared is consistent with the financial statements.
Matters on which we are required to report by exceptionWe have nothing to report in respect of the following:Under the Companies Act 2006 we are required to report to you if, in our opinion:• adequate accounting reports have not been kept by the Parent
Company, or returns adequate for our audit have not been received from branches not visited by us; or
• the Parent Company financial statements and the part of the Directors’ remuneration report to be audited are not in agreement with the accounting records and returns; or
• certain disclosures of Directors’ remuneration specified by law are not made; or
• we have not received all the information and explanations we require for our audit.
Under the Listing Rules we are required to review:• the Directors’ statement, set out on page 57, in relation
to going concern;• the part of the Corporate governance statement on pages
40 to 45 relating to the Company’s compliance with the nine provisions of the UK Corporate Governance Code specified for our review; and
• the report to shareholders by the Board on the audited section of the Directors’ remuneration.
A J Stone(Senior Statutory Auditor)for and on behalf of KPMG Audit Plc, Statutory Auditor
Chartered Accountants1 The EmbankmentNeville StreetLeedsLS1 4DW
7 March 2012
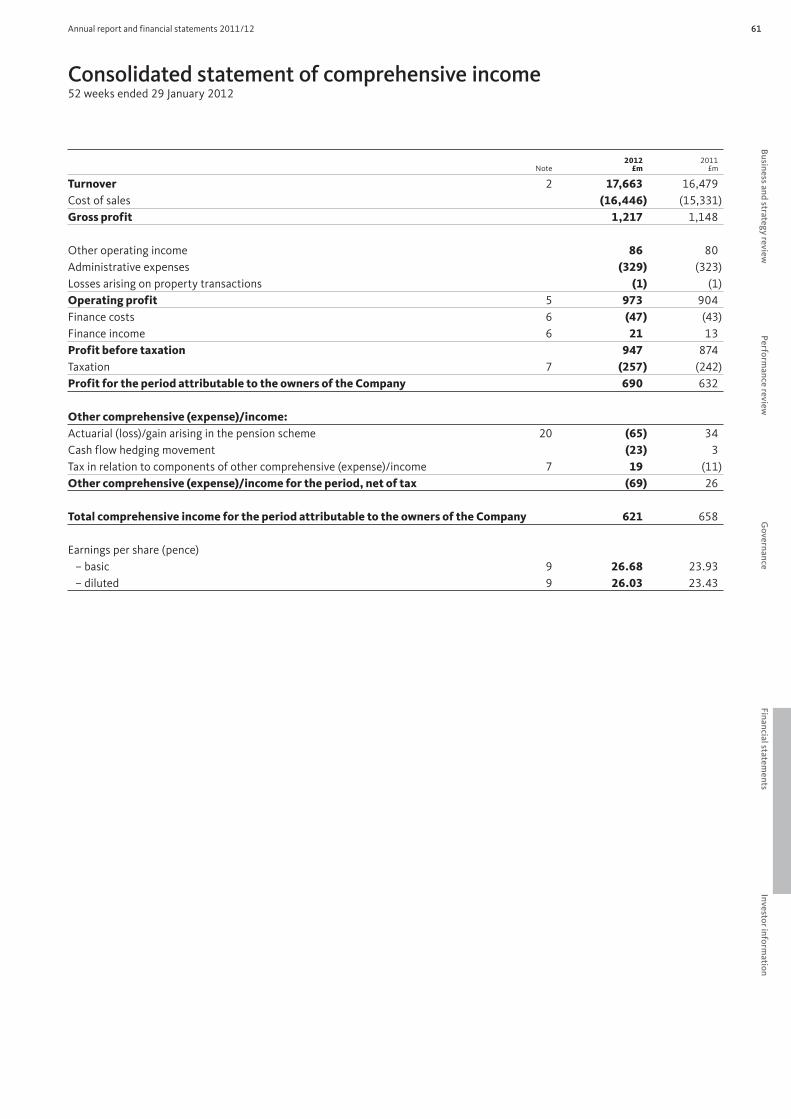
61Annual report and financial statements 2011/12
Consolidated statement of comprehensive income52 weeks ended 29 January 2012
Note2012
£m2011
£m
Turnover 2 17,663 16,479Cost of sales (16,446) (15,331)Gross profit 1,217 1,148
Other operating income 86 80Administrative expenses (329) (323)Losses arising on property transactions (1) (1)Operating profit 5 973 904Finance costs 6 (47) (43)Finance income 6 21 13Profit before taxation 947 874Taxation 7 (257) (242)Profit for the period attributable to the owners of the Company 690 632
Other comprehensive (expense)/income:Actuarial (loss)/gain arising in the pension scheme 20 (65) 34Cash flow hedging movement (23) 3Tax in relation to components of other comprehensive (expense)/income 7 19 (11)Other comprehensive (expense)/income for the period, net of tax (69) 26
Total comprehensive income for the period attributable to the owners of the Company 621 658
Earnings per share (pence) – basic 9 26.68 23.93– diluted 9 26.03 23.43
Business and strategy review
Perform
ance review
Governance
Financial statements
Investor information

62 Financial statements Wm Morrison Supermarkets PLC
Consolidated balance sheet29 January 2012
Note2012
£m2011
£m
AssetsNon-current assetsGoodwill and intangible assets 10 303 184Property, plant and equipment 11 7,943 7,557Investment property 12 259 229Net pension asset 20 – 38Investments 13 31 –Other financial assets 14 1 3
8,537 8,011Current assetsStocks 759 638Debtors 15 320 268Other financial assets 14 2 4Cash and cash equivalents 241 228
1,322 1,138LiabilitiesCurrent liabilitiesCreditors 16 (2,025) (1,914)Other financial liabilities 17 (115) –Current tax liabilities (163) (172)
(2,303) (2,086)Non-current liabilitiesOther financial liabilities 17 (1,600) (1,052)Deferred tax liabilities 19 (464) (499)Net pension liabilities 20 (11) –Provisions 21 (84) (92)
(2,159) (1,643)Net assets 5,397 5,420
Shareholders’ equityCalled-up share capital 22 253 266Share premium 22 107 107Capital redemption reserve 23 19 6Merger reserve 23 2,578 2,578Retained earnings and hedging reserve 23 2,440 2,463Total equity attributable to the owners of the Company 5,397 5,420
The accounting policies on pages 65 to 69 and notes on pages 70 to 94 form part of these financial statements.
The financial statements on pages 61 to 94 were approved by the Board of Directors on 7 March 2012 and were signed on its behalf by:
Dalton Philips Richard PennycookChief Executive Group Finance Director

63Annual report and financial statements 2011/12
Consolidated cash flow statement52 weeks ended 29 January 2012
Note2012
£m2011
£m
Cash flows from operating activitiesCash generated from operations 24 1,264 1,141Interest paid (55) (52)Taxation paid (281) (191)Net cash inflow from operating activities 928 898
Cash flows from investing activitiesInterest received 6 5Investments (31) –Proceeds from sale of property, plant and equipment 4 8Purchase of property, plant and equipment and investment property (724) (494)Purchase of intangible assets (72) (98)Cash outflow from acquisition of businesses 27 (74) (3)Net cash outflow from investing activities (891) (582)
Cash flows from financing activitiesPurchase of own shares 23 (368) –Proceeds from issue of ordinary shares – 16New borrowings 1,102 25Repayment of borrowings (486) (154)Dividends paid to equity shareholders 8 (301) (220)Net cash outflow from financing activities (53) (333)
Net decrease in cash and cash equivalents (16) (17)Cash and cash equivalents at start of period 228 245Cash and cash equivalents at end of period 25 212 228
Reconciliation of net cash flow to movement in net debt in the period
Note2012
£m2011
£m
Net decrease in cash and cash equivalents (16) (17)Cash outflow from decrease in debt and lease financing 486 154Cash inflow from increase in borrowings (1,102) (25)Other non-cash movements (22) (1)Debt acquired on acquisition of businesses – (4)Opening net debt (817) (924)Closing net debt 25 (1,471) (817)
Business and strategy review
Perform
ance review
Governance
Financial statements
Investor information

64 Financial statements Wm Morrison Supermarkets PLC
Consolidated statement of changes in equity52 weeks ended 29 January 2012
Attributable to the owners of the Company
Note
Sharecapital
£m
Sharepremium
£m
Capital redemption
reserve£m
Merger reserve
£m
Hedgingreserve
£m
Retained earnings
£m
Total equity
£m
Current periodAt 30 January 2011 266 107 6 2,578 5 2,458 5,420Profit for the period – – – – – 690 690Other comprehensive income:
Actuarial loss arising in the pension scheme 20 – – – – – (65) (65)Cash flow hedging movement – – – – (23) – (23)Tax in relation to components of other comprehensive income 7 – – – – 6 13 19
Total comprehensive income for the period – – – – (17) 638 621Shares purchased for cancellation 22 (13) – 13 – – (368) (368)Employees share options schemes:
Share-based payments 26 – – – – – 25 25Dividends 8 – – – – – (301) (301)Total transactions with owners (13) – 13 – – (644) (644)At 29 January 2012 253 107 19 2,578 (12) 2,452 5,397
The hedging reserve represents the gains and losses arising on derivatives used for cash flow hedging, principally from the Group’s cross-currency swaps, energy price contracts and forward exchange contracts.
Attributable to the owners of the Company
Note
Sharecapital
£m
Sharepremium
£m
Capital redemption
reserve£m
Merger reserve
£m
Hedgingreserve
£m
Retained earnings
£m
Total equity
£m
Prior periodAt 31 January 2010 265 92 6 2,578 3 2,005 4,949Profit for the period – – – – – 632 632Other comprehensive income:
Actuarial gain arising in the pension scheme 20 – – – – – 34 34Cash flow hedging movement – – – – 3 – 3Tax in relation to components of other comprehensive income 7 – – – – (1) (10) (11)
Total comprehensive income for the period – – – – 2 656 658Employees share options schemes:
Share-based payments 26 – – – – – 17 17Share options exercised 22 1 15 – – – – 16
Dividends 8 – – – – – (220) (220)Total transactions with owners 1 15 – – – (203) (187)At 30 January 2011 266 107 6 2,578 5 2,458 5,420

65Annual report and financial statements 2011/12
Group accounting policies
General informationWm Morrison Supermarkets PLC is a public limited company incorporated in the United Kingdom under the Companies Act 2006 (Registration number 358949). The Company is domiciled in the United Kingdom and its registered address is Hilmore House, Gain Lane, Bradford, BD3 7DL, United Kingdom.
Basis of preparationThe financial statements have been prepared for the 52 weeks ended 29 January 2012 (2011: 30 January 2011) in accordance with International Financial Reporting Standards (IFRS) and International Financial Reporting Interpretation Committee interpretations (IFRIC) as adopted by the European Union and with those parts of the Companies Act 2006 applicable to companies reporting under IFRS. IFRS and IFRIC are issued by the International Accounting Standards Board (the IASB) and must be adopted into European Union law, referred to as endorsement, before they become mandatory under the IAS Regulation. Shown below are recent standards and interpretations that have been issued by the IASB, indicating their status of endorsement.
The financial statements have been prepared on a going concern basis. The Directors’ assessment of going concern has been considered within the general information section of the Directors’ report.
The financial statements are presented in Pounds Sterling, rounded to the nearest million, except in some instances, where it is deemed relevant to disclose the amounts up to two decimal places. They are drawn up on the historical cost basis of accounting, except as disclosed in the accounting policies set out below.
The Group’s accounting policies are set out below and have, unless otherwise stated, been applied consistently to all periods presented in these consolidated financial statements.
There are no IFRS or IFRIC interpretations that are effective for the first time for the financial year beginning on or after 31 January 2011 that would have a material impact on the Group. The Group has adopted all amendments published in ‘Improvements to IFRSs 2010’. The adoption of these amendments has not had any significant impact on the amounts reported in these financial statements.
Accounting reference dateThe accounting period of the Group ends on the Sunday falling between 29 January and 4 February each year.
New IFRS and amendments to IAS and interpretationsThere are a number of standards and interpretations issued by the IASB that are effective for financial statements after this reporting period. The following have not been early adopted by the Group:
International Financial Reporting Standards
Effective for accounting periods starting on or after
IFRS 7* Amendment to Financial instruments: Disclosures on derecognition
1 July 2011
IAS 12 Amendment to Income taxes on deferred tax
1 January 2012
IAS 1 Amendment to Financial statement presentation
1 July 2012
IAS 19 Amendment to Employee benefits
1 January 2013
IFRS 9 Financial instruments 1 January 2015IFRS 10 Consolidated financial statements 1 January 2013IFRS 11 Joint arrangements 1 January 2013IFRS 12 Disclosures of interests in other
entities1 January 2013
IFRS 13 Fair value measurement 1 January 2013IAS 27 Separate financial statements
(revised)1 January 2013
IAS 28 Associates and joint ventures (revised)
1 January 2013
* Endorsed by the European Union.
IAS 19 ‘Employee benefits’ was amended in June 2011. The impact on the Group will be immediately to recognise all past service costs, and to replace interest cost and expected return on plan assets with a net interest amount that is calculated by applying the discount rate to the net defined benefit asset/liability.
The application of these standards and interpretations is not anticipated to have a material effect on the Group’s financial statements.
Basis of consolidationThe consolidated financial statements incorporate the financial statements of the Company and its subsidiaries (together the ‘Group’), being those undertakings that it controls. Control is achieved where the Company has the power to govern the financial and operating policy of an investee entity so as to obtain benefits from its activities. The financial statements of subsidiaries used in the preparation of the consolidated financial statements are prepared for the same reporting period as the Parent Company and are based on consistent accounting policies. The results of subsidiaries acquired or disposed of during the period are included in the consolidated financial statements from the effective date of acquisition up to the effective date of disposal, as appropriate.
Intra-group balances and any unrealised gains and losses or income and expenses arising from intra-group transactions, are eliminated in preparing the consolidated financial statements.
Business and strategy review
Perform
ance review
Governance
Financial statements
Investor information

66 Financial statements Wm Morrison Supermarkets PLC
Group accounting policies – continued
Significant accounting policiesThe Directors consider the following to be significant accounting policies in the context of the Group’s operations:
Segmental reportingThe Group is required to determine and present its operating segments based on the way in which financial information is organised and reported to the chief operating decision-maker (CODM). The CODM has been identified as the Management Board as it is this Board who make the key operating decisions of the Group, are responsible for allocating resources and assess performance of the operating segments.
The Directors consider, based on its internal reporting framework, management and operating structure, that it has one operating segment, that of retailing. The level of disclosure of segmental and other information is driven by such assessment. Further details of the considerations made and the resulting disclosures are provided in note 3 to these financial statements.
Revenue recognitionRevenue comprises the fair value of consideration received or receivable for the sale of goods in the ordinary course of the Group’s activities. It is recognised when significant risks and rewards of ownership have been transferred to the buyer, there is reasonable certainty of recovery of the consideration and the amount of revenue, associated costs and possible return of goods can be estimated reliably.
a) Sale of goods in-store and fuelSale of goods in-store is recorded net of value added tax, returns, staff discounts, coupons, vouchers and the free element of multi-save transactions. Sale of fuel is recognised net of value added tax and Morrisons Miles award points. Revenue is recognised when transactions are completed in-store.
b) Other salesOther revenue primarily comprises income from concessions and commissions based on the terms of the contract and manufacturing sales made direct to third party customers recognised on despatch of goods. Revenue collected on behalf of others is not recognised as turnover, other than the related commission. Sales are recorded net of value added tax and intra-group transactions.
Cost of salesCost of sales consists of all costs to the point of sale including manufacturing, warehouse and transportation costs. Store depreciation, store overheads and store based employee costs are also allocated to cost of sales.
Supplier incomeSupplier incentives, rebates and discounts are collectively referred to as supplier income in the retail industry. Supplier income is recognised as a deduction from cost of sales on an accruals basis based on the expected entitlement which has been earned up to the balance sheet date for each relevant supplier contract. The accrued incentives, rebates and discounts receivable at year end are included within prepayments and accrued income. Where amounts received are in the expectation of future business, these are recognised in the income statement in line with that future business.
Other operating incomeOther operating income primarily consists of income not directly related to the operating of supermarkets and mainly comprises rental income from investment properties and income generated from recycling of packaging. Rental income arising from operating leases on investment properties is accounted for on a straight-line basis to the date of the next rent review. Details of rental income from investment property are provided in note 12.
Property transactionsProperty includes the balance sheet headings of Property, plant and equipment and Investment property. The results of transactions relating to disposal of property are reported in profit for the period under Profit/loss arising on property transactions. Depreciation and any impairment charges or reversals are recognised in cost of sales or administrative expenses, as appropriate.
Borrowing costsAll borrowing costs are recognised in the Group’s profit for the period on an effective interest rate basis except for interest costs that are directly attributable to the construction of buildings and other qualifying assets which are capitalised and included within the initial cost of the asset. Capitalisation of interest ceases when the asset is ready for use.
Deferred and current taxThe current income tax charge is calculated on the basis of the tax laws in effect during the period and any adjustments to tax payable in respect of previous periods. Taxable profit differs from the reported profit for the period as it is adjusted both for items that will never be taxable or deductible, and temporary differences. Current tax is charged to profit for the period, except when it relates to items charged or credited directly in equity in which case the current tax is reflected in equity.
Deferred tax is recognised using the balance sheet method. Provision is made for temporary differences between the carrying amounts of assets and liabilities for financial reporting purposes and the amounts used for taxation purposes. No deferred tax is recognised for temporary differences that arise on the initial recognition of goodwill or the initial recognition of assets and liabilities that is not a business combination and that affects neither accounting nor taxable profits. Deferred tax is calculated based on tax law that is enacted or substantively enacted at the reporting date and provided at rates expected to apply when the temporary differences reverse. Deferred tax is charged or credited to profit for the period except when it relates to items charged or credited directly to other comprehensive income, in which case the deferred tax is reflected in other comprehensive income.
Deferred tax assets are recognised to the extent that it is probable that taxable profit will be available against which the asset can be utilised. Deferred tax assets recognised are reviewed at each reporting date as judgement is required to estimate the availability of future taxable income. Deferred tax assets and liabilities are offset where amounts will be settled on a net basis as there is a legally enforceable right to offset.
Accruals for tax contingencies require management to make judgements and estimates of ultimate exposures in relation to tax compliance issues. All accruals are included in current liabilities.
Intangible assetsa) Business combinations and goodwillThe acquisition method of accounting is used to account for business combinations by the Group. The consideration transferred for the acquisition of a subsidiary is the fair value of the assets transferred, the liabilities incurred and the equity interests issued by the Group. The consideration transferred includes the fair value of any asset or liability resulting from a contingent consideration arrangement. Acquisition-related costs are expensed as incurred. Identifiable assets acquired and liabilities and contingent liabilities assumed in a business combination are measured initially at their fair values at the acquisition date. On an acquisition-by-acquisition basis, the Group recognises any non-controlling interest in the acquiree

67Annual report and financial statements 2011/12
either at fair value or at the non-controlling interest’s proportionate share of the acquiree’s net assets.
The excess of consideration transferred, the amount of any non-controlling interest in the acquiree and the acquisition date fair value of any previous equity interest in the acquiree over the fair value of the Group’s share of the identifiable net assets acquired is recorded as goodwill. If this is less than the fair value of the net assets of the subsidiary acquired, in the case of a bargain purchase, the difference is recognised directly in profit for the period.
Goodwill arising on a business combination is not amortised but is reviewed for impairment on an annual basis or more frequently if there are indicators that goodwill may be impaired. Any impairment is recognised immediately in profit or loss.
b) BrandsBrands acquired through a business combination are initially recognised at their fair value at the acquisition date and amortised to profit or loss on a straight line basis over their estimated useful economic life. Any impairment in value is recognised immediately in profit or loss.
c) Software development costsCosts that are directly attributable to the creation of identifiable software, which meet the development asset recognition criteria as laid out in IAS 38 ‘Intangible assets’ are recognised as intangible assets. Direct costs include consultancy costs, the employment costs of internal software developers and borrowing costs. Borrowing costs are capitalised until such time as the software is substantially ready for its intended use.
All other software development and maintenance costs are recognised as an expense as incurred.
Software development costs recognised as assets are held at historic cost less accumulated amortisation and impairment, and are amortised over their estimated useful lives (3 to 10 years) on a straight line basis.
d) LicencesSeparately acquired pharmaceutical licences and software licences are recognised at historic cost less accumulated amortisation and impairment. Those acquired in a business combination are recognised at fair value at the acquisition date. Pharmaceutical licences and software licences are amortised over their useful lives (3 to 10 years) on a straight line basis.
Property, plant and equipmenta) Property, plant and equipment are stated at cost less accumulated depreciation and accumulated impairment losses. Costs include directly attributable costs. Annual reviews are made of estimated useful lives and material residual values.
b) Depreciation rates used to write off cost less residual value on a straight line basis are:
Freehold land 0%Freehold buildings 2.5%Leasehold land Over the lease periodLeasehold buildings Over the shorter of lease
period and 2.5%Plant, equipment, fixtures and vehicles
10% to 33%
Assets under construction 0%
Investment propertyProperty held to earn rental income is classified as Investment property. Investment property is recorded at cost, less accumulated depreciation and any recognised impairment loss. The depreciation policy is consistent with that described for property, plant and equipment.
InvestmentsInvestments comprise of investments in equity instruments. All equity instruments are held for long term investment and are measured at fair value through other comprehensive income, where the fair value can be measured reliably. Where the fair value of the instruments cannot be measured reliably, for example, when there is variability in the range of estimates, the investment will be recognised at cost less accumulated impairment losses, in accordance with IAS 39 ‘Financial instruments: recognition and measurement’. Any impairment is recognised immediately in profit or loss.
Impairment of non-financial assetsProperty, plant and equipment, Investment property and Intangible assets are annually reviewed for indications of impairment, or when events or changes in circumstances indicate that the carrying amount may not be recoverable. This is performed for each cash-generating unit, which in the case of a supermarket is an individual retail outlet. If there are indications of possible impairment then a test is performed on the asset affected to assess its recoverable amount against carrying value. An impaired asset is written down to its recoverable amount which is the higher of value in use or its fair value less costs to sell. In assessing value in use, the estimated future cash flows are discounted to their present value using a pre-tax discount rate that reflects current market assessments of the time value of money and the risks specific to the asset.
If there is indication of an increase in fair value of an asset that had been previously impaired, then this is recognised by reversing the impairment, but only to the extent that the recoverable amount does not exceed the carrying amount that would have been determined if no impairment loss had been recognised for the asset. Impairment losses previously recognised relating to goodwill cannot be reversed.
StocksStocks are measured at the lower of cost and net realisable value. Provision is made for obsolete and slow moving items. Cost is calculated on a weighted average basis and comprises purchase price, import duties and other non-recoverable taxes less rebates. Stocks represent goods for resale.
Net realisable value is the estimated selling price in the ordinary course of business, less the estimated costs necessary to make the sale.
LeasesLeases in which substantially all the risks and rewards of ownership are retained by the lessor are classified as operating leases; all other leases are classified as finance leases.
Lessor accounting – operating leasesAssets acquired and made available to third parties under operating leases are recorded as Property, plant and equipment and Investment property and are depreciated on a straight line basis to their estimated residual values over their estimated useful lives. Operating lease income is credited on a straight line basis to the date of the next rent review.
Business and strategy review
Perform
ance review
Governance
Financial statements
Investor information

68 Financial statements Wm Morrison Supermarkets PLC
Lessee accounting – operating leasesRental payments are taken to profit for the period on a straight line basis over the life of the lease. Property leases are analysed into separate components for land and buildings and tested to establish whether the components are operating leases or finance leases.
Lessee accounting – finance leasesThe present value, calculated using the interest rate implicit in the lease, of the future minimum lease payments is included within Property, plant and equipment and financial liabilities as an obligation to pay future rentals. Depreciation is provided at the same rates as for owned assets, or over the lease period, if shorter.
Rental payments are apportioned between the finance charge and the outstanding obligation so as to produce a constant rate of finance charge on the remaining balance.
ProvisionsProvisions are created where the Group has a present obligation as a result of a past event, where it is probable that it will result in an outflow of economic benefits to settle the obligation, and where it can be reliably measured.
Provisions are made in respect of individual properties where there are obligations for onerous contracts, dilapidations and certain decommissioning obligations for petrol filling stations. The amounts provided are based on the Group’s best estimate of the likely committed outflow to the Group. Where material, these estimated outflows are discounted to net present value.
Foreign currenciesTransactions in foreign currencies are recorded at the rates of exchange at the dates of the transactions. At each balance sheet date, monetary assets and liabilities that are denominated in foreign currency are retranslated at the rates of exchange at the balance sheet date. Gains and losses arising on retranslation are included in the income statement for the period except when they are deferred in other comprehensive income as qualifying cash flow hedges.
Retirement benefitsThe Group operates defined benefit and defined contribution schemes. A defined contribution scheme is a pension scheme under which the Group pays fixed contributions into a separate entity. A defined benefit scheme is one that is not a defined contribution scheme. Pension benefits under defined benefit schemes are defined on retirement based on age at date of retirement, years of service and a formula using either the employee’s compensation package or career average revalued earnings.
The Group operates two defined benefit retirement schemes which are funded by contributions from the Group and members. The defined benefit schemes are not open to new members. Pension scheme assets, which are held in separate trustee administered funds, are valued at market rates. Pension scheme obligations are measured on a discounted present value basis using assumptions as shown in note 20. The operating and financing costs of the scheme are recognised separately in profit for the period when they arise. Death-in-service costs are recognised on a straight line basis over their vesting period. Actuarial gains and losses are recognised immediately in other comprehensive income.
The Group has a right to recognise an asset, should one arise, in respect of the Group’s net obligations to the pension schemes. Therefore either an asset or a liability is recognised in the balance sheet, calculated separately for each scheme.
Payments by the Group to the defined contribution scheme are charged to profit for the period as they arise.
Share-based paymentsThe Group issues equity settled share-based payments to certain employees in exchange for services rendered by them. The fair value of the share-based award is calculated at the date of grant and is expensed on a straight line basis over the vesting period with a corresponding increase in equity. This is based on the Group’s estimate of share options that will eventually vest. This takes into account movement of non-market conditions, being service conditions and financial performance, if relevant.
Fair value is measured by use of a binomial stochastic model. The expected life used in the model has been adjusted, based on management’s best estimate, for effects of non-transferability, exercise restrictions and behavioural considerations.
Financial instrumentsFinancial assets and liabilities are recognised on the Group’s balance sheet when the Group becomes a party to the contractual provisions of the instrument.
a) Financial assetsi) Trade and other debtorsTrade and other debtors are initially recognised at fair value. Provision is made when there is objective evidence that the Group will not be able to recover balances in full, with the charge being recognised in ‘Administrative expenses’ in profit for the period. Balances are written off when the probability of recovery is assessed as being remote.
ii) Cash and cash equivalentsCash and cash equivalents for cash flow purposes includes cash-in-hand, cash-at-bank and bank overdrafts together with short term, highly-liquid investments that are readily convertible into known amounts of cash, with an insignificant risk of a change in value, within three months from the date of acquisition. In the balance sheet bank overdrafts that do not have right of offset are presented within current liabilities.
Cash held by the Group’s captive insurer is not available for use by the rest of the Group as it is restricted for use against the specific liability of the captive. As the funds are available on demand, they meet the definition of cash in IAS 7 ‘Cashflow statements’.
b) Financial liabilitiesi) Trade and other creditorsTrade and other creditors are stated at fair value.
ii) BorrowingsInterest-bearing loans and overdrafts are initially recorded at fair value, net of attributable transaction costs. Subsequent to initial recognition, any difference between the redemption value and the initial carrying amount is recognised in profit for the period over the period of the borrowings on an effective interest rate basis.
c) Derivative financial instruments and hedge accountingDerivative financial instruments are initially measured at fair value and are remeasured at fair value through profit or loss, except where the derivative qualifies for hedge accounting.
i) Cash flow hedgesDerivative financial instruments are classified as cash flow hedges when they hedge the Group’s exposure to variability in cash flows that are either attributable to a particular risk associated with a recognised asset or liability, or a highly probable forecasted transaction.
Group accounting policies – continued

69Annual report and financial statements 2011/12
The Group has cross-currency swaps designated as cash flow hedges. These derivative financial instruments are used to match or minimise risk from potential movements in foreign exchange rates inherent in the cash flows of the US Dollar private placement loan notes.
To minimise the risk from potential movements in energy prices, the Group has energy price contracts which are designated as cash flow hedges.
To minimise the risk from potential movements in foreign exchange rates, the Group uses forward exchange contracts with financial institutions which are designated as cash flow hedges.
Derivatives are reviewed annually for effectiveness. Where a derivative financial instrument is designated as a hedge of the variability in cash flows of a recognised asset or liability, or highly probable forecast transaction, the effective part of any gain or loss on the movement in fair value of the derivative financial instrument is recognised in other comprehensive income and presented in the hedging reserve in equity.
The gain or loss on any ineffective part of the hedge is immediately recognised in profit for the period within ‘Cost of sales’ in relation to the energy price contracts and within ‘Finance income/costs’ in relation to the cross-currency swaps. If a hedge of a forecast transaction subsequently results in the recognition of a financial asset or liability, the associated cumulative gains or losses that were recognised directly in equity are reclassified into profit for the period when the transaction occurs.
ii) Fair value hedgesDerivative financial instruments are classified as fair value hedges when they hedge the Group’s exposure to changes in fair value of a recognised asset or liability or an unrecognised firm commitment. The hedging instrument is stated at fair value and any changes in fair value are immediately recognised in other comprehensive income.
Hedge accounting is discontinued when the hedging instrument expires or is sold, terminated or exercised, or no longer qualifies for hedge accounting. At that time, any cumulative gain or loss existing in equity at that time remains in equity and is recognised when the forecast transaction is ultimately recognised in the income statement. When a forecast transaction is no longer expected to occur, the cumulative gain or loss reported in equity is immediately transferred to the income statement.
Net debtNet debt is cash and cash equivalents, long term cash on deposit, bank and other current loans, finance lease debt, bonds, private placement loan notes and derivative financial instruments (stated at current fair value).
Share capitalOrdinary shares are classified as equity. Incremental costs directly attributable to the issue of new shares or options are shown in equity as a deduction, net of tax, from the proceeds.
Where any Group company purchases the Company’s equity share capital, the consideration paid, including directly attributable incremental costs, is deducted from retained earnings until the shares are cancelled. On cancellation, the nominal value of the shares is deducted from share capital and the amount is transferred to the capital redemption reserve.
Own shares heldThe Group has an employee trust for the granting of Group shares to executives and members of the employee share plans. Shares in the Group held by the employee share trust are presented in the balance sheet as a deduction from retained earnings.
The shares are deducted for the purpose of calculating the Group’s earnings per share.
Use of critical accounting assumptions and estimatesEstimates and judgements are continually evaluated and are based on historical experience and other factors, including expectations of future events that are believed to be reasonable under the circumstances.
The Group makes estimates and assumptions concerning the future. The resulting accounting estimates will, by definition, seldom equal the related actual results. The estimates and assumptions that have significant risk of causing a material adjustment to the carrying value of assets and liabilities are discussed below.
a) Property provisionsProvisions have been made for onerous leases, dilapidations and decommissioning costs. These provisions are estimates based on the condition of each property and market conditions for the relevant location. The actual costs and timing of future cash flows are dependent on future events. Any difference between expectations and the actual future liability will be accounted for in the period when such determination is made.
b) Pension scheme assumptions and mortality tableThe carrying value of defined benefit pension schemes is valued using actuarial valuations. These valuations are based on assumptions including the selection of mortality tables for the profile of members in each scheme. All these are estimates of future events. The mortality experience study conducted as part of the Safeway scheme triennial valuation is statistically significant and the longevity assumption is adjusted to reflect its results. As both of the Group’s schemes have a similar composition and type of members, this adjustment is also made to the Morrisons scheme. The mortality assumptions, financial assumptions and mortality experience study are based on advice received from the schemes’ actuaries. Where appropriate these are corroborated from time-to-time with benchmark surveys and ad-hoc analysis.
c) Determination of useful lives, residual values and carrying values of Intangible assets, Property, plant and equipment and Investment propertyDepreciation and amortisation are provided so as to write down the assets to their residual values over their estimated useful lives as set out in the accounting policies for Intangible assets, Property, plant and equipment and Investment property. The selection of these residual values and estimated lives requires the exercise of judgement.
The Group is required to assess whether there is indication of impairment to the carrying values of assets. In making that assessment, judgements are made in estimating value in use in relation to future cash flows and discount rates. The Directors consider that the individual carrying values of stores and other operating assets are supportable either by value in use or market values.
Business and strategy review
Perform
ance review
Governance
Financial statements
Investor information

70 Financial statements Wm Morrison Supermarkets PLC
Notes to the Group financial statements52 weeks ended 29 January 2012
1 Underlying profitThe Directors consider that underlying earnings per share measures referred to in the Chairman’s statement, Business and strategy review and Financial review provide additional useful information for shareholders on underlying trends and performance and reflects how the business is monitored internally. The adjustments are made to reported profit to (a) remove the impact of pension interest income volatility on profit for the period; (b) remove losses/profits arising on property transactions since they do not form part of the Group’s principal activities; and (c) apply an effective tax rate of 29.3% (2011: 30%), being an estimated normalised tax rate.
2012£m
2011£m
Profit after tax 690 632Add back: tax charge for the period1 257 242Profit before tax 947 874Adjustments for:Net pension interest income (note 6)1 (13) (6)Loss arising on property transactions1 1 1Underlying profit before tax 935 869Taxation1 (274) (261)
Underlying profit after tax charge 661 608Underlying earnings per share (pence)
– basic (note 9(b)) 25.55 23.03– diluted (note 9(b)) 24.93 22.54
1 Adjustments marked 1 equal £29m (2011: £24m) as shown in the reconciliation of earnings disclosed in note 9(b).
2 Sales analysisThis table is provided to reconcile the like-for-like sales described in the Business and strategy review with the total turnover:
Like-for-likestores Other
2012Total
£m
2011Total
£m
Sale of goods in-stores 13,112 324 13,436 12,937Fuel 4,009 30 4,039 3,426Total store-based sales 17,121 354 17,475 16,363Other sales – 188 188 116Total turnover 17,121 542 17,663 16,479
Fuel sales are removed from quoted like-for-like figures, given the volatility in the fuel price, to provide a more stable measure.
3 Segmental reportingThe Group’s principal activity is that of retailing, derived solely from the UK. The Group is not reliant on any major customer for 1% or more of revenues.
Consideration of IFRS 8 ‘Operating segments’The Group has made the following considerations in arriving at conclusions and the corresponding disclosure in these financial statements.
IFRS 8 requires consideration of the chief operating decision maker (CODM) within the Group. In line with the Group’s internal reporting framework and management structure, the key operating decisions and resource allocations are made by the Management Board. The Directors therefore consider the Management Board to be the CODM.
Consideration in particular was given to retail outlets, the fuel resale operation, the manufacturing entities and multi-channel operations.
Key internal reports received by the CODM, primarily the Board Management Accounts, focus on the performance of the Group as a whole. The operations of all elements of the business are driven by the retail sales environment and hence have fundamentally the same economic characteristics. All operational decisions made are focused on the performance and growth of the retail outlets and the ability of the business to meet the supply demands of the stores. Given this, the Group has considered the overriding core principles of IFRS 8 and has determined that it has one operating segment.
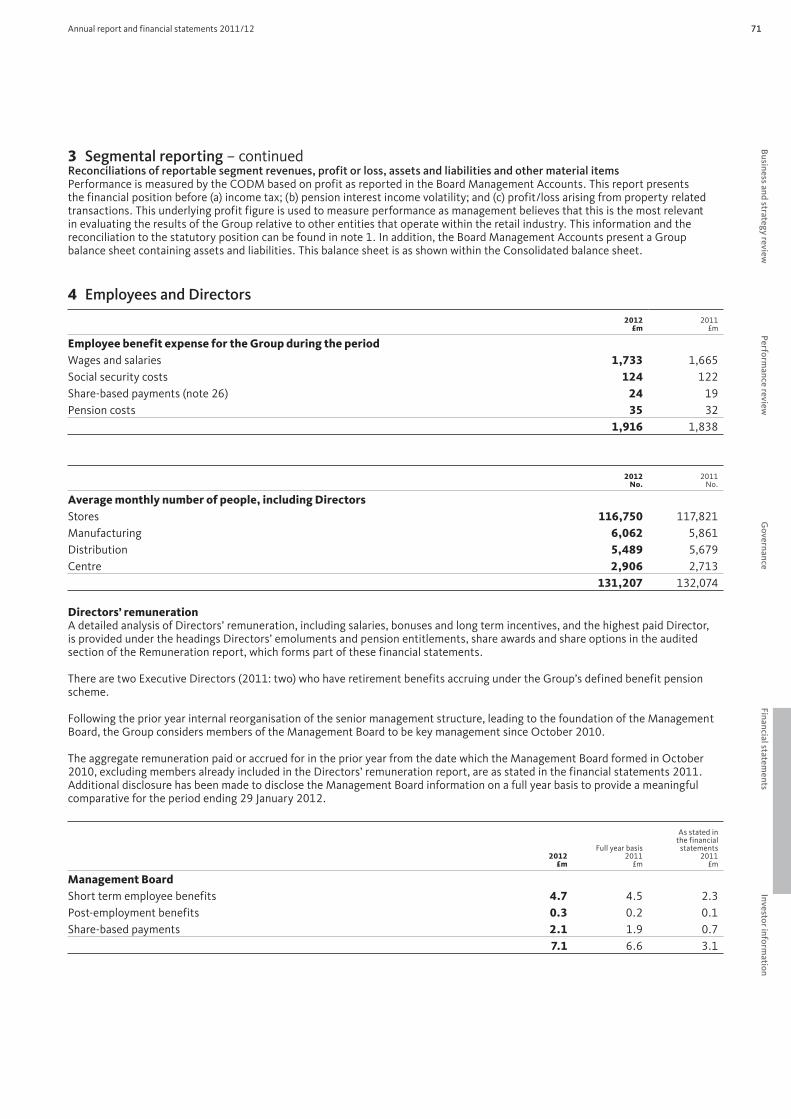
71Annual report and financial statements 2011/12
3 Segmental reporting – continuedReconciliations of reportable segment revenues, profit or loss, assets and liabilities and other material itemsPerformance is measured by the CODM based on profit as reported in the Board Management Accounts. This report presents the financial position before (a) income tax; (b) pension interest income volatility; and (c) profit/loss arising from property related transactions. This underlying profit figure is used to measure performance as management believes that this is the most relevant in evaluating the results of the Group relative to other entities that operate within the retail industry. This information and the reconciliation to the statutory position can be found in note 1. In addition, the Board Management Accounts present a Group balance sheet containing assets and liabilities. This balance sheet is as shown within the Consolidated balance sheet.
4 Employees and Directors
2012£m
2011£m
Employee benefit expense for the Group during the periodWages and salaries 1,733 1,665Social security costs 124 122Share-based payments (note 26) 24 19Pension costs 35 32
1,916 1,838
2012No.
2011No.
Average monthly number of people, including DirectorsStores 116,750 117,821Manufacturing 6,062 5,861Distribution 5,489 5,679Centre 2,906 2,713
131,207 132,074
Directors’ remunerationA detailed analysis of Directors’ remuneration, including salaries, bonuses and long term incentives, and the highest paid Director, is provided under the headings Directors’ emoluments and pension entitlements, share awards and share options in the audited section of the Remuneration report, which forms part of these financial statements.
There are two Executive Directors (2011: two) who have retirement benefits accruing under the Group’s defined benefit pension scheme.
Following the prior year internal reorganisation of the senior management structure, leading to the foundation of the Management Board, the Group considers members of the Management Board to be key management since October 2010.
The aggregate remuneration paid or accrued for in the prior year from the date which the Management Board formed in October 2010, excluding members already included in the Directors’ remuneration report, are as stated in the financial statements 2011. Additional disclosure has been made to disclose the Management Board information on a full year basis to provide a meaningful comparative for the period ending 29 January 2012.
2012£m
Full year basis2011
£m
As stated inthe financial
statements2011
£m
Management BoardShort term employee benefits 4.7 4.5 2.3Post-employment benefits 0.3 0.2 0.1Share-based payments 2.1 1.9 0.7
7.1 6.6 3.1
Business and strategy review
Perform
ance review
Governance
Financial statements
Investor information

72 Financial statements Wm Morrison Supermarkets PLC
Notes to the Group financial statements – continued52 weeks ended 29 January 2012
5 Operating profit
2012£m
2011£m
The following items have been included in arriving at operating profit:Employee costs (note 4) 1,916 1,838Depreciation:
– Property, plant and equipment – owned assets (note 11) 310 300– Property, plant and equipment – under finance lease (note 11) 1 2– Investment property (note 12) 8 7
Charge to profit for the period 319 309Amortisation (note 10) 21 10Operating lease rentals:
– minimum lease payments – property 43 38– other 9 6
– sublease receipts (5) (6)Value of stock expensed 13,346 12,380
Services provided by the Group’s auditorDuring the period KPMG Audit Plc, the Group’s auditor, provided the following services:
2012£m
2011£m
Audit servicesFees payable to the Group’s auditor for the audit of the Group and the Company 0.4 0.5financial statementsOther servicesFees payable to the Group’s auditors and its associates for other services:
– the audit of the Group’s subsidiaries pursuant to legislation 0.2 0.2– services relating to taxation 0.2 0.1– other services 0.5 0.5
1.3 1.3
Other services includes £0.4m (2011: £0.5m) in relation to independent project assurance and £0.1m (2011: £nil) in relation to transaction support.
6 Finance costs and income
2012£m
2011£m
Interest payable on short term loans and bank overdrafts (12) (6)Interest payable on bonds (39) (36)Interest capitalised 12 7Total interest payable (39) (35)Fair value movement of derivative instruments (1) (1)Provisions: unwinding of discount (4) (5)Other finance costs (3) (2)Finance costs (47) (43)Bank interest received 5 3Amortisation of bonds 2 3Other finance income 1 1Pension liability interest cost (127) (120)Expected return on pension assets 140 126
Net pension interest income (note 20) 13 6Finance income 21 13Net finance cost (26) (30)
Interest is capitalised at the effective interest rate incurred on borrowings before taxation of 4% (2011: 4%). Tax relief is obtained on interest paid and this reduces the tax charged for the period.

73Annual report and financial statements 2011/12
7 Taxationa) Analysis of charge in the period
2012£m
2011£m
Corporation tax– current period 292 280– adjustment in respect of prior period (20) (5)
272 275Deferred tax
– current period (37) (33)– adjustment in respect of prior period 22 –
(15) (33)Tax charge for the period 257 242
b) Tax on items (credited)/charged in other comprehensive income and equity
2012£m
2011£m
Actuarial (loss)/gain arising in the pension scheme (13) 10Cash flow hedges (6) 1Total tax on items included in other comprehensive income (19) 11Share-based payments (1) –Total tax on items included in other comprehensive income and equity (20) 11
Analysis of items (credited)/charged to other comprehensive income:Current tax – (6)Deferred tax (note 19) (20) 17
c) Tax reconciliationThe tax for the period is higher (2011: lower) than the standard rate of corporation tax in the UK of 26.3% (2011: 28%). The differences are explained below:
2012£m
2011£m
Profit before tax 947 874Profit before tax at 26.3% (2011: 28%) 249 245Effects of:Expenses not deductible for tax purposes 12 1Non-qualifying depreciation 38 31Deferred tax on Safeway acquisition assets (12) (11)Effect of change in tax rate (42) (20)Other 10 1Prior period adjustments 2 (5)Tax charge for the period 257 242
Factors affecting current and future tax chargesThe standard rate of corporation tax in the UK changed from 28% to 26% with effect from 1 April 2011. Accordingly, the Group’s profits for this accounting period are taxed at an effective rate of 26.3% and will be taxed at 26% in the future. The impact of this change in tax rate is a credit of £42m to the income statement.
On 23 March 2011, it was announced that the rate of corporation tax will be reducing from 28% to 23% over a four year period. The first reduction to 26% is applicable for the period ending 29 January 2012. A further 1% reduction per year will bring the rate down to 23% by 2015. At 29 January 2012, a rate of 25% had been substantively enacted and has been used in calculating the Group’s deferred tax liability.
Business and strategy review
Perform
ance review
Governance
Financial statements
Investor information

74 Financial statements Wm Morrison Supermarkets PLC
Notes to the Group financial statements – continued52 weeks ended 29 January 2012
8 DividendsAmounts recognised as distributed to equity holders in the period:
2012£m
2011£m
Interim dividend for the period ended 29 January 2012 of 3.17p (2011: 1.23p) 81 32Final dividend for the period ended 30 January 2011 of 8.37p (2010: 7.12p) 220 188
301 220
The Directors are proposing a final dividend in respect of the financial period ending 29 January 2012 of 7.53p per share which will absorb an estimated £191m of shareholders’ funds. Subject to approval at the AGM, it will be paid on 20 June 2012 to shareholders who are on the register on 18 May 2012.
9 Earnings per shareBasic earnings per share (EPS) are calculated by dividing the earnings attributable to ordinary shareholders by the weighted average number of ordinary shares outstanding during the period.
For diluted EPS, the weighted average number of ordinary shares in issue is adjusted to assume conversion of all potentially dilutive ordinary shares. The Company has two (2011: two) classes of instrument that are potentially dilutive: those share options granted to employees where the exercise price is less than the average market price of the Company’s ordinary shares during the period and contingently issuable shares under the Group’s long term incentive plan (LTIPs).
a) Basic and diluted EPS (unadjusted)Reconciliations of the earnings and weighted average number of shares used in the calculations are set out below:
2012 2012 2012 2011 2011 2011
Earnings£m
Weighted average
number of shares
millionsEPS
penceEarnings
£m
Weighted average
number of shares
millionsEPS
pence
Unadjusted EPSBasic EPSEarnings attributable to ordinary shareholders 690 2,586.6 26.68 632 2,640.5 23.93Effect of dilutive instrumentsShare options and LTIPs – 64.3 (0.65) – 56.4 (0.50)Diluted EPS 690 2,650.9 26.03 632 2,696.9 23.43
b) Underlying EPSGiven below is the reconciliation of the earnings used in the calculations of underlying earnings per share:
2012 2012 2012 2011 2011 2011
Earnings£m
Weighted average
number of shares
millionsEPS
penceEarnings
£m
Weighted average
number of shares
millionsEPS
pence
Underlying EPSBasic EPSEarnings attributable to ordinary shareholders 690 2,586.6 26.68 632 2,640.5 23.93Adjustments to determine underlying profit (note 1) (29) – (1.13) (24) – (0.90)
661 2,586.6 25.55 608 2,640.5 23.03Effect of dilutive instrumentsShare options and LTIPs – 64.3 (0.62) – 56.4 (0.49)Diluted EPS 661 2,650.9 24.93 608 2,696.9 22.54
The weighted average number of shares has decreased compared to the prior period as a result of the Group’s equity retirement programme, see note 23.

75Annual report and financial statements 2011/12
10 Intangible assets
Goodwill£m
Brands£m
Softwaredevelopment
costs£m
Licences£m
Total£m
Current periodCostAt 30 January 2011 7 – 173 20 200Acquired in a business combination (note 27) 27 15 19 – 61Additions – – 70 2 72Interest capitalised – – 7 – 7At 29 January 2012 34 15 269 22 340
Accumulated amortisation and impairmentAt 30 January 2011 – – 9 7 16Charge for the period – 1 16 4 21At 29 January 2012 – 1 25 11 37
Net book amount at 29 January 2012 34 14 244 11 303
The cumulative interest capitalised included within software development costs is £13m (2011: £6m). The cost of internal labour capitalised is not material for separate disclosure.
The goodwill acquired balance relates to the Group’s acquisition of kiddicare.com Limited (‘Kiddicare’) (£24m) and Flower World Limited (£3m) and has been allocated to the respective cash-generating units (CGUs). The value of goodwill has been tested for impairment during the current financial year by comparing the recoverable amount on a value in use basis of each CGU to the carrying value of goodwill.
The key assumptions for the Kiddicare value in use calculations are based on the latest Board approved cash flow projections for the next five years and for subsequent years; a long term growth assumption of 2% has been applied. These cash flows have been discounted at a pre-tax rate of 8%. Changes in income and expenditure are based on past experience and expectations of future changes in the market. No impairment arose during the year as a result of this test.
The remaining goodwill of £10m (2011: £7m) is allocated across the respective CGUs. Impairment tests have been performed on the remaining goodwill based on value in use and similar assumptions to those above or on a net asset basis where appropriate. No impairment loss was identified in the current financial year (2011: £nil).
The valuations indicate sufficient headroom such that a reasonably possible change to key assumptions is unlikely to result in an impairment of the related goodwill.
Goodwill£m
Software development costs
£mLicences
£mTotal
£m
Prior periodCostAt 31 January 2010 – – – –Acquired in a business combination 7 – – 7Transferred from property, plant and equipment – 78 11 89Additions – 89 9 98Interest capitalised – 6 – 6At 30 January 2011 7 173 20 200
Accumulated amortisation and impairmentAt 31 January 2010 – – – –Charge for the period – 6 4 10Transferred from property, plant and equipment – 3 3 6At 30 January 2011 – 9 7 16
Net book amount at 30 January 2011 7 164 13 184
During the prior period software development costs and licences previously held within Property, plant and equipment were reclassified and presented separately within Intangible assets.
Business and strategy review
Perform
ance review
Governance
Financial statements
Investor information

76 Financial statements Wm Morrison Supermarkets PLC
Notes to the Group financial statements – continued52 weeks ended 29 January 2012
11 Property, plant and equipment
Land and buildingsPlant,
equipment, fixtures & vehicles
£mTotal
£mFreehold
£mLeasehold
£m
Current periodCostAt 30 January 2011 7,152 886 1,845 9,883Acquisition of subsidiary undertakings (note 27) 11 – 1 12Additions at cost 438 46 233 717Interest capitalised 5 – – 5Transfer to investment properties (35) – – (35)Disposals (6) (2) (6) (14)At 29 January 2012 7,565 930 2,073 10,568
Accumulated depreciation and impairmentAt 30 January 2011 885 125 1,316 2,326Charge for the period 97 30 184 311Transfer to investment properties (4) – – (4)Disposals (1) (2) (5) (8)At 29 January 2012 977 153 1,495 2,625
Net book amount at 29 January 2012 6,588 777 578 7,943
Assets under construction included above 187 1 62 250
The cost of financing property developments prior to their opening date has been included in the cost of the project. The cumulative amount of interest capitalised in the total cost above amounts to £251m (2011: £246m).
Land and buildings Plant, equipment,
fixtures & vehicles £m
Total£m
Freehold£m
Leasehold£m
Prior periodCostAt 31 January 2010 6,894 833 1,777 9,504Acquisition of subsidiary undertakings 6 3 5 14Additions at cost 242 53 186 481Interest capitalised 1 – – 1Transfer from investment properties 17 – – 17Transfer to intangible assets – – (89) (89)Disposals (8) (3) (34) (45)At 30 January 2011 7,152 886 1,845 9,883
Accumulated depreciation and impairmentAt 31 January 2010 797 106 1,162 2,065Charge for the period 90 21 191 302Transfer from investment properties 1 – – 1Transfer to intangible assets – – (6) (6)Disposals (3) (2) (31) (36)At 30 January 2011 885 125 1,316 2,326
Net book amount at 30 January 2011 6,267 761 529 7,557
Assets under construction included above 110 2 25 137

77Annual report and financial statements 2011/12
11 Property, plant and equipment – continuedAnalysis of assets held under finance leases:
2012£m
2011£m
Leasehold land and buildingsCost 285 286Accumulated depreciation (14) (13)Net book value 271 273
12 Investment property
2012£m
2011£m
CostAt start of period 283 277Additions 7 23Transfer from/(to) property, plant and equipment 35 (17)At end of period 325 283
Accumulated depreciationAt start of period 54 48Charge for the period 8 7Transfer from/(to) property, plant and equipment 4 (1)At end of period 66 54
Net book amount at end of period 259 229
Included in other operating income is £23m (2011: £22m) of rental income generated from investment properties.
The fair value of investment properties at the end of the period was £277m (2011: £279m). The Directors do not believe that there has been a material change in yield since last year.
13 Investments
2012£m
2011£m
Equity investments 31 –
The equity investments held for long term investment represents a 12% stake in Fresh Direct Inc, an internet grocer serving the New York market. The investment was made on 9 March 2011 and is held at cost.
14 Other financial assets
2012£m
2011£m
Non-current assetsEnergy price contracts 1 3Current assetsEnergy price contracts 2 4
Business and strategy review
Perform
ance review
Governance
Financial statements
Investor information

78 Financial statements Wm Morrison Supermarkets PLC
Notes to the Group financial statements – continued52 weeks ended 29 January 2012
15 Debtors
2012£m
2011£m
Trade debtors 196 201Less: Provision for impairment of trade debtors (5) (4)
191 197Other debtors 46 18Prepayments and accrued income 83 53
320 268
The ageing analysis of trade debtors is as follows:
2012£m
2011£m
Neither past due nor impaired 183 191Past due but not impaired:
Not more than 3 months 7 3Greater than 3 months 1 3
Impaired debt 5 4196 201
As at 29 January 2012, trade debtors, that were neither past due nor impaired, related to a number of debtors for whom there is no recent history of default. The other classes of debtors do not contain impaired assets.
16 Creditors – current
2012£m
2011£m
Trade creditors 1,409 1,400Other taxes and social security payable 34 33Other creditors 143 127Accruals and deferred income 439 354
2,025 1,914
17 Other financial liabilitiesThe Group had the following current and non-current borrowings and other financial liabilities:
2012£m
2011£m
CurrentBank loans and overdrafts due within one year or on demand:Bank overdraft 29 –Short term borrowings 80 –
109 –Energy price contracts 5 –Forward foreign exchange contract 1 –
115 –

79Annual report and financial statements 2011/12
17 Other financial liabilities – continued
2012£m
2011£m
Non-current£150m Sterling bonds 6.50% August 2014 153 154£200m Sterling bonds 6.00% January 2017 202 201£200m Sterling bonds 6.12% December 2018 203 204£400m Sterling bonds 4.625% December 2023 397 –$250m US private placement loan notes 4.4% November 2026 156 –Total non-current bonds and loan notes 1,111 559
Floating credit facility – 1.4% (2011: 1.13%) 470 475Other loans – 9.38% – 11Cross-currency swaps 8 –Energy price contracts 4 –Finance lease obligations 7 7
1,600 1,052
Borrowing facilitiesBorrowings are denominated in Sterling and US Dollars and bear fixed interest rates, with the exception of the floating credit facility which bears floating interest rates. All borrowings are unsecured.
On 8 December 2011, the Group issued £400m of Sterling bonds at a fixed rate of 4.625%, expiring in December 2023. The issue is part of a £3,000m Euro Medium Term Note Programme where the Group can from time-to-time issue notes denominated in any agreed currency.
On 2 November 2011, the Group issued $250m US private placement loan notes at a fixed rate of 4.4%, expiring in November 2026. The Group has put in place cross-currency swaps to swap the principal and fixed rate interest of the US Dollar private placement loan notes into fixed rate sterling interest liabilities. The maturity dates of the cross-currency swaps match the underlying loan notes.
On 4 March 2011, the Group agreed terms on its new floating credit finance. During the period the Group repaid the previous facility of £476m and drew down £475m of the new facility. The expiry date for the floating credit facility, March 2016, is consistent with the undrawn element of the facility disclosed below.
In the event of default of covenants on the bank facility, the principal amounts and any interest accrued are repayable on demand.
The Group has the following undrawn floating committed borrowing facilities available in respect of which all conditions present had been met at that date:
2012£m
2011£m
Undrawn facilities expiring:Between 1 and 2 years – 625Between 4 and 5 years 725 –
18 Financial instrumentsa) Financial risk management The Group’s treasury operations are controlled centrally by the Treasury Committee in accordance with clearly defined policies and procedures that have been authorised by the Board. There is an amount of delegated authority to the Treasury Committee, but all activities are summarised in half yearly treasury reports which are presented to the Audit Committee.
The Group’s principal financial liabilities, other than derivatives, comprise bank loans and overdrafts, bonds, other borrowings, finance leases and trade and other creditors. The main purpose of these financial liabilities is to raise finance for the Group’s operations. The Group has various financial assets such as trade debtors and cash and short term deposits which arise directly from its operations.
The Group enters into derivative transactions, in the form of forward currency contracts, cross-currency swaps and energy price contracts. The purpose of these derivative instruments is to manage risks arising from the Group’s operations and its sources of finance. As part of normal banking arrangements, the Group utilises letters of credit in order to facilitate contracts with third parties. The financial derivatives relating to commitments entered into during the year are to manage the risks arising from its usage of energy and foreign currency. It remains the Group’s policy not to engage in speculative trading of financial instruments.
Business and strategy review
Perform
ance review
Governance
Financial statements
Investor information

80 Financial statements Wm Morrison Supermarkets PLC
Notes to the Group financial statements – continued52 weeks ended 29 January 2012
18 Financial instruments – continuedThe objectives, policies and processes for managing these risks are stated below:
i) Foreign currency riskThe Group makes the majority of its purchases in Sterling however it incurs currency exposure in respect of overseas trade purchases made in currencies other than Sterling, primarily being Euro and US Dollar. The Group’s objective is to reduce risk to short term profits and losses from exchange rate fluctuations. It is Group policy that any transactional currency exposures recognised to have a material impact on short term profits and losses will be hedged through the use of derivative financial instruments. At the balance sheet date, the Group had entered into forward foreign exchange contracts to mitigate foreign currency exposure on up to 50% (2011: 50%) of its forecasted purchases within the next six months.
Cross-currency swaps are used to mitigate the Group’s currency exposure arising from payments of interest and repayment of the principal in relation to US Dollar private placement loan notes.
The sensitivity to a reasonably possible change (+/- 10%) in the US Dollar/Euro exchange rate has been determined as being immaterial.
ii) Liquidity riskThe Group policy is to maintain a balance of funding with a range of maturities and a sufficient level of undrawn committed borrowing facilities to meet any unforeseen obligations and opportunities. Short term cash balances, together with undrawn committed facilities, enable the Group to manage its liquidity risk. The Group finances its operations with a combination of bank credit facilities, bonds and US private placement loan notes.
The Treasury Committee monitors rolling forecasts of the Group’s liquidity reserve on a quarterly basis, which comprises committed and uncommitted borrowing facilities on the basis of expected cash flow. At 29 January 2012, the Group had undrawn committed facilities of £725m (note 17). These facilities remain available to the Group.
The table below summarises the maturity profile of the Group’s other financial liabilities based on contractual undiscounted payments, which includes interest payments.
Creditors and current tax liabilities have been excluded from this analysis. These balances are due within 12 months and their contractual undiscounted payments equal their carrying balances as the impact of discounting is not significant.
Where borrowings are subject to a floating rate, an estimate for interest has been made. The amounts included in the table are the contractual undiscounted cash flows, and therefore do not agree to the amounts disclosed on the balance sheet for borrowings.
2012£m
2011£m
Less than one year 149 41One to two years 68 516Two to three years 224 42Three to four years 57 185Four to five years 732 25More than five years 988 468
The table below analyses the Group’s derivative financial instruments into relevant maturity groupings based on the remaining period at the balance sheet date to the contractual maturity date. The amounts disclosed in the table are the contractual undiscounted cash flows.
At 29 January 2012< 1 year
£m1 – 5 years
£m5 + years
£m
Derivatives settled on a gross basisCross-currency swaps – cash flow hedges
– Outflow (8) (31) (234)– Inflow 7 28 230
Forward contracts – cash flow hedges– Outflow (67) – –– Inflow 66 – –
Derivatives settled on a net basisEnergy price contracts – cash flow hedges
– Outflow (4) (3) –– Inflow 2 – –

81Annual report and financial statements 2011/12
18 Financial instruments – continued
At 30 January 2011< 1 year
£m1 – 5 years
£m5+ years
£m
Derivatives settled on a gross basisForward contracts – cash flow hedges
– Outflow (54) – –– Inflow 54 – –
Derivatives settled on a net basisEnergy price contracts – cash flow hedges
– Outflow (4) (3) –
iii) Credit riskCredit risk is managed on a Group basis. Credit risk arises from cash and cash equivalents, deposits with banking groups as well as credit exposures from other sources of income such as supplier income and tenants of investment properties.
The Group maintains deposits with banks and financial institutions who must possess a long term credit rating of A1 or higher with Moody’s for a period not exceeding six months. Further, the Group has specified limits that can be deposited with any banking group or financial institution at any point. The maximum exposure on cash and cash equivalents and deposits is equal to the carrying amount of these instruments. The Group does not expect any significant performance losses from counterparties.
The Group trades only with recognised third parties. It is the Group’s policy that tenants of investment properties who wish to trade on credit terms are subject to credit verification procedures. In addition, receivable balances are monitored on an ongoing basis with the result that the Group’s exposure to bad debts is not significant. The maximum exposure is the carrying amount as disclosed in note 15. There are no significant concentrations of credit risk within the Group.
iv) Other riskPricing risk: The Group manages the risks associated with the purchase of electricity, gas and diesel consumed by its activities (excluding fuel purchased for resale to customers) by entering into bank swap contracts to fix prices for expected consumption.
The Treasury Committee reviews the Group’s market price exposure to these commodities on a quarterly basis and determines a strategy for utilising derivative financial products in order to mitigate the volatility of energy prices. A +/- 10 % change in the fair value of the commodity price at the balance sheet date impacts the cash flow reserve by £16m.
The Group intends to hold derivatives to maintain cover of its energy purchases of up to 75% over an appropriate timescale.
Cash flow interest rate risk: The Group’s long term policy is to protect itself against adverse movements in interest rates by maintaining approximately 60% of its consolidated total net debt in fixed rate borrowings. As at the balance sheet date 70% (2011: 55%) of the Group’s borrowings are at fixed rate, thereby substantially reducing the Group’s exposure to adverse movements in interest rates.
b) Capital managementThe Group defines the capital that it manages as the Group’s total equity and net debt balances, with an adjustment to reflect rental commitments.
The Group’s objectives are to safeguard its ability to continue as a going concern providing returns to shareholders, through the optimisation of the debt and equity balances, maintaining a strong investment grade credit rating and having adequate liquidity headroom. The Group manages its capital structure and makes appropriate decisions in light of the current economic conditions and strategic objectives of the Group. Initiatives available to achieve the Group’s desired capital structure include adjusting the amount of dividends paid to shareholders, issuing new shares and buying back share capital. During the current financial year, the proportion of debt relative to equity has increased, resulting from both £368m incurred on the equity retirement programme, and a strategy of pursuing a more diversified funding portfolio. In recent months, £400m additional funding has been obtained following the Group’s successful inaugural Bond issuance, and a further £156m from a US Private Placement with Metlife Insurance. As these were issued for 12 and 15 years, respectively, this has contributed to a significant increase in average maturity period of the Group’s debt.
A key objective of the Group’s capital management is to maintain compliance with the covenants set out in the revolving credit facility.
The Group’s covenants require maintenance of a gearing ratio of less than 3.5 and interest cover of at least 3.0 times. Throughout the year, the Group has comfortably complied with these covenants.
Business and strategy review
Perform
ance review
Governance
Financial statements
Investor information
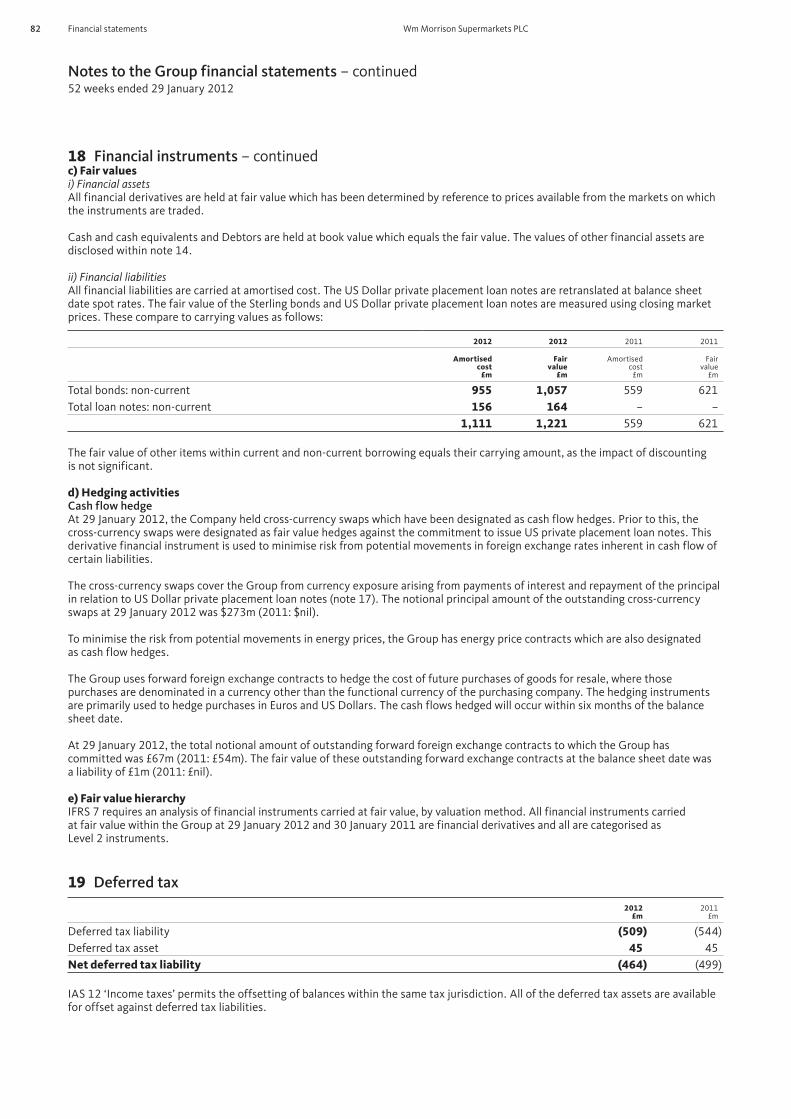
82 Financial statements Wm Morrison Supermarkets PLC
Notes to the Group financial statements – continued52 weeks ended 29 January 2012
18 Financial instruments – continuedc) Fair valuesi) Financial assetsAll financial derivatives are held at fair value which has been determined by reference to prices available from the markets on which the instruments are traded.
Cash and cash equivalents and Debtors are held at book value which equals the fair value. The values of other financial assets are disclosed within note 14.
ii) Financial liabilitiesAll financial liabilities are carried at amortised cost. The US Dollar private placement loan notes are retranslated at balance sheet date spot rates. The fair value of the Sterling bonds and US Dollar private placement loan notes are measured using closing market prices. These compare to carrying values as follows:
2012 2012 2011 2011
Amortisedcost
£m
Fairvalue
£m
Amortisedcost
£m
Fairvalue
£m
Total bonds: non-current 955 1,057 559 621Total loan notes: non-current 156 164 – –
1,111 1,221 559 621
The fair value of other items within current and non-current borrowing equals their carrying amount, as the impact of discounting is not significant.
d) Hedging activitiesCash flow hedgeAt 29 January 2012, the Company held cross-currency swaps which have been designated as cash flow hedges. Prior to this, the cross-currency swaps were designated as fair value hedges against the commitment to issue US private placement loan notes. This derivative financial instrument is used to minimise risk from potential movements in foreign exchange rates inherent in cash flow of certain liabilities.
The cross-currency swaps cover the Group from currency exposure arising from payments of interest and repayment of the principal in relation to US Dollar private placement loan notes (note 17). The notional principal amount of the outstanding cross-currency swaps at 29 January 2012 was $273m (2011: $nil).
To minimise the risk from potential movements in energy prices, the Group has energy price contracts which are also designated as cash flow hedges.
The Group uses forward foreign exchange contracts to hedge the cost of future purchases of goods for resale, where those purchases are denominated in a currency other than the functional currency of the purchasing company. The hedging instruments are primarily used to hedge purchases in Euros and US Dollars. The cash flows hedged will occur within six months of the balance sheet date.
At 29 January 2012, the total notional amount of outstanding forward foreign exchange contracts to which the Group has committed was £67m (2011: £54m). The fair value of these outstanding forward exchange contracts at the balance sheet date was a liability of £1m (2011: £nil).
e) Fair value hierarchyIFRS 7 requires an analysis of financial instruments carried at fair value, by valuation method. All financial instruments carried at fair value within the Group at 29 January 2012 and 30 January 2011 are financial derivatives and all are categorised as Level 2 instruments.
19 Deferred tax
2012£m
2011£m
Deferred tax liability (509) (544)Deferred tax asset 45 45Net deferred tax liability (464) (499)
IAS 12 ‘Income taxes’ permits the offsetting of balances within the same tax jurisdiction. All of the deferred tax assets are available for offset against deferred tax liabilities.
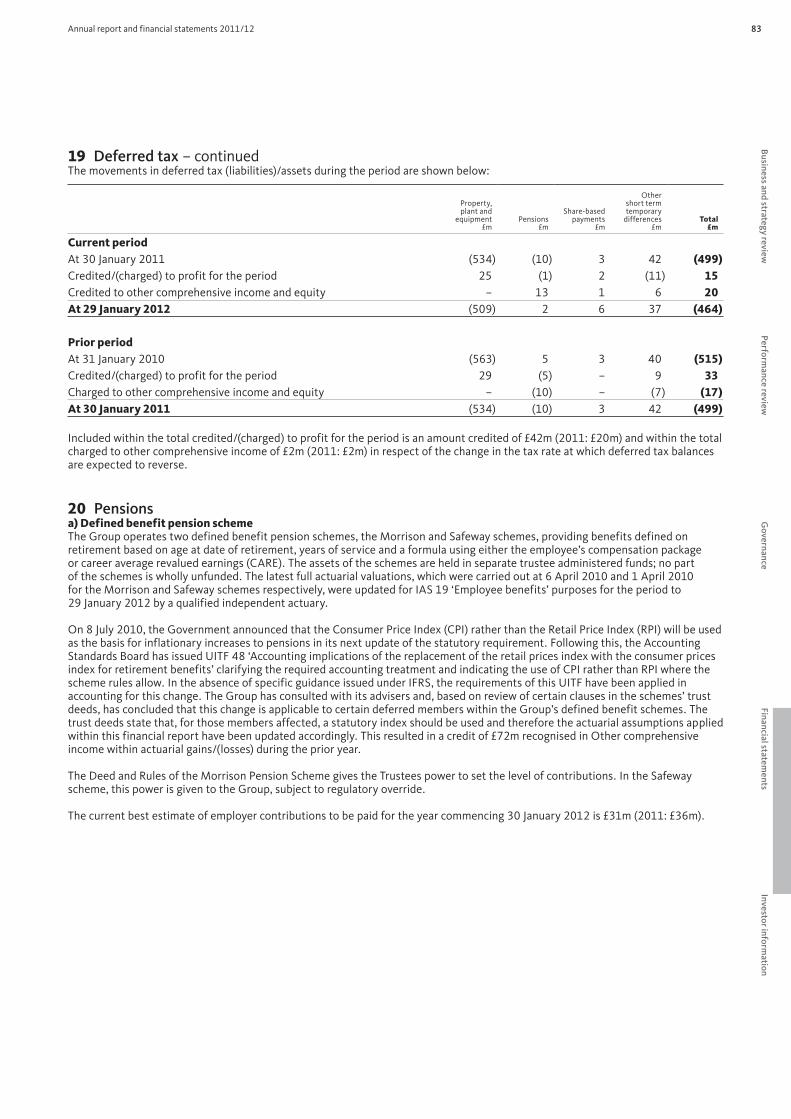
83Annual report and financial statements 2011/12
19 Deferred tax – continuedThe movements in deferred tax (liabilities)/assets during the period are shown below:
Property, plant and
equipment £m
Pensions£m
Share-based payments
£m
Othershort termtemporary
differences£m
Total£m
Current periodAt 30 January 2011 (534) (10) 3 42 (499)Credited/(charged) to profit for the period 25 (1) 2 (11) 15Credited to other comprehensive income and equity – 13 1 6 20At 29 January 2012 (509) 2 6 37 (464)
Prior periodAt 31 January 2010 (563) 5 3 40 (515)Credited/(charged) to profit for the period 29 (5) – 9 33Charged to other comprehensive income and equity – (10) – (7) (17)At 30 January 2011 (534) (10) 3 42 (499)
Included within the total credited/(charged) to profit for the period is an amount credited of £42m (2011: £20m) and within the total charged to other comprehensive income of £2m (2011: £2m) in respect of the change in the tax rate at which deferred tax balances are expected to reverse.
20 Pensionsa) Defined benefit pension schemeThe Group operates two defined benefit pension schemes, the Morrison and Safeway schemes, providing benefits defined on retirement based on age at date of retirement, years of service and a formula using either the employee’s compensation package or career average revalued earnings (CARE). The assets of the schemes are held in separate trustee administered funds; no part of the schemes is wholly unfunded. The latest full actuarial valuations, which were carried out at 6 April 2010 and 1 April 2010 for the Morrison and Safeway schemes respectively, were updated for IAS 19 ‘Employee benefits’ purposes for the period to 29 January 2012 by a qualified independent actuary.
On 8 July 2010, the Government announced that the Consumer Price Index (CPI) rather than the Retail Price Index (RPI) will be used as the basis for inflationary increases to pensions in its next update of the statutory requirement. Following this, the Accounting Standards Board has issued UITF 48 ‘Accounting implications of the replacement of the retail prices index with the consumer prices index for retirement benefits’ clarifying the required accounting treatment and indicating the use of CPI rather than RPI where the scheme rules allow. In the absence of specific guidance issued under IFRS, the requirements of this UITF have been applied in accounting for this change. The Group has consulted with its advisers and, based on review of certain clauses in the schemes’ trust deeds, has concluded that this change is applicable to certain deferred members within the Group’s defined benefit schemes. The trust deeds state that, for those members affected, a statutory index should be used and therefore the actuarial assumptions applied within this financial report have been updated accordingly. This resulted in a credit of £72m recognised in Other comprehensive income within actuarial gains/(losses) during the prior year.
The Deed and Rules of the Morrison Pension Scheme gives the Trustees power to set the level of contributions. In the Safeway scheme, this power is given to the Group, subject to regulatory override.
The current best estimate of employer contributions to be paid for the year commencing 30 January 2012 is £31m (2011: £36m).
Business and strategy review
Perform
ance review
Governance
Financial statements
Investor information

84 Financial statements Wm Morrison Supermarkets PLC
Notes to the Group financial statements – continued52 weeks ended 29 January 2012
20 Pensions – continuedb) AssumptionsThe major assumptions used in this valuation to determine the present value of the schemes’ defined benefit obligation are shown below:
i) Financial
2012 2011
Rate of increases in salaries 4.55% 5.05%Rate of increase in pensions in payment and deferred pensions 2.50%–3.30% 3.30%–3.80%Discount rate applied to scheme liabilities 4.75% 5.60%Inflation assumption 3.30% 3.80%
ii) LongevityThe average life expectancy in years of a member who reaches normal retirement age of 65 and is currently aged 45 is as follows:
2012 2011
Male 24.4 24.2Female 25.3 25.1
The average life expectancy in years of a member retiring at the age of 65 at balance sheet date is as follows:
2012 2011
Male 22.0 21.8Female 23.0 22.8
Assumptions regarding future mortality experience are set based on actuarial advice and in accordance with published statistics. The longevity assumption considers how long a member will live when they reach the age of retirement. Amongst the UK population, there is a continuing trend for a generation to live longer than the preceding generation, and this has been reflected in the longevity assumption. This means that a 45-year-old today is assumed to live on average longer than a 65-year-old today. This particular adjustment, described in the mortality tables below, is known as ‘long cohort’ and is in-line with the latest advice from the Pension Regulator.
In calculating the present value of the liabilities, the actuary selects the appropriate mortality table that reflects the longevity assumption. The most up to date tables are used in each period. The current mortality table used is S1PMA/S1PFA-Heavy YOB (2011: S1PMA/S1PFA-Heavy YOB). As disclosed in the Critical accounting assumptions and estimates section on page 69, the results of the experience study conducted for the Safeway scheme have been used to adjust the longevity assumption for both schemes.
iii) Expected return on assetsThe major assumptions used to determine the expected future return on the schemes’ assets, were as follows:
2012 2011
Long term rate of return on:Equities 5.90% 7.45%Corporate bonds 4.75% 5.60%Gilts 2.90% 4.44%Property related funds – 5.60%Cash 1.50% 1.50%
The assumptions used by the actuary are the best estimates chosen from a range of possible actuarial assumptions which, due to the timescales covered, may not necessarily be borne out in practice. The expected return on plan assets is based on market expectation at the beginning of the period for returns over the entire life of the benefit obligation.

85Annual report and financial statements 2011/12
20 Pensions – continuedc) ValuationsAssets of the schemes are held in order to generate cash to be used to satisfy the schemes’ obligations, and are not necessarily intended to be realised in the short term. The allocation of assets between categories is governed by the investment principles of each scheme and is the responsibility of the trustees of each respective scheme. The trustees should take due consideration of the Group’s views and a representative of the Group attends Trustee Investment Committees. The fair value of the schemes’ assets, which may be subject to significant change before they are realised, and the present value of the schemes’ liabilities which are derived from cash flow projections over long periods and are inherently uncertain, are as follows:
2012£m
2011£m
Equities 1,054 1,001Corporate bonds 724 667Gilts 805 622Property and property related funds – 4Cash 6 10Total fair value of schemes’ assets 2,589 2,304Present value of defined benefit funded obligation (2,600) (2,266)Net pension (liability)/asset recognised in the balance sheet (11) 38Related deferred tax asset/(liability) (note 19) 2 (10)Net (deficit)/surplus (9) 28
The movement in the fair value of the schemes’ assets over the year was as follows:
2012£m
2011£m
Fair value of scheme assets at start of period 2,304 2,111Expected return on scheme assets 140 126Actuarial gain recognised in other comprehensive income 148 62Employer contributions 31 41Employee contributions 10 10Benefits paid (44) (46)Fair value of scheme assets at end of period 2,589 2,304
The above pension scheme assets do not include any investments in the Parent Company’s own shares or property occupied by any member of the Group.
The movement in the present value of the defined benefit obligation during the period was as follows:
2012£m
2011£m
Defined benefit obligation at start of period (2,266) (2,128)Current service cost (28) (26)Employee contributions (10) (10)Interest on defined benefit obligation (127) (120)Actuarial loss recognised in other comprehensive income (213) (28)Benefits paid 44 46Defined benefit obligation at end of period (2,600) (2,266)
d) SensitivitiesBelow is listed the impact on the liabilities at 29 January 2012 of changing key assumptions whilst holding other assumptions constant:
Discount factor +/– 0.1% £65mLongevity +/– 1 year £80m
Business and strategy review
Perform
ance review
Governance
Financial statements
Investor information

86 Financial statements Wm Morrison Supermarkets PLC
Notes to the Group financial statements – continued52 weeks ended 29 January 2012
20 Pensions – continuede) Profit for the periodThe following amounts have been charged in employee benefits in arriving at operating profit:
2012£m
2011£m
Current service cost 28 26
The amounts for current service cost and pensions credit have been charged in the following Statement of comprehensive income lines:
2012£m
2011£m
Cost of sales (22) (21)Administrative expenses (6) (5)
(28) (26)
The following amounts have been included in finance income:
2012£m
2011£m
Expected return on pension scheme assets 140 126Interest on pension scheme liabilities (127) (120)
13 6
f) Actuarial gains and losses recognised in other comprehensive incomeThe amounts included in the other comprehensive income were:
2012£m
2011£m
Actual return less expected return on scheme assets 148 62Experience gains and losses arising on scheme obligation 2 (128)Changes in financial assumptions underlying the present value of scheme obligations (215) 100Actuarial movement recognised in other comprehensive income (65) 34Taxation on actuarial movement in other comprehensive income (note 19) 13 (10)Net actuarial movement recognised in other comprehensive income (52) 24
2012£m
2011£m
Cumulative gross actuarial movement recognised in other comprehensive income (190) (125)Taxation on cumulative actuarial movement recognised in other comprehensive income 47 34Cumulative net actuarial movement recognised in other comprehensive income (143) (91)
The actual return on schemes’ assets can therefore be summarised as follows:
2012£m
2011£m
Expected return on schemes’ assets 140 126Actuarial movement recognised in other comprehensive income reflecting the difference between expected and actual return on assets 148 62Actual return on schemes’ assets 288 188
The expected return on schemes’ assets was determined by considering the expected returns available on the assets underlying the current investment policy. Expected yields on fixed interest investments are based on gross redemption yields as at the balance sheet date. Expected returns on equity and property investments reflect long term real rates of return experienced in the respective markets.

87Annual report and financial statements 2011/12
20 Pensions – continuedg) History of experience gains and losses
2012£m
2011£m
2010£m
2009£m
2008£m
Difference between the expected and actual return on scheme assets:
– Amount 148 62 245 (425) (113)– Percentage of scheme assets 5.7% 2.7% 11.6% (24.2%) (5.8%)
Experience gains and losses arising on scheme liabilities:– Amount 2 (128) – (4) 83– Percentage of present value of scheme obligation 0.1% (5.6%) – (0.2%) 4.1%
Effects to changes in the demographic and financial assumptions underlying the present value of the scheme liabilities:
– Amount (215) 100 (316) 328 (6)– Percentage of present value of scheme obligation (8.3%) 4.4% (14.8%) 18.2% (0.3%)
Total amount recognised in other comprehensive income:
– Amount (65) 34 (71) (101) (36)– Percentage of present value of scheme obligation (2.5%) 1.5% (3.3%) (5.6%) (1.8%)
Total value of schemes’ assets 2,589 2,304 2,111 1,758 1,939Present value of defined benefit obligation (2,600) (2,266) (2,128) (1,807) (2,007)Net pension (liability)/asset recognised in the balance sheet (11) 38 (17) (49) (68)
h) Defined contribution pension schemeEmployees joining the Company after September 2000 are no longer eligible to gain automatic entry into the defined benefit pension scheme. In June 2001, the Company established a stakeholder pension scheme, open to all employees, to which the Company makes matching contributions of a maximum of 5% of eligible earnings. Pension costs for the defined contribution scheme are as follows:
2012£m
2011£m
Stakeholder pension scheme (5) (4)Life assurance scheme (2) (2)Total costs (7) (6)
21 ProvisionsProperty
provisions£m
At 30 January 2011 92Charged to profit for the period 4Unused amounts reversed during the period (11)Utilised in period (5)Unwinding of discount 4At 29 January 2012 84
Property provisions comprise onerous leases provision, petrol filling station decommissioning reserve and provisions for dilapidations on leased buildings.
Onerous leases relate to sublet and vacant properties. Where the rent receivable on the properties is less than the rent payable, a provision based on present value of the net cost is made to cover the expected shortfall. The lease commitments range from one to 61 years. Market conditions have a significant impact and hence the assumptions on future cash flows are reviewed regularly and revisions to the provision made where necessary.
Other property provisions comprise petrol filling station decommissioning reserve and dilapidations cost. Provision is made for decommissioning costs for when the petrol filling station tanks reach the end of their useful life or when they become redundant and is based on the present value of costs to be incurred to decommission the petrol tanks. Dilapidation costs are incurred to bring a leased building back to the condition in which it was originally leased. Provision is made for these costs, which are incurred on termination of the lease.
Business and strategy review
Perform
ance review
Governance
Financial statements
Investor information

88 Financial statements Wm Morrison Supermarkets PLC
Notes to the Group financial statements – continued52 weeks ended 29 January 2012
22 Called-up share capital
Number ofshares
millionsShare capital
£mShare premium
£mTotal
£m
Current periodAt 30 January 2011 2,658 266 107 373Shares cancelled (126) (13) – (13)At 29 January 2012 2,532 253 107 360
Prior periodAt 31 January 2010 2,651 265 92 357Share options exercised 7 1 15 16At 30 January 2011 2,658 266 107 373
The total authorised number of ordinary shares is 4,000 million shares (2011: 4,000 million shares) with a par value of 10p per share (2011: 10p per share). All issued shares are fully paid.
There were 245,378 shares issued pursuant to the exercise of options (2011: 6,666,293) with a nominal value of £0.02m (2011: £1m) and an aggregate consideration of £0.5m (2011: £16m). Shares cancelled of 125,699,939 relate to the equity retirement programme (note 23).
The holders of ordinary shares are entitled to receive dividends as declared from time-to-time and are entitled to one vote per share at the meetings of the Company.
23 Reserves
2012£m
2011£m
Capital redemption reserve 19 6Merger reserve 2,578 2,578Hedging reserve (12) 5Retained earnings 2,452 2,458Total 5,037 5,047
Included in retained earnings is a deduction of £21m (2011: £31m) in respect of own shares held at the balance sheet date. This represents the cost of 8,887,915 (2011: 13,181,346) of the Company’s ordinary shares (nominal value of £0.9m (2011: £1.3m)). These shares are held by a trust using funds provided by the Group and were acquired to meet obligations under the Group’s share option schemes. The market value of the shares at 29 January 2012 was £26m (2011: £35m). The trust has waived its rights to dividends. These shares are not treasury shares as defined by the London Stock Exchange.
a) Capital redemption reserveThe capital redemption reserve at the start of the period related to 57,788,600 of the Company’s own shares which it purchased on the open market for cancellation between 31 March 2008 and 21 November 2008 at a cost of £146m. The shares repurchased represented 2.15% of the ordinary share capital of the Company at 3 February 2008.
The movement in the period of £13m relates to 125,699,939 of the Company’s own shares which it purchased on the open market for cancellation between 10 March 2011 and 27 January 2012. The total amount paid to acquire the shares, net of tax, was £368m and has been deducted from retained earnings within shareholders’ equity. The shares purchased represent 5% of the ordinary share capital at 29 January 2012.
b) Merger reserveThe merger reserve represents the reserve in the Company’s balance sheet arising on the acquisition in 2004 of Safeway Limited. In the opinion of the Directors, this reserve is not distributable and accordingly it will be carried forward as a capital reserve.
c) Hedging reserveThis represents the gains and losses arising on derivatives used for cash flow hedging, principally from the Group’s cross-currency swaps, energy price contracts and forward exchange contracts (note 17).

89Annual report and financial statements 2011/12
24 Cash flow from operating activities
2012£m
2011£m
Profit for the period 690 632Adjustments for:Taxation 257 242Depreciation 319 309Amortisation 21 10Loss on disposal of property, plant and equipment 2 1Net finance cost 26 30Other non-cash changes 25 16Excess of contributions over pension service cost (3) (15)Increase in stocks (117) (61)Increase in debtors (49) (75)Increase in creditors 101 60Decrease in provisions (8) (8)Cash generated from operations 1,264 1,141
25 Analysis of net debt
2012£m
2011£m
Cash and cash equivalents per balance sheet 241 228Bank overdrafts (note 17) (29) –Cash and cash equivalents per cash flow 212 228Energy price contracts 3 7Other financial assets (note 14) 3 7Short term borrowings (80) –Energy price contracts (5) –Forward foreign exchange contracts (1) –Current financial liabilities (note 17) (86) –Bonds (955) (559)Private placement loan notes (156) –Floating credit facility (470) (475)Other unsecured loans – (11)Cross-currency swaps (8) –Energy price contracts (4) –Finance lease obligations (7) (7)Non-current financial liabilities (note 17) (1,600) (1,052)Net debt (1,471) (817)
Cash and cash equivalents include restricted balances of £67m (2011: £78m) held by the Group’s captive insurer subsidiary, Farock Insurance Company Limited. The cash is held to cover the liabilities of this entity.
26 Share-based paymentsThe Group operates a number of share-based payments schemes: the Executive share option scheme, the Sharesave scheme, an equity-settled Long Term Incentive Plan (LTIP), restricted share awards and deferred share awards.
The total charge for the period relating to employee share-based payment plans was £24m (2011: £19m), all of which related to equity-settled share-based payment transactions. The total charge to equity for the period, net of tax, was £25m (2011: £17m).
a) Share option schemesi) Executive share option schemeIn May 1995, the Group adopted the 1995 Senior Executive Share Option Scheme, which was made available to Directors and other senior employees. The scheme was terminated on 25 May 2005.
There are no options outstanding at the end of the period (2011: 157,000) due to all options being exercised. The weighted average exercise price of the options exercised during the period was £2.04 (2011: £1.89).
Business and strategy review
Perform
ance review
Governance
Financial statements
Investor information

90 Financial statements Wm Morrison Supermarkets PLC
Notes to the Group financial statements – continued52 weeks ended 29 January 2012
26 Share-based payments – continuedii) Sharesave schemeThe Sharesave scheme has been in operation since May 2000 and all employees (including Executive Directors) are eligible once the necessary service requirements have been met. The scheme allows participants to save up to a maximum of £250 each month for a fixed period of three years. Options are offered at a discount of 20% to the mid-market closing price on the day prior to the offer and are exercisable for a period of six months commencing after the end of the fixed period of the contract. The exercise of options under this scheme is only subject to service conditions and is equity-settled. The scheme launched in May 2011 and is under the new scheme rules, approved by the shareholders in June 2010.
Options which have been granted to those eligible employees, including Directors, who chose to participate in the scheme have been fair valued using a binomial stochastic option pricing model. The fair value of options granted and the assumptions were as follows:
Grant date 17 May 2011 18 May 2010 14 May 2009 18 May 2007
Share price at grant date £3.01 £2.70 £2.43 £3.26Fair value of options granted £11.5m £9.7m £17.4m £12.3mExercise price £2.28 £2.37 £1.98 £2.47Dividend yield 3.20% 3.04% 2.38% 1.23%Annual risk free interest rate 1.65% 1.63% 2.10% 5.58%Expected volatility* 24.2% 26.5% 28.0% 23.5%
*The volatility measured at the standard deviation of expected share price returns is based on statistical analysis on weekly share prices over the past 3.37 years prior to the date of grant.
The requirement that the employee has to save in order to purchase shares under the Sharesave plan is a non-vesting condition.This feature has been incorporated into the fair value at grant date by applying a discount to the valuation obtained from the binomial stochastic option pricing model using the assumptions disclosed above. The discount has been determined by estimating the probability that the employee will stop saving based on expected future trends in the share price and employee behaviour.
2012 2012 2011 2011
Weighted average exercise price in
£ per shareOptions
thousands
Weighted average exercise price in
£ per shareOptions
thousands
Movement in outstanding optionsOutstanding at start of period 2.14 38,701 2.07 32,218Granted 2.28 15,380 2.37 17,450Exercised 2.09 (88) 2.46 (5,764)Forfeited 2.25 (5,591) 2.15 (5,203)Outstanding at end of period 2.17 48,402 2.14 38,701Exercisable at end of period – – 2.47 20

91Annual report and financial statements 2011/12
26 Share-based payments – continued
2012 2012 2011 2011
Weighted averageshare price at date
of exercise £
Number of shares
thousands
Weighted average share price at date
of exercise £
Number ofshares
thousands
Share options exercised in the financial period 2.94 88 2.70 5,764
2012 2011
Share options outstanding at the end of the periodRange of exercise prices £1.98 – £2.37 £1.98 – £2.47Weighted average remaining contractual life 1.7 years 2.3 years
b) Long term incentive plansIn May 2007, a discretionary LTIP for the benefit of certain employees as approved by the Remuneration Committee was introduced. The awards are free share-based awards, with non-market vesting conditions attached, that accrue the value of dividends over the vesting period.
The maximum total market value of shares over which awards may be granted to any employee during any financial year of the Company is 300% of salary. Awards normally vest three years after the original grant date, provided the relevant performance criteria have been met.
The fair value at the date of grant, which is being charged to profit for the period over the three year vesting period, has been calculated based on the following assumptions:
Grant date1 Oct 2011
18 Apr 2011
14 Oct2010
22 Apr2010
29 Jan 2010
20 Oct 2009
9 Apr2009
14 Oct2008
14 Apr2008
Share price at grant date £3.02 £2.85 £2.96 £2.97 £2.93 £2.71 £2.50 £2.42 £2.77Assumed leavers 5% 5% 8% 8% – 5% 5% 5% 5%Performance criteria 77% 77% 80% 80% 90% 90% 90% 90% 90%Fair value of share awards granted £1.4m £23.3m £1.1m £14.4m £1.1m £1.0m £18.8m £0.6m £12.5m
2012 2011
Shareawards
thousands
Shareawards
thousands
Movement in outstanding share awardsOutstanding at start of period 19,725 17,976Granted 8,651 7,862Exercised (4,258) (3,423)Forfeited (1,412) (2,690)Outstanding at end of period 22,706 19,725Exercisable at end of period – –
2012 2011
Share awards outstanding at the end of the periodWeighted average remaining contractual life 1.8 years 1.4 years
Business and strategy review
Perform
ance review
Governance
Financial statements
Investor information

92 Financial statements Wm Morrison Supermarkets PLC
Notes to the Group financial statements – continued52 weeks ended 29 January 2012
26 Share-based payments – continuedc) Restricted share awardsAs part of the package for certain senior management, restricted share awards may be granted. These are primarily designed to replace the value of share scheme awards forfeited from the previous employer. Vesting of these awards is only subject to service conditions and is equity-settled.
The fair value at the date of grant, which is being charged to profit for the period over the vesting period, has been calculated based on the following assumptions:
Grant date 2012 2011
Share price at grant date £2.71 £2.95Assumed leavers 0% 0%Exercise price £nil £nilFair value of share awards granted £1.9m £0.4m
Share awards outstanding at the end of the period are 817,000 (2011: 121,000). The movement in share awards during the period relates to new awards being granted. No awards have vested during the period.
The weighted average remaining contractual life of the share awards is 1 year (2011: 1.2 years).
d) Deferred share bonus planAs part of the annual bonus plan, certain members of senior management are eligible for the deferred share bonus plan which allows 33% to 50% of any bonus payable to be deferred in shares for three years from the date the deferred shares are made. Dividend equivalents accrue over the vesting period, to be paid when the shares vest. Vesting of these share awards is only subject to service conditions and is equity-settled.
The fair value at the date of grant, which is being charged to profit for the period over the vesting period, has been calculated based on the following assumptions:
Grant date 2012
Share price at grant date £2.76Assumed leavers 0%Exercise price £nilFair value of share awards granted £1.8m
Share awards outstanding at the end of the period are 659,000. The movement in share awards during the period relates to new awards being granted. No awards have vested during the period.
The weighted average remaining contractual life of the share awards is 2.2 years.
27 Business combinationsIFRS 3 (revised) ‘Business combinations’ has been applied to the two acquisitions completed during the period.
On 28 February 2011, the Group acquired the trade and assets of kiddicare.com Limited (‘Kiddicare’), a multi-channel online retailer. The total cash consideration for the purchase was £70m.
Assets and liabilities recognised as a result of the acquisition:Fair values
on acquisition£m
Property, plant and equipment (note 11) 9Brand (included in intangibles) (note 10) 15IT hardware and software 20Other assets 2Net identifiable assets acquired 46Goodwill 24Total cash consideration 70
Goodwill relates to the technological know-how and potential future multi-channel sales. The acquisition will provide the Group with further expertise in relation to online retailing. The goodwill arising on the acquisition is tax deductible.
The revenue included in the Consolidated statement of comprehensive income since 28 February 2011 contributed by Kiddicare was £43m. Kiddicare also contributed operating profit of £1m over the same period. Given the close proximity of the acquisition date to the beginning of the financial year, it is not considered material to disclose annualised revenue and profit results since 31 January 2011.

93Annual report and financial statements 2011/12
27 Business combinations – continuedOn 10 June 2011, the Group acquired 100% of the ordinary share capital of Flower World Limited, a wholesale flower business. This will provide the Group with the capacity to handle all flower requirements in-house. Total consideration (including deferred consideration) was £6m. Goodwill and intangible assets acquired were £3m and other assets acquired were £3m.
28 Capital commitments
2012£m
2011£m
Contracts placed for future capital expenditure not provided in the financial statements 103 178
29 Operating lease arrangementsa) Lessee arrangementsThe Group has outstanding commitments for future minimum lease payments under non-cancellable operating leases. The leases have varying terms, escalation clauses and renewal rights, and fall due as follows:
2012 2011
Property£m
Vehicles, plant and
equipment£m
Property£m
Vehicles, plant and
equipment£m
Within one year 50 10 44 10More than one year and less than five years 184 9 202 14After five years 669 – 518 –
903 19 764 24
b) Lessor arrangementsThe Group has non-cancellable agreements with tenants with varying terms, escalation clauses and renewal rights. The future minimum lease income is as follows:
2012£m
2011£m
Within one year 28 27More than one year and less than five years 95 92After five years 127 138
250 257
30 Post balance sheet eventsOn 31 January 2012, the Group exchanged contracts on the Winsford site from Vion Food Group Limited, a meat packing business based in Cheshire. Total cash consideration of £20m is attributable to the net assets acquired; there is no goodwill arising. The acquisition will strengthen the Group’s ability to provide pre-packed retail fresh meat to supplement our in-store butcheries.
Business and strategy review
Perform
ance review
Governance
Financial statements
Investor information

94 Financial statements Wm Morrison Supermarkets PLC
Notes to the Group financial statements – continued52 weeks ended 29 January 2012
31 Principal subsidiaries
Subsidiaries of Wm Morrison Supermarkets PLC Principal activity Equity holding%
Farmers Boy Limited Manufacturer and distributor of fresh food products 100Neerock Limited Fresh meat processor 100Wm Morrison Produce Limited Produce packer 100Safeway Limited Holding company 100Optimisation Developments Limited Property development 100Subsidiaries of other Group companiesSafeway Stores Limited Grocery retailer 100
The Group has taken advantage of the exemption under Section 410(2) of Companies Act 2006 by providing information only in relation to subsidiary undertakings whose results or financial position, in the opinion of the Directors, principally affected the financial statements.
All of the above companies are registered in England and Wales and the principal area of trading for all the above companies is the United Kingdom.
The Group currently owns 51% of the share capital of Farmers Boy (Deeside) Limited. However, due to the nature of options in place to purchase the remaining 49% share capital in 2013, the subsidiary has been treated as if it were already 100% owned for accounting purposes. Deferred consideration of £13m, in relation to these options, is held within other creditors.
The Company is also part of a joint venture, with The Great Steward of Scotland Dumfries House Trust, to form The Morrisons Farm at Dumfries House Limited, whose principal activity is to farm 859 acres of agricultural land located on the Dumfries House Estate near Cumnock in Ayrshire, Scotland. This has been accounted for as a joint venture in accordance with IFRS, however, as the results are not material to the Group, no further disclosure has been made of the accounting policies within the consolidated financial statements.
In addition to the above, the Company has a number of other subsidiary companies, particulars of which will be annexed to the next annual return.

95Annual report and financial statements 2011/12
Wm Morrison Supermarkets PLC Company balance sheet29 January 2012
Note2012
£m2011
£m
Fixed assetsTangible assets 34 3,288 3,086Derivative financial assets 35 1 3Investments 36 3,467 3,366
6,756 6,455Current assetsStocks – goods for resale 478 400Derivative financial assets 35 2 4Debtors – amounts falling due within one year 37 668 514Cash and cash equivalents 91 69
1,239 987Creditors – amounts falling due within one year 38 (3,594) (3,032)
Net current liabilities (2,355) (2,045)
Total assets less current liabilities 4,401 4,410
Creditors – amounts falling due after more than one year 39 (1,035) (475)
Provisions for liabilities 40 (109) (96)
Net assets – excluding pension asset 3,257 3,839Net pension asset 41 – 12Net assets – including pension asset 3,257 3,851
Capital and reservesCalled-up share capital 43 253 266Share premium 44 107 107Capital redemption reserve 44 19 6Merger reserve 44 2,578 2,578Hedging reserve 44 (12) 5Profit and loss account 44 312 889Equity shareholders’ funds 3,257 3,851
The accounting policies on pages 96 to 98 and notes on pages 99 to 107 form part of these financial statements.
The financial statements on pages 95 to 107 were approved by the Board of Directors on 7 March 2012 and were signed on its behalf by:
Dalton Philips Richard PennycookChief Executive Group Finance Director
Business and strategy review
Perform
ance review
Governance
Financial statements
Investor information

96 Financial statements Wm Morrison Supermarkets PLC
Wm Morrison Supermarkets PLC – Company accounting policies52 weeks ended 29 January 2012 under UK GAAP
Basis of preparationThese separate financial statements of Wm Morrison Supermarkets PLC (the Company) have been prepared on a going concern basis under the historic cost convention, except as disclosed in the accounting policies set out below, and in accordance with applicable accounting standards under UK GAAP and the Companies Act 2006.
The following accounting policies have been applied consistently in dealing with items which are considered material in relation to the Company’s financial statements.
Accounting reference dateThe accounting period of the Company ends on the Sunday falling between 29 January and 4 February each year.
Investmentsa) Investments in subsidiary undertakingsInvestments in subsidiary undertakings are stated at cost less provision for impairment.
b) Investments in equity instrumentsAll equity instruments are held for long term investment and are measured at fair value, where the fair value can be measured reliably. Where the fair value of the instruments cannot be measured reliably, the investment will be recognised at cost less accumulated impairment losses in accordance with FRS 26 ‘Financial instruments: recognition and measurement’. Any impairment is recognised immediately in profit or loss.
Fixed assetsFixed assets are stated at cost less accumulated depreciation and accumulated impairment losses. Costs include directly attributable costs. Annual reviews are made of estimated useful lives and material residual values.
DepreciationThe policy of the Company is to provide depreciation at rates which are calculated to write off the cost less residual value of tangible fixed assets on a straight line basis. The rates applied are:
Freehold land 0%Freehold buildings 2.5%Leasehold improvements Over the shorter of lease period
and 2.5%Plant, equipment,fixtures and vehicles 10% to 33%Assets under construction 0%
Fixed assets are reviewed for indications of impairment when events or changes in circumstances indicate that the carrying amount may not be recoverable. This is performed for each income generating unit, which in the case of a supermarket is an individual retail outlet. If there are indications of possible impairment, then a test is performed on the asset affected to assess its recoverable amount against carrying value. An impaired asset is written down to its recoverable amount, which is the higher of value in use or its net realisable value. In assessing value in use, the estimated future cash flows are discounted to their present value using a pre-tax discount rate that reflects current market assessments of the time value of money and the risks specific to the asset.
If there is indication of an increase in fair value of an asset that had been previously impaired, then this is recognised by reversing the impairment, but only to the extent that the
recoverable amount does not exceed the carrying amount that would have been determined if no impairment loss had been recognised for the asset.
Financial instrumentsFinancial assets and liabilities are recognised on the Company’s balance sheet when the Company becomes a party to the contractual provisions of the instrument.
a) Financial assetsi) Trade and other debtors: Trade and other debtors are initially recognised at fair value. Provision is made when there is objective evidence that the Company will not be able to recover balances in full, with the charge being recognised in the profit and loss account. Balances are written off when the probability of recovery is assessed as being remote.
ii) Cash: Cash and cash equivalents includes cash-in-hand, cash-at-bank and bank overdrafts together with short term, highly-liquid investments that are readily convertible into known amounts of cash, with an insignificant risk of a change in value, within three months from the date of acquisition.
b) Financial liabilitiesi) Trade and other creditors: Trade and other creditors are stated at fair value.
ii) Borrowings: Borrowings are initially recorded at fair value, net of attributable transaction costs. Subsequent to initial recognition, any difference between the redemption value and the initial carrying amount is recognised in profit for the period over the period of the borrowings on an effective interest rate basis.
c) Derivative financial instrumentsDerivative financial instruments are initially measured at fair value, which normally equates to cost, and are remeasured at fair value through profit or loss, except where the derivative qualifies for hedge accounting.
i) Cash flow hedgesDerivative financial instruments are classified as cash flow hedges when they hedge the Company’s exposure to variability in cash flows that are either attributable to a particular risk associated with a recognised asset or liability, or a highly probable forecast transaction.
The Company has cross-currency swaps designated as cash flow hedges. These derivative financial instruments are used to match or minimise risk from potential movements in foreign exchange rates inherent in the cash flows of the US Dollar private placement loan notes.
To minimise the risk from potential movements in energy prices, the Company has energy price contracts which are designated as cash flow hedges.
To minimise the risk from potential movements in foreign exchange rates, the Company uses forward exchange contracts which are designated as cash flow hedges.
Derivatives are reviewed annually for effectiveness. Where a derivative financial instrument is designated as a hedge of the variability in cash flows of a recognised asset or liability, or highly probable forecast transaction, the effective part of any gain or loss on the movement in fair value of the derivative financial instrument is recognised directly in equity through the statement of total recognised gains and losses (STRGL).

97Annual report and financial statements 2011/12
The gain or loss on any ineffective part of the hedge is immediately recognised in the profit and loss account within cost of sales for the energy price contracts and within interest payable in relation to the cross-currency swaps. If a hedge of a forecast transaction subsequently results in the recognition of a financial asset or liability, the associated cumulative gains or losses that were recognised directly in equity are reclassified into the profit and loss account when the transaction occurs.
ii) Fair value hedgesDerivative financial instruments are classified as fair value hedges when they hedge the Company’s exposure to changes in fair value of a recognised asset or liability or an unrecognised firm commitment. The hedging instrument is stated at fair value and any changes in fair value are immediately recognised in equity.
Hedge accounting is discontinued when the hedging instrument expires or is sold, terminated or exercised, or no longer qualifies for hedge accounting. At that time, any cumulative gain or loss existing in equity at that time remains in equity and is recognised when the forecast transaction is ultimately recognised in the profit and loss account. When a forecast transaction is no longer expected to occur, the cumulative gain or loss reported in equity is immediately transferred to the profit and loss account.
Capital managementThe capital management policy of the Company is consistent with that of the Group set out in note 18.
Borrowing costsAll borrowing costs are recognised in the Company’s profit and loss account on an accruals basis, except for interest costs that are directly attributable to the construction of buildings and other qualifying assets which are capitalised and included within the initial cost of the asset. Capitalisation of interest ceases when the asset is ready for use.
Pension costsThe Company operates defined benefit and defined contribution schemes. A defined contribution scheme is a pension scheme under which the Company pays fixed contributions into a separate entity. A defined benefit scheme is one that is not a defined contribution scheme. Pension benefits under defined benefit schemes are defined on retirement based on age at date of retirement, years of service and a formula using either the employee’s compensation package or career average revalued earnings.
The Company operates a defined benefit retirement scheme which is funded by contributions from the Company and members. The defined benefit scheme is not open to new members. Pension scheme assets, which are held in separate trustee administered funds, are valued at market rates. Pension scheme obligations are measured on a discounted present value basis using assumptions as shown in note 41. The operating and financing costs of the scheme are recognised separately in the profit and loss account in the period in which they arise. Death-in-service costs are recognised on a straight line basis over their vesting period. Actuarial gains and losses are recognised immediately in the STRGL.
The Company has a right to recognise an asset, should one arise, in respect of the Company’s net obligations to the pension schemes. Therefore either an asset or a liability is recognised in the balance sheet, and is stated net of deferred tax.
A liability or asset is recognised in the balance sheet in respect of the Company’s net obligations to the scheme and is stated net of deferred tax.
The Company also operates a stakeholder pension scheme and contributions are charged to the profit and loss account as they arise.
Foreign currenciesTransactions in foreign currencies are recorded at the rates of exchange at the dates of the transactions. At each balance sheet date, monetary assets and liabilities that are denominated in foreign currency are retranslated at the rates of exchange at the balance sheet date. Gains and losses arising on retranslation are included in the profit and loss account for the period except when they deferred in reserves as qualifying cash flow hedges.
ProvisionsProvisions are created where the Company has a present legal or constructive obligation as a result of a past event, where it is probable that it will result in an outflow of economic benefits to settle the obligation from the Company, and where it can be reliably measured.
Provisions are made in respect of individual properties where there are obligations for onerous contracts, dilapidations and certain decommissioning obligations for petrol filling stations. The amounts provided are based on the Company’s best estimate of the likely committed outflow to the Company. Where material, these estimated outflows are discounted to net present value.
LeasesLeases in which substantially all the risks and rewards of ownership are retained by the lessor are classified as operating leases; all other leases are classified as finance leases.
Lessor accounting – operating leasesAssets acquired and held for use under operating leases are recorded as fixed assets and are depreciated on a straight line basis to their estimated residual values over their estimated useful lives. Operating lease income is recognised on a straight line basis to the date of the next rent review.
Lessee accounting – operating leasesRental payments are taken to the profit and loss account on a straight line basis over the life of the lease.
Lessee accounting – finance leasesThe present value of the minimum lease payments payable during the lease term is included within fixed assets and the corresponding lease commitments are shown as obligations to the lessor. Lease payments are split between capital and interest elements using the annuity method. Depreciation on the relevant assets and interest are charged to the profit and loss account.
Deferred and current taxationCurrent tax payable is based on the taxable profit for the year using tax rates in effect during the period. Taxable profit differs from the profit as reported in the profit and loss account as it is adjusted both for items that will never be taxable or deductible and timing differences.
Business and strategy review
Perform
ance review
Governance
Financial statements
Investor information

98 Financial statements Wm Morrison Supermarkets PLC
Wm Morrison Supermarkets PLC – Company accounting policies – continued52 weeks ended 29 January 2012 under UK GAAP
Deferred tax is provided in full on timing differences which result in an obligation at the balance sheet date to pay more tax, or a right to pay less tax, at a future date, at average rates expected to apply when they crystallise, based on tax rates enacted or substantively enacted at the balance sheet date. Timing differences arise from the inclusion of items of income and expenditure in taxation computations in different periods from those in which they are included in the financial statements.
A net deferred tax asset is recognised only when it is recoverable on the basis that it is more likely than not that there will be suitable taxable profits against which to recover carried forward tax losses and from which the future reversal of underlying timing differences can be deducted.
Deferred tax assets and liabilities are not discounted.
StocksStocks are measured at the lower of cost and net realisable value. Provision is made for obsolete and slow moving items. Cost is calculated on a weighted average basis and comprises purchase price, import duties and other non-recoverable taxes less rebates. Stocks represent goods for resale.
Net realisable value is the estimated selling price in the ordinary course of business, less estimated costs necessary to make the sale.
Share-based paymentsThe Company issues equity-settled share-based payments to certain employees in exchange for services rendered by them. The fair value of the share-based award is calculated at the date of grant and is expensed on a straight line basis over the vesting period with a corresponding increase in equity. This is based on the Company’s estimate of share options that will eventually vest. This takes into account movement of non-market conditions, being service conditions and financial performance, if relevant. The fair value of equity-settled awards granted is not subsequently revisited.
Fair value is measured by use of a binomial stochastic option pricing model. The expected life used in the model has been adjusted, based on management’s best estimate, for effects of non-transferability, exercise restrictions and behavioural considerations.
The cost of the share-based award relating to each subsidiary is calculated, based on an appropriate apportionment and recharged through intercompany.
Financial contractsWhere the Company enters into financial contracts to guarantee the indebtedness of other companies within its Group, the Company considers these to be insurance arrangements, and accounts for them as such. In this respect, the Company treats the guarantee contract as a contingent liability until such time as it becomes probable that the Company will be required to make a payment under the guarantee.
Share capitalOrdinary shares are classified as equity. Incremental costs directly attributable to the issue of new shares or options are shown in equity as a deduction, net of tax, from the proceeds.
Where the Company has purchased its own equity share capital, the consideration paid, including directly attributable incremental costs, is deducted from retained earnings until the shares are cancelled. On cancellation, the nominal value of the shares is deducted from share capital and the amount is transferred to the capital redemption reserve.
ExemptionsThe Company has taken advantage of the exemption from preparing a cash flow statement under the terms of FRS 1 ‘Cash flow statement’ and exemption from the disclosure requirements of FRS 29 ‘Financial instruments: disclosures’. The cash flows of the Company and financial instruments disclosures are included in the consolidated financial statements.
The Company is also exempt under the terms of FRS 8 ‘Related parties’ from disclosing related party transactions with wholly owned entities that are part of the Wm Morrison Supermarkets PLC Group.
The Company has taken advantage of the exemption available under section 408 of the Companies Act 2006 and not presented a profit and loss account for the Company.

99Annual report and financial statements 2011/12
Notes to the Company financial statements52 weeks ended 29 January 2012
32 Profit and loss accountThe profit after tax for the Company for the 52 week period was £86m (2011: £91m).
33 Employees and directors
2012£m
2011£m
Employee benefit expense for the Company during the periodWages and salaries 886 806Social security costs 64 64Share-based payments (note 45) 14 11Pension costs 19 18
983 899
The average number of persons employed by the Company during the period was as follows:
2012No.
2011No.
Stores 54,048 53,367Distribution 5,489 5,679Centre 2,906 2,713
62,443 61,759
The aggregate remuneration paid to or accrued for the key management for services in all capacities during the period is the same as the Group and is shown in note 4.
34 Tangible fixed assets
Land and buildings
Plant, equipment, fixtures & vehicles
£mTotal
£mFreehold
£mLeasehold
£m
CostAt 30 January 2011 2,651 519 1,275 4,445Additions at cost 206 68 121 395Interest capitalised 1 – – 1Disposals – (2) (3) (5)At 29 January 2012 2,858 585 1,393 4,836
Accumulated depreciationAt 30 January 2011 574 74 711 1,359Charged in the period 66 18 110 194Disposals – (2) (3) (5)At 29 January 2012 640 90 818 1,548
Net book valueAt 29 January 2012 2,218 495 575 3,288At 30 January 2011 2,077 445 564 3,086
Assets under construction included aboveAt 29 January 2012 2 – 138 140At 30 January 2011 1 1 130 132
Included above is an amount of £728m (2011: £712m) relating to non-depreciable land. The cost of property assets held as lessor included in the above figures is £267m at 29 January 2012 (2011: £227m). The related accumulated depreciation is £58m (2011: £47m).
Since 3 February 1985, the cost of financing property developments prior to their opening date has been included in the cost of the project.
The cumulative amount of interest capitalised in the total cost above amounts to £103m (2011: £102m). Interest is capitalised at the effective interest rate of 4% (2011: 4%) incurred on borrowings.
Business and strategy review
Perform
ance review
Governance
Financial statements
Investor information

100 Financial statements Wm Morrison Supermarkets PLC
Notes to the Company financial statements – continued52 weeks ended 29 January 2012
35 Derivative financial assets
2012£m
2011£m
Fixed assetsEnergy price contracts 1 3Current assetsEnergy price contracts 2 4
36 Investments
Investment in equity
instruments£m
Investment insubsidiary
undertakings£m
Total£m
CostAt 30 January 2011 – 3,367 3,367Additions 31 70 101At 29 January 2012 31 3,437 3,468
Provision for impairmentAt 30 January 2011 and 29 January 2012 – (1) (1)
Net book valueAt 29 January 2012 31 3,436 3,467At 30 January 2011 – 3,366 3,366
A list of the Company’s principal subsidiaries is shown in note 31.
37 Debtors – amounts falling due within one year
2012£m
2011£m
Trade debtors 145 156Amounts owed by subsidiary undertakings 333 290Other debtors 14 8Prepayments 176 60
668 514
Prepayments includes £130m (2011: £30m) relating to amounts falling due after more than one year.
38 Creditors – amounts falling due within one year
2012£m
2011£m
Trade creditors 1,282 1,349Amounts owed to subsidiary undertakings 1,856 1,392Other taxes 67 37Other creditors 45 57Floating credit facility 80 –Energy price contracts 5 –Accruals and deferred income 259 197
3,594 3,032

101Annual report and financial statements 2011/12
39 Creditors – amounts falling due after more than one year
2012£m
2011£m
Revolving credit facility – 1.4% (2011: 1.13%) 470 475US Dollar private placement loan notes 156 –£400m Sterling bonds 4.625% December 2023 397 –Cross-currency swaps 8 –Energy price contracts 4 –
1,035 475
On 8 December 2011, the Company issued £400m of Sterling bonds at a fixed rate of 4.625%, expiring in December 2023. The issue is part of a £3,000m Euro Medium Term Note Programme where the Company can from time-to-time issue notes denominated in any agreed currency.
On 2 November 2011, the Company issued $250m US private placement loan notes at a fixed rate of 4.4%, expiring in November 2026. The Company has put in place cross-currency swaps to swap the principal and fixed rate interest of the US Dollar private placement loan notes into fixed rate Sterling interest liabilities. The maturity dates of the cross-currency swaps match the underlying loan notes.
On 4 March 2011, the Company concluded a renewal of its floating credit finance. During the period the Company repaid the previous facility of £476m and drew down £475m of the new facility. The expiry date for the floating credit facility, March 2016, is consistent with the undrawn element of the facility disclosed below.
In the event of default of covenants on the bank facility, the principal amounts and any interest accrued are repayable on demand.
Finance leasesNet obligations under finance leases of £20m (2011: £nil) are payable in five or more years.
40 Provisions for liabilities
Deferred taxation£m
Property provisions£m
Total£m
At 30 January 2011 83 13 96Charge recognised in profit and loss 19 2 21Credit recognised directly in the STRGL (9) – (9)Unwinding of discount – 1 1At 29 January 2012 93 16 109
Further details of the property provisions are provided in note 21.
Included within the deferred taxation provision, £10m (2011: £5m) has been credited to the profit and loss and £3m (2011: £2m) has been charged to the STRGL in the period in respect of the change in the tax rate at which deferred tax balances are expected to reverse.
The potential deferred taxation on timing differences, calculated at 25% (2011: 27%), is set out below and has been provided for in full.
2012£m
2011£m
Excess of capital allowances over depreciation 123 115Provisions and short term timing differences (24) (30)Share-based payments (6) (2)Provision at the year end excluding deferred tax on pension asset 93 83Deferred tax liability on pension asset (note 41) – 4Provision at the year end including deferred tax on pension asset 93 87
The deferred tax liability of £nil (2011: £4m) relating to the pension asset has been deducted in arriving at the net pension asset on the balance sheet.
Business and strategy review
Perform
ance review
Governance
Financial statements
Investor information

102 Financial statements Wm Morrison Supermarkets PLC
Notes to the Company financial statements – continued52 weeks ended 29 January 2012
41 Pensionsa) Defined benefit pension schemeThe Company operates a pension scheme providing benefits defined on retirement based on age at date of retirement, years of service and a formula using either the employee’s compensation package or career average revalued earnings (CARE). The assets of the scheme are held in a separate trustee administered fund. The latest full actuarial valuations were carried out at 6 April 2010 and were updated for FRS 17 Retirement benefits purposes for the period to 29 January 2012 by a qualified independent actuary.
On 8 July 2010 the Government announced that the Consumer Price Index (CPI) rather than the Retail Price Index (RPI) will be used as the basis for inflationary increases to pensions in its next update of the statutory requirement. Following this, the Accounting Standards Board has issued UITF 48 ‘Accounting implications of the replacement of the retail prices index with the consumer prices index for retirement benefits’ clarifying the required accounting treatment and indicating the use of CPI rather than RPI where the scheme rules allow. The Company has consulted with its advisers and based on review of certain clauses in the schemes’ trust deeds has concluded that this change is applicable to certain deferred members within the Company’s defined benefit scheme. The trust deeds state that, for those members affected, a statutory index should be used and therefore the actuarial assumptions applied within this financial report have been updated accordingly. This resulted in a credit of £8m recognised in the STRGL within actuarial gains/(losses) in the prior year.
The current best estimate of employer contributions to be paid for the year commencing 30 January 2012 is £18m (2011: £22m).
b) AssumptionsThe major assumptions used in this valuation to determine the present value of the scheme’s defined benefit obligation are shown below.
i) Financial
2012 2011
Rate of increases in salaries 4.55% 5.05%Rate of increase in pensions in payment and deferred pensions 2.50% – 3.30% 3.30% – 3.80%Discount rate applied to scheme liabilities 4.75% 5.60%Inflation assumption 3.30% 3.80%
ii) LongevityThe average life expectancy in years of a member who reaches normal retirement age of 65 and is currently aged 45 is as follows:
2012 2011
Male 24.4 24.2Female 25.3 25.1
The average life expectancy in years of a member retiring at the age of 65 at balance sheet date is as follows:
2012 2011
Male 22.0 21.8Female 23.0 22.8
Assumptions regarding future mortality experience are set based on actuarial advice and in accordance with published statistics. The longevity assumption considers how long a member will live when they reach the age of retirement. Amongst the UK population there is a continuing trend for a generation to live longer than the preceding generation, and this has been reflected in the longevity assumption. This means that a 45 year old today is assumed to live on average longer than a 65 year old today. This particular adjustment, described in the mortality tables below, is known as ‘long cohort’ and is in line with the latest advice from the Pension Regulator.
In calculating the present value of the liabilities the actuary selects the appropriate mortality table that reflects the longevity assumption. The most up to date tables are used in each period. The current mortality table used is S1PMA/S1PFA-Heavy YOB (2011: S1PMA/S1PFA-Heavy YOB).

103Annual report and financial statements 2011/12
41 Pensions – continuedii) Expected return on assetsThe major assumptions used to determine the expected future return on the scheme’s assets, were as follows:
2012 2011
Long term rate of return on:Equities 5.90% 7.45%Bonds 4.75% 5.60%Gilts 2.90% 4.44%Cash 1.50% 1.50%
The assumptions used by the actuary are the best estimates chosen from a range of possible actuarial assumptions which, due to the timescales covered, may not necessarily be borne out in practice.
c) ValuationsThe fair value of the scheme’s assets, which are not intended to be realised in the short term and may be subject to significant change before they are realised, and the present value of the scheme’s liabilities which are derived from cash flow projections over long periods and are inherently uncertain, were as follows:
2012£m
2011£m
Equities 260 234Bonds 178 172Gilts 199 146Cash 1 1Total market value of assets 638 553Present value of scheme liabilities (638) (537)Surplus in the scheme – pension asset – 16Related deferred tax liability – (4)Net pension asset in the balance sheet – 12
The movement in the fair value of the scheme’s assets over the year was as follows:
2012£m
2011£m
Fair value of scheme assets at start of period 553 490Expected return on scheme assets 34 31Actuarial gain 36 13Employer contributions 18 22Employee contributions 5 5Benefits paid (8) (8)Fair value of scheme assets at end of period 638 553
The above pension scheme assets do not include any investments in the Company’s own shares or property occupied by any member of the Group.
The movement in the present value of the defined benefit obligation during the period was as follows:
2012£m
2011£m
Defined benefit obligation at the beginning of the period (537) (468)Current service cost (17) (14)Employee contributions (5) (5)Other finance income (30) (26)Actuarial loss (57) (32)Benefits paid 8 8Defined benefit obligation at the end of the period (638) (537)
Business and strategy review
Perform
ance review
Governance
Financial statements
Investor information

104 Financial statements Wm Morrison Supermarkets PLC
Notes to the Company financial statements – continued52 weeks ended 29 January 2012
41 Pensions – continuedd) SensitivitiesBelow is listed the impact on the liabilities at 29 January 2012 of changing key assumptions whilst holding other assumptions constant:
Discount factor +/– 0.1% £16mLongevity +/– 1 year £19m
e) Profit and loss account impactThe following amounts have been charged in arriving at operating profit in respect of pension costs:
2012£m
2011£m
Current service cost 17 14
The amounts for current service cost and pensions credit have been charged in the following profit and loss account lines:
2012£m
2011£m
Cost of sales (14) (11)Administrative expenses (3) (3)
(17) (14)
The following amounts have been included in other finance income:
2012£m
2011£m
Expected return on pension scheme assets 34 31Interest on pension scheme liabilities (30) (26)
4 5
f) Amounts recognised in statement of total recognised gains and lossesThe amounts included in the statement of total recognised gains and losses (STRGL) were:
2012£m
2011£m
Actual return less expected return on scheme assets 36 13Experience gains and losses arising on scheme liabilities 1 (52)Changes in assumptions underlying the present value of scheme liabilities (58) 20Actuarial loss recognised in the STRGL (21) (19)
2012£m
2011£m
Cumulative gross actuarial movement recognised in the STRGL (164) (143)Taxation on cumulative actuarial movement recognised in the STRGL 41 39Cumulative net actuarial movement recognised in the STRGL (123) (104)
The actual return on the scheme’s assets can therefore be summarised as follows:
2012£m
2011£m
Expected return on scheme’s assets 34 31Actuarial movement recognised in the STRGL reflecting the difference between expected and actual return on assets 36 13Actual return on scheme’s assets 70 44
The expected return on scheme’s assets was determined by considering the expected returns available on the assets underlying the current investment policy. Expected yields on fixed interest investments are based on gross redemption yields as at the balance sheet date. Expected returns on equity and property investments reflect long term real rates of return experienced in the respective markets.

105Annual report and financial statements 2011/12
41 Pensions – continuedg) History of experience gains and losses
2012£m
2011£m
2010£m
2009£m
2008£m
Difference between the expected and actual return on scheme assets:Amount 36 13 48 (85) (32)Percentage of scheme assets 5.6% 2.4% 9.8% (21.4%) (7.9%)
Experience gains and losses arising on scheme liabilities:Amount 1 (52) – – 12Percentage of present value of scheme liabilities 0.3% (9.7%) – – 2.9%
Effects of changes in the demographic and financial assumptions underlying the present value of the scheme liabilities:
Amount (58) 20 (72) 82 (6)Percentage of present value of scheme liabilities (9.1%) 3.7% (15.4%) 20.5% (1.4%)
Total amount recognised in statement of total recognised gains and lossesAmount (21) (19) (24) (3) (26)Percentage of present value of scheme liabilities (3.3%) (3.5%) (5.1%) (0.8%) (5.9%)
Total value of schemes’ assets 638 553 490 397 407Present value of defined benefit obligation (638) (537) (468) (400) (438)Net pension asset/(liability) – 16 22 (3) (31)
h) Defined contribution pension schemeEmployees joining the Company after September 2000 are no longer eligible to gain automatic entry into the final salary pension scheme. In June 2001 the Company established a stakeholder pension scheme, open to all employees, to which the Company makes matching contributions of a maximum of 5% of eligible earnings. Pension costs for the defined contribution scheme are as follows:
2012£m
2011£m
Stakeholder pension scheme (4) (3)Life assurance scheme (1) (1)Total costs (5) (4)
42 Reconciliation of movements in equity shareholders’ funds2012
£m2011
£m
Profit for the financial period 86 91Dividends (note 8) (301) (220)Retained loss for the financial period (215) (129)Share-based payment (note 45) 25 17Cash flow hedging movement (23) 26Tax relating to cash flow hedging movement 6 (6)Actuarial loss on pension scheme (21) (19)Tax relating to pension scheme 2 4Shares purchased for cancellation (368) –Share options exercised – 16Net reduction in equity shareholders’ funds (594) (91)Opening shareholders’ funds 3,851 3,942Closing equity shareholders’ funds 3,257 3,851
Business and strategy review
Perform
ance review
Governance
Financial statements
Investor information

106 Financial statements Wm Morrison Supermarkets PLC
Notes to the Company financial statements – continued52 weeks ended 29 January 2012
43 Share capital
2012£m
2011£m
AuthorisedEquity share capital4,000,000,000 ordinary shares of 10p each(2011: 4,000,000,000) 400 400Issued and fully paidEquity share capital2,532,312,110 ordinary shares of 10p each(2011: 2,657,766,671) 253 266
Ordinary shares
2012£m
2011£m
At start of period 266 265Shares cancelled (13) –Shares options exercised – 1At end of period 253 266
44 Reserves
Share premium account£m
Capital redemption reserve £m
Merger reserve£m
Hedging reserve£m
Profit and loss account£m
At start of period 107 6 2,578 5 889Retained in the period – – – – (215)Shares purchases for cancellation – 13 – – (368)Share-based payments – – – – 25Cash flow hedging movement – – – (23) –Tax arising on cash flow hedging movement – – – 6 –Actuarial loss recognised – – – – (21)Tax arising on actuarial loss – – – – 2At end of period 107 19 2,578 (12) 312Net pension asset –Profit and loss account excluding pension asset 312
a) Capital redemption reserveThe capital redemption reserve at the start of the period related to 57,788,600 of the Company’s own shares which it purchased on the open market for cancellation between 31 March 2008 and 21 November 2008 at a cost of £146m. The shares repurchased represented 2.15% of the ordinary share capital of the Company at 3 February 2008.
The movement in the period relates to 125,699,939 of the Company’s own shares which it purchased on the open market for cancellation between 10 March 2011 and 29 January 2012. The total amount paid to acquire the shares, net of tax, was £368m and has been deducted from retained earnings within shareholders’ equity. The shares purchased represent 5% of the ordinary share capital at 29 January 2012.
b) Merger reserveThe merger reserve represents the reserve arising on the acquisition in 2004 of Safeway Limited. In the opinion of the Directors, this reserve is not distributable and accordingly it will be carried forward as a capital reserve.
c) Hedging reserveThis represents the gains and losses arising on cash flow hedges from the Company’s energy price contracts and forward exchange contracts.
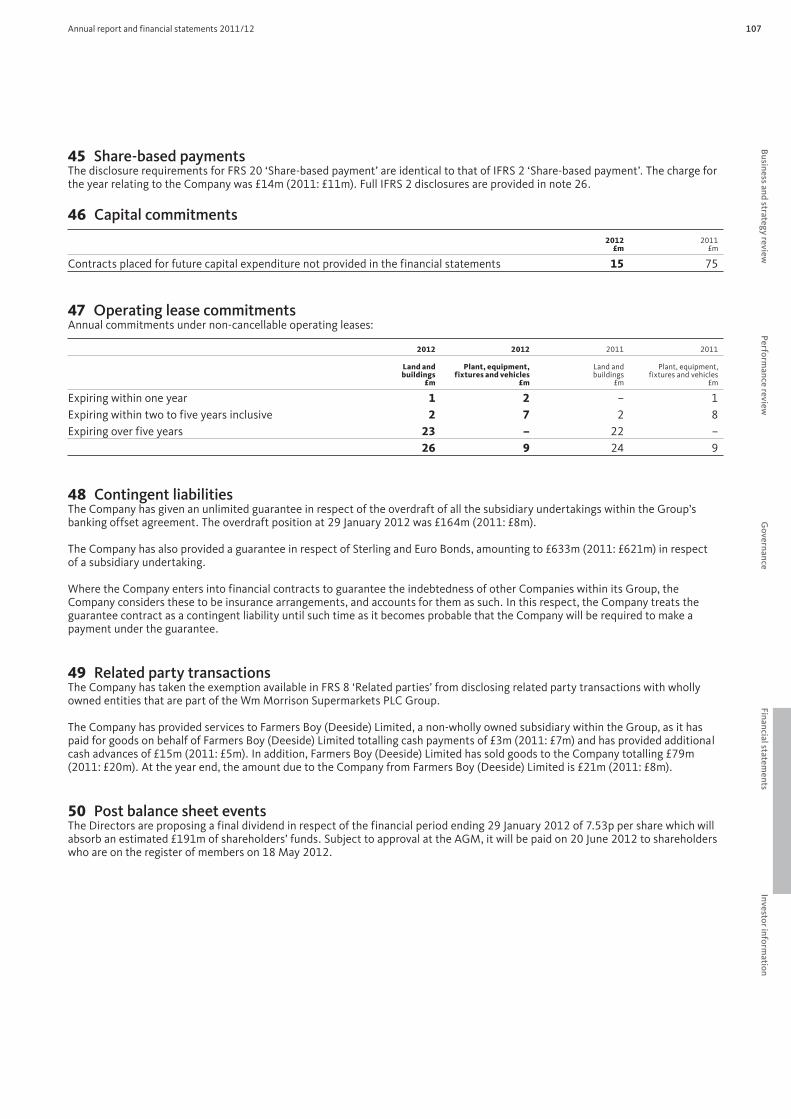
107Annual report and financial statements 2011/12
45 Share-based paymentsThe disclosure requirements for FRS 20 ‘Share-based payment’ are identical to that of IFRS 2 ‘Share-based payment’. The charge for the year relating to the Company was £14m (2011: £11m). Full IFRS 2 disclosures are provided in note 26.
46 Capital commitments
2012£m
2011£m
Contracts placed for future capital expenditure not provided in the financial statements 15 75
47 Operating lease commitmentsAnnual commitments under non-cancellable operating leases:
2012 2012 2011 2011
Land andbuildings
£m
Plant, equipment, fixtures and vehicles
£m
Land andbuildings
£m
Plant, equipment, fixtures and vehicles
£m
Expiring within one year 1 2 – 1Expiring within two to five years inclusive 2 7 2 8Expiring over five years 23 – 22 –
26 9 24 9
48 Contingent liabilitiesThe Company has given an unlimited guarantee in respect of the overdraft of all the subsidiary undertakings within the Group’s banking offset agreement. The overdraft position at 29 January 2012 was £164m (2011: £8m).
The Company has also provided a guarantee in respect of Sterling and Euro Bonds, amounting to £633m (2011: £621m) in respect of a subsidiary undertaking.
Where the Company enters into financial contracts to guarantee the indebtedness of other Companies within its Group, the Company considers these to be insurance arrangements, and accounts for them as such. In this respect, the Company treats the guarantee contract as a contingent liability until such time as it becomes probable that the Company will be required to make a payment under the guarantee.
49 Related party transactionsThe Company has taken the exemption available in FRS 8 ‘Related parties’ from disclosing related party transactions with wholly owned entities that are part of the Wm Morrison Supermarkets PLC Group.
The Company has provided services to Farmers Boy (Deeside) Limited, a non-wholly owned subsidiary within the Group, as it has paid for goods on behalf of Farmers Boy (Deeside) Limited totalling cash payments of £3m (2011: £7m) and has provided additional cash advances of £15m (2011: £5m). In addition, Farmers Boy (Deeside) Limited has sold goods to the Company totalling £79m (2011: £20m). At the year end, the amount due to the Company from Farmers Boy (Deeside) Limited is £21m (2011: £8m).
50 Post balance sheet eventsThe Directors are proposing a final dividend in respect of the financial period ending 29 January 2012 of 7.53p per share which will absorb an estimated £191m of shareholders’ funds. Subject to approval at the AGM, it will be paid on 20 June 2012 to shareholders who are on the register of members on 18 May 2012.
Business and strategy review
Perform
ance review
Governance
Financial statements
Investor information

108 Financial statements Wm Morrison Supermarkets PLC
Five year summary of results52 weeks ended 29 January 2012
Consolidated statement of comprehensive income
2012£m
2011£m
2010£m
2009£m
2008£m
Turnover 17,663 16,479 15,410 14,528 12,969Cost of sales (16,446) (15,331) (14,348) (13,615) (12,151)Gross profit 1,217 1,148 1,062 913 818Other operating income 86 80 65 37 30Administrative expenses (329) (323) (315) (281) (268)(Losses)/profits arising on property transactions (1) (1) 4 2 32Operating profit before pensions credit 973 904 816 671 612Pensions credit – – 91 – –Operating profit 973 904 907 671 612Net finance costs (26) (30) (49) (16) –Profit before taxation 947 874 858 655 612Taxation (257) (242) (260) (195) (58)Profit for the period attributable to the owners of the Company 690 632 598 460 554Underlying profit before tax 935 869 767 636 563Earnings per share (pence)
– basic 26.68 23.93 22.80 17.39 20.79– diluted 26.03 23.43 22.37 17.16 20.67– underlying basic 25.55 23.03 20.47 16.67 14.38
Dividend per ordinary share (pence) 10.70 9.60 8.20 5.80 4.80
Consolidated balance sheet
2012£m
2011£m
Restated1
2010£m
Restated1
2009£m
Restated1
2008£m
AssetsIntangible assets 303 184 – – –Property, plant and equipment 7,943 7,557 7,439 6,838 6,445Investment property 259 229 229 242 239Net pension asset – 38 – – –Investments 31Other financial assets 1 3 – 81 43Non-current assets 8,537 8,011 7,668 7,161 6,727Current assets 1,322 1,138 1,092 1,065 909LiabilitiesCurrent liabilities (2,303) (2,086) (2,152) (2,024) (1,853)Other financial liabilities (1,600) (1,052) (1,027) (1,049) (774)Deferred tax liabilities (464) (499) (515) (472) (424)Net pension liabilities (11) – (17) (49) (68)Provisions (84) (92) (100) (112) (139)Non-current liabilities (2,159) (1,643) (1,659) (1,682) (1,405)Net assets 5,397 5,420 4,949 4,520 4,378Shareholders’ equityCalled-up share capital 253 266 265 263 269Share premium 107 107 92 60 57Capital redemption reserve 19 6 6 6 –Merger reserve 2,578 2,578 2,578 2,578 2,578Retained earnings and hedging reserves 2,440 2,463 2,008 1,613 1,474Total equity attributable to the owners of the Company 5,397 5,420 4,949 4,520 4,378
1 Restated for amendment to IAS 17 ‘Leases’.

109Annual report and financial statements 2011/12
Supplementary information52 weeks ended 29 January 2012
2012%
2011%
2010%
2009%
2008%
Increase/(decrease) on previous year %Turnover 7.18 6.94 6.07 12.02 4.07Operating profit 7.63 10.78 21.601 9.74 44.57Profit before taxation 8.35 1.86 30.99 6.98 65.89Profit after taxation 9.18 5.69 30.00 (17.02) 123.67Underlying profit before taxation 7.56 13.30 20.60 12.97 12.97Diluted earnings per share 11.10 4.74 30.36 (17.01) 122.13Dividend per ordinary share 11.46 17.07 41.38 20.83 20.00
% of turnoverOperating profit 5.51 5.49 5.59 4.62 4.72Profit before taxation 5.36 5.30 5.57 4.51 4.72Profit after taxation 3.91 3.84 3.88 3.16 4.27
Retail portfolioSize 000s sq ft (net sales area)0–5 3 – – – –5–15 65 45 42 13 1215–25 135 137 141 135 14125–40 228 213 199 190 18040+ 44 44 43 44 42Total number of stores 475 439 425 382 375Petrol filling stations 300 296 293 287 284Total sales area (000s sq ft) 12,904 12,261 11,867 11,131 10,837Total sales area excluding convenience (000s sq ft) 12,894 12,261 11,867 11,131 10,837Average store size (000s sq ft)3 27.4 27.9 28.5 29.1 28.9Average sales area (000s sq ft)2 12,456 11,959 11,452 11,061 10,675Total supermarket takings ex petrol (gross) £m3 14,585 13,916 13,241 12,180 11,238Average takings per sq ft per week (£)3 22.52 22.38 22.24 21.41 20.18Average takings per store per week3 618 624 632 617 576Average number of customers per store per week3 25,083 25,583 25,932 25,928 24,411Average take per customer (£)3 24.62 24.40 24.90 23.86 23.10
EmployeesFull time 57,169 58,287 55,703 50,934 50,018Part time 74,038 73,787 78,041 73,596 67,436Total 131,207 132,074 133,743 124,530 117,454Full time equivalent 94,114 95,181 94,724 89,855 83,736
Average per FTE employee:Turnover (£000s) 188 173 163 162 155Operating profit (£) 10,339 9,498 8,6151 7,472 7,307Employee costs (£) 19,530 19,311 18,021 17,996 17,973
1 Before pensions credit.2 Includes sales area of divested stores.3 Excludes convenience.
Business and strategy review
Perform
ance review
Governance
Financial statements
Investor information

110 Wm Morrison Supermarkets PLCInvestor Information
Investor relations and financial calendar
Financial calendar 2012/13Financial events and dividendsQuarterly management statement 3 May 2012Final dividend record date 18 May 2012Annual General Meeting 14 Jun 2012Final dividend payment date 20 Jun 2012Half year end 29 Jul 2012Interim results announcement 6 Sep 2012Interim dividend record date 28 Sep 2012Interim dividend payment date 5 Nov 2012Quarterly management statement 8 Nov 2012Financial year end 3 Feb 2013Preliminary results announcement 14 Mar 2013
Company SecretaryGreg McMahon
Registered officeWm Morrison Supermarkets PLCHilmore HouseGain LaneBradfordBD3 7DLTelephone: 0845 611 5000www.morrisons.co.uk
Investor relationsTelephone: 0845 611 5710Email: [email protected]
Corporate Responsibility enquiriesTelephone: 0845 611 5000
Annual General MeetingThe AGM will be held at 11.00 a.m. on Thursday 14 June 2012 at Wm Morrison Supermarkets PLC Head Office, Gain Lane, Bradford BD3 7DL. A separate notice convening the meeting is sent to shareholders, which includes an explanation of the items of special business to be considered at the meeting.
Dividend reinvestment planThe Company has a dividend reinvestment plan which allows shareholders to reinvest their cash dividends in the Company’s shares bought in the market through a specifically arranged share dealing service. Full details of the plan and its charges, together with mandate forms, are available from the Registrars.
Morrisons websiteShareholders are encouraged to visit our website, www.morrisons.co.uk, to obtain information on Company history, stores and services, latest offers, press information and a local store finder.
Share price informationThe investor information section of our website provides our current and historical share price data and other share price tools. Share price information can also be found in the financial press and the Cityline service operated by the Financial Times. Telephone: 0906 843 3545.
Online reports and accountsOur Annual and Interim Group financial statements are available to download from the website along with Corporate Responsibility reports and other financial announcements. The 2011/12 Annual report is also available to view in HTML format at www.morrisons.co.uk/corporate/ar2012
The information in the Annual report and financial statements, Annual review and summary financial statements, and the Interim reports is exactly the same as in the printed version.
Environmental mattersThe effect of our business on the environment is something that Morrisons takes very seriously. In the production of the 2011/12 Annual reports, we have contributed to the reduction in environmental damage in the following ways:
a) WebsiteShareholders receive notification of the availability of the results to view or download on the Group’s website, www.morrisons.co.uk/corporate, unless they have elected to receive a printed version of the results.
Shareholders are encouraged to view the report on the website which is exactly the same as the printed version, but using the internet has clear advantages such as lowering costs and reducing the environmental impact.
b) Recycled paperThis document has been printed on recycled paper that is manufactured in mills with ISO 14001 accreditation from 100% recycled fibre. It is totally chlorine free and is an NAPM certified recycled product.
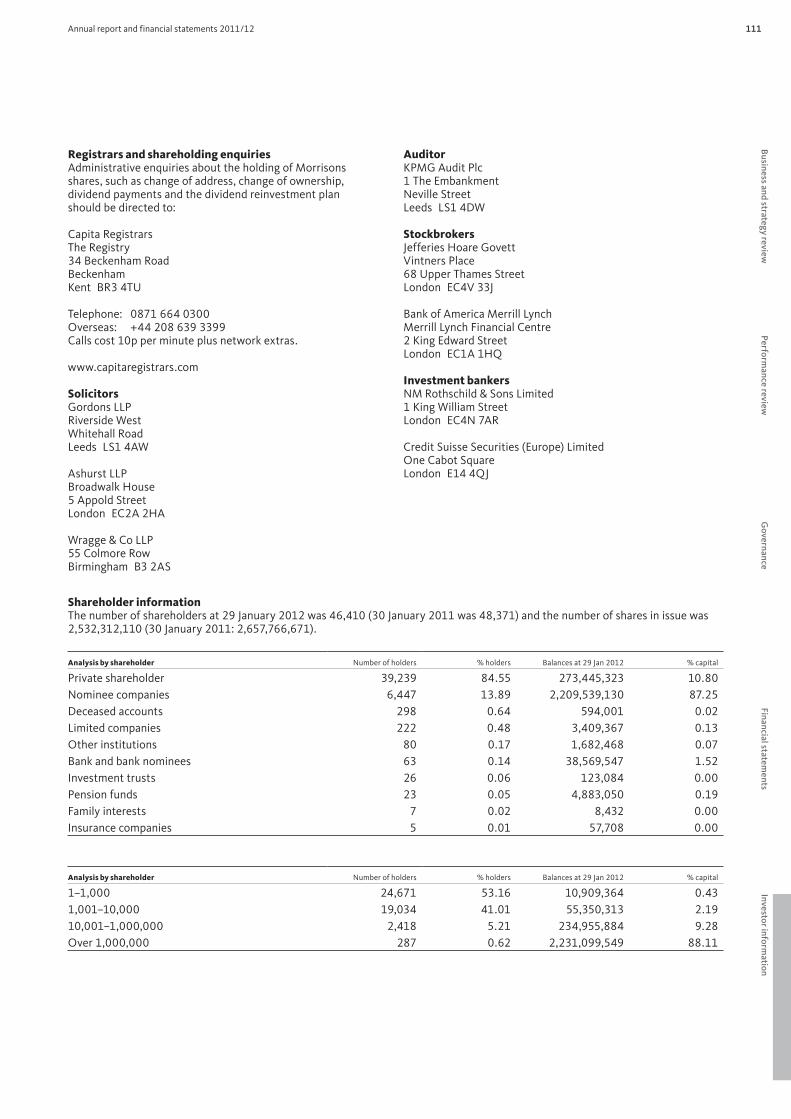
111Annual report and financial statements 2011/12
Registrars and shareholding enquiriesAdministrative enquiries about the holding of Morrisons shares, such as change of address, change of ownership, dividend payments and the dividend reinvestment plan should be directed to:
Capita RegistrarsThe Registry34 Beckenham RoadBeckenhamKent BR3 4TU
Telephone: 0871 664 0300Overseas: +44 208 639 3399Calls cost 10p per minute plus network extras.
www.capitaregistrars.com
SolicitorsGordons LLPRiverside WestWhitehall RoadLeeds LS1 4AW
Ashurst LLPBroadwalk House5 Appold StreetLondon EC2A 2HA
Wragge & Co LLP55 Colmore RowBirmingham B3 2AS
AuditorKPMG Audit Plc1 The EmbankmentNeville StreetLeeds LS1 4DW
StockbrokersJefferies Hoare GovettVintners Place68 Upper Thames StreetLondon EC4V 33J
Bank of America Merrill LynchMerrill Lynch Financial Centre2 King Edward StreetLondon EC1A 1HQ
Investment bankersNM Rothschild & Sons Limited1 King William Street London EC4N 7AR
Credit Suisse Securities (Europe) LimitedOne Cabot SquareLondon E14 4QJ
Shareholder informationThe number of shareholders at 29 January 2012 was 46,410 (30 January 2011 was 48,371) and the number of shares in issue was 2,532,312,110 (30 January 2011: 2,657,766,671).
Analysis by shareholder Number of holders % holders Balances at 29 Jan 2012 % capital
Private shareholder 39,239 84.55 273,445,323 10.80Nominee companies 6,447 13.89 2,209,539,130 87.25Deceased accounts 298 0.64 594,001 0.02Limited companies 222 0.48 3,409,367 0.13Other institutions 80 0.17 1,682,468 0.07Bank and bank nominees 63 0.14 38,569,547 1.52Investment trusts 26 0.06 123,084 0.00Pension funds 23 0.05 4,883,050 0.19Family interests 7 0.02 8,432 0.00Insurance companies 5 0.01 57,708 0.00
Analysis by shareholder Number of holders % holders Balances at 29 Jan 2012 % capital
1–1,000 24,671 53.16 10,909,364 0.431,001–10,000 19,034 41.01 55,350,313 2.1910,001–1,000,000 2,418 5.21 234,955,884 9.28Over 1,000,000 287 0.62 2,231,099,549 88.11
Business and strategy review
Perform
ance review
Governance
Financial statements
Investor information

112 Wm Morrison Supermarkets PLCwww.morrisons.co.uk
Compiled byWm Morrison Supermarkets PLCHilmore House, Gain LaneBradford BD3 7DL
DesignSalterbaxterwww.salterbaxter.comTelephone: 020 7229 5720
The Annual report and financial statements, the Annual review and summary financial statements in both paper and HTML format, and the Corporate responsibility review were designed and produced by Salterbaxter.
PhotographyMike GoldwaterRichard Moran
PrintingPureprint
Paper stock:This report is printed on 9lives Offset uncoated, a 100% recycled paper. 9lives Offset is manufactured to the certified environmental management system ISO 14001.

Information at your fingertips
Telephone0845 611 5000
Visit our websitewww.morrisons.co.uk
Wm Morrison Supermarkets PLCHilmore House, Gain LaneBradford BD3 7DL
CorporateOur corporate website,www.morrisons.co.uk/corporate,has the following sections.
Work with MorrisonsCareer opportunities and information about working for Morrisons. For our dedicated recruitment website, go to www.iwantafreshstart.com
Media centreLatest releases about the growing estate of Morrisons, along with promotions and product news.
Corporate responsibilityHere you can find out about our corporate responsibility ethos, including how we take good care of our environment, society and how we go about business. www.morrisons.co.uk/cr
InvestorsUser-friendlyPresentations, announcements and financial reports can be quickly and easily downloaded or viewed on-screen as PDFs. You can easily navigate around the Annual report and financial statements 2011/12 on-screen, viewing only the parts you want to, at www.morrisons.co.uk/corporate/ar2012
WebcastsWebcasts of the Directors delivering the preliminary results for 2011/12 on 8 March 2012 are available.
Shareholder informationOther relevant shareholder information is available, for example share price history, dividends, financial calendar and AGM minutes.
Electronic communicationsElectronic communications (eComms) is the fastest and most environmentally friendly way to communicate with our shareholders.
Instead of receiving paper copies of the annual and interim financial results, notices of shareholder meetings and other shareholder documents, you will receive an email to let you know this information is available on our website.
Visiting our website to obtain our results reduces our environmental impact by saving on paper and also reduces our print and distribution costs.
Sign up to eComms on our website at www.morrisons.co.uk/corporate and follow the investor eComms link.
About MorrisonsYou will find information about the Group, its operations, strategy and structure, and past financial information.
ConsumerOur website, www.morrisons.co.uk, allows you to learn more about Morrisons and our offering.
Offers• Latest promotions• Specific product offerings• Press releases/marketing• Sign up for our latest offers by email
Market StreetMore about our unique in-store offering, along with video presentations of where our food comes from and how to buy, cook and present it. You can now find nutrition information for Market Street on our website.
Food and drinkInformation about our food ranges, healthy eating and mouth-watering recipes along with ideas of what drink goes well with each recipe.
Family lifeFrom entertainment to bringing up baby and looking after your pets. View our current and archived bi-monthly magazine and read our handy health information for the whole family.
Our suppliersRead about what food is produced fresh near your home and explore our seasonal calendar to see which foods are fresh at different times of the year.
Let’s GrowInformation about our Let’s Grow scheme, including how to register, facts, how it works and teaching resources.
KiddicareSee our range of baby and toddler products and order online at www.kiddicare.com