making hes more lean - lu
TRANSCRIPT

Lund University autumn 2010, Lund
Lund Institute of Technology
Department of Industrial Management & Logistics
Making HES more Lean
- Identification and reduction of waste
Authors: Johan Bergskans Marcus Svensson
Supervisors: Bertil I Nilsson, LTH
Stefan Nilsson, Alfa Laval

II

III
Preface
Alfa Laval Lund AB in Ronneby had identified the need of balancing the production flow at Heat
Exchanger Systems (HES) for making their production of district heating systems more efficient.
As a response to that we performed, in collaboration with the Institute of technology in Lund, our
Master Thesis at HES as the final part of our Master of Science in Industrial Engineering and
Management during the autumn of 2010. In this 20 week project we have applied many of the
things we have learned during our education profiling in logistics and production management.
We would like to thank our supervisor Stefan Nilsson at Alfa Laval in Ronneby for all the
support during the project. We also would like to thank our supervisor at the department of
production management Bertil I Nilsson for all the feedback and guidance during the project.
Finally we want to thank all the personnel at HES in Ronneby for all the provided information,
patience and good response to this project.
Lund, December 2010
Johan Bergskans & Marcus Svensson

IV
V
Abstract
Title: Making HES more Lean – Identification and reduction of waste
Authors: Johan Bergskans, Marcus Svensson I-06
Supervisors: Stefan Nilsson, Unit Manager HES & Key Account Operations, Alfa
Laval. Bertil I Nilsson, Department of Industrial Management & Logistics,
Faculty of Engineering, Lund University
Research questions: Where are the largest gaps between how HES (Heat Exchanger System) are
working today and how they could be working according to lean
philosophies? How could these gaps be reduced and what effect will it have
to HES and their customers?
Deliverables: The project contains a gap analysis which is the foundation to a new
suggested work pattern. The new work pattern was implemented, evaluated
and revised. Finally further recommendations are presented.
Methodology: Quantitative data as well as qualitative data was gathered from interviews,
observations and internal documentations. In parallel to the empiric study,
literature on lean philosophies, material supply and assembly systems was
studied. After the data was gathered a gap analysis was performed to see
where HES could be improved and an identification of where an
implementation of a new work pattern would be of most value for Alfa
Laval and their customers was made. The implementation was performed
according to PDCA (Plan-Do-Check-Act), and was continuously evaluated
and revised. The implementation was performed together with the
employees who had a key role with their experienced input.
Delimitations: The project was performed at Alfa Laval in Ronneby and it only includes
the internal flow from customer order to order dispatch at HES in Ronneby.
Conclusions: The largest gaps where identified as poor flexibility and visualization in the
production, an unstable material supply process and warehousing- and
purchasing policies that need to be reviewed. The internal downtime at a
changeover has been reduced from varying 15-60 minutes down to four
minutes by changing the material supply process for the assembly line. The
new standardized way to supply material is visual and all the material are
secured, prepared and everyone know where to find it. The changes have
made the production more flexible and aligned with the sales company
strive to satisfy the customers’ demand for a wider product range.

VI
Keywords: Lean, gap analysis, waste reduction, material supply, visualization,
standardization, flexibility, changeover time reduction, assembly line,
kitting, work organization

VII
Contents
1 Introduction ............................................................................................................................... 1
1.1 Background ........................................................................................................................ 1
1.2 Problem description ........................................................................................................... 1
1.3 Target group ...................................................................................................................... 2
1.4 Purpose .............................................................................................................................. 2
1.5 Delimitations ..................................................................................................................... 2
1.6 Project deliverables ............................................................................................................ 2
1.7 Alfa Laval Lund AB .......................................................................................................... 3
1.7.1 Alfa Laval in Ronneby ............................................................................................... 3
1.8 Chapter overview and guidance for the reader .................................................................. 4
2 Methodology ............................................................................................................................. 6
2.1 The work process in the project ......................................................................................... 6
2.2 Different scientific strategies ............................................................................................. 7
2.2.1 Strategy in this project ................................................................................................ 7
2.3 Research methods .............................................................................................................. 7
2.3.1 Research methods in this project ................................................................................ 9
2.4 Techniques for gathering data ........................................................................................... 9
2.4.1 Interview ..................................................................................................................... 9
2.4.2 Observations ............................................................................................................... 9
2.4.3 Techniques used in this project ................................................................................ 10
2.5 Qualitative and quantitative studies ................................................................................. 10
2.5.1 Quantitative .............................................................................................................. 10
2.5.2 Qualitative ................................................................................................................ 10
2.5.3 Chosen approach in this project ............................................................................... 11
2.6 How argumentation are built ........................................................................................... 11
2.6.1 Deduction ................................................................................................................. 11
2.6.2 Induction ................................................................................................................... 11
2.6.3 Abduction ................................................................................................................. 11
2.6.4 Grounded theory ....................................................................................................... 12
2.6.5 Triangulation ............................................................................................................ 12

VIII
2.6.6 Approach in this project ........................................................................................... 12
2.7 Information sources ......................................................................................................... 12
2.7.1 Information sources in this project ........................................................................... 13
2.8 Credibility ........................................................................................................................ 13
2.8.1 Reliability ................................................................................................................. 13
2.8.2 Validity ..................................................................................................................... 14
2.8.3 Objectivity ................................................................................................................ 14
2.9 Critique of sources ........................................................................................................... 14
2.9.1 Sources used in this project ...................................................................................... 15
2.10 Summary of chosen research strategies and methods ..................................................... 15
3 Frame of reference .................................................................................................................. 16
3.1 Process choice .................................................................................................................. 16
3.2 Assembly system ............................................................................................................. 17
3.2.1 Product oriented layout ............................................................................................ 17
3.2.2 Functional oriented layout ........................................................................................ 18
3.2.3 Flow oriented layout ................................................................................................. 18
3.3 Material supply ................................................................................................................ 19
3.3.1 Continuous material supply ...................................................................................... 19
3.3.2 Batch supply ............................................................................................................. 20
3.3.3 Kitting ....................................................................................................................... 20
3.4 Lean Production ............................................................................................................... 21
3.4.1 Eliminate waste ........................................................................................................ 22
3.4.2 The principle of one-piece-flow ............................................................................... 23
3.4.3 Just-In-Time ............................................................................................................. 23
3.4.4 Pull system ............................................................................................................... 24
3.4.5 Takt ........................................................................................................................... 24
3.4.6 Changes in Customer demand .................................................................................. 25
3.4.7 Production leveling .................................................................................................. 25
3.5 Work organization ........................................................................................................... 26
3.5.1 Ergonomics ............................................................................................................... 27
3.6 Production development tools and techniques ................................................................ 28

IX
3.6.1 Important success factors for improvement work .................................................... 28
3.6.2 Value-stream mapping ............................................................................................. 28
3.6.3 Kanban ..................................................................................................................... 29
3.6.4 Pareto principle ........................................................................................................ 29
3.6.5 5S .............................................................................................................................. 29
3.6.6 5 Why ....................................................................................................................... 30
3.6.7 Single Minute Exchange of Die ............................................................................... 31
3.6.8 Kaizen vs. Kaikaku .................................................................................................. 31
3.6.9 The Deming cycle (Plan-Do-Check-Act) ................................................................. 32
4 Current state ............................................................................................................................ 33
4.1 Customer order to order dispatch overview .................................................................... 33
4.1.1 Customer need to customer order ............................................................................. 33
4.1.2 Planning process ....................................................................................................... 34
4.1.3 Assembly system ...................................................................................................... 35
4.1.4 Warehousing ............................................................................................................. 36
4.1.5 Material supply ......................................................................................................... 37
4.2 Visualization and 5S ........................................................................................................ 41
4.3 Takt .................................................................................................................................. 42
4.4 Work organization ........................................................................................................... 42
4.4.1 Ergonomics ............................................................................................................... 43
5 Current state analysis .............................................................................................................. 44
5.1 Layout and value stream .................................................................................................. 44
5.2 Customer order and planning process ............................................................................. 44
5.3 Assembly systems ............................................................................................................ 46
5.4 Warehousing .................................................................................................................... 46
5.5 Material supply ................................................................................................................ 47
5.6 Visualization and 5S ........................................................................................................ 48
5.7 Takt .................................................................................................................................. 49
5.8 Work organization ........................................................................................................... 50
5.8.1 Ergonomics ............................................................................................................... 50
5.9 Summary of problems/gaps found ................................................................................... 50

X
5.9.1 Flexibility ................................................................................................................. 51
5.9.2 Visualization ............................................................................................................. 51
5.9.3 Supplying material ................................................................................................... 52
5.9.4 Warehousing- and purchasing policies .................................................................... 53
5.10 Discussion and explanation on where to focus and why ................................................. 54
6 A new work pattern ................................................................................................................. 55
6.1 General idea ..................................................................................................................... 55
6.2 Layout .............................................................................................................................. 55
6.3 The material supply process ............................................................................................ 56
6.4 Visualization and 5S ........................................................................................................ 57
6.5 Implementation ................................................................................................................ 57
6.6 Results of the new work pattern ...................................................................................... 59
6.6.1 Further implementations .......................................................................................... 61
6.6.2 Feedback from the employees .................................................................................. 62
7 Conclusions ............................................................................................................................. 63
8 Reflections .............................................................................................................................. 65
8.1 Further studies ................................................................................................................. 65
8.2 Author’s reflections about the project and the methodology used .................................. 65
9 References ............................................................................................................................... 67
Written sources ........................................................................................................................... 67
Electronic sources ....................................................................................................................... 69
Appendix 1: HES Layout ............................................................................................................ - 1 -
Appendix 2: Identified problems at the different stages in the process ..................................... - 2 -
Appendix 3: New separated areas for trolleys to the one piece flow .......................................... - 4 -
Appendix 4: The material market before any changes ................................................................ - 5 -
Appendix 5: The first suggested layout ....................................................................................... - 6 -
Appendix 6: The new work pattern ............................................................................................. - 7 -
Appendix 7: The savings with the new work pattern .................................................................. - 8 -
Appendix 8: Survey about changes at HES ................................................................................ - 9 -

1
1 Introduction The purpose with this chapter is to give the reader an understanding for the project and state
what the writers wants to achieve with it. The background for the project is described to explain
why the project has been performed and were the problem areas were. Through this the problem
formulation is declared and the delimitations for the project are set as well as the target group.
The introduction also gives the reader a chapter overview and guidance for reading the report.
1.1 Background For four years there has been an assembly line within the Heat Exchanger Systems at Alfa Laval
in Ronneby. Six different models of Heat Exchanger System for single family houses are
assembled on the line. A Heat Exchanger System is the link between a building and the district
heating and it contains among other things a heat exchanger, a temperature controller and a
control unit. Both production of standard products to stock and production to customer orders are
assembled. In addition to this several other heat exchanger systems, which is different in working
tasks and materials, are assembled at separate workplaces within HES. The line was created with
the purpose to reach an efficient high volume production with a well defined takt. Workstations
and the different roles on the assembly lines was carefully balanced and dimensioned to achieve
high effectiveness. During the years the product portfolio and thereby also the working tasks has
changed, but there has not been made any new studies for these products to balance the line and
its material supply. Therefore the productivity has decreased. The production line and its
warehouse have also been moved in the beginning of the year 2010 and at that time the layout of
the line was changed but it still needs to be improved in order to be effective.
1.2 Problem description HES are today struggling to keep up a high output from the assembly line and at the same time
stay flexible to meet the customer demands. There are efficiency problems that need to be
investigated so that Alfa Laval could be better prepared for future higher volumes.
Understanding these problems is a key to change due to its effect on flexibility, work in process,
stock balance and lead time for the customer. Answering the following questions will structure
the work towards a more balanced and efficient flow at HES.
Where are the largest gap between the current flow and the desired flow according to lean
philosophy?
What can be done to eliminate or at least decrease these gaps?
What effect will these changes have for HES and their customers?

2
1.3 Target group
The target group for this master thesis is the company Alfa Laval and its personnel. That includes
the mangers and production staff at HES, but the project can also be seen as best practice for
other parts of the company.
The target group is also other students at Faculty of Engineering and the master thesis can be
relevant for other manufacturing companies as well.
1.4 Purpose The purpose with the project is to develop the structure and set-up for HES in Ronneby, by
mapping the internal value stream, in order to improve the production. The project will tie
theoretical knowledge to practical experience in a real company case and give us valuable
experience for our future engineering careers. This will be done by studying and applying lean
philosophies in order to develop and balance HES production flow, from customer order to
finished goods. By mapping the internal flow and compare it with theory the authors will identify
the gap between HES current production and a lean production. Then some of the most valuable
improvement opportunities will be chosen and analyzed to see which improvements can be made
by Alfa Laval. Some of these improvements will be implemented and evaluated during the
project and others will be left in form of suggestions, and together it will lead to
recommendations to the company.
1.5 Delimitations The project will only include the flow, from customer order to finished products, of HES at Alfa
Laval in Ronneby. Other parts of the Alfa Laval production are studied only with the purpose of
understanding and to see opportunities for potential improvements for HES.
1.6 Project deliverables The project will be presented in a detailed report with a description of the chosen methodology, a
theoretical framework, a gap analysis of the current state and the desired state of the HES
production flow according to lean philosophy. A proposal of changes will be presented and the
authors will start to implement some of them. After the implementation the proposals will be
evaluated and revised. Finally further recommendations for the company will be made and a
company presentation will be held. A scientific article will also be written and an oral
presentation at the university will be made. An opposition on another project is also included in
the project.

3
1.7 Alfa Laval Lund AB
Alfa Laval is a leading global provider of solutions to a large number of industries and their core
technologies are heat transfer, separation and fluid handling. The corporate mission is to optimize
the performance of their customers’ processes, time and time again. The company has
approximately 12 000 employees worldwide and a large number of employees work in Sweden,
Denmark, India, France and the US. In 2008 they had a turnover of SEK 27 464 million and they
has a broad geographic coverage, selling product in about 100 countries. Alfa Laval has 27 large
and medium sized manufacturing units: 15 in Europe, 7 in Asia, 4 in the US and 1 in Brazil.1
1.7.1 Alfa Laval in Ronneby
The site in Ronneby has worked with heat transfer products under different companies since
1964. It was in 1987, when Alfa Laval acquired Euroheat AB, the site became a part of the Alfa
Laval group. At that time they produced welded heat exchangers, heat exchanger systems and
water heaters. In 1988 the production of brazed heat exchangers started and in 2005 the
production of fused heat exchangers started. Today Ronneby is the main supplier for comfort and
heat pump customers. 2
1 http://www.alfalaval.com
2 Internal documents from Alfa Laval
4
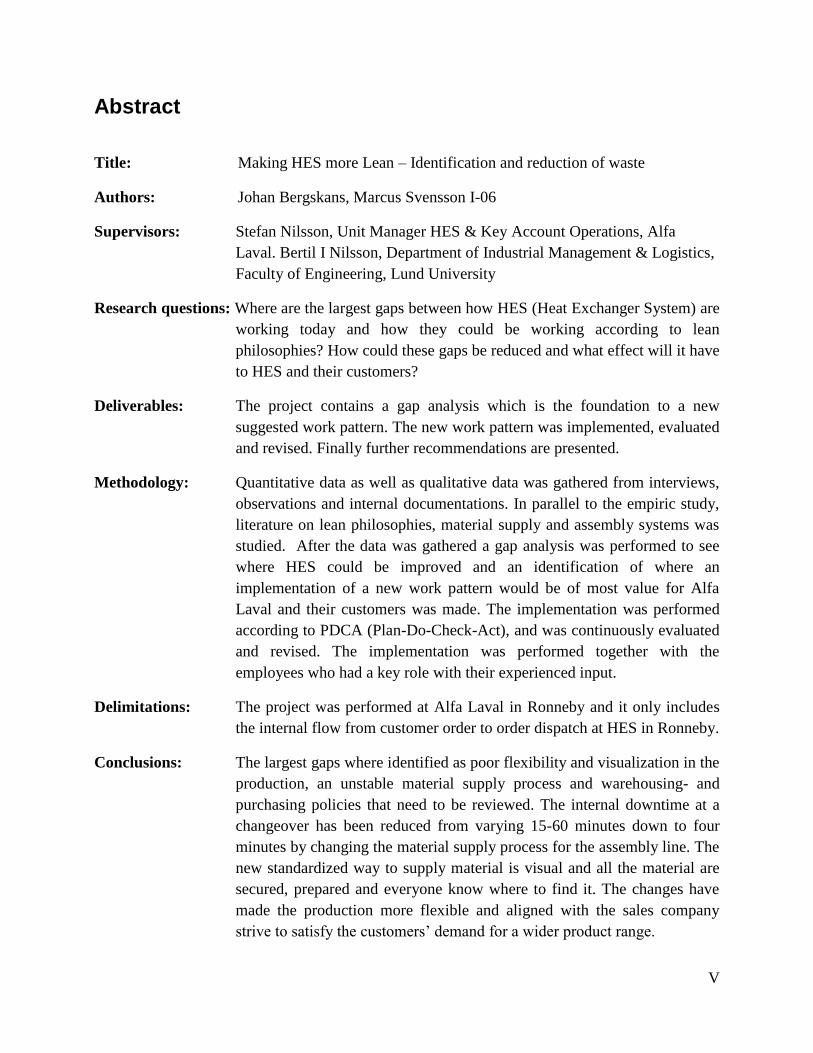
Figure 1: A Mini ECO, which is a district heating substation for single-family houses and a typical product for HES.3
1.8 Chapter overview and guidance for the reader
This report is presented in eight main chapters. They can be read separately, but to get the overall
picture they are best read from the beginning to the end. After the main chapters the references
are presented followed by appendix and a survey made with the personnel at the end of the
project. A short description of the chapters is given below.
1. Introduction
The purpose with this chapter is to give the reader an understanding for the project and state
what the writers wants to achieve with it.
3 http://www.alfalaval.com

5
2. Methodology
This chapter gives an overview of how a scientific study can be made and how this project is
performed.
3. Frame of reference
In this chapter the theoretical framework used in this project is presented. This forms the
foundation for the later analysis of the current state.
4. Current state
This chapter describes the current state of HES in Ronneby. The chapter starts with
presenting and explaining the layout and is followed by an explanation of the main functions
and how they communicate with each other.
5. Current state analysis
The current state at HES is analyzed in this chapter. The analysis identifies gaps, which
generate waste and inefficiencies, between how HES currently are working and how they
could work according to the theoretical framework.
6. A new work pattern
In this chapter the authors’ suggestion will be explained followed by a description of how an
implementation was made using PDCA.
7. Conclusions
In this chapter we summarize the outcome of the project and present the conclusions.
Important things for HES to do next and to make the improvements last are also presented
here.
8. Reflections
In this chapter the authors’ makes recommendations for further studies and what HES should
focus on after this project is finished. This chapter also includes the authors’ personal
reflections about the project and the used methodology.
6
2 Methodology This chapter gives an overview of how a scientific study can be made and how this project is
performed. It starts with a description of the work process and the different available strategies
and methods followed by the authors’ choices. Different ways of how to collect data and how to
make sure that the project is valid, reliable and objective will then be presented. This chapter will
also secure the quality in this research paper.
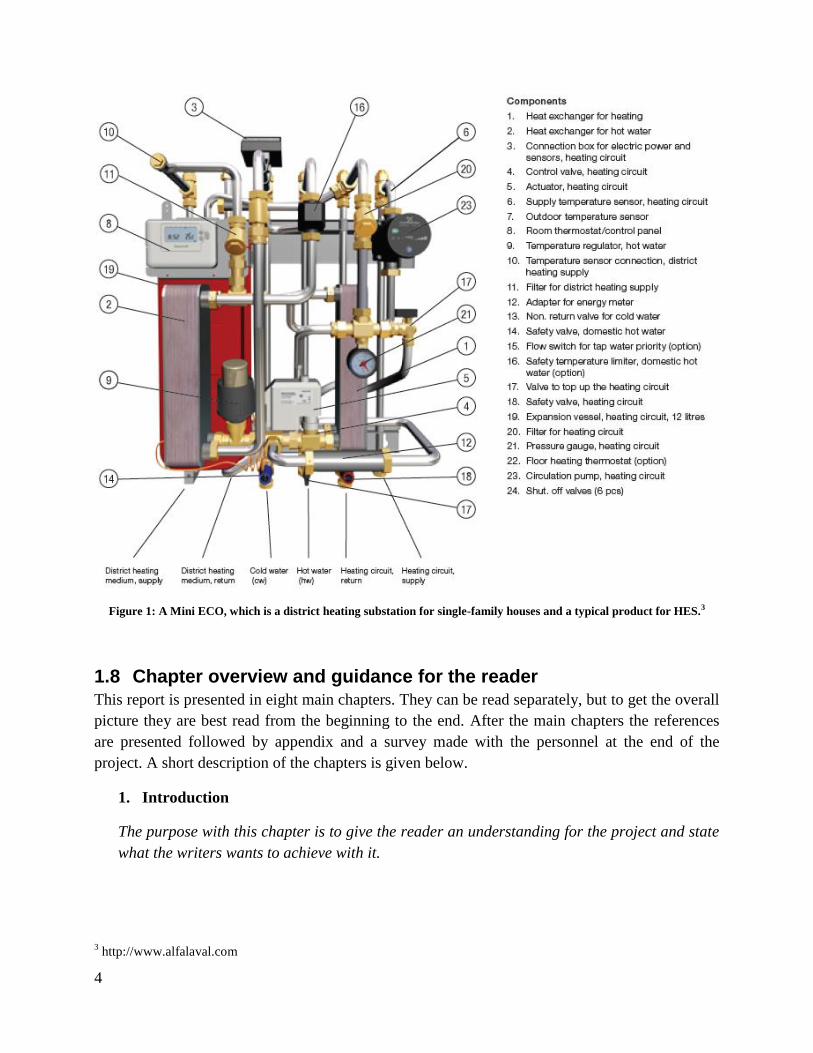
2.1 The work process in the project This project will be performed during a 20 week period and in figure 2 an explanation on how the
project will be executed is illustrated. The objective and the problem formulation are set at an
early stage in a project specification. Then a pre-study will take place in order to understand the
value chain and the organization at HES. Information of available methods to use are chosen and
studied simultaneously to secure the credibility. When the authors have an understanding of the
value chain it is time to study different theories and more in depth how they are working at HES
which will be analyzed against the theories. When the gap has been analyzed it is time to start
implement and follow up changes that will reduce these gaps and the final step will be to
summarize the project and present the conclusions.
Figure 2: The authors work process
7
2.2 Different scientific strategies
Which scientific strategy to use depends on the characteristics and the aim of the research. An
overview of the different strategies will below be given, followed by the chosen strategy for this
thesis.
Exploratory study is used when there is little knowledge available and the main purpose is to gain
as much knowledge as possible. The studies can be used to form a problem and later used as a
base for further studies which emphasizes the importance that it is performed thoroughly and
illustrates the problem from different angles.4
When there already is some knowledge about the environment and the problem is determined this
method is used to describe rather than explain existing relations. The method tries to map the
facts, relationships and consequences of different phenomenon.5
Explanatory studies are used for further more in depth studies. The purpose is to find the cause
and the effect between different parameters. The relationships will be investigated and explained
in the study.6
Normative studies are used when you have a problem to solve. The purpose for the researcher is
to clarify his or her perspective with a clear recommendation and state the impact an
implementation of the recommendation would have. Normative studies are the most common
method used at Technology Institutes.7
2.2.1 Strategy in this project
In the beginning of this project the exploratory strategy will be used to map the internal value
stream and to see where the problems are for the company. The exploratory study will form the
foundation for the normative studies, where the authors will try to solve the problems with the
most valuable potential. The solutions will then be evaluated and revised.
2.3 Research methods Within the scientific research area there are different methods for gathering data. The most
common methods in this kind of projects will be described more in detail below.
Survey - Survey is used when the objective is to describe or explain an extensive
question. It is an investigation of random samples from a population. For example how
many people in a group are using a certain computer program etc.8 The purpose is often to
update the knowledge of certain things and to get an overview of the area at a specific
4 Höst et al., 2009
5 Ibid
6 Ibid
7 Ibid
8 Ibid

8
time. 9 The survey can be performed in different ways for example written or online
questionnaires, observations and interviews by telephone or face to face.10
Case study - Case study is a more intensive study of one or several objects where the
investigator tries to have as little influence on the object as possible. No generalizations of
the received result are made for other cases, because the study is very specific with a
specific purpose. For example how a specific organization is working.11
Experiment - Experiment is an empirical investigation and it is the fundamental principle
within the scientific research area. An experiment is designed to investigate specific
properties and relationships of an element under controlled circumstances. 12
Action research - If the purpose is to improve something or solve a problem while you
study it, action research can be used as a valuable support. Denscombe says that there are
four characteristics of the action research:
o Practical approach - The project has the purpose to solve real cases, often at a
company or in an organizational environment.
o Change - Change is one approach to comprehend practical issues and a mean to
acquire more knowledge of a phenomenon.
o Cyclic process - It is a cyclical process where the initial result is evaluated and gives
feedback and opportunities to new changes to implement.
o Participation - The key persons for the research process are actively participating.
The action research starts with observations of the situation or phenomenon, in order to
identify the problems needed to be solved. Here it is possible to use surveys or case
studies. After the problems are identified the next steps are to develop solutions and
implement them followed by evaluation of the results. During the evaluation the
researcher analyzes the changes made and reflects over the results. If the problem stays
the researcher starts over again.13
Clinical research - Clinical research resembles action research, and the difference lies in
who initiates and defines the problem. In clinical studies the company defines the problem
9 Denscombe, 2009
10 Ibid
11 Höst et al., 2009
12 Denscombe, 2009
13 Höst et al., 2009

9
and the research is in action rather than about action. In the case of action research the
company gets involved as a result of a research initiative.14
2.3.1 Research methods in this project
This project will include a combination of the methods of case study, action research and clinical
research. Case study because the project takes place in a specific organization and the result will
not be generalized. Both clinical and action research will be used due to characteristics of the
project and the combination of problems initiated by Alfa Laval and the authors.
2.4 Techniques for gathering data
There are several techniques that can be used for data gathering. Below follows a description of
the most common techniques which leads to choice of technique for this project.
2.4.1 Interview
An interview might seem simple to perform due to its similarity to a conversation, but it is not a
simple option and it needs a lot of preparations for being successful. The potential of an interview
is best used when complex phenomena are studied and when the researcher needs to get an
understanding of peoples’ opinions, emotions and experiences. There are different kinds of
interview techniques, which will be described below.15
Structured interview - A structured interview gives the researcher control over the
interview by using a list of question and the respondent is just given a limited amount of
answering alternatives. This makes the following analyze relative simple and is often used
where there is a lot of data to be analyzed.16
Semi-structured interview - In a semi-structured interview the researcher also has a
prepared list with questions but is trying to be more flexible with the sequence of the
questions and the respondent are allowed to elaborate the answers.17
Unstructured interview - An unstructured interview is where the researcher intervenes as
little as possible in order to let the respondent to elaborate his/hers thoughts. The
researchers therefore only choose the issues to talk about.18
2.4.2 Observations
Observation means that the researcher studies a course of events and makes notes of what
happens. He can choose not to participate and just observe, or the observer can participate and
14
Skiöld, 2007 15
Höst et al., 2009 16
Ibid 17
Ibid 18
Ibid

10
have a role in the event while he observes. The advantage of participation is that the observer gets
trust from the persons he studies, and the disadvantage is that the observer risks losing the
distance to the object of study. The risk of being passive is that the observer may not be admitted
into the event properly. 19
2.4.3 Techniques used in this project
This research will include semi-structured and unstructured interviews as well as observations, in
order to see the problems from different perspectives and to utilize the experience of the workers
in the organization.
2.5 Qualitative and quantitative studies Data can be gathered with a quantitative and a qualitative approach. A combination of the two is
often used to get a comprehensive picture and to validate results.20
2.5.1 Quantitative
Quantitative studies are designed to collect data in form of numbers that can be statistically
generalized.21
The data can be gathered with standardized surveys that enable the researcher to
only investigate a selection of a population.22
Data in form of numbers can be used to make
statistical calculations such as mean value, median value, and modal value and to confirm or
reject hypothesis.23
The advantages with quantitative studies are for example; reliance through
statistical calculations, easy to analyze lots of data and it could be presented in a concise and
effective way in forms of tables and graphs. Some of the negative aspects with quantitative
studies can be if the researcher takes to many variables in consideration and the analysis therefore
gets difficult to comprehend and then deviations might be discarded from the calculations.24
2.5.2 Qualitative
Qualitative data is gathered and presented as words instead of numbers. To develop knowledge in
these studies the relation between researcher and the survey unit are essential, as the unit’s
situation needs to be faced face to face.25
Qualitative methods are often used when the researcher
chose one of the strategies ethnography, phenomenology or grounded theory. Methods such as
interviews and observation are associated with qualitative studies but there are several other
methods that can be used to produce qualitative data.26
The advantage with qualitative studies is
that data is formed from social conditions and it considers the entire situation, which gives a
holistic view and a better understanding. It is very important that the researcher is objective to the
19
Höst et al., 2009 20
Ibid 21
Denscombe, 2009 22
Ibid 23
Ibid 24
Ibid 25
Holme & Solvang, 1997 26
Denscombe, 2009

11
study when he gathers and interprets data. Deviating results and alternative explanations could
and should be investigated in qualitative studies. There are some negative aspects with qualitative
studies for instance; difficult to generalize, affected by the researcher’s personality and prejudices
and time consuming to analyze.27
2.5.3 Chosen approach in this project
Due to the fact that lean is a qualitative philosophy and a holistic view is necessary in this
research, the project will mainly use a qualitative approach. To get a comprehensive picture and
validate the results some quantitative measures will also be used.
2.6 How argumentation are built There are three sets of logic: deduction, induction and abduction. Grounded theory and
triangulation can be used as a complement to them. The following part will describe them more
in detail.
2.6.1 Deduction
The deductive approach means to draw conclusions about real problems based on theories and
logical thinking.28
This approach is used by experimental researchers and they apply general
principles which are well known to explain specific events and phenomenon. The researcher
verifies and show consequences of something already accepted as truth.29
2.6.2 Induction
Induction is often called the explorer’s way and is when the researcher develops theories based
on empirical studies.30
This approach is mainly used by qualitative researchers and means that
general rules evolve from specific cases or observations of phenomena. A holistic view is used.31
The weakness with inductive research is that it is rarely based on all possible observations.32
2.6.3 Abduction
Abduction is a mixture of deduction and induction and an approach for making conclusions about
causes for an observation. Here the researcher often have an effect and tries to figure out what the
most common factors are without having the possibility to manipulate them. The relations are not
unambiguous and the researcher looks at probable relations and makes conclusions based on
elimination of different factors supplemented by tests. An abductive approach can be used for
instance in an investigation of a crime scene or diagnosis of a disease.
27
Denscombe, 2009 28
Holme & Solvang, 1997 29
DePoy & Gitlin, 1999 30
Holme & Solvang, 1997 31
DePoy & Gitlin, 1999 32
Eriksson et al., 2001

12
2.6.4 Grounded theory
Grounded theory is used in small projects, when qualitative data is used for studying human
interaction and when the research is exploratory and concentrated to certain environments. It is a
procedure to generate theories and emphasizes empirical work on the field and the need to
connect every theory with the practical reality. The empirical research is the foundation from
where the theories gradually are evolved from analyzing the data. As the theories evolve they are
tested with empirical data for the specific purpose.33
2.6.5 Triangulation
It is possible to get a more comprehensive view of the object of the studies by using several
methods, types of data and persons who study the object. Then the things are seen from different
perspectives and this is called triangulation. 34
2.6.6 Approach in this project
This project will require both an inductive and deductive approach. An inductive approached is
used to create an idea on how they are working and then a deduction approach will be used to
identify gaps between theory and empirics. To complement this and due to the certain
environments, grounded theory will be used in this research. Triangulation will be utilized to see
complex problems from different perspectives.
2.7 Information sources There are different kinds of information sources available when gathering data for research, for
example books, brochures and journals. Lester says that the library, where the best books and
journals are, should be the center of your research whether you access it electronically or in
person. The reason is that the articles you access through libraries are in main written by scholars
and thereby carefully reviewed by a board of scholars before publishing. 35
Data can be either
primary or secondary data and below the difference between them will be explained.
Primary data is data collected by the researcher for the purpose to be used in the research.36
For
example: methods and tools, experiments, observations, discoveries and findings from tests. 37
Secondary data are data which has been developed with another purpose than the current research
such as general literature of the subject. Thereby it is important to know that the secondary data
can be angled, not complete or written for another target group.38
33
Denscombe, 2009 34
Höst et al., 2009 35
Lester & Lester, 2005 36
Björklund & Paulsson, 2003 37
Lester & Lester, 2005 38
Björklund & Paulsson, 2003
13
2.7.1 Information sources in this project
Both primary and secondary data will be required in this research. Primary data will be used to
develop our own opinion and not just accept everything received from the company. Secondary
data will be used to collect knowledge about the general theories and how best practice
companies work with similar problems.
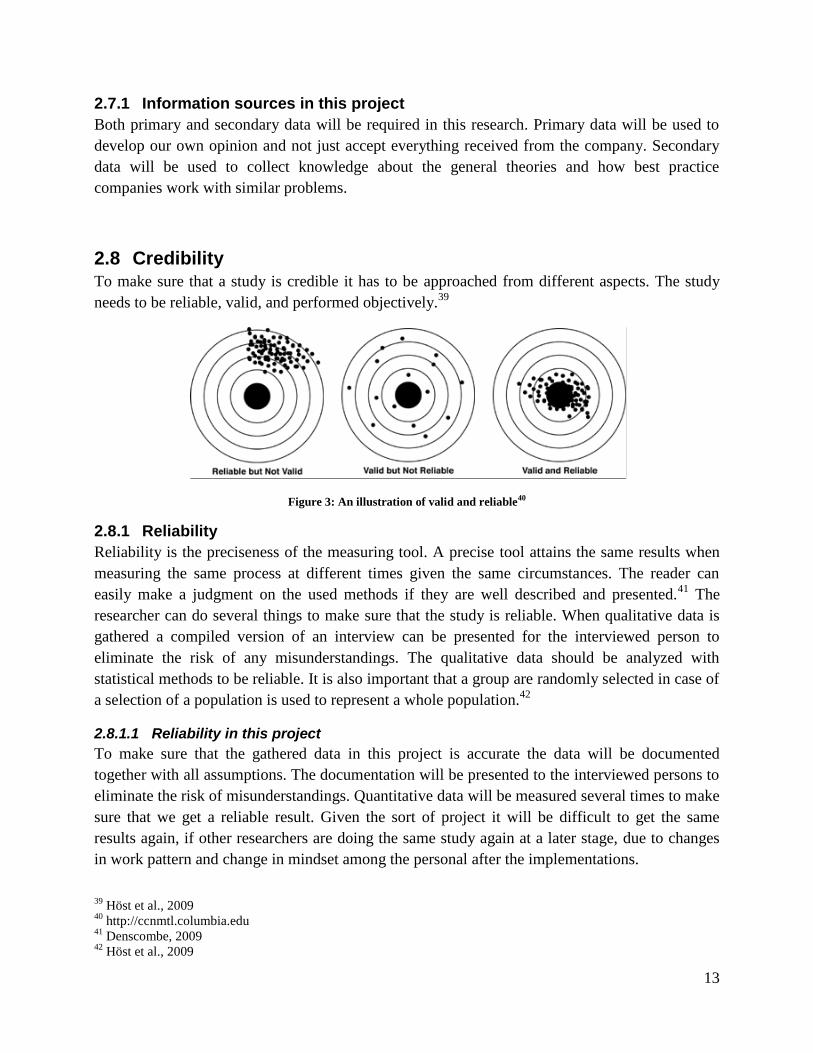
2.8 Credibility To make sure that a study is credible it has to be approached from different aspects. The study
needs to be reliable, valid, and performed objectively.39
Figure 3: An illustration of valid and reliable40
2.8.1 Reliability
Reliability is the preciseness of the measuring tool. A precise tool attains the same results when
measuring the same process at different times given the same circumstances. The reader can
easily make a judgment on the used methods if they are well described and presented.41
The
researcher can do several things to make sure that the study is reliable. When qualitative data is
gathered a compiled version of an interview can be presented for the interviewed person to
eliminate the risk of any misunderstandings. The qualitative data should be analyzed with
statistical methods to be reliable. It is also important that a group are randomly selected in case of
a selection of a population is used to represent a whole population.42
2.8.1.1 Reliability in this project
To make sure that the gathered data in this project is accurate the data will be documented
together with all assumptions. The documentation will be presented to the interviewed persons to
eliminate the risk of misunderstandings. Quantitative data will be measured several times to make
sure that we get a reliable result. Given the sort of project it will be difficult to get the same
results again, if other researchers are doing the same study again at a later stage, due to changes
in work pattern and change in mindset among the personal after the implementations.
39
Höst et al., 2009 40
http://ccnmtl.columbia.edu 41
Denscombe, 2009 42
Höst et al., 2009

14
2.8.2 Validity
There are two types of validity, internal and external. Internal validity is the measure of to which
degree the study measures what it is supposed to measure. External validity is the way
interviewed people answers a question, did they remember the situation wrong, did they
misinterpret the question or did they lie? The researcher can use triangulation and study the
object from different perspectives to validate the study.43
2.8.2.1 Validity in this project
Quantitative data in this project, for instance numerical measures will measure a well defined
process to reduce the risk of having significant measuring errors. Interviews will use triangulation
by containing questions in various forms to make sure that the interviewed person understands
the question without any room for misinterpretation.
2.8.3 Objectivity
Objectivity is the measure of to which extent the authors affect the result. It is important that no
personal values affect the study and that chosen methods are well described and motivated. An
objective research is impartial and presents honest results.44
2.8.3.1 Objectivity in this project
The authors´ documentation will be coordinated with members from several functions at Alfa
Laval so that decisions are based on facts and not affected by the authors´ valuations.
2.9 Critique of sources
The number of sources the researcher can comprehend is limited when a study is made. It is
therefore important that the researcher review the available sources to find the best suited and
most reliable sources for his work. Holme and Solvang divide the review in four phases:
Observation - The first stage is to overview the available sources to find the most suited
for the study.
Origin - Identification of whom or what is the root of the source and the difference
between the source and what it describes. Investigate the date of the study and when the
source is published.
Interpretation - The researcher needs to interpret the source to understand what the
author wants to mediate.
43
Denscombe, 2009 44
Ibid

15
Usability - Finally the usability of the source must be determined to make sure that the
information is aligned with the researcher’s purpose with the study.
These steps help to find suitable and reliable sources. Holme and Solvang also want the
researcher to keep in mind that a source is a historical document that reflects the opinion and
knowledge at a given time.45
2.9.1 Sources used in this project
Information from Alfa Laval will be collected by viewing and comparing different internal
documents together with compiled answers from interviews with several persons within Alfa
Laval to make sure that we have the whole picture instead of just one person’s opinion. There is a
lot of literature written about the subjects that concerns this project and the authors will look at
several independent sources to validate the information. Where there have been difficult to find
several sources the limitation of the project simply forced the authors to rely on the publishers´
data.
2.10 Summary of chosen research strategies and methods
First exploratory studies will be made to map the value stream and to form the foundation for the
normative studies where the detected problems will be solved. A combination of the methods of
case study, action research and clinical research will be used due to the characteristics of the
project. The research will include semi-structured interviews as well as unstructured interviews
and both an inductive and deductive argumentation will be used. As a complement grounded
theory and triangulation will be used to utilize the experience of the blue collars/workers to see
the complex problems from different perspectives. As the lean philosophy is very qualitative the
authors’ analysis will be more of a qualitative nature, but complemented with some quantitative
measures.
Regarding information sources both primary and secondary data will be used in this project.
Secondary data in order to collect knowledge about the general theories and how best practice
companies work with similar problems. Primary data will be used to develop our own opinion
and to analyze problems mentioned by the personnel. Several sources will be studied and the
described methodology will be used to make sure that the project is credible.
45
Holme & Solvang, 1997

16
3 Frame of reference In this chapter the theoretical framework used in this project is presented. First process choice
and assembly systems are described, followed by different kinds of material supply. Also the lean
philosophy is presented here as well as work organization theories. Finally tools and techniques
related to this project are described. Together this forms the foundation for the later analysis of
the current state.
3.1 Process choice When choosing which process is best suited for a product one must consider that a product has
both a technical and a business dimension. The former relates to aspects such as design and
material, while the latter defines the business aspects for example what characteristics qualify
your product as an alternative for the customer and what characteristics wins the order.
Below is a description of the five generic types of manufacturing:46
Project - Project process is used when the product cannot be physically moved when
completed. Instead the required resources are brought to the site where the product is built
and are allocated for the duration of the project.
Jobbing - Jobbing is used when a product can be moved and companies choose to make it
in house for later dispatch to the customer. A characteristic of jobbing is that it is used for
unique products that are not thought to be repeated. The process is often performed by a
small group of skilled people.
Batch - Products that are of high and repeat volumes that move from step to step until
complete are suited for a batch process. Another characteristic is that different products
use the same process simply by setting and resetting them each time.
Line - Processes can be dedicated to needs of a given range of products due to their high
volumes. In a line the processes are designed to work without resetting each time a new
product is to be made.
Continuous processing - This process is just like a line designed to make mass products
without being stopped and reset. A characteristic of the product is that they need to be
transferable through piping or in liquid form and the processes are designed to run
continuously.
46
Hill, 2009

17
It is not always easy to choose a process that fit between the business requirements and the
process characteristics. When encountering this issue a company can choose to have Hybrid
processes, a mix of two generic types, as the best way.47
Figure 4: An illustration of Hills model of process choice
3.2 Assembly system When designing an assembly system it is important to maximize the value adding time of the
operator and by having compact work stations it is possible to reduce non value adding time such
as unnecessary movements and transports.48
When it comes to the efficiency of the assembly
system, two important criteria is: high capacity utilization and low degree of tied up capital.
However, it is important to complement these with criteria related to the people working in the
production system for example: stability in the production, attractive work tasks and good
production environment.49
Below some of the most common production layouts will be
described.
3.2.1 Product oriented layout
In a product oriented layout the assembly occurs in one place due to that the product often is big,
heavy or hard to move. This layout is common when having long production times and small
47
Hill, 2009 48
Wänström & Medbo, 2009 49
Axsäter, 1998/99

18
series or one piece production for example airplanes or ships. The final manufacture is often
characterized by a lot of manual work.50
3.2.2 Functional oriented layout
In the functional layout all machines are sorted by kind of machining operation, which allows a
large amount of product varieties because the processing sequences can be changed if necessary.
The disadvantages are complex material handling, long internal transports and often queues in
front of the machines. This layout is common when producing according to batches.51
3.2.3 Flow oriented layout
Here the machines are lined up according to how a specific product is processed. This is done in a
way that creates a visual production flow through the factory. This layout enables a higher
production pace, but more fixed installations are necessary such as material handling equipment
and therefore the layout is more suitable for long series and mass production.52
3.2.3.1 Line organization
The benefit of a line organization is the well defined material flow, which easily can be
mechanized. The different assembly operations are performed at different stations, which mean
that the components only have one material address. This makes the material supply
easier.53
Other benefits are short lead times and by having short work cycles it is easy to teach
new employees. High utilization of resources, easy managing and visualization of the work are
other benefits with a line organization.
Some of the disadvantages are monotone work tasks, which have a negative impact on the work
environment, and the workers might feel very replaceable. The system also risks being sensitive
for disturbances and inflexible.54
In a line organization an extensive balancing between the
different work stations is necessary to reduce losses, and a fully balanced line is difficult to
achieve.
3.2.3.2 Parallel production flow
One way to increase the flexibility and capacity of the assembly system, and at the same time
reduce the sensitivity for disturbances, is to utilize parallel production flows.55
Then it is possible
to reduce time losses, operation safety and increase the possibility to have a good work
environment compared to the line organization.56
When using parallel production flows it is
50
Ståhl, 2009 51
Ibid 52
Ibid 53
Agervald, 1981 54
Bellgran & Säfsten, 2005 55
Agervald, 1981 56
Ibid

19
beneficial to use lean principles, where real demands manage the production instead of estimated
demands which is common in traditional mass production. 57
3.3 Material supply The material supply design has an important impact on the flexibility and performance of the
assembly system.58
The material supply shall provide the assembly operators with correct
material, and the material should be obtainable in a way that makes the operators work easier.
The operator should not have to walk long distances or reach for components.59
The way of buying material and its packages have a big influence on how the material supply is
organized in Sweden. The consequence of this is having large packages that need a lot of space in
the production and unnecessary handling and movement of material at the workstations occurs.
This can also cause ergonomic problems connected to the heavy lifting.60
According to Vollman
et al. the goal in lean production is to use small container sizes to minimize the hidden inventory
costs and increase the adaption to changes in demand. 61
The general idea of an effective material supply is to minimize the amount of handling of
material, because it is a big part of the overall cost and lead time of the material supply. An
efficient way of reducing the number of steps included in the handling is to integrate the material
supply with other functions and to merge different handling operations into a handling process.
Another thing to consider is that the material supply, production and work organization should be
synchronized with each other. More common thou, the production is developed first and the
material supply just have to adapt to the situation. 62
An effective material flow into and within a factory is crucial to any productivity improvements.
In a production plant where the shop floor is tight or there might be congestions an optimization
of the internal flow can radically improve the capacity of the production, without expansion.63
3.3.1 Continuous material supply
Continuous material supply, also called line stocking, is the traditional way of supplying material
for an assembly line. All articles are available at the line and the material supply personnel refills
when one type of material is consumed. No coordination between switches of the different
articles exists. Which material is to be used for a specific product is often declared in some more
57
Engström et al., 2005 58
Wänström & Medbo, 2009 59
Engström et al., 2005 60
Ibid 61
Vollmann, 2005 62
Kurslitteratur kompendium, 2000 63
Hillis, 2006

20
or less cryptic code or article number. The material is then picked from packages according to the
codes.64
The continuous material supply requires a lot of space in the production as the level of
customization and amount of products increase. It is not uncommon that the length of the
assembly line is dimensioned by the required area for the material. 65
When using continuous
material supply it is hard to guarantee that right components are used for the products as the
operators can be confused which material to use.66
By using only one bin of articles at the time, a good delivery performance from the material
supply personnel is required to avoid material shortages. A two-bin system does not require as
high delivery performance, but require more space on the other hand.67
3.3.2 Batch supply
This requires that there are well defined batches. Every batch is then supplied either in the exact
amount of material, or by roughly refilling the material and then having a return flow when the
order is assembled. Here it is common that every pallet only contains one sort of article.68
3.3.3 Kitting
Growing diversity of product varieties and parallelization of the assembly systems are trends
making it more difficult to supply material in a traditional way. As a result of this other principles
of material supply has been developed, called kitting. This involves order picking and the
characteristics of the components picked differ between systems, but the basic objectives and
main activities are common i.e. picking and sorting a number of components in one stage of the
production flow in order to satisfy a demand in a later stage.69
When having parallel assembly
systems one solution for the material supply can be to place the kitted material on a “material
square”, where the assembly personnel picks the material themselves. This increases the
independence of the work group. 70
The main reasons for using kitting is to ensure that the
product consists of the right components, so that the operators does not get confused which
component to use, and to utilize the kitted material as a pedagogic support. This means that the
operator uses the material as a physical work instruction.71
Kitting also ensures that the right
components are at the work station at the right time, as the accuracy is increased and the number
of stock keeping units is reduced. It also saves space at the work stations and reduces the overall
material handling time in parallel flows.72
64
Engström et al., 2005 65
Kurslitteratur kompendium, 2000 66
Engström et al., 2005 67
Kurslitteratur kompendium, 2000 68
Ibid 69
Brynzér et al, 1994 70
Axsäter, 1998/99 71
Engström et al., 2005 72
Medbo, 2003

21
By extensive use of manual material handling it is possible to reduce the requirement that the
operator shall be provided with the right material at the exact right time in independent work
groups. For example if one operator in the group has some time to spare, he can get the material
for himself and to other members of the group at the material square instead of waiting for the
warehousing personnel to come. By doing this the company also reduces the need of advanced
technology. Instead it is more beneficial to use several simple transport equipments such as
manual trolleys, due to the possibility to adjust the trolleys to different production systems and
products. They are also easier to modify and develop compared to automated equipment, and this
result in having a more flexible material supply. It is also possible to ease the learning of the
assembly work, by first picking the material and gradually learn how to assembly it.73
According to Brynzér et al. the picking efficiency is often expressed in terms of a single variable
such as transportation time, but it is also important to see the efficiency of the whole picking
process. If a change in one problem area affect others it is important to see this and state the
effect.74
3.4 Lean Production The ideas of lean production are mostly picked from the car manufacturer Toyota and are also
known as The Toyota Production System75
. The hallmarks of lean production are
communication, teamwork and efficient use of resources.76
Almost every company has started to
use the philosophy in their own company during the last decades, and worldwide companies are
requesting Toyota employees for their knowledge. The company is seen as world leading in terms
of quality, efficiency, production speed and flexibility.77
By using lean remarkable results have
been achieved, like cars with one third of the defects, build in half the factory using half of the
time.78
But the success surely does not only come from the layout of the production system, but
also from the management culture and the leadership principles which are applied at Toyota.
Liker describes 14 principles, which has many similarities with Deming’s famous 14 key
principles for management.79
Toyota´s 14 principles can be divided into four groups:
Long term philosophy - The company should think and act based on a long-term
perspective, even if it goes against short term financial results. It is all about creating
value for the customers, society and the economy and every department should be
evaluated against their capability to achieve this. 80
73
Engström et al., 2005 74
Brynzér et al, 1994 75
Bergman & Klefsjö, 2008 76
Womack et al., 1991 77
Liker, 2009 78
Womack et al., 1991 79
Deming, 1986 80
Bergman & Klefsjö, 2008

22
The right process will produce the right results - The value-streams should be designed
for continuous flow without waste, where the products are pulled from the internal and
external customers. Aim at doing right from the beginning, standardize, visualize and
make the processes transparent for detecting problems easily and being predictable.81
Build a culture of stopping the production to fix problems to get the right quality and use
only reliable, throughout tested technology that serves the organization. 82
Add value to the organization by developing the people - In order to develop
exceptional people and teams who live the company culture, it is necessary to have a
management who understands and teaches the company’s philosophy and nature of work.
It is also important to respect and develop the suppliers and partners in the same way and
help them to improve.83
Continuously solving root problems drives organizational learning - Walk the
organization and go to the source of the problems to fully understand the situation. Make
decisions slowly by consensus and consider all options before implementation, which is
done rapidly when the decision is made. Finally become a learning organization through
relentless reflection and continuous improvement. 84
3.4.1 Eliminate waste
It is important to understand what creates value, but it is also crucial to understand what generates
waste in order to eliminate it.85
Continuously eliminating waste is the heart of Toyota Production
System. Toyota have identified seven kinds of waste in business and manufacturing processes: 86
1. Overproduction
Producing items before the item is needed or without any customer orders does not create
value.87
Overproduction is often considered as the worst kind of waste, because it
generates all the other kinds of waste. 88
2. Waiting
For example waiting for the next processing step, waiting because of stock outs or
capacity bottlenecks.
81
Bergman & Klefsjö, 2008 82
Liker, 2009 83
Bergman & Klefsjö, 2008 84
Ibid 85
Ibid 86
Liker, 2009 87
Bergman & Klefsjö, 2008 88
Petersson et al., 2008

23
3. Unnecessary transport or conveyance
Carrying things for long distances, inefficient transports and moving materials into or out
of storage or from one process to another does not create any value.89
4. Over processing or incorrect processing
When unnecessary process steps are taking place or when the process is inefficient due to
poor tool and product design, unneeded motion and defects are made.
5. Excess inventory
Excess inventory hides problems such as late deliveries, long setup times and defects and
makes the problem solving more difficult. Extra raw material, work in process or finished
goods are also contributing to longer lead times, higher grade of obsolescence and more
tied up capital.
6. Unnecessary movement
Things like walking, stacking products, reaching or looking for products that are included
in the daily work are waste.
7. Defects
All kinds of rework or repair, scrap, inspection or production of defective parts are
waste.90
3.4.2 The principle of one-piece-flow
One-piece-flow is when the products are manufactured one by one throughout the supply chain
according to customer orders. The ultimate goal of lean production is to achieve a one-piece-flow
in all business operations, from product design to physical distribution.91
. All over the world
companies has made huge gains such as increased productivity and quality and reduced inventory
and lead times, by introducing one-piece-flow. The results are always the same and it always
seems miraculous when things that once took weeks to produce now can be done in hours. One-
piece-flow eliminates most of Toyota´s seven wastes.92
3.4.3 Just-In-Time
Just-In-Time (JIT) is a set of tools, techniques and principles to deliver the right products, in the
right amounts, at the right time. It enables the company to produce in small quantities with short
lead times in order to be responsive for specific customer needs. JIT also reduces the inventory
level and thereby the total cost of inventory. 93
89
Bergman & Klefsjö, 2008 90
Liker, 2009 91
Ibid 92
Ibid 93
Ibid

24
3.4.4 Pull system
A pull system means that the entire flow is managed by actual customer orders and not by any
forecast or plan. The production order is given to the last stage of the supply chain. That stage in
turn gets the components, which shall be processed or assembled, from the previous stage of the
supply chain.94
The main reason for using a pull system is to avoid overproduction, which is by Toyota
considered to be the worst kind of waste. A pull system also provides less work in process
compared to a push system and thereby earlier detection of quality problems. It also provides
shorter lead times, which is leading to an increased responsiveness to the customers and less
dependency on the forecasts. A pull system may cause that some of the operations in the
production system are not fully utilized, because sometimes there might not be any demand from
the next operation.95
3.4.5 Takt
Takt is originally a German word for rhythm and it is a measure of the demand rate. A takt
system is used to synchronize the production with the customer demand and the takt time is
defined by:
Takt time =
and sets the pace in the entire supply chain.96
In other words the takt time is the pace at which
products move forward in the flow. The takt time is telling people how much personnel and
capacity they need as well as how fast they need to work in order to keep up with the rest of the
chain.97
The goal is to eliminate waste when you are working with lean manufacturing and by using takt
instead of number produced per hour it is easier to find waste and the source of the waste.98
The
takt could be visualized with a takt board and markings on the floor that shows the takt and what
are supposed to be done on the product when it passes a marking. Every station should have a
clear work method and if the operator cannot keep the pace he either does not follow the work
method or there is something wrong with it. The takt is for this reasons a good way for the
managers to find areas where they can improve the production.99
94
Bellgran & Säfsten, 2005 95
Ibid 96
Pascal, 2002 97
Liker, 2009 98
Petersson et al., 2008 99
Ibid
Equation 1: Takt time
25
To mitigate the risk that you will not be able to keep up with the given takt you could use
checkpoints. If you know that you are supposed to produce one unit every second day you could
have a checkpoint after one day and see if you are on track with the takt, and if not you could ask
for support.100
3.4.6 Changes in Customer demand
When solving the problem how to respond to changing customer demands there are three options:
Absorb demand changes with a stock of finished goods
Run overtime or similar capacity increase over calendar time
Adjust the takt time and change the number of operators
The first two options can be used on a daily basis without any bigger problems, but changing takt
is a little bit more difficult. The reason is that in order to change takt one often needs to change
standardized work charts and redeploy people. Veteran lean companies are used to such changes,
but a company new to lean production may have some problems initially.101
Most people would probably say that all form of stock is a waste of resources, but if a company
has a small inventory of finished goods this will be well compensated by the ability to maintain
the production pace in most cases. In this way you protect the company against a temporary
increase in demand and you maintain the company’s ability to produce to orders and the total
waste is decreased. 102
3.4.7 Production leveling
Production leveling is a method for reducing waste and it is important in the development of an
efficient production according to the Toyota Production System and Lean Manufacturing.103
When production leveling is used a company does not produce according to the actual demand
exactly, because the demand could vary a lot over time. Instead you take the total number of
orders during a certain time period and balance the production so the same amount and mix of
products is produced every day. In this way the production is predictable and you do not have to
work overtime one day and sending people home the other day.104
In order to level the
production, the company has to study the demand and try to see trends and different patterns for
the volume and the product mix.105
100
Pascal, 2002 101
Ibid 102
Liker, 2009 103
Ibid 104
Ibid 105
Pascal, 2002

26
The benefits with production leveling is the flexibility to produce what customers want and when
they want it and thereby decrease your stock on hand and problems linked to that such as tied-up
capital and obsolescence.106
Another big benefit with the use of leveling is the ability to balance the workload for the
employees and the machines. In this way it gets easier to standardize the work, secure the quality
and be more efficient. A standardized work is easier, cheaper and faster, but also better for
revealing waste like missing components and obsolescence. Production leveling will also lead to
a more stable demand for the suppliers and the possibility to use Just-In-Time. In the end this will
lead to savings for the suppliers which can be shared with the company so that the whole supply
chain benefits from it.107
3.5 Work organization In an assembly system the work load is often quite high for the assembly personnel and therefore
they have a significant impact on the system. This makes the work organization very important
besides the technical requirements of the system. The work organization deals with how the work
is performed and divided among the employees and both the human aspects and the efficiency
aspects are considered here.108
It is important that the personnel understand that they together are
responsible for the outcome of the group and agrees to get feedback on what they have performed
as a team.109
In order to be successful with an improvement project the attitude of the workers are
important and it is significant to establish the ideas among the workers at an early stage and
create participation.110
Lean production has received some critique related to the work environment. An overview of
studies of lean production factories, mainly in North America, shows on high stress levels due to
high production pace, a lot of repetitive work and few breaks. Older people and physically
weaker people are then more vulnerable. 111
Proponents of lean production say that lean results in competence improvements of the workers
and that lean companies soon will have the repetitive work automated. In this way the workers
will become more of skilled problem-solvers, whose job will be to think of new methods making
the system even more smooth and productive.112
The direct work at Toyota is repetitive and has short cycle time (approximately 1 minute). The
workers have to be able to carry out a lot of different standardized work tasks, in order to achieve
106
Pascal, 2002 107
Liker, 2009 108
Bellgran, 1998 109
Hackman & Oldham, 1980 110
Sörqvist, 2004 111
Börnfelt, 2009 112
Ibid

27
a flexible organization. They also have responsibility for indirect work tasks as, reparations,
quality controls, maintain order and purchase material. This is considered as enrichment of the
work. 113
The workers at Toyota are organized into quality control circles and participation is compulsory.
The purpose is to create a feeling for responsibility, cut costs, make technical competence
improvements and to create conditions for the workers to be accepted and respected. At Toyota
the suggestions from the workers are rated by a committee and rewards are often given to the
whole group with the purpose to be used for group activities. Every year a reward is also given to
the person, which has come up with the most suggestions. Very valuable suggestions are also
rewarded by the company.114
At Toyota a very important part of the culture is “genchi genbutsu”, which means that you
should go to the source of the problem and look for yourself. Even top managers need to do this
and understand how the work on the shop floor is done, so they can live the company culture and
teach their employees. The philosophies of Toyota emphasize practical work and trial and error,
instead of theoretical knowledge. In lean the human elements are the most important resource and
to give the employees trust, feedback and respect is crucial.115
3.5.1 Ergonomics
According to Axelsson people in the industry believe in a strong relationship between
ergonomics and quality and they speak out of experience. Employee development and job
satisfaction is considered to be a pre-requisite of quality. Axelsson says that both qualitative and
quantitative data demonstrates that human errors resulting in quality deficiencies happen more
often when the ergonomic situation is poor. Failure rates are substantially increased when
working in adverse work postures and with high physical loading and he states that ergonomic
improvements can reduce quality deficiencies with 30-50%. He also shows that a feasible and
often necessary strategy to create lasting improvements is to integrate the perspectives of
employers, employees and customers i.e. efficiency, work conditions and quality.116
Adverse work postures can cause musculoskeletal disorders which not only affect the individual
but also the company if the disorders results in sick leaves and rehabilitation training.117
113
Börnfelt, 2009 114
Ibid 115
Liker, 2009 116
Axelsson, 2000 117
Neumann, 2004

28
3.6 Production development tools and techniques
This section will present important things to consider when performing production development
according to lean philosophy. Success factors are described and what to think about when
choosing project. A set of tools connected to improvement work will also be described here.
3.6.1 Important success factors for improvement work
In order to be successful in the implementation of an improvements program it is of great
importance that the top managers are involved and act in a convinced and visual way. Also
important is that the necessary resources are given for making the implementation possible.
Without this kind of involvement from the top managers it is hard to be successful in the
implementation.118
Another important prerequisite for a successful improvement project is that the project utilizes
the collective knowledge and experience of the employees, as Nilsson says. He means that the
difference between widespread distrust for a threatening change and a more accepted attitude
often lies in to what extent the personnel participate in the project.119
According to Sörqvist the initially prioritized projects should be chosen tactically, in order to
quickly and safely achieve success to demonstrate the improvements initiative with. Choosing to
big projects is a common mistake and the resistance to change should not be underestimated.
Follow up of ongoing project and verifications of results should also be highly prioritized.
Another very important thing is that the improvements projects are aligned with the company’s
strategies and goals.120
3.6.2 Value-stream mapping
Value-stream mapping is a tool or a technique that helps people understand how the value-stream
of a product works in an organization and shows both the information, material and product
flow.121
It helps the steering committee to visualize and communicate how the organization
works today and how they should act in the future to improve the cost, service and quality on the
products.122
This technique can create a high level look at the total efficiency of the company and
not just independent efficiencies of departments or individuals.123
A value-stream map is a basic
tool for both leading already existing value-streams and to continue and implement new value-
streams. It is the first and most important step to get focus and control over a transformation to
lean.124
The practices of companies’ that successfully implemented lean production shows that
value-stream mapping can eliminate 50% waste per process/step and reduce the cycle time by
118
Sörqvist, 2004 119
Nilsson, 1999 120
Sörqvist, 2004 121
Chen & Meng, 2010 122
Keyte & Locher, 2008 123
Chen & Meng, 2010 124
Keyte & Locher, 2008
29
30%. They also prove that it is possible to reduce variation from 30% to 5% and improve
quality.125
The steps in the value-stream map process are:
1. Choose product family and make delimitations
2. Map the current state
3. Map the future state
4. Develop an action plan on how to reach the future state
3.6.3 Kanban
There was a lot of waste in form of overproduction and buffers at Toyota that could be eliminated
if every process knew when the next replenishment was needed. Taiichi Ohno realized this and
wanted to create a system that would control these issues by creating a pull system through the
flow.126
Kanban is the Japanese word for card and a Kanban card conveys information regarding
what amount and when the next process will start. When a need is generated at the last process it
sends a card to the previous process which in turn sends a card further up the stream creating a
pull system.127
3.6.4 Pareto principle
Pareto principle is also known as the 80-20 rule or the rule of the vital few. The principle was
suggested by Josef M Juran who stated that 80% of the effects come from 20% of the causes.
This principle can be used by illustrating all the causes and how big impact they have on the
effect in a chart, which can be used to determine what cause is most important to solve.128
3.6.5 5S
5S is a concept that creates order and visualizes waste. It is originated from Japan and the
reactions from the Americans that visited Japanese factories in the 1970s were that everything
was so clean that you could eat from the floor. But the 5S program in Japan was responsible for
much more than just a good looking factory, their measures was also made to eliminate waste that
contributed to errors, defects and injuries at the workplace. The concept has gained popularity
because it creates an environment that is clean, well organized and efficient. The philosophies of
5S are now widely used as a starting point for continuous improvement efforts. The 5S is five
steps that you continually have to go through to eliminate waste, create structure, sustain the
order and find new improvements. Below is a short description of the five steps.129
1. Sort (Japanese translation, Seiri) – The concept starts by identifying what items are
necessary to get the job done efficiently and effectively. The essential items for the job
are tagged and the rest are removed.130
125
Chen & Meng, 2010 126
Liker, 2009 127
Ståhl, 2009 128
Bergman & Klefsjö, 2008 129
Liker, 2009 130
Ibid
30
2. Set in order (Seiton) – In this step all the tagged items needs to be determined where they
should be placed for easy access. Every item needed for the job needs a home where they
always could be found when needed. A common reason for long downtimes in many
industries is due to searching for items that are not in its place.
3. Shine (Seiso) – The first two steps have organized the required tools and equipment
efficiently and eliminated what is not needed. It is now necessary to keep everything that
is used to make the product clean to reduce the risk that dirt in the production processes
cause deviations in the product.
4. Standardize (Seiketsu) – The fourth step is to standardize processes so they can be used
to maintain the first three steps. Visual management is very important for visual
identification of abnormalities in the surroundings. Color-coding and standard colors is
one way to visualize these abnormalities so they can be detected and corrected
immediately.131
5. Sustain (Shitsuke) – The final step is the most challenging one. It is all about defining a
new status quo with a mindset that thinks lean. Everyone must be willing to maintain
order and cleanliness and feel that the standard procedures are a normal way of life
instead of just a response to a 5S audit.132
Without 5S many waste accumulates and hides problems, often in form of buffers, and becomes
an accepted dysfunctional way of doing business. Using all five S´s creates a continuously
improving environment that becomes more efficient and eliminates waste. Most of the companies
that have succeeded with their 5S program have regularly audits of the program. These audits are
performed randomly and they use checklists to see how well the program is followed and what
they need to change and how to become a more mature organization.133
3.6.6 5 Why
There are some difficulties that need to be considered when trying to eliminate waste. First the
waste has to be identified and analyzed, then the right measures has to be done so that the waste
does not occur again.134
5 Why is a method that finds the root cause of a deviation. By asking the
question “Why?” at least five times, starting with a simple question and then going deeper in to
the cause, the root cause of the problem should come up. Most of the time it is the process rather
than the operator who is the root to a deviation. The managers have to believe that the operator is
131
Howell, 2009 132
Ibid 133
Liker, 2009 134
Ståhl, 2009
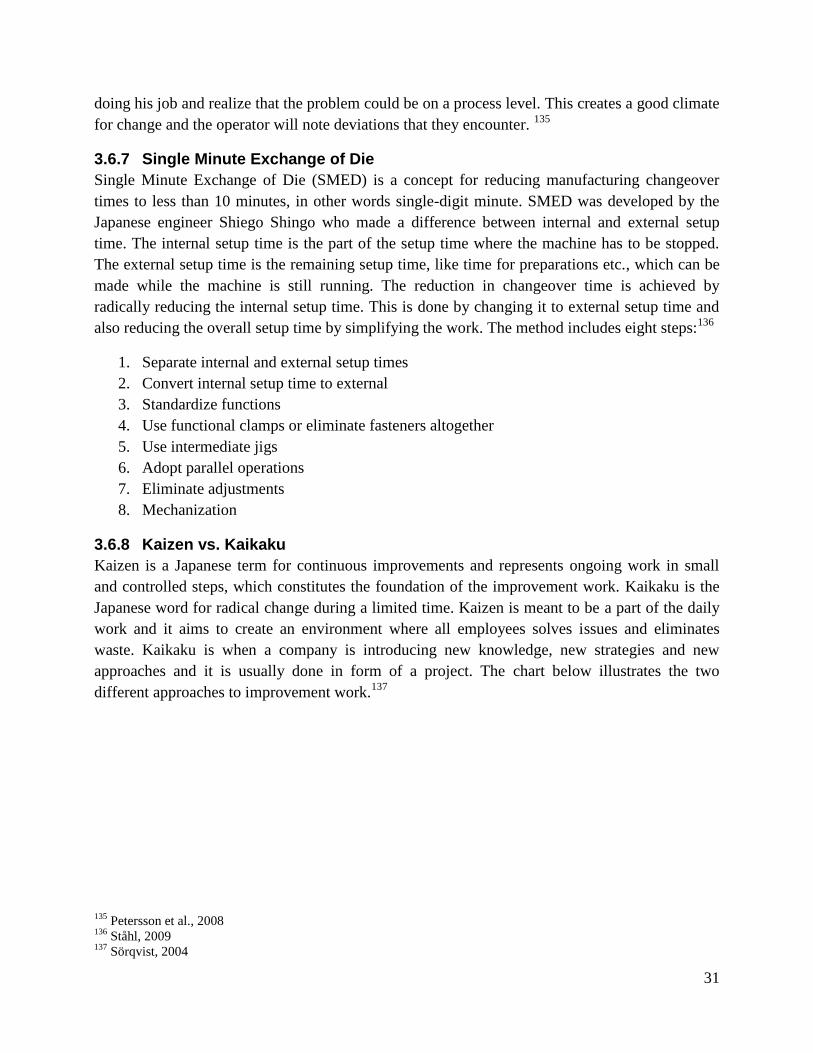
31
doing his job and realize that the problem could be on a process level. This creates a good climate
for change and the operator will note deviations that they encounter. 135
3.6.7 Single Minute Exchange of Die
Single Minute Exchange of Die (SMED) is a concept for reducing manufacturing changeover
times to less than 10 minutes, in other words single-digit minute. SMED was developed by the
Japanese engineer Shiego Shingo who made a difference between internal and external setup
time. The internal setup time is the part of the setup time where the machine has to be stopped.
The external setup time is the remaining setup time, like time for preparations etc., which can be
made while the machine is still running. The reduction in changeover time is achieved by
radically reducing the internal setup time. This is done by changing it to external setup time and
also reducing the overall setup time by simplifying the work. The method includes eight steps:136
1. Separate internal and external setup times
2. Convert internal setup time to external
3. Standardize functions
4. Use functional clamps or eliminate fasteners altogether
5. Use intermediate jigs
6. Adopt parallel operations
7. Eliminate adjustments
8. Mechanization
3.6.8 Kaizen vs. Kaikaku
Kaizen is a Japanese term for continuous improvements and represents ongoing work in small
and controlled steps, which constitutes the foundation of the improvement work. Kaikaku is the
Japanese word for radical change during a limited time. Kaizen is meant to be a part of the daily
work and it aims to create an environment where all employees solves issues and eliminates
waste. Kaikaku is when a company is introducing new knowledge, new strategies and new
approaches and it is usually done in form of a project. The chart below illustrates the two
different approaches to improvement work.137
135
Petersson et al., 2008 136
Ståhl, 2009 137
Sörqvist, 2004
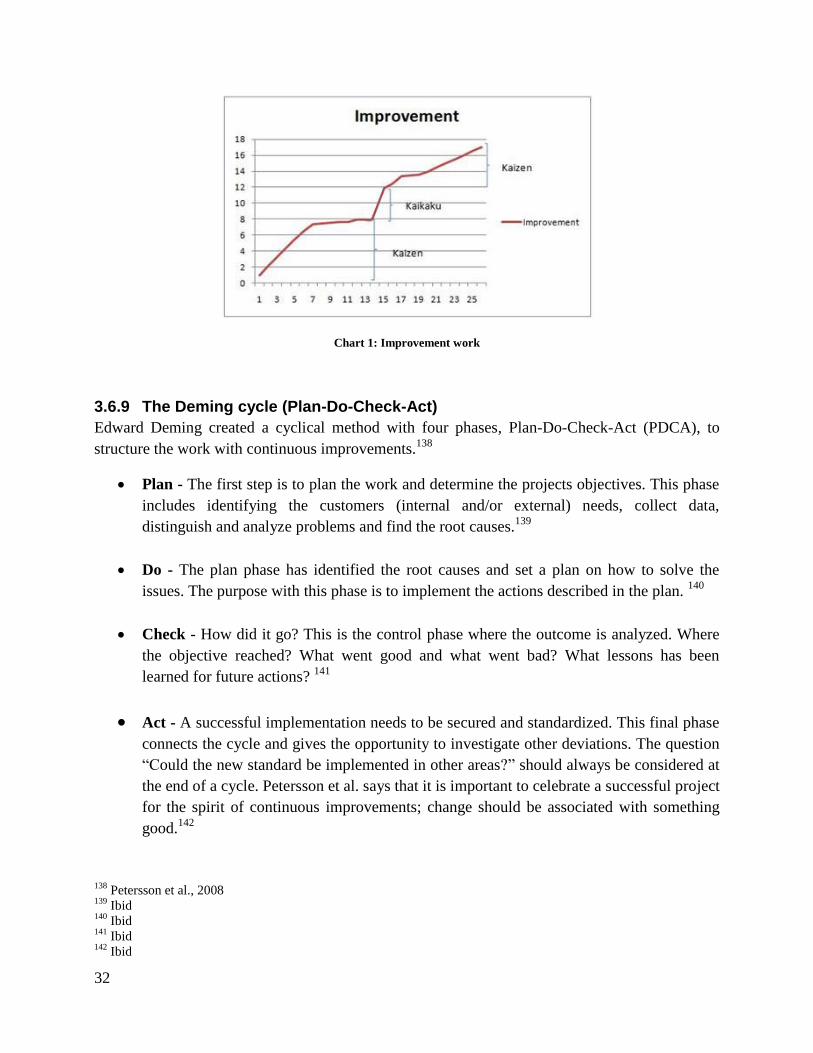
32
Chart 1: Improvement work
3.6.9 The Deming cycle (Plan-Do-Check-Act)
Edward Deming created a cyclical method with four phases, Plan-Do-Check-Act (PDCA), to
structure the work with continuous improvements.138
Plan - The first step is to plan the work and determine the projects objectives. This phase
includes identifying the customers (internal and/or external) needs, collect data,
distinguish and analyze problems and find the root causes.139
Do - The plan phase has identified the root causes and set a plan on how to solve the
issues. The purpose with this phase is to implement the actions described in the plan. 140
Check - How did it go? This is the control phase where the outcome is analyzed. Where
the objective reached? What went good and what went bad? What lessons has been
learned for future actions? 141
Act - A successful implementation needs to be secured and standardized. This final phase
connects the cycle and gives the opportunity to investigate other deviations. The question
“Could the new standard be implemented in other areas?” should always be considered at
the end of a cycle. Petersson et al. says that it is important to celebrate a successful project
for the spirit of continuous improvements; change should be associated with something
good.142
138
Petersson et al., 2008 139
Ibid 140
Ibid 141
Ibid 142
Ibid

33
4 Current state This chapter describes the current state of HES in Ronneby and is together with chapter 3 the
foundation of the analysis in chapter 5. The current state will be described in the same order that
the value flow was mapped by the authors. After that HES currently work with visualization and
takt will be described as well as the work organization.
4.1 Customer order to order dispatch overview
Alfa Laval communicates with their customers through a sales company which in turn places a
customer order to the order department. The order department creates a production order and
acknowledges the order and then the production planner together with the production manager
and the team leaders’ plans the production. The warehousing staff prints a picking list and
collects the included items and then the assembly personnel preassembles modules which later
are used in the assembly line or at the one piece production stations before they are dispatched.
HES´s production and their warehouse were moved from another building in January 2010 and
they had to adapt to the new available space, which is much smaller than the old one. The shop
floor is divided in four main areas: warehouse, preassembly, assembly line and one piece
production stations, see appendix 1.
4.1.1 Customer need to customer order
When a customer turns to Alfa Laval they communicate with a sales company which do anything
they can to fulfill the customers need and make them place an order. They have a portfolio with
standard products but they also gives the customer the option to change the specification, for
instance if they have a situation where they need a bigger pump or another valve. Alfa Laval has
an engineering department that customizes standard products and creates a special product to
satisfy these kinds of needs. The order is then placed direct via EDI to Jeeves, Alfa Laval’s MPS
system, or by mail to the order department. When an order arrives the order department makes an
availability check for material and capacity and then sends an order acknowledgement back to the
sales company who communicates the information to the customer. Production order is made to
match every customer order and to make a finished product they often have to make several
production orders. This is because a finished product often consists of several modules that they
assemble in the preassemble area before it goes to the assembly line or to the one piece stations.
Alfa Laval has some of the standard products in stock with a lead time of two days and some are
assembled to order with a lead time of approximately 10 days while they for some products have
to place an order for material which gives them a longer lead time. An order which will be
assembled the following week normally gets Friday as ship date so that the production planner
can plan the next weeks production with minimum downtime. If they know that an order is very
urgent for the customer they have the ability to check a box in Jeeves called ASAP (As soon as

34
possible). When ASAP is checked the staff at the distribution center dispatch the order the same
day as it is assembled.
4.1.2 Planning process
The production planner meets with the production manager and the production team leaders’ one
or two times per week to plan the production for the following week. They go through the order
book and plan the week by different product families, for instance they place all XXX on
Monday and all YYY on Tuesday to minimize the number of changeovers, resulting in less
downtime in the assembly line. Observations and experience from the personnel shows that the
downtime when they change product families differs from 15 minutes up to 1 hour. HES´s
demand works as a pull system and it is the customer order that generates the assembly of most
of the product.
The planners work with a production schedule which is an Excel file with all the production
orders for the preassembly, the assembly line and the one piece stations for next week. They use
production leveling to plan a suitable number of products each day. The schedule shows how
many and on what day they should be assembled. It also has a description field that is used to put
the full product name and information regarding what differs from the standard product in case of
an order unique product. This field is today used moderately and it is only a few of the production
staff that can interpret it in case of a customized product. The production schedule is sent to the
warehousing personnel in order to communicate what day they need to pick the orders and it is
also displayed on the cell status board, described in section 4.3, where a daily meeting is held
with the production staff. There is no information on the production schedule about what time to
pick the material and when the changeovers are to be made. Currently some of the preassembled
articles are not registered as modules, which mean that they do not come up on the production
schedule. The production and the sales company do not always agree which articles that should
be registered as modules and this creates confusions. Here it is up to the personnel to keep in
mind what needs to be preassembled and at what time. The current inconsistency and lack of
explanations when having a product that differs from the standard product, force the personnel to
go through the production order document and compare them to the standard product to find out
what differs. Confusions like this have created a mindset among the personnel that these
customized orders always comes with trouble and most of them are therefore against the large
number of variants that the sales company offers the customers to choose from. There is neither
any information describing which station the change concerns when having a customized
product.
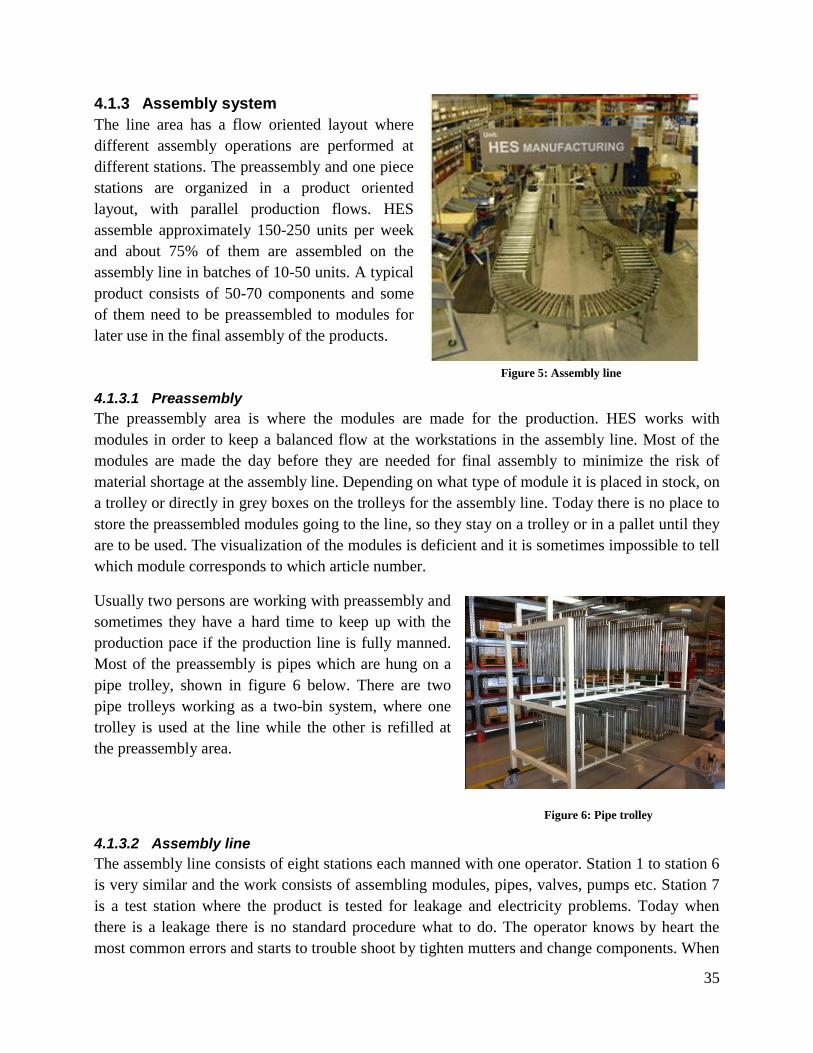
35
4.1.3 Assembly system
The line area has a flow oriented layout where
different assembly operations are performed at
different stations. The preassembly and one piece
stations are organized in a product oriented
layout, with parallel production flows. HES
assemble approximately 150-250 units per week
and about 75% of them are assembled on the
assembly line in batches of 10-50 units. A typical
product consists of 50-70 components and some
of them need to be preassembled to modules for
later use in the final assembly of the products.
4.1.3.1 Preassembly
The preassembly area is where the modules are made for the production. HES works with
modules in order to keep a balanced flow at the workstations in the assembly line. Most of the
modules are made the day before they are needed for final assembly to minimize the risk of
material shortage at the assembly line. Depending on what type of module it is placed in stock, on
a trolley or directly in grey boxes on the trolleys for the assembly line. Today there is no place to
store the preassembled modules going to the line, so they stay on a trolley or in a pallet until they
are to be used. The visualization of the modules is deficient and it is sometimes impossible to tell
which module corresponds to which article number.
Usually two persons are working with preassembly and
sometimes they have a hard time to keep up with the
production pace if the production line is fully manned.
Most of the preassembly is pipes which are hung on a
pipe trolley, shown in figure 6 below. There are two
pipe trolleys working as a two-bin system, where one
trolley is used at the line while the other is refilled at
the preassembly area.
Figure 6: Pipe trolley
4.1.3.2 Assembly line
The assembly line consists of eight stations each manned with one operator. Station 1 to station 6
is very similar and the work consists of assembling modules, pipes, valves, pumps etc. Station 7
is a test station where the product is tested for leakage and electricity problems. Today when
there is a leakage there is no standard procedure what to do. The operator knows by heart the
most common errors and starts to trouble shoot by tighten mutters and change components. When
Figure 5: Assembly line
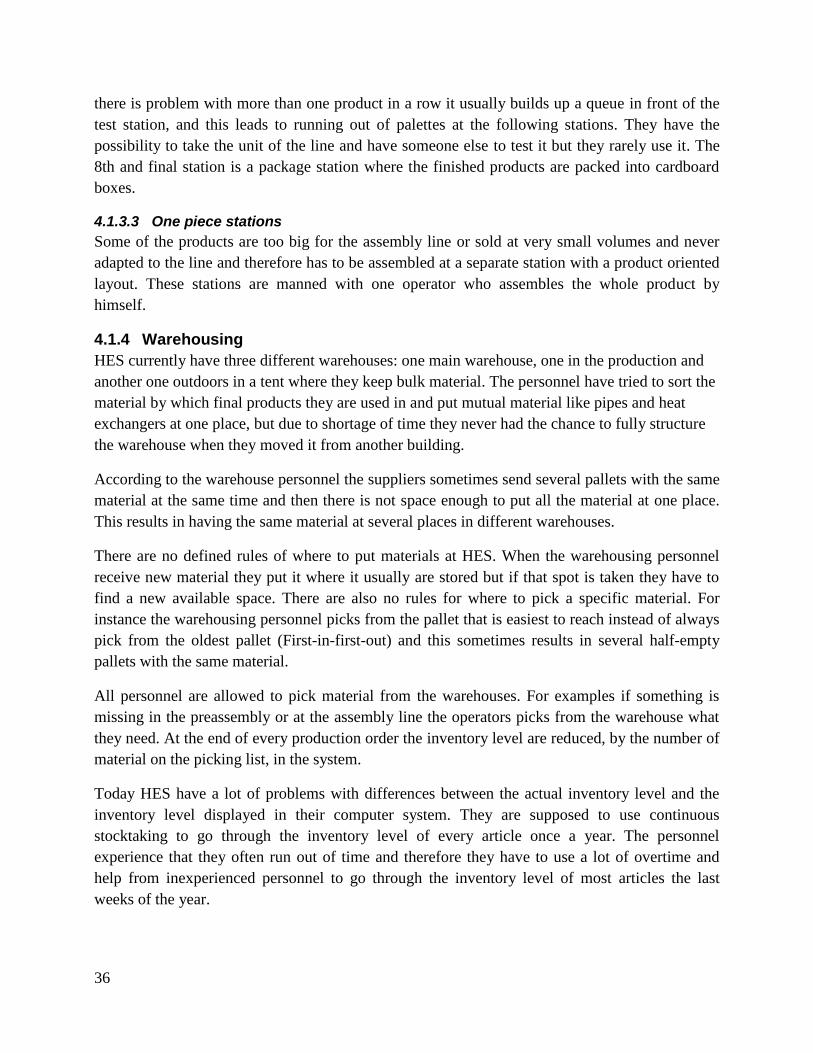
36
there is problem with more than one product in a row it usually builds up a queue in front of the
test station, and this leads to running out of palettes at the following stations. They have the
possibility to take the unit of the line and have someone else to test it but they rarely use it. The
8th and final station is a package station where the finished products are packed into cardboard
boxes.
4.1.3.3 One piece stations
Some of the products are too big for the assembly line or sold at very small volumes and never
adapted to the line and therefore has to be assembled at a separate station with a product oriented
layout. These stations are manned with one operator who assembles the whole product by
himself.
4.1.4 Warehousing
HES currently have three different warehouses: one main warehouse, one in the production and
another one outdoors in a tent where they keep bulk material. The personnel have tried to sort the
material by which final products they are used in and put mutual material like pipes and heat
exchangers at one place, but due to shortage of time they never had the chance to fully structure
the warehouse when they moved it from another building.
According to the warehouse personnel the suppliers sometimes send several pallets with the same
material at the same time and then there is not space enough to put all the material at one place.
This results in having the same material at several places in different warehouses.
There are no defined rules of where to put materials at HES. When the warehousing personnel
receive new material they put it where it usually are stored but if that spot is taken they have to
find a new available space. There are also no rules for where to pick a specific material. For
instance the warehousing personnel picks from the pallet that is easiest to reach instead of always
pick from the oldest pallet (First-in-first-out) and this sometimes results in several half-empty
pallets with the same material.
All personnel are allowed to pick material from the warehouses. For examples if something is
missing in the preassembly or at the assembly line the operators picks from the warehouse what
they need. At the end of every production order the inventory level are reduced, by the number of
material on the picking list, in the system.
Today HES have a lot of problems with differences between the actual inventory level and the
inventory level displayed in their computer system. They are supposed to use continuous
stocktaking to go through the inventory level of every article once a year. The personnel
experience that they often run out of time and therefore they have to use a lot of overtime and
help from inexperienced personnel to go through the inventory level of most articles the last
weeks of the year.

37
4.1.5 Material supply
The material for the assembly line is supplied in batches for the different product families. No
exact counting is made and when they produce within the same product family, they use
continuous supply. The preassembly also uses continuous supply where the assembly personnel
pick components by themselves. Only some components used in preassembly are located in the
main warehouse and needs the involvement of the warehousing personnel. The supply for the one
piece stations are done in a different way. Here the personnel do kitting of the order in trolleys,
which are picked from a material square by the assembly personnel when needed.
The warehousing staff uses the production schedule to plan their week in order to pick the orders
at the right day. They print a picking list with all the articles that the order consists of and at what
shelf they are stored on at the warehouse. The information on the picking list comes from Jeeves
and due to changes in products and lack of updates in the system there are some faults on the
picking lists. For instance there could be components that are needed for the order that are not
listed on the picking list, due to faulty product structures. The result of this is that not all material
gets withdrawn from Jeeves when reporting the order after assembly.
Most of the products are picked by the warehousing staff with a forklift from the main warehouse
and the production warehouse. Some of the articles need to be picked with help from personnel
that collects the articles from a stock placed in an outside tent. The responsible personnel of the
tent are very busy and they therefore need to prepare and collect these items in advanced not to
risk that the tent personnel is unavailable when they need the articles.
There is a big square, marked in the middle of the shop floor, for incoming and outgoing material
for the preassembly, assembly line and the one-piece stations. The meaning is to show, in a visual
way, which material is going in for assembly and what has been used and can be taken away.
Today this material square is not managed as intended, as it also is used as buffer for trolleys and
material and the left-over material is not returned to the warehouses frequently, see figure 7.
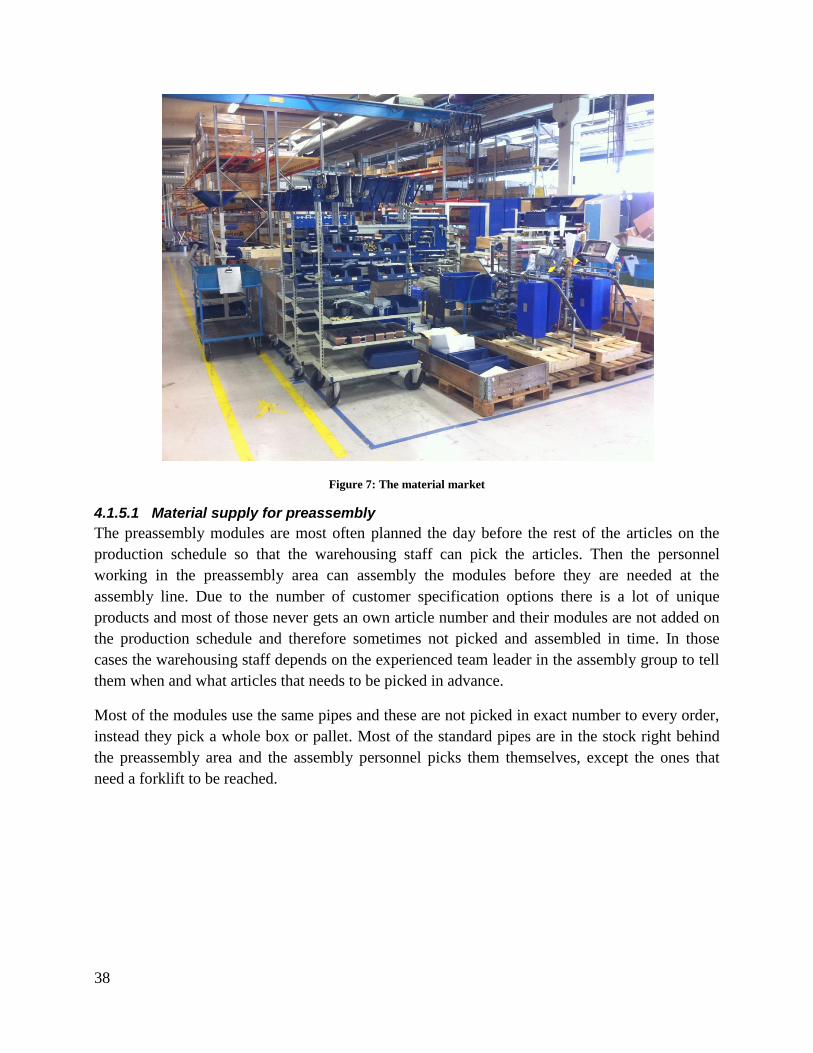
38
Figure 7: The material market
4.1.5.1 Material supply for preassembly
The preassembly modules are most often planned the day before the rest of the articles on the
production schedule so that the warehousing staff can pick the articles. Then the personnel
working in the preassembly area can assembly the modules before they are needed at the
assembly line. Due to the number of customer specification options there is a lot of unique
products and most of those never gets an own article number and their modules are not added on
the production schedule and therefore sometimes not picked and assembled in time. In those
cases the warehousing staff depends on the experienced team leader in the assembly group to tell
them when and what articles that needs to be picked in advance.
Most of the modules use the same pipes and these are not picked in exact number to every order,
instead they pick a whole box or pallet. Most of the standard pipes are in the stock right behind
the preassembly area and the assembly personnel picks them themselves, except the ones that
need a forklift to be reached.

39
4.1.5.2 Material supply for one piece stations
The products that are assembled in the one piece flow
have trolleys with dedicated and marked holders for
every article. These orders are kitted by the
warehousing staff and placed in the material square
with in- and outgoing material, described in section
4.2.5, the day before they are going to be assembled.
When kitting the orders, the warehousing staff takes
an empty trolley from the material square and put the
articles directly to its dedicated holder. Today it is
hard to tell which trolley going where and also hard
to get the trolley from the material square, due to the
disorder.
4.1.5.3 Material supply for assembly line
Bulk material such as heat exchangers and pumps are delivered on a pallet to a lifting tackle to
each station. These articles are often heavy and in order to reduce the number of heavy manual
lifts the warehousing staff never picks them out of the pallet, instead they deliver the whole pallet
to the line. Because there is no information on the picking list regarding which material going to
which station, the personnel have made some basic cheat sheets as support for knowing where to
put the pallets. When a changeover takes place all pallets need to be changed starting with the
ones at the 1st station. Currently there is no chance to prepare for the next order, so when it is
time for a changeover the warehousing personnel gathers the pallets as quickly as possible from
the warehouse in order to minimize the waiting time at the line. Not all pallets have a dedicated
spot in the warehouse according to Jeeves, so in these cases they have to rely on their experience
telling them where they usually put them and this causes a lot of searching.
Other material is provided in grey boxes placed on
trolleys right behind the line operators. The boxes
are divided into different compartments and most
compartments are marked with article number. The
marking is not always correct because in the same
compartment there can be different articles
depending on which product they are assembling.
Today there are only three sets of boxes and two
sets of trolleys, but according to the assembly
personnel there should be a set of boxes for every
product family to eliminate confusions.
Figure 8: Trolley for materiel to one piece stations
Figure 9: Grey boxes for picked line material

40
The picking list has no information regarding where to put the material and in which box, so the
warehouse staff has to rely on the experienced assembly personal to tell them in what box they
should place the material. Most of the materials in the boxes are pipes and modules that are
stored close to the assembly line and often picked by the assembly personnel themselves.
Sometimes there are confusions about who is supposed to pick which material. No exact counting
of this material is made, so when needed the assembly personnel or the warehousing personnel
just refills with more material. Between similar end products the changeovers sometimes consist
of refilling the boxes with a different pipe or pump mixing it with material from the previous
order. Interviews with the warehousing personnel show that they think this is a good way to
work. The reason given was that it avoids heavy lifting for the personnel and that it is not as time
consuming as exact counting.
When there is a changeover to a new product family the operator at each station is responsible to
switch his own trolley with grey boxes. A typical change for the line operators consist of
changing palettes and pipe trolley at the first station and change of trolleys at the following four
station and boxes at the package station. The excess material in the grey boxes are left on the
trolleys and placed at the end of the shop floor until they should assembly that product type
again, usually about a week later. The area where the trolley is left is not connected to the line
where the material is used. Every time there is a changeover the line personnel walks across the
shop floor to get the trolleys. During this time the line is not running. The collected trolley is
placed at the line and the warehousing staff and the assembly personnel looks in the boxes to see
what material they need to gather from to the new order the stock. These switches between
product families take between 15 to 60 minutes depending on how much material that needs to be
refilled from the stock.
The warehousing staff continuously keep track on the material levels in the pallets and grey
boxes so that the assembly operator never runs out of material. If an operator runs out of a
material in the boxes and the warehousing staff is not around, they often leave the line to gather
material themselves in order to save time. This is not possible when a pallet is empty and in this
case they have to wait for the warehousing personnel to change the pallet with a fork lift.
HES are currently testing to use blue boxes for the order unique material for customized
products. They simple put the components for one product in a blue box and send the box right
after the palette on the line. For example if the customized product has a different pump than the
standard product the special pump is placed in the blue box next to the palette. When the palette
together with the blue box arrives to the station where pumps are mounted the operator
immediately recognizes that he should use the special pump.
4.1.5.4 Order dispatch
The personnel at the distribution center starts every day by printing a list from Jeeves with all
orders that should be dispatched. It is up to them to keep track on the list and collect finished
orders from the production and the stock of finished goods. The order department keeps track if

41
order is finished before the promised date and the customer has requested it as soon as possible
and communicates this to the personnel at the distribution centre so they can send the order
immediately.
4.2 Visualization and 5S Problems that occur are written on a Cell Status Board, which are reviewed every morning. The
problems are categorized after how long time they take to solve and what actions to be taken.
Who is responsible to solve the issues are also discussed and posted on the daily meeting. This is
also the board where the production schedule is posted letting everyone take part of it. The board
also shows the planned and actual output for every day the current week.
HES are working with 5S and they have realized lots of the benefits with it, but the management
does also understand that it takes some time to set the right mindset among the personnel. The
managers have the knowledge to implement a lot of changes to make the factory look like they
are great at lean, but they have identified the important need of the right mindset among the
personnel to be successful and continuously improve their work area. The work is audited on a
regularly basis using checklists and the audits show varying results, some areas are well marked
and everything is in place while other areas needs more work. For example many tools in the
assembly line have its own place, but according to the assembly personnel not always the right
place. There are also some tools that have no dedicated place and they are often placed in a grey
box together with the components and when a changeover is made the tools disappears together
with the trolley. The company uses markings on the floor in order to organize the shop floor.
They do this by using standardized 5S colors, for example scrap containers have their own
dedicated place marked with red lines, and footpaths that separate pedestrians from the truck
aisles are marked with yellow lines.
Apart from the 5S audit, the order on the shop floor is regularly viewed from a customer
perspective. This is called Customer/ Waste walk and is a walk where the unit manager brings
one of the operators and asks him to describe what he sees, then the unit manager explain how a
customer might see it. Things that come up on these walks are often symptoms like “there are a
lot of plastic straps lying around on the floor beneath station 5 and it looks messy” and the
manger tries to make the operator identify the reason for this mess and how it could be solved.
For instance “If we put a bin under the line at station 5 all the straps will fall into the bin and that
will make the area cleaner and then we do not have to sweep up the straps all the time”. The
manager explains how this solution not only makes it cleaner and save time, it also reduces the
risk of injury caused by someone slipping on the plastic straps. The manager does these walks
every week with different operators to create a mindset where they understand that 5S is much
more than just making the surroundings looks good.
42
HES use instructions in form of a standard operation procedure (SOP) to ensure that every
operator knows how to assemble a product the right way. The SOP is tailor made for every
station and placed in front of the operators work area. It consists of a step by step guide with
pictures describing how to assemble a product. There is not a SOP for every product due to
number of special variants, but they are continuously adding new SOP so there will be one for
every product.
4.3 Takt
Alfa Laval’s production engineers uses a video based software tool called AviX to determine all
operation time that is needed to assemble a product. The software helps them to balance the
operations between the stations so that the product can be assembled at an even pace on the line.
The team manager uses the operation time and the number of people manning the line to
determine how many units the line should produce every day. This number is shown on the cell
status board described in section 4.3 and after each day the number of actual produced units is
posted on the board. The difference between these numbers is discussed on the daily meetings
and the reason for that difference is often material shortage, problems getting the units through
the test or lack of staff. Observations by the authors show that the operation time still varies
between stations. The takt is close connected to the number of people working at the line, 8
people means maximum pace, four people means 50% pace and so on. The production engineer
and the managers want the operator to follow the product from station to station until it is
completed if they are an uneven number, for instance 7 people. Observations show that this is
rarely done.
The Unit manger is aware of the benefits with fully using takt through the entire supply chain as
described in section 3.4.5 and also how to visualize the takt in the production, but he thinks that
the current production is to unstable and the maturity among the staff needs to be improved
before they can extend their work with takt.
4.4 Work organization The cycle time of repetitive work are, depending on what kind of product is assembled,
approximately 5-10 minutes at the line within HES. One to three times a day the workers are
switching work tasks with each other. Today nothing is automated at HES, so everything is done
manually except from some help from supporting tools like lifting devices at the work stations.
The assembly personnel have responsibility for the quality of the assembled products and they
sign the order before dispatch. Together they are also responsible for the outcome of the
assembly work, and have to explain at the production meeting if yesterdays target was not
reached. They also have different areas to be responsible for, like spare parts or SOPs.

43
Today there is no reward system for suggestions at HES. The employees are instead supposed to
solve problems continuously or mention the problem at the morning meeting. Then when the unit
manager feels like there have been a lot of improvements he rewards the employees with some
sort of group activity.
Recently the warehousing personnel became a part of the assembly organization and more
integrated in the process as they now have the same manager. The personnel think this is more
natural as they work close together with the assembly personnel.
At HES the managers spend a lot of time in the production and listens to what the employees say
and in case of a problem they go to the source of the problem themselves. The unit manager has a
daily routine where he walks through the production every morning for making sure that
everything is alright and to give the employees a natural chance to bring up ideas or problems to
him in person. In general the managers at HES understand that the human elements are very
important. The managers also continuously tell the employees to write problems that come up on
the cell status board and explain that this is necessary for having a chance to improve their work.
4.4.1 Ergonomics
HES have a safety representative among the personnel who is responsible for the work
environment and all new suggestions must be approved by him. He looks at the ergonomic
aspects and tries to minimize the number of heavy lifts and adverse work postures. They have
some supporting tools to ease the work, for instance lifting tackles used to get the pallets at an
ergonomic height for the operator that picks the material from the pallet.
44
5 Current state analysis With the theoretical framework as foundation the current state at HES is analyzed in this chapter.
The analysis identifies gaps, which generate waste and inefficiencies, between how HES
currently are working and how they could work according to the theoretical framework. They are
then compiled in appendix 2. This analysis will lead to suggestions and implementations further
on in the project. 5 Why is frequently used to identify the cause to a gap.
5.1 Layout and value stream When the production of HES was moved they had to adapt to the new factory as well as they
could. Today the shop floor layout is not fully designed after the production flow, see appendix 1.
A visual and natural flow would be to place every value creating process after each other
according to the value stream. In this case starting in one end with incoming goods to the
warehouse and then proceed with the preassembly area followed by the production line and
ending with the stock of finished goods and dispatch. The current setup creates waste in form of
unnecessary transportations on the shop floor when moving trolleys and pallets back and forth.
By having three different types of warehouses spread out which is not fully organized the
warehousing personnel has no natural route when gathering material for the production. This
means they need to do a lot of unnecessary movement and searching, which is contrary to lean
production. Some of the pallets used at the line are placed in the outside tent, causing a lot of
downtime at the line if they have not prepared and gathered this in advance when it is time for a
changeover or when running out of material. The reason for the spread out warehouses and
unnatural production layout is explained to be due to lack of space in the new factory area and
limited time given when moving from the old factory.
5.2 Customer order and planning process The sales company tries to satisfy the customers´ demand on customized products resulting in a
lot of customer unique products, which increases the complexity in the production. Due to the
long downtime that occurs at every changeover, the production aims to minimize the number of
changeovers every week. According to lean the customer demand should trigger the production
creating a pull system and in an optimal production, with a one piece flow without downtime at
changeovers, the production should produce in the same number and order that the customer
order arrives, see section 3.4.4. The current method to plan the production results in varying lead-
times for the customer depending on how well their desired product fits in the current production.
Producing with as few changeovers as possible results in larger batches and products is produced
before they are needed. In lean this is called overproduction and it is considered to be the most
common and also the worst kind of waste. Overproduction like this leads to increased lead time,
decreased inventory turnover and more tied up capital in the finished goods stock. HES uses this
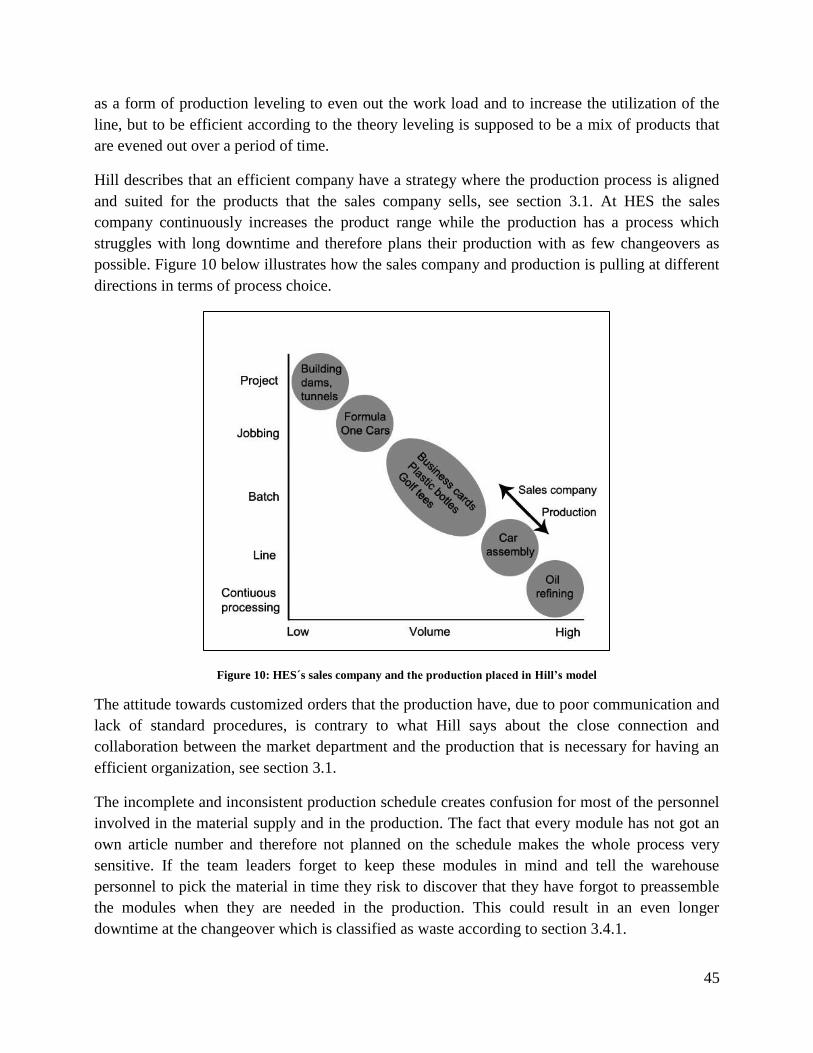
45
as a form of production leveling to even out the work load and to increase the utilization of the
line, but to be efficient according to the theory leveling is supposed to be a mix of products that
are evened out over a period of time.
Hill describes that an efficient company have a strategy where the production process is aligned
and suited for the products that the sales company sells, see section 3.1. At HES the sales
company continuously increases the product range while the production has a process which
struggles with long downtime and therefore plans their production with as few changeovers as
possible. Figure 10 below illustrates how the sales company and production is pulling at different
directions in terms of process choice.
Figure 10: HES´s sales company and the production placed in Hill’s model
The attitude towards customized orders that the production have, due to poor communication and
lack of standard procedures, is contrary to what Hill says about the close connection and
collaboration between the market department and the production that is necessary for having an
efficient organization, see section 3.1.
The incomplete and inconsistent production schedule creates confusion for most of the personnel
involved in the material supply and in the production. The fact that every module has not got an
own article number and therefore not planned on the schedule makes the whole process very
sensitive. If the team leaders forget to keep these modules in mind and tell the warehouse
personnel to pick the material in time they risk to discover that they have forgot to preassemble
the modules when they are needed in the production. This could result in an even longer
downtime at the changeover which is classified as waste according to section 3.4.1.
46
5.3 Assembly systems
The preassembly and one piece stations at HES are product oriented with parallel production
flows and are an important complement to the line organization. As HES have some big products
including a lot of manual work and which is not frequently ordered this kind of layout is suitable
according to section 3.2.3.2. The productions flow parallelization increases the capacity and
flexibility of HES assembly system at the same time as it reduces the sensitivity for disturbances,
as described in 3.2.3.2.
Due to the high level of customized orders and increasing product range at HES and at the same
time having a line organization makes it crucial to have short changeover times, see section
3.2.3.1. This is not the situation today and this increases the lead time for customers and tied up
capital, as batch planning is utilized to reduce downtime.
Observations show that the test station is the bottleneck of the line. Once there is a leakage the
operator tries to fix it instantly and a queue is building up if he cannot fix it quickly. When
investigating the problem the authors found that there are no rules or guidelines of the
troubleshooting or how long time to spend on it. The lack of these kinds of guidelines is the
reason that this station is the bottleneck. They have the ability to put the unit to the side for
troubleshooting by someone else so that they do not interrupt the rest of the line but the authors
observations show that it is rarely done.
5.4 Warehousing
The focus on getting the production started as fast as possible without managing the warehouse
properly when relocating HES has and will continue to cause waste, in form of searching and
unnecessary movements, if not corrected.
The fact that preassembled modules for the line do not have dedicated places in any warehouse
causes the preassembly area to be messier than it has to be. Today the warehousing personnel
constantly have to interrupt the team leaders, and check which modules to pick and where to put
them. According to section 3.6.5 there are a lot of advantages with visualization, like having an
environment that is clean, well organized and efficient without waste.
When a pallet is empty and removed from the pallet rack it has to be removed in Jeeves. When
the personnel forget this step they are creating more work for themselves. It is critical that Jeeves
is up to date to keep control of the inventory; otherwise it is not possible to see where they have
available space in the warehouse when they need to add new articles. Instead they have to
physically go through the forklift aisles to find available space in the pallet rack. By not having
this updated and visual it causes a lot of waste like unnecessary movement and searching. The
fact that no first-in-first-out rules are applied lead to spread out material, which creates disorder
and makes the material impossible to trace if they pick from several batches at the same time.
47
The material market is today divided into incoming and outgoing material, but observations show
that this is not followed properly. All kinds of material and trolleys are mixed in this zone and
also excess material, which has not been returned. This has a negative impact on the visualization
and generates waste in buffers and searching of material. The reason is that there is no available
place to put the trolleys gathered from the outgoing square, and as a result of this they will be left
there until they are to be used again. The disorder in the material market also makes it hard to
reach the needed trolley without having to move around several trolleys. This kind of behaviors is
very different from how the theoretical framework describes how to make the process visual, sees
section 3.6.5, and also causes a lot of waste over and over again.
Currently leftover materials from several orders are placed on a trolley in the outgoing area
without any documentation for the warehousing personnel to identify the article number of the
left over material with. Thereby there is no way of knowing where to place it in the warehouse. If
there are articles on the picking list that are not used for the order this material ends up on a
trolley like this and there is no way of knowing which order the excess material belongs to. This
makes it impossible to know which picking list to update so that the same excess material will not
be picked over and over again. It also hides problems with the product structure as there is no
way to see if it is correct or not. This increases the risk of withdrawing wrong components from
Jeeves every time reporting those products. This risk is also increased by the fact that everyone
are allowed to pick material from the production stock, because when some components are
missing the assembly personnel just go pick them without telling anyone to check the product
structure. According to section 3.5 it is necessary to bring these kinds of problems to the surface
for having a possibility to correct them and improve the process.
Left over material that is left on the trolleys can also cause confusion due to the fact that
according to Jeeves the material is on its attended place in the warehouse. Keeping the extra setup
of trolleys for the line at the end of the shop floor generates unnecessary transportations and the
excess material in the grey boxes is also a buffer that is not shown in the system. Buffers like this
could in some cases be the cause to stock difference. The personnel simply cannot find the
material when they are stocktaking if it is left in different temporary buffers on the shop floor. As
described in section 3.4, extra raw material and work in process like this are contributing to
longer lead times, higher grade of obsolescence and more tied up capital. The extra
transportation also means extra downtime in the line when a changeover is made.
5.5 Material supply
By not knowing if the picked material is enough for the order or when it is time for a changeover
force the warehouse personal to continuously check the situation at the line. This interrupts their
other work tasks, like kitting trolleys to the one piece stations and receiving new gods and adding
it to the stock. These kinds of interruptions and continuously checkups make their daily work
very stressful and a lot of time are wasted driving back and forth, time that could have been used

48
for other things. The theoretical framework shows that these checkups and interruptions could be
eliminated if the situation at the line was more visual. Keeping some material in a tent where they
are dependent on the availability of another fork lift means that they risk even more downtime if
they forget to gather the material in advance or if the fork lift is busy when needed.
The mixing of different kind of material in the same compartments makes it difficult for the
assembly personal to know which article to use on the product they are assembling. This is a big
quality issue, as they risk assembling the wrong material and sending a faulty product to their
customer. A lean environment should be visualized and have different dedicated places for
different kinds of material and thereby not allowing this mixing of material.
One of the reasons that a changeover is very time consuming is because the assembly personnel
gathers and refills some of the articles in the grey boxes themselves instead of starting to
assembly products for the new order. SMED distinguishes between internal and external
changeover time and a manual assembly line like this should not need to have this long internal
changeover time.
The current picking lists contains no information regarding which material goes to which station
so the warehouse personnel have to interrupt and ask the team leaders with most of the material.
Today the warehousing personnel also have problems to separate the modules from each other
and state which module that corresponds to a certain article number. This creates waste in form of
searching, movement and leads to interrupting the team leaders with questions all the time. Here
is a gap between how they are working and how they could be working according to 5S. Every
item should have its own place where everyone know where to find it according to 5S.
The orders that are going to be assembled at the one piece stations are kitted and placed at the
material market. Here there are no temporary buffers with excess material and this process is
working better than the supply for the line, looking from a lean perspective.
Except from the lack of a proper planning on all modules, the material supply for the preassembly
works as expected and does not generate a lot of waste. The preassembly personnel pick most of
the material for the modules by themselves in a nearby production stock and they are helped,
when needed, by the warehousing personnel.
5.6 Visualization and 5S The 5S work and the management that understands that it takes some time to achieve the right
mindset among the personnel is aligned with what is described in section 3.4. HES are currently
working with the first two of five steps in 5S, with some exceptions like the SOPs and the color
coding. Essential items are being tagged and given a dedicated place, but a lot of work still
remains here. The visualization is still poor compared to how the best companies are working

49
with it, and a lot of work remains for having a transparent production for easy detection of
problems.
All unsorted items without a dedicated place contribute to the risk of more downtime. Tools that
are placed in the grey boxes follows the boxes when there is a changeover and thereby risks to be
missing until the same grey box are to be used again. Disorder like this creates a lot of searching
for needed equipment and it is also a matter of ergonomics. Section 3.5.1 says that you should
avoid adverse work postures like the kind of movement that occurs when the personnel have to
turn around and reach for tools in the boxes, tools that are to be used at the line.
The personnel only get oral feedback from the 5S audits, which are done regularly just as the best
companies are doing. Section 3.5 suggest that if the personnel where divided into different groups
with specific areas to be responsible for they could compare themselves and be given simple
rewards to create an incentive to improve. This is not done at HES today
The daily meeting in front of the cell status board is a good way of going through the daily work
and to give everyone an opportunity to discuss problems and solutions. The waste walk is also a
good opportunity to show the employers the work area from another perspective and to make
them identify waste on their own. Unfortunately everything that comes up on these walk are not
corrected today, but HES have come a long way since they moved the production and, as earlier
described, it takes some time to create a new mindset without forcing everyone to change.
SOP for every product is not only to ensure that every product is assembled the right way but also
that the needed information is right in front of the personnel when needed. By having this
standardization HES reduces waste as the products are assembled in the best possible way and the
quality for customers are also secured. This standardization work is aligned with what is
described in the theoretical framework in section 3.6.5.
5.7 Takt HES´s only use of takt is to set the number of units they should produce every day. This means
that they do not have a visual aid to show if they are going to reach the target of the day or not
until the day is finished. Section 3.4.5 state that an efficient value chain uses takt in all processes
and demonstrates benefits with having several targets, for instance number of units to produce per
hour. To be able to set up hourly output targets the process has to be stable and everyone must
know what to do and how to alert others if something is wrong. If a queue is building up in front
of the test station the rest of the stations will soon run out of palettes and will have to wait to the
test problem is solved. The same thing happens if the operators do not follow the product around
the line when they are an uneven number of operators working at the line. This behavior causes a
lot of waste in form of waiting. Since the managers are aware of the time losses that are caused
by this way of working there seems to be some issues on how they are communicating this

50
information to the operators since observation show that they do not follow these guidelines
appropriately.
Observations also show that some stations are faster than others when assembling some of the
products. A system with a defined takt should be balanced to eliminate wastes, but some of the
reasons for interruptions in the takt are when the operator leaves his station to gather material
himself.
5.8 Work organization Compared to Toyota HES have longer cycle times and less repetitive work, which has a positive
effect on the work environment. At both companies the workers have indirect work and other
responsibilities in addition to the direct work and the work tasks are frequently switched. The
switching of work tasks results in employees learning different things and creates a more flexible
organization, as described in section 3.5. The fact that the warehousing personnel now are more
integrated with the assembly personnel has a good impact on the work organization as they feel
more communions with the others. This also makes them work more as a unit, as they are more
responsible for the daily outcome and problem solving together.
In contrast to Toyota HES has no official reward system and sees problem solving and
improvements as a part of the daily work for the employees. Though, the managers continuously
motivate the employees to bring up problems they see and the managers are very responsive to
what the employees say. They also go to the source themselves when problems occur, just as the
lean philosophy emphasizes. Also the respect for the employees and understanding of the
importance of human elements is all aligned with lean principles.
5.8.1 Ergonomics
It is important to think through every aspect of the daily work for the employees and how it will
be affected by a new work procedure. Having a trained safety representative among the staff
reduces the risk of introduction of work patterns that are unhealthy. Supporting tools such as the
lifting tackles show that HES are aware of the risks with having adverse work postures. The
ideas of not counting the material on pallets exact is right from an ergonomic point of view, as is
reduced a lot of heavy lifts. Even if there is more work to do, all this things shows that HES see
ergonomics as a pre-requisite of quality an efficient organization, as described in section 3.5.1.
5.9 Summary of problems/gaps found There are some gaps between how HES currently are working compared to the theoretical
framework described in chapter 3. These gaps often appear as problems and wastes and appendix
2 lists these problems where they arise. The list was regrouped so that the similar symptoms and
causes were grouped together. The result of this was four groups which are the four major gaps
51
between how they currently are working and how they could be working according to lean. Those
are: flexibility, visualization, supplying material and warehousing- and purchasing policies. The
main gaps will be described in this section followed by a list of suggestions of how the gaps
could be reduced. As said the layout has no natural flow according to the value adding activities
but it is too big of an issue to solve in a project like this and will therefore be discarded from
further analysis. Below the main gaps are described.
5.9.1 Flexibility
The amount of customized products increases rapidly, but the production is still producing in
large batches resulting in longer lead time. This is contrary to lean and would not be necessary if
the production was more flexible. This is also contrary to Hills´s theory on how to choose
production process. HES´s sales company needs to have flexibility to win customer orders while
the production line currently is adapted to high volumes. The list below describes some of the
problems belonging to flexibility issues.
Batch planning and not according to the actual demand, increasing lead time
Long changeover times
No possibility to prepare the next order, leading to stress and downtime
How the flexibility gap could be reduced
Reduce the changeover time
o Dedicate an area where the next order is prepared
o Reduce distances where the operator walks to change his trolley
o Make sure that everyone knows what to do when it is time for a changeover
o The warehousing staff needs to know when it is time for a changeover so they can
be available when needed
Reduce other downtime
o Make sure that all the needed material are kitted in the grey boxes
o Set up rules for how to troubleshoot at the test station
5.9.2 Visualization
The whole production needs to be more transparent for making detection of problems and
deviations easier and in that way be able to reduce waste continuously. This includes
visualization of how the production is performing as well as markings of boxes, compartments,
trolleys and the shop floor. The list below presents the problems that occur due to poor
visualization.
52
Very dependent on experienced team leaders
The production personnel cannot interpret the text string saying what is customized
Incomplete product structures that has no way to be corrected makes the reporting in
Jeeves incomplete and leads to inventory differences
Disorder in the material market
Mixing of material for several orders causing confusion and quality problems
There are no grey boxes for some product families
A lot of unnecessary searching and movements due to disorder in the material market
The kitted trolleys for the one piece stations are not separated between product families
No dedicated place to put preassembled modules
No standardized rules of what to do at the test station when having errors, building up
queues
No standardized routine of how to handle customized products
Do follow any rules of how many to be at the line for optimal assembling
Not all tools have their own spot, leading to waste and adverse work postures
How the visualization gap could be reduced
Improve all general markings
Every moveable item needs a dedicated place
Pick the exact number of components for an order
Update the picking lists
Standardizations and guidelines
5.9.3 Supplying material
The material supply process need to be more stable and standardized. The warehousing personnel
need to know when and where the material is needed. The current process has problems with the
below listed.
No article number for certain modules and thereby no planning of them
Lack of times when an order is finished and when changeovers will take place
Old picking lists are used, which are not up to date
Dependent on experienced team leaders to know where to put material
Hard to plan the kitting of components for preassembly
Material supply personnel need to be available for the preassembly personnel a lot
Do not know which station the components and pallets are going to
Do not know which stations is concerned when picking for customized products
The forklift for the outside tent is not always available when the line needs material
Continuous checking material levels at all stations and a lot of unnecessary movement
53
Left over material stays in the grey boxes instead of being returned to the warehouse
Confusions about who is picking some of the material
No dedicated place for the kitted material
Waiting time when running out of material
Downtime when the assembly personnel leave for getting material
How the material supply gap could be reduced
Warehousing staff needs to know when and where to pick and put orders
Reduce their stress level by creating a process where they can be slightly ahead with
prepared orders before it is time for changeover
Pick the exact number of components for an order instead of continuous checking
Let the warehousing personnel own and control the warehouses
5.9.4 Warehousing- and purchasing policies
The warehouses as well as the purchasing policies need to be reviewed. Standardized rules such
as where to put different material, when and how much to buy at a time, the importance of
updating Jeeves when the pallet racks are empty and first in first out rules needs to be applied.
Also things like who has access to the warehouses, when and who to perform stocktaking and
how to avoid inventory differences needs to be reviewed. Below is a list of problems regarding
warehousing and purchasing.
No directions/instructions on where to put material
Same material spread out in several warehouses
The warehouses are not sorted
No FIFO rules
To large quantities of one components delivered in the same batch
Everyone have access to the warehouses
Do not always update when having empty pallet racks in Jeeves
Do not have time for stocktaking
How the warehousing- and purchasing policies gap could be reduced
Sort the warehouse
Look over reorder points
Mark arriving goods with dates so that FIFO can be used
Make sure that the product structures are correct so that Jeeves gets updated and the right
components get withdrawn when picking an order
Set up directions for making sure that stocktaking takes place continuously
54
5.10 Discussion and explanation on where to focus and why Because of the limited time and resources in this project the authors wanted to focus on the most
important problem areas first. The most important areas were identified as where the largest gaps
are today, which prevents HES from having an efficient production flow, and areas which would
reduce most of the important problems if solved. Another criterion was that the focused areas
also should have potential for quick and safe improvements that would have a great impact on the
efficiency as well as the workers attitude to change. Of significant importance was also that the
focused areas were not too large for this limited project and that the focused areas were aligned
with the strategy of the company. Here a holistic view was of great importance. The way HES
supply material was identified as the key area that together with the visualization also would have
a great impact on the flexibility. The focus from here on will be to standardize the material
supply process, improve visualization and make the line more flexible and thereby align the
production´s focus with the sales company according to Hill´s process choice model. The
warehousing- and purchasing policy gap was not included in this project, as this is a very big
project and by the authors seen as a natural step to take after the other improvements.

55
6 A new work pattern In the following part the authors’ suggestion will be explained followed by a description of how
an implementation was made using PDCA.
6.1 General idea The main purpose of this suggestion is to make HES´s production more flexible and make the
different material flows more stable and visual. The idea is to separate the material supply for the
different production flows from each other. The picked material for the line will not be mixed
with the picked material for the preassembly or the one piece stations. To make the assembly line
more flexible, the time for a changeover has to be reduced and this suggestion will allow that by
having the next orders already picked and waiting on an assigned place on the shop floor.
Moveable items will be dedicated a marked area to keep the order and to eliminate waste.
6.2 Layout From the beginning the authors’ suggestion was to move the pallet rack behind the line and keep
two sets of white trolleys prepared with the following orders for the line there, having them close
to the station where they are to be used. This requires a new set of white trolleys and also new
space for the pallets that are removed when the pallet rack by the line is taken down. When this
was presented for the company, they wanted to see that the new concept worked practically
before making any investments. This forced the authors to redesign the layout, adopting it so the
concept could be tested with existing equipment and without any moving of pallet racks.
The old material square will be dedicated for the line and redesigned to make room for
preparation of material for the next orders to the line. There will be seven marked areas dedicated
for pallets that are to be used on the seven lifting tackles on the next order. Each marked area is
given a number which corresponds to the number on the lifting tackle, for making it visual which
pallet goes where. There are also markings for the white trolleys for the next two orders. This
result in two lines with four squares for trolleys with grey boxes and one square for order unique
material at the end of each line. Other line material such as palettes and pipe trolleys are also
given a dedicated area. By giving every moveable object a dedicated place it will create order and
everyone will know where to find everything when it is time for a changeover. By not having
available space for excess material, empty trolleys and pallets they will have to be moved to the
right place instead of building buffers. It will also be easier to get to your trolley when there are
no other trolleys in the way. Keeping all material for the line in the old material square will also
minimize the distance that a trolley has to be moved. Appendix 4 and appendix 5 show detailed
layouts on how the material market used to be and how it will look like when the suggestion is
implemented.

56
Trolleys with material for the one piece stations are removed from the material market and placed
at the end of the shop floor. The areas dedicated for these trolleys will be sorted by product
family in order to make it visual and no need to search for a trolley, the area is highlighted in
appendix 3. Scrap containers are not frequently used close to the assembly line and are therefore
moved to the end of the shop floor as well.
6.3 The material supply process In the suggestion the warehousing personnel owns the warehouse and are the only people allowed
to make withdrawals, except for the material in the production stock at the preassembly. This is
for making them feel more responsible for the warehouse and to keep the order. The
warehousing personnel will start to pick the exact amount of material needed for the orders into
the grey boxes. This is to avoid bringing in excess material, reduce the risk of taking wrong
material and bring faulty product structures to the surface, resulting in less inventory differences
in the long run. Material for the next two orders at the line are prepared and this allows the
warehousing personnel to plan their day as they know that the line have material prepared.
Material shortages are also detected in advance, allowing them to reschedule the order and alert
the purchasers and eventually the customer.
The picking of material is done by moving the trolleys through the warehouse and picking
material directly in the trolley in order to minimize the handling of material. When all material
for station one is picked the trolley is put on its dedicated place and then the warehousing
personnel are moving on to trolley number two etc.
When doing a changeover the line personnel brings in the prepared trolley, for the station they
currently are working on, by themselves. At the same time they leave the empty trolley from the
previous order where they got the new one. This is a visual signal showing that the warehousing
personnel are able to start picking a new order. By having prepared trolleys close to the line, the
internal changeover time would reduce radically. The authors found that reducing the internal
changeover time, according to SMED, is absolutely crucial when adopting the layout to a more
flexible production.
When the warehousing personnel picks the first orders according to the suggestion, new cheat
sheets will be made saying which component going into which station and to which compartment
in the grey box. Here the experienced team leaders have a key role in the beginning and need to
support the warehousing personnel. The information from the cheat sheets will be used to update
Jeeves, enabling the picking list to contain information of which material goes to which station.

57
6.4 Visualization and 5S
The suggestion aims at making the production more transparent and visual. All things such as
containers, pallets and trolleys will have their own location which is clearly marked. The grey
boxes will be sorted by product
family and all compartments
will be labelled with its
intended component to avoid
doubt of what is supposed to be
in it. Faulty components that
were detected at the test station
was given a small area next to
the station so that they would
have to take care of them and
not just build up a pile with
problems, see the blue box in the
red square in figure 11.
Everyone are supposed to see which order is stranding in queue and if the warehousing personnel
have prepared it or not. This is the case both at the line and at the one piece stations.
6.5 Implementation Section 3.5 describes the importance of everyone’s participation in a change to keep them
motivated and willing to change. Therefore the new layout and way to prepare next orders was
presented to the staff two weeks before the actual implementation. This gave them time to
understand the change and also time to come up with new ideas and suggestions on how it could
be improved even more. The authors started with explaining the background, purpose and
objectives with the implementation and kept a copy of those together with the new layout posted
in the production so that the staff could go through it on their own after the presentation.
The team leaders and the team manager were involved in remarking the floor, which resulted in
new ideas how to use the floor space which resulted in moving the garbage, to a place behind the
packaging station, creating more room for the palettes and a trolley in the material market. To
eliminate the risk of interfering the production, marking and other preparations was done a late
afternoon after the shift when the line was not running. Due to lack of information on the picking
lists the team managers with great experience had a key role in helping the warehousing
personnel to create cheat sheets with information on what articles goes in what trolley.
The new set up requires an extra set of trolleys and after having revised the situation three extra
sets of grey boxes. Unfortunately there are no extra set of line trolleys available so another kind
of trolleys that is not adopted for the line had to be used to test the new method. The extra set of
Figure 11: New markings at the test station

58
boxes had to be given a place to be stored when they are not in use so the layout had to be revised
again. When this was done another problem arose when the boxes had to be stacked, the
delimiters in the boxes were too high which resulted in unstable piles. This problem created a
safety risk and was solved by cutting 45mm of the top of each delimiter which resulted in stable
stacks of piled boxes.
When the authors lined up the trolleys in its marked squares and started to pick material we
realized that the trolleys are kind of hard to maneuver. This knowledge made us redesign the
squares and making two one-way lines instead, where the warehousing personnel refill trolleys
from the back and the line personnel pick the trolleys from the front. This improves both the
ergonomics and speed of the process, as the personnel do not have to make sideways maneuvers
in order to put the trolley in its square besides the other trolleys. As a result of this the one-way
lines claimed the order unique materials location as well, so the order unique material was given
a new location behind the line material square. The revised designed is shown in appendix 6.
During the implementation the authors continuously worked with 5S and assigned every
moveable object an own dedicated place and clearly visualized it. Initially different colors were
supposed to be used to connect the trolleys with its working station in a visual way. But when the
suggestion was presented for the team manager it became clear that this was against their 5S
color schemes, and a decision to go with numbers instead was made. All grey boxes were labeled
with its product family and all compartments were labeled with article number. For avoiding
confusion and mistakes all modules were photographed and the pictures were set in the assigned
compartment.
Figure 12: A fully marked pair of grey boxes

59
A benefit with counting material in exact number for the order is the visual aspect of it, everyone
can see what material to use and how many there are left on the order or if the number on the
picking list needs to be corrected. During the implementation it also became more visual which
equipment that did not have its own place. Another thing now brought to the surface were all
kinds of material which maybe would be better to have located at the line, due to the time it takes
to count small components that are needed for several products, for example screws and mutters.
Components that are kept in front of the line all the time needs to have an indicator that shows
when it needs to be refilled. This can be done with some sort of kanban system described in
section 3.6.3.
In the authors suggestions the ergonomic aspects were considered and therefore no exact
counting of the heavy and bulky components were suggested. Because without having the right
supporting tools that would lead to a lot of heavy lifts and adverse work postures for the
warehousing personnel.
6.6 Results of the new work pattern With the new work pattern the material supply has been standardized and everyone knows when
and where the material is going. Feedback from the warehousing personnel showed on a less
stressful work environment after the implementation and an increased possibility to plan their
day.
The downtime in the line when having a changeover has significantly been decreased. Now the
line never has to be stopped in the middle of an order due to material shortage and the time for a
changeover is reduced from the varying 15 to 60 minutes down to 4 minutes. Four minutes is the
time it takes for the first station to change the pipe trolley and palettes for the new order. The
following stations only have one trolley to change and it takes about three minutes. The extra
time it takes to count the components is not longer than the time they used to spend on
continuously checking of the material levels.
The new and faster procedure to perform changeovers gives the planner an opportunity to plan
the production after the actual demand, instead of planning to minimize the number of
changeovers, without missing out on a lot of valuable production time. The ability to have more
changeovers every week creates a whole new flexibility which according to Hill is needed from
the production to meet the sales company´s continuously increased product range. It is now
possible to discard the production schedule with a more critical order if needed. You can simple
prepare the critical order on one of the set of white trolleys and put it in front of the order in
queue to the line.
All the markings and dedicated places have made the shop floor more visual and observation
show that the new areas are used for the right things. It also shows which things that do not have
a dedicated place and might need one. For example after the implementation it become clear that

60
the preassembled modules needs a clearly marked place to be stored while waiting for final
assembly, in order to reduce the risk of taking wrong modules and avoid disorder on the shop
floor. This kind of visualization of problems is necessary for making continuous improvements
possible, according to Liker.
Figure 13: The new material market
The possibility to detect errors and deviations has also increased with the new work pattern.
When having material kitted in exact amount for the orders at the line the personnel can easily
discover if something is wrong with the product structure. Bringing this to the surface will reduce
the risk of having the same problem generating waste over and over again. The risk of assembling
wrong material is also severely reduced by having the compartments in the grey boxes clearly
marked. It is easy to see if a component is placed in the wrong compartment and the warehousing
personnel can use the markings as a work instruction when kitting.
After the implementation it became more visual how the production is performing according to
the production plan. It is now possible to see how many units there are left on the current order
by looking into any of the grey boxes and count how many components there are left to
assembly. By looking at the material square anyone can see if the next one or two orders are
prepared for assembly, and if one set of trolleys is empty it is a visual signal for the warehousing
personnel that another order can be prepared.

61
Appendix 7 shows that the new work pattern at HES will save 150 000-300 000SEK annually
just for the time saved for the line operators, depending on the number of changeovers per week,
due to the reduced changeover time and the fact that all the needed material are in place at the
line after a changeover.
6.6.1 Further implementations
When every moveable thing was given an own dedicated place it became clear that the modules
had no place to be stored. Due to the incomplete planning of module that has not got an article
number in the system, the modules are sometimes made some days in advance. This results in
modules lying around in the production on trolleys and pallets without markings for days.
Another thing that came up was the fact that it is almost impossible to sort out the different
modules. The personnel that pick the orders have no way to know where to find the right module
for the order without asking the experienced team leader. These problems would not exist if all
modules were given a dedicated place, which is clearly marked.
So the next step in the PDCA was to correct these problems and make it more visual for
everyone. The suggestion for solving this resulted in a production warehouse for frequently used
modules. All modules, both those registered in the system and those not, were analyzed by the
authors. The frequency and inventory level were studied in order to find out which modules
needed a dedicated place in the module warehouse. Here the general idea was to place the most
frequently used models at the best picking height, i.e. first and second level, and modules less
frequently used on the third and fourth level in the pallet rack. They were sorted by product
family and clearly marked with article number, when needed a new temporary name, and pictures
of the modules. The reason for putting up pictures was to make it easier for everyone to know
where to put and where find the modules, especially the modules without an article number.
The production warehouse with modules is meant to work as a balance stock, where there always
are suppose to be units between a minimum and a maximum number. These levels have to be set
by the managers after they have decided which product needs to have the shortage lead time.
When the levels are set they can use indicators on the pallets, for instance three magnets in
different colors that indicates the current stock level and if they need to assembly more modules.
This module warehouse is considered to be quite temporary but very necessary until the planning
process is stable and when every module is registered in the system. The warehouse can then
gradually be phased out or have lowered maximum levels when the production is ready for
making the preassembly just in time. Having finished modules in stock will also ease the
planning of staff allocation in the production and not have to risk letting personnel leave the line
to help at the preassembly to keep up with the pace. Having modules in stock means that it will
shorten the lead time of an order and that could mean that they can reduce the finished goods
stock and still have a high service level.

62
Figure 14: The new module stock
6.6.2 Feedback from the employees
During and after the implementation the authors observed and talked to the warehouse and
assembly personnel to see the effect of the change. Understanding that an anonymous survey was
the only way to know that the employees would answer our questions honestly, a survey was
handed out to the employees a month after the implementation so their feedback could be
compiled after having worked accordingly to the new work pattern some time.
The answers from the 14 respondents of the survey are presented in appendix 8. Overall the
respondents where happy with the change and the answers are aligned with the results described
in section 6.6. For instance 13/14 thinks that there is better order in the material market and that
the changeover runs smoother. The survey also shows how the employees’ mindsets, and how
they experience their work environment, have changed. For instance 4/14 says that they are more
optimistic to change and 3/14 feels less stressed out at work.

63
7 Conclusions In this chapter we summarize the outcome of the project and present the conclusions. Important
things for HES to do next and to make the improvements last are also presented here.
When comparing the current state at HES with lean philosophies the largest gaps where identified
as lack of flexibility and visualization in the production, an unstable material supply process and
warehousing- and purchasing policies that needs to be reviewed. All these gaps, except the latter
one, were reduced within this project and the results are by the authors considered valuable for
Alfa Laval.
After this project the HES production is more adapted to meet the needs of the sales company, as
they now are able to plan the production more flexible. Now when the time for a changeover is
reduced to four minutes it not necessary to produce in long batches any more. Instead HES
should plan the production more according to the customers, as this will reduce the tied up capital
and result in shorter lead times. Due to the reduced changeover time and the fact that all the
needed material are in place at the line after a changeover HES will also save 150 000-300 000
SEK annually just for the saved time for the eight operators at the line, depending on the number
of changeovers per week.
As the production and material supply have become more visual and transparent it is now easier
for everyone to see how the production is managing compared to the production plan. It is also
easier to detect problems, like deficient product structures or if wrong components are picked.
The amount of unnecessary searching and movements has also decreased as moveable things are
given dedicated places and due to line material now are kitted in the right amount, which removes
the need of continuously checking and refilling material. Now it is also more visual which tools
and frequently used material that do not have a dedicated spot, as they now comes to the surface
when the grey boxes are supposed to be empty when the order is finished.
To make sure that these improvements are maintained it is crucial that the management gives the
right support to the employees and that the trolleys used in the implementations are reviewed for
making the material supply process smoother. It is also important to continue with all 5S work in
order to visualize waste and new improvement opportunities. A standardization of the text string
on the production schedule would, in combination with education of the personnel, reduce a lot of
troubles concerning customized products. The only way to change the attitude towards these
products is to make everyone understand what differs from the standard product.
Observations show that HES needs to balance the assembly line even more for some products.
The communication of what is supposed to happen when the employees are at uneven numbers
on the assembly line also needs to be improved. The employees need to follow the palette at
uneven numbers in order to reduce the balance losses. It is also crucial that the test station is
64
standardized with specific guidelines for how long to troubleshoot and what to do when the
troubleshooting takes too long time. It is a prerequisite to utilize the other test stations in a
separate flow to be able to introduce and keep a certain takt in the assembly line.
The established balance stock for preassembled modules should gradually be phased out, when
all modules are registered and a proper planning process is in place. Today though, it is beneficial
to use the stock as some modules are registered and not planned and there is no way to keep track
of them. Another important thing is to introduce first-in-first-out rules in the warehouses to avoid
picking same material from several different places, mixing of batches and to keep the order. To
keep the order the warehousing personnel also need to update Jeeves when a place in the pallet
rack is empty.

65
8 Reflections In this chapter the author’s make recommendations for further studies and what HES should
focus on after this project is finished. This chapter also includes the author’s personal reflections
about the project and the methodology used.
8.1 Further studies
There is more problem areas needed to be solved than was included in this project. The next step,
according to the authors, should be to review the warehouses as well as the purchasing policies.
Standardized rules needs to be applied, such as where to put different material, when and how
much to buy at a time and when to perform stocktaking. The warehouses also needs to be sorted,
like frequently used material in a good picking height etc., for avoiding waste while gathering
material. When the warehouse and purchasing policies are reviewed it is probably possible to
reduce the inventory levels gradually and start using Just-In-Time to some extent. This has not
been analyzed by the authors.
Introducing takt in the production would visualize which parts of the value chain that has
problems keeping the pace and visualize where new improvements are necessary. Meanwhile takt
is introduced the daily production target might be beneficial to break down more than today and
visualize it for everyone. By doing this the production gets more predictable and the employees
knows better at which takt they are supposed to assembly and where they are according to the
production plan.
In the future it might be suitable to review the layout of HES. As earlier said/written in the report
the production flow does not follow a natural route according to how the products are processed,
and this generates a lot of waste.
Further studies could also investigate how the communication between the production and the
sales company could be increased in the future. Here is probably a lot of work to do to get them
fully synchronized striving towards the same goal.
8.2 Author’s reflections about the project and the methodology used
Through the project the time schedule made in the project specification was followed and the
chosen methodology proved to be successful. As the management at HES is well informed about
lean principles it was always possible to get an agreement with them what was needed to be done.
The mainly qualitative approach was enough and the authors did not have to come up with a lot
of quantitative data for that reason. The fact that the supervisor is unit manager for HES made the
ways of decision very short, which speeded up the work.

66
Initially it was sometimes difficult to know where to focus as during the pre-study everyone
interviewed had a lot of ideas which parts were the most important ones to improve. The authors
also found a lot of problem areas that needed to be looked at. The main reason for this, according
to the authors, is that the motivation of the employees for making improvements has been low
since the moving of the factory and personnel reductions. Thereby we found problems that would
have been quite easy for the personnel to solve if they just had the right mindset and willingness
to do it. The triangulation was of good help for keeping the holistic view and not to be stuck in
complex problems with small potential. The authors also worked with staying objective, when
decisions were to be made.
The authors consider the project reliable, as they always went back to the source of information
to make sure that they got the information right and by the fact that data was measured several
times. The validity was secured by using triangulation during interviews and well defined
processes when performing quantitative measures, and also by using many different written
sources about the subject.
The authors applied a leadership approach were the personnel were invited at an early stage in the
changes, letting them participate and be a key part of the improvements with their experience.
Afterwards the authors think this is the best way to create lasting improvements and to set the
right mindset among the personnel. This was also confirmed by the survey made among the
production personnel afterwards. Now almost a third of the personnel feel more optimistic to
change than they did before this project. It is also satisfying that not only the efficiency for HES
was improved, but also questions regarding the work environment and daily stress was answered
positively.
The project gave very valuable experience for the authors and their future careers, and they
realized that something that makes sense in the theory is not always that easy to implement. Also
the experience of having several aspects to think about when making changes such as
economical, leadership, human elements and ergonomic aspects was a good experience.

67
9 References .
Written sources
Agervald Olof, 1981: Exempel på monteringssystem för mindre montage, Institutionen för Läran
om vertygsmaskiner, KTH
Axelsson, RC Jan, 2000: Quality and Ergonomics: Towards successful integration, Linköping
Studies in Science and Technoogy Dissertation No. 616
Axsäter, S., 1998/99: Kurslitteratur kompendium Material- och Produktionsstyrning, Lunds
Tekniska Högskola, Lund
Bellgran, Monica, 1998: Systematic design of assembly systems, Department of Mechanical
Engineering Linköping University, Linköping
Bellgran, Monica & Säfsten, Kristina, 2005: Produktionsutveckling: utveckling och drift av
produktionssystem, Upplaga 1:2, Studentlitteratur AB, Pozkal, Poland
Bergman, Bo & Klefsjö, Bengt, 2008: Kvalitet: från behov till användning, Upplaga 4:2,
Studentlitteratur, Göteborg
Björklund, Maria & Paulsson, Ulf, 2003: Seminarieboken – att skriva, presentera och opponera,
Studentlitteratur, Lund
Brynzér, Henrik, Johansson, Mats I. & Medbo, Lars, 1994: A Methodology for Evaluation of
Order Picking Systems as a Base for System Designand managerial Decisions, International
journal of operations & Production Management, Vol 14, No. 3
Börnfelt P-O, 2009: Arbetsorganisation i praktiken: En kritisk introduktion till
arbetsorganisationsteori, första upplagan, SNS, Göteborg
Chen, Lixia & Meng, Bo, 2010: The application of value stream mapping bases lean production
system, International Journal of Business and Management, Vol. 5, No. 6; June
Deming, W.Edwards, 1986: Out of the crisis, The MIT Press, Massachusetts Institute of
Technology
DePoy, Elizabeth & Gitlin, Laura N, 1999: Forskning: en introduktion, Studentlitteratur, Lund
Engström Tomas, Jonsson Dan & Medbo Lars, 2005, Alternativ montering: principer och
erfarenheter från fordonsindustrin, Metall
Eriksson, Lars Torsten, Wiedersheim-Paul, Finn, 2001: Att forska utreda och rapportera,
Lagerblads tryckeri AB, Karlshamn
68
Hackman, J., Richard & Oldham, Greg R., 1980: Work Redesign, Addison- Wesley Publishing
Company Inc, Massachusetts
Hillis David, 2006: Improving the flow, IET Manufacturing Engineer, April/May
Holme, Idar Magne & Solvang, Bernt K, 1997: Forskningsmetodik: om kvalitativa och
kvantitativa metoder, andra upplagan, Studentlitteratur, Lund
Howell, Vincent, 2009: 5S For Success, Ceramic Industri, Aug vol.159 Issue 7
Keyte, Beau, & Locher, Drew, 2008: Lean Handboken: Värdeflödeskartläggning inom
administration, service och tjänster, Upplaga 1:1, Liber, Malmö
Kurslitteratur kompendium, 2000, Produktionslogistik, Transportteknik, Chalmers Tekniska
Högskola
Lambert, Douglas, M., 2008: An Executive Summary of supply chain management: Processes,
Partnerships, Performance, Supply Chain Management Institute, Sarasota
Liker, Jeffrey K., 2009: The Toyota Way: Lean för världsklass, Liber AB, Malmö
Lester Sr., James D., Lester Jr., James D, 2005: Writing research papers: A complete guide,
Eleventh edition, Pearson Education Inc.
Medbo, Lars, 2003: Assembly work executions and material kit functionality in parallel assembly
systems, International Journal of Industrial Ergonomics 31
Neumann, Patric W., 2004: Production Ergonomics: Identifying and Managing Risk in the
Design of High Performance Work Systems, Department of Design Sciences, Lund University
Nilsson, Tommy, 1999: Ständig förbättring: om utveckling av arbete och kvalitet, Arbetsinstitutet
& författarna, Solna
Pascal, Dennis, 2002: Lean Production Simplified: A Plain-language Guide to the World’s Most
Powerful Production System, Productivity Press
Petersson, P., Johansson, O., Broman, M., Blücher, D., Alsterman, H., 2008: Lean: Gör
avvikelser till framgång!, Part Media, Bromma
Skiöld, Martin, 2007: Synergirealisering: realisering av produktsynergier efter
företagssammanslagningar, Handelshögskolan i Stockholm, Stockholm
Ståhl, J-E., 2009: Industriella Tillverkningssystem del II – Länken mellan teknik och ekonomi,
Lunds Universitet, Lund
Sörqvist, Lars, 2004: Ständiga förbättringar, Studentlitteratur, Lund

69
Vollmann, T.E., Berry, W.L., Whybark, D.C. & Jacobs, F.R., 2005: Manufacturing Planning and
Control for Supply Chain Management, McGraw Hill, Singapore
Wallén, Göran, 1996: Vetenskapsteori och forskningsmetodik, Studentlitteratur, Lund
Womack James P., Jones Daniel T. & Roos Daniel, 1991: The machine that changed the world:
The story of Lean production, Harper Perennial
Wänström Carl & Medbo Lars, 2009: The impact of material feeding design on assembly process
performance, Journal of Manufacturing Technology Management, Vol. 20 No. 1
Electronic sources Alfa Laval internal documentation
http://www.alfalaval.com (2010-12-16)
http://www.alfalaval.se (2010-12-16)
http://ccnmtl.columbia.edu/projects/qmss/measurement/validity_and_reliability.html (2010-12-
16)


- 1 -
Appendix 1: HES Layout
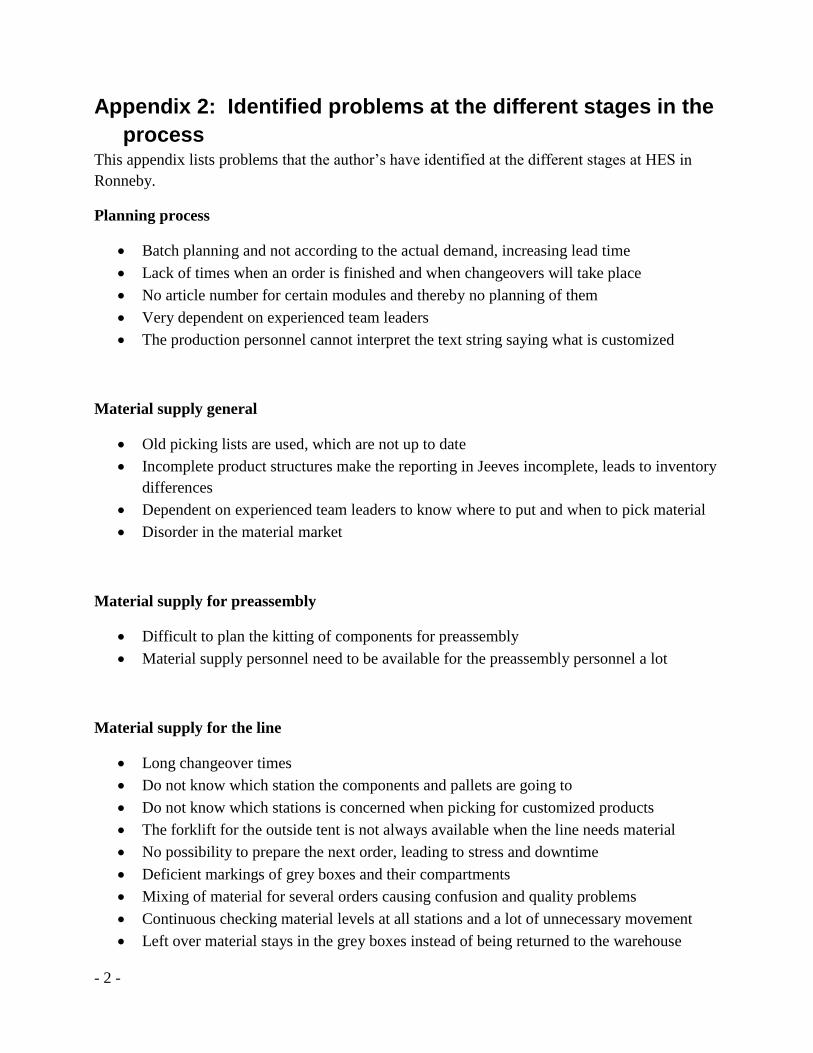
- 2 -
Appendix 2: Identified problems at the different stages in the
process This appendix lists problems that the author’s have identified at the different stages at HES in
Ronneby.
Planning process
Batch planning and not according to the actual demand, increasing lead time
Lack of times when an order is finished and when changeovers will take place
No article number for certain modules and thereby no planning of them
Very dependent on experienced team leaders
The production personnel cannot interpret the text string saying what is customized
Material supply general
Old picking lists are used, which are not up to date
Incomplete product structures make the reporting in Jeeves incomplete, leads to inventory
differences
Dependent on experienced team leaders to know where to put and when to pick material
Disorder in the material market
Material supply for preassembly
Difficult to plan the kitting of components for preassembly
Material supply personnel need to be available for the preassembly personnel a lot
Material supply for the line
Long changeover times
Do not know which station the components and pallets are going to
Do not know which stations is concerned when picking for customized products
The forklift for the outside tent is not always available when the line needs material
No possibility to prepare the next order, leading to stress and downtime
Deficient markings of grey boxes and their compartments
Mixing of material for several orders causing confusion and quality problems
Continuous checking material levels at all stations and a lot of unnecessary movement
Left over material stays in the grey boxes instead of being returned to the warehouse

- 3 -
There are no marked grey boxes for some product families
Long way to transport the trolleys when having a changeover
Confusions about who is picking some of the material
Material supply for one piece station
A lot of unnecessary searching and movements due to disorder in the material market
No dedicated place for the kitted material
The kitted trolleys for one piece stations are not separated between product families
Preassembly
No dedicated place to put preassembled modules
Waiting time when running out of material
Assembly line
No standardized rules of what to do at the test station when having errors, building up
queues
No standardized routine of how to handle customized products
Downtime when the assembly personnel leave for getting material
Do follow any rules of how many to be at the line for optimal assembling
Not all tools have their own spot, leading to waste and adverse work postures
Warehousing
No directions on where to put arriving material
Same material spread out in several warehouses
The warehouses are not sorted
No FIFO rules
To large quantities of one components delivered in the same batch
Everyone have access to the warehouses
Do not always update when having empty pallet racks in Jeeves
Do not have time for stocktaking
Inventory differences

- 4 -
Appendix 3: New separated areas for trolleys to the one piece
flow This appendix shows how the area next to the preassembly now is used for trolleys for the one
piece flow.
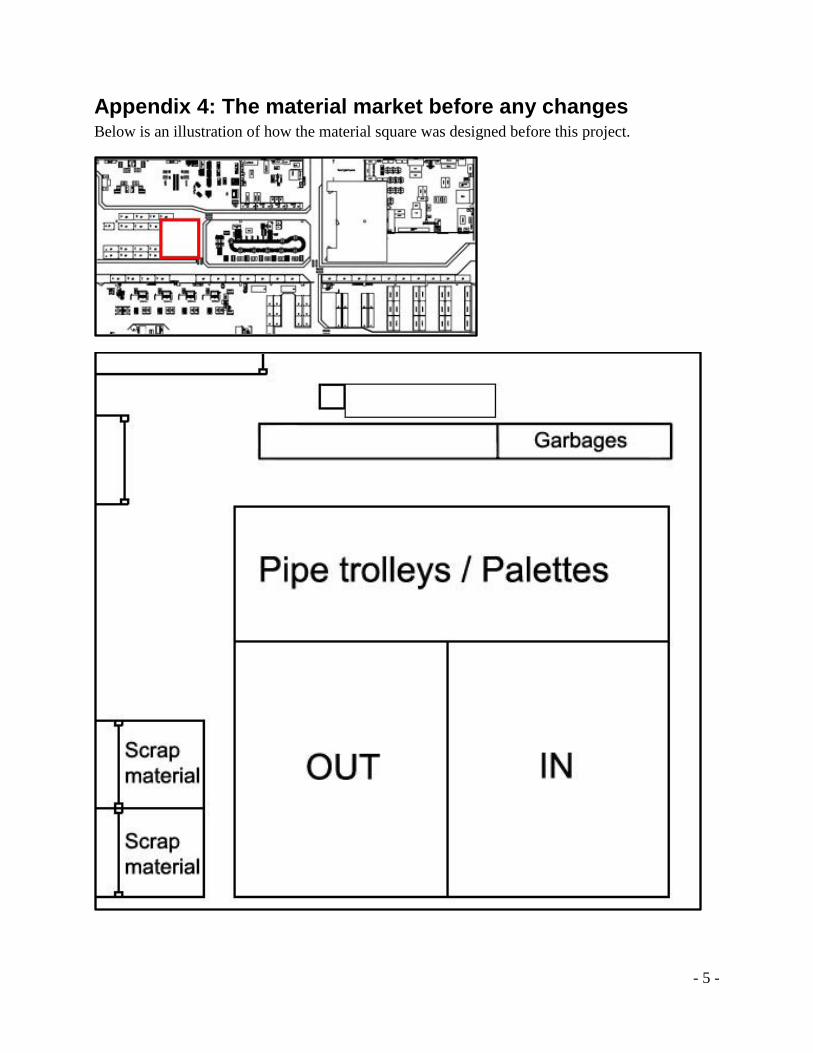
- 5 -
Appendix 4: The material market before any changes Below is an illustration of how the material square was designed before this project.

- 6 -
Appendix 5: The first suggested layout The illustration below is the author´s first suggested layout of the material square.
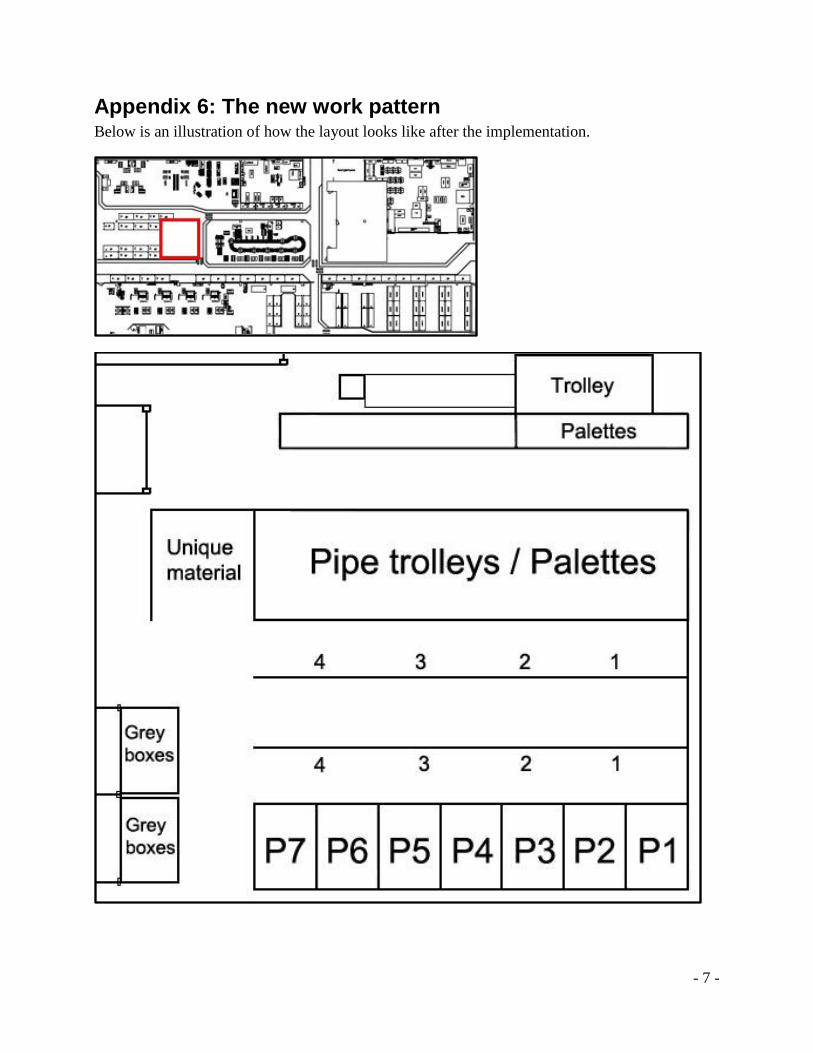
- 7 -
Appendix 6: The new work pattern Below is an illustration of how the layout looks like after the implementation.

- 8 -
Appendix 7: The savings with the new work pattern This appendix illustrates the resulted savings of the changes made in this project.
Estimates used in the calculations:
The line is manned with 8 persons 6 hours a day, 5 days a week, for 50 weeks each year
The cost for an employee is 250SEK per hour
Every station had to gather or wait for components 2 min per hour, which is no longer
needed when all the material are in place after a changeover
The time for a changeover is reduced with 30minutes
Those estimates results in the following savings at the production line:
Annually savings if they have 1 changeover every week = 600h =150 000SEK
Annually savings if they have 2 changeovers every week = 800h = 200 000SEK
Annually savings if they have 3 changeovers every week = 1000h = 250 000SEK
Annually savings if they have 4 changeovers every week = 1200h = 300 000SEK
These numbers just considers the time that are saved for the operators in the line, they do not
consider the time that are saved for the warehousing staff and the operators at the one piece
stations, since they no longer have the same need for searching and continuously check the status
at the line.

- 9 -
Appendix 8: Survey about changes at HES This is a compilation of the result from a survey that was performed, by the personnel working in the production and in the warehouse, a month after the implementation of the new work pattern. The survey was answered by 14 blue collars/workers.
How do you experience the order in the area where in- and outgoing material used to be? Compare with how it was before the changes
Worse
Unchanged 1/14
Improved 13/14
Is it easy to find needed trolleys? Compare with how it was before the changes
More difficult
Unchanged 2/14
Easier 12/14
How do you experience the changeovers now? The change of white trolleys
It is more complicated
Unchanged 1/14
It is smoother 13/14
What do you think of general markings? Markings of floor, boxes and trolleys
Messy
Inadequate 3/14
Clear 11/14

- 10 -
Does everyone comply with the markings?
Is it used as it is attend to be used? Compare with how it was before the change
Worse than before
Unchanged 1/14
Better than before 13/14
What do you think about the new warehouse for modules? Your general impression of a dedicated place where there are a number of units between a minimum and a maximum level of the most common modules You can check several statements:
Excess inventory, worked well without it
Good to always know where to put assembled modules 9/14
Nice to know that there always are modules in stock when needed 11/14
Avoids last-minute assembly 5/14
More flexible planning of modules 7/14
What do you think of the markings with pictures on pallets and in the grey boxes?
Unnecessary, article number is enough
Great, it helps 14/14
How many disruptions at the line do you experience? The station is waiting due to material shortage, compare to how it was before.
More disruptions
Unchanged 1/14
Less disruptions 13/14

- 11 -
What do you think of your work environment?
Compared to how it used to be
Worse
Unchanged 12/14
Improved 2/14
How often do you feel stressed out? Compared to how it used to be
More often
Unchanged 11/14
Less often 3/14
Have the number of unnecessary movements and transportation of material changed? For instance the distance you go to search for something and the distance you go when changing trolleys
The distances have increased 1/14
Unchanged 5/14
The distances are reduced 8/14
Do problems like faulty product structures get more attention? Compare to how it used to be
Problems was more obvious before 2/14
Unchanged 10/14
It is easier to detect problems now 2/14

- 12 -
How has your attitude to change of work procedures been affected? If you have been influenced by this change where you have been able to affect the changes and see the results.
More opposed to change
Unchanged 10/14
More optimistically to change 4/14
Do you think that we have utilized the experience from the personnel in a good way?
Not at all
Partially 7/14
Yes 7/14 What is the best thing with having the next orders prepared in the area where the in- and outgoing material used to be?
Answers:
Reduced wainting time
Smoother changeovers
Easier to know what to do
Less searching
more rapid changeovers
All material is secured to every order before we begin to assembly it
Do not have to leave due to material shortage
Easier to see when it is time for a changeover
What could we have done different? How could we have utilized the area more efficiently and what could we have done to make the implementation smoother?
Answers:
Increased the available area for HES
A pallet rack for the pallets so that we can prepare pallets for two orders instead of one
Also looked at improving the sorting of the warehouse instead of just making improvements for the line

- 13 -
What is the next thing that needs to be changed at HES? Since the production was moved there have been a lot of changes but there are still areas that need to be improved. Which is the most important area to improve now?
Answers:
Sort the warehouse
The faulty product structures
Adapt trolleys so they are easier to move (new wheels) and add a feature so they can be transported with a fork lift
Identify what tools we need at every station and where they should be placed
Utilize color coding