making money out of football - imperial college london
TRANSCRIPT

Making money out of football
Stefan Szymanski1Stephen Hall
The Business School, Imperial College London
April 2003
Abstract: In the US most economists have argued that professional sports teams are profit maximising businesses, but it is a widely held view in Europe that professional football clubs are not run on a profit maximising basis. This belief has important implications for the impact of policy measures such as income redistribution that are widely advocated. This paper looks at the performance of sixteen English football clubs that acquired a stock exchange listing in the mid 1990s. If the European story is true, we should have observed a shift toward profit maximising behaviour at these clubs. This paper finds no evidence of any shift in this direction. This result is consistent with the view that football clubs in England have been much more oriented toward profit objectives than is normally allowed.
Keywords: economics of sport, objective functionsJEL classification number: L21, L83
We thank to Dirk Nitzsche for assistance with data collection. We thank Peter Sloane and seminar participants at the CARR Outreach workshop on business history for helpful comments.
1 Corresponding author: The Business School, Imperial College London, 53 Prince’s Gate, Exhibition Road, SW7 2PG, UK. Tel : (44) 20 7594 9107, Fax: (44) 20 7823 7685, e-mail: [email protected]

“Those clubs which have floated to become public companies – Manchester United,
Newcastle United, Aston Villa, Chelsea, Tottenham- now have as their principal
objective the making of money for their shareholders.”
-David Conn, The Football Business, p154.
1. Introduction
In North America it is commonplace, especially among economists, to think of the
owners of professional sports teams as profit maximisers (see e.g. Fort and Quirk
(1995)). In Europe, however, this assumption has been treated somewhat sceptically.
In an influential paper Sloane (1971) argued that a plausible characterisation of the
owners of football clubs is as “utility maximisers” subject to a budget constraint,
where utility is largely associated with success on the pitch. Reasons for this view
include the perceived lack of profitability of football clubs and the opinions expressed
by club officials. In some countries football clubs are organised as sporting
associations which have no shareholders, but in England all professional clubs are
limited companies, and most have been so for around 100 years.
This study focuses on sixteen English football clubs came to be traded on the London
Stock Exchange in the mid 1990s. For the most part this arose through share placings
and offers for sale of up to 100% of the share capital. If the directors of these clubs
were acting as utility maximisers prior to their flotation, then flotation should have
brought about a significant change in the objectives, assuming that investors in
publicly quoted corporations are interested primarily in financial returns. At the time
of flotation many fans expressed concerns similar to those implicit in the quote above.
This paper examines the performance of these sixteen clubs before and after their
flotation. The changes in measured performance of these clubs do not seem to be
consistent with a shift toward more profit oriented objectives.
1
2. The Impact of Flotation
(a) The significance of objectives for league policy
It has long been recognised that the identification of the firm’s objective function is
central to understanding its behaviour, and this is more than usually crucial when it
comes to understanding sports leagues. Members of sports leagues typically enter
into a wide range restrictive agreements such as revenue sharing, limitations on
players spending (salary caps and roster limits) and restrictions on player mobility.
These restraints, the team owners claim, are necessary to preserve a competitive
balance without which the league’s product will become unattractive. Antitrust
authorities have in general been persuaded by this line of argument. However, critics
such as Fort and Quirk (1995) and Vrooman (2000) have argued that these restraints
will be tend to raise profits, that this is the true motive for their adoption by owners,
and that the impact on competitive balance will be negligible or non-existent. The
assumption of profit maximisation is critical to the validity of these claims, as has
been shown in work of Kesenne (1996, 2000).
Consider for example, the case of collectively sold broadcast rights. In the North
American major leagues the income derived from collective sale is typically divided
equally among the teams. What effect would this have on behaviour compared to the
alternative where teams negotiate their own broadcast rights individually and retain
the income for themselves? Let us suppose that if rights are sold individually then
there are some large market teams that will generate a lot more income than small
market teams. If owners are profit maximisers there is reason to doubt whether
collective selling will improve the competitive balance of the league, since owners are
under no obligation to spend what they receive. Thus a small market team may
receive more income under collective selling, but will not choose to spend more on
creating a successful team. Under the profit maximisation hypothesis owners should
spend up to the point where the marginal revenue of a win equals the marginal cost,
and a fixed share of broadcast income will affect neither marginal revenue nor
marginal cost2. However, if the owners are utility maximisers whose principal interest 2 Indeed, collective selling will impair competitive balance if it leads to a disproportionate fall in the marginal revenue from winning for the small market team, see Szymanski and Kesenne (2003) for an example of this possibility.
2

is success on the pitch then collective selling will improve competitive balance. By
assumption teams spend what they get on the pursuit of sporting success, and
collective selling means more spending power for the small market teams and less
spending for the large markets teams.
(b) ownership and motives in English soccer
In this paper we are interested in the possible change in behaviour associated with
stock market flotation. The ownership structure of football clubs in the UK is
significantly different from the model adopted in other countries. In most of Europe,
football clubs have typically been organised as not-for-profit sporting associations.
Even very large clubs, such as Barcelona and Bayern Munich, have been run as clubs
in a legal sense, i.e. controlled by members who pay an annual subscription and
managed (in a commercial sense) by a club committee. One of the most practical
consequences of this arrangement has been that football clubs have not been able to
take advantage of limited liability and therefore their ability to borrow has been
constrained3. Football clubs in England and Scotland sought to evade this restriction
as early as the nineteenth century. No fewer than 68 of the 92 teams in the four
English professional divisions (Premier League and Football League) adopted limited
company status prior to the First World War, the majority during the 1890s4.
The conventional view is that the ownership of a limited company resides with the
shareholders and that the shareholders are motivated by profit. However, there are
plausible reasons to doubt this in the case of English football clubs. Firstly, analysis of
shareholder lists (see references cited in footnote 4) suggest that the original
subscribers were largely drawn form a club’s locality and were frequently supporters
of the club and hence the profit motive may have been tempered by an interest in
sporting success. Even shareholders with purely commercial interests (such as local
brewers) may have been more interested in the success of the club from the
3 The finances of football clubs can be hard to understand. In many cases wealthy patrons stand ready to guarantee debts, or local government is involved, directly or indirectly in financial support of the teams. 4 All of the teams in the Premier League in the current season (2002/03) were limited companies by 1920. For more details on the early history of English football clubs see Mason (1980), Vamplew (1988) and Tischler (1981) and Inglis (1988).
3

perspective of generating income for their core business interests rather than for any
direct financial return (Morrow (1999) provides a detailed analysis of the motivation
of directors with dominant shareholdings). Secondly over time most of these clubs
came to be concentrated in the hands of a small number of wealthy individuals-
usually because the limited company had fallen into financial difficulties. Often these
individuals were supporters themselves, and therefore unlikely to view their
ownership of the club as a purely financial proposition5.
This does not exclude the possibility that some owners of football clubs at some times
were motivated by profit. But arguably what distinguishes a private limited company
from a public limited company (floated on the stock exchange) is that in the latter case
the profit motive is likely to be even stronger. It is not that the listing requirements of
the stock exchange oblige companies to maximise profits, but rather that a stock
exchange listing typically introduces a class of investors with little or no interest in
the business other than the returns that it can generate, either through the payment of
dividends or the appreciation of the share price. Insurance companies and pension
funds own the largest share of stock in most listed companies.
The listing requirements of the stock exchange are intended to provide such investors
with all the information they require to make an informed decision about investment
prospects. The directors of the company are thus obliged to achieve this return for
their stock holders or see the company shares decline and risk a hostile takeover that
may lose them their job. The view that stock market flotation will introduce
commercial objectives has been advanced in the North American context. Most of the
Major leagues in fact ban stock market flotation on the grounds that this will lead to
excessive commercialisation6. Thus while we cannot state with certainty that the
directors of any single company will be more profit oriented following a stock market
flotation, we can reasonably argue that on average directors of companies with a
listing will be more profit oriented than directors of companies that do not have a
listing.
5 A third reason is that the FA disapproved of the profit motive in football and took action to try and limit commercialism by means such as imposing a limit on the maximum dividend payable by football clubs. But by the 1980s restraints such as these had lost their significance (there are other ways for clubs to reward shareholders) and the will of the FA to restrain commercialism had largely evaporated.6 Although this is perhaps odd given the prevailing view that team owners in North America are dyed-in-the-wool profit maximisers. See Cheffins (1998) for a critical discussion of this issue.
4

(c) the predicted impact of a change of objectives
If companies that float stock on the market adopt more profit oriented policies, what
does this mean in terms of the measurable performance of the company? First
consider the impact of success on the profitability of a given club. Success, we might
reasonably suppose, is achieved by investing in the team. This may mean investing in
training facilities or a good manager, but more often than not it means hiring the best
players, and the best players command the highest salaries. The better the quality of
the players on the pitch the more likely is success. Szymanski and Kuypers (1999)
explored at great length the data that demonstrates the extent of these relationships.
If a club spends little or nothing on its players, success will be limited, but profits will
also be small, since few people are interested in paying to watch an unsuccessful
football team. If player spending increases, however, fans will be attracted and profits
will typically rise. This will continue up to some level of success, at which point more
player spending will increase success but profits will fall. This is illustrated in figure
1.
Figure 1 here
The most likely reason for this is that once a certain threshold has been reached
increasing success becomes more and more expensive, while the revenues generated
by that extra success get smaller and smaller. For example, a moderate level of
spending in the First Division offers the prospect of promotion to the Premier League
once in while, but increasing that probability to a level of near certainty costs a lot
more, and, once having been promoted, eliminating the probability of relegation is
even more expensive. For clubs without a substantial revenue base to begin with,
aspiring to that level of certainty is beyond their financial capabilities7.
The directors of a football club are able, up to a point, able to select a financial policy
for the club based on the relationship between success and profits. Figure 2 illustrates 7 Another reason why profits may decline as success increases is that fans may become disinterested in the competition because it is too predictable- this is the uncertainty of outcome hypothesis (see Szymanski (2003)) for a review of evidence on this hypothesis.
5

two different approaches. The horizontal lines represents managerial indifference
curves for a profit maximising owner. These are horizontal because the profit
maximiser cares only about profit and so aims to reach the highest horizontal curve
possible- yielding the highest profit whatever the level of sporting success. The
concave indifference curves represent the preferences of utility maximising directors.
For such managers increasing profits is seen as desirable, but not if the cost in terms
reduced success is too great. The shape of the indifference curves imply that a
manager will demand ever increasing levels of profit (resp. success) to compensate for
a constantly decreasing level of success (resp.profit).
Figure 2 here
Given the relationship between profit and success we can contrast the optimal choices
of profit and utility maximising managers in figure 3 (this treatment is based on
Vrooman (1997)8). The profit maximising manager will choose a profit/success
combination tangent to the highest feasible horizontal indifference curve, shown as
(PM)* and S(PM)* in figure 3. A utility maximising facing the same success/profit
possibilities and choosing the same combination of profit and success would find
themselves located on an indifference curve such as I0 which is not a tangency. This
implies that a combination of lower profits and greater success would enable to the
manager to reach a higher indifference curve. Ultimately a tangency such as ((U)*,
S(U)*) could be reached yielding the maximum payoff for the manager.
Figure 3 here
We can therefore conclude that in theory a profit maximising manager will prefer
higher profits and inferior playing success compared to a utility maximising manager.
These effects follow directly from the supposed change in objectives. Indirect
consequences may follow as well if the increased scrutiny imposed by the listing
requirements cause directors to be more circumspect in their policies. First this may
involve the avoidance of excessive risks, thus creating a more stable earnings stream.
Secondly, it may imply a shift in distribution policy toward higher and more regular 8 Szymanski and Smith (1997) derive a similar relationship.
6
dividend payments, which are sometimes considered an important indicator of
company performance by market investors. Thirdly, it may be that company
efficiency is improved, so that resources are more productive and opportunities are
exploited more fully (something here which may be associated with a higher degree of
commercialism- e.g. raising ticket prices if it is profitable to do so).
3. Evidence
Tottenham Hotspur (1983), Millwall (1989) and Manchester United (1991) were the
first three English football clubs to obtain a stock exchange listing. The huge increase
in broadcasting income associated with the advent of the Premier League and the
rapid appreciation of Manchester United share created conditions in the mid 1990s
where the stock market was receptive to new issues. Between October 1995 and
October 1997 a further sixteen English clubs obtained a listing (see Table 1).
Our strategy is to search for any changes in the performance of these recently floated
companies relative to their peers in the professional leagues using the Fame database
of UK company accounting information which provides online records for the
previous ten years. Thus in most cases we are able to track performance for about five
years before and five years after flotation9. We examine four main indicators: pre-tax
profits, league ranking, wage expenditure relative to the average for teams in that
season and revenues relative to the average for that season. The first two variables
shed light directly on any possible change in objectives associated with flotation. The
last two relate to variables that might be related causally with changes in these
variables; for instance, increased wage expenditure is likely to lead to better league
performance. Wage spending and revenues are expressed in terms of orthogonal
deviations serves for two purposes. Firstly, given the rapid escalation of ticket prices,
broadcast rights values and player salaries a relative measure provides a consistent
basis for comparison across years. Secondly, in the context of a sports league an
absolute indicator of financial performance such as profits is likely to depend on the
use of inputs measured in relative terms rather than absolute terms (the absolute
9 Since Tottenham, Millwall and Manchester United were listed during this entire period their performance has not been considered.
7

quality of a team will not determine its success on the pitch, rather its quality relative
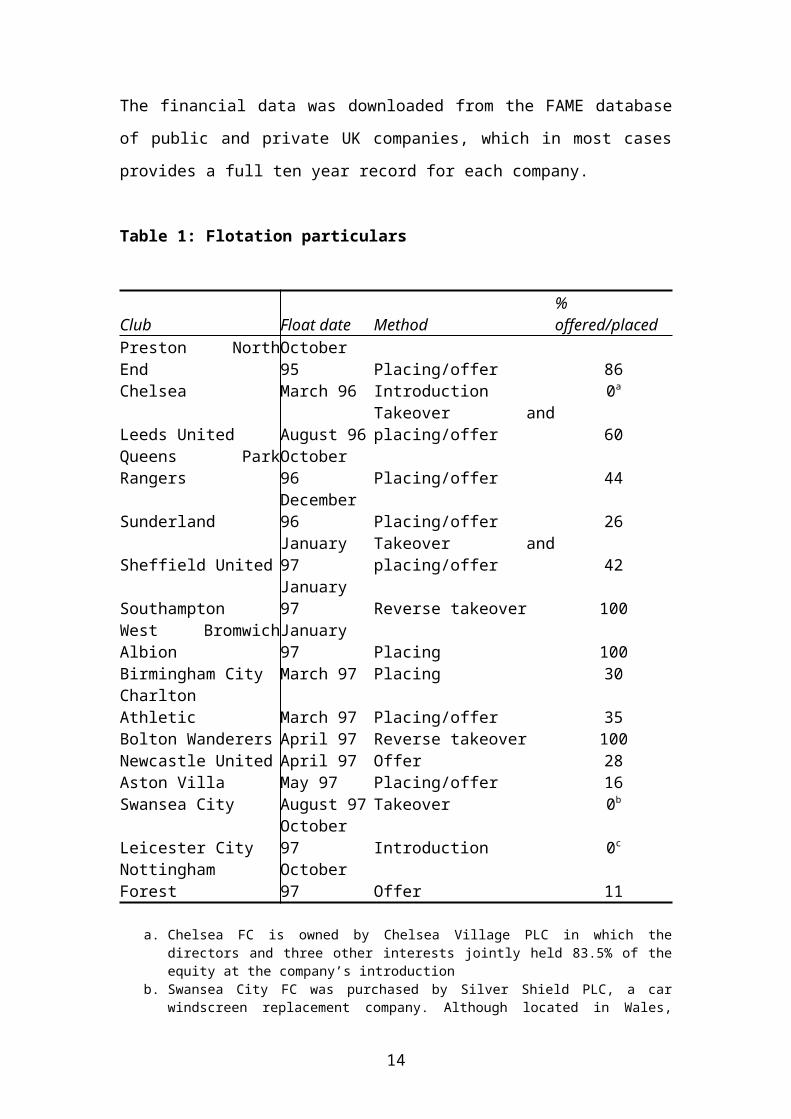
to its competitors). The financial data was downloaded from the FAME database of
public and private UK companies, which in most cases provides a full ten year record
for each company.
Table 1: Flotation particulars
Club Float date Method % offered/placedPreston North End October 95 Placing/offer 86Chelsea March 96 Introduction 0a
Leeds United August 96 Takeover and placing/offer 60Queens Park Rangers October 96 Placing/offer 44Sunderland December 96 Placing/offer 26Sheffield United January 97 Takeover and placing/offer 42Southampton January 97 Reverse takeover 100West Bromwich Albion January 97 Placing 100Birmingham City March 97 Placing 30Charlton Athletic March 97 Placing/offer 35Bolton Wanderers April 97 Reverse takeover 100Newcastle United April 97 Offer 28Aston Villa May 97 Placing/offer 16Swansea City August 97 Takeover 0b
Leicester City October 97 Introduction 0c
Nottingham Forest October 97 Offer 11
a. Chelsea FC is owned by Chelsea Village PLC in which the directors and three other interests jointly held 83.5% of the equity at the company’s introduction
b. Swansea City FC was purchased by Silver Shield PLC, a car windscreen replacement company. Although located in Wales, Swansea plays in English Football League and hence is treated as an “English” club.
c. Leicester City FC was acquired by Soccer Investments PLC
(a) Pre-tax profits and dividends
There are significant problems associated with the use of accounting profits to
measure the financial performance of sports businesses, as is well documented in the
American literature on the subject (see e.g. Scully (1989) and Quirk and Fort
(1992)10). When profit and loss statements form the basis of tax assessments firms
have a significant incentive to understate profits. Particular government policies, for
example in relation to depreciation, may create tax loopholes which enable firms to
10 Both of these drew heavily on the work of Roger Noll from Stanford University who dissected the profits statements of Major League Baseball teams on behalf of the players’ union in the 1980s and found that reported accounting profits significantly understated economic profits.
8

reduce profits and so legally limit their tax liability. Owners may charge expenses to
the company which bear little relation to any economic services rendered, and so
transfer taxable income away from the company (e.g. because personal incomes are
more favourably treated) – this is legal tax avoidance (for example, it would not be
illegal to pay a director £1m for 10 minutes work), or may be able to illegally evade
tax by exaggerating expenses.
Table 2 reports the pre-tax profits for fifteen of the sixteen clubs in Table 1. Summing
profits over the entire period only five of the clubs reported a net profit. Newcastle
reported a cumulative loss of £47m over this period while Nottingham Forest reported
a cumulative loss of £40m. In general a business that runs perpetually at an economic
loss will be closed by its owners if they are profit maximisers. Several of the clubs did
in fact have to undergo a significant restructuring. The shares of Nottingham Forest,
Queens Park Rangers (Loftus Road PLC) and Leicester City have all been suspended
from the market while the latter two clubs have entered administration (in 2001 and
2002 respectively). Loftus Road is no longer a listed company, while the shares of
Leicester City remain suspended at the date of writing. Nottingham Forest had their
shares delisted in 2002 following their failure to publish their accounts and in
anticipation of a restructuring involving a cash injection of £5m from a wealthy
supporter. Swansea City, which was taken over by a listed company in 1997 was sold
to it Managing Director for £1 during the 2000/01 season). Thus it may be that the
losses indicated reflect a genuine failure to produce an economic return. On the other
hand, Bolton has reported a pre-tax loss in each of the last nine seasons without filing
for bankruptcy while Newcastle has paid out dividends in each of the past five
seasons (totalling £14m) despite the size of its reported losses.
The ability to pay dividends is generally viewed as an indicator of financial health,
although there may be many good reasons for not paying dividends. It makes little
sense for a company with profitable investment opportunities to return internally
generated funds to shareholders. Of the quoted football clubs only six have paid
dividends: Aston Villa, Bolton, Newcastle, Southampton, Sunderland and West
Bromwich Albion. The total payout across those years were available was in the
region of £0.9m per club per season.
9

Table 2 illustrate that in general pre-tax profitability has deteriorated significantly
since flotation. In the five or so years prior to flotation the clubs in total reported
losses of £40m in aggregate, an average of £0.6m per club. In the five or so years
since flotation aggregate losses have been £103m, An average of £1.7m per club- i.e.
around three times larger than before flotation. Only Aston Villa, Chelsea Village,
Sunderland and West Bromwich Albion have reported positive profits on average, and
these are also the only clubs for whom profitability has improved11. It might be
argued that profitability should be compared against industry levels. There are
roughly sixty clubs which did not change status during the sample for whom we have
accounting data. In the five years from 1992 to 1996 these clubs reported an aggregate
loss of £16m, an average loss of about £0.05m per season per club. In the period 1997
to 2001 these12 clubs reported an aggregate loss of £105m, equivalent to around £0.3m
per season per club. Thus it appears that clubs that floated had much larger losses both
before and after listing, and in relative terms their losses declined after they were
listed. It could even be argued that this indicates a shift toward profit maximising
objectives. However, if profit maximising concerns had weighed significantly more
heavily after flotation, it seems hard to believe that the directors of the listed clubs
could not have done a lot more to bring their profitability into line with average of
other clubs13.
The decline in profitability also seems to be reflected in the changing market
valuations of the clubs. The market valuations of eleven of the clubs, on a monthly
basis, are shown in the charts at the end of the paper. What is clear is that market
values of clubs analysed here declined steadily and significantly after flotation except
in the cases of Charlton and Chelsea. Furthermore, this performance contrasted
sharply with that of Manchester United and the market in general until the stock
market started to decline in 2000. This is consistent with a rational valuation of
football club shares based on expected profitability.
11 I.e. all other clubs experienced greater losses than before flotation. Chelsea Village also appears to have had higher profits before flotation, but the series is too short to make a reasonable comparison.12 The sample is not balanced, and there are about 6% more observations in the second half of the panel.13 There is quite a lot of variability in financial performance. Manchester United, the largest and most profitable club by far is often cited as an outlier, but omitting them from the set of clubs whose status did not change does not alter the profile of profitability that much. Without Manchester United the 92-96 average is a loss of £0.2m compared to a loss of £0.7m in the 97-01 period.
10

(b) League performance
Team performance could be measured in several ways. Clubs compete in a number of
sporting competitions- the domestic league, the FA Cup, The League Cup, and at the
highest level the UEFA Cup and Champions’ League. Domestic league performance
is the indicator used here, firstly because it is the competition within which teams play
most of their matches, and secondly because club performance over time is
comparable on this basis.
The most striking feature of the data in Table 3 is that in twelve out of the sixteen
cases average league performance was better in the five years following stock market
flotation than in the five years before. Moreover, in three of these four cases the clubs
involved fell into severe financial difficulties and have lost their listing (Nottingham
Forest, Queen’s Park Rangers and Swansea City). Thus all but one of the clubs that
have retained their stock market listing since the mid 90s have improved their league
performance. It seems quite likely that it is the financial crisis at these clubs, rather
than the stock market listing, that led to the deterioration in performance.
While this suggests a quite powerful tendency towards improved performance, some
caution should be exercised given the small number of observations involved. In most
cases it could not be said that the change in performance was statistically significant.
In some cases (e.g. Aston Villa, Chelsea, Leeds, Preston North End, Southampton and
West Bromwich Albion14) the improvement is negligible. In other cases a significant
improvement in performance was apparent before flotation (e.g. Bolton, Newcastle)
so that only in a few cases does there appear to be a significant improvement that
coincides with flotation (Birmingham City, Charlton, Leicester City and Sunderland).
(c) Wage spending
Clubs improve their league performance by hiring or otherwise acquiring better
players. Since there is a well functioning market for player talent any improvement in
14 Preston’s performance improved by an average of ten places, which would be a significant accomplishment in the Premier League but is less impressive on the borders of the First and Second Divisions. West Bromwich’s improvement is largely associated with the last two seasons (and their subsequent promotion to the Premier League).
11
player quality can only be achieved through higher wage spending15. Wage spending
is here defined relative to the average wage spending of all teams in the league since it
not absolute spending that produces success, but outspending your rivals. Table 4
shows that in 50% of cases wage spending relative to the average increased post
flotation. As with performance, relative spending fell at those quoted clubs that fell
into financial difficulties (Nottingham Forest, Queens Park Rangers and Swansea, but
not Leicester City). Relative spending also fell at Birmingham City, Preston North
End, Sheffield United, Southampton and West Bromwich Albion. However, in these
case the relative decline was quite small. Some clubs saw very large relative increases
in spending- notably Bolton, Charlton, Chelsea, Leeds, Leicester, Newcastle and
Sunderland. In the cases of Bolton, Charlton, Leicester, Newcastle and Sunderland,
these were also clubs that witnessed a significant improvement in performance.
(d) Revenues
One expectation that one might hold about clubs that floated on the market is that they
would exploit their commercial opportunities more effectively, e.g. through
merchandising and sponsorship. This would manifest itself in the ability the extract
higher revenues from a given level of performance. Since on average relative
performance improved post flotation, one might reasonably expect that revenues
relative to the average would improve at most if not all clubs. In fact, revenues
relative to the average improved at only six clubs out of the sixteen.
(e) Regression analysis
The analysis thus far has been discussed in terms of simple averages. These shed light
on the proposition that flotation shifted football club owners away from utility
maximisation toward profit maximisation given that such a change in objectives is 15 Unless the club possesses some distinctive capability that enables them to extract a better level of performance from a given player than any other club. See Szymanski and Kupyers (1999), chapter 6 for a discussion of this possibility.

likely to lead to an increase in profits and a relative decline in performance on the
field. However, another approach is to look at the underlying causal relationships and
to see whether flotation led to any change in those causal links.
The data available here is a panel, which is characterised by a relatively small time
dimension (T) but a large number of clubs (N). The question we are interested in is
essentially a dynamic one of the adjustment, which takes place in a club over time to
flotation. We therefore have a very well known problem in panel data estimation,
which was first outlined by Nickell (1981) that under these circumstances OLS
dynamic panel data estimation is subject to considerable bias. We therefore employ
the GMM estimation technique proposed by Arellano and Bond (1991) and Arellano
and Bover (1995) to estimate dynamic panel data models. Essentially these techniques
build up a recursive varying set of instruments which provide good small sample
performance even in the face of relatively short time periods (T), a good survey of
these techniques may be found in Baltagi (1995).
The first causal mechanism that underlies the analysis in this paper is that league
performance is determined by the quality of players hired in a competitive market so
that in general higher player expenditure leads to better league performance. The
second link is that better performance will generate increased revenue as teams attract
fans, sponsorship and other income as a result of increased success. This is essentially
the model proposed and estimated in Szymanski and Smith (1997). Each team
chooses a level of investment in playing talent to meet its target level of performance
and profit given their underlying objectives and capabilities. We can write
(1) Pit = ai + bwit
Rit = ci +dPit
Where P is league rank, w is wage expenditure relative to the average and R is
revenue relative to the average. The a and c parameters represent intrinsic differences
in terms of productivity (the efficiency of turning player spending into performance)
and revenue generating capacity (from a given level of support). Each team then has
an objective function that is a weighted average of profits and performance:
13
(2) it = it + (1-) Pit
so that if, for example, = 1, the club cares only about profit. Here we ask whether
flotation might change the underlying causal relationship as well as the weighting on
profit. In effect we test to see whether a and c are affected by flotation. This might be
because a stock market listing is a more effective discipline on company managers
and hence they become more productive, either in their ability to generate playing
performance from a given investment (a) or to generate income from success (c). Note
that flotation, since it raises income from the flotation proceeds, should at least
increase c in the short run.
Given that actual outcomes in football will often deviate substantially from planned
results, the most natural approach to estimating these relationships is using an error
correction model. Our two estimating equations are:
(3)
where revenues, wage expenditure (both in orthogonal deviations) and league
performance are expressed in logs, Q refers to periods where listed on the stock
market, D indicates the league division in which the team plays, Pr indicates winning
promotion in the current season and Rel indicates being relegated in the current
season. Parameter estimates are reported in Table 6. The first three columns report
estimates for the revenue equation, the last three columns reports estimates for the
performance equation.
We are interested primarily in the sign and significance of the quoted variables. In an
error correction model the terms specified in differences specify the way in which a
given variable influences the adjustment toward equilibrium and the levels terms
define the underlying equilibrium relationship. The most important result therefore is
that the variable defining stock market flotation is insignificantly different from zero
14

in each of the regressions reported- suggesting that stock market flotation has no long
term impact on the performance of the club. In other words, quoted teams are not
expected to generate more revenue in the long term from a given league position or to
generate a better league position from a given wage expenditure relative to the
average. The first of these is perhaps most surprising, since many would have
expected quoted clubs to exploit commercial opportunities of success more
efficiently. One interpretation of this result is that all teams exploit commercial
opportunities fully, regardless of ownership.
The estimates of the dynamic terms tell a slightly differently story. In the wage-
performance equation the dynamic terms are insignificant, suggesting that there was
not even a short term adjustment brought about by flotation. On the other hand the
dynamic terms are significant in the revenue equation (expect in the specification with
club specific dummies included). The implication of this is that quotation brought
about a one-off boost to income, but that this benefit had no long term effect. One
interpretation of this finding is that flotation proceeds provided a temporary boost to
income. As income was higher, this may have provided more funds for improved
performance reported in Table 3 (this is not the effect of flotation per se, but the effect
of increased income associated with flotation), but this effect lasts only for a few
years and eventually the team returns to the same revenue-performance/performance-
wage equilibrium.
4. Discussion and Conclusions
Interpreting the findings of this paper requires some caution. On the face of it there
appears to have been a decline in profitability accompanied by increase in relative
spending a league performance among clubs that floated some share on the market in
the mid 1990s. One might question whether these results, given the size of the sample,
are statistically significant, but the main fact is that the expectation, based on
economic theory, that profits should increase and league performance decline
following flotation, does not seem to be supported by the data. But there is more than
one interpretation of these findings. We can identify the main contending
explanations:
15

(i) All football clubs were profit maximisers before flotation- so that entry
onto the stock market did not lead to any appreciable change in behaviour
(ii) The clubs that floated were profit maximisers before flotation- so that
entry onto the stock market did not lead to any appreciable change in
behaviour relative to the average
(iii) Accounting profits give a poor indication of economic profits, so that the
figures cannot truly indicate any change in economic performance
(iv) Post flotation accounts of PLC’s include data related to group business
activities that extend beyond the football club and are therefore not
comparable to the pre-flotation data.
(v) These clubs did not become profit maximisers after flotation because
a. Professional investors were unable to exercise control (only small
amounts of shares were offered to the market)
b. Professional investors were not interested- only fans bought shares
(vi) The directors mistakenly believed that the appropriate way to operate as a
profit maximiser was to invest heavily in playing talent in the anticipation
of future success generating larger profits.
All of the arguments apart from (i) imply that the data need not be inconsistent with
the conventional view of club objectives.
The second explanation does not seem all that plausible, given the fact these clubs had
lower profitability than their peers prior to flotation. Moreover, this does not explain
why they would have improved their league performance by spending more on
players while presiding over declining profits. The third explanation appears weak
since whatever problems there may be in inferring the level of economic profits from
accounting profits, it is reasonable to believe that changes in accounting profits are a
good indicator in changes in economic profits over a reasonable period of time for a
large enough sample of businesses, absent significant changes in the accounting rules.
One problem with this argument relates to the fourth explanation- if the group
business has more opportunities to shelter profits earned elsewhere after flotation then
it may well be the case that listed companies have an incentive to report larger losses.
However, in most cases football was the primary business activity of the listed entity,
16
and there are no cases of clubs becoming part of much larger commercial empires as
in the US16.
The fifth explanation has some merits. As Table 1 shows, several clubs floated a
relatively small percentage of the stock, limiting the scope for the market in general to
put pressure on the performance of the directors (although this story carries with it the
implication that the directors were failing in their fiduciary duties, a serious
allegation). Where small amounts of stock were on offer, it may well have been the
fans who were most likely to buy. However, there is plenty of evidence that
institutional shareholders were significant buyers at flotation of many of these clubs,
and indeed it was the perception that this was the case that gave rise to many
complaints from fans about the commercialisation of football (see e.g. Conn (1997)).
Morrow (1997) reports that “at its 1997 accounting year end 124 institutional
shareholders owned almost 60 per cent of the ordinary shares in Manchester United”.
However, it may be that the institutions quickly deserted the newly floated clubs once
they realised that they were unlikely to see a reasonable return on their investment.
The charts at the end of this paper illustrate the stock market valuation of eleven clubs
that floated between 1995 and 1997 as well as Manchester United. What is clear is
that few clubs ever saw their market value rise above the level posted in the first
month of trading, and that most saw quite rapid declines in value in the first few
months after flotation. If this reflects institutions selling off their shareholdings, it is
unclear why they should have given up on the idea quite so quickly. A better picture
of what happened could be constructed from an analysis of shareholder lists.
The sixth explanation is one that also might be consistent with the market valuation
data. Directors may have gambled on improving performance with a view to
exploiting the very rapid growth in media income during the period. The escalation of
player salaries in general during this period was a reflection of this growth, and it may
have appeared to be an individually rational strategy to invest relatively heavily in the
late 90s with a view to obtaining a larger share of a larger pot in the new millennium.
An example of this approach appears to be the performance of Leeds United, which
invested heavily and gambled on achieving success not only in the Premier League
16 Not least because in 1999 the UK competition authority blocked the takeover of Manchester United by the Sky broadcasting organisation, effectively prohibiting media ownership.
17

but also in the UEFA Champions League. They did in fact succeed in reaching the
semi-final of the latter competition in 2001, only to fail to qualify for the following
season and found themselves unable to fund their collection of star players. Since that
time they have been more or less forced sellers of large amounts of player talent.
It seems unlikely that any one explanation will furnish a conclusive explanation of the
relative performance of the football clubs that floated in the mid 90s. However, the
data does at least provide a serious challenge to the received view that football clubs
in England were utility maximisers rather than profit maximisers. If a utility
maximising club floats stock on the market the most natural implication is a shift
upward in profit and downward in on the pitch performance, almost exactly the
opposite of what seems to have occurred. Not only did profits fall and performance
improve on the pitch, but the econometric evidence suggests that the reason for this
change was that the floating clubs simply spent the flotation proceeds on players.
While it is not impossible to construct alternative stories to explain the data while
maintaining the conventional view that football clubs are utility maximiser, at the very
least the explanations seem somewhat strained. The alternative view- that football
clubs have always been profit maximisers, in England at least, deserves some
consideration.
18

Table 2: Pre-tax profits (£000)
Year relative to flotation
Aston Villa Birm-ingham City
Bolton Wanderers
Charlton Athletic
Chelsea Leeds United
Leicester City
Newcastle United
Nottingham Forest
Preston North End
Queens Park Rangers
Sheffield United
South-ampton
Sunderland West Bromwich Albion
-5 3542 804 -2307 247 -128 -165-4 -191 -28 814 -729 -374 1528 487 1094 1580 540 -254-3 1118 -129 112 3093 -2165 3766 -3441 389 509 -802 -476-2 3717 256 -960 -1156 -1362 2819 2464 -8111 -3315 164 2278 -250 878 -1544 -489-1 -65 -164 -1163 3395 842 -568 -25117 1729 -191 -859 -84 1710 -3926 1125 -4,009 254 -2045 -875 -3593 8,302 -10965 -253 2077 -4040 -910 -2368 -1851 11740 -4,712 -2010 -513 -3,272 -253 3,669 -4,617 62 -7,052 -6,715 -803 3,080 6122 20156 -5,122 1249 3067 684 -6307 1,373 7,951 113 -5,563 -4,217 2,022 564 -2,2573 -4850 -2,514 -2797 3499 711 291 -18,923 -15,222 -1,435 -8,927 -1,635 -3,427 1,465 7364 138 -2626 -8,188 323 2311 1,244 -6289 -8,854 -14,098 -761 -5,333 -367 -96 418 1,6885 -5962 -7,589 -1,165 3,011
Average for years before 1624 256 -320 -736 1017 1892 -39 -6429 -650 -14 1051 73 1229 -473 -243
Average for years
after 6796 -2626 -5134 -809 480 -1644 -3140 -5684 -6497 -637 -6719 -3234 -576 1708 195
Note: Post flotation data based on PLC accounts. Profits for Swansea City not reported
19
Table 3: League rank
Year relative to flotation
Aston Villa Birm-ingham City
Bolton Wanderers
Charlton Athletic
Chelsea Leeds United
Leicester City
Newcastle United
Nott-ingham Forest
Preston North End
Queens Park Rangers
Sheffield United
South-ampton
Sund-erland
Swansea West Bromwich Albion
-5 7 48 59 29 11 4 26 42 8 63 12 9 16 41 65 53-4 2 41 48 34 14 1 28 23 22 61 11 14 18 40 51 50-3 10 44 36 33 11 17 26 3 24 63 5 20 18 43 59 43-2 18 47 25 37 14 5 21 6 3 67 9 30 10 34 56 41-1 4 35 20 26 11 5 25 2 9 75 8 29 17 42 66 310 5 30 21 35 11 13 9 2 20 75 19 25 16 21 73 361 7 27 18 24 6 11 10 13 21 69 29 26 12 18 88 302 6 24 26 18 4 5 10 13 20 59 41 28 17 23 75 323 6 25 26 21 3 4 8 11 34 59 40 36 15 21 69 414 8 25 23 9 5 3 13 11 31 49 30 30 10 7 67 265 8 25 16 14 6 4 20 4 36 45 43 33 11 7 88 22
Average for years before 8 43 38 32 12 6 25 15 13 66 9 20 16 40 59 44
Average for years
after 7 25 22 17 5 5 12 10 28 56 37 31 13 15 77 30
20

Table 4: Spending relative to the League average
Year relative to flotation
Aston VillaBirm-ingham City
Bolton Wanderers
Charlton Athletic
Chelsea Leeds United
Leicester City
Newcastle United
Nott-ingham Forest
Preston North End
Queens Park Rangers
Sheffield United
South-ampton
Sund-erland
Swansea West Bromwich Albion
-5 1.96 0.70 1.63 1.43 1.15 1.28 0.40 0.74-4 1.92 0.73 0.54 1.96 1.03 1.99 1.93 1.39 1.27 1.44 0.97 0.36 0.71-3 2.23 0.95 0.66 0.65 2.24 1.12 2.35 2.84 1.59 1.13 1.41 1.05 0.33 0.69-2 2.28 1.16 0.85 0.72 1.75 2.29 1.41 2.27 1.83 0.33 1.44 1.01 1.53 1.15 0.33 0.68-1 2.11 1.31 0.91 0.69 1.80 2.43 1.49 2.79 2.33 0.40 1.41 1.07 1.13 1.08 0.27 0.750 2.17 1.05 1.32 0.64 2.39 2.76 1.92 3.50 1.73 0.38 1.37 0.94 1.03 1.22 0.24 0.671 1.92 0.79 1.39 0.70 3.01 2.47 1.58 3.28 1.73 0.33 1.09 1.19 0.92 1.23 0.20 0.642 2.14 0.80 1.25 1.06 3.61 2.36 2.03 3.06 1.52 0.35 0.96 0.92 1.23 1.26 0.23 0.593 2.45 0.88 1.02 1.25 3.20 2.24 2.26 3.12 1.24 0.35 0.77 0.62 1.50 1.28 0.24 0.714 2.32 0.86 1.03 1.59 4.62 3.00 2.05 2.41 0.99 0.29 0.57 1.44 2.50 0.22 0.535 4.05 3.85 0.42 2.16
0.41Average for years before 2.10 0.97 0.74 0.69 1.78 2.23 1.26 2.21 2.07 0.36 1.46 1.12 1.36 1.06 0.34 0.71
Average for years
after 2.21 0.83 1.17 1.15 3.70 2.78 1.98 2.97 1.37 0.35 0.94 0.83 1.27 1.68 0.22 0.61
Note: Aston Villa, Birmingham City, Charlton, Chelsea Village, Leicester City, Nottingham Forest and West Bromwich Albion figures from PLC accounts. All other clubs based on Limited Company Accounts.
21

Table 5: Revenue relative to the League average
Year Relative To Flotation
Aston VillaBirm-ingham City
Bolton Wanderers
Charlton Athletic
Chelsea Leeds United
Leicester City
Newcastle United
Nott-ingham Forest
Preston North End
Queens Park Rangers
Sheffield United
South-ampton
Sund-erland
Swansea West Bromwich Albion
-5 1.80 0.51 1.53 1.28 2.73 1.03 1.33 0.32-4 2.24 0.69 0.31 2.06 1.10 1.92 2.60 0.97 1.33 2.09 1.33 0.30-3 2.44 0.70 0.92 0.55 2.93 1.17 3.18 2.93 1.41 0.00 1.36 2.09 0.28-2 2.05 1.10 0.95 0.43 2.60 1.53 3.90 1.62 0.30 1.16 0.68 1.59 1.36 0.19 0.72-1 2.73 1.06 2.08 0.53 2.00 2.33 1.34 4.12 2.33 0.28 1.21 0.62 1.17 1.59 0.21 0.790 2.57 0.89 0.89 0.50 2.17 2.72 2.02 4.65 1.68 0.29 1.04 0.57 1.08 1.17 0.14 0.711 3.02 0.79 1.49 0.55 2.55 2.59 1.82 4.64 1.07 0.24 0.95 0.76 1.18 1.08 0.16 0.712 2.92 0.71 1.05 1.36 3.52 2.68 1.99 3.58 1.42 0.26 0.61 0.47 1.12 1.18 0.17 0.573 2.79 0.79 0.90 0.91 3.69 2.96 2.02 3.50 0.74 0.25 0.58 0.38 1.31 1.12 0.16 0.534 2.42 0.82 0.66 1.74 4.61 3.95 1.80 3.38 0.70 0.26 0.34 1.48 1.31 0.15 0.525 3.16 4.69 0.26 1.48
0.28Average for years before 2.25 0.81 1.07 0.50 2.00 2.48 1.33 2.88 2.44 0.29 1.19 0.73 1.51 1.59 0.32 0.76
Average for years
after 2.79 0.78 1.02 1.14 3.51 3.38 1.91 3.77 0.98 0.25 0.71 0.49 1.27 1.23 0.16 0.58
Note: Aston Villa, Birmingham City, Charlton, Chelsea Village, Leicester City, Nottingham Forest and West Bromwich Albion figures from PLC accounts. All other clubs based on Limited Company Accounts.
22
Table 6: Regression Results
Dependent variable:
Variables in differences
0.074(0.023)
0.049(0.028)
0.021(0.036)
0.231(0.130)
0.245(0.133)
0.163(0.117)
0.102(0.031)
0.121(0.037)
0.053(0.021)
-0.039(0.025)
-0.034(0.030)
-0.019(0.030)
Quotedit 0.047(0.021)
0.053(0.025)
0.021(0.024)
-0.021(0.052)
-0.031(0.057)
-0.024(0.060)
Divisionit -0.108(0.022)
-0.115(0.024)
-0.096(0.012)
-0.405(0.037)
-0.399(0.035)
-0.467(0.038)
Promotedit 0.055(0.021)
0.062(0.023)
0.034(0.012)
0.190(0.021)
0.190(0.021)
0.213(0.023)
Relegatedit -0.054(0.022)
-0.057(0.023)
-0.035(0.017)
-0.194(0.022)
-0.194(0.022)
-0.192(0.026)
Variables in levelsConstant -0.084
(0.034)-0.035(0.047)
0.214(0.078)
0.313(0.176)
0.272(0.160)
1.060(0.237)
-0.394(0.131)
-0.488(0.165)
-0.507(0.110)
0.169(0.075)
0.163(0.076)
0.106(0.130)
0.186(0.053)
0.121(0.037)
0.106(0.029)
-0.372(0.201)
-0.339(0.189)
-0.739(0.180)
Quotedit-1 0.038(0.028)
0.069(0.038)
0.018(0.032)
0.051(0.034)
0.045(0.034)
0.032(0.056)
Divisionit-1 -0.051(0.032)
-0.069(0.037)
-0.061(0.031)
-0.168(0.102)
-0.150(0.094)
-0.380(0.100)
Promotedit-1 0.077(0.020)
0.084(0.023)
0.066(0.020)
0.191(0.024)
0.188(0.023)
0.251(0.033)
Relegatedit-1 -0.031(0.019)
-0.031(0.021)
-0.030(0.019)
-0.215(0.026)
-0.211(0.024)
-0.216(0.031)
Time dummies No Yes Yes No Yes YesFixed effects No No Yes No No Yesobservations 604 604 604 621 621 621AR(1) 0.58 1.3 -2.0 -0.9 -1.2 -0.6AR(2) 2.1 2.2 0.2 -0.53 -0.7 -2.1
Wit is total company wage expenditure of club i in year t, R it is company turnover, and Pit is league rank on measured from 1 to 92, treating first place in Division One of the Football League as rank 21, first place in Division Two as 45, and so on. AR(1) and AR(2) are tests of first and second order serial correlation in the errors, distributed as standard normal. Figures in parenthesis are robust standard errors.
24
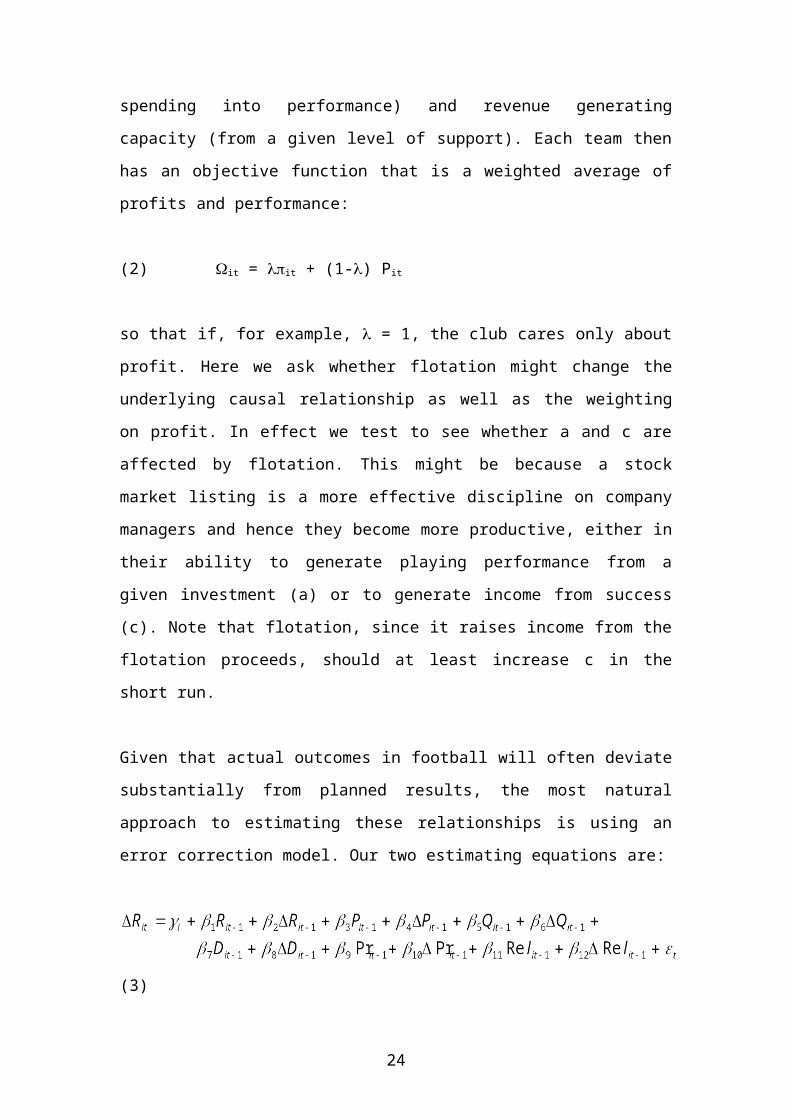
Figure 1: Profits as a function of club success
Figure 2: Indifference curves for profit maximising and utility maximising owners
profit
Playing success
Indifference curves for profit maximising owner
profit
Playing success
Indifference curves for utility maximising owner
25

Figure 3: Equilibrium for profit maximising and utility maximising owners
I1I0
(PM)*
(U)*
S(PM)* S(U)*
profits
Playing success
Indifference curves for utility maximising owner
Indifference curve for profit maximising owner
26

References
Arellano M. and Bond S.R. (1991) ‘Some tests of specification for panel data: Monte Carlo evidence and an application to employment equations’ Review of Economic Studies, 58, 277-297.
Arellano M. and Bover O. (1995) ‘Another look at the instrumental variables estimation of error component models’ Journal of Econometrics, 68, 29-51.
Baltagi B.H. (1995) ‘Econometric Analysis of Panel Data’ Chichester, John Wiley and sons.
Cheffins, Brian. 1998. “Sports Teams and the Stock Market: A Winning Match?” UBC Law Review 32: 271-291
Conn, David, 1997. The Football Business: Fair Game in the ‘90s? Mainstream Publishing
Fort, Rodney and James Quirk. 1995. “Cross Subsidization, Incentives and Outcomes in Professional Team Sports Leagues” Journal of Economic Literature, XXXIII, 3, 1265-1299
Inglis, Simon. 1988. League Football and the men who made it. Willow Books. London.
Késenne, Stefan. 1996 “League Management in Professional Team Sports with Win Maximizing Clubs”, European Journal for Sport Management, vol. 2/ 2, pp. 14-22
Késenne, Stefan. 2000. “Revenue Sharing and Competitive Balance in Professional Team Sports” Journal of Sports Economics, Vol 1, No 1, pp56-65.
Mason, Tony. 1980. Association Football and English Society, 1863-1915. Brighton, UK: Harvester Press.
Morrow, Stephen. 1999. The New Business of Football. London: Macmillan.
Nickell S. J. (1981) ‘An investigation of the determinants of manufacturing employment in the UK’ Discussion paper No. 105, Center for Labor Economics, London School of Economics.
Quirk, James and Rodney Fort. 1992. Pay Dirt: The Business of Professional Team Sports, Princeton N.J.: Princeton University Press.
Scully, Gerald. 1989. The Business of Major League Baseball. Chicago: University of Chicago Press.
Sloane, Peter. 1971. "The Economics of Professional Football: The Football Club as a Utility Maximizer", Scottish Journal of Political Economy, 17, 2, 121-146.
Szymanski, Stefan. 2003 “The Economic Design of Sporting Contests” Journal of Economic Literature, forthcoming.
27

Szymanski, Stefan and Tim Kuypers. 1999. Winners and Losers: The Business Strategy of Football. Viking Books, London.
Szymanski, Stefan and Ron Smith. 1997. “The English Football Industry, Profit, Performance and Industrial Structure” International Review of Applied Economics, 11, 1, 135-153
Tischler, Steven. 1981. Footballers and Businessmen. NY: Holmes & Meier.
Vamplew, Wray. 1988. Pay up and play the game: Professional sport in Britain 1875-1914. Cambridge, UK: Cambridge University Press
Vrooman, John. 1997. “A Unified Theory of Capital and Labor Markets in Major League Baseball” Southern Economic Journal, 63, 594-619
Vrooman, John. 2000. "The Economics of American Sports Leagues" Scottish Journal of Political Economy, 47, 4, 364-98
28

Chelsea Market Value April 96-Feb 03
0
50
100
150
200
250
£m
Sheffield United Market value Jan 97- Feb 03
0
5
10
15
20
25
30
35
40
Jan-
97
Mar
-97
May
-97
Jul-9
7
Sep-
97
Nov
-97
Jan-
98
Mar
-98
May
-98
Jul-9
8
Sep-
98
Nov
-98
Jan-
99
Mar
-99
May
-99
Jul-9
9
Sep-
99
Nov
-99
Jan-
00
Mar
-00
May
-00
Jul-0
0
Sep-
00
Nov
-00
Jan-
01
Mar
-01
May
-01
Jul-0
1
Sep-
01
Nov
-01
Jan-
02
Mar
-02
May
-02
Jul-0
2
Sep-
02
Nov
-02
Jan-
03
£m
Manchester United Market Value June 91- Feb 03
0
200
400
600
800
1000
1200
£M
16 clubs listed during this period
29

Sunderland Market value Dec 96- Feb 03
0
10
20
30
40
50
60
70
Dec
-96
Feb-
97
Apr-
97
Jun-
97
Aug-
97
Oct
-97
Dec
-97
Feb-
98
Apr-
98
Jun-
98
Aug-
98
Oct
-98
Dec
-98
Feb-
99
Apr-
99
Jun-
99
Aug-
99
Oct
-99
Dec
-99
Feb-
00
Apr-
00
Jun-
00
Aug-
00
Oct
-00
Dec
-00
Feb-
01
Apr-
01
Jun-
01
Aug-
01
Oct
-01
Dec
-01
Feb-
02
Apr-
02
Jun-
02
Aug-
02
Oct
-02
Dec
-02
Feb-
03
£m
West Bromwich Albion Market Value Jan 97 - Feb 03
0
2
4
6
8
10
12
14
16
18
20
Jan-
97
Mar
-97
May
-97
Jul-9
7
Sep-
97
Nov
-97
Jan-
98
Mar
-98
May
-98
Jul-9
8
Sep-
98
Nov
-98
Jan-
99
Mar
-99
May
-99
Jul-9
9
Sep-
99
Nov
-99
Jan-
00
Mar
-00
May
-00
Jul-0
0
Sep-
00
Nov
-00
Jan-
01
Mar
-01
May
-01
Jul-0
1
Sep-
01
Nov
-01
Jan-
02
Mar
-02
May
-02
Jul-0
2
Sep-
02
Nov
-02
Jan-
03
£m
Birmingham Market Value March 97- Feb 03
0
5
10
15
20
25
30
£m
30

Charlton Market Value March 97 - Feb 03
0
5
10
15
20
25
30
35
£m
Newcastle Market Value April 97 - Feb 03
0
20
40
60
80
100
120
140
160
180
200
£m
Aston Villa Market Value May 97- Feb 03
0
20
40
60
80
100
120
£m
31

Nottingham Forest Market Value Oct 97 - Oct 01 (shares supsended)
0
5
10
15
20
25
30
35
£m
Burnden Liesure (Bolton Wanderers) May 97 - Feb 03
0
10
20
30
40
50
60
£m
Southampton Market Value Jan 97 - Feb 03
0
5
10
15
20
25
30
35
40
Jan-
97
Mar
-97
May
-97
Jul-9
7
Sep-
97
Nov
-97
Jan-
98
Mar
-98
May
-98
Jul-9
8
Sep-
98
Nov
-98
Jan-
99
Mar
-99
May
-99
Jul-9
9
Sep-
99
Nov
-99
Jan-
00
Mar
-00
May
-00
Jul-0
0
Sep-
00
Nov
-00
Jan-
01
Mar
-01
May
-01
Jul-0
1
Sep-
01
Nov
-01
Jan-
02
Mar
-02
May
-02
Jul-0
2
Sep-
02
Nov
-02
Jan-
03
£m
32