making sense of balance sheets€¦ · balance sheet abc company as of 12/31/2015 current assets...
TRANSCRIPT
MAKING SENSE OF
BALANCE SHEETS
Ronald Sereika, CCE, CEW

How to start analysis process
• The user of a firm’s annual report can expect to
encounter a great quantity of information that
encompasses the required information- Financial
statements, notes to the financial statements, the
auditors report, a five year summary of key
financial data, management’s discussion and
analysis of operations – as well as material that is
included in the report at the imagination and
discretion of management.
Starting the analysis process
• To understand how to navigate the vast amount of
information available to financial statement users,
background on the accounting rule-making
environment is necessary.
• Financial statements are prepared according to
generally accepted accounting principles (GAAP)
that have been adopted in order to achieve a
presentation of financial information that is
understandable by as well as relevant and reliable
for decision making.

Continuing the analysis
process
• The SEC regulates US companies that issue
securities to the public and requires issuance of a
prospectus for any new security offering. The SEC
also requires regular filings of:
• Annual reports – 10-K
• Quarterly reports 10-Q
• Other reports- if you change auditors that would be
a 8-K.

Who regulates the SEC
• The SEC has congressional authority to set the accounting policies and has issued rulings called Accounting Series Releases (ASRs) and Financial Reporting Rulings (FRR’s).
• For the most part however, accounting rule making has been delegated to the Financial Accounting Standards Board (FASB).
• The FASB is comprised of seven full time paid members. The Board issues Statements of Financial Accounting Standards and Interpretations, usually after some lengthy process of deliberations.
• The SEC and FASB work together to develop accounting policy, with the SEC playing mainly a supporting role.

Where to find financial
information
• Corporate financial statements are available from
several sources. All publicly held companies must
file a form 10-K annually with the SEC. The
information in this document is mandated by the
SEC and contains uniform content, presented in
the same order for all filing companies.
• Documents filed with the SEC can usually be
accessed through the Electronic Data Gathering,
Analysis, Retrieval (EDGAR) database at the
SEC’s website www.sec.gov

WWW.SEC.GOV

Which Financial statements to
use
• Balance Sheet- Shows the financial position –
assets, liabilities, and stockholders equity of a firm
on a particular date, such as the end of quarter or
year.
• The statement is a summary of what a firm owns
(Assets) and what the firm owes to outsiders
(Liabilities) and to internal owners (Stockholders
Equity)

The Balance Sheet
• The accounts balances on a balance sheet must
balance, meaning the total of all assets must
equal the sum of the liabilities and stockholders
equity.
• Assets= Liabilities + Stockholders equity
A=L+OE

Balance Sheet and P&L Related
• Balance sheet - one point in time
• Profit and loss - running summary of time period
• Statement of Cash Flows- Cash must be generated for a
company to remain in business even if they are
showing increases in sales and profits

Balance Sheet
• current assets
• fixed assets
• current liabilities
• long term liabilities
• net worth
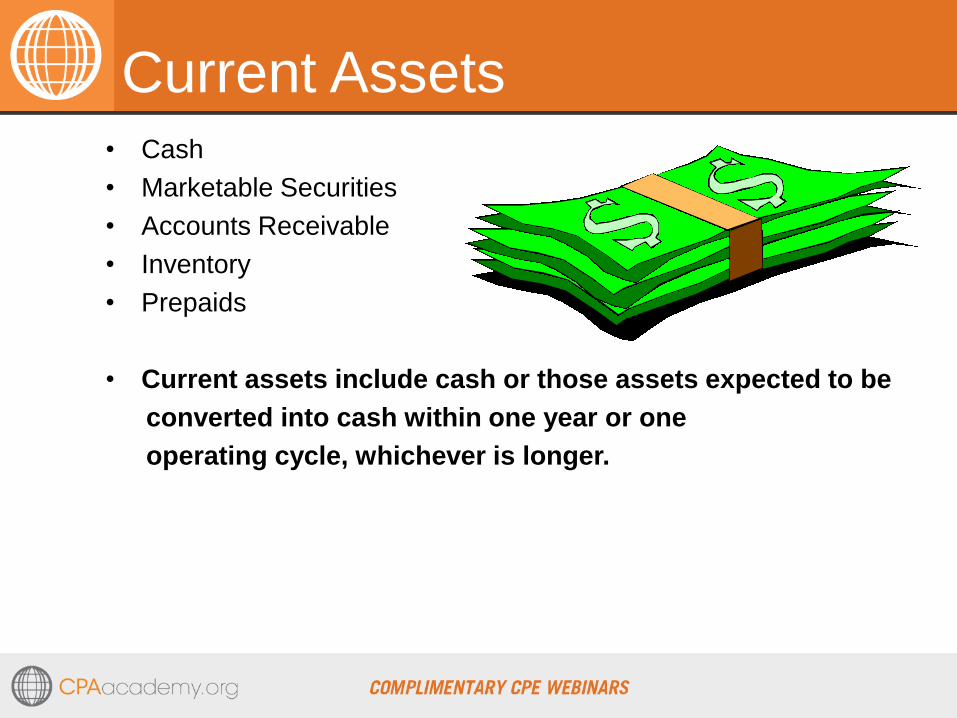
Current Assets• Cash
• Marketable Securities
• Accounts Receivable
• Inventory
• Prepaids
• Current assets include cash or those assets expected to be
converted into cash within one year or one
operating cycle, whichever is longer.

Fixed Assets
• Land
• Buildings
• Depreciation
• Long term Notes
• Goodwill
• Intangible
• These assets produce
economic benefits for more than one year for the
company.

Current Liabilities
• Accounts payable
• Short term notes due bank
• Current maturities of long term debt
• Accrued liabilities
• Taxes
• Current Liabilities are the claims against the assets that must
be paid in one year or one operating cycle, whichever is longer.

Long term Liabilities
• Long term debt
• long term notes to suppliers, owners
• Capital leases
• Pension liability
• Long term Liabilities are obligations by the company of greater
than one year that will need to be satisfied.
Net Worth / Equity
• Capital Stock
• Paid In Capital
• Retained Earnings
• Treasury Stock
• Shareholder/Stockholder equity is the residual interest in
assets that remains after deducting liabilities.

Working Capital formula
Current Assets – Current Liabilities = Working capital
If this calculation ever shows a negative number
than the company you are reviewing is
BANKRUPT

Balance Sheet
ABC Company
As of
12/31/2015
Current Assets Current LiabilitiesCash and Cash Equivalents $50,000 Accounts Payable $490,000
Accounts Rec. Less Allowance for $590,000 Accrued Liablilites $40,000
Doubtful Acounts $10,000 Income Taxes Paybale $25,000
Inventories $990,000 Current Maturities of LT Debt $125,000
Prepaid Expenses $5,000 Short term debt $50,000
Total Current Assets $1,635,000 Total Current Liabilities $730,000
Property Plant & Equip Deferred Federal Income Taxes $30,000
Land $1,000,000 Long Term Debt $150,000
Buildings and leasehold Improve $650,000 Total Liabilities $910,000
Equipment $250,000
$1,900,000 Stockholders Equity Less: Accumaulated Depreciation $60,000 Common Stock Par Value $1.00
Net Property Plant and Equipment $1,840,000 1,000,000 Shares issued, $1,000,000
GoodWill $325,000 Additonal Paid in Capital $250,000
Other Assets $75,000 Retained Earnings $1,715,000
Total Assets $3,875,000 Total Stockholders Equity $2,965,000
Total Liabilities and Stockholders $3,875,000
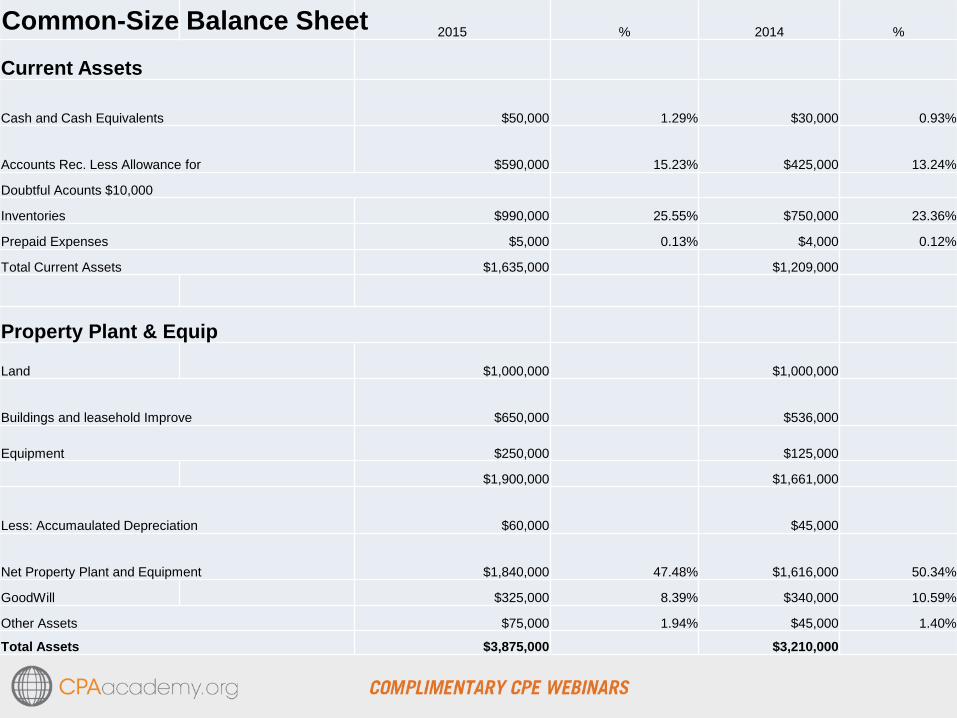
2015 % 2014 %
Current Assets
Cash and Cash Equivalents $50,000 1.29% $30,000 0.93%
Accounts Rec. Less Allowance for $590,000 15.23% $425,000 13.24%
Doubtful Acounts $10,000
Inventories $990,000 25.55% $750,000 23.36%
Prepaid Expenses $5,000 0.13% $4,000 0.12%
Total Current Assets $1,635,000 $1,209,000
Property Plant & Equip
Land $1,000,000 $1,000,000
Buildings and leasehold Improve $650,000 $536,000
Equipment $250,000 $125,000
$1,900,000 $1,661,000
Less: Accumaulated Depreciation $60,000 $45,000
Net Property Plant and Equipment $1,840,000 47.48% $1,616,000 50.34%
GoodWill $325,000 8.39% $340,000 10.59%
Other Assets $75,000 1.94% $45,000 1.40%
Total Assets $3,875,000 $3,210,000
Common-Size Balance Sheet

2015 % 2014 %
Current Liabilities
Accounts Payable $490,000 12.65% $285,000 8.88%
Accrued Liablilites $40,000 1.03% $25,000 0.78%
Income Taxes Paybale $25,000 0.65% $15,000 0.47%
Current Maturities of LT Debt $125,000 3.23% $140,000 4.36%
Short term debt $50,000 1.29% $60,000 1.87%
Total Current Liabilities $730,000 $525,000
Deferred Federal Income Taxes $30,000 0.77% $18,000 0.56%
Long Term Debt $150,000 3.87% $175,000 5.45%
Total Liabilities $910,000 $718,000
Stockholders Equity
Common Stock Par Value $1.00
1,000,0000,Shares issued, $1,000,000 25.81% $1,000,000 31.15%
Additonal Paid in Capital $250,000 6.45% $124,000 3.86%
Retained Earnings $1,715,000 44.26% $650,000 20.25%
Total Stockholders Equity $2,965,000 $2,492,000
Total Liabilities and Stockholders $3,875,000 $3,210,000
Common-Size Balance Sheet

Liquidity Ratios
• Current ratio
Current Assets/Current Liabilities
2015 $1,635,000 / $730,000 2.24:1
2014 $1,209,000/ $525,000 2.30:1
• Quick ratio
Current Assets-Inventory/Current Liabilities

Days sales outstanding DSO
Accounts Receivable/Sales/365
This will tell you how fast you are collecting AR
Educate your management that this formula is
driven more by sales than collections, avoid
having DSO as a measurement for your review.
To show how well you are collecting cash take
the amount of cash you collect in a month and
divide the AR balance from the beginning of that
month into the amount you collected- compare months
Days Payable outstanding DPO
• Accounts Payable/CGS/365
This will tell you how fast the company is paying their bills
This is helpful if you are looking to set up a new customer
and you want to see on average how they are paying their
bills, can they meet your payment terms?

Leverage Ratios
Debt Ratio -Total Liabilities/Total Assets
Shows the proportion of all assets what are financed with
debt.
Debt to Equity – Total Liabilities /Stockholders Equity
Measures the total debt relative to your equity.
Times Interest earned- Operating Profit/Interest Expense
Measures how many times interest expense is covered by
operating earnings.
the amount of cash you collect in a month and
divide the AR balance from the beginning of that
month into the amount you collected- compare months

The 5 C’s of Credit
#1 Character- The moral qualities and actions of a credit
applicant which oblige the applicant to pay
debts as they become due.
#2 Capacity- The ability to pay when debt is due
#3 Capital- The financial strength of a risk as measured by
the equity or Net Worth of an applicant.
#4 Collateral- Those possessions or equities from which the
customer or debtor might be expected to draw
upon should character and capacity fail.
#5 Conditions-The current and expected general economic
situations as they might affect the applicant.

How to make a credit decision just
from a Balance Sheet
Look at the Working Capital ratio first to make sure they have
enough assets to cover debt for coming year
Do ratios; Current Ratio, Debt to Equity, DPO, DSO
Look at the total they have in Accounts Payable, see what
the percentage of what you want to sell to them or loan
them is of the AP total.
#1 answer- Call and talk to the controller, ask them about
your concerns and she how he/she responds (Character)
To show how well you are collecting cash take
the amount of cash you collect in a month and
divide the AR balance from the beginning of that
month into the amount you collected- compare months

QUESTIONS
Ronald A Sereika, CCE,CEW
Copyright 3/1/2016