making smart decisions about smart beta - … · worked as director of research at barra, where his...
TRANSCRIPT
RONALD N. K AHN AND MICHAEL LEMMON OCTOBER 2014
MAKING SMART DECISIONS ABOUT SMART BETA

ABOUT THE AUTHORS
Ronald N. Kahn, PhD, Managing Director, is Global Head of Scientific Equity Research at BlackRock. He is responsible for upholding and enhancing BlackRock’s scientific equity research standards and products.
Dr. Kahn’s service with the firm dates back to 1998, including his years with Barclays Global Investors (BGI), which merged with BlackRock in 2009. At BGI, his roles included Global Head of Equity Research, Global Head of Advanced Equity Strategies, and Head of Active Equities in the US. Prior to joining BGI, Dr. Kahn worked as Director of Research at BARRA, where his research covered equity and fixed income markets.
With Richard Grinold, Dr. Kahn authored Active Portfolio Management: Quantitative Theory and Applications. The two of them are the 2013 winners of the James R. Vertin award, presented periodically by the CFA Institute to recognize individuals who have produced a body of research notable for its relevance and enduring value to investment professionals. He is a 2007 winner of the Bernstein Fabozzi/Jacobs Levy award for best article in The Journal of Portfolio Management. He serves on the editorial advisory boards of the Financial Analysts Journal, The Journal of Portfolio Management and The Journal of Investment Consulting. The 2007 book How I Became a Quant includes his essay describing his transition from physics to finance.
Dr. Kahn teaches the equities half of the course “International Equity and Currency Markets” in UC Berkeley’s Master of Financial Engineering Program.
Dr. Kahn earned an AB degree in physics, summa cum laude, from Princeton University, and a PhD in physics from Harvard University. He was a post-doctoral fellow in physics at UC Berkeley.
Michael Lemmon, PhD, Managing Director, is a member of BlackRock’s Scientifically Driven Active Equity team.
Prior to joining BlackRock in 2011, Dr. Lemmon was a professor of finance at the University of Utah. Prior to that, he was an assistant professor at Arizona State University.
Dr. Lemmon’s research on executive compensation, corporate governance, and corporate financial policies has been published in academic and practitioner journals. Dr. Lemmon earned a BS degree and an MS degree in electrical engineering, both from the University of Utah, in 1985 and 1987, respectively. Dr. Lemmon earned a PhD in finance from that university in 1995.

Executive Summary
Smart beta strategies have captured the interest of investors. But where do they fit in their portfolios? In order to answer this question, this paper introduces a framework for understanding the returns and risks of any strategy: passive, active, or smart beta.
The key findings:
The return to any strategy over time can be decomposed into a broad cap-weighted index return, the return to static exposures to smart beta factors, the return to timing smart beta factors, and the return above and beyond smart beta.
We believe that it may benefit the typical investor—who currently owns active and index products—to own active, index, and smart beta products, and the framework described herein facilitates optimizing the blend.
Active managers on average allocate a significant fraction of their active risk budget to static exposures to smart beta factors: 35% for international equity managers and 67% for domestic fixed income managers in our study. Investing in multiple managers increases this allocation, as smart beta factors are correlated across managers.
Smart beta is disrupting active management. Given these innovative new products, investors will increasingly demand that their active managers deliver returns beyond those that can be achieved through static exposures to smart beta factors.

[2 ] MAKING SMART DECISIONS ABOUT SMART BETA
Smart beta strategies offer some of the return advantages of active strategies with some of the implementation advantages of passive strategies. These strategies have generated considerable—and growing—interest among investors. But where do they fit in investors’ portfolios? The answer will show that smart beta is an innovation with significant implications not only for investors, but also for active managers.1 For a detailed analysis of who should buy smart beta see our May 2014 paper “Who Should Buy Smart Beta?”
A FRAMEWORK FOR UNDERSTANDING STRATEGY RETURNS AND RISKS
To help us analyze how best to use smart beta, and how it fits in with passive indexing and active management, we will rely on the following framework. Since our framework is very general, the analysis can apply to equity investors considering equity smart beta, or fixed income investors considering fixed income smart beta, or multi-asset-class investors considering multi-asset smart beta.
We can consider the return to any investment strategy over time as a combination of cap-weighted benchmark returns and active returns. We can further decompose the active returns into smart beta factor returns and active return above and beyond smart beta factors. Exhibit 1 illustrates this decomposition.
Over time, the active return for any investment strategy is the sum of an average smart beta term and “pure alpha” return. By this definition:
The smart beta return arises from static (i.e. long-term average) exposures to smart beta factors.
The pure alpha consists of three pieces:
– The average bottom-up security selection return (beyond smart beta factors).
– The average top-down macro, industry, and country returns (beyond smart beta factors).
– The return due to smart beta timing.
The smart beta timing piece is only non-zero if the smart beta exposures vary over time; and it is only positive if those exposures are higher when the smart beta factor return exceeds its expectation and lower when the smart beta factor return falls short of its expectation.
Importantly, the Exhibit 1 decomposition also updates and clarifies the goals of active management: to deliver active returns above and beyond those available via static exposures to smart beta factors. Those static exposures to smart beta factors are now available at low cost relative to traditional active products.
EXHIBIT 1. DECOMPOSITION OF INVESTMENT RETURN OVER TIME
Return from Average (Static) Exposures to Smart Betas
Security Selection (Beyond Smart Beta)
“Pure Alpha” Return
Macro, Industry, Country (Beyond Smart Beta)
Smart Beta Timing
Cap-Weighted Index Benchmark Return
Active Return over Time
Investment Return over Time
Source: BlackRock
1. Ronald N. Kahn and Michael Lemmon. “The Asset Manager’s Dilemma: How Smart Beta Is Disrupting the Investment Management Industry.” BlackRock manuscript, September 2014.

[ 3 ]B l a c k R o c k
0.05 0.1 0.2 0.3
Fraction of Active Risk Explained by Factors
0.4 0.5 0.6 0.7 More0
5
10
15
20
25%
Per
cent
of O
bser
vati
ons
Mean = 35%
EXHIBIT 2. FRACTION OF ACTIVE RISK EXPLAINED BY FOUR SMART BETA FACTORS (MARKET, SIZE, VALUE, AND MOMENTUM) FOR A SAMPLE OF 138 GLOBAL EQUITY INVESTMENT MANAGERS
In fact, implicit in this decomposition of returns is a decomposition of pricing. We can buy the cap-weighted benchmark for the cost of indexing. We can buy static exposures to smart beta factors for the cost of smart beta products. And we can buy active management (beyond static exposures to smart beta factors) for the cost of active management.
Investors need their active managers to deliver the sources of return beyond those available via static exposures to smart beta factors. Active managers who cannot do that may lose out to these low-cost smart beta products. This is how smart beta represents a disruptive innovation for active management.
WHERE DOES SMART BETA FIT IN INVESTOR PORTFOLIOS?To illustrate in more detail how smart beta products can fit into investor portfolios, we focus on the typical investor who currently invests in both active and passive products.
As we have seen, aggregate returns to the active holdings consist of three pieces:
Returns from constant exposures to smart beta factors.
Returns that arise from manager timing of those factors.
Returns that arise from manager skill above and beyond those factors.
Understanding this decomposition allows the investor to diagnose the issues and take appropriate actions. Because active managers can deliver all those components of return, it is useful to understand empirically the extent to which active managers focus on smart beta.
Exhibit 2 shows a histogram of the fraction of active risk that can be explained by four smart beta factors (Market, Size, Value, and Momentum)2 for the 138 global active equity managers in the e-vestment database with returns over the three-year period from April 2011 through March 2014. As seen in the exhibit, for an average manager, static exposures to these four smart beta factors explain about 35% of active risk. For about 35% of these managers, smart beta contributes 50% or more of their active risk. According to this analysis, many of these active managers are not focused on delivering what only active managers can deliver: returns beyond static exposures to smart beta factors.
This situation becomes more pronounced when an investor hires multiple managers, each of whom derives some returns from exposure to smart beta factors. As an example, consider an investor who hires four fundamental value managers, each with active risk of 5%, where each manager obtains 3% active risk from constant exposure to a value factor and 4% from
2. Although not technically a smart beta factor, we include the market factor because a number of funds deliver at least part of their active returns through static exposures to the cap-weighted benchmark.
Sources: BlackRock, eVestment 4/11 to 3/14. This represents all global equity funds that are tracked in eVestment from 4/11 to 3/14.

[ 4 ] MAKING SMART DECISIONS ABOUT SMART BETA
stock-specific risk (which is uncorrelated across managers).3 At the manager level, 36% of the active variance comes from the value factor and 64% comes from stock-specific variance.4
If the investor now allocates an equal dollar amount to each manager, the resulting aggregate portfolio will have an active risk of only 3.6%, consisting of 3% risk from exposure to the value factor (risk which does not diversify across managers) and only 2% stock specific risk (which does diversify across managers). So at the aggregate level, 69% of the active variance comes from the value factor, and only 31% comes from stock-specific variance. In other words, each individual manager provides mainly stock-specific risk, but in aggregate they provide mainly factor risk.
Even if each individual manager takes mainly stock-specific risk (which does diversify across managers), the aggregate
portfolio can have a much higher fraction of active risk in smart beta factors (which do not diversify across managers). Exhibit 3 shows this very clearly. It uses the same database of global equity investment managers and looks at 1,000 simulations, each building an equal-weighted portfolio of 10 managers chosen at random.
Exhibit 3 displays the same histogram as Exhibit 2, but this time for these multi-manager portfolios. The histogram for the multi-manager portfolios shifts to the right, indicating that smart beta factors explain a greater fraction of active risk in multi-manager portfolios. For an average multi-manager portfolio, static exposures to these four smart beta factors explain about 43% of the active risk, versus about 35% for the average individual manager. In this multi-manager analysis, smart beta factors contribute 50% or more of the active risk about 55% of the time. You can be happy with your active
3. So the active risk for each manager is 5%, because (5%)2 = (3%)2 + (4%)2.
4. This is because 36% = (3%)2 / (5%)2 and 64% = (4%)2 / (5%)2.
EXHIBIT 3. FRACTION OF ACTIVE RISK EXPLAINED BY FOUR SMART BETA FACTORS (MARKET, SIZE, VALUE, AND MOMENTUM) FOR 1,000 EQUAL-WEIGHTED 10-MANAGER PORTFOLIOS CHOSEN FROM 138 GLOBAL EQUITY INVESTMENT MANAGERS
Sources: BlackRock, eVestment 4/11 to 3/14. This represents all global equity funds that are tracked in eVestment from 4/11 to 3/14.
0.05 0.1 0.2 0.3
Fraction of Active Risk Explained by Factors
0.4 0.5 0.6 0.7 More0
5
10
15
20%
Per
cent
of O
bser
vati
ons
Mean = 43%
[ 5 ]B l a c k R o c k
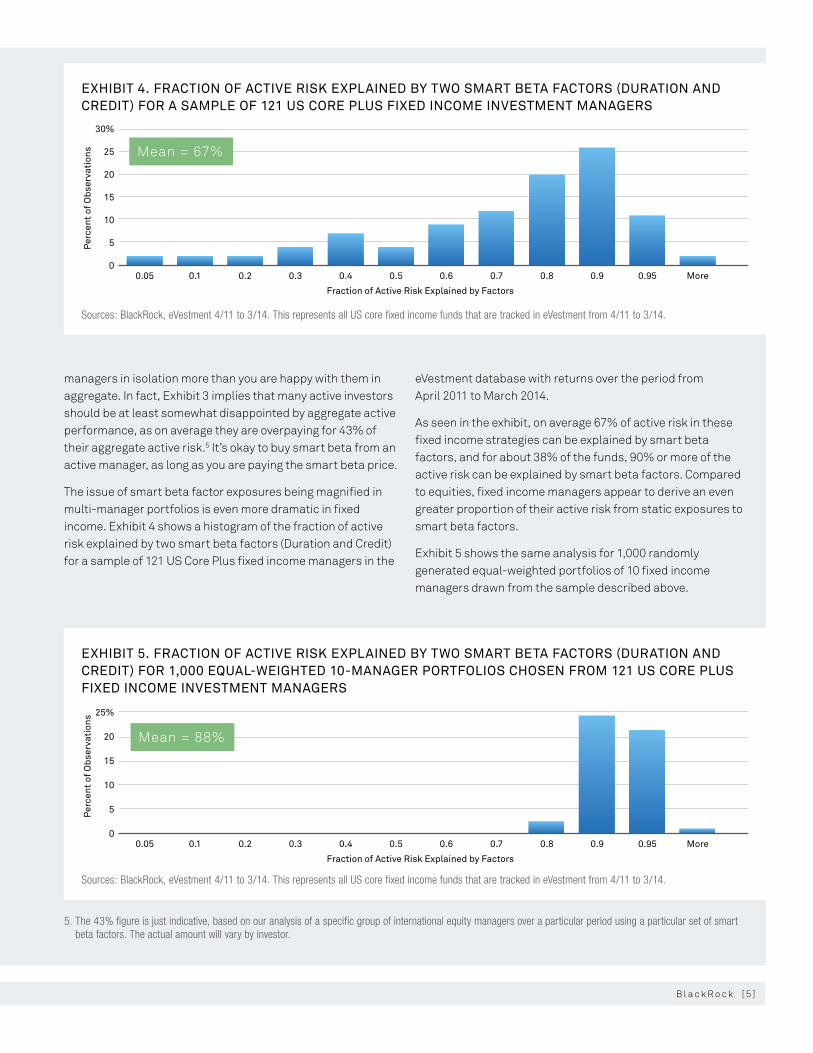
EXHIBIT 4. FRACTION OF ACTIVE RISK EXPLAINED BY TWO SMART BETA FACTORS (DURATION AND CREDIT) FOR A SAMPLE OF 121 US CORE PLUS FIXED INCOME INVESTMENT MANAGERS
EXHIBIT 5. FRACTION OF ACTIVE RISK EXPLAINED BY TWO SMART BETA FACTORS (DURATION AND CREDIT) FOR 1,000 EQUAL-WEIGHTED 10-MANAGER PORTFOLIOS CHOSEN FROM 121 US CORE PLUS FIXED INCOME INVESTMENT MANAGERS
managers in isolation more than you are happy with them in aggregate. In fact, Exhibit 3 implies that many active investors should be at least somewhat disappointed by aggregate active performance, as on average they are overpaying for 43% of their aggregate active risk.5 It’s okay to buy smart beta from an active manager, as long as you are paying the smart beta price.
The issue of smart beta factor exposures being magnified in multi-manager portfolios is even more dramatic in fixed income. Exhibit 4 shows a histogram of the fraction of active risk explained by two smart beta factors (Duration and Credit) for a sample of 121 US Core Plus fixed income managers in the
eVestment database with returns over the period from April 2011 to March 2014.
As seen in the exhibit, on average 67% of active risk in these fixed income strategies can be explained by smart beta factors, and for about 38% of the funds, 90% or more of the active risk can be explained by smart beta factors. Compared to equities, fixed income managers appear to derive an even greater proportion of their active risk from static exposures to smart beta factors.
Exhibit 5 shows the same analysis for 1,000 randomly generated equal-weighted portfolios of 10 fixed income managers drawn from the sample described above.
5. The 43% figure is just indicative, based on our analysis of a specific group of international equity managers over a particular period using a particular set of smart beta factors. The actual amount will vary by investor.
Sources: BlackRock, eVestment 4/11 to 3/14. This represents all US core fixed income funds that are tracked in eVestment from 4/11 to 3/14.
Sources: BlackRock, eVestment 4/11 to 3/14. This represents all US core fixed income funds that are tracked in eVestment from 4/11 to 3/14.
0.05 0.1 0.2 0.3
Fraction of Active Risk Explained by Factors
0.4 0.5 0.6 0.7 0.8 0.9 0.95 More0
5
10
15
20
25
30%
Per
cent
of O
bser
vati
ons Mean = 67%
0.05 0.1 0.2 0.3
Fraction of Active Risk Explained by Factors
0.4 0.5 0.6 0.7 0.8 0.9 0.95 More0
5
10
15
20
25%
Per
cent
of O
bser
vati
ons
Mean = 88%
[ 6 ] MAKING SMART DECISIONS ABOUT SMART BETA
As seen in the exhibit, for more than 90% of the 10-manager fixed income portfolios, two smart beta factors explain more than 90% of the active returns. In fixed income, investors in multi-manager portfolios are overpaying for nearly all of their aggregate active risk.6
AN OPTIMAL BLEND OF ACTIVE, SMART BETA, AND INDEXOur typical investor owns both active and index products. Based on our empirical analysis, such an investor may be paying active fees for smart beta exposures, with the likelihood of that increasing with the number of active managers in the portfolio. There should be opportunities, then, to use low-cost smart beta products for smart beta exposures, and use active managers for returns beyond smart beta. Smart beta products should expand the after-cost efficient frontier provided by active and index products. Most investors should benefit then from investing in smart beta products in addition to their active and index products. To identify the best blend of active, smart beta, and index products, they need to understand the expected active returns and risks for each.
For the active management piece, our return decomposition will help them to identify managers who can consistently deliver pure alpha (and mainly pure alpha), and estimate their expected alpha and active risk going forward.
For the smart beta piece, we will focus first on the factors, and later find the strategies that can best deliver our desired blend of factors.7 Similar to the process of identifying successful active managers, the smart beta investor should, among other things, consider the following:
What are the underlying reasons to believe the factors will continue to deliver risk-adjusted returns?
Has anything changed over time that could impact those underlying reasons?
What are the expected returns after fees and costs?
What are the volatilities and correlations among the smart beta factors?
What levels and periods of drawdowns have the factors experienced historically?
The last required piece is an understanding of investors’ tolerance for risk. What level of absolute and relative drawdowns over three- or five-year periods can they handle? Are they long-term investors who can stomach large drawdowns if they lead to outperformance over the long-term, or are they sensitive to annual performance?
Given the set of expected active returns, risks, and correlations, as well as the investor’s risk aversion, we can identify an optimal blend of active products, smart beta factors, and index strategies. Our October 2014 manuscript “Smart Beta Illustrated: A Detailed Example” provides the details.8 Note that while this analysis of expected return and risk can sound daunting, it is no different than the type of analysis most investors conduct to support their existing asset allocation. And consultants and managers can help with the analysis, and in developing optimal blends.
At this point, investors need to consider several practical issues as they look for strategies to deliver their desired blend of smart beta factors.
First, do they want a long-only implementation of smart beta factors, or are they open to long-short implementations? Long-only implementations deliver considerable market risk along with factor risk, and thus may also affect the allocation to benchmark strategies in investors’ portfolios. Is shorting allowed by their guidelines? Is it allowed, but limited, and possibly more valuable when used for their alternatives investments? The advantage of long-short implementations is that they better capture the true factor and so presumably have a higher ratio of return to risk.9 The disadvantages include the additional costs of shorting, the additional complexity of implementation, the scarcity of long-short smart beta strategies, and their lower capacity relative to long-only.
Capacity is another practical issue, though mainly for the very largest investors. And since capacity is a bigger issue for active management than for smart beta, the primary impact of capacity will be to move the largest investors from active management toward smart beta.10 That said, there can be capacity constraints for some smart beta factors.
6. The 90% figure is just indicative, based on our analysis of a specific group of fixed income managers over a particular period using a particular set of smart beta factors. The actual amount will vary by investor.
7. Some investors can choose to manage this optimal blend themselves, either to take this task in-house, or to avoid limiting themselves to existing products.
8. In lieu of this approach, if investors are generally happy with the smart beta exposures that arise from the existing set of active managers, they can engage the active managers on the issue of pricing of the various components of return, with a lower fee being attached to returns arising from static factor exposures and a higher fee being attached to returns arising from manager skill in factor timing and returns above and beyond smart beta factors.
9. Richard C. Grinold and Ronald N. Kahn. “The Efficiency Gains of Long-Short Investing.” Financial Analysts Journal, September/October 2000.
10. One example related to this case is the Norwegian Government Pension Fund Global (GPFG). This fund has been written about extensively elsewhere (David Chambers, Elroy Dimson, and Antti Ilmanen, 2011, “The Norway Model”, Journal of Portfolio Management, 38(2), pgs 67-81). The investment philosophy underpinning the GPFG is viewable at: http://www.regjeringen.no/en/dep/fin/Selected-topics/the-government-pension-fund/government-pension-fund-global-gpfg/investment-strategy.html?id=696849.
[ 7 ]B l a c k R o c k
Another practical consideration is whether the investor wants a prepackaged blend of factors or wants to invest in the factors separately. The individual smart beta factors are risky and tend to exhibit significant periods of underperformance, even if they outperform on average over time. Diversified mixes of smart beta factors can mitigate that behavior to some extent. Therefore, assuming the investor’s optimal combination of smart beta factors invests in more than one factor, the investor ideally wants a blended product. Investors in blended strategies also benefit from offsetting trades, which can lower transaction costs and turnover, and from offsetting positions, which can help mitigate the headwind imposed by the long-only constraint in long-only products.
Finally, to manage the smart beta investments going forward, investors must have the proper internal organization and governance structure to take on the responsibility for understanding and communicating investment performance to their stakeholders.
NAVIGATING THE PRODUCT LANDSCAPEOnce investors have decided upon a desired set of smart beta exposures, how do they navigate the wide variety of available strategies to choose specific smart beta managers and investments? Here are a few guideposts to consider.
First, investors should consider how smart beta strategies have performed historically. But here, the question is less about the performance of the smart beta factors than about the manager’s ability to consistently and efficiently deliver the promised exposure to the factors. When investors choose a passive index fund manager, they take into account how closely the manager has tracked the index historically. We recommend the same approach here: How well has the manager delivered (or tracked) the promised smart beta factors?
Second, investors can decide whether to use smart beta factors provided by independent third parties, or smart beta factors customized by particular managers. Do the benefits of a customized smart beta portfolio, which may more accurately capture the factor and avoid crowded trades if the third-party index becomes very popular, outweigh the benefits of an off-the-shelf product?
Third, how much do different smart beta products cost? Other things equal, lower cost products are more desirable. As investors consider costs, however, they should make sure they are comparing products that deliver the same smart beta exposures.

[ 8 ] MAKING SMART DECISIONS ABOUT SMART BETA
Conclusions
Smart beta strategies have generated considerable interest among investors, given their interesting combination of features of active and passive products. The typical investor currently owns active and index strategies, and should own active, index, and smart beta strategies.
Investors currently receive static exposures to smart beta factors from their active managers. These exposures are increasingly available via low-cost smart beta products. For reasons of cost and transparency, investors should switch and gain their smart beta exposures via smart beta strategies.
Even if individual active managers take a minority of their active risk in static exposures to smart beta factors, in aggregate a portfolio of active products can deliver mainly smart beta risk, because these risks are correlated across managers. Hence active managers need to focus as much as possible on delivering pure alpha (i.e. active returns beyond static exposures to smart beta factors) to their investors. This is what investors need, as they can only get pure alpha from active management.
The development of smart beta products should inspire all investors to review their current allocations to active and index products. A revamped allocation to active, index, and smart beta products could increase their expected returns (after costs) and/or lower their active risk, relative to their current allocations.

[ 9 ]B l a c k R o c k

UIM
-004
9
This material is for distribution only to institutional investors and should not be relied upon by any other persons. This document is intended solely to report on various investment views held by BlackRock. Opinions, estimates, forecasts, and statements of financial market trends that are based on current market conditions constitute our judgment and are subject to change without notice. This material is provided for informational purposes only and does not constitute a solicitation in any jurisdiction in which such solicitation is unlawful or to any person to whom it is unlawful. Moreover, it neither constitutes an offer to enter into an investment agreement with the recipient of this document nor an invitation to respond to it by making an offer to enter into an investment agreement.
This material may contain “forward-looking” information that is not purely historical in nature. Such information may include, among other things, projections, forecasts, estimates of yields or returns, and proposed or expected portfolio composition. Moreover, where certain historical performance information of other investment vehicles or composite accounts managed by BlackRock, Inc. and/or its subsidiaries (together, “BlackRock”) has been included in this material and such performance information is presented by way of example only. No representation is made that the performance presented will be achieved, or that every assumption made in achieving, calculating or presenting either the forward-looking information or the historical performance information herein has been considered or stated in preparing this material. Any changes to assumptions that may have been made in preparing this material could have a material impact on the investment returns that are presented herein by way of example.
This material is not intended to be relied upon as a forecast, research or investment advice, and is not a recommendation, offer or solicitation to buy or sell any securities or financial product or to adopt any investment strategy. The opinions expressed are as of October 9, 2014, and may change as subsequent conditions vary. The information and opinions contained in this material are derived from proprietary and nonproprietary sources deemed by BlackRock to be reliable, are not necessarily all-inclusive and are not guaranteed as to accuracy. There is no guarantee that any forecasts made will come to pass. Any investments named within this material may not necessarily be held in any accounts managed by BlackRock. Reliance upon information in this material is at the sole discretion of the reader. Past performance is no guarantee of future results.
In the US this material is for institutional investors only.
This document contains general information only and does not take into account an individual’s financial circumstances. An assessment should be made as to whether the information is appropriate in individual circumstances and consideration should be given to talking to a professional adviser before making an investment decision.
THIS MATERIAL IS HIGHLY CONFIDENTIAL AND IS NOT TO BE REPRODUCED OR DISTRIBUTED TO PERSONS OTHER THAN THE RECIPIENT.
BLACKROCK is a registered trademark of BlackRock, Inc. All other marks are the property of their respective owners.
©2014 BlackRock, Inc. All Rights Reserved.