making the connections - placeeconomics
TRANSCRIPT

CONNECTIONS:
MAKING THE
A STUDY OF THE IMPACT OF HISTORIC PRESERVATION IN INDIANAPOLIS
Created for: Indiana LandmarksPrepared by: PlaceEconomics 2018

The 1873 Kemper House. Photo Credit: Old House Online
Foundry Coffee in the Herron-Morton Place District. Photo Credit: Raina Regan
I

TABLE OF CONTENTS
EXECUTIVE SUMMARY 4
INTRODUCTION 6 A LOOK BACK: THE HISTORY OF HISTORIC PRESERVATION IN INDIANAPOLIS THE BASICS: INDIANAPOLIS’ HISTORIC RESOURCES MAPS
PRODUCTIVE 13 IMPACT ON JOBS & EMPLOYMENT
RESILIENT 21 HISTORIC DISTRICTS AS STABILIZERS
LIVABLE 31 QUALITY OF LIFE MEASUREMENTS
CONCLUSION 39 ACKNOWLEDGEMENTS METHODOLOGIES PROJECT TEAM
II

INDIANAPOLIS HERITAGE
The Cottage Home area is a conservation district east of downtown Indianapolis. The small community features residential and commercial structures and has historically been known as a working-class neighborhood. Photo by Raina Regan.
Fountain Square is the oldest commercial area outside of downtown to function continually as an important commercial area. The intersection of 5 streets make the distinct shape. The Lady Spray Fountain is an anchor in the center. Photo by Lee Lewellen.
Forming the true icon of the city, Monument Circle, is the brick-paved intersection of Meridian and Market streets. The Neoclassical Indiana State Soldiers and Sailors Monument sits at the center. The area is Indianapolis’ newest historic district, designated in 2012. Photo by Raina Regan.
1

The Wholesale District used to be a blighted area, but thanks to investments in historic buildings the area has turned into one of the city’s premier arts and entertainment spots. Photo by Indiana Landmarks.
An example of the modest sized, character-rich, residential structures found in many of Indianapolis’ historic districts, this one in Cottage Home. Photo by Raina Regan.
The Central State campus has been transformed through collaborative efforts, historic rehabilitation, and new construction. Pictured below is the Ignition Arts space. Photo by author.
Old Northside is a testament to the impacts of historic preservation. Once home to Indianapolis’ wealthiest residents, the neighborhood fell into disrepair in the middle of the 20th century. Years of investment and the protection of a local historic district revitalized the neighborhood. Photo by Raina Regan.
2

Interior of the Indiana War Memorial. Photo Credit: Raina Regan3

EXECUTIVE SUMMARY “This is a terrific American city, a worthy city, a city of hidden charms and historical significance.” — New York Post
On the 50th anniversary of the enactment of the Indianapolis historic preservation ordinance, the Indianapolis Historic Preservation Commission sought to take a comprehensive look at the contributions of a half-century of diligent preservation efforts. The pages that follow quantify those contributions to the economy, environment, and cultural life of Indianapolis.
Key findings include:
PRODUCTIVE
RESILIENT
LIVABLE
• Indianapolis has 13 local historic districts, 5 conservation districts, and 19 National Register districts that are not also listed as local districts
• Local historic districts cover 4 percent of the land area or 5 percent of the parcels within the urban context area
• 16 percent of all jobs in the city are located in historic districts
• The 4 percent land area in historic districts contributes 18 percent of the total assessed value inside the Urban Compact Area, with per square mile values 4 times that of non-designated areas
• Between 2010 and 2015, the local historic districts saw 9 percent population growth compared to the 2 percent growth in non-designated areas
• Between 2008—2012, Indianapolis foreclosure rates reached 25 percent in non-designated areas compared to local historic districts at 6 percent
• Property values in historic districts outperformed the rest of the city 2000-2015
• Historic districts also recovered better from the real estate crash
• Home sales prove the historic market is strong with 19 percent of all sales and 34 percent of aggregate sale amount in 2015
• Less than 2 percent of the city’s nearly 3,000 abandoned properties are in historic districts
• Local historic districts are in close proximity to Indianapolis’ urban amenities such as bike lanes, parks, and museums
• Households in local historic districts have shorter commutes
• 18 percent of active adopt-a-block locations are located in historic districts
• Local historic districts are home to a wide distribution of household incomes, race, and ethnicity
4

Downtown Indianapolis. Photo Credit: Raina Regan
Indianapolis Union Station.Photo credit: Lee Lewellen.
5

INTRODUCTIONFast cars and sports fanatics—these are the images that might come to mind when one thinks of the revving engines of Indianapolis. Yet being the “Capital at the Crossroads of America” is about much more than motor highways, as impressive as they may be. Ultimately, it's about connections—not just connecting the East to the West, but connecting planning with people, culture to recreation, and history to economic growth.
Indianapolis has lived up to this slogan. The city boasts a nearly encyclopedic art museum; a world class, eight-mile-long, urban Cultural Trail that connects its neighborhoods to downtown; and a wealth of creative, independent boutiques and restaurateurs dotting the city’s historic and cultural districts. Indianapolis is doing a lot of things right, and other communities are taking notice.
Over the past two centuries, the city has grown from its original, compact “Mile Square,” centered around Monument Circle, to become the 16th largest city in the United States by land area, 15th largest in population, and 2nd largest in the Midwest. In 2017, the city’s Plan 2020 received the Silver National Planning Achievement Award for “Best Practice” from the American Planning Association. The plan has been lauded for its decentralized approach, placing the power to affect the future of the city’s growth outside of local government and into the hands of city partners. While the recently approved neighborhood plan shows that some city neighborhoods are growing while others are shrinking, those
growing neighborhoods—which include the downtown—are consistently gaining national attention.
This growth can be attributed to the incredible livability of the city. Indianapolis International Airport has been named “#1 airport in America” for the last six years by Airports Council International. Livability.com ranked Indianapolis as having the country’s “3rd Best Downtown,” and ZipRecruiter.com put Indianapolis as 6th on the list for “Up-and-Coming Cities for Tech Jobs.”
This progress can also be attributed to Indianapolis’ historic resources, which contribute significantly to the city’s growth and quality of life. From the radiating avenues and early squares, to streetcar lines and mid–century suburbs, the historic fabric makes Indianapolis a unique place for living, working, and playing. As Indianapolis plans for the future, the historic, built environment remains essential in reshaping the city in the 21st century.
2017 marked the 50th anniversary of the enactment of Indianapolis historic preservation ordinance and commission. For a half century, preservation advocates have worked to save the special places in Indianapolis, and their efforts have laid the groundwork for an innovative, sustainable, and equitable future. This study demonstrates how historic preservation has contributed to a more productive, resilient, and livable Indianapolis.
6

Lockerbie Fair. Photo credit: City
of Indianapolis.
as Lockerbie Square, with its compactly spaced frame cottages and brick homes, already best illustrated a pre-Civil War Indianapolis.2
Shortly thereafter, Historic Landmarks Foundation of Indiana (now Indiana Landmarks) was formed in 1960. Seven years later, Indiana Landmarks spearheaded the legislation that established the Indianapolis Historic Preservation Commission, appointing seven members with powers to preserve historic areas, review surveys and plans, and acquire real estate. IHPC’s first district plan in 1978 saved Lockerbie Square from its near-Disneyfication, protecting it as a residential neighborhood.
Indianapolis followed the wave of the preservation movement taking off in the U.S.
2 “Capital at the Crossroads of America,” National Park Service, US Department of the Interior. https://www.nps.gov/nr/travel/indianapolis/introessay.htm
A LOOK BACK: THE HISTORY OFHISTORIC PRESERVATION IN INDIANAPOLIS
In 1971, the preservation ethic was strong in the state of Indiana. The desire to protect Indiana’s heritage made its way to the statehouse where legislators passed Indiana Statute PL 260-1971 creating the Meridian Street Preservation Area and Commission. The nine member commission members are appointed by the Mayor and the Governor.
MERIDIAN STREET HISTORIC COMIMISSION
Indianapolis would be a profoundly different city were it not for the creation of the Indianapolis Historic Preservation Commission (IHPC). In the mid-20th century, like many American cities, the combined forces of strict zoning, urban renewal, depopulation, and unsympathetic redevelopment schemes were threatening the built character and vibrant nature of the city. By 1967, the historic 1904 Marion County Courthouse had been replaced by a clean-lined International–style building, much of the area surrounding Monument Circle had been converted to parking lots, and the neighborhoods adjacent to the Mile Square, once vibrant residential hubs, were suffering population loss1.
The birth of the preservation movement in Indianapolis can be traced back to this period, beginning with the proposed Lockerbie Fair development in 1958. The proposal called for Lockerbie Square, the oldest surviving residential neighborhood in Indianapolis, to be transformed into a Victorian replica of a “Midwestern Main Street.” An ironic proposal,
1 Tom Gallager, “URBAN DESIGN: IHPC offers lessons for smart development,” Indiana Business Journal, https://www.ibj.com/articles/65082-urban-design-ihpc-offers-lessons-for-smart-development
7
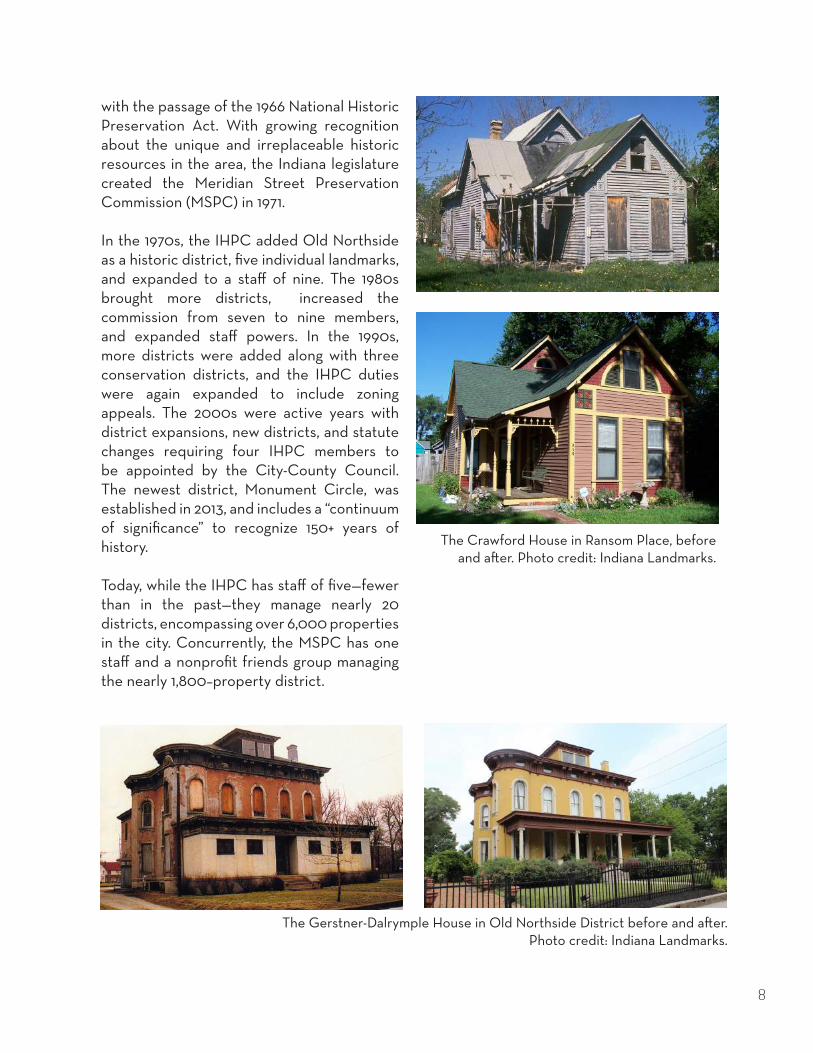
with the passage of the 1966 National Historic Preservation Act. With growing recognition about the unique and irreplaceable historic resources in the area, the Indiana legislature created the Meridian Street Preservation Commission (MSPC) in 1971.
In the 1970s, the IHPC added Old Northside as a historic district, five individual landmarks, and expanded to a staff of nine. The 1980s brought more districts, increased the commission from seven to nine members, and expanded staff powers. In the 1990s, more districts were added along with three conservation districts, and the IHPC duties were again expanded to include zoning appeals. The 2000s were active years with district expansions, new districts, and statute changes requiring four IHPC members to be appointed by the City-County Council. The newest district, Monument Circle, was established in 2013, and includes a “continuum of significance” to recognize 150+ years of history.
Today, while the IHPC has staff of five—fewer than in the past—they manage nearly 20 districts, encompassing over 6,000 properties in the city. Concurrently, the MSPC has one staff and a nonprofit friends group managing the nearly 1,800–property district.
The Crawford House in Ransom Place, before and after. Photo credit: Indiana Landmarks.
The Gerstner-Dalrymple House in Old Northside District before and after. Photo credit: Indiana Landmarks.
8

THE BASICS: INDIANAPOLIS’ HISTORIC RESOURCES
The city of Indianapolis is rich in historic resources, with over 6,000 properties protected by IHPC alone. From the Eastman Lilly House—one of the oldest homes built in the region—to the Gramse Apartment Building—a multi-family structure that speaks to a rapidly growing city in the early 20th century—the historic resources of Indianapolis create a physical timeline and tell the story of a city over almost two centuries.
In Indianapolis, as in many cities in the United States, there are three types of districts as identified in the maps on pages 11-12. National Register districts are an honorific designation, maintained by the National Park Service within the Department of the Interior in Washington, D.C. National Register districts provide the threshold for use of the Federal and State Rehabilitation Tax Credits for commercial structures, but are not subject to other restrictions.
The greatest protection for historic properties comes from local historic designation. The IHPC defines a local historic district as “a single property or a collection of structures and sites that possesses a high degree of integrity in all of the following areas: location, design, setting, materials, workmanship, feeling, and
association.”1 As can be seen in the following maps, in many cases, all, or portions of, National Register districts are included within local historic districts. Local districts are under the purview of the IHPC/MSPC, and their review covers a broad range of exterior changes. In total, the IHPC/MSPC provide protection for over 9,900 properties in Marion County. Most of the analyses in this report look at the character and characteristics of local historic districts.
Indianapolis also has conservation districts, which differ from historic districts in both purpose and administration. Whereas historic districts are typically structured to preserve historic architecture, conservation districts focus on sustaining a neighborhood’s historic community.2 Conservation districts address overall character and the overlay protections include design review of new construction and demolitions.
Indianapolis has 13 local historic districts, 5 conservation districts, and 19 National Register districts that are not also listed as local districts.
1 “Historic Districts,” City of Indianapolis, http://indy.gov/eGov/City/DMD/IHPC/Districts/Historic/Pages/home.aspx2 “Conservation Districts,” City of Indianapolis, http://www.indy.gov/eGov/City/DMD/IHPC/Districts/Conservation/Pages/home.aspx
9

CERTIFICATE OF APPROVAL
The owners of designated buildings in Indianapolis do need the approval of IHPC to make exterior changes and alterations to existing structures or for new construction within historic districts. But the ever-recurring myth that historic designation takes away a property owner’s rights is just not true. While there are indeed regulations acting on those properties, very rarely are applications made to the IHPC denied. 60 percent of certificates of approval are handled at staff level. Of the nearly 5,000 applications submitted in the last nine years, just over 1 percent have been denied. Designation does not mean partitioning off older buildings with a velvet rope. Through the identification, protection, and enhancement of Indianapolis’ irreplaceable historic buildings, the IHPC makes the places of the past useful for the future.
60%HANDLED AT STAFF LEVEL
1%DENIED IN LAST
9 YEARS
5,000 APPLICATIONS
A house in Old Northside. Photo Credit: Raina Regan
10

MAPS
For the purpose of this analysis, the study was limited to the measurement of preservation’s impact of local historic districts inside the Urban Compact Area as defined by the Indianapolis Metropolitan Planning Organization. Within that area, local historic districts cover 5 percent of the parcels and 4 percent of the land area. Just over 3 square miles is locally designated. The pages that follow demonstrate how this small, preserved area of local historic districts contribute greatly to the economic, social, and cultural well-being of Indianapolis.
National Register Historic Districts
Conservation DistrictsLocal Historic Districts
HISTORIC DISTRICTS LOCATION IN CITY BOUNDARY
4% OF LAND AREA
5% OF ALL PROPERTIES
ARE IN LOCAL HISTORIC DISTRICTS
3TOTAL
SQUARE MILES DESIGNATED
11

HISTORIC DISTRICTS LOCATION IN URBAN COMPACT AREA
LOCAL HISTORIC DISTRICTS LOCATION IN URBAN COMPACT AREA
National Register Historic Districts
Conservation DistrictsLocal Historic Districts
Local Historic Districts
12

Historic districts in Indianapolis have more jobs, draw more young professionals, act as hubs for innovation, and make the city more money. More people want to live in these areas than in non-historic neighborhoods, and that growth has acted as a counterbalance to those areas of the city that are shrinking while bringing positive attention to Indianapolis on a national level. By looking at jobs, business activity, tax generation, population increase and density in historic neighborhoods versus non-historic neighborhoods, we see how the efforts of preservationists in Indianapolis have secured a bright future for a city that has struggled with population loss.
PRODUCTIVE
Monument Circle. Photo Credit: Raina Regan13

33%
18%
0%5%
10%15%
20%25%30%35%40%
Historic Districts Rest of Compact Area
Percent Workers Under the Age of 30
84%
16%
Jobs in Local Historic Districts
All City Jobs (inside compact area) Historic Districts
The 4 percent of the city that makes up local historic districts contains 16 percent of the jobs. As the capital city and entertainment hub of the state, Indianapolis maintains a large share of jobs in the accommodation and food service industry. Nearly a quarter of those jobs are located in historic districts.
IMPACT ON JOBS & EMPLOYMENT
Indianapolis is understandably proud of its growth in recent years. The city has attracted the kind of demographic that all cities are clamoring for: young professional workers, particularly in the tech/knowledge industries.
Local historic district workers are measurably young, 33 percent are under the age of 30 compared to 18 percent in the rest of the compact area.
This in-migration of young, educated workers is a positive sign for the future of Indy’s economic growth, but the location of those jobs and the decision of those firms to locate in historic districts or historic buildings is not random.
14

TAX GENERATIONThe fiscal health of a city depends largely on the revenue it receives and the effectiveness of distributing its resources. The municipality relies on property taxes to pay for public school teachers, police, and other public services. Indianapolis local historic districts contribute taxes at a rate disproportionately higher than their land area would suggest. The 4 percent land area contributes 15 percent of the total assessed value inside the Urban Compact Area and 5 percent of the total value of the city. On a per-square mile basis, these local historic districts are 4 times as valuable as non-designated acres inside the Urban Compact Area.
DENSITYThe benefits of the compact built environment in the local historic districts are numerous. The city’s historic districts are providing critical density through neighborhoods of closely spaced, modestly sized buildings. This is often identified as “density at a human scale” because while high rise apartment buildings and skyscrapers add density, they do not do so at a walkable, human scale that offers sunny sidewalks, neighborhood connection—quality of life.
4%
16%21%
28%
0%
5%
10%
15%
20%
25%
30%
Land Area ofHistoric Districts
Jobs in HistoricDistricts
Accommodation& Food Service
Professional,Scientific,TechnicalServices
Historic Districts and Job AttractionOver 28 percent of jobs in the professional, scientific, and technical services category are located in historic districts. 11 percent of these jobs are in arts, entertainment, and recreation. Indianapolis’ historic districts are attracting a talented, educated working class.
$- $100,000,000 $200,000,000 $300,000,000 $400,000,000 $500,000,000 $600,000,000 $700,000,000 $800,000,000 $900,000,000
$1,000,000,000
Historic Districts Urban CompactArea
Total Value Per Square Mile
4,409
3,251
-
1,000
2,000
3,000
4,000
5,000
Historic Districts Rest of the Compact Area
Population Per Square Mile
15
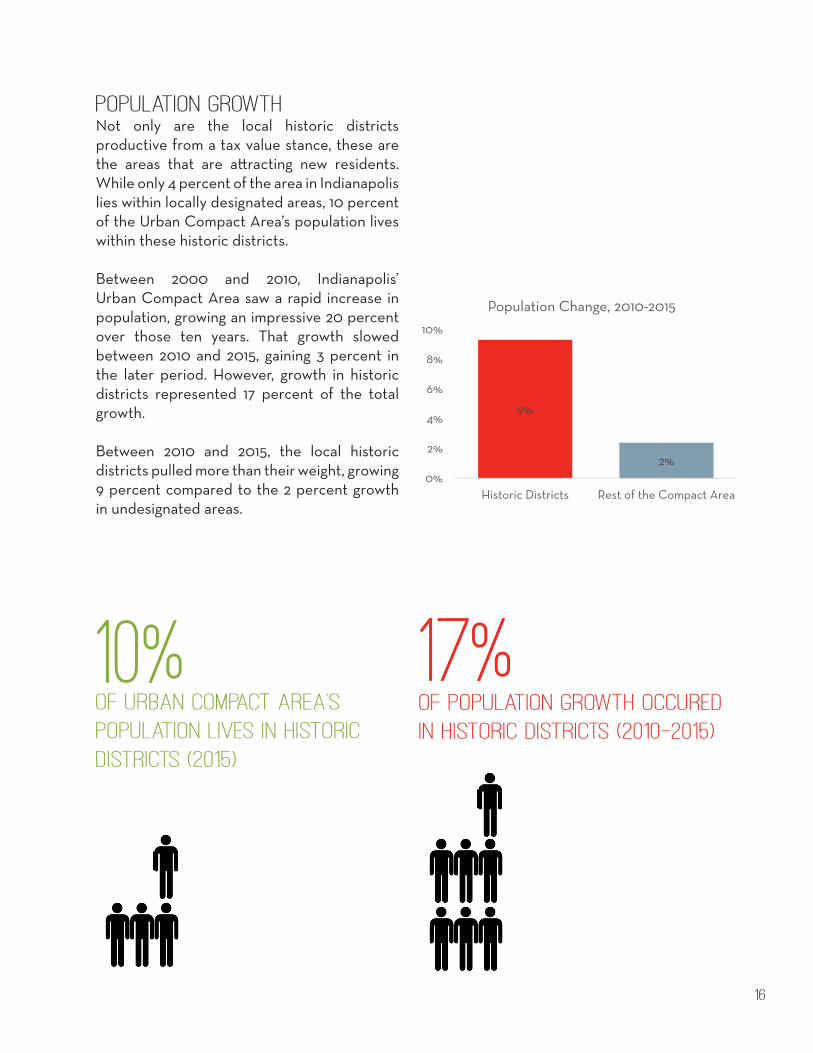
POPULATION GROWTH Not only are the local historic districts productive from a tax value stance, these are the areas that are attracting new residents. While only 4 percent of the area in Indianapolis lies within locally designated areas, 10 percent of the Urban Compact Area’s population lives within these historic districts.
Between 2000 and 2010, Indianapolis’ Urban Compact Area saw a rapid increase in population, growing an impressive 20 percent over those ten years. That growth slowed between 2010 and 2015, gaining 3 percent in the later period. However, growth in historic districts represented 17 percent of the total growth.
Between 2010 and 2015, the local historic districts pulled more than their weight, growing 9 percent compared to the 2 percent growth in undesignated areas.
10%OF URBAN COMPACT AREA’S POPULATION LIVES IN HISTORIC DISTRICTS (2015)
9%
2%0%
2%
4%
6%
8%
10%
Historic Districts Rest of the Compact Area
Population Change, 2010-2015
17%OF POPULATION GROWTH OCCURED IN HISTORIC DISTRICTS (2010-2015)
16

DOWNTOWN REVITALIZATIONWhile about 11 percent of Indianapolis’ downtown is made up of historic districts, they once again contribute a disproportionate amount of income generation, containing nearly 39,000 jobs, which is 26 percent of all of the jobs downtown.
26%OF DOWNTOWN JOBS ARE LOCATED IN HISTORIC DISTRICTS
Local Historic Districts
HISTORIC DISTRICTS LOCATION IN DOWNTOWN
17

HISTORIC REHABILITATION TAX CREDITSThere have been 58 federal historic rehabilitation tax credit projects in Indianapolis between 2002-2016. Of those, 28 have been in the downtown area, representing over $250,000,000 in investment. Landmarks such as Union Station, Circle Theater, and the Real Silk Hosiery Mill are examples.
A tax credit is a dollar-for-dollar offset of income taxes that would otherwise be paid. The federal tax credit is 20 percent of qualified rehabilitation expenditures for eligible income-producing buildings listed on the National Register of Historic Places. Historic rehabilitation tax credits are only awarded after the project is completed to rehabilitation standards certified by the Indiana State Historic Preservation Office and the National
Penn Arts Building by Reverie
Park Service. Unlike some other tax incentives, the historic tax credit is an investment in a long-term capital asset, Indianapolis’ historic resources. It has led to the redevelopment of some of the city’s iconic structures, created jobs and new businesses, improved property values, and fostered civic pride.
Some 35 states also have historic tax credits, a vast majority of them are a mirror of the federal historic tax credit. From 2002 to 2015, Indiana had a tax credit program. In 2015, the commercial program was eliminated but a 20 percent residential rehabilitation tax credit remains.
In 2017, the federal historic tax credit was retained in the tax reform efforts. This effort was crucial for Indianapolis, as redevelopment efforts such as the Coca-Cola Bottling Plant are counting on the historic tax credit for economic development success.
SPOTLIGHT Project Name: Penn-Arts ApartmentsAddress: 111 E. 16th StreetYear: 2011Cost: $1,462,795Use: Commercial, Residential
18

11 OF INDIANAPOLIS’ 16 “HOT SPOTS” ARE IN HISTORIC DISTRICTS
Preservation advocates have long known that historic neighborhoods are magnets for entrepreneurial creatives, artists, and consumers seeking authentic experiences. But what anecdotal evidence exists? In February of 2018, the Washington Post released an article describing Indianapolis as a “scrappy, creative community determined to make art part of the everyday Indy.”1 Indianapolis is home to a vibrant arts and culinary scene, and the city’s historic neighborhoods are helping it thrive. Of the 16 places to go, eat, shop, stay, and explore outlined in the article, 11 are located in local historic districts. Those hot spots and hangouts cover more than just the guidebook must-sees. The list reveals that Indianapolis’ favorite local haunts are located in local historic districts as well, from Slippery Noodle Inn—Indiana’s oldest continuously operating bar—to Action and Atomic Duckpin Bowling—a turquoise and white bowling alley pulled straight out of the 1950s. The people of Indianapolis crave authenticity, and the proof is in their preferences.
1 Silver, Kate, “Things to Do in Indianapolis,” https://www.washingtonpost.com/graphics/2018/lifestyle/vacation-ideas/things-to-do-in-indianapolis/?utm_term=.906bf979b30f
Mass Ave. Photo Credit: Indiana Landmarks.
19

CRAFTED BY INTENT: INDY PLAN 2020
“From the original Mile Square plan on which the city was founded, to the Parks and Boulevards system plan of George Kessler, to the Amateur Sports Capital of the World strategy that culminated in Indianapolis hosting the 2012 Super Bowl. Indy has always been crafted by intent.” - Plan 2020
Indy Plan 2020 is a community planning initiative that bridges the numerous existing plans, ideas, and visions of the Indianapolis region into one vision. The roadmap leverages community talent, existing assets, data metrics, and economic growth. The resulting documents are the collective vision of the citizens of Indianapolis. How does historic preservation advance the goals of Indy Plan 2020? The findings in this study show that the city’s historic preservation program and the dense, character-rich, tree-lined, walkable, economically vital neighborhoods it preserves are an indispensable component towards meeting the goals.
Lockefield Gardens. Photo Credit: Raina Regan
20

Often the word resilience is used synonymously with environmental sustainability. But urban resilience demands a more holistic view of the city. Resiliency refers to the capacity for cities to change and adapt in the face of daily and chronic stresses—whether those stresses are a natural disaster or a housing crisis.
RESILIENT
Ovid Butler House in Old Northside. Photo Credit: Raina Regan21

For most Hoosiers—unless they enjoy cruising along the White River in a private yacht—their largest asset is their house. Some see the value of that house as a source of funds for a comfortable retirement. For others, the house may be the legacy they leave to their children. For these reasons and more, Hoosiers are right to be concerned about restrictions that may reduce the value of their property. Homeowners sometimes oppose historic districts because of a belief that another layer of regulations will diminish the value of their primary asset. This analysis evaluated the relationship between historic districts, foreclosures, and property values over nearly 15 years.
FORECLOSURE RATES The first decade of the 21st century was a volatile one for real estate in the United States. In late 2007, the Great Recession began, and its first victim was residential real estate. Between 2008 and 2012, the foreclosure rate for single family homes in Indianapolis reached a staggering 26 percent. But those with homes in local historic and conservation districts—while also hit hard by the recession—fared much better with just 6 percent foreclosure rates.
This lower foreclosure rate is not because residents of historic districts never lose their job, get a divorce or run up the credit card balances too much. Rather, it seems to be that because the demand for those houses is more stable and the value change less volatile when prices are in decline, a homeowner in financial trouble can get the property sold before the foreclosure process begins.
HISTORIC DISTRICTS AS STABILIZERS
6% 6%
26%
0%
5%
10%
15%
20%
25%
30%
Foreclosure Rate Single Family Houses2008 - 2012
Local Historic Districts Conservation Districts Rest of the City
22

80.0
90.0
100.0
110.0
120.0
130.0
140.0
150.0
160.0
170.0
2003 2004 2005 2006 2007 2008 2009 2010 2011 2012 2013 2014 2015
Long Term Change in Value2003 = 100
Local District Conservation District
National District Not in a District
80.0
85.0
90.0
95.0
100.0
105.0
110.0
115.0
2008 2009 2010 2011 2012 2013 2014 2015
The Impact of the Real Estate Crash
Local District Conservation District
National District Not in a District
0%
4%5%
7%
11%13% 14%
16% 16%
26%
0%
5%
10%
15%
20%
25%
30%
Foreclosure Rate Local Historic Districts2008 - 2012
In fact, every local historic district had a foreclosure rate lower than the rest of the city. A measurable testament to the stability that historic preservation provides.
PROPERTY VALUES1
The real estate industry is often fixated on annual appreciation rates of single-family homes. After all, this is the way many Americans gain equity in their most prized asset. Are historic districts a good investment?
The long-term change in value data demonstrates that single-family homes in historic districts saw greater rates of appreciation than properties not designated. On an aggregate basis, local districts, conservation districts, and National Register historic districts outperformed non-designated residential properties.
These historic properties also performed better when values were in decline. While historic districts also saw decreases in value as the great recession hit, they recovered sooner and sustained their value better than the rest of the market.
1 To understand the impact of historic districts on property values, assessment data for single-family properties were evaluated and separated into average values per square foot of those within historic districts and those not in districts. Those values in each category was assigned an index of 100. Then annual change in value were measured against the base year.23

$30.00
$40.00
$50.00
$60.00
$70.00
$80.00
$90.00
2003200420052006200720082009 2010 2011 2012 2013 2014 2015
Long Term Values
Local District Conservation District
National District Not in a District
$77.82
$59.05$66.03
$55.59
$70.31
$58.95 $61.80 $61.45
$0.00$10.00$20.00$30.00$40.00$50.00$60.00$70.00$80.00$90.00
Local District ConservationDistrict
National District Not in a District
Recovery from the Real Estate Crash
2008 2015
When comparing values per square foot in the period of recovery from the real estate crash, again historic districts provide strength and stability in the market. In local and National Register historic districts, the values for properties in these districts are measurably higher in 2015 compared to the rest of the market.
HOME SALESAccording to Boxwood Means data from 2015, historic districts, which only make up 5.5 percent of properties in the city, represented nearly 20 percent of all sales and almost 35 percent of the aggregate sale amount. The market demand for historic properties in Indianapolis is strong.
This strength in the market is further reflected in the lack of neglected or abandoned properties in historic districts. Not even 2 percent of the city’s nearly 3,000 abandoned properties inside the urban context area are in historic districts.
5%
19%
34%
0%
5%
10%
15%
20%
25%
30%
35%
40%
Parcels Number of Sales Aggregate SaleAmount
Historic Districts and Home Sales
On a value per square foot basis, historic districts gained value faster than the rest of the market and have held their value over time. Local historic districts, with the most overlay design review, maintain the highest long-term value.
24

Indiana Landmarks (IL) has invested in Indianapolis over the last 50 years through their revolving loan fund and direct purchase of threatened properties. These include both covenants and easements. Both are legal documents attached to the deed of the property for its protection. The difference is that a covenant is recorded when IL either a) lends money from their revolving loan fund for a project resulting in a mortgage or b) enters the chain of title for a property, such as when they purchase the property. IL also will attach a covenant on a property if they take out an option agreement to purchase from an owner, and are successful in finding a new buyer. With a preservation easement, IL neither lends money or purchases the property. An owner desiring to protect their property can donate the right to preserve it to Indiana Landmarks, or a similar qualified easement holding non-profit. That gives IL the right to prevent demolition, conduct design review and work with owners on appropriate strategies for use of their properties. The owner retains title to the property, and can continue to own it, sell it or bequeath it to their heirs. Both easements and covenants are recorded in perpetuity. As a result, donors of easements can receive charitable tax benefits due to an anticipated reduction in the value of the property, based upon a qualified appraisal.
!(!(!(!(!(!(!(!(!(!(!(!(!(!(!(
!(!(!(!(
REVOLVING LOAN FUND OVER TIME
!(!(!(!(!(!(!(!(!(!(!(!(!(!(!( !(
!(!(!(!(!(!(!(!(
!(!(!(
!(
!(
!(!(!(!(!(!(!(!(!(
!(!(!(!(!(!(!(
!(
!(
!(
!(
!(
!(
!(
!(
!(!(!(!(!(!(!(!(!(!(!(!(!(!(
!(!(!(
!(
!(!(!(!(!(
!(!(!(!(!(!(!(!(!(!(!(!(!(!(!(
!(!(!(!(
!(!( !(!(
!(!(!(!(!(!(!(!(!(!(!(
!(!(!(!(!(!(!(
!(!(
!(
!(
!(!(!(!(!(!(!(!(!(!(!(!(!(!(!(!( !(!(!(!(!( !(!(!(
!(!(!(!(!(!(!(!(!(!(!(!(!(!(!( !(
!(!(!(!(!(!(!(!(
!(!(!(
!(
!(
!(!(!(!(!(!(!(!(!(
!(!(!(!(!(!(!(
!(
!(
!(
!(
!(
!(
!(
!(
!(!(!(!(!(!(!(!(!(!(!(!(!(!(
!(!(!(
!(
!(!(!(!(!(
!(!(!(!(!(!(!(!(!(!(!(!(!(!(!(
!(!(!(!(
1970s
1970s1980s
1970s1980s
1990s
INDIANA LANDMARKS REVOLVING LOAN FUND
25
!(!( !(!(
!(!(!(!(!(!(!(!(!(!(!(
!(!(!(!(!(!(!(
!(!(
!(
!(
!(!(!(!(!(!(!(!(!(!(!(!(!(!(!(!( !(!(!(!(!( !(!(!(
!(!(!(!(!(!(!(!(!(!(!(!(!(!(!( !(
!(!(!(!(!(!(!(!(
!(!(!(
!(
!(
!(!(!(!(!(!(!(!(!(
!(!(!(!(!(!(!(
!(
!(
!(
!(
!(
!(
!(
!(
!(!(!(!(!(!(!(!(!(!(!(!(!(!(
!(!(!(
!(
!(!(!(!(!(
!(!(!(!(!(!(!(!(!(!(!(!(!(!(!(
!(!(!(!(!(
!(!(!(!(!(!(!(!(!(!(!(!(!(!(!(!(!(!(!(
!(!(!(!(
!(
!(!(
!(
!(!( !(!(!( !(
!(
!(
!(
!(
!(
!(
!(
!(
!(
!(!(!(!(!(
!(
!(!(!(!(!(
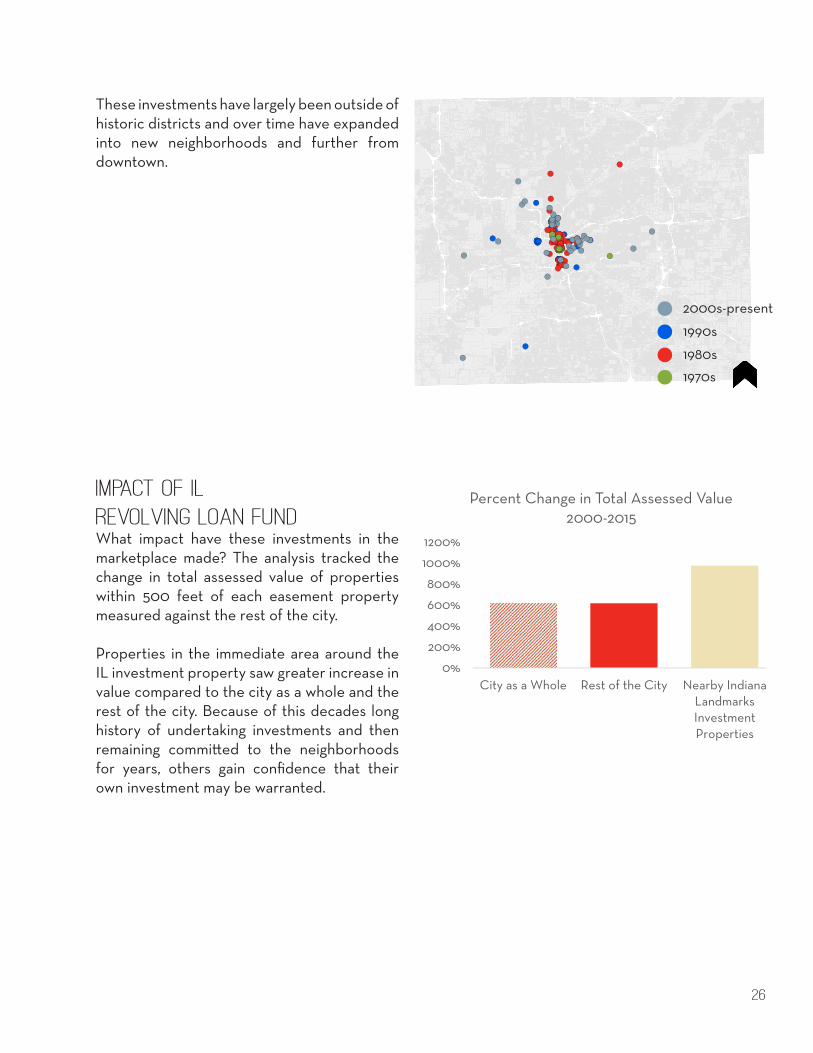
IMPACT OF IL REVOLVING LOAN FUNDWhat impact have these investments in the marketplace made? The analysis tracked the change in total assessed value of properties within 500 feet of each easement property measured against the rest of the city.
Properties in the immediate area around the IL investment property saw greater increase in value compared to the city as a whole and the rest of the city. Because of this decades long history of undertaking investments and then remaining committed to the neighborhoods for years, others gain confidence that their own investment may be warranted.
1970s1980s
1990s
2000s-present
0%
200%
400%
600%
800%
1000%
1200%
City as a Whole Rest of the City Nearby IndianaLandmarksInvestmentProperties
Percent Change in Total Assessed Value2000-2015
These investments have largely been outside of historic districts and over time have expanded into new neighborhoods and further from downtown.
26
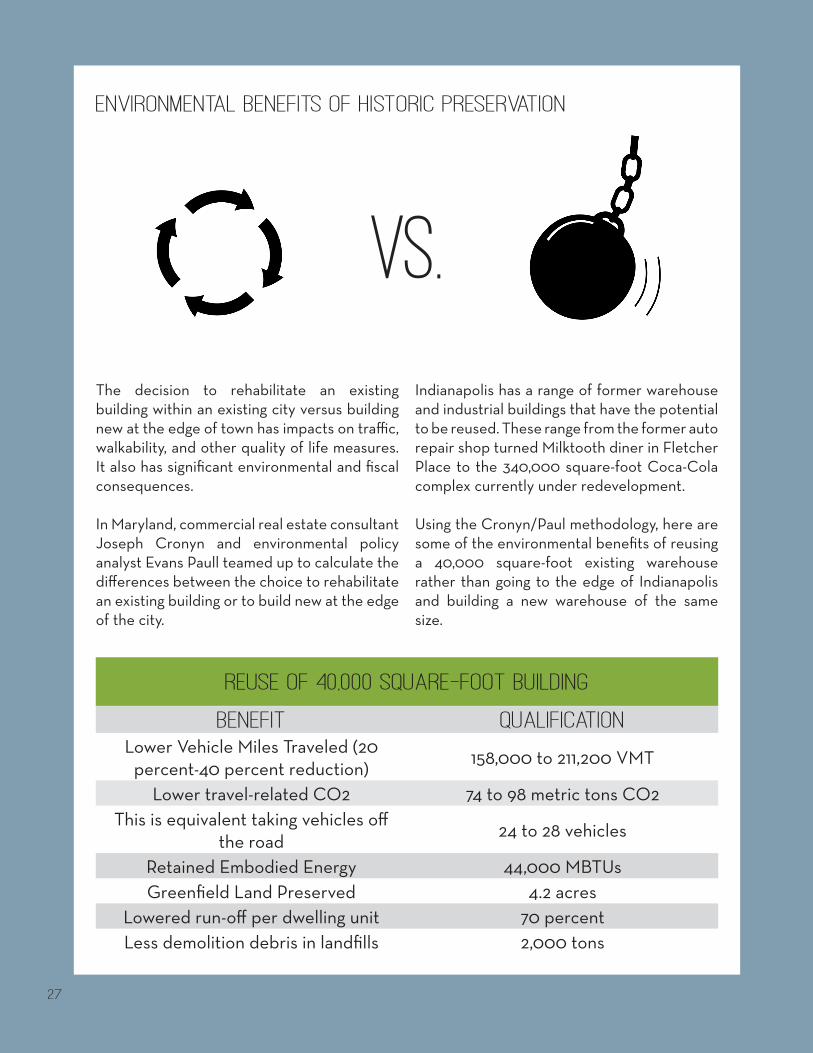
The decision to rehabilitate an existing building within an existing city versus building new at the edge of town has impacts on traffic, walkability, and other quality of life measures. It also has significant environmental and fiscal consequences.
In Maryland, commercial real estate consultant Joseph Cronyn and environmental policy analyst Evans Paull teamed up to calculate the differences between the choice to rehabilitate an existing building or to build new at the edge of the city.
ENVIRONMENTAL BENEFITS OF HISTORIC PRESERVATION
BENEFIT QUALIFICATIONLower Vehicle Miles Traveled (20
percent-40 percent reduction) 158,000 to 211,200 VMT
Lower travel-related CO2 74 to 98 metric tons CO2This is equivalent taking vehicles off
the road 24 to 28 vehicles
Retained Embodied Energy 44,000 MBTUsGreenfield Land Preserved 4.2 acres
Lowered run-off per dwelling unit 70 percentLess demolition debris in landfills 2,000 tons
Indianapolis has a range of former warehouse and industrial buildings that have the potential to be reused. These range from the former auto repair shop turned Milktooth diner in Fletcher Place to the 340,000 square-foot Coca-Cola complex currently under redevelopment.
Using the Cronyn/Paul methodology, here are some of the environmental benefits of reusing a 40,000 square-foot existing warehouse rather than going to the edge of Indianapolis and building a new warehouse of the same size.
VS.
REUSE OF 40,000 SQUARE-FOOT BUILDING
27

A tour of Irvington. Photo Credit: Indiana Landmarks
Old Northside. Photo Credit: Raina Regan 28

CENTRAL STATE HOSPITAL The Central State Mental Hospital is a historic campus west of downtown Indianapolis built between 1848 until 1994. The campus was purchased by the City of Indianapolis in 2003, and went through a series of redevelopment stages. The property is now the site of new housing, rehabilitated mixed-use spaces, and industrial, arts, and nonprofit offices.
Reverie Estates, known for their revitalization of the Penn Arts building took on the Central State Mansion in 2012. They discovered the property in 2012 and bought it in 2014 in a collaborative effort with the City of Indianapolis. The rehabilitated administration building is converted into a mixed-use “Central State Mansion” with apartments, cowork spaces, and studios. The 67 room building is home to many students and young professionals. According to Chris Piazza of Reverie, “This redevelopment has led to a shift in perspective about the West Side. And it’s fulfilling to be able to transform buildings. When you have gems like this sitting around, why not?” Reverie also rehabilitated the former men’s dining hall into the 1899 events venue.
One of the first tenants on the grounds was Ignition Arts founded by artist Brian McCutcheon. Ignition Arts employs 10 people fabricating and constructing art installations for artists from around the world. “The space couldn’t be more perfect, the space is beautiful, no posts to interfere, completely undeveloped,” said McCutcheon.
A recent tenant to the cafeteria building, Project One Studio was founded in 2009 by Ball State University graduates Adam Buente and Kyle Perry. Both Indiana natives, the firm started out in a small historic commercial building along the railroad tracks
in downtown Muncie. In 2017, they made the move to a bigger space on the Central State campus. Here they have plenty of space for their design and fabrication of custom architectural installations, and private and public art commissions. With clients such as the Evansville Museum of Arts, History, and Science, Riley Hospital for Children, and the City of Muncie, the operation keeps growing. The forklift should have more than enough vertical height in the new space.
The arts–related businesses are numerous at Central State. The nonprofit People for Urban Progress — or “PUP” — is a nonprofit that transforms old materials into new designs. Their projects include salvaging the seats from the former Bush Stadium and repurposing them for IndyGo bus stops. They moved from their downtown office location to Central State to have more space and because of the culture and creativity the rehabbed spaces provide.
The willingness of the City of Indianapolis to take on this site is paying dividends. The flurry of activity that now takes place on a daily basis at Central State serves as an anchor for entire the west side. There are still buildings to be rehabbed on the site, including the vacant power house. The redevelopment opportunities are endless with Central State.
A) Ignition Arts Space, photo by author. B) Brian McCutcheon, founder of Ignition Arts in his shop, photo by Michelle Pemberton. C) Adam Buente and Kyle Perry, founders Project One Studio, photo by Michelle Pemberton. D) Forklift and interior of Project One Studio shop, photo by Project One Studio. E) Floor tile and namesake of 1899, photo by 1899 Indy. F) Exterior of 1899, photo by 1899 Indy. G) Exterior of Ignition Arts, photo by author.
29

A B
CD
E F
G30

The character and quality of historic districts in Indianapolis offer massive financial contributions. Historic districts provide disproportionately high tax revenue, stable property values, job creation, and more. While quality of life measures may on the surface seem elusive or based on arbitrary aesthetics, there are, in fact, ways to assess what draws people to a city and what makes them stay.
LIVABLE
A tree-lined street in Cottage Home. Photo credit: Raina Regan. 31

While a city’s future vitality will, in part, focus on whether a younger demographic is drawn there, most quality of life measures transcend age, race, and gender, creating diverse, mixed income neighborhoods with a healthy work/life blend. By looking at both the fiscal and recreational assets of Indianapolis, we see a striking pattern emerge.
ACCESS TO CULTURAL AMENITIESAccording to the Urban Land Institute’s Building Healthy Places Initiative, “50 percent of U.S. residents say that walkability is a top priority or a high priority when considering where to live” and, according to the U.S. Census, “bicycling has become the country’s fastest-growing form of transportation for commuters.”1
Almost 40 percent of properties in local historic districts are within .25 miles of a bike lane.
1 “Active Transportation and Real Estate: The Next Frontier,” The Urban Land Institute, Healthy Places Initiative, March 2016, http://americas.uli.org/wp-content/uploads/sites/125/ULI-Documents/Active-Transportation-and-Real-Estate-The-Next-Frontier.pdf
QUALITY OF LIFE MEASUREMENTS
39%23%
0%
10%
20%
30%
40%
50%
All Historic Districts Rest of the City (incompact area)
Percent Properties Within .25 miles of Bike Lane
32

Over half of properties in local historic districts are within .25 miles of a park, compared to 47 percent of non-designated properties.
Indianapolis voters declared in 2016 that transit options are important to them with 60 percent supporting an income tax for transit projects. Local historic districts are already well-serviced by bus routes.
53%
47%
42%44%46%48%50%52%54%
All Historic Districts Rest of the City (incompact area)
Percent Properties Within .25 miles of Parks
91%
80%70%
75%
80%
85%
90%
95%
Historic Districts Rest of the City (incompact area)
Percent Properties Within .25 miles of Bus Stops
LIVE–WORK PATTERNS Quality of life of residents is certainly a major deciding factor in where to live. For many, the time spent getting to work and back home is a significant quality of life variable. The density and central location of Indianapolis historic districts have implications for the live-work balance. While the average commute in the Indianapolis is 23 minutes, nearly 35 percent of households in historic districts commute less than 15 minutes. This also affects the quality of life of residents, as more time spent commuting means less time spent with family, exercising, and contributing to the community.
33%25%
0%5%
10%15%
20%25%30%35%
Historic Districts Rest of Compact Zone
Households with 15 minute Commute
33
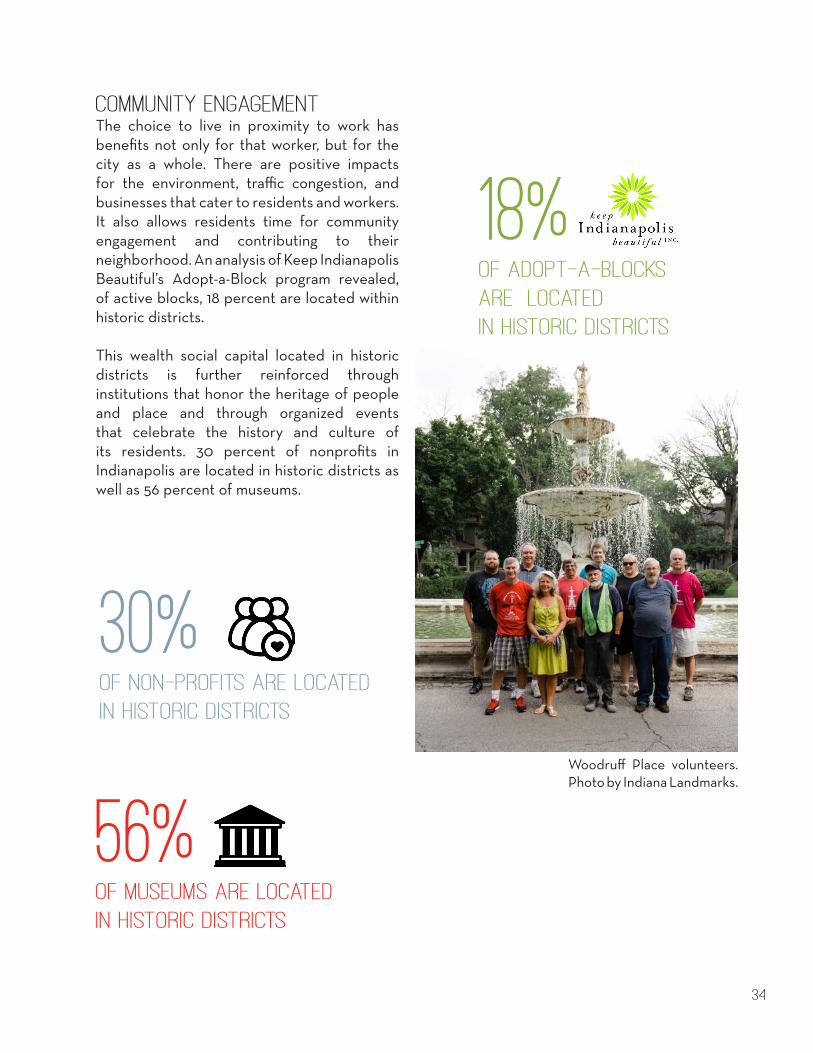
COMMUNITY ENGAGEMENTThe choice to live in proximity to work has benefits not only for that worker, but for the city as a whole. There are positive impacts for the environment, traffic congestion, and businesses that cater to residents and workers. It also allows residents time for community engagement and contributing to their neighborhood. An analysis of Keep Indianapolis Beautiful’s Adopt-a-Block program revealed, of active blocks, 18 percent are located within historic districts.
This wealth social capital located in historic districts is further reinforced through institutions that honor the heritage of people and place and through organized events that celebrate the history and culture of its residents. 30 percent of nonprofits in Indianapolis are located in historic districts as well as 56 percent of museums.
Woodruff Place volunteers. Photo by Indiana Landmarks.
18%OF ADOPT-A-BLOCKS ARE LOCATED IN HISTORIC DISTRICTS
30%OF NON-PROFITS ARE LOCATED IN HISTORIC DISTRICTS
56%OF MUSEUMS ARE LOCATED IN HISTORIC DISTRICTS
34
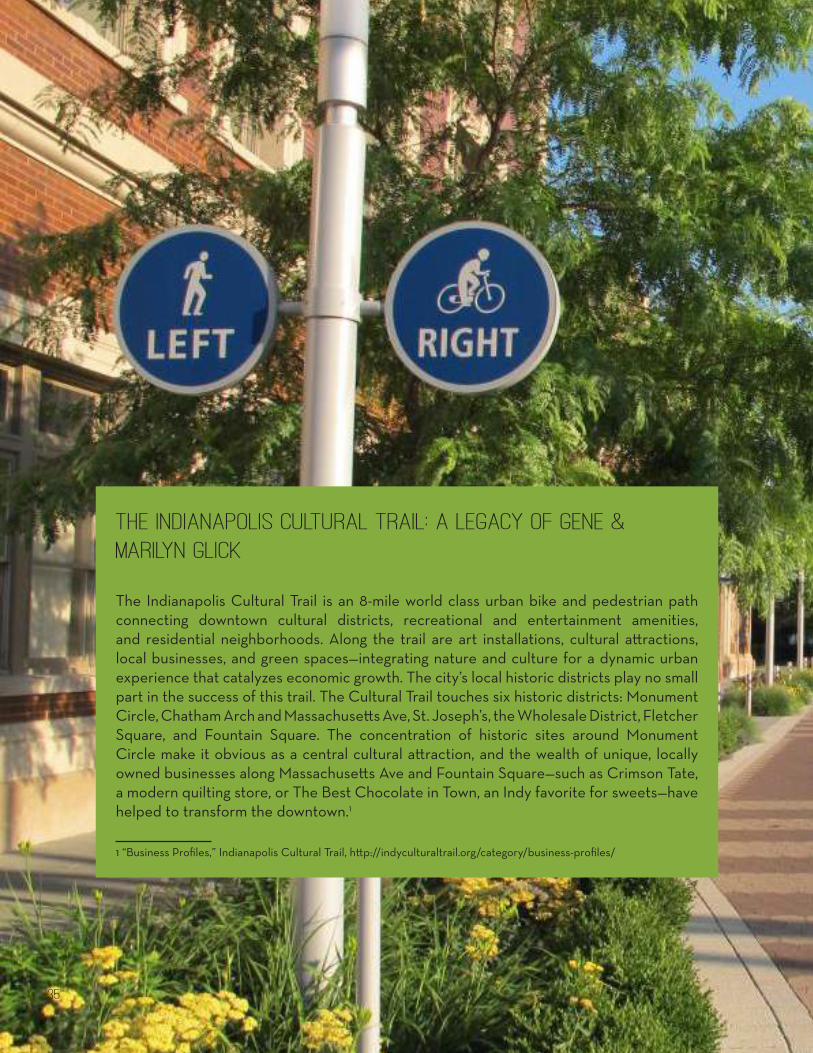
THE INDIANAPOLIS CULTURAL TRAIL: A LEGACY OF GENE & MARILYN GLICK
The Indianapolis Cultural Trail is an 8-mile world class urban bike and pedestrian path connecting downtown cultural districts, recreational and entertainment amenities, and residential neighborhoods. Along the trail are art installations, cultural attractions, local businesses, and green spaces—integrating nature and culture for a dynamic urban experience that catalyzes economic growth. The city’s local historic districts play no small part in the success of this trail. The Cultural Trail touches six historic districts: Monument Circle, Chatham Arch and Massachusetts Ave, St. Joseph’s, the Wholesale District, Fletcher Square, and Fountain Square. The concentration of historic sites around Monument Circle make it obvious as a central cultural attraction, and the wealth of unique, locally owned businesses along Massachusetts Ave and Fountain Square—such as Crimson Tate, a modern quilting store, or The Best Chocolate in Town, an Indy favorite for sweets—have helped to transform the downtown.1
1 “Business Profiles,” Indianapolis Cultural Trail, http://indyculturaltrail.org/category/business-profiles/
35

Indianapolis Cultural Trail. Photo Credit: Megy Karydes. 36

0%10%20%30%40%50%60%70%80%90%
100%
Income Distribution by District
Less than $25,000 $25,000-$50,000 $50,000-$75,000 $75,000-$100,000 $100,000+
ECONOMIC INTEGRATIONUrban vitality is built on diversity, and it has become a basic premise of placemaking that healthy neighborhoods are neither all rich nor all poor. Often, historic districts are accused of being home to only rich folks. While that may be true in some places, the historic districts in Indianapolis are home to households at both the bottom and the top of the economic rungs of the city.
Data in the aggregate can be deceptive—in many cases it is most useful and revealing to analyze demographic and economic data at the district level. Yet, even on a district-by-district basis, the local historic districts of Indianapolis are composed of a great diversity of incomes by household. Most neighborhoods are statistically similar to the distribution of income across the Urban Compact Area as a whole.
Certain historic districts, such as Lockefield Gardens—significantly known for its public housing development designed to provide safe and sanitary dwellings at a low cost—and the Fountain Square Historic Commercial District, are home to over 50 percent of households making less than $25,000.
Meanwhile, the Meridian Street, Monument Circle, and Wholesale districts have a greater share of households making more than $100,000. Fletcher Place displays a remarkably even distribution of wealth across all brackets. The historic districts of Indianapolis, with their gamut of income dispersal, truly exemplify the concept of economic integration.
30% 35%
21%
29%
16%
16%10%
9%23%
10%
0%
10%
20%
30%
40%
50%
60%
70%
80%
90%
100%
Historic Districts Rest of Compact Area
Household Incomes
Less than $25,000 $25,000-$50,000 $50,000-$75,000
$75,000-$100,000 $100,000+
37
0%2%4%6%8%
10%12%14%16%
Percent Hispanic/Latino
74%61%
17%
27%
3%2%
6% 10%
0%
10%
20%
30%
40%
50%
60%
70%
80%
90%
100%
Historic Districts Rest of Compact Area
Race
White Black Asian Other
0%10%20%30%40%50%60%70%80%90%
100%
Race by District
White Black Asian Other
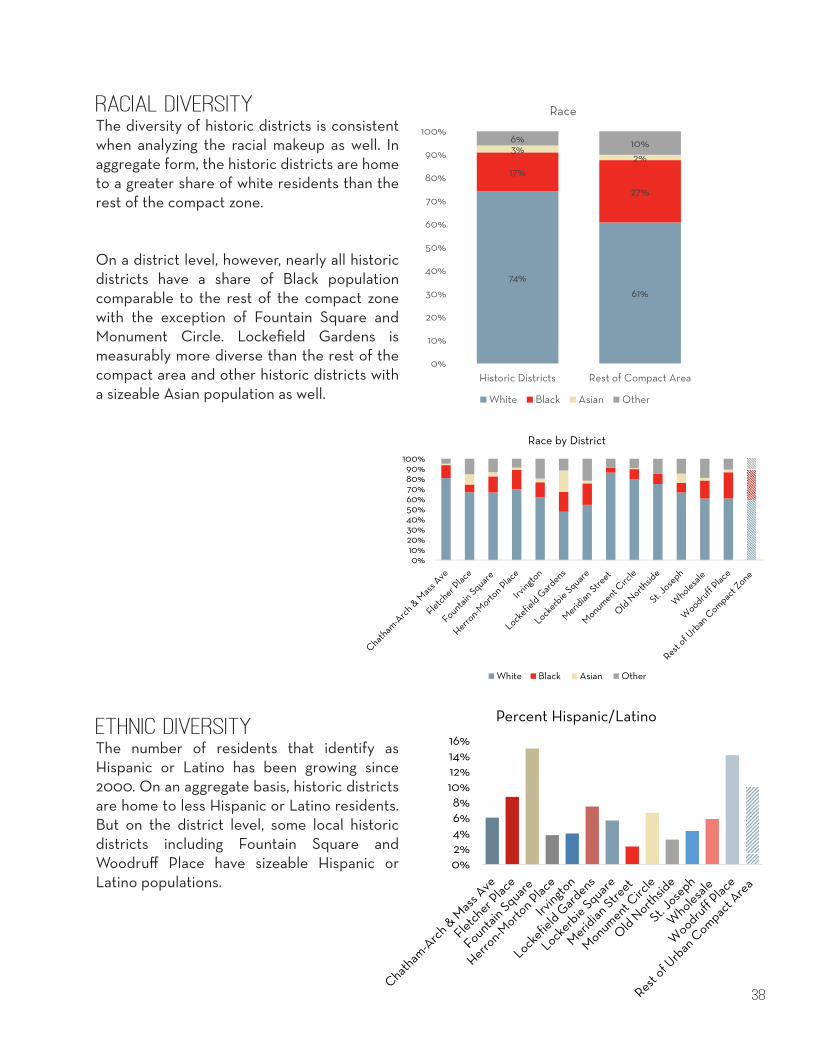
RACIAL DIVERSITYThe diversity of historic districts is consistent when analyzing the racial makeup as well. In aggregate form, the historic districts are home to a greater share of white residents than the rest of the compact zone.
On a district level, however, nearly all historic districts have a share of Black population comparable to the rest of the compact zone with the exception of Fountain Square and Monument Circle. Lockefield Gardens is measurably more diverse than the rest of the compact area and other historic districts with a sizeable Asian population as well.
ETHNIC DIVERSITYThe number of residents that identify as Hispanic or Latino has been growing since 2000. On an aggregate basis, historic districts are home to less Hispanic or Latino residents. But on the district level, some local historic districts including Fountain Square and Woodruff Place have sizeable Hispanic or Latino populations.
38

CONCLUSION The public recognition of Indianapolis’ historic resources began over 50 years ago. In Indianapolis, like much of the country, historic preservation began with nearly exclusive focus on the architectural character of buildings and monuments. Since that time, historic preservation has become much more than architectural gems. Historic preservation is a tool to publically recognize the significance of all types of built assets of those who made Indianapolis their home—Native Americans, early pioneers, industrial powerhouses, colleges, women, minorities, LGBT communities, and others.
Maybe the most significant factor is that young people are moving to and staying in Indianapolis. They are not looking to re-create the past. Instead they are creating, making, and contributing to the future of Indianapolis. This report shows that these young people see the character and quality of historic buildings as vital to that future.
The preservation and reuse of these resources provides Indianapolis with productive, resilient, and livable neighborhoods. As Indianapolis moved forward with Indy Plan 2020, historic preservation is an indispensable component towards achieving the vision. In fact, the 4 percent of Indianapolis located in local historic districts, home to 10 percent of the population, are already fulfilling the Indy Plan 2020 goals.
39

Cobblestone Street in St. Joseph. Photo credit: St. Joseph Neighborhood Association.
Architectural details on a home in Old Northside. Photo credit: Raina Regan.
Coca-Cola Bottling Plant, prior to renovations. Photo by author.
Architectural details on the Athenaeum. Photo credit: Raina Regan.

ACKNOWLEDGEMENTSThe authors would like to acknowledge the following people for their input. These individuals were interviewed to provide an on-the-ground look at how historic preservation projects have impacted their community. We appreciate all of the stakeholders across the city that took the time to meet and speak with us, and show us the sites and projects they care deeply about.
Margaret Banning, Irvington Development Corporation Adam Buente, Project One StudioJoe Jarzen, Keep Indianapolis BeautifulBrian McCutcheon, Ignition ArtsKyle Perry, Project One StudioChris Piazza, Reverie Estates
The following individuals served as an advisory panel for the study:
David Baker, Indianapolis Historic Preservation Commission (retired)Brad Beaubien, Department of Metropolitan Development, City of IndianapolisBill Browne, FAIA, Indianapolis Historic Preservation CommissionMichael Cox, Core RedevelopmentJoe Giacoletti, Giacoletti AppraisalsJim Kienle, FAIA, Indianapolis Historic Preservation CommissionSallie Rowland, ASID, Rowland Design and Board Member, Indiana LandmarksPaul Smith, Southeast Neighborhood Development, Inc.Bill Taft, Local Initiatives Support Corporation, IndianapolisSusan Williams, Indianapolis Historic Preservation Commission
Indiana Landmarks StaffMarsh Davis, President Mark Dollase, Vice President of Preservation ServicesSuzanne Stanis, Director of Heritage Education and Information
Indiana War Memorial. Photo credit: Raina Regan. 41

PROJECT TEAM
This report was prepared and written by Donovan Rypkema, Briana Grosicki, and Katlyn Cotton of PlaceEconomics. Rypkema is principal of PlaceEconomics, a Washington D.C.-based real estate and economic development consulting firm. He is author of The Economics of Historic Preservation: A Community Leader’s Guide and an adjunct professor in the Historic Preservation Program at the University of Pennsylvania. Grosicki is Director of Research at PlaceEconomics and a former resident of Indiana. Cotton is a Research Associate with PlaceEconomics and recent graduate in historic preservation from the University of Pennsylvania.
METHODOLOGIESThis analysis relied on data from the City of Indianapolis, Marion County, Indiana Landmarks, Keep Indianapolis Beautiful, other state and federal databases, local city offices, nonprofits, online research platforms, newspaper and social media outlets, and in-person stakeholder interviews.
• Tax credit data from the National Park Service
• Property tax value data from Marion County Assessor's Office
• Foreclosure data from RealtyTrac• Population data from the U.S. Census Bureau
PlaceEconomics
Snowy Lockerbie Square. Photo credit: Raina Regan. 42

Indiana Landmarks saves the places that shape Hoosier lives and distinguish communities, repurposing and revitalizing vintage structures rather than throwing them away.
With nine offices located throughout the state, the private nonprofit organization saves landmarks because they improve property values, promote tourism, and inject vitality into neighborhoods and business districts. To learn more and to join, visit
www.indianalandmarks.org | 317-639-4534