making the connections - rtpscs.scag.ca.govrtpscs.scag.ca.gov/documents/2008/fgoods_movement.pdf ·...
TRANSCRIPT

SOUTHERN CALIFORNIA ASSOCIATION OF GOVERNMENTS
RTPMaking the Connections
REGIONAL TRANSPORTATION PLAN2008

GOODS MOVEMENT
Economic Impacts of Goods Movement 1
International Trade 1
Local Manufacturing and Logistics Industry 2
Cross-Border Trade Activity 5
Existing Regional Goods Movement System 5
Maritime Activity 7
Port Related Rail Activities: On-dock, Near-dock and Off-dock facilities 7
Rail Characteristics 11
Mainline Rail 11
Rail System Constraints and Issues 12
Trucks 13
Port Related Trucking 13
Local Trucks 15
Environmental Impacts 19
Safety and Security Concerns 20
SCAG’s Regional Strategies 23
Regional Truck Strategies 23
Regional Rail Strategies 25
Goods Movement High Speed Rail Transport (HSRT) for Freight 32
Inland Port Strategy 32
Next Steps 33
Appendix A: Comparison of Port Truck Volumes to Total Daily Truck Volumes on
Regional Roadways, Year 2003 34
Appendix B: Truck-involved Traffic Collisions in Southern California 36
Appendix C: Freight Rail Electrification Report of Findings 40
Electrification Costs 40
Electrification Milestones and Durations 44
Electric Power Consumption 45
Key References by Topics 45
Appendix D: San Pedro Bay Port Goods Movement Strategies 47
On-dock Rail Capacity Enhancements 47
Reduction in Truck Trips and Truck VMT 47
Emission Reduction 49
Productivity Benefits 49
PierPass Off-Peak Program 50
Virtual Container Yards 52
Port Clean Air Action Plan Projects 55
Environmental and Public Health Issues 56
Emission Reductions from CAAP Measures 57

G O O D S M O V E M E N T R E P O R T 1
Goods movement activities thrive in the SCAG region because of the
numerous advantages the region offers, including deep-water marine
ports, highly developed networks of highways and railways, an abun-
dance of trans-loading facilities, and a large internal market. As a re-
sult, the region serves as a major gateway for both international and domestic
commerce, with goods movement being the fastest growing segment of the
region’s transportation sector. Additionally, goods movement plays a vital
role in the local, regional, state, and national economies with one out of every
seven jobs in Southern California linked to trade related industries.
While all projections indicate continued robust growth in trade volumes, the
existing goods movement system is highly constrained. Over time, this trend
will undermine the efficiency, reliability, and productivity of the system, and
contribute to negative environmental and community impacts. Without
improvements to the current system, projected growth in trade will worsen
traffic congestion, pushing the region toward massive gridlock. Ultimately,
this will lead to delays in goods delivery, which will increase costs to consum-
ers and reduce quality of service, potentially undermining the region’s com-
petitive advantages. Additionally, the air quality and public health effects of
diesel emissions are expected to worsen if no action is taken to mitigate these
negative impacts. Current research suggests that health impacts associated
with diesel emissions include lung malfunctioning, arterial thickening, birth
defects, low birth weights, premature deaths, and increased rates of cancer
and asthma. These and other environmental and public health impacts have
increasingly led communities and policy makers to demand mitigation strate-
gies and challenge proposals for infrastructure capacity enhancements.
Goods movement activities in the SCAG region have enormous impacts on the
local, regional, state, and national economies, as well as local residents’ qual-
ity of life. Infrastructure constraints, their associated impacts on operational
efficiency, and associated adverse health impacts are critical issues which will
continue to impact the SCAG region throughout the RTP period and beyond,
requiring a coordinated regional framework to realize accelerated infrastruc-
ture improvements. As such, this RTP proposes three key goods movement
strategies to address these challenges.
Freight Rail Investments, which consist of accelerating mainline capac-1.
ity, grade separations, and locomotive engine upgrades;
Dedicated lanes for clean technology trucks, which focus upon adding 2.
roadway capacity along truck intensive corridors; and
High-Speed Regional Transport (HSRT) for freight, which includes explo-3.
ration of HSRT systems that can provide greater freight throughput and
reliability, with near zero emissions.
Economic Impacts of Goods Movement
INTERNATIONAL TRADE
Trade activities in the SCAG region produce a wide range of economic impacts
at the local, regional, state, and national levels, and generate significant em-
ployment opportunities ranging from entry level to white-collar managerial
positions. Businesses and services supported by trade activities include whole-
sale, supply chain management, courier services, vessel operations services,
cargo handling, surface transportation (rail and truck), air cargo, trade finance,
freight forwarding, customs brokers, insurance, and government agencies.
The total trade value of containerized trade through the San Pedro Bay ports
(the Ports of Los Angeles and Long Beach) was $256 billion in 2005. Accord-
ing to the U.S. Department of Transportation, the Port of Los Angeles became
the nation’s most valuable trade conduit in 2003 surpassing John F. Kennedy
International Airport for total value of goods imported and exported through
a freight gateway. The total economic output associated with international
containerized trade through the Ports in 2005 was approximately $364 bil-
lion. Containerized trade has generated, directly or indirectly, approximately
$107.5 billion in income, approximately 3.3 million jobs, and $28.3 billion
in state and local taxes, as shown in Table 1. However, it is important to note

2 G O O D S M O V E M E N T R E P O R T
that the majority of these tax revenues were not reinvested to provide capacity
enhancements to the regional goods movement system.
TABLE 1 SUMMARY OF TRADE IMPACTS FOR CONTAINERIZED TRADE
VIA THE PORTS OF LOS ANGELES AND LONG BEACH IN 2005
($ BILLIONS)
Item Exports Imports Total
Trade Value $35.4 $220.6 $256.0
Economic Impacts:
Output $78.7 $285.2 $364.0
Income $18.8 $88.3 $107.5
Total Jobs 446,000 2,840,000 3,306,000
State & Local Taxes
$2.0 $26.3 $28.3
Source: BST Associates, PIERS, US Department of Commerce, U.S. Bureau of Economic Analysis, WISER Trade.
LOCAL MANUFACTURING AND LOGISTICS INDUSTRY
Although the region’s manufacturing sector has been declining, it is still one
of the largest in the nation. Los Angeles County ranks 1st, Orange County
8th, and the Riverside-San Bernardino area 16th largest in the nation. These
data indicate that the region represents a significant market for all types of
suppliers. Major products produced in the region include computer & elec-
tronic products, apparel, transportation equipment, fabricated metal products,
plastics & rubber products, textile and food. Most of the region’s manufactur-
ing centers are clustered in the area bounded by SR-60, I-710 and Los Angeles/
Orange county line, the South Bay area, the San Fernando Valley, the San
Gabriel Valley (the City of Industry), and northern parts of Orange County
and Inland Empire.
According to studies by Dr. John Husing, the manufacturing sector historically
played a key role in the regional economy by providing upward income mo-
bility to entry-level workers with marginal education. Manufacturing has en-
abled unskilled workers to gain necessary skills and experience via on-the-job
training, and given them the means to enter the middle class. Recent technol-
ogy advancements, however, have increased operational efficiency and have
led to significant declines in employment demand for this sector. Another
factor contributing to this trend is the high cost of conducting business in
Southern California, including increasing workers compensation costs, rising
energy costs, and an expensive housing market. These high costs and the need
to compete in the global marketplace, have increasingly led manufacturers to
outsource their activities to achieve lower costs. As a result, international
trade continues to grow rapidly in the region, as goods and products manufac-
tured overseas are shipped to the United States through Southern California’s
ports. This has created an exponential growth in the logistics sector, as these
imported goods are transported from Southern California’s ports to the rest of
the United States. Current data suggests that Southern California’s logistics
sector will continue to experience both sustained and rapid growth well into
the future.
The logistics industry is now filling the employment needs created by the re-
gion’s declining manufacturing sector. Similar to manufacturing, the logistics
industry provides good-paying jobs that are well above the minimum wage
for entry-level workers with limited education. The success of the logistics
industry in the SCAG region is due in part to “Just-in-Time” systems used by
the nation’s manufactures and retailers, which makes the logistics sector one
of the most capital and information-intensive industries in the region.
The locations of logistics centers tend to overlap with manufacturing centers
as these sectors are complementary to one another. Throughout the region,
warehousing, distribution, and intermodal facilities occupy more than 1.5 bil-
lion square feet of space with more than 32 million square feet currently in
development. Services provided by these facilities account for 15% of the
total U.S. market and 60% of the West Coast market. Exhibits 1 and 2 display
the distribution of warehouses and distribution centers in the SCAG region.

G O O D S M O V E M E N T R E P O R T 3
EXHIBIT 1 WAREHOUSES AND DISTRIBUTION CENTERS IN THE SCAG REGION
Source: Inland Port Feasibility Study, SCAG, 2006.

4 G O O D S M O V E M E N T R E P O R T
EXHIBIT 2 WAREHOUSES AND DISTRIBUTION CENTERS IN THE INLAND EMPIRE
Source: Inland Port Feasibility Study, SCAG, 2006.

G O O D S M O V E M E N T R E P O R T 5
CROSS-BORDER TRADE ACTIVITY
Cross-border trade activity between California and Baja California, Mexico
increased significantly following the passage of NAFTA in 1993, resulting in
economic benefits for both countries. In the SCAG region, there are three
Ports of Entry (POEs) located in Imperial County (Calexico, Calexico East and
Andrade). The total value of goods transported through these POEs increased
from $3.4 billion in 1995 to $10.8 billion in 2005. The Calexico POE was the
second busiest land crossing along the California/Baja California border with
approximately 17 million people crossing northbound in 2003 and 600,000
annual truck crossings. Incoming border-crossing truck volumes through Im-
perial County’s POEs rose from over 182,000 in 1994 to almost 322,000 in
2005, a 77% increase.
This increase in truck traffic is primarily due to the maquiladora industry,
(manufacturing / assembly plant operations along the Border), which has
grown over 472% since 1978. Caltrans estimates that border trade activ-
ity will continue to grow, with approximately 5.6 million border crossings
expected by 2030. Railroads also contribute to border-crossing trade activ-
ity. In the SCAG region, a Union Pacific rail line connects Mexicali in Baja
California to Calexico and El Centro in Imperial County. This line handles
approximately 160 railcars per day, six days a week.
Existing Regional Goods Movement System
The region’s major ports and airports handle an enormous amount of im-
ported goods, mainly from Asia, as well as exports. Goods enter and exit the
region via ocean carriers, railroads, trucks, and aircraft and are transported to
final destinations or to local warehousing and distribution centers for sort-
ing, consolidation, and distribution. Exhibit 3 illustrates the existing regional
goods movement system. The following sections discuss each of the compo-
nents in detail.

6 G O O D S M O V E M E N T R E P O R T
EXHIBIT 3 EXISTING REGIONAL GOODS MOVEMENT SYSTEM
Source: Southern California Association of Governments, ESRI StreetMap USA, Teleatlas

G O O D S M O V E M E N T R E P O R T 7
Maritime Activity
The Ports of Los Angeles and Long Beach, also known as the San Pedro Bay
(SPB) ports, constitute the nation’s busiest seaport and the fifth largest con-
tainer port complex in the world. In 2005, the Ports accounted for approxi-
mately 24 percent of all U.S. export container traffic and approximately 40
percent of import container traffic. The Ports handled 14.2 million twenty-
foot equivalent Units (TEUs) in 2005 and 15.8 million TEUs in 2006.
Table 2 shows forecasted growth for cargo containers moving through the SPB
ports through 2030. The forecasts are capacity constrained forecasts based on
current development strategies at the Ports. The US Department of Transpor-
tation has noted that unconstrained demand could be as high as 60 million
TEUs. The ability of the Ports to handle projected growth in containerized
cargo volumes is critical to the continued health of the local, regional, state,
and national economies.
TABLE 2 SAN PEDRO BAY PORTS CONTAINERIZED CARGO FORECASTS
Year TEUs (Million) Share of California Total
2006 (actual) 15.8 86.8%
2010 19.7 86.8%
2020 36.0 85.7%
2030 42.5 86.7%
Source: Growth of California Ports – Opportunities and Challenges, A Report to the Legislature, April 2007
The breakdown of cargo types and volumes received by both Ports is illus-
trated in Table 3.
TABLE 3 PORTS OF LOS ANGELES AND LONG BEACH CARGO TYPES AND
VOLUMES
Cargo Types
2006 Cargo Volume
(Millions of Metric Revenue Tons)
Port of Los An-geles
Port of Long Beach
Total (Both Ports)
General Cargo 155.3 127.2 282.5
Liquid Bulk 22.8 33.2 56.0
Dry Bulk 3.6 9.4 13.0
Total 181.7 169.8 351.5
Sources: Port of Los Angeles 2006 Financial Statement; and Port of Long Beach 2006 Monthly Tonnage Summary Report.
Seventy percent of imported goods arriving at the Ports are intended for mar-
kets outside of the region. Despite efforts to develop alternative West Coast
gateways, such as enhancing cargo handling capacity, the SPB ports are ex-
pected to remain the primary West Coast gateway to the rest of the nation
well into the future.
The Port of Hueneme also plays an important role in the region’s goods move-
ment system. Located approximately 60 miles northwest of Los Angeles, the
Port of Hueneme is the only deep-water harbor between Los Angeles and San
Francisco. Roughly $7.5 billion in cargo moves through the Port of Hueneme
each year, which mostly includes automobiles, fresh fruit, and produce. The
Port’s location near the Santa Barbara channel has also made the Port one of
the primary support facilities for the offshore oil industry. Port related activity
contributes over $650 million to the local economy, and supports an addi-
tional 5,000 jobs (directly and indirectly) in Ventura County.
PORT RELATED RAIL ACTIVITIES: ON-DOCK, NEAR-DOCK AND
OFF-DOCK FACILITIES
More than half of the international import and export container market uti-
lizes the region’s intermodal rail system. There are two main types of inter-
national intermodal movements in Southern California, depending on cargo
handling and intermodal transfer practices:

8 G O O D S M O V E M E N T R E P O R T
Direct Intermodal: The direct loading/unloading of marine containers
on/off intermodal trains, without intermediate cargo handling, and
Transload Intermodal: The transfer of cargo from marine containers to
domestic trailers at transload/consolidation facilities and warehouses,
and includes subsequent transfer to railcars. This offers advantages by
expediting the return of empty marine containers back to port terminals
and enhancing the cost-effectiveness of intermodal movements since
domestic trailers offer the ability to move larger shipment volumes per
rail car compared to marine containers. Approximately 10% of total
port container throughput is currently estimated to be transloaded and
moved on the rail system.
Depending on the location of the intermodal yards relative to port terminals,
intermodal logistics movements associated with port containers can be cat-
egorized into the following types:
On-Dock Intermodal Rail: Loading/unloading of containers directly on/
off intermodal trains on the docks. On-dock intermodal accounted for
more than 24% of the SPB ports intermodal throughput in 2006.
Near-Dock Intermodal Rail: Loading/unloading of containers directly on/
off intermodal trains at an intermodal rail yard located near the docks.
Currently, the only near-dock intermodal yard in Southern California is
the Intermodal Container Transfer Facility (ICTF) owned and operated
by the Union Pacific Railroad. The ICTF handled approximately 8% of
the SPB ports intermodal cargo in 2006.
Off-Dock Intermodal Rail: Loading/unloading of containers on/off in-
termodal trains at an intermodal yard located farther away from termi-
nals than a near-dock intermodal yard. Off-dock intermodal facilities
in Southern California are located in downtown Los Angeles, approxi-
mately 25 miles north of the Ports. They are operated by both BNSF and
UP. Off-dock intermodal facilities handled approximately 20% of Port
container cargo throughput in 2006, though this share has been declin-
ing due to increased movement of containers using on-dock rail.
On-dock intermodal rail requires no truck movements on local and re-
gional roadway systems. Remaining intermodal market movements re-
quire at least one truck trip to a near dock or off-dock intermodal facility.
Compared to off-dock intermodal, on-dock and near-dock intermodal
operations play a key role in minimizing port truck trips and reducing
truck VMT, resulting in lower emissions and increased safety benefits to
the region. The increased efficiency of intermodal yards has an impact
on the overall productivity of the regional goods movement system.
As of 2005, 3.8 million TEUs, or 24 %, of intermodal cargo were handled
at on-dock rail yards at the SPB ports. With planned improvements at the
Ports, this number is projected to increase to 12.9 million TEUs, or approxi-
mately 30 %, by 2030. If this projected volume were handled exclusively
by trucks, the increased truck traffic would cripple regional traffic flows, and
adversely impact air quality. In recognition of these challenges, stakeholders
are proceeding with projects to enhance intermodal facility capacity and con-
nectivity with the SPB ports by developing several on-dock rail yard projects
and working with shipping lines and terminal operators to improve efficiency.
However, demand is projected to outpace capacity making near-dock rail yard
expansion critical.
The SPB ports have initiated the Rail Enhancement Program (REP) for the
phased development and implementation of key on-dock rail projects and
key rail infrastructure projects. Projects included in the REP have been sup-
ported by industry stakeholders who believe these projects are imperative to
maintain efficient operations at the SPB ports. Table 4 highlights planned
on-dock and near-dock facilities in the SPB ports area, and Table 5 highlights
rail infrastructure projects.

G O O D S M O V E M E N T R E P O R T 9
TABLE 4 PLANNED ON-DOCK RAIL YARD PROJECTS AT THE SAN PEDRO BAY PORTS
Rail Yard Project SponsorDevelopment Cost ($ millions)
Phase I Short-term (by end of 2007)
No Rail Yard Projects
Phase II Near-term (by end of 2010)
Pier A On-Dock Rail Yard Expansion to Carrack POLB 19.6
Pier S On-Dock Rail Yard POLB 34.3
New Near-Dock-South of Sepulveda (potential) POLA Na
Pier G-New North Working Yard POLB 14.1
Pier G-South Working Yard Rehabilitation POLB 40.7
West Basin East-New ICTF (Phase I) POLA 45.4
Phase III Medium-term (by end of 2015)
Navy mole Road Storage Rail Yard POLB 10.0
Middle Harbor Terminal Rail Yard POLB 68.9
Pier J On-Dock Rail Yard Reconfiguration POLB 100.0
Pier 400 On-Dock Rail Yard Expansion (Phase I) POLA 33.4
Pier 300 On-Dock Rail Yard Expansion POLA 23.4
Terminal Island ICTF Rail Yard Expansion POLA 18.9
West Basin ICTF Rail Yard Expansion (Phase I) POLA 6.2
Phase IV Long-term (beyond 2015)
Pier A On-Dock Rail Yard East of Carrack POLB 31.4
Pier 400 On-Dock Rail Yard Expansion (Phase II) POLA 16.3
West Basin ICTF Rail Yard Expansion (Phase II) POLA 12.5
West Basin East-ICTF Expansion (Phase II) POLA 7.8
Subtotal POLA Cost (millions) 163.9
Subtotal POLB Cost (millions) 318.9
Total Potential Rail Yard Cost (millions) 482.8
Source: San Pedro Bay Port Rail Study Update, December 2006

10 G O O D S M O V E M E N T R E P O R T
TABLE 5 LIST OF RAIL INFRASTRUCTURE PROJECTS
(OUTSIDE MARINE TERMINALS)
Rail Infrastructure Project SponsorDevelopment Cost ($ millions)
Phase I Short-term (by end of 2007)
I.1 Closure of Edison Avenue Grade Crossing POLB 0.3
I.2 Expanded Control Points to POLB/POLA ACTA 4.9
I.3 Thenard Track Connecion at Alameda Street/K-Pac ACTA 4.6
Phase II Near-term (by end of 2010)
II.2 Terminal Island Wye Track Realignment POLB 3.6
II.4 Pier B Street Realignment POLB 12.6
II.6 Constrain Badger Bridge Lifts POLB/LA 1.0
II.7 Track Realignment at Ocean Boulevard/Harbor Scenic Drive POLB 20.0
II.8 Pier F Support Yard POLB 3.4
II.11 Double Track Access from Pier G to Pier J POLB 1.7
II.12 West Basin Rail Access Improvements POLA 150.0
Phase III Medium-term (by end of 2015)
III.1 Pier B Rail Yard Expansion (Phase I) POLB 85.4
III.2 Pier B Rail Yard Expansion (Phase II) POLB 159.9
III.3 Grade Separation for Reeves Crossing POLB/LA 60.0
III.4 Closure of Reeves At-grade Crossing POLB/LA 1.0
III.6 Pier 400 Second Lead Track POLA 7.7
III.7 Reconfiguration at CP Mole POLB/LA 20.0
Phase IV Long-term (beyond 2015)
IV.1 Triple Track Badger Bridge ACTA 91.0
IV.2 Triple Track South of Thenard Jct. ACTA 16.5
Subtotal ACTA Cost (millions) $117.0
Subtotal POLA Cost (millions) $157.7
Subtotal POLB Cost (millions) $286.9
Subtotal Shared POLB/LA Cost (millions) $82.0
Total Potential Infrastructure Cost (millions) $643.6Source: San Pedro Bay Ports Rail Study Update, December 2006.
G O O D S M O V E M E N T R E P O R T 11
Rail
RAIL CHARACTERISTICS
Railroads have been involved in moving freight through California for over
140 years. As of 2005, 29 freight railroads operate 7,335 track miles statewide,
including trackage rights. The Union Pacific Railroad (UP) operates on 3,358
miles of track, a 46% share of the State’s rail network. The Burlington Northern
Santa Fe Railway (BNSF) operates on 2,130 miles, a 29% share. Regional, local,
and short-line carriers serve the remaining 25% of the State’s track miles.
With an extensive network throughout the SCAG region, rail serves as a vital
link in the goods movement supply chain. Railroads are best known for the
ability to move large volumes of goods over long distances. The current sys-
tem sees 5 million lifts annually, of which 64% are intermodal containers.
MAINLINE RAIL
The region has an extensive mainline rail network. BNSF operates a single
mainline network in the SPB ports region, the Transcon, which runs from
downtown Los Angeles to Barstow with a terminus in Chicago. UP operates
multiple lines in and out of the Los Angeles basin. Typically referred to as the
Alhambra and Los Angeles lines, UP operates two mainlines between down-
town Los Angeles and the Colton Crossing. Along these lines, UP performs
“directional running” operations, where all eastbound through-trains are
routed along the Los Angeles lines and westbound through-trains along the
Alhambra line. North of West Colton, UP operates the Palmdale line which
parallels BNSF’s Transcon line, ascending the south slope of the Cajon Pass
between San Bernardino and the San Gabriel Mountains. Compared to other
UP lines, the Palmdale line carries relatively little traffic. UP also runs trains
on BNSF’s Transcon between West Riverside and Barstow-utilizing trackage
rights agreements.
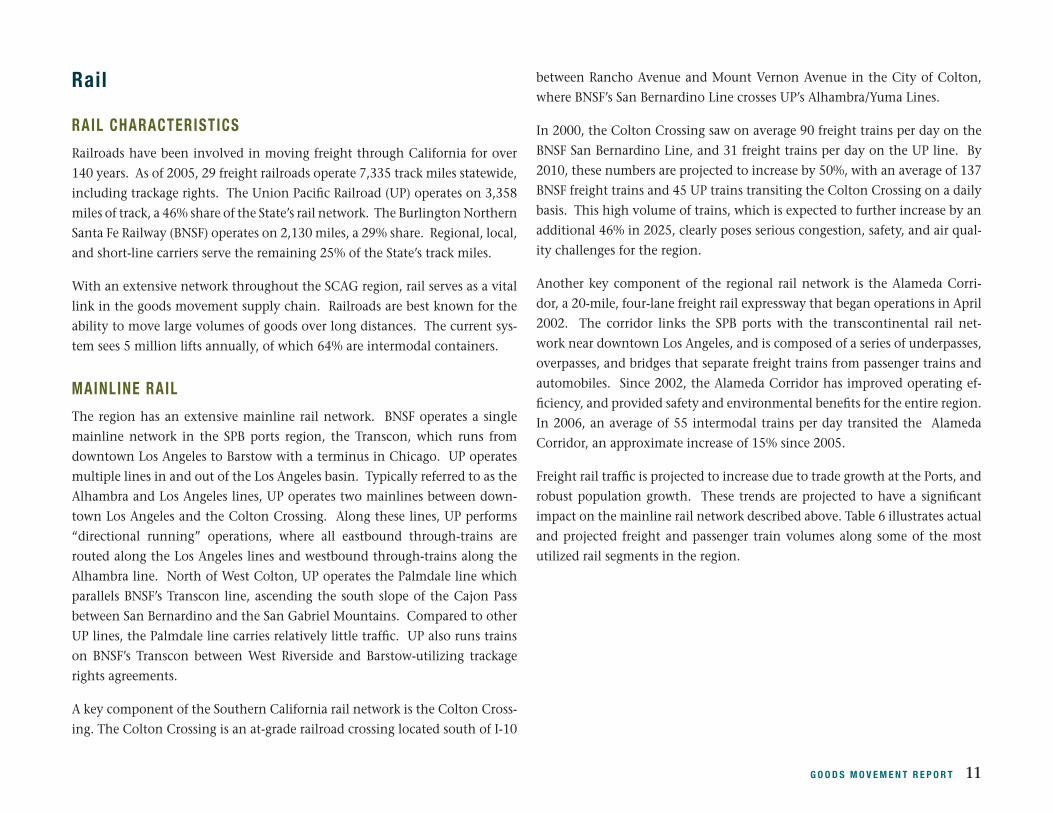
A key component of the Southern California rail network is the Colton Cross-
ing. The Colton Crossing is an at-grade railroad crossing located south of I-10
between Rancho Avenue and Mount Vernon Avenue in the City of Colton,
where BNSF’s San Bernardino Line crosses UP’s Alhambra/Yuma Lines.
In 2000, the Colton Crossing saw on average 90 freight trains per day on the
BNSF San Bernardino Line, and 31 freight trains per day on the UP line. By
2010, these numbers are projected to increase by 50%, with an average of 137
BNSF freight trains and 45 UP trains transiting the Colton Crossing on a daily
basis. This high volume of trains, which is expected to further increase by an
additional 46% in 2025, clearly poses serious congestion, safety, and air qual-
ity challenges for the region.
Another key component of the regional rail network is the Alameda Corri-
dor, a 20-mile, four-lane freight rail expressway that began operations in April
2002. The corridor links the SPB ports with the transcontinental rail net-
work near downtown Los Angeles, and is composed of a series of underpasses,
overpasses, and bridges that separate freight trains from passenger trains and
automobiles. Since 2002, the Alameda Corridor has improved operating ef-
ficiency, and provided safety and environmental benefits for the entire region.
In 2006, an average of 55 intermodal trains per day transited the Alameda
Corridor, an approximate increase of 15% since 2005.
Freight rail traffic is projected to increase due to trade growth at the Ports, and
robust population growth. These trends are projected to have a significant
impact on the mainline rail network described above. Table 6 illustrates actual
and projected freight and passenger train volumes along some of the most
utilized rail segments in the region.

12 G O O D S M O V E M E N T R E P O R T
TABLE 6 PASSENGER AND FREIGHT TRAIN TRAFFIC VOLUMES PER
PEAK DAY BY LINE SEGMENT
Line Segment Train Type 2000 2010 2025
BNSF Hobart - Fullerton Jct. Freight 50.0 74.1 111.9
Psgr 46.0 96.0 106.0
Total 96.0 170.0 207.9
BNSF Fullerton Jct. - Atwood Freight 50.0 74.1 111.9
Psgr 5.0 20.0 34.0
Total 55.0 94.1 145.9
BNSF Atwood - West Riverside Freight 57.0 82.2 121.3
Psgr 16.0 38.0 62.0
Total 73.0 120.2 183.3
West Riverside - Colton UP Freight 35.2 49.8 72.9
BNSF Freight 57.0 82.2 121.3
Psgr 11.0 24.0 36.0
Total 103.2 156.0 230.2
Colton Crossing BNSF Line 90.2 137.1 201.8
UP Yuma Line 31.0 44.6 64.7
Total 121.2 181.7 266.5
Colton - San Bernardino UP Freight 22.2 30.9 44.5
BNSF Freight 57.0 82.2 121.3
Psgr 11.0 24.0 36.0
Total 68.0 106.2 157.3
Lines over Cajon Pass Freight 93.7 130.0 186.7
(including BNSF/UP Cajon Line and UP Palmdale Line)
Psgr 2.0 6.0 8.0
Total 95.7 136.0 194.7
UP Mira Loma - W. Riverside plus Freight 64.2 90.4 126.2
UP West Colton - Colton Psgr 14.0 26.0 44.0
Total 78.2 116.4 170.2
UP Yuma Line Freight 42.0 59.5 87.1
Psgr 2.0 4.0 8.0
Total 44.0 63.5 95.1Source: Inland Empire Railroad Main Line Study, SCAG, June 2005.
RAIL SYSTEM CONSTRAINTS AND ISSUES
INTERMODAL RAIL YARD CAPACITY CONSTRAINTS
The region’s intermodal rail yards are reaching capacity, resulting in time de-
lays in moving both international and domestic containers between trains
and trucks. According to the 2006 San Pedro Bay Ports Rail Study Update,
off-dock rail yards in Southern California, which handle direct intermodal,
transload, and domestic intermodal cargo, will exceed capacity between 2010-
2015, meaning all direct international intermodal demand will need to be
accommodated at on-dock and near-dock intermodal yards. Assuming full
on-dock rail capacity enhancements are realized at the Ports in the future,
Table 7 illustrates the resulting shortfall in intermodal lift capacity if no new
near-dock or off-dock intermodal yards are developed in the region. This
indicates that, even when considering all planned on-dock rail capacity en-
hancements, total direct intermodal demand will likely exceed capacity by
over 2.2 million TEUs.
TABLE 7 FORECAST PORT DIRECT INTERMODAL DEMAND AND
AVAILABLE INTERMODAL LIFT CAPACITY
Direct Intermodal excludes Transload All values in millions of TEU
2005 Actual
2010 2015 2020 2030
SPB Cargo Forecast (Demand)
14.20 20.20 27.10 36.20 42.50
SPB Direct Intermodal (Demand)
5.70 8.10 10.84 14.48 17.01
POLB On-Dock Capacity 1.09 2.27 4.15 5.49 6.10
POLA On-Dock Capacity 1.84 2.79 4.33 6.25 6.84
SPB Off-Dock Capacity 1.69 0.67 0.04 0.00 0.00
SPB Near-Dock Capacity 1.08 1.40 1.84 1.84 1.84
SPB Variance (negative = shortfall)
0.00 -0.97 -0.48 -0.90 -2.23
Source: San Pedro Bay Port Rail Study Update, December 2006

G O O D S M O V E M E N T R E P O R T 13
RAIL NETWORK CAPACITY CONSTRAINTS
SCAG has identified rail mainline capacity constraints east of Los Angeles as
a critical issue facing the region. In 2000, train delays averaged more than 30
minutes and are projected to increase by over 40% by 2010 without capacity
improvements. Overall, mainline capacity constraints reduce system velocity,
which results in delays of time-sensitive shipments to customers nationwide.
TABLE 8 YEAR 2000 AND 2010 TRAIN DELAYS ON EXISTING TRACKAGE
Year Train Type Average Delay Per Train
2000BNSF Freight 31.9 minutes
UP Freight 30.4 minutes
2010BNSF Freight 206.3 minutes
UP Freight 196.9 minutes
Source: Inland Empire Railroad Main Line Study, SCAG, June, 2005.
The Colton Crossing has been identified in several previous studies as a major
rail bottleneck that slows freight movement and has delayed the implementa-
tion of additional passenger rail service in the Inland Empire. The majority
of freight rail traffic moving between Southern California and the rest of the
nation must transit the Colton Crossing. Increasing international trade and
regional population growth led the Southern California Regional Rail Author-
ity (SCRRA) to conduct a network rail operation analysis to identify potential
bottlenecks in the vicinity of the Colton Crossing. The study confirmed the
need to make capital improvements to the crossing to reduce rail congestion
and operational conflicts. The Inland Empire Railroad Main Line Study also
confirmed the critical need for grade-separations.
The Cajon Pass is another critical transcontinental rail segment requiring ca-
pacity improvements to ensure efficient freight movement. Steep grades and
curves along the Cajon Pass pose operational challenges that significantly slow
trains. Presently, approximately 90 trains per day traverse the Cajon Pass.
The Inland Empire Railroad Main Line Study projected that, by 2010, the BNSF
line segment between Colton Crossing and Barstow will require a minimum
of three main tracks while the segment between San Bernardino and Barstow
will require four main tracks by 2025. There is also a need for four main tracks
on the UP lines between Los Angeles and Riverside/Colton.
Trucks
PORT RELATED TRUCKING
Given the number of truck trips generated by the Ports, port truck traffic as-
sociated with the logistics of container movements in the region must be
analyzed. Depending on the geographic concentration of warehouses, dis-
tribution centers, transload facilities, and other inland facilities, some port
cargo movements may be associated with high-density truck flows between
origin-destination pairs including:
Truck trips between marine terminals and near-dock/off-dock intermod-
al yards;
Truck trips between marine terminals and transload/cross-dock facili-
ties; and
Truck trips between marine terminals and warehouse/distribution
centers.
The high concentration of intermodal yards near downtown Los Angeles has
resulted in significant container movements on freight corridors connecting
the Ports and these facilities. However, due to the scattered nature of logistics
and manufacturing facilities in the region, container movements on freight
corridors between marine terminals and logistics and manufacturing facilities
may not be as significant as movements between marine terminals and inter-
modal yards. But logistics and manufacturing facilities may generate second-
ary truck trips that create significant truck demand along many of the region’s
freight corridors.
Most port truck cargo movements associated with intermodal yards, transload
facilities, and warehouses are primarily related to import containers from the
SPB ports. However, there are significant empty container truck movements

14 G O O D S M O V E M E N T R E P O R T
between these facilities and the Ports that generate high-density port truck
movements. Examples include empty container return truck trips from trans-
load facilities and warehouses to the port terminals, and truck trips associated
with empty container repositioning from off-dock intermodal yards to port
terminals.
The magnitude and distribution of port-related truck traffic in the region war-
rants careful consideration of the feasibility of dedicated lanes for clean tech-
nology trucks to address future growth in port truck traffic volumes. A major
factor in determining the feasibility of such facilities is whether high-density
truck traffic exists between major origin-destination pairs. Consequently, in
examining the feasibility of such facilities on certain corridors between the
Ports and inland facilities, key issues pertaining to truck traffic flows and pat-
terns must be understood. These include:
Total truck traffic demand along the corridors between the Ports and
inland facilities;
Origin-destination (O-D) patterns of truck trips along these corridors;
and
Major generators of truck traffic demand along these corridors.
Table 9 shows the shares of port truck trips along I-710 and SR-60. For other
major freight corridors in the region, please refer to Appendix A.
TABLE 9 TOTAL AND PORT TRUCK TRAFFIC ALONG I-710 AND SR-60,
2003
Highways SegmentsTotal Daily Vehicle Volume
Total Daily Truck Volume
Daily Port Truck Volume
Total Trucks as % of Total Vehicle Volume
Port Trucks as % of Total Truck Volume
I-710
I-105 to I-10
324,000
15,900
2,485 4.9% 15.6%
PCH to Willow
146,000
25,400
23,900 17.4% 94.1%
Willow to I-405
161,000
27,100
23,235 16.8% 85.7%
I-405 to SR-91
186,000
31,400
20,045 16.9% 63.8%
SR-91 to I-105
227,000
38,300
15,315 16.9% 40.0%
I-105 to I-5
237,000
34,600
11,685 14.6% 33.8%
I-5 to SR-60
199,000
24,200
1,025 12.2% 4.2%
SR-60 to I-10
132,000
11,300
845 8.6% 7.5%
SR-60SR-57 to I-605
265,000
23,200
1,560 8.8% 6.7%
Source: “Baseline Transportation Study”, Port of Los Angeles, 2004; Caltrans Truck Volumes 2004 (Year 2003 data).
As illustrated in Table 9, I-710 has a larger share of port-related trucks than SR-
60. Port-related truck traffic and its share of total truck volume along I-710 are
more highly concentrated along segments closer to the Ports. This indicates
that a large number of port truck access facilities exist along I-710.
The I-710 major corridor study analyzed growth in truck traffic along I-710
based on expected growth in port container volumes. The study projected
total heavy-duty truck traffic to more than double on the I-710 by 2025, with
truck shares reaching up to 35% of total traffic volumes along high volume
segments compared to the current shares of between 14% - 19%. Considering

G O O D S M O V E M E N T R E P O R T 15
the magnitude and distribution patterns of port truck trips along I-710, fore-
casts indicate that demand would be favorable to the implementation of dedi-
cated lanes for clean technology trucks on I-710. Future near-dock intermodal
yard capacity expansions associated with the expansion of the ICTF and the
development of the Southern California International Gateway (SCIG), which
is privately funded by BNSF, may also play a key role in addressing the growth
of high-density truck traffic.
LOCAL TRUCKS
The vast majority of imports through the SPB ports are retail goods. SCAG’s
Port and Modal Elasticity study calculated local container volume based on
local purchasing power associated with retail sales. According to the study, 23
% of traffic generated by the SPB ports is local traffic, meaning goods either
originate or are ultimately consumed in the region which is defined as South-
ern California, Southern Nevada, Arizona, and New Mexico. In 2005, local
consumption of the total import trade value of $256 billion was $58.8 billion.
With over 75% of truck tonnage in the region moving less than 50 miles, the
effect on local truck traffic is dramatic. The modal shares and lengths of haul
by rail and truck are shown in Figure 1.
FIGURE 1 MODAL SHARES AND LENGTH OF HAUL
Perc
ent
Rail IntermodalRail CarloadTruckload
75
80
85
90
95
100
< 50 50 to 99 100 to249
250 to499
500 to749
750 to999
1000 to1499
1500 to1999
2000+
100 100 10098
96
91
84 83
87
23
5
12
4
3
14 4
1310
Source: Goods Movement Truck and Rail Study Executive Summary, SCAG, 2003.
SCAG’s Travel Demand Model suggests that regional daily truck VMT will in-
crease from 29.0 million in 2003 to 50.4 by 2035, an 82.7% increase. Daily
delay will also increase as shown in Table 10.
TABLE 10 PROJECTED DAILY DELAY IN THE REGION
Daily Delay (Hours)
2003 Base Year 2035 Baseline 2035 Plan
Autos 3,711,266 7,545,518 6,155,229
Trucks 192,555 592,733 466,598
Source: Travel Demand Model Output, SCAG, 2007.
This increase in regional VMT will reduce average freeway speeds from 51
mph in 2005 to approximately 37.5 mph in 2035. The average speed on the
regional freeway system for 2003, the 2035 Baseline, and the 2035 Plan are
illustrated in Exhibits 4, 5, and 6. Delays caused by congestion could increase
the cost of transporting goods by as much as 50%-250%.

16 G O O D S M O V E M E N T R E P O R T
Source: Southern California Association of Governments, ESRI StreetMap USA, Teleatlas
EXHIBIT 4 BASE YEAR 2003 FREEWAY SPEED | PM PEAK

G O O D S M O V E M E N T R E P O R T 17
Source: Southern California Association of Governments, ESRI StreetMap USA, Teleatlas
EXHIBIT 5 BASELINE 2035 FREEWAY SPEED | PM PEAK

18 G O O D S M O V E M E N T R E P O R T
EXHIBIT 6 PLAN 2035 FREEWAY SPEED | PM PEAK
Source: Southern California Association of Governments, ESRI StreetMap USA, Teleatlas

G O O D S M O V E M E N T R E P O R T 19
Environmental Impacts
Mitigating the community and environmental impacts of goods movement is
critical to the region. Perhaps the most visible and pressing environmental im-
pacts are the increasing volumes of criteria air pollutant emissions surround-
ing the Ports and major freight corridors. While trade activities in the SCAG
region are key contributors to the economy, air pollution from these activities
poses serious health hazards to the region, especially for communities located
near the Ports and trade corridors. The California Air Resource Board (CARB)
has identified particulate matter (PM ) as a toxic air contaminant linked to in-
creased health risks. Table 11 lists CARB’s assessment of PM2.5 health effects
on residents of the Southern California Air Basin. Table 10 chronicles other
goods movement related pollutants and their health effects.
TABLE 11 CARB ASSESSMENT OF PM HEALTH EFFECTS ON SOUTHERN
CALIFORNIA AIR BASIN RESIDENTS
Health Effect Cases Per Year
Premature Deaths 5,400
Hospitalizations 2,400
Asthma & Lower Respiratory Symptoms 140,000
Lost Work Days 980,000
Minor Restricted Activity Days 5,000,000
Source: California Air Resources Board
TABLE 12 OTHER GOODS MOVEMENT RELATED POLLUTANTS AND THEIR
HEALTH EFFECTS
Pollutant Health Effects
Ozone (O3) Breathing Difficulties, Lung Tissue Damage
Nitrogen Dioxide (NOX) Lung Irritation and Damage
Sulfur Dioxide (SOX)Increases in Lung Disease and Breathing
Problems for Asthmatics
Respirable Particulate Matter (PM10)Increased Respiratory Disease, Lung Dam-
age, Cancer, Premature Death
Carbon Monoxide (CO)Chest Pain in Heart Patients, Headaches,
Reduced Mental Alertness
Source: California Air Resources Board
Port-related sources, which were approximately 25% of regional diesel PM
emissions in 2002, are projected to increase to 50% of regional PM emissions
in 2020. The CARB assessment of PM2.5 health effects indicates that the
South Coast Air Basin suffers disproportionate exposure to pollutants relative
to other parts of California and the rest of nation. Residents of the South
Coast Air Basin are exposed to PM2.5 levels that are 82% higher than the
exposure of residents statewide and 52% higher than national exposure. As
shown in Figure 2, goods movement related sources contribute substantially
to the region’s total emissions of Nitrogen Oxides (NOX), Sulfur Oxides (SoX),
PM10, PM2.5, and Carbon Monoxide (CO). Figure 3 shows statewide emis-
sions of diesel particulate matter by goods movement sources. Air pollution
is just one of many goods movement related environmental impacts identi-
fied. Other impacts include noise, vibration, aesthetic, safety, and natural
resource depletion.

20 G O O D S M O V E M E N T R E P O R T
FIGURE 2 2008 ESTIMATED ANNUAL AVERAGE EMISSIONS IN THE SOUTH
COAST AIR BASINPe
rcen
t
0
20
40
60
80
100
CO NOx SOx PM 10 PM 2.5
Ships and Commercial Boats Trains Aircraft Total for trucks Other sources
Source: 2007 Air Quality Management Plan, SCAQMD
FIGURE 3 STATEWIDE EMISSIONS OF DIESEL PARTICULATE MATTER BY
GOODS MOVEMENT SOURCE, 2001
Cargo Handling Equipment1%
Trucks66%
Harbor Crat7%Ships
14%
TRU4%
Rail8%
Source: Emission Reduction Plan for Ports and Goods Movement in California, California EPA and California Air Resources Board (ARB),
March, 2006
Safety and Security Concerns
With the growth in trade volume, accidents involving trucks and trains are
expected to increase, without needed safety improvements. Accident data
collected on the I-710 between 2002 and 2004 identified an average of five
accidents per day between Ocean Boulevard and SR-60 on the I-710. These
data also suggest that highest incident locations were primarily tied to three
factors: 1) design deficiencies, 2) high traffic volumes, and 3) the mix between
autos and trucks. Accidents on truck-intensive facilities are particularly prob-
lematic due to their increased severity relative to auto-exclusive accidents.
Truck-related accidents also have a significant safety impact on other modes
in the transportation system. According to an FHWA report, 78 % of victims
in truck-related fatalities are drivers of other vehicles and 8% are pedestrians.
For a detailed discussion on truck collisions, please refer to Appendix B.
Growth in rail service also increases the potential for automobile / train in-
teractions and rail-related fatalities at grade crossings. These emerging con-
cerns point to the need for the region to research and implement appropriate
mitigation strategies including grade separations and other grade crossing
improvements.
The SCAG region is vulnerable to many types of safety and security challenges
including catastrophic events, which could significantly disrupt the regional
goods movement system. These challenges include earthquakes, floods, fires,
hazardous material incidents, transportation accidents, and human-caused in-
cidents such as acts of terrorism. To ensure the safety and security of residents,
as well as regional economic activities, SCAG is coordinating and collaborating
with various stakeholders to improve transportation security. To date, these
stakeholders have developed a number of efforts and strategies to prepare for
unforeseen events. Some of these efforts and strategies include:
Identification of the operation and maintenance needs of the interstate
and state highway system within the SCAG region, including the Strate-
gic Highway Network;

G O O D S M O V E M E N T R E P O R T 21
A Border Master Plan developed by California Department of Transpor-
tation (Caltrans) to ensure border security;
A comprehensive risk analysis and security plan for the regional railroad
system developed by the Railroad Security Task Force;
Integration of security into the regional ITS architecture; and
Collaboration of federal agencies and local law enforcement agencies to
ensure safety and security at the Ports.
The primary agencies with responsibility for port security at the federal level
include the Department of Homeland Security, United States Coast Guard,
the Bureau of Customs and Border Protection (CBP), Transportation Secu-
rity Administration (TSA), and the United States Maritime Administration
(MARAD).
Within the port facilities themselves, security is maintained by a combination
of agencies, including the U.S. Coast Guard, Customs and Border Protection,
Los Angeles Port Police at the Port of Los Angeles, and the Long Beach Police
Department at the Port of Long Beach who coordinate to ensure the security
of the port. While all of these agencies have the authority to access all areas
of the port, maintaining security inside the individual port terminals is the
responsibility of the terminal operators, who are required to comply with the
Maritime Transportation Security Act of 2002. This act requires terminal fa-
cilities to establish restricted areas, security patrols, access control measures,
personnel identification procedures, and develop plans to address identified
vulnerabilities.
In addition, the Ports of Los Angeles and Long Beach partner and coordinate
their security planning with other local law enforcement agencies, such as the
Los Angeles Police Department, Los Angeles County Sheriff’s Department, and
California Highway Patrol.
For detailed information on transportation safety and security, please see the
Safety and Security reports.

22 G O O D S M O V E M E N T R E P O R T
EXHIBIT 7 2035 PLANNED GOODS MOVEMENT SYSTEM
Source: Southern California Association of Governments, ESRI StreetMap USA, Teleatlas

G O O D S M O V E M E N T R E P O R T 23
SCAG’s Regional Strategies
Exhibit 7 illustrates planned goods movement system.
REGIONAL TRUCK STRATEGIES
While a variety of modes of transportation are used for the movement of
goods, on-road trucks perform the majority of goods movement activities in
the SCAG region. Trucks utilizing the current system of local arterial streets,
state highways, and interstate freeways carry approximately 80% of the total
value of U.S. freight shipments. Approximately 75% of all port related freight
movements are made by truck for at least one trip segment. Consequently,
trucks have contributed to rising concerns about traffic congestion and pub-
lic health impacts. Trucks consume upwards of 40% of total highway capac-
ity while representing only 15% of the total number of vehicles. Forecasted
growth in freight traffic has placed a greater emphasis on the need for regional
efforts in addressing road congestion, air quality, and infrastructure capacity.
DEDICATED LANES FOR CLEAN TECHNOLOGY TRUCKS
Truck-related delay impacts the efficiency of goods movement in the region
and ultimately increases prices paid by consumers for goods and services.
Additionally, the unreliability of the highway system also increases costs of
transportation as shippers build buffer times into their estimated travel times
to account for the possibility of severe traffic in the region. Estimated buffer
times in Southern California are twice as long as average nationwide delay for
the trucking industry.
Figure 4 illustrates the variances of buffer times throughout the day in South-
ern California. Free-flow traffic is assigned a value of 1. For example, if the
travel time index is roughly 1.3, travel time is roughly 30 % higher than
free flow time. Given necessary buffer times, significant costs are incurred
by trucking companies in Southern California to provide on-time service to
their customers.
FIGURE 4 AVERAGE TRAVEL TIME AND BUFFER TIME VARIATIONS IN
SOUTHERN CALIFORNIA
Inde
x Va
lue
Planning TimeTravel Time
1.0
1.4
1.8
2.2
12 AM 4 AM 8 AM 12 PM 12 AM4 PM 8 PMTime of Day (weekdays, non-holidays only)
Source: SCAG
SCAG has been exploring dedicated lanes for clean technology trucks and
refining the concept of user-supported, dedicated truck facilities to improve
the flow of goods within the region. Operationally, these facilities would be
aligned to focus on connecting freight-intensive locations such as the Ports,
warehousing/distribution center locations, and manufacturing locations.
Dedicated lanes would have less ingress/egress points than typical urban free-
ways and would be physically separated from mixed flow traffic to smooth
the flow of trucks on these facilities. A network of dedicated lanes for clean
technology trucks would be most advantageous for trucks that are traveling
long distances and those traveling between freight-intensive locations. The
corridors under consideration for such enhancements are I-710, an east-west
corridor parallel to SR-60/I-10/I-210, and I-15.
Such facilities have the potential to relieve many negative truck impacts in
the region, including recurrent delay, pavement deterioration, safety, emis-
sions, and reliability. For instance, trucks are responsible for significant
roadway damage including pavement deterioration. On average, one fully
loaded, 80,000-pound truck causes as much pavement wear as 10,000 auto-
mobiles. By separating trucks onto designated truck lanes, pavement dam-

24 G O O D S M O V E M E N T R E P O R T
age and maintenance costs could be significantly reduced on the mainline
freeway system. Though dedicated truck lanes may generate intensive
truck use requiring expensive design and maintenance, the net result would
likely be a significant reduction in total maintenance costs for the overall
freeway network.
The development of such facilities would also have the potential to signifi-
cantly improve the regional roadway system by addressing current system
deficiencies such as:
On/off ramps proximity to interchanges;
Low speed/capacity connections (loop ramps);
Missing interchanges from major freeway connections;
Close proximity of merging ramps to interchanges;
Non-standard weaving distances;
Narrow or Non-Existent Shoulders; and
Narrow Lane Widths
Despite high capital costs and the need for further analyses on environmen-
tal impacts and equity issues, the magnitude of truck volumes on regional
freight corridors requires urgent mitigation. Dedicated lanes for clean trucks
along I-710 could address numerous adverse impacts associated with existing
truck volumes, ensuring reliable system operation and reducing adverse envi-
ronmental impacts. SCAG recommends including dedicated lanes for clean
trucks on I-710, creating two lanes in each direction along existing alignments
extending from the Ports to SR-60. This represents an investment of over $5
billion in nominal dollars. At the same time, SCAG recognizes the need for a
comprehensive system that addresses regional truck-related issues, and con-
siders the I-710 portion the first segment of a comprehensive regional system.
Other corridors, such as an east-west corridor parallel to SR-60/I-10/I-210, and
I-15, which complement the comprehensive system, are in the Strategic Plan
for further analyses.
TRUCK CLIMBING LANES
Truck climbing lanes are additional lanes located outside mixed-flow lanes,
which permit slower-moving trucks to operate at their own pace. This enables
other vehicles to move at a faster pace, thereby reducing congestion. These
lanes are typically placed where slow-moving trucks would cause an obstruc-
tion to other vehicles, such as hillsides or other areas with significant grade
increases. Inclusion of these lanes would add capacity to existing roadways
and help reduce truck emissions by reducing delay. However, this strategy is
limited to areas with significant grade increases and may only have minimum
benefits on the regional transportation system. Corridors identified suitable
for truck climbing lanes are I-5, I-10, I-15, I-215, SR-57 and SR-60.
HIGH DESERT CORRIDOR
In an effort to avoid the congested metropolitan area, many trucks traverse
SR-138, the east-west corridor linking the Antelope and Victor Valleys. How-
ever, SR-138 currently lacks adequate infrastructure to handle heavy truck
volumes. The proposed High Desert Corridor between I-15 and I-5 will ac-
commodated an expected three- to six-fold increase in traffic, providing a new
level of accessibility and carry trucks and other through traffic safely around
existing communities.
TRUCK EMISSION CONTROL STRATEGIES
Heavy-duty trucks are usually powered by diesel, which contributes to region-
al NOX and PM emissions. New EPA emission standards taking effect in 2007
and 2010 will require strict emission reductions in both NOX and PM. Truck
emission reduction strategies are listed below. While these strategies do not
address congestion or capacity issues, they do provide support for the mitiga-
tion of freight emissions.
Truck Replacement: This strategy assumes that truck owners replace
older model trucks with newer trucks, with proof of disposal to prohibit
resale within the SCAG region.

G O O D S M O V E M E N T R E P O R T 25
Engine Repowering: This strategy is generally feasible for pre-1994 trucks
and can be obtained at lower capital costs than replacing the entire
truck. This strategy replaces older diesel truck engines with cleaner die-
sel or alternative fuel engines. Similar to the truck replacement strategy,
proof of disposal is required to ensure that the engine is not resold into
the region.
Exhaust Treatment Device Retrofit: Diesel particulate filters (DPFs), flow-
through filters (FTFs), and diesel oxidation catalysts (DOCs) are easily
retrofitted to existing trucks with only minor modifications to the exist-
ing system. While CARB has not certified emission reduction amounts,
DPFs, FTFs and DOCs are expected to reduce PM emissions by at least
50% and 25% respectively.
Alternative Fuels: There are a variety of alternative fuels that can reduce
truck emissions such as emulsified diesel, bio-diesel, natural gas, pro-
pane, and new hybrid-electric technologies.
Due to the costs associated with truck emission control strategies, monetary
incentives may be necessary for implementation purposes. Various agencies
are finalizing their incentive programs to support similar truck emission re-
duction programs. These incentive programs include:
The Clean Air Action Plan – Technology Advancement Program by the
SPB ports;
The Port of Los Angeles’ Port Air Quality Mitigation Incentive (PAQMIP);
and
The Carl Moyer Program by South Coast air Quality management Dis-
trict (SCAQMD) .
REGIONAL RAIL STRATEGIES
Given its superior connections to inland locations, freight rail is key to the re-
gion’s economy. Over the next 25 years, at least half of the containers coming
through the Ports will be transported via rail. Table 13 illustrates this growth.
Over the same period, commuter rail needs will also double. To address these
issues, SCAG is proposing rail system capacity enhancements, rail grade sepa-
rations, and alternative strategies to reduce rail emissions.
TABLE 13 SAN PEDRO BAY PORTS CARGO GROWTH FORECASTS* (TEUS
IN MILLIONS)
2005 (Ac-tual)
2010 2015 2020 2030
Total Port Container Throughput 14.2 20.3 27.1 36.2 42.5
Regional Truck Demand 6.8 9.7 13.0 17.4 20.4
Long Haul Truck Demand 0.1 0.2 0.3 0.4 0.4
Total Rail Demand** 7.2 10.3 13.8 18.5 21.7
Rail Share of Total Throughput 50.7% 50.7% 50.9% 51.1% 51.1%* Total San Pedro Bay projections are based on Mercer Management forecast as adjusted by Port of Los Angeles and Port of Long Beach** Includes transload to rail
Source: The San Pedro Bay Ports
RAIL MAINLINE CAPACITY IMPROVEMENTS
As a system, rail transports goods more efficiently, and emits three times less
pollutants than trucks. While the current system manages both passenger rail
and freight rail, current projections indicate severe system shortfalls in near the
future. To ensure sound operations, existing system infrastructure must be ex-
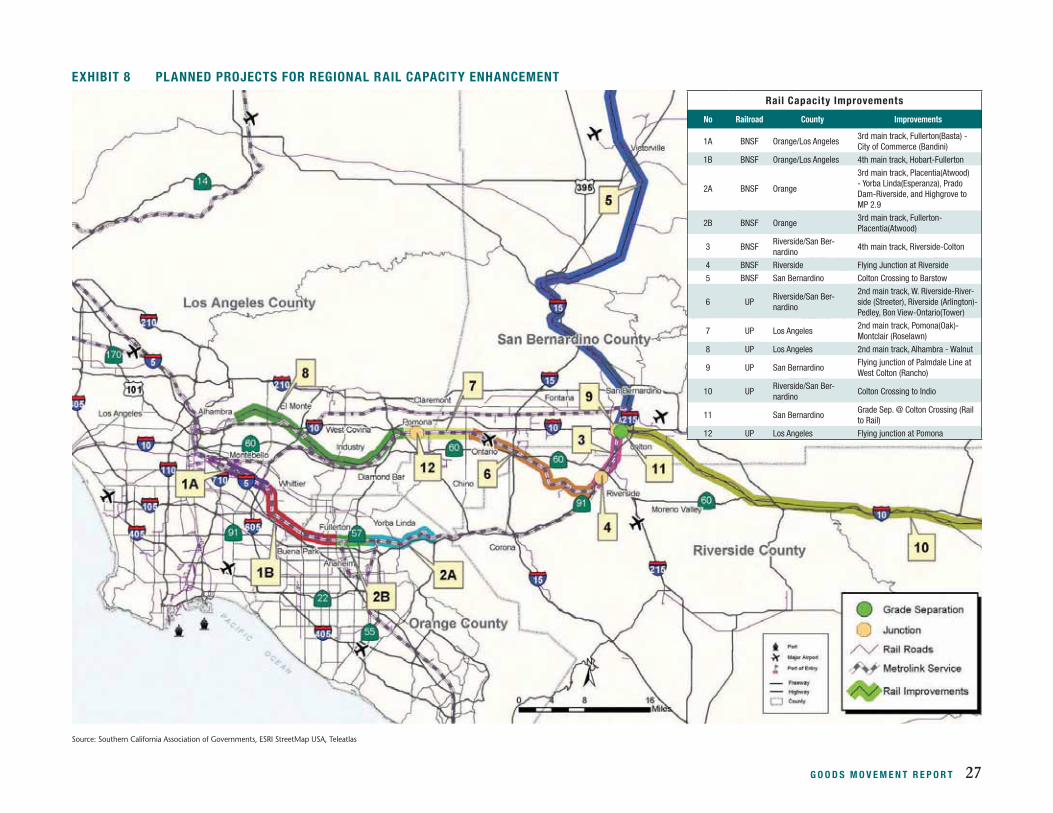
panded and grade separations at critical crossings must be completed. Exhibit
8 identifies planned projects for regional rail capacity enhancements. Critical
mainline track capacity improvements in the region are associated with UP
and BNSF lines. BNSF’s Transcon track capacity improvements include:
Additional 3rd and 4th mainline tracks between Hobart/Commerce
and Fullerton;
Additional 3rd mainline tracks for Fullerton - Placentia, Placentia - Yorba
Linda, Prado Dam – Riverside, and Highgrove - M.P. 2.9 segments; and
Additional 4th mainline track between Riverside and Colton.

26 G O O D S M O V E M E N T R E P O R T
UP’s mainline capacity improvements include:
Additional 2nd main track for West Riverside - Riverside, Riverside - Ped-
ley, and Bon view - Ontario segments; and
Additional 2nd main track for Pomona - Montclair, and Alhambra
- Walnut.
Colton Crossing is also a highly important capacity enhancement project
which involves both BNSF and UP lines. Improvements would provide signifi-
cant public and private sector benefits to the region including:
Improved operational efficiency resulting from increased speed through
the crossing;
Increased rail network capacity resulting in increased train throughput;
Economic benefits resulting from increased employment associated with
increased throughput through the crossing;
Environmental benefits due to emissions reductions resulting from
elimination of train idling, and enhanced train speeds through the
crossing; and
Environmental benefits associated with commuter VMT reduction re-
sulting from increased commuter rail service.
RAIL GRADE SEPARATIONS
Vehicle delay at grade crossings is expected to triple between 2000 and 2025.
Allowing two intersecting axes of traffic to move concurrently, grade cross-
ings eliminate vehicle delay and decrease associated emissions by reducing
vehicle idling times. This also means that longer trains may be formed, thus
increasing operating efficiencies by permitting the transport of larger volumes
of goods per trip.
The projected growth in freight and passenger train volumes make it critical
to separate grade crossings in order to ensure an efficient goods movement
system, to reduce traffic congestion and delays, and to meet regional air qual-
ity conformity requirements. Grade separations also address other rail cross-
ing related concerns such as noise and safety.
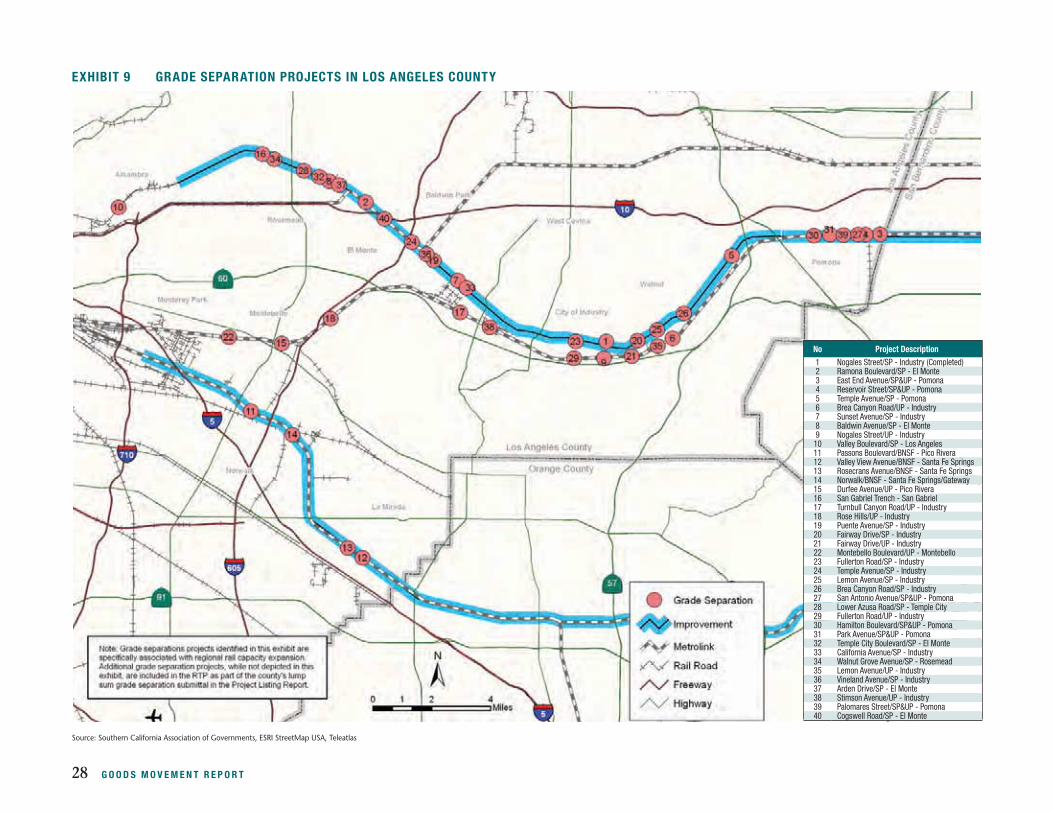
Throughout the SCAG region, 131 grade crossings requiring grade separations
were identified by the Alameda Corridor-East Trade Corridor Plan. These grade
separation projects would cost an estimated $5.99 billion to implement.
Exhibits 9, 10, 11, and 12 show proposed grade separation projects planned
in the region by county.
LOCOMOTIVE ENGINE UPGRADES
Upgrading locomotives to cleaner engines is another strategy to reduce diesel
emissions. In March 2007, the EPA proposed new Tier 3 and Tier 4 engine
standards to reduce emissions from diesel locomotives. Tier 3 standards are
near-term engine-out emission reduction standards for PM and NOX. Tier 4
standards are longer-term standards for newly-built engines. These standards
will be phased in over time, and would be based on the application of high-
efficiency catalytic aftertreatment technologies which would be enabled by
the availability of ultra low sulfur diesel fuel. Tier 3 engines are expected to
be available in 2009, and Tier 4 engines are expected to be available in 2015.
While these technologies may reduce emissions significantly, Tier 3 engines
will not reduce emissions by the amount required to meet the EPA’s attain-
ment deadline for PM2.5, and Tier 4 engines will not be available to meet the
2014 deadline. However, these strategies can be implemented at substantially
lower capital costs than other alternatives such as system electrification. SCAG
is exploring methods to accelerate implementation of this strategy through
measures such as financial incentives to engine manufacturers and railroads.
G O O D S M O V E M E N T R E P O R T 27
EXHIBIT 8 PLANNED PROJECTS FOR REGIONAL RAIL CAPACITY ENHANCEMENT
Rail Capacity Improvements
No Railroad County Improvements
1A BNSF Orange/Los Angeles3rd main track, Fullerton(Basta) - City of Commerce (Bandini)
1B BNSF Orange/Los Angeles 4th main track, Hobart-Fullerton
2A BNSF Orange
3rd main track, Placentia(Atwood) - Yorba Linda(Esperanza), Prado Dam-Riverside, and Highgrove to MP 2.9
2B BNSF Orange3rd main track, Fullerton-Placentia(Atwood)
3 BNSFRiverside/San Ber-nardino
4th main track, Riverside-Colton
4 BNSF Riverside Flying Junction at Riverside
5 BNSF San Bernardino Colton Crossing to Barstow
6 UPRiverside/San Ber-nardino
2nd main track, W. Riverside-River-side (Streeter), Riverside (Arlington)-Pedley, Bon View-Ontario(Tower)
7 UP Los Angeles2nd main track, Pomona(Oak)-Montclair (Roselawn)
8 UP Los Angeles 2nd main track, Alhambra - Walnut
9 UP San BernardinoFlying junction of Palmdale Line at West Colton (Rancho)
10 UPRiverside/San Ber-nardino
Colton Crossing to Indio
11 San BernardinoGrade Sep. @ Colton Crossing (Rail to Rail)
12 UP Los Angeles Flying junction at Pomona
Source: Southern California Association of Governments, ESRI StreetMap USA, Teleatlas
28 G O O D S M O V E M E N T R E P O R T
EXHIBIT 9 GRADE SEPARATION PROJECTS IN LOS ANGELES COUNTY
No Project Description
1 Nogales Street/SP - Industry (Completed)2 Ramona Boulevard/SP - El Monte3 East End Avenue/SP&UP - Pomona4 Reservoir Street/SP&UP - Pomona5 Temple Avenue/SP - Pomona6 Brea Canyon Road/UP - Industry7 Sunset Avenue/SP - Industry8 Baldwin Avenue/SP - El Monte9 Nogales Street/UP - Industry
10 Valley Boulevard/SP - Los Angeles11 Passons Boulevard/BNSF - Pico Rivera12 Valley View Avenue/BNSF - Santa Fe Springs13 Rosecrans Avenue/BNSF - Santa Fe Springs14 Norwalk/BNSF - Santa Fe Springs/Gateway15 Durfee Avenue/UP - Pico Rivera16 San Gabriel Trench - San Gabriel17 Turnbull Canyon Road/UP - Industry18 Rose Hills/UP - Industry19 Puente Avenue/SP - Industry20 Fairway Drive/SP - Industry21 Fairway Drive/UP - Industry22 Montebello Boulevard/UP - Montebello23 Fullerton Road/SP - Industry24 Temple Avenue/SP - Industry25 Lemon Avenue/SP - Industry26 Brea Canyon Road/SP - Industry27 San Antonio Avenue/SP&UP - Pomona28 Lower Azusa Road/SP - Temple City29 Fullerton Road/UP - Industry30 Hamilton Boulevard/SP&UP - Pomona31 Park Avenue/SP&UP - Pomona32 Temple City Boulevard/SP - El Monte33 California Avenue/SP - Industry34 Walnut Grove Avenue/SP - Rosemead35 Lemon Avenue/UP - Industry36 Vineland Avenue/SP - Industry37 Arden Drive/SP - El Monte38 Stimson Avenue/UP - Industry39 Palomares Street/SP&UP - Pomona40 Cogswell Road/SP - El Monte
Source: Southern California Association of Governments, ESRI StreetMap USA, Teleatlas

G O O D S M O V E M E N T R E P O R T 29
EXHIBIT 10 GRADE SEPARATION PROJECTS IN ORANGE COUNTY
No Project Description
1 Melrose Street Undercrossing (Completed)
2 Bradford Avenue Closure (Completed)
3 Imperial Highway Overcrossing
4 State College Boulevard Undercrossing
5 Placentia Avenue Undercrossing
6 Kraemer Boulevard Undercrossing
7 Orangethorpe Avenue Overcrossing
8 Tustin Avenue/Rose Drive Overcrossing
9 Jefferson Street Overcrossing
10 Van Buren Avenue Overcrossing
11 Richfield Road Crossing
12 Lakeview Avenue Overcrossing
13 Kellogg Drive Undercrossing
Source: Southern California Association of Governments, ESRI StreetMap USA, Teleatlas

30 G O O D S M O V E M E N T R E P O R T
EXHIBIT 11 GRADE SEPARATION PROJECTS IN RIVERSIDE COUNTY
No Project Description
1 Avenue 50 - Coachella (Completed)2 Jurupa Road/UP - Riverside County3 Magnolia Avenue/UP - Riverside4 Riverside Avenue/UP - Riverside5 McKinley Street/BNSF - Corona6 Magnolia Avenue/BNSF - Riverside County7 3rd Street/BNSF - Riverside8 Chicago Avenue/BNSF - Riverside9 Columbia Avenue/BNSF - Riverside
10 Iowa Avenue/BNSF - Riverside11 Sunset Avenue/UP - Banning12 Clay Street/UP - Riverside County13 Jurupa Avenue/UP - Riverside14 Streeter Avenue/UP - Riverside15 Brockton Avenue/UP - Riverside16 Auto Center Drive/BNSF - Corona17 Smith Avenue/BNSF - Corona18 Tyler Street/BNSF - Riverside19 Adams Street/BNSF - Riverside20 Madison Street/BNSF - Riverside21 Mary Street/BNSF - Riverside22 7th Street/BNSF - Riverside23 Spruce Street/BNSF - Riverside24 Palmyrita Avenue/UP - Riverside25 Center Street/BNSF - Riverside County26 22nd Street/UP - Banning27 San Gorgonio Avenue/UP - Banning28 Hargrave Street/UP - Banning29 Avenue 48/Dillon Road/UP - Coachella/Indio30 Bellgrave Avenue/UP - Riverside County31 Palm Avenue/UP - Riverside32 Panorama Road/UP - Riverside33 Railroad Street/BNSF - Corona34 Buchanan Street/BNSF - Riverside35 Pierce Street/BNSF - Riverside36 San Timoteo Canyon Road/UP - Calimesa37 California Av/UP - Beaumont38 Avenue 52/UP - Coachella39 Avenue 62/UP - Coachella40 Avenue 66/UP - Coachella
Source: Southern California Association of Governments, ESRI StreetMap USA, Teleatlas

G O O D S M O V E M E N T R E P O R T 31
EXHIBIT 12 GRADE SEPARATION PROJECTS IN SAN BERNARDINO COUNTY
No Project Description
1 Grove Avenue Alhambra (UP) Line (Completed)2 Grove Avenue Los Angeles (UP) Line (Completed)3 Ramona Avenue Alhambra and Los Angeles (UP) Lines4 Monte Vista Avenue Alhambra and and Los Angeles (UP) Lines 5 State/University Cajon (UP) Line6 Hunts Lane Yuma (UP) Line7 Milliken Avenue Alhambra (UP) Line8 Central Avenue Alhambra and Los Angeles (UP) Lines9 San Antonio Avenue Alhambra and Los Angeles (UP) Lines10 Sultana Avenue Alhambra and Los Angeles (UP) Lines11 Campus Avenue Alhambra and Los Angeles (UP) Lines12 Vineyard Avenue Alhambra (UP) Line13 Mt. Vernon Avenue Alhambra (UP) Line14 Vine Avenue Los Angeles (UP) Line15 Bon View Avenue Los Angeles (UP) Line16 Vineyard Avenue Los Angeles (UP) Line17 Archibald Avenue Los Angeles (UP) Line18 Milliken Avenue Los Angeles (UP) Line19 Valley Boulevard San Bernardino (BNSF & UP) Line20 Laurel Street San Bernardino (BNSF & UP) Line21 Main Street San Bernardino (BNSF & UP) Line22 Olive Street San Bernardino (BNSF & UP) Line23 Mt. Vernon Avenue San Bernardino (BNSF & UP) Line24 Other Improvements: E Street, H Street San Bernardino (BNSF & UP) Line25 Palm Avenue Cajon (BNSF & UP) Line26 Glen Helen Parkway Cajon (BNSF & UP) Line27 Ranchero Road Cajon (BNSF & UP) Line28 Vista Road Cajon (BNSF & UP) Line29 Hinkley Road Cajon (BNSF & UP) Line30 Lenwood Road Cajon (BNSF & UP) Line31 Oro Grande (BNSF & UP) Line32 Other Improvements: Indian Trail Cajon (BNSF & UP) Line33 Ranchero Road Cutoff (UP) Line34 Phelan Road Cutoff (UP) Line35 Other Improvements: Johnson Road Cutoff (UP) Line36 Whittier Avenue Yuma (UP) Line37 Beaumont Avenue Yuma (UP) Line38 Alessandro Road Yuma (UP) Line39 Other Improvements: San Timoteo Canyon Road Yuma (UP) Line
Source: Southern California Association of Governments, ESRI StreetMap USA, Teleatlas

32 G O O D S M O V E M E N T R E P O R T
GOODS MOVEMENT HIGH SPEED RAIL TRANSPORT (HSRT) FOR
FREIGHT
The region is also exploring new HSRT systems that may provide greater
throughput and reliability with near zero emissions. A recent analysis car-
ried out by the IBI Group considered the application of a HSRT system for
the movement of containers (logistics and systems technology) to and from
the SPB ports. The HSRT container movement system would provide a high
capacity, fast, efficient, and environmentally sensitive method of moving con-
tainerized cargo from the Ports to inland port facilities in San Bernardino. The
HSRT system capitalizes on the inherent savings of multiple uses on a single
infrastructure by operating on shared alignments with a HSRT passenger sys-
tem. The technology permits operation of HSRT freight vehicles on a shared
guideway with passenger vehicles even during peak hour service. Freight ve-
hicle trips can be interspersed with passenger trips while still meeting required
passenger vehicle headways. Additionally, full utilization of the freight line
can be achieved during the passenger system’s off-peak hours.
The freight component of the HSRT system would begin at the Ports and con-
nect to the Initial Operating Segment (IOS) at a point just east of Los Angeles
Union Passenger Terminal. The assumed alignment would run north-south
and follow a route parallel to the I-710/Alameda Corridor. After connecting
to the IOS and other segments, the freight-only service would be interspersed
with passenger service.
Table 14 shows current estimates, which indicate that a HSRT container move-
ment system is capable of moving over 25,272 containers per day or over
9.2 million TEUs annually. The total freight component is estimated to cost
nearly $18 billion in nominal dollars.
INLAND PORT STRATEGY
The region is confronting serious long-term freight mobility issues. Straight-
forward capacity increases that worked in the past – more highways, larger
ports – are not enough for the future and may endanger the environment,
tax the budget, and impact communities. Inland ports and related initia-
tives have been proposed as solutions to freight mobility issues. An inland
port would be located further away from the Ports with transportation sys-
tems other than existing freight corridors moving goods between the Ports
and the inland port. The broad potential benefits of an inland port include
facilitating goods movement, encouraging economic development, reducing
traffic congestion, and promoting regional objectives. The development of
TABLE 14 SBD CAPACITY SHARED GUIDEWAY WITH PASSENGER SERVICE - 9.2M TEU
Operating Period Trains/Day/Direction Potential Capacity
Hr/Day Trains/Hr/Direction Passenger Freight Per Day and Direction Per Year and Direction
Passenger Freight Passenger Freight (24/7 Operation)
20 ft 40 ft TEU TEU
Peak 8 6 6 48 48 42,528 96 1,824 3,744 1,366,560
Off-Peak 10 3 9 30 90 26,580 180 3,420 7,020 2,562,300
Night 2 0 12 0 24 - 48 912 1,872 683,280
Maintenance 4 0 0 0 0 - - - - -
Total 24 9 27 78 162 69,108 324 6,156 12,636 4,612,140
Total Passengers/Freight in Both Directions 138,216 648 12,312 25,272 9,224,280
Source: IBI Group

G O O D S M O V E M E N T R E P O R T 33
inland ports is also critical to the HSRT system. Based on studies conducted
by SCAG, development of inland ports served by rail shuttle trains would
reduce net truck VMT, lower net emissions, and encourage efficient patterns
of industrial development and land use. Establishment of inland port facili-
ties would require ongoing operating subsidies along with significant capital
investment. Implementation of an inland port/rail shuttle facility would re-
quire identification of a target market, securing of sites, improvements in the
existing port rail network, and cooperation with railroads. The Inland Empire
area has been recognized as the most promising location for an inland port
facility to address existing goods movement needs due to current demand
and infrastructure. However, land availability in the area for an inland port
facility is rapidly decreasing. This suggests that more suitable candidates for
a future inland port facility may be found in areas where land scarcity is not
a pressing concern- areas such as Barstow, Victorville, and North Los Ange-
les County. However, inland port facilities and associated costs need to be
further evaluated.
Next Steps
SCAG strives to ensure quality of life beyond the 2008 RTP as reflected by its
ongoing efforts to identify innovative solutions for the region’s goods move-
ment system. Several projects have been included in the RTP’s Strategic Plan
for feasibility analyses and to promote a long-term policy dialogue regarding
potential solutions to the region’s goods movement challenges.
These strategic projects include an extensive network of dedicated lanes for
clean technology trucks, an extension of planned HSRT, establishment of in-
land port facilities at strategic locations, and freight rail electrification. In ad-
dition to these efforts, SCAG is currently preparing two regionally significant
studies. One study would be a careful evaluation of regional goods movement
system and potential implementation strategies. The other focuses on pric-
ing mechanisms and identification of reliable financing sources for the entire
system, including goods movement projects of regional significance.
Finding solutions to many of the problems faced by the region will require
the involvement of stakeholders from both the public and private sectors.
Private entities have recognized the challenges related to goods movement
in the region and are increasingly embarking upon efforts to improve system
efficiency. One example has been UP’s plan to modernize ICTF, which would
double this facility’s capacity while at the same time improving operational
efficiency and environmental standards. The BNSF has also proposed devel-
oping a privately funded near-dock facility called SCIG, which is projected to
accommodate increasing trade volumes while also reducing truck traffic on
the I-710.
Goods movement is a vital component of the region’s transportation system
as well as the economy. Based upon trends identified in this RTP, it is evident
that growth in this sector will continue to have lasting impacts upon the re-
gion, its transportation systems, and the environment. By pursuing best suited
solutions and collaborating with stakeholders, SCAG will continue working to
develop a better future for goods movement systems in the region.

34 G O O D S M O V E M E N T R E P O R T
Appendix A: Comparison of Port Truck Volumes to Total Daily
Truck Volumes on Regional Roadways, Year 2003
Highways Segments Total Daily Vehicle
Volume Total Daily Truck
Volume Daily Port Truck
Volume Total Trucks as % of Total
Vehicle VolumePort Trucks as % of Total
Truck Volume
I-110
PCH to Sepulveda 148,000 9,900 7,810 6.7% 78.9%
Sepulveda to I-405 226,000 11,900 7,335 5.3% 61.6%
I-405 to SR-91 266,000 23,900 6,015 9.0% 25.2%
SR-91 to I-105 247,000 17,800 4,680 7.2% 26.3%
I-710
I-105 to I-10 324,000 15,900 2,485 4.9% 15.6%
PCH to Willow 146,000 25,400 23,900 17.4% 94.1%
Willow to I-405 161,000 27,100 23,235 16.8% 85.7%
I-405 to SR-91 186,000 31,400 20,045 16.9% 63.8%
SR-91 to I-105 227,000 38,300 15,315 16.9% 40.0%
I-105 to I-5 237,000 34,600 11,685 14.6% 33.8%
I-5 to SR-60 199,000 24,200 1,025 12.2% 4.2%
SR-60 to I-10 132,000 11,300 845 8.6% 7.5%
I-405
I-605 to I-710 289,000 15,700 1,875 5.4% 11.9%
I-710 to I-110 283,000 15,400 2,965 5.4% 19.3%
I-110 to SR-91 270,000 14,600 1,960 5.4% 13.4%
SR-91 to I-105 294,000 12,100 1,810 4.1% 15.0%
I-105 to I-10 310,000 12,800 1,590 4.1% 12.4%
SR-91
SR-57 to I-5 250,000 21,800 1,135 8.7% 5.2%
I-5 to I-605 283,000 39,900 1,470 14.1% 3.7%
I-605 to I-710 263,000 37,100 2,870 14.1% 7.7%
I-710 to I-110 212,000 13,700 1,385 6.5% 10.1%
I-110 to I-405 67,000 1,500 195 2.2% 13.0%
I-105
I-605 to I-710 212,000 18,800 2,800 8.9% 14.9%
I-710 to I-110 231,000 14,700 1,605 6.4% 10.9%
I-110 to I-405 243,000 13,800 390 5.7% 2.8%

G O O D S M O V E M E N T R E P O R T 35
Highways Segments Total Daily Vehicle
Volume Total Daily Truck
Volume Daily Port Truck
Volume Total Trucks as % of Total
Vehicle VolumePort Trucks as % of Total
Truck Volume
I-5
SR-57 to SR-91 223,000 21,400 225 9.6% 1.1%
SR-91 to I-605 199,000 18,600 160 9.3% 0.9%
I-605 to I-710 249,000 23,200 195 9.3% 0.8%
I-710 to SR-60 267,000 20,600 1,800 7.7% 8.7%
SR-60 to I-10 247,000 20,400 710 8.3% 3.5%
SR-60 SR-57 to I-605 265,000 23,200 1,560 8.8% 6.7%
I-105
SR-57 to I-605 259,000 18,100 1,775 7.0% 9.8%
I-605 to I-710 234,000 14,200 585 6.1% 4.1%
I-710 to I-5 254,000 9,000 190 3.5% 2.1%
SR-60 to I-110 284,000 21,600 300 7.6% 1.4%
I-605
I-405 to SR-91 245,000 11,300 20 4.6% 0.2%
I-105 to I-5 297,000 41,900 4,100 14.1% 9.8%
I-5 to SR-60 265,000 37,400 3,825 14.1% 10.2%
SR-60 to I-10 224,000 26,800 1,815 12.0% 6.8%
SR-57
I-5 to SR-91 276,000 18,800 10 6.8% 0.1%
SR-91 to SR-60 296,000 23,400 135 7.9% 0.6%
SR-60 to I-10 139,000 9,100 40 5.8% 0.5%
Source: “Baseline Transportation Study”, Port of Los Angeles, 2004; Caltrans Truck Volumes 2004 (Year 2003 data).

36 G O O D S M O V E M E N T R E P O R T
TABLE B1 TRUCK-INVOLVED FATAL COLLISIONS (1996 – 2005)
County/Region/State 1996 1997 1998 1999 2000 2001 2002 2003 2004 2005
Imperial 4 5 8 5 8 9 3 6 8 3
Los Angeles 65 70 54 48 63 72 55 56 60 50
Orange 10 16 10 15 9 14 12 14 15 15
Riverside 21 25 28 27 25 20 21 28 30 22
San Benardino 29 36 32 36 34 27 28 29 36 34
Ventura 6 7 6 3 4 5 7 9 6 2
SCAG Region 135 159 138 134 143 147 126 142 155 126
Percent of CA 36% 44% 40% 40% 39% 41% 37% 42% 45% 37%
California, excluding SCAG region 238 205 205 200 223 215 219 197 187 217
California 373 364 343 334 366 362 345 339 342 343
TABLE B2 TRUCK-INVOLVED INJURY COLLISIONS (1996 - 2005)
County/Region/State 1996 1997 1998 1999 2000 2001 2002 2003 2004 2005
Imperial 61 63 71 57 43 55 42 54 50 46
Los Angeles 2,520 2,375 2,307 2,428 2,446 2,511 2,344 2,338 2,087 2,210
Orange 524 544 563 537 560 487 449 461 497 524
Riverside 337 370 404 412 429 441 455 544 562 558
San Benardino 614 614 626 693 633 692 679 755 781 703
Ventura 134 166 141 136 143 155 166 151 124 133
SCAG Region 4,190 4,132 4,112 4,263 4,254 4,341 4,135 4,303 4,101 4,174
Percent of CA 50% 49% 49% 49% 49% 50% 50% 52% 52% 53%
California, excluding SCAG region 4,158 4,289 4,335 4,360 4,441 4,388 4,095 3,938 3,848 3,636
California 8,348 8,421 8,447 8,623 8,695 8,729 8,230 8,241 7,949 7,810
Appendix B: Truck-involved Traffic
Coll isions in Southern California
This section summarizes key findings of truck-involved traffic collisions in
Southern California by using the Statewide Integrated Traffic Records System
(SWITRS) data. The results include historical trends analysis (1996 – 2005) and
characteristics of collisions involving trucks in 2005.

G O O D S M O V E M E N T R E P O R T 37
TABLE B3 PERCENTAGE OF TRUCK-INVOLVED COLLISIONS, 2005
County/Region/State Fatal Injury Property-Damage-Only Total
Imperial 7.7% 7.0% 11.7% 9.8%
Los Angeles 7.2% 3.8% 7.6% 6.2%
Orange 7.9% 3.3% 6.1% 5.1%
Riverside 7.3% 5.4% 8.4% 7.3%
San Benardino 9.4% 6.5% 9.3% 8.4%
Ventura 3.2% 3.1% 5.0% 4.3%
SCAG Region 7.6% 4.2% 7.6% 6.3%
California, excluding SCAG region 10.0% 3.7% 6.5% 5.5%
California 9.0% 3.9% 7.0% 5.9%
TABLE B4 TYPES OF TRUCK-INVOLVED COLLISIONS, 2005
Fatal Injury Property-Damage-Only Total
County/Region/State Collisions Percent Collisions Percent Collisions Percent Collissions Percent
Imperial 3 1.8% 47 28.7% 114 69.5% 164 100%
Los Angeles 50 0.5% 2,229 23.8% 7,077 75.6% 9,356 100%
Orange 15 0.7% 531 24.6% 1,608 74.7% 2,155 100%
Riverside 22 1.1% 571 27.3% 1,495 71.6% 2,088 100%
San Benardino 34 1.2% 721 25.6% 2,065 73.2% 2,820 100%
Ventura 2 0.4% 134 26.7% 366 72.9% 502 100%
SCAG Region 126 0.7% 4,233 24.8% 12,726 74.5% 17,085 100%
California, excluding SCAG region 217 1.5% 3,577 25.0% 10,537 73.5% 14,331 100%
California 343 1.1% 7,810 24.9% 23,263 74.0% 31,416 100%

38 G O O D S M O V E M E N T R E P O R T
TABLE B5 TOP TWENTY HIGHWAYS WITH MOST TRUCK-INVOLVED
COLLISIONS, 2005
Rank Primary Road Collisions Percent
1 RT 10 1,571 9.2%
2 RT 5 1,548 9.1%
3 RT 15 946 5.5%
4 RT 60 938 5.5%
5 RT 405 725 4.2%
6 RT 91 725 4.2%
7 RT 101 549 3.2%
8 RT 710 545 3.2%
9 RT 215 432 2.5%
10 RT 210 420 2.5%
11 RT 605 418 2.4%
12 RT 57 305 1.8%
13 RT 110 262 1.5%
14 RT 118 145 0.8%
15 RT 14 142 0.8%
16 RT 105 127 0.7%
17 RT 40 106 0.6%
18 RT 55 95 0.6%
19 RT 22 91 0.5%
20 RT 134 85 0.5%
Top 20 Routes Total 10,175 60%
Grand Total 17,085 100%
TABLE B6 TYPE OF TRUCK-INVOLVED COLLISIONS, 2005
Type of Collision Collisions Percent
Sidewipe 7,314 43%
Rear End 5,175 30%
Hit Object 1,747 10%
Broadside 1,706 10%
Overturned 365 2%
Head-On 265 2%
Vehicle/Pedestrian 60 0.4%
Other 453 3%
Total 17,085 100%

G O O D S M O V E M E N T R E P O R T 39
TABLE B7 CONTRIBUTING FACTORS OF TRUCK-INVOLVED COLLISIONS
Violation Category Collisions Percent
Unsafe Speed 4,417 25.9%
Unsafe Lane Change 4,186 24.5%
Improper Turning 3,305 19.3%
Other Than Driver (or Pedestrian) 821 4.8%
Automobile Right of Way 740 4.3%
Improper Passing 477 2.8%
Driving Under the Influence of Alcohol or Drug
459 2.7%
Other Hazardous Violation 443 2.6%
Other Equipment 348 2.0%
Traffic Signals and Signs 335 2.0%
Following too Closely 235 1.5%
Wrong Side of Road 228 1.3%
Other Improper Driving 122 0.7%
Brakes 94 60.0%
Pedestrian Violation 32 20.0%
Hazardous Parking 27 20.0%
Impeding Traffic 20 10.0%
Lights 15 10.0%
Pedestrain Right of Way 8 0.05%
Fell Asleep 5 0.03%
Not Stated 228 1.3%
Unknown 522 3.1%
Total 17,085 100.0%
FIGURE B1 PERCENT OF TRUCK-INVOLVED AND PASSENGER-CAR-ONLY
COLLISIONS BY HOUR
Perc
ent
Passenger CarTruck-Involved
1
3
5
7
9
Collision Time
FIGURE B2 TRUCK-INVOLVED AND PASSENGER-CAR-ONLY COLLISIONS
BY HOUR
Thou
sand
s
Truck-InvolvedPassenger Car
4
8
12
16
20
Collision Time

40 G O O D S M O V E M E N T R E P O R T
Appendix C: Freight Rail Electrification
Report of Findings
MemorandumFrom: Cambridge Systematics
Date: August 24, 2007As part of an effort to target clean technology investments and reduce emis-
sions from freight rail movements in the Los Angeles Basin, the Southern
California Association of Governments (SCAG) performed a preliminary eval-
uation of alternative scenarios for freight rail electrification and locomotive
upgrades. The findings were included in the Freight Rail Emission Reduction
Discussion Paper, an internal draft document dated July 17, 2007. Three of
the scenarios involve rail electrification alone; the remaining two scenarios
involve upgrades to lower emission diesel locomotives to reduce emissions.
Following the issuance of the discussion paper, SCAG commissioned System
Metrics Group, Inc. and its subcontractor Cambridge Systematics, Inc. to con-
duct a study to:
Obtain updated electrification infrastructure and electric locomo-
tive costs vis-à-vis the Southern California Accelerated Rail Electri-
fication Study (1992) prepared for the Southern California Regional
Rail Authority (SCRRA), from which costs were derived for the 2007
discussion paper;
Estimate electrification implementation time, including what can be ac-
complished by 2014; and
Estimate electric power consumption, in order to determine emissions
from incremental power generation (a separate study).
These objectives are intended to support SCAG’s overall goal of assessing the
feasibility of implementing freight rail electrification to contribute to signifi-
cant regional emission reductions by 2014.
Three electrification scenarios for the Los Angeles Basin described in the
SCRRA 1992 study are the focus of the current feasibility assessment. The sce-
narios are as follows:
Scenario 1 – Primary East/West Freight Line Electrification from the Ports 1.
of Los Angeles and Long Beach to Colton and San Bernardino;
Scenario 2 – Electrification Extension to Barstow and Indio; and2.
Scenario 3 – Electrification Extension to Chatsworth and San Fernando.3.
The current study was conducted over a three-week period and represents a
high level planning assessment. The findings do not reflect engineering analy-
sis or detailed field reviews.
The purpose of this memorandum is to present the results of the study. The
results include estimated electrification costs (per mile, per electric locomo-
tive, and for each scenario), appropriate electrification milestones and their
durations, and electric power consumption associated with electrified rail.
ELECTRIFICATION COSTS
The initial object of investigation was the cost of electrifying existing rail line
per mile. The unit electrification infrastructure cost and the cost of an electric
locomotive (described later) allow us to estimate the scenario costs. At the
outset, our attention was directed to two electrification projects: Northeast
Corridor and Caltrain. Electrification of the Northeast Corridor is complete,
while Caltrain electrification has not yet begun.
NORTHEAST CORRIDOR
The Northeast Corridor Improvement Project (NECIP) is the most recently
completed major rail electrification project in the U.S. It included the electri-
fication of the Amtrak mainline between New Haven, Connecticut and Bos-
ton, a distance of 157 miles. The project extended the electrified railroad that
already existed between Washington, DC and New Haven, where previously
electric locomotives were switched for diesel-powered locomotives for the trip

G O O D S M O V E M E N T R E P O R T 41
to Boston. Electrification began in July 1996 and was completed in July 2000
(the date commonly given for completion, but see the next paragraph), about
three years later than scheduled. The NEC provides primarily passenger ser-
vices, with freight service provided through trackage rights.
The cost of electrifying the New Haven – Boston line is variously reported,
ranging from $680 million in 2000 to $727 million in 2003, exclusive of elec-
tric locomotives acquired for the electrified operations. In 2000 most of the
electrification work had been completed, but several work elements remained.
Hence, between 2000 and 2003 costs to electrify the line were still accruing.
Overall, the estimated cost of electrification increased from $300 million in
1992 to $727 million in 2003.
Electrification costs for the New Haven – Boston line included only the instal-
lation of an electrical system between the two points, covering construction
work, such as the overhead catenary system and electrical substations and
facilities, related to electrifying the line. The catenary system delivers 25kV AC
electrical power to the locomotive for traction (movement).
Generally, what constitutes electrification costs will vary depending on how
costs are tracked and reported. Variables include trackage, signal systems,
grade separations, and construction of terminals, yards, bridges, and tunnels,
in addition to the electrical system itself. As stated, for the NECIP, only the
electrical system was included in the costs of electrification.
The New Haven – Boston electrification project was fraught with difficulties
that caused both delays and cost overruns, including changed electrification
contractors in 1995 when the original contractor went out of business, un-
anticipated and difficult working conditions in the Boston area due to the
Central Artery Project (“Big Dig”), and various contractor problems. Amtrak
reportedly documented numerous instances in which the contractor did not
have the necessary equipment, personnel, and/or supplies in place to conduct
work in a timely fashion, causing relocation of electrification work and unan-
ticipated need for safety protection measures.
CALTRAIN
Caltrain plans to electrify its commuter rail line between San Francisco and
San Jose (Tamien station), a distance of 52 miles, at a cost of $471 million.
Electric rolling stock will be acquired at an additional cost. Two options are be-
ing considered: electric locomotives combined with new or overhauled, non-
powered passenger cars, or electric multiple units (commonly called EMUs),
self-propelled passenger power cars. Electrification is scheduled for comple-
tion in 2012.
Electrification components of the San Francisco – San Jose line include an
electrical system that will provide 25kV AC electrical power through an over-
head catenary system and infrastructure modifications for compatibility with
the electrical system. (Recall that for the Northeast Corridor such infrastruc-
ture modifications were not counted in the costs of electrification.)
Electrical system. This includes electrical facilities (electric power sup-
ply substations and switching stations), overhead catenary system to
distribute power to the trains, and supervisory control of the electrical
facilities and wayside switches.
Infrastructure modifications. Some infrastructure modifications are
necessary to facilitate the construction of and compatibility with the
electrification system. These include modifications to signals, com-
munications, track, and grade crossings. For example, tracks may need
to be shifted or lowered to allow foundations for poles supporting the
overhead catenary system to be installed or for the overhead wires to
be run under bridges; grade crossing warning devices may need to be up-
graded; and signal changes may be required to the wayside signals and
track circuit.
The line between San Francisco and San Jose is primarily two tracks, similar
to the Northeast Corridor, and like the latter, will deliver 25kV AC electrical
power through overhead wires. In the U.S., 12.5kV and 25kV are commonly
used, with 25kV considered to be the preferred system for high speed and long
distance operations. The 25kV AC configuration is considered to be the “mod-

42 G O O D S M O V E M E N T R E P O R T
ern” way of electrifying a railroad line, and is used in the United Kingdom,
France, Taiwan, and other countries.
Caltrain is implementing a number of capital improvement projects deemed
necessary to facilitate the transition to electrified rail operations and to enable
increased service levels. The projects and estimated costs (in 2006 dollars) are
shown in the table below.
Capital Improvement Electric Locomotives Option
State of Good Repair Projects (a) $425 M
Rolling Stock Replacement $296 M
Platform Modifications - Level Boarding $190 M
Enhancement Projects (b) $854 M
Electrification $471 M
Positive Train Control (c) $30 M
Fleet Expansion and Infrastructure $598 M
Total of Capital Improvement Costs $2,864 M
M - Millions
Source: Peninsula Corridor Joint Powers Board, Project 2025, November 30, 2006, page 30.(a) Replacement and rehabilitation of equipment and infrastructure that have reached the end of their “useful” life or
require rehabilitation.(b) Construction of new terminals, yards and maintenance or storage facilities, and grade separations.(c) Signal system that among other functions determines and displays the location of all trains within a specific area. The
new level of performance will maximize the capacity potential of electrification.
As stated earlier, Caltrain electrification costs per se include the installation of
the electrical system and implementation of necessary associated infrastruc-
ture modifications. Other improvements (as shown in the table), however re-
lated to electrification, are included under different cost categories.
INFRASTRUCTURE
Of primary interest was the calculation of the unit cost of the electrification
infrastructure (as opposed to rolling stock), in the form of cost per route mile.
The table below lists the derived costs (in millions of dollars) for the electrified
New Haven – Boston (Northeast Corridor) line and the San Francisco – San
Jose (Caltrain) line that is yet to be electrified.
Rail LineCost/Route Mile
(Year)
Cost/Route Mile in 2007 Base on Consumer Price
Index
Cost/Route Mile in 2007 Based
on 6% Increase per Year
New Haven - Boston, NEC $4.63 M (2003) $5.24 M $5.85 M
San Francisco - San Jose, Caltrain
$9.06 M (2007) $9.06 M $9.06 M
M - Millions
Unit costs in 2007 dollars are considerably different between the Northeast Cor-
ridor and Caltrain. Possible reasons for the difference include the following:
Caltrain costs include infrastructure modifications directly related to
electrification as well as the electrical system. NEC costs pertain to the
electrical system only, and it was not possible within the scope of this
study to ascertain the additional amount that could be attributed to
comparable infrastructure modifications.
Caltrain electrification will require considerable night and weekend
work because of the large number of trains that run daily (almost 100),
whereas fewer trains (26 trains at the outset) were running when Amtrak
electrified the New Haven - Boston line.
Raw materials (copper, steel, and concrete in particular) costs have expe-
rienced “steep” increases in recent years.
Given the much longer NEC line, economies of scale could have lowered
total NEC costs.
Caltrain costs are estimated expenditures; NEC costs are already
expended.
A review of the literature revealed no other concrete electrification projects in
the U.S. from which to derive comparative projected costs.
It is recommended that the Caltrain cost of $9.06 million per mile be used
to produce estimated costs for the Los Angeles Basin railroad electrification

G O O D S M O V E M E N T R E P O R T 43
scenarios (identified on pages 1-2). Many similar infrastructure modifications
would be required for Southern California as for Caltrain
In fact, electrification costs in the SCRRA 1992 study included at least some, if
not all, of the infrastructure modifications included in Caltrain electrification
costs. The lower NEC unit cost would certainly be higher (although to what
degree is unknown) if some infrastructure modifications were included as in
the Caltrain cost. Moreover, using the Caltrain cost ncorporates regional cost
assumptions (e.g., labor costs) that are applicable to the Southern California
scenarios, in comparison to the NEC experience that began a decade ago.
The larger Caltrain unit cost is offered as the better high level planning tool.
ELECTRIC LOCOMOTIVE
Capital costs of electrification also include electric locomotives which propel
trains of nonpowered trailer cars. The electric locomotive is powered by elec-
tricity from an external source such as an overhead line. If Caltrain selects
the electric locomotive option (as opposed to EMUs, as described earlier), the
Bombardier ALP 46 electric locomotive will be deployed. The ALP 46 is the
newer of the two major electric locomotives in use in the U.S. It is used by
New Jersey Transit on the Northeast Corridor.
Cost of the ALP 46 electric locomotive is approximately $5.5 million. In com-
parison, a diesel freight locomotive is reported by the Electro-Motive Division
(EMD) of General Motors to cost $2.2 million (SD-70M-2 DC locomotive).
LOS ANGELES BASIN SCENARIOS
Electrification and electric locomotive costs were produced for the three sce-
narios using the unit infrastructure cost of $9.06 million per mile and locomo-
tive cost of $5.5 million. The results are shown in the table below.
Scenario MileageCost of
Electrifica-tion
Number of Electric Locomo-
tives
Cost of Electric
Locomo-tives
Total cost
1 - Primary East/West Freight Line - Ports to Colton & San Bernardino
250 Miles $2.27 B 360 $1.98 B 4.25 B
2 - Extension to Barstow & Indio
170 Miles $1.54 B 360 $1.98 Billion $3.52 B
3 - Extension to Chatsworth and San Fernando
40 Miles $0.36 B 55 $0.36 B $0.66 B
Total, All
Scenarios460 Miles $4.17 B 775 $4.26 B $8.43 B
B - Billions
The total cost of the three scenarios based on the new unit and locomotive
costs is 31 percent greater than the total cost proposed in SCAG’s 2007 discus-
sion paper ($6.43 billion), due in large part to the much higher number used
for the electric locomotive ($5.5 million compared to $2.0 million).
In contrast, the figure used by SCAG for the cost of electrification was a de-
rived cost of $10.6 million per mile (based on the unit cost estimated in the
SCRRA 1992 study adjusted for six percent increase per year to 2007), which
being higher than the $9.06 million per mile used to produce the require-
ments shown in the table above, served to temper the increased locomotive
costs.

44 G O O D S M O V E M E N T R E P O R T
ELECTRIFICATION MILESTONES AND DURATIONS
Implementation time for the scenarios also was a study objective, centered
on what can be accomplished by 2014. The three scenarios are incremental.
Therefore, implementation of Scenario 1 was the focus.
Caltrain sources provided the best information on applicable milestones and
approximate durations that was accessible during this study. Information from
the SCRRA 1992 study was used to validate milestones and their durations
that were identified from information provided by the Caltrain electrification
project.
Electrification of the New Haven – Boston line (157 miles) required four years
assuming 2000 is used as the completion date, yielding .31 month per mile,
an arguably quick pace. Characteristics of the NEC electrification do not
make it a realistic benchmark for extrapolating construction time. First, dur-
ing construction relatively few trains were running and this minimized con-
struction delays brought about by train operations. Second, the electrification
timeline did not include infrastructure modifications, which were performed
separately from the electrification per se. Caltrain electrification, on the oth-
er hand, will take place amidst almost 100 trains a day, and infrastructure
modifications are a part of the electrification timeline. These characteristics
contribute to a more realistic model for estimating construction time in the
Los Angeles Basin.
As a result, a construction rate derived from the Caltrain projections will be
used to estimate the construction time for Scenario 1. The rate equates to
.69 month per mile based on the projected electrification of the 52-mile San
Francisco – San Jose line in a three-year timeframe.
Scenario 1 comprises two railroads with three parallel lines. In order to accel-
erate the project schedule, work could be conducted concurrently on all three
lines, instead of being conducted
on each line sequentially, and time requirements would be drastically reduced.
This is the premise behind the construction timeframe depicted in the table
below. The table shows milestones, rough estimates of durations of these mile-
stones, and applicable years for the implementation of Scenario 1.
Scenario 1
Milestone Duration Years
Preliminary Engineering and Institutional Processes (a)
3.0 2007-2009
Environmental Approvals (b) 1.5 2010-2011
Final Design 1.0 2011-2012
Procurement and Contract 0.5 2012
Construction (c) 5.2 2013-2017
Electrification Interface Testing; Locomotives Commissioning and Test
1.0 2018
Total 12.2 2007-2018
(a) Includes project definition, conceptual design, railroad and utility agreements, access rights, regulatory approvals, and full funding plan. Duration may potentially be reduced if consensus building can be accelerated.
(b) Includes a Request for Proposals (RFP) for environmental studies and environmental documentation. Duration may potentially be reduced if consensus building can be accelerated.
(c) Based on a construction rate of .69 month per mile as derived from Caltrain, San Francisco - San Jose projections (36 months to electrify 52 miles), applied to the 90-mile Burlinton Northern Santa Fe (BNSF) line in Scenario 1. Electrifica-tion of the two shorter Union Pacific (UP) lines will occur at the same time as the BNSF line. Construction includes overhead catenary system poles and wires, traction power substations, switching stations and paralleling stations; pantograph inspection platforms; associated infrastructure modifications; etc.
(d) Procurement and manufacture of locomotives occurs during construction.
Construction time of slightly over five years as shown in the table is an opti-
mistic estimate. It requires the deployment of three full construction crews,
one devoted to each of the parallel lines. The five-year estimate is based on the
time needed to complete the longest line (90 miles).
It is more reasonable to assume that additional time will be needed. The
railroads run freight trains 24 hours a day, seven days a week. Work has to
be halted when the trains pass. In the Caltrain case, however, night work is
productive because the passenger trains do not run 24 hours (making this an
assumption of the Caltrain construction rate). Clearly, density and frequency

G O O D S M O V E M E N T R E P O R T 45
of train operations will help determine how much work can be accomplished
during a 24-hour period.
How much time is associated with productivity, and any other, issues cannot
be determined with any certainty. Seven years construction time may be a
good, realistic estimate. This would push the completion of construction to
about the end of 2019, and completion of testing to about the end of 2020.
However, as noted previously, work must proceed on all three lines at the
same time, requiring three crews and very possibly additional costs. Diversion
of trains also may be necessary to allow work to proceed at an acceptable pace
given that trains run 24x7.
ELECTRIC POWER CONSUMPTION
One of the benefits of an electrified system is the reduction of diesel emissions.
The final study objective was to estimate electric power consumption per mile
to support estimates of total annual power consumption and the associated
emissions from the incremental power generation. The objective was limited
to identifying unit consumption. Subsequent analysis will be conducted by
SCAG or a third party.
According to the American Public Transportation Association (2007), “heavy
rail” power consumption equates to 5.83 kilowatt hours per vehicle mile.
Heavy rail, as opposed to light rail, is an electric railway that can support a
heavy volume of traffic, is capable of high speed and/or rapid acceleration,
and is primarily grade-separated.
KEY REFERENCES BY TOPICS
BACKGROUND
DeLeuw Cather & Company, et al. for Southern California Regional Rail
Authority, Southern California Accelerated Rail Electrification Program,
February 1992.
21st Century Science & Technology, “Why Electrified Rail Is Superior,” Sum-
mer 2005.
NORTHEAST CORRIDOR
Federal Railroad Administration, 2001 Assessment of Amtrak’s Financial Per-
formance and Requirements, January 2002.
Journal of Homeland Security, “Electrifying Transportation for Homeland Se-
curity,” February 2004.
Mineta Transportation Institute, High-Speed Rail Projects in the United States:
Identifying the Elements of Success Part 2, November 2006.
Office of the Inspector General, Audit Report, Amtrak’s High Speed Rail Elec-
trification Project, December 1999.
Personal Communication, Rick Schmedes (works with SamTrans/Caltrain, for-
merly on the NECIP), August 10, 2007.
U.S. General Accounting Office, Intercity Passenger Rail, Amtrak’s Manage-
ment of Northeast Corridor Improvements Demonstrates Need for Applying
Best Practices, February 2004.
CALTRAIN
Peninsula Corridor Joint Powers Board, Environmental Assessment/Draft En-
vironmental Impact Report, April 2004.
Peninsula Corridor Joint Powers Board, Project 2025 (Report), November 2006.
Personal Communication, Rick Schmedes (works with SamTrans/Caltrain, for-
merly on the NECIP), August 10, 2007.
G O O D S M O V E M E N T 45

46 G O O D S M O V E M E N T R E P O R T
COSTS – GENERAL
Federal Railroad Administration, High-Speed Ground Transportation for
America, September 1997.
21st Century Science & Technology, “A Plan to Revolutionize America’s Trans-
port,” Summer 2005.
U.S. Department of Labor, Bureau of Labor Statistics, May 2006.
ELECTRIC LOCOMOTIVES
Adtranz-Daimler Chrysler Rail Systems, “New Jersey Transit Purchase of ALP
46 Electric Study Locomotives” (multiple news articles), November 2001.
Morrison Knudsen Corporation, et al. for California Department of Transporta-
tion, Feasibility Study for Electrifying the Caltrain/PCS Railroad, October 1992.
Peninsula Corridor Joint Powers Board, Project 2025 (Report), November 2006.
Personal Communication, General Motors Electro-Motive Division Manager
of Sales, August 22, 2007.
Personal Communication, Rick Schmedes (works with SamTrans/Caltrain, for-
merly on the NECIP), August 10, 2007.
RAILSIM Rolling Stock Libraries, “North American Locomotives,” n.d.
MILESTONES AND IMPLEMENTATION TIME
DeLeuw Cather & Company, et al. for Southern California Regional Rail Au-
thority, Southern California Accelerated Rail Electrification Program, February
1992.
Peninsula Corridor Joint Powers Board, Environmental Assessment/Draft En-
vironmental Impact Report, April 2004.
Peninsula Corridor Joint Powers Board, Project 2025 (PowerPoint Presenta-
tion), January 2007.
Personal Communication, Rick Schmedes (works with SamTrans/Caltrain, for-
merly on the NECIP), August 10, 2007.
U.S. General Accounting Office, Intercity Passenger Rail, Amtrak’s Manage-
ment of Northeast Corridor Improvements Demonstrates Need for Applying
Best Practices, February 2004.
ELECTRIC POWER CONSUMPTION
American Public Transportation Association, 2007 Public Transportation Fact
Book, n.d.

G O O D S M O V E M E N T R E P O R T 47
Appendix D: San Pedro Bay Port
Goods Movement Strategies
The SPB ports are planning and developing specific strategies to increase ca-
pacity and enhance operational efficiency. At the same time, these strategies
attempt to minimize the impacts of goods movement activities on the envi-
ronment and public health.
ON-DOCK RAIL CAPACITY ENHANCEMENTS
Table D1 documents the growth in on-dock rail intermodal throughput com-
pared to near-dock and off-dock intermodal throughput.
TABLE D1 EXISTING TRENDS IN SAN PEDRO BAY PORT ON-DOCK RAIL
THROUGHPUT, AND COMPARISONS WITH NEAR-DOCK AND
OFF-DOCK INTERMODAL THROUGHPUT TRENDS, 2003 TO 2006
TEU 2003 2004 2005 2006
On-Dock 1,885,642 2,369,853 2,934,850 3,801,892
Percent of Port Through-put
15.9% 18.1% 20.7% 24.1%
Near Dock 962,197 936,428 1,081,350 1,271,327
Percent of Port Through-put
8.1% 7.1% 7.6% 8.1%
Off-Dock 1,805,791 1,846,199 1,689,890 1,671,489
Percent of Port Through-put
15.3% 14.1% 11.9% 10.6%
Total Direct Intermodal 4,653,630 5,152,469 5,706,090 6,744,708
Percent of Port Through-put
39.3% 39.3% 40.2% 42.8%
Total Port Throughput 11,837,064 13,101,292 14,194,442 15,759,219
Source: San Pedro Bay Port Rail Study Update, December 2006
Table D2 lists projected on-dock intermodal throughput through 2030 based
on planned on-dock rail investments at the Ports.
TABLE D2 PROJECTED SAN PEDRO BAY PORT ON-DOCK RAIL
THROUGHPUT
(millions of TEU) 2010 2015 2020 2030
POLB 2.27 4.15 5.49 6.10
Percent of Port Throughput 23% 32% 32% 30%
POLA 2.79 4.33 6.25 6.84
Percent of Port Throughput 27% 31% 33% 31%
Total SPB 5.06 8.47 11.74 12.94
Percent of Port Throughput 25% 31% 32% 30%
Source: San Pedro Bay Port Rail Study Update, December 2006
An on-dock rail capacity enhancement strategy at the Ports will be crucial in
addressing critical landside capacity constraints and environmental issues in
the region. Key constraints and issues include the following: 1) lack of capac-
ity at off-dock intermodal yards; 2) congestion and safety issues on port access
routes; and 3) air quality impacts from port truck traffic.
A report by the California Marine and Intermodal Transportation System Ad-
visory Council (CALMITSAC) observes that recent trends in increased on-dock
rail activity at the Ports can be partly attributed to the imposition of quotas by
BNSF at the Hobart off-dock intermodal yard. The Hobart yard has eliminated
free time, with the imposition of a $150 per day demurrage fee for containers.
It has been estimated that transload and domestic cargo will exceed off-dock
rail yard capacity by the 2010-2015 timeframe.
REDUCTION IN TRUCK TRIPS AND TRUCK VMT
The Port Truck Trip Reduction Strategies study analyzed the impact of in-creased on-dock rail on truck trips on four major access roadways around the Ports (I-710, I-110, SR-103, and Alameda Street). In one approach, baseline scenarios for 2010 and 2030, which already include on-dock rail investment, were compared against revised baseline scenarios for these years, which as-sumed on-dock rail capacity to be capped at 2005 levels. The study demon-strated reductions in truck traffic on these roadways and total truck VMT at-tributable to on-dock rail investments. Tables D3 and D4 highlight reductions
47 G O O D S M O V E M E N T

48 G O O D S M O V E M E N T R E P O R T
in truck traffic for 2010 and 2030 in baseline scenarios compared to alterna-tive baselines (assuming 2005 on-dock capacity). Significant truck traffic and peak hour congestion reductions are shown in Table D4.
TABLE D3 IMPACTS OF ON-DOCK RAIL ON TRUCK TRAFFIC AND VMT
(2010)
Weekday Port Container Truck Volumes by Period of Day and By Roadway and Percent-age Change from 2010 Baseline
Time Period I-710SR 47/
SR 103
HF/
AlamedaI-110
AM Peak (6:00 am - 9:00 am)
3,958 980 692 1,470
-4.8% -5.6% -5.2% -6.1%
Midday (9:00 am - 3:00 pm)
15,134 2,860 4,077 6,248
-4.5% -4.5% -5.1% -5.1%
PM Peak (3:00 pm - 7:00 pm)
5,339 1,113 1,436 2,254
-4.7% -4.6% -5.2% -7.0%
Subtotal (Daytime: 6:00 am - 7:00 pm)
24,611 4,953 6,205 9,972
-4.6% -4.8% -5.1% -5.7%
Night (7:00 pm - 6:00 am)
2,398 600 741 1,511
-5.3% -4.8% -6.4% -5.7%
Total27,009 5,553 6,946 11,483
-4.7% -4.8% -5.2% -5.7%
Total Weekday Container Truck Trips by Port and by Truck Type
Bobtails Chassis Loads Empties Total
POLB 1,161 3,294 9,598 7,400 31,453
-3.6% -8.3% -4.6% 0.0% -3.7%
POLA 18,576 3,617 14,218 11 47,184
-6.9% -19.1% -8.4% 0.0% -7.0%
Total 29,737 6,911 23,816 18,174 78,637
-5.7% -14.3% -6.9% 0.0% -5.7%
Total VMT 1,205,617
-5.7%
Source: Port Truck Trip Reduction Strategies, Final Report, December 2005
TABLE D4 IMPACTS OF ON-DOCK RAIL ON TRUCK TRAFFIC AND VMT
(2030)
Weekday Port Container Truck Volumes by Period of Day and By Roadway and Percent-age Change from 2030 Baseline Capped at 2005 On-Dock Capacity Levels
Time Period I-710SR47/SR103
HF/Alameda
I-110
AM Peak (6:00 am - 9:00 am)
9,391 2,061 1,468 2,177
-19.0% -18.0% -18.0% -22.0%
Midday (9:00 am - 3:00 pm)
37,367 6,201 8,703 9,557
-19.0% -18.0% -19.0% -20.0%
PM Peak (3:00 pm - 7:00 pm)
13,258 2,441 3,066 3,375
-19.0% -19.0% -20.0% -23.0%
Subtotal (Daytime: 6:00 am - 7:00 pm)
60,015 10,703 13,237 15,109
-19.0% -18.0% -19.0% -22.0%
Night (7:00 pm - 6:00 am)
5,223 1,147 1,393 2,270
-17.0% -16.0% -18.0% -22.0%
Total65,238 11,849 14,630 17,379
-19.0% -18.0% -19.0% -22.0%
Total Weekday Container Truck Trips by Port and by Truck Type
Bobtails Chassis Loads Empties Total
POLB 32,147 8,570 27,333 22,546 90,596
-20.0% -41.0% -23.0% 0.0% -20.0%
POLA 29,819 6,047 22,445 18,845 77,156
-19.0% -43.0% -23.0% 0.0% -19.0%
Total 61,966 14,617 49,778 41,391 167,752
-19.0% -42.0% -23.0% 0.0% -19.0%
Total VMT 2,571,855
-19.0%
Source: Port Truck Trip Reduction Strategies, Final Report, December 2005

G O O D S M O V E M E N T R E P O R T 49
One on-dock intermodal trains can eliminate approximately 750 truck trips
from the local highway networks around the Ports. Given forecasted growth
in cargo volumes, and full on-dock capacity available by 2030, on-dock rail is
estimated to remove nearly 29,000 daily truck trips.
EMISSION REDUCTION
The Port Truck Trip Reduction Strategies study performed a detailed analysis of
emission reduction benefits from increased on-dock rail for the region. Two
on-dock rail scenarios were tested in the study to analyze their performance in
emission reduction by type of pollutant, which included:
A 2005 increased on-dock rail scenario involving 1 eastbound train per
week per terminal, and
The 2010 baseline scenario compared to the 2010 alternative baseline
that assumed on-dock rail capped at the 2005 level in 2010.
Table D5 presents emission reductions from the above two scenarios in per-
cent reduction of emissions compared to baseline by type of pollutant.
Statistics in Table 5 show that increased on-dock rail has notable emission
reduction benefits for each of the four pollutant types.
PRODUCTIVITY BENEFITS
The movement of containerized cargo by on-dock rail has higher efficiency and
productivity than near-dock or off-dock intermodal yards. This is because:
Movement of cargo by on-dock rail involves one-time loading or un-
loading, whereas near-dock or off-dock rail require trucks to transport
cargo between docks and railcars;
There can be delays in truck loading/unloading at marine terminals due
to delays at gates, which can affect productivity;
Congestion on the highway system can impact reliability and productiv-
ity for near-dock and off-dock yards; and
On-dock yards only involve direct intermodal cargo, whereas trans-
loaded cargo moving through off-dock yards requires transload-
TABLE D5 EMISSION REDUCTION FROM INCREASED ON-DOCK RAIL
ScenariosTruck VMT
Per Day
Change in Truck VMT Per
Day
Net Emissions (Tons Per Day) Percent Reductions from Base
ROG CO NOX
PM10
ROG CO NOX
PM10
2005 Scenarios
Increased On-Dock Rail (1 eastbound train per
week per terminal)999,691 -17,807 -0.010 -0.048 -0.2178 -0.0035 -1.33% -1.61% -1.13% -1.03%
2010 Scenarios
On-Dock Rail Base 2010 Comparison with Revised
2010 Baseline -72,302 -0.037 -0.120 -0.916 -0.010 -4.75% -4.59% -4.95% -3.81%
Source: Port Truck Trip Reduction Strategies, Final Report, December 2005

50 G O O D S M O V E M E N T R E P O R T
ing/distribution facilities, which increases container lead times and
reduces productivity.
PIERPASS OFF-PEAK PROGRAM
The PierPass program was launched in July 2005, to alleviate truck conges-
tion and improve air quality in the region. The OffPeak program provides an
incentive for cargo owners and their carriers to move cargo during nighttime
periods and weekends to reduce truck traffic during peak day time periods on
major highways, and to decrease negative air quality impacts from high peak
period truck traffic volumes. The program is based on a market incentive ap-
proach where all containers entering or exiting marine terminals at the Ports
during the peak day time hours (Monday through Friday, 3:00 am to 6:00 pm)
are charged a Traffic Mitigation Fee (TMF). Trucks entering or exiting during
the off-peak shift (Monday through Thursday, 3:00 pm to 6:00 am) or anytime
between 6:00 pm Friday to 3:00 am Monday, avoid the TMF. This provides an
incentive for truck drayage companies to operate during these off-peak time
periods. Landside and terminal capacity constraints affecting the implemen-
tation of the OffPeak program include peak-period congestion on port access
routes, and port terminal gate capacity constraints.
The PierPass program has been successful in shifting truck trips from peak to
off-peak periods, reducing peak period congestion, and improving utilization
of port terminal gate capacity. On a typical day, more than 10,000 trucks
use off-peak shifts, alleviating congestion during peak-day time periods. This
translates to approximately 30% - 35% of container throughput from the
Ports shifting to the off-peak periods, exceeding the targets of the program.
According to the Alameda Corridor Transportation Authority (ACTA), peak
hour truck traffic on I-710 was reduced by an estimated 24% due to the Off-
Peak program.
The Port Truck Trip Reduction Strategies study looked at the reduction in peak
period truck trips due to extended gate hours. The following scenarios were
analyzed in the study:
68% day and 32% night container moves, with no shift to weekends,
in 2010
68% day and 32% night container moves, with 20% of weekly gate
moves allotted to weekends, in 2010
Tables D6 and D7 present the reduction in truck trips from extended gate hour
strategies at the Ports. Statistics show that significant truck trip reductions
can be achieved on all the major access routes to the Ports in the A.M. and
mid-day time periods in 2010 through extended gate hour strategies, shifting
truck trips to the nighttime period and weekends.

G O O D S M O V E M E N T R E P O R T 51
TABLE D6 EXTENDED GATE HOURS (68% DAY, 32% NIGHT) WITH NO
SHIFT TO WEEKEND (2010)
Weekday Port Container Truck Volumes by Period of Day and By Roadway and Percent-age Change from 2010 Baseline
Time Period I-710SR 47/SR 103
HF/Alame-
daI-110
AM Peak (6:00 am - 9:00 am)
2,211 516 382 776
-44.1% -47.4% -44.9% -47.2%
Midday (9:00 am - 3:00 pm)
12,209 2,385 3,330 5,380
-20.3% -16.6% -18.3% -13.9%
PM Peak (3:00 pm - 7:00 pm)
5,674 1,208 1,560 2,426
6.3% 8.5% 8.6% 7.6%
Subtotal (Daytime:6:00 am - 7:00 pm)
20,093 4,109 5,272 8,582
-18.4% -17.1% -15.0% -13.9%
Night (7:00 pm - 6:00 am)
6,688 1,302 1,827 2,935
178.9% 116.9% 146.4% 94.2%
Total 26,781 5,410 7,099 11,517
-0.8% -2.6% 2.2% 0.3%
Total Weekday Container Truck Trips by Port and by Truck Type
Bobtails Chassis Loads Empties Total
POLB 11,161 3,294 9,598 7,400 31,453
0.0% 0.0% 0.0% 0.0% 0.0%
POLA 18,576 3,617 14,218 10,774 47,184
0.0% 0.0% 0.0% 0.0% 0.0%
Total 29,736 6,911 23,816 18,174 78,638
0.0% 0.0% 0.0% 0.0% 0.0%
Total VMT 1,205,617
Percent Change 0.0%
Source: Port Truck Trip Reduction Strategies, Final Report, December 2005
TABLE D7 EXTENDED GATE HOURS (68% DAY, 32% NIGHT) WITH 20%
WEEKDAY SHIFT TO WEEKEND (2010)
Weekday Port Container Truck Volumes by Period of Day and By Roadway and Percent-age Change from 2010 Baseline
Time Period I-710SR 47/SR 103
HF/Alame-da
I-110
AM Peak (6:00 am - 9:00 am)
1,956 457 331 714
-50.6% -53.4% -52.2% -51.4%
Midday (9:00 am - 3:00 pm)
10,810 2,114 2,914 4,948
-29.4% -26.1% -28.5% -20.8%
PM Peak (3:00 pm - 7:00 pm)
5,007 1,069 1,366 2,276
-6.2% -4.0% -4.9% 1.0%
Subtotal (Daytime: 6:00 am - 7:00 pm)
17,774 3,640 4,612 7,938
-27.8% -26.5% -25.7% -20.4%
Night (7:00 pm - 6:00 am)
5,914 1,153 1,597 2,710
146.6% 92.1% 115.4% 79.3%
Total 23,688 4,793 6,208 10,648
-12.3% -13.7% -10.6% -7.3%
Total Weekday Container Truck Trips by Port and by Truck Type
Bobtails Chassis Loads Empties Total
POLB 9,734 2,886 8,372 6,440 27,431
-12.8% -12.4% -12.8% -13.0% -12.8%
POLA 16,642 3,256 12,728 9,603 42,229
-10.4% -10.0% -10.5% -10.9% -10.5%
Total 26,375 6,141 21,100 16,043 69,660
-11.3% -11.1% -11.4% -11.7% -11.4%
Total VMT 1,067,979
Percent Change -11.4%
Source: Port Truck Trip Reduction Strategies, Final Report, December 2005

52 G O O D S M O V E M E N T R E P O R T
OTHER BENEFITS
Other potential benefits of the OffPeak program include:
Improved monitoring of trucks entering and exiting marine terminals as
part of the program, may allow for improved regulation of trucks, espe-
cially in assessing equipment standards and ensuring that trucks meet
air quality requirements;
Increased truck turn times in harbor trucking due to improved efficien-
cy; and
Improved ability for harbor trucking companies to assess premiums from
shippers for off-peak operations (due to the savings in Traffic Mitigation
Fee), which are also ultimately passed on to the drivers providing incen-
tives to work during off-peak periods.
VIRTUAL CONTAINER YARDS
A Virtual Container Yard (VCY) is an innovative empty container manage-
ment strategy to reduce truck movements of empty containers in and out of
port terminal gates. In many cases, after an import container is unloaded by
the importer (or a transloader), it is returned to the Ports or an off-site depot
for storage until an exporter calls for a container. In the SCAG region, virtu-
ally all loaded import containers are trucked back to the Ports empty (after
unloading at the importer’s location or a transload facility) with only about
2% matched with shippers needing an export container en route to the Ports.
In 2000, more than one million empty containers were trucked back to the
Ports after unloading, while approximately 500,000 empty containers were
trucked to access facilities from the Ports for export loading.
The VCY concept is based on a computerized matching system that tracks the
location of empty import containers and matches them with export container
requirements prior to returning to the Ports to facilitate “street turn” con-
tainer interchanges between the importer/transloader and exporter locations.
The VCY concept could increase empty container re-use from the current 2%
to almost 10%, which would result in reductions of empty container truck
trips around the Ports.
Figure D1 depicts the VCY concept in comparison with the traditional empty
container logistics practice.
FIGURE D1 VCY CONCEPT AND TRADITIONAL PORT EMPTY CONTAINER
LOGISTICS
Traditional Import / Export Cycle
Exporter Importer
Port
Empty Em
pty
Exporter Importer
Port
Empty
Source: Alameda Corridor Transportation Authority
The Empty Ocean Container Logistics Study conducted by The Tioga Group
estimated 2000 baseline and forecasted empty container flows for the San Pe-
dro Bay port marine terminals through 2020. These estimates are provided in
Table D8. The largest share of empty trips to and from the Ports are associated
with local shippers and consignees. The number of empty truck trips from
importer/transload facilities to the Ports (westbound flow) is projected to in-
crease from more than 3.5 million TEUs in 2000 to over 14.4 million TEUs in
2020, which is an average annual growth rate of slightly over 7%.

G O O D S M O V E M E N T R E P O R T 53
TABLE D8 BASE YEAR AND FORECASTED EMPTY CONTAINER FLOWS
2000 2010 2015 2020
TEU Units TEU Units TEU Units TEU Units
Eastbound to Exporters 1,324,476 715,933 2,738,344 1,480,186 3,631,065 1,968,738 5,027,971 2,717,822
Via Rail 22,169 11,983 80,413 43,467 116,400 62,919 170,494 92,159
On-Dock Intermodal 22,169 11,983 80,413 43,467 116,400 62,919 170,494 92,159
Via Truck 1,302,306 703,949 2,657,931 1,436,719 3,514,665 1,899,819 4,857,476 2,625,663
Off-Dock Intermodal 51,728 27,961 187,631 101,422 271,600 146,811 397,820 215,038
Local for Export Loading 1,017,137 549,804 2,053,720 1,110,119 2,618,965 1,415,657 3,514,937 1,899,966
SSL Off-Hires to Depots 233,441 126,184 416,579 225,178 624,100 337,351 944,719 510,659
Westbound to the Ports 3,568,312 1,928,817 6,367,713 3,442,007 9,539,815 5,156,657 14,440,698 7,805,783
Via Rail 278,128 150,339 501,602 271,136 731,291 395,293 1,084,536 586,236
On-Dock Intermodal 278,128 150,339 501,602 271,136 731,291 395,293 1,084,536 586,236
Via Truck 3,290,183 1,778,478 5,866,112 3,170,871 8,808,524 4,761,364 13,356,161 7,219,547
Off-Dock Intermodal 564,600 305,189 920,401 497,514 1,491,797 806,377 2,366,438 1,279,156
Local form Import Loads 2,084,712 1,126,871 3,842,221 2,076,876 5,661,030 3,060,016 8,483,038 4,585,426
Local from WB Domestic Loads
64,897 35,079 105,793 57,186 171,471 92,687 272,004 147,029
Repo Off-Hires from Depots
333,487 180,263 595,113 321,683 891,572 481,931 1,349,598 729,512
Local Empties from Trans-loads
242,488 131,075 402,583 217,613 592,655 320,354 885,083 478,423
Bobtail Trip Change 0 0 0 0
Port Subtotal 4,892,787 2,644,750 9,106,058 4,922,193 13,170,880 7,119,395 19,468,669 10,523,605
On-Dock Rail 300,297 162,323 582,015 314,603 847,691 458,211 1,255,031 678,395
Truck through Terminal Gates
4,592,490 2,482,427 8,524,043 4,607,591 12,323,189 6,661,183 18,213,638 9,845,210
Cross-Town Truck Factor 149,184 90,640 268,159 144,951 399,506 215,949 602,663 325,764
Local Off-hires to Depots 3% 80,577 43,555 146,796 79,349 216,030 116,773 323,278 174,745
IM Off-Hires to Depots 3% 19,469 10,524 31,738 17,156 51,441 27,806 81,601 44,109
Reused empties for exports
2% 49,138 26,561 89,624 48,446 132,035 71,370 197,784 106,910
Grand Total 5,041,972 2,725,390 9,374,216 5,067,144 13,570,387 7,335,344 20,071,332 10,849,368
Source: EmptyOceanContainerLogisticsStudy,TheTiogaGroup

54 G O O D S M O V E M E N T R E P O R T
Key constraints and issues related to the movement of empty containers in
Southern California include:
Marine terminal yard capacity constraints due to higher terminal space
usage by empty containers resulting from permitted longer dwell times;
Delays at marine terminal gate due to empty container volumes moving
through the Ports;
Truck traffic volume and congestion due to empty container logistics.
The first virtual container yard program has operated at the SPB ports since
July 2006. Tables D9 and D10 show potential savings in annual truck trips
and VMT that could result from VCY strategies assuming 5% and 10% con-
tainer reuse through 2020.
TABLE D9 TRUCK TRIP SAVINGS FROM VIRTUAL CONTAINER YARD
STRATEGIES
Scenarios 2010 2015 2020
Base Case 3,186,995 4,475,673 6,485,392
VCY (5% Reuse) - Total Trips 3,029,304 4,243,363 6,137,400
VCY (5% Reuse) - Trips Saved 157,691 232,310 347,992
VCY (5% Reuse) - % Reduction -4.9% -5.2% -5.4%
VCY (10% Reuse) - Total Trips 2,766,487 3,856,179 5,557,412
VCY (10% Reuse) - Trips Saved 420,508 619,494 927,980
VCY (10% Reuse) - % Reduction -13.2% -13.8% -14.3%
Source: Empty Ocean Container Logistics Study, The Tioga Group
TABLE D10 EMPTY CONTAINER ANNUAL TRUCK VMT SAVINGS FROM
VIRTUAL CONTAINER YARD STRATEGIES
Scenarios 2010 2015 2020
Base Case 64,040,254 92,374,112 136,322,325
VCY (5% Reuse) - Total VMT 61,852,813 89,151,532 131,494,795
VCY (5% Reuse) - VMT Reduction 2,187,441 3,222,580 4,827,530
VCY (5% Reuse) - % Reduction -3.4% -3.5% -3.5%
VCY (10% Reuse) - Total VMT 58,207,077 83,780,567 123,448,912
VCY (10% Reuse) - VMT Reduction 5,833,177 8,593,545 12,873,413
VCY (10% Reuse) - % Reduction -9.1% -9.3% -9.4%
Source: Empty Ocean Container Logistics Study, The Tioga Group
VCY strategies may have significant VMT reduction benefits as some of the
trips associated with “street turns” will potentially have lower trip lengths.
Table D11 shows the emission reduction benefits by type of pollutant result-
ing from VCY strategies through 2020.

G O O D S M O V E M E N T R E P O R T 55
TABLE D11 EMISSION REDUCTIONS FROM VCY STRATEGIES
Scenario & Emis-sions Type
2010 2015 2020
Annual Tons
Peak Day Tons
Annual Tons
Peak Day Tons
Annual Tons
Peak Day Tons
Base Case
Carbon Monoxide 925 3.98 1,335 5.75 1,970 8.48
Total Organic Gases 211 0.91 304 1.31 449 1.93
Reactive Organic Gases
206 0.89 297 1.28 438 1.89
Oxides of Nitrogen 783 3.37 1,129 4.85 1,666 7.17
Exhaust Particulates 73 0.31 105 0.45 155 0.67
Tier I - 5% Reuse
Carbon Monoxide 894 3.95 1,288 5.55 1,900 8.18
Reduction 32 0.14 47 0.20 70 0.30
Total Organic Gases 204 0.88 294 1.26 433 1.86
Reduction 7 0.03 11 0.05 16 0.07
Reactive Organic Gases
199 0.86 287 1.23 423 1.82
Reduction 7 0.03 10 0.04 16 0.07
Oxides of Nitrogen 756 3.26 1,090 4.69 1,607 6.92
Reduction 27 0.12 39 0.17 59 0.25
Exhaust Particulates 70 0.30 101 0.44 149 0.64
Reduction 2 0.01 4 0.02 5 0.02
Tier II - 10% Reuse
Carbon Monoxide 841 3.62 1,211 5.21 1,784 7.68
Reduction 84 0.36 124 0.53 186 0.80
Total Organic Gases 192 0.83 276 1.19 407 1.75
Reduction 19 0.08 28 0.12 42 0.18
Reactive Organic Gases
187 0.81 269 1.16 397 1.71
Reduction 19 0.08 28 0.12 41 0.18
Oxides of Nitrogen 712 3.06 1,024 4.41 1,617 6.96
Reduction 71 0.31 105 0.45 50 0.21
Scenario & Emis-sions Type
2010 2015 2020
Annual Tons
Peak Day Tons
Annual Tons
Peak Day Tons
Annual Tons
Peak Day Tons
Exhaust Particulates 66 0.28 95 0.41 140 0.60
Reduction 7 0.03 10 0.04 15 0.06
Source: Empty Ocean Container Logistics Study, The Tioga Group
PORT CLEAN AIR ACTION PLAN PROJECTS
The San Pedro Bay Port Clean Air Action Plan (CAAP) is a five-year action plan
developed by the Ports to establish goals and standards for air quality in the
region and identify specific projects, programs, control measures, and tech-
nologies to meet those air quality goals/standards through multi-party col-
laboration for successful project funding and implementation. The five-year
plan is a blueprint for the Ports to significantly reduce the health risks posed
by air pollution from port-related ships, trains, trucks, terminal equipment,
and harbor craft. The Plan will be reviewed and updated on an annual basis
to assess and evaluate the effectiveness of current strategies to meet air quality
goals, test new strategies and control measures, and jointly develop a revised
and improved CAAP annually. The Ports have committed a total of $417.9
million, of which $166.0 million is allocated as truck engine replacement/
retrofit incentives. The broad categories for the performance standards based
on the type of sources are:
Engine standards for Heavy Duty Trucks to meet EPA 2007 on-road PM emis-
sion standards (0.01 g/bhp-hr)
Heavy duty truck engine replacement/retrofit
Vessel Speed Reduction (VSR) for OGVs
Low Sulfur Marine Gas Oil (MGO) fuel in auxiliary and main engines of OGVs
Shore power (cold ironing) at marine terminals

56 G O O D S M O V E M E N T R E P O R T
Diesel Particulate Matter (DPM) and NOx emission control devices for auxil-
iary and main engines of OGVs
Engine standards to meet EPA 2007 on-road PM emission standards (0.01
g/bhp-hr) for cargo handling equipments (CHE), or alternative use of Veri-
fied Diesel Emissions Controls (VDECs) on engines not meeting EPA’s PM
emission standards
EPA 2007 on-road or Tier 4 engine standards for yard tractors, top picks, fork-
lifts, reach stackers, rubber tired gantries, and straddle carriers.
EPA engine standards and NOx/PM emission reduction technologies for
harbor craft
EPA engine standards, idling-limiting devices, and alternative diesel fuels for
switcher, helper and long-haul locomotives
ENVIRONMENTAL AND PUBLIC HEALTH ISSUES
The Multiple Air Toxics Exposure Study (MATES) by the South Coast Air Qual-
ity Management District (SCAQMD) identified emissions from port-related
sources as a major concern for public health in the region. A large share of
pollutant emissions in the South Coast Air Basin come from the SPB ports as
Figures D2, D3, and D4 illustrate.
FIGURE D2 DIESEL PARTICULATE MATTER (DPM) EMISSIONS BY SOURCE
IN SCAB
Total San Pedro Bay Ports Related0.12
Total Other Mobile0.48
Total Stationary and Area0.15
Total On-Road0.25
Source: San Pedro Bay Ports Clean Air Action Plan
FIGURE D3 NOX EMISSIONS BY SOURCE IN SCAB
Total San Pedro Bay Ports Related0.09
Total Stationary and Area0.08
Total On-Road0.56
Total Other Mobile0.27
Source: San Pedro Bay Ports Clean Air Action Plan

G O O D S M O V E M E N T R E P O R T 57
FIGURE D4 SOX EMISSIONS BY SOURCE IN SCAB
Total On-Road0.07
Total Stationary and Area0.41
Total Other Mobile0.07
Total San Pedro Bay Ports Related0.45
Source: San Pedro Bay Ports Clean Air Action Plan
EMISSION REDUCTIONS FROM CAAP MEASURES
The initial development and implementation of CAAP control measures
and strategies for emissions reduction from port-related sources focuses on
emissions from heavy-duty trucks, cargo handling equipment, and ocean go-
ing vessels. A quantitative assessment of the benefits of the CAAP control
measures estimates emission reductions of 47% for Diesel Particulate Matter
(DPM), 45% for NOX, and 52% for SOX by 2011.
