making the links between teachers' professional standards
TRANSCRIPT

Research Report DFE-RR075
Making the links between teachers' professional standards, induction, performance management and continuing professional development
Matthew Walker Jennifer Jeffes Ruth Hart Pippa Lord Kay Kinder National Foundation for Educational Research

This research report was commissioned before the new UK Government took office on 11 May 2010. As a result the content may not reflect current
Government policy and may make reference to the Department for Children, Schools and Families (DCSF) which has now been replaced by the Department
for Education (DFE).
The views expressed in this report are the authors’ and do not necessarily reflect those of the Department for Education.
Contents
Executive Summary i
1. Introduction 1 1.1 The strands of new professionalism and making the links 1 1.2 Research aims 2 1.3 Methodology 3 1.4 Sample design and sampling procedures 4 1.5 Analysis and reporting 5 1.6 Structure of this report 6 2. Scoping the literature 8 2.1 Introduction 9 2.2 Professional Standards 9 2.3 Performance Management 10 2.4 Continuing Professional Development (CPD) 12 2.5 Induction 19 2.6 Making the links 25 2.7 Conclusion 27 3. The professional standards for teachers 28 3.1 Introduction 28 3.2 Familiarity with the professional standards 29 3.3 Usage and usefulness of the professional standards 30 3.4 Impacts relating to the professional standards 35 3.5 Regression analysis on findings relating to the professional
standards for teachers 39
3.6 Usage and usefulness of the professional standards for teachers: regression analysis
39
4. Performance management 41 4.1 Introduction 42 4.2 Familiarity with performance management regulations and
policies in schools 42
4.3 About teachers’ performance management and their engagement with the process
47
4.4 About headteachers’ performance management and their engagement with the process
57
4.5 Annual reports and monitoring 61 4.6 The local authority’s role 63 4.7 Impacts relating to performance management 64 4.8 Regression analysis on findings relating to performance
management 70
4.9 Engagement with performance management: regression analysis
70
4.10 Impacts of performance management: regression analysis 71
5. Induction 72 5.1 Introduction 72 5.2 Familiarity with induction regulations and policies in schools 73 5.3 Induction arrangements in schools 74 5.4 NQTs’ engagement with and views on induction 80 5.5 The induction tutor’s role 82 5.6 The local authority’s role 83 5.7 Impacts relating to induction 83 5.8 Regression analysis on findings relating to induction 85 5.9 Positivity towards induction arrangements: regression analysis 86 5.10 Impacts of induction: regression analysis 86 6. Continuing Professional Development 87 6.1 Introduction 88 6.2 Access to, and engagement with, CPD 88 6.3 Mentoring and coaching 93 6.4 Evaluating CPD 96 6.5 Impacts of CPD 97 6.6 Regression analysis of findings relating to CPD 101 6.7 Meeting CPD needs: regression analysis 102 6.8 Impacts of CPD: regression analysis 102 7. Making the links 104 7.1 Introduction 105 7.2 Extent of links in school 105 7.3 Support and guidance for making the links 108 7.4 Additional advice required 110 7.5 Overall impacts 113 8. The New Professionalism Journey 122 8.1 NFER’s impact model 122 8.2 Level 1 impacts (awareness of new professionalism and
experiences of implementation) 123
8.3 Level 2 impacts (changes to professionals’ experience and attitudes)
123
8.4 Level 3 impacts (outcomes for children and young people) 124 8.5 Level 4 impacts (embedding) 124 8.6 The strands compared 125 9. Conclusion 128
References 132
Appendix A: Sample profile 134

Acknowledgements The research team would like to thank the schools who agreed to participate in the evaluation. We would also like to thank Jenny Hudson and Julie Thompson, project administrators, Palak Mehta and Tilaye Yeshanew, project statisticians, and David Hereward from our research data services group, all of whom have provided outstanding support to the research team. Finally, the research team would like to thank the Department for Education for funding and managing this research, and in particular Sarah Baker, for the consistently cooperative, responsive and facilitative support and research management.
Executive summary i
Executive Summary
Making the links between professional standards, induction, performance management and continuing professional
development of teachers: A study
Matthew Walker, Jennifer Jeffes, Ruth Hart, Pippa Lord and Kay Kinder
Report brief This report sets out the findings from a study evaluating the extent to which ‘new professionalism’ has been introduced in schools, and its impact on teaching and learning. For the purposes of the research, ‘new professionalism’ is taken to include professional standards, performance management, ongoing continuing professional development (CPD) and newly qualified teacher (NQT) induction.
New professionalism • In 2003, the National Agreement
set out measures to raise standardsand tackle workloads (ATL et al.,2003).
• Alongside these measures to tackleworkloads, the National Agreementset out workforce reforms. Thesereforms ushered in a newprofessionalism for teachers,encompassing new professionalstandards for teachers; performancemanagement arrangements forteachers and headteachers; and thepromotion of professionaldevelopment as an integral part of ateacher’s everyday life.
• The links between the strands areimportant, as it has been shownthat schools placing CPD at theheart of their planning forimprovement, and integratingperformance management, self-review and CPD into a coherent
cycle, raise standards and improve teaching (Ofsted, 2006).
Scope of the study • The overarching aims of the
evaluation were to:
- establish how and to whatextent schools have implemented NewProfessionalism
- identify, explore andaccount for the impacts ofnew professionalism onteaching and learning inschools.
• The study was commissioned bythe then Department for Children,Schools and Families (now theDepartment for Education) andcarried out by a team at the
Executive summary ii
• National Foundation for Educational Research (NFER).
• The report’s findings were drawn from a literature review and survey returns from: 707 headteachers; 1392 teachers; 355 newly qualified teachers (NQTs)/2nd year teachers; 441 induction tutors; 955 governors; and 57 local authority (LA) officers. The average response rate across respondent groups was 20 per cent.
Conclusions and overview of the findings Overall, the survey data suggests that schools are implementing the four strands of new professionalism, and that this is making a difference to aspects of teachers’ and headteachers’ working practices. Awareness of the four strands was high, and the majority of respondents reported that each of the four strands had led to improvements in teaching and learning practices. The professional standards, schools’ performance management and induction arrangements, and respondents’ experiences of CPD were all perceived to be contributing to improving pupils’ progress, albeit to varying degrees.
The professional standards for teachers • Overall, staff at all levels were
familiar with the professional standards – most to a ‘great extent’.
• Headteachers and induction tutors reported being particularly familiar with the standards (more than four out of five reported this ‘to a great extent’). NQTs/2nd year teachers were slightly more familiar than teachers (just over three-fifths of NQTs reported their familiarity ‘to a great extent’, while under three-fifths of teachers did so).
• While about half of the teachers reported that using the standards had helped to contribute to whole school improvement or had led to improvements in their pupils’ outcomes/progress, more than one in ten teachers ‘disagreed’ or ‘strongly disagreed’ that the standards had impacted on either area (12 per cent and 15 per cent respectively).
Performance management • Awareness of the revised
performance management regulations introduced in September 2007 was high amongst headteachers and school governors.
• The vast majority of headteachers, school governors and induction tutors, and about two-thirds of teachers ‘agreed’ or ‘strongly agreed’ that the performance management arrangements had helped teachers to improve their teaching and learning practices, and overall, headteachers and teachers reported that their school encouraged teachers to engage in professional dialogue about their performance.
• The majority of respondents agreed that performance management had helped improve pupils’ outcomes/progress. This finding was broadly in line with the evidence from the literature, which suggests that when undertaken in a systematic way across the school workforce, staff development underpinned by performance management can lead to improved outcomes for pupils and staff.
Induction • Overall, headteachers and local
authority respondents were aware of the revised induction arrangements introduced in
Executive summary iii
September 2008, and a high proportion of respondents reported their schools had induction arrangements in place which took account of these revisions.
• Staff at all levels reported that their school’s current induction arrangements were providing NQTs with the statutory reduction in their teaching timetable, and the majority of headteachers, induction tutors and NQTs/2nd year teachers reported that their school’s current induction arrangements were tailored to NQTs’ individual needs.
• The vast majority of respondents ‘agreed’ or ‘strongly agreed’ that NQTs’ experiences of induction were having an impact, particularly in helping them to work towards meeting the Core Standards and to improving their teaching and learning practices.
Continuing professional development • In general, school staff and
governors appeared to believe that their school enabled teachers to access relevant CPD opportunities. There were some differences in opinion by professional group and school type.
• Nine out of ten headteachers reported that the impact of CPD was evaluated, typically as part of the performance management process, and in terms of impact on pupils. Three-quarters of governors and two-thirds of local authority respondents reported receiving information from their schools on the impact of CPD.
• Overall, CPD was perceived to have helped improve teaching and learning in schools, with only limited variation between professional groups and no statistically significant differences
by school type or teachers’ length of service.
Making the links • Overall, the majority of staff at all
levels reported that their schools were making links between the strands, at least ‘to a small extent’.
• The majority of headteachers reported that they had been able to link together the four strands to smooth the transition from induction to early career teaching, support teachers in developing their performance, and inform school improvement planning, at least ‘to a small extent’.
• Eight out of ten headteachers felt that their School Development Plan and/or Self Evaluation Form enabled them to identify the links between the strands ‘to some extent’ or ‘to a great extent’.
• The majority of headteachers ‘agreed’ or ‘strongly agreed’ that the implementation of new professionalism had made them more effective in managing and leading their school and more able to support teachers to access pay progression opportunities.
• The majority of respondents agreed that as a result of new professionalism, they or teachers in their school were now more able to exercise their own professional judgement in their teaching and learning practices, gave more recognition to the importance of a good work-life balance, received the recognition they deserved for the contribution they made to teaching and learning, and had been more able to access pay progression opportunities.
Introduction 1
1. Introduction This report sets out the findings from a study evaluating the extent to which ‘new professionalism’ has been introduced in schools, and its impact on teaching and learning. For the purposes of the research, ‘new professionalism’ is taken to include professional standards, performance management, continuing professional development (CPD) and newly qualified teacher (NQT) induction. The study was commissioned by the Department for Children, Schools and Families (now the Department for Education) and carried out by a team at the National Foundation for Educational Research (NFER), Northern Office.
1.1 The strands of new professionalism and making the links In 2003, the majority of the school workforce unions and employers and the then Department for Education and Skills (DfES) introduced a national agreement on raising standards and tackling workloads (ATL et al., 2003). Through a seven-point plan, this agreement aimed to reduce pressure on teachers’ working hours (for example through guaranteed planning, preparation and assessment time within the school day), and contractually remove clerical and administrative tasks and any unnecessary paperwork and bureaucratic processes from teachers and headteachers. Alongside these measures to tackle workloads, the national agreement also set out workforce reforms, encouraging schools to increase the number of support staff and higher level teaching assistants (HLTAs), and to recruit new business and personnel managers to their leadership teams. Building capacity amongst other areas of the workforce would enable teachers to focus on their core role and also enhance their professional status. In addition, the Agreement on Rewards and Incentives for Post-Threshold Teachers and Members of the Leadership Group (DfES, 2004) set out new links between performance, progression and pay. These reforms ushered in a new professionalism for teachers, encompassing new professional standards for teachers, performance management (PM) arrangements for teachers and headteachers, and the promotion of professional development as an integral part of a teacher’s everyday life. The changes have been introduced over the last three years. The Professional Standards for
Introduction 2
Teachers in England were introduced in September 2007, while the new induction regulations and guidance were introduced in September 2008. The revised performance-management arrangements came into effect from 1 September 2009. The framework for new professionalism (put forward by the Rewards and Incentive Group (RIG) in 2005) is housed with the Training and Development Agency for Schools (TDA), the national agency and recognised sector body responsible for the training and development of the school workforce in England. Their remit also covers the induction of teachers, which additionally was evaluated here as part of new professionalism. The principles which guide the new professionalism emphasise the links between performance management, CPD and school improvement. These links are important, as it has been shown that in schools that place CPD at the heart of schools’ planning for improvement, and integrate performance management, self-review and CPD into a coherent cycle, teaching and learning improves and standards are raised (Ofsted, 2006). Thus, the evaluation focused on both the individual strands that make up new professionalism as well as the relationships and interactions between them.
1.2 Research aims The overarching aims of the evaluation were to: • establish how and to what extent schools have implemented New
Professionalism
• identify, explore and account for the impacts of new professionalism on teaching and learning in schools.
To address these principal aims, our evaluation was formulated to address four key objectives. These were to: • bring together existing evidence on new professionalism in a succinct and
policy focused format
• document the current situation with regards to development of new professionalism within schools
• develop and apply a methodology to assess the impact of new professionalism to date
Introduction 3
• identify good practices in relation to developing new professionalism
More specifically, underpinning the aims of the evaluation are the following research questions: 1. How are schools implementing new professionalism, to what extent and in
what ways? 2. What key features/factors support the implementation of new
professionalism? 3. What barriers have they encountered, and how have they overcome these? 4. What are the perceived positives or benefits of new professionalism for
staff working practices, attitudes and roles? 5. What are the perceived impacts of new professionalism on teaching and
learning in schools? 6. What is the evidence of impact of new professionalism on teaching and
learning in schools? And how far can the impacts be attributed to new professionalism?
7. What are the links and relationships between the various aspects of new professionalism?
8. How does the practice and impact of new professionalism vary across different settings and teacher types? (e.g. primary, secondary, special, and pupil referral units (PRUs)) or teacher types (e.g. NQTs, main scale teachers and headteachers?)
1.3 Methodology The methodology was designed to provide robust evidence on a national scale about how schools are implementing new professionalism, and what impact this was having on teaching and learning. The research design involved a two-stage process. The first stage involved a rapid response review of the literature relating to the four strands of new professionalism and new professionalism as a whole. The findings from the review fed into research foci and instrument design. The second stage involved a large-scale postal and online survey of headteachers, teachers, NQTs/2nd year teachers, induction tutors, local authority (LA) staff, and governors to establish how and to what extent schools were implementing new professionalism.
Introduction 4
1.4 Sample design and sampling procedures Sampling for the surveys was representative of the nine government regions and took account of the different types of school (primary, secondary, special and PRUs), and the size, location and status of schools. Paper-based surveys were produced for headteachers, teachers, NQTs/2nd year teachers, induction tutors and governors while an online response option was made available for headteachers, governors and LA staff, in order to offer flexibility to respondents and to maximise the response rate. To minimise the burden on schools, prior to the surveys going out, letters were sent to local authorities asking them to state if there were any schools which should not be approached for any particular reason. Four random samples of maintained schools were drawn from NFER’s database of schools in England. The sample was drawn from the whole population of 151 local authorities in England. Respondents from a total of 1281 primary schools, 831 secondary schools, 400 special schools and 200 Pupil Referral Units (PRUs) were invited to participate to provide a representative data sample that would be robust enough for subsequent statistical analysis. The primary school and secondary school samples were both stratified to ensure that a representative range of schools was included, based on key stage performance data, region, rural/non-rural location and free school meals eligibility. Grammar schools, sixth-form colleges and academies were excluded from the secondary school sample. The special school and PRU samples were also stratified to ensure a representative range of schools/units was included, based on region, rural/non-rural location and free school meals eligibility. Independent schools were excluded from all samples. Each respondent was asked to submit their individual questionnaire online or to return their postal questionnaire to NFER in the envelopes provided. The surveys were undertaken between February and March 2010. Two reminder letters were sent, the second with a further copy of the questionnaire. Table 1 shows the number of respondents that were drawn, the number intended to be recruited, and the number of responses actually achieved. The research team adopted a target response rate of 30 per cent for headteachers, 50 per cent for LA staff and 30 per cent for the other
Introduction 5
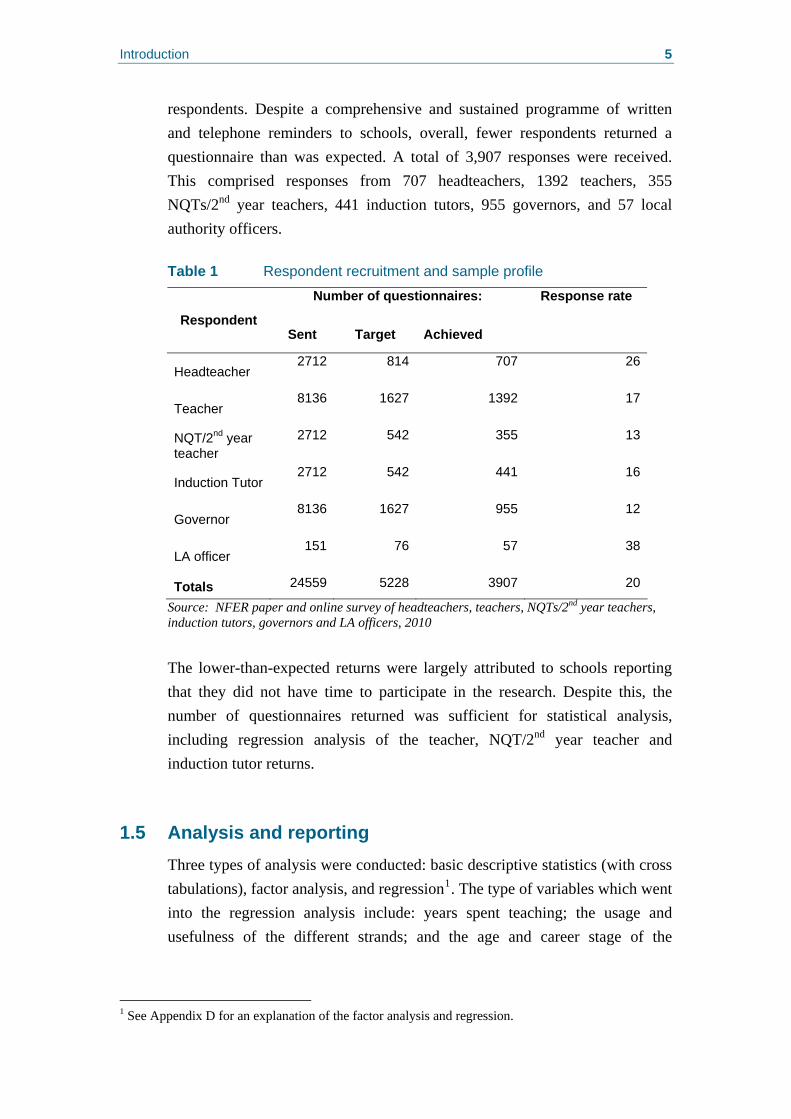
respondents. Despite a comprehensive and sustained programme of written and telephone reminders to schools, overall, fewer respondents returned a questionnaire than was expected. A total of 3,907 responses were received. This comprised responses from 707 headteachers, 1392 teachers, 355 NQTs/2nd year teachers, 441 induction tutors, 955 governors, and 57 local authority officers. Table 1 Respondent recruitment and sample profile
Number of questionnaires: Respondent
Sent Target Achieved
Response rate
Headteacher 2712 814 707 26
Teacher 8136 1627 1392 17
NQT/2nd year teacher
2712 542 355 13
Induction Tutor 2712 542 441 16
Governor 8136 1627 955 12
LA officer 151 76 57 38
Totals 24559 5228 3907 20
Source: NFER paper and online survey of headteachers, teachers, NQTs/2nd year teachers, induction tutors, governors and LA officers, 2010
The lower-than-expected returns were largely attributed to schools reporting that they did not have time to participate in the research. Despite this, the number of questionnaires returned was sufficient for statistical analysis, including regression analysis of the teacher, NQT/2nd year teacher and induction tutor returns.
1.5 Analysis and reporting Three types of analysis were conducted: basic descriptive statistics (with cross tabulations), factor analysis, and regression1. The type of variables which went into the regression analysis include: years spent teaching; the usage and usefulness of the different strands; and the age and career stage of the
1 See Appendix D for an explanation of the factor analysis and regression.
Introduction 6
respondent (where available). For a full list of variables see Appendix D, Table D2.
1.6 Structure of this report The remainder of the report is divided into a further eight main chapters, a references section, and Appendices. The survey findings for each of the four strands of new professionalism are reported in separate chapters. Chapter 2 presents the findings from the literature review, which draws on the latest research evidence on each of the four strands. Chapter 3 presents information about the professional standards for teachers, including respondents’ familiarity with the standards, their reported usage and usefulness, and the impacts they are reported to be having. Chapter 4 examines respondents’ familiarity with performance management regulations, teachers’ engagement with the process, and the local authority and governors’ roles and impacts relating to performance management. Chapter 5 explores respondents’ familiarity with their school’s induction arrangements, NQTs’ engagement with and views on induction, and impacts relating to induction. Chapter 6 explores respondents’ access to, and engagement with CPD, their experience of mentoring and coaching, and impacts relating to CPD. Chapter 7 explores the extent to which respondents report they are making links between the different strands of new professionalism, the support they are receiving to do this and the overall impacts. Chapter 8 draws on the NFER impact model to provide some initial insights into the overall journey made by schools. The final chapter brings together the key findings from the study. Findings from descriptive analysis, within-school matched analysis, and from regression analysis are reported within chapters. Regression findings are
Introduction 7
presented in rank order of strength of the relationship between the outcome measure and the predictor variables. The main variables discussed throughout the report relate to the professional groups that respondents belonged to (e.g. comparing the perspectives of headteachers with those of teachers), school phase/type (i.e. primary, secondary, special, PRU), and length of (teachers’) service, where these are statistically significant. Key findings are summarised at the beginning of each of the chapters. Appendix A presents information about the overall respondent sample in terms of gender, age, and years of teaching experience (where available). The additional frequency tables are presented in Appendix B. The explanation of the factor analysis and the regression analysis, and tables outlining the regression analysis findings, are presented in Appendix D. The data from the within school correlation analysis is presented in Appendix C.
Scoping the literature 8
2. Scoping the literature Key findings Professional Standards
• The evidence base for the uptake and impact of professional standards as a component of ‘new professionalism’ is limited. This is reflected by the paucity of relevant literature relating to professional standards identified for this research.
• Teachers’ focus on meeting the criteria set out in the professional standards has been used to inform CPD activities across the school workforce, particularly in helping NQTs meet their professional development needs and allowing teachers to demonstrate their competence before moving on to more advanced pay scales.
• Some schools were less aware of the professional standards than others, and as a consequence did not use them to inform their CPD activities.
Performance Management
• Perspectives about the value of performance management in schools are highly polarised. Not all schools have established systems for the performance management of support staff.
• Success of the performance management process is highly dependent on the role and seniority of the performance manager within the school, and their ability and influence in effecting change.
• Staff development, if undertaken in a systematic way across the school workforce, can lead to improved outcomes for pupils and staff, particularly for career and skills development, and for boosting self esteem.
Continuing Professional Development (CPD)
• There is evidence to suggest that schools provide a wealth of CPD opportunities for teachers at both individual and collective levels (Ofsted, 2006; Storey, 2009). Ofsted (2006) report that the most effective schools are able to match the development needs of staff to the most appropriate professional development activities (Ofsted, 2006).
• Senior management teams use a range of evidence to decide on areas for CPD development, including assessment data, classroom observation, discussions with subject leaders and pupil interviews (Ofsted, 2006).
• Coldwell et al. (2008) found that CPD is most successful when there is sufficient planning time for those involved in the design and implementation of CPD activities, when the project has a clear focus; when staff have a clear understanding of its wider implications; and when those managing the project are able to engage suitable support.
Induction
• NQTs’ experiences of the induction year appear dependent on the induction arrangements made by schools and their relationships with induction tutors.
• Induction tutors were increasingly taking on additional roles: in addition to their monitoring and facilitating role, they now have an assessment role in determining whether or not NQTs meet the core standards at the end of their induction year.
• NQTs’ development needs usually change quickly as their abilities develop, and the best schools allow teachers to adapt their performance management targets early in their NQT year to reflect this.
Scoping the literature 9
2.1 Introduction This section presents the findings from the rapid response literature review which was designed to scope and map current knowledge and practice in relation to new professionalism. Specifically, the review maps the key issues arising from relevant research related to the four strands of new professionalism: • Professional standards
• Performance management
• Continuing Professional Development (CPD)
• Induction
The findings are set out under these four themes. The links between the four strands and the barriers to implementing new professionalism are also explored, before presenting the conclusion. Some of the evidence relating to induction was conducted when NQTs were expected to meet a separate set of ‘induction standards’. Therefore, it is important to note that where such evidence has been included, this distinction no longer exists and NQTs are now expected to meet the same ‘core standards’ as other teaching staff.
2.2 Professional Standards The evidence base for the uptake and impact of professional standards as a component of ‘new professionalism’ is limited... Storey (2009), in reporting on the results of a national survey to examine the extent to which the principles of new professionalism have been implemented in schools, finds that the evidence base for the uptake and impact of professional standards as a component of new professionalism is limited. Although professional standards are widely recognised in schools, the impact of these standards on school workforce behaviour is not yet sufficiently understood. This is reflected by the paucity of relevant literature relating to professional standards identified for this research, possibly as a result of their relatively recent introduction in 2007. There is little consensus about which groups of teachers have made most use of the professional standards. Storey (2009) reports that the standards have been most widely adopted by NQTs, who have been successful in focusing
Scoping the literature 10
their CPD activities towards their professional development needs. The professional standards have also been used as a tool for teachers to demonstrate their competence before moving on to more advanced pay scales. For example, some more experienced teachers have used the professional standards to demonstrate competence when preparing applications for threshold or Excellent Teacher status. However, Storey reports that some schools are less aware of the professional standards than others, and as a consequence do not use them to inform their CPD activities (Storey, 2009).
2.3 Performance Management Perspectives on the impact of performance management in schools is highly polarised... Dymoke and Harrison (2006), in their study considering how beginning teachers are becoming integrated in the ‘professional development cultures’ of the schools in which they work (which was conducted prior to the introduction of the revised performance management arrangements), were critical of its impact. They suggested that performance management systems for beginner teachers engendered a ‘managerial’ approach to teacher development and were not encouraging beginner teachers to become self-monitoring or reflective in relation to their career aspirations and personal targets. They also suggested a need to develop a more person-led/professional-led approach to performance management in favour of a systems-led approach, and recommended mentoring as a tool to help beginning teachers develop professional and personal autonomy. Research by Ofsted (2006) into schools’ arrangements for the professional development of their staff (whose previous inspection reports identifies strong practice in this area), however, depicts a more positive view of a formal performance management process:
Teachers and support staff in the survey schools were involved in a formal process of performance review. They found this a positive experience as it gave them an opportunity to discuss their career plans, reflect on their professional development, have their achievement recognised, and to focus on priorities for the coming year. In the most effective schools, the process resulted in a carefully considered individual training plan.
Ofsted, 2006:11.
Scoping the literature 11
Research by Springate et al. (2009) into the early professional development of teachers also finds that nearly two thirds of respondents have specific performance management objectives relating to new areas of responsibility, and many report that their performance management objectives are aligned with their school improvement plan. However, in setting performance management objectives, teachers’ own assessments of their needs tend to be prioritised over the school improvement plan, as well as their reviewer’s assessment of their professional development needs and their future career aspirations (Springate et al., 2009). Bubb and Earley (2008), in their study into staff development and its role in school improvement, also find, that whilst schools were using performance management appropriately to develop individuals’ careers, not all schools had established systems for the performance management of support staff. The researchers recommend that, ‘individuals’ development should be linked to the analysis of needs through performance management and career development as well as self-evaluation and school improvement’ (Bubb and Earley, 2008:27). However, it should be noted that, in contrast to qualified teachers; there are no statutory requirements for the performance review of support staff in schools. The success of the performance management process is highly dependent on the role and seniority of the performance manager within the school, and their ability and influence in effecting change. Dymoke and Harrison (2006) report that performance managers across a range of curriculum areas and phases generally occupy a middle management role, and are accountable to the head and responsible for meeting whole-school performance targets. This impacts upon the capacity of performance managers to drive forward change, and creates tensions between the fulfilment of the performance management review process and the role of middle managers in supporting staff’s CPD needs (Dymoke and Harrison, 2008). This view was supported by the General Teaching Council for England (GTC, 2009).Their study into the current framework for accountability within teaching and the professional registration requirements placed on teachers, reports teachers’ and headteachers’ concern that the performance management system means staff in middle management are required to judge and hold to account colleagues, whom, for example, they also have lunch with in the staff room. Greater input from more objective
Scoping the literature 12
external advisers, such as School Improvement Partners, in the process of verifying teachers’ CPD was suggested. Staff development, if undertaken in a systematic way across the school workforce, can lead to improved outcomes for pupils and staff... Bubb et al.’s (2008) study into staff development reports that half of respondents found performance management useful and one fifth found it very useful for their career and skills development, and for boosting self esteem. Research by the GTC (2009) also finds that just under half of teachers surveyed think that performance management is an effective way of holding teachers to account for the quality of their teaching. About a third of teachers involved in the GTC study did not consider this to be the case. The GTC (2009) also finds that teachers who perceive performance management to be more effective tend to have engaged in CPD more frequently than other teachers, report access to adequate CPD opportunities; and say their CPD needs have been identified by their school. However, beginner teachers have varied experiences of these performance management processes, in particular relating to the transition of objectives as they move from their first to second year of teaching. Whilst beginner teachers are willing to engage with the performance management process, often this is motivated by a need to evidence their development to advance their career pathway, rather than as an ‘aid to reflection, future development or [for] planning potential routes on their professional journey’ (Dymoke and Harrison, 2008:80). Secondary teachers are less likely than primary teachers to view performance management as effective (GTC, 2009).
2.4 Continuing Professional Development (CPD) The literature surrounding the continuing professional development (CPD) of teachers has been widely reviewed. Therefore, this section of the review concentrates only on the aspects of CPD which relate to new professionalism, specifically: individual and collective CPD; organisational and leadership support; mentoring and coaching; aligning teacher needs and school priorities; and evaluating impacts of CPD.
Scoping the literature 13
2.4.1 Individual and collective CPD
There is evidence to suggest that schools provide a wealth of CPD opportunities for teachers at both individual and collective levels… Ofsted (2006) report that the most effective schools are able to match the development needs of staff to the most appropriate professional development activities (Ofsted, 2006), although it is also recognised that CPD is ‘inconsistent and unevenly distributed’ across schools (Storey, 2009:134). A report produced by the House of Commons Children, Schools and Families Committee into the training of teachers (published in February 2010), for example, suggests that in some schools there are ‘fundamental problems, [which] concern the process by which teachers’ professional development needs are identified through the performance management process, as well as teachers’ access to and the quality of professional development provision’ (House of Commons, 2010:45). The GTC identifies a range of effective CPD activities, which include: focusing on pupil learning; involving teachers in identifying their own needs; using coaching and mentoring alongside constructive observation; feedback and collaborative working; and providing opportunities for discussion and reflection on CPD activities (GTC, cited in House of Commons, 2010). Pedder, Storey and Opfer (2008), in their study into schools and CPD in England, also find that effective CPD activities tend to relate to the curriculum, teaching and learning, approaches to assessment and evaluation of learning. Typical forms of CPD include attending seminars and workshops; mentoring and coaching; and involvement in committees and task groups (Storey, 2009). Pedder et al. (2008) found that 84 per cent of the teachers involved in their study engage in in-school workshops and 64 per cent in out-of-school workshops. Pedder et al. (2008) further report that very few of the teachers in their study engage with active CPD activities such as mentoring, teacher study groups or independent study. Instead, teachers are likely to engage in passive forms of CPD, such as listening to lectures and presentations: this passivity is an area that new professionalism has been designed to address. Ofsted (2006) and Storey (2009) also report that secondary schools in particular often rely on external providers to offer CPD opportunities to staff. This, however, has the effect of limiting staff professional development opportunities in
Scoping the literature 14
circumstances where few external courses are available (Ofsted, 2006). Teachers involved in Pedder et al.’s study receive less CPD relating to behaviour management, leadership development and numeracy (Pedder et al., 2008). Schools with the most effective CPD arrangements provide staff with the opportunity to reflect upon and assess their own development needs, supported by the knowledge and expertise of management (Ofsted, 2006). However, in some cases, development pathways are determined by staff’s own perceptions without sufficient support from management:
... all too often the development needs discussed at performance reviews were based on staff’s perceptions of their own needs and on their personal ambitions. While this served well at times, when staff or their team leaders were insufficiently critical or were unaware of shortcomings, important weaknesses were ignored.
Ofsted, 2006:8. Across specific subject areas, CPD needs are sometimes not recognised because the school lacks sufficient subject expertise. For example, in one school visited by Ofsted, the sole art teacher was unaware that she had gaps in her knowledge of contemporary art. Effective schools overcome this problem by using external consultants to provide specialist support. However, in some areas, local authority provision of subject-specific CPD has been reduced due to lack of demand, creating an accessibility issue (Ofsted, 2006). Ofsted (2006) report that teaching staff often find the opportunity to engage in collaborative CPD activities useful, particularly as a tool for sharing good practice – for example, to consider and reflect upon different pupil learning styles (Ofsted, 2006). All of the schools involved in Ofsted’s (2006) study use local authority resources to deliver collective CPD. This includes bespoke training sessions, consultancy for subject leaders and working groups (Ofsted, 2006). Dymoke and Harrison (2008) suggest that engagement with collaborative CPD may develop as teachers’ careers progress. Their research indicates that some second year teachers are becoming involved with whole-school initiatives and development (for example, membership of working parties). However, wider collaborative work was less in evidence (for example, participation in subject associations and external networks) (Dymoke
Scoping the literature 15
and Harrison, 2008). Groups of schools sometimes also pool resources and expertise to provide collective CPD (Ofsted, 2006). Effective CPD can lead to a range of positive outcomes… Coldwell (2008) finds that effective CPD, which gives staff in all groups the opportunity to reflect on their training and development, leads to a range of positive outcomes including greater and further engagement with development opportunities, and higher career aspirations. When management do not account for the varying needs of staff groups or provide sufficient CPD opportunities, staff become disengaged from the CPD process (Coldwell, 2008). Some teachers choose not to allocate much time to CPD as they do not want to ‘affect the balance of teaching and learning’ (Storey, 2009:130): they are receptive to the facets of new professionalism but are not able to make full use of it due to organisational constraints. The extent of CPD provision tends to be dependent on the unique context of the school. CPD tends to be more widely disseminated in schools with higher levels of achievement, whereas those in struggling schools feel their school context is a ‘barrier to authentic individual uptake of CPD’ (Storey, 2009:128). Some CPD is focused on school-wide targets, rather than individual professional development. Teachers view this as training rather than CPD and this is identified as a tension (Storey, 2009). CPD also often meets a ‘need of the moment’ (Storey, 2009:129), e.g. using interactive whiteboards.
2.4.2 Organisational and leadership support
The literature suggests that schools with good CPD arrangements have strong leadership and organisational structures… Coldwell et al. (2008), in evaluating schools’ approaches to whole-school training and development, finds that the schools which are most effective at implementing CPD are led by senior management teams with a strong sense of commitment to whole-school CPD (Coldwell et al., 2008). Coldwell et al. (2008) further report that this process is best enabled in school cultures where people trust the vision and purpose of the leadership team; there is an ethos of openness, participation and support; and effective teamwork is commonplace within the school.
Scoping the literature 16
Further research by Ofsted (2010a), which considers what makes CPD work well in successful schools, also suggests that successful CPD arrangements are contingent upon strong leadership and a commitment to raising standards, coupled with high levels of trust and involvement on the part of staff in identifying their CPD needs. Ofsted (2010a) identify that opportunities for staff to discuss and reflect on their experiences, supported by school leaders, is a key feature of successful CPD (Ofsted, 2010a). Evidence about how this might be best achieved is limited. However, research by Ofsted (2010b) into the impacts of workforce reform finds that some secondary schools have altered the timing of the school day once a fortnight to ‘allow all staff, including the wider workforce, to attend an afternoon of in-service training’ (Ofsted, 2010b). Coldwell et al. (2008) further report that CPD is most effective when those in leadership positions understand that different groups across the wider school workforce have different expectations and needs, and are sensitive to this in planning their activities. This involves personalising activity to the differing needs of different staff groups and roles. School structures could be used effectively to facilitate this – for example, by promoting interaction between groups; enabling staff to understand their role; and providing development opportunities through role change or promotion (Coldwell et al., 2008).
2.4.3 Mentoring and coaching
Evidence suggests that mentoring and coaching are used in different ways by different schools… The schools involved in Ofsted’s (2006) study demonstrate wide variation in the extent to which mentoring and coaching is employed as a tool for effective CPD. Ofsted (2006) identify that primary schools in particular find specialist coaching valuable, (e.g. when preparing to introduce a modern language).
Coaching was most effective when a teacher with a clearly identified need was paired with a colleague with expertise in that area. The process was planned over an agreed time period and designed to increase progressively the degree of independence shown by the teacher as the coach’s support was withdrawn.
Ofsted, 2006:13-14

Scoping the literature 17
Ofsted (2006) also point out that coaching and mentoring are understood in different ways between schools. For example, some schools perceive this to be support in an area of mutual interest, whereas others include teaching observations. Others were private arrangements, which were not subject to leadership knowledge. These varied interpretations can affect the usefulness of mentoring and coaching, making it difficult for leaders to evaluate the effectiveness of the activity (Ofsted, 2006).
2.4.4 CPD and school development/aligning teacher needs and school priorities
The way in which CPD is planned can affect its potential impact… Senior management teams use a range of evidence in planning CPD provision across the school, including assessment data, classroom observation, discussions with subject leaders and pupil interviews (Ofsted, 2006). Coldwell et al. (2008) also find that CPD is most successful when there is sufficient planning time for those involved in the design and implementation of CPD activities; when the project has a clear focus; when staff have a clear understanding of its wider implications; and when those managing the project are able to engage suitable support. This view is corroborated in a research report by Ofsted (2006), which finds that key to the success of CPD is ‘thorough, focussed planning, and regular monitoring’ (Ofsted, 2006:22). Ofsted report that the most effective CPD plans are linked to school improvement objectives and included the following phases: • Actions identified;
• responsible people identified;
• how objectives would be achieved using most suitable CPD considered;
• adequate financial and other resources allocated;
• clear outcomes identified; and
• time built in for reflection and evaluation (Ofsted, 2006).
A key weakness at the planning stage of CPD is determining outcomes and deciding how to assess whether these outcomes had been met. This limited the potential impact of CPD activities (Ofsted, 2006). CPD in some subject areas had suffered as a result of school-wide focus on literacy and numeracy, and on helping teachers to support pupils in passing exams (Ofsted, 2006). Schools
Scoping the literature 18
gave consideration to staff development needs, but any training needed to be in line with school needs (Ofsted, 2006). Storey (2009) also finds that in some cases due to the division of responsibility within school, CPD leaders have little control over the CPD budget, making it difficult for them to plan their activities, ‘undercutting the strategic dimension was the structural division of leadership responsibility we found in the two areas of CPD and performance management’ (Storey, 2009:130). CPD leaders may also be limited by the scope of the CPD budget itself: although there is considerable variation between sources in the proportion of the school budget allocated to CPD, it has been suggested that the CPD budget may range from anywhere between 0.25 per cent and 15 per cent of the total school budget (House of Commons, 2010). Research by Ofsted (2006) has also found that CPD is most effective in schools where the strategic CPD coordinator is also a member of the senior management team. CPD tends to be less effective when the CPD coordinator plays an administrative role, or when the roles of the performance management coordinator or CPD manager were divided amongst too many people (Ofsted, 2006).
2.4.5 Evaluating impacts of CPD
The evidence suggests that many schools could do more to strengthen their evaluation of CPD… In 2006, Ofsted reported that evaluating and reflecting on CPD was the ‘weakest link in the chain’ of CPD (Ofsted, 2006:19). In 2010, this still appears to be the case: follow-up research by Ofsted reveals that ‘as in the previous survey, the weakest aspect of continuing professional development was the extent to which schools evaluated its impact and value for money’ (Ofsted, 2010a:5). Storey (2009) reports that CPD activities tend to ‘lack a coherent focus and [are] rarely evaluated’ (Storey, 2009:128). Evaluation is deemed to be most effective when outcomes are defined and an appropriate method for measuring impact is integrated into the planning stage. By contrast, ‘evaluation was not good in schools which had failed to build it in at the planning stage’ (Ofsted, 2006:20).
Scoping the literature 19
The school managers engaged in this research did not conduct value for money assessments of their CPD activities, and many doubted it would be feasible. However, they continue, to invest in CPD. The research recommends more subject-specific training and development in primary schools, and the dissemination of methods for identifying individual staff needs and models of individual training plans for schools to use (Ofsted, 2006).
2.5 Induction Beginner teachers’ experiences of the induction year depend on the induction arrangements made by schools and their relationships with induction tutors... Ashby et al. (2008), in their literature review surrounding the Becoming a Teacher (BaT) study (a six-year longitudinal research project ending in 2009 that examined teachers’ experiences during their initial teacher preparation and their first four years of teaching), find that beginner teachers’ experiences of the induction year are dependent on many factors, including the induction arrangements made by schools; individual induction tutor-NQT relationships; and how NQTs draw on their initial training to interpret their experiences as beginning teachers. Research by Johnson et al. (2005) cited in Ashby et al. (2008) into teacher retention in the USA found that ‘veteran-oriented’ schools (i.e. where the teaching workforce is mainly made up of experienced teachers), staff can fail to acknowledge the development needs of new teachers. Mentoring is limited, and observation is evaluative rather than supportive. By contrast, ‘novice-oriented’ cultures (i.e. where the teaching workforce is mainly made up of less experienced staff) occur most often in low-performing schools due to high staff turnover. In these schools observation, feedback and mentoring can be restricted due to a lack of experienced colleagues. Johnson et al., (2005) argue that integrated cultures are most effective in meeting the needs of NQTs through mentoring, help with classroom teaching, and opportunities to observe and to be observed (Johnson et al., 2005, cited in Ashby et al., 2008). The majority of headteachers and induction tutors believed that the induction process was easing the transition between the initial teacher
Scoping the literature 20
training and NQT year, and NQTs felt well supported in their induction year... Totterdell et al. (2002), cited in Ashby et al. (2005), into the effectiveness of statutory arrangements for the induction of NQTs found that the ‘vast majority’ of headteachers and induction tutors believe that induction provision has been improved and that the induction process is easing the transition between the initial teacher training and NQT years, as well as providing a foundation for subsequent professional development. Where schools make arrangements for regular observation of trainees; provide ‘feedback’ sessions and sufficient non-contact time; have an ethos which encourages professional growth; and provide conditions for induction tutors to pursue their own professional development for the role as well as carry out the role – then these schools can aid NQT retention and smooth the transition from initial teacher training to NQT years and from induction to early professional development (Ashby et al., 2008). However, evidence collected by the House of Commons Children, Schools and Families Committee reveals that there a number of ‘fundamental’ areas of teaching practice where NQTs require additional support in making the transition from initial teacher training to their NQT year. These areas include: assessment, behaviour management; child development; equality and diversity; practical work inside and outside the classroom; special educational needs; subject knowledge; and working with parents. The Committee further report that the experiences of NQTs in making the transition from their initial teacher training are highly variable, and contingent upon the effectiveness of the school and the local authority. They report that ‘failure to offer trainees a smooth transition from initial training is a widely held criticism of existing teacher training arrangements’ (House of Commons, 2010:38). In the final report of the Becoming a Teacher project, Hobson et al. (2009) report that the vast majority of surveyed NQTs are enjoying their teaching. They have positive perceptions of their role in their pupils’ learning. NQTs feel well supported in their induction year (over three-quarters rated the support they received as ‘good’ or ‘very good’). The majority of NQTs (88 per cent) have access to a formal induction programme – almost all of these had an induction mentor and reported good or very good relationships with that mentor (Hobson, 2009). Smethem et al. (2005) support this view in their study into the effects of statutory induction on the professional development of
Scoping the literature 21
newly-qualified teachers. NQTs who have experienced statutory induction benefit from induction tutor feedback, and find confidence in observing others as they share the same challenges (Smethem et al., 2005, cited in Ashby et al., 2008). Totterdell et al. (2002) also suggest that alongside improving schools’ provision for NQTs, statutory induction may also have brought about benefits for the whole school. For example, becoming involved in the induction process was seen by some to have encouraged staff to reflect upon their own practice and to keep up-to-date with policy matters (Totterdell et al., 2002, cited in Ashby et al., 2008). Variation in beginner teachers’ experiences of induction is minimal according to the ITT route followed. However, minority ethnic and older entrants tend to report less positive experiences of ITT, induction and early professional development. Both groups give lower ratings to their relationships with teaching colleagues, of the support they receive and of their enjoyment of teaching (Hobson et al., 2009). Beginner teachers have opportunities for observations by their performance manager, but opportunities for feedback on these are variable, and often other classroom observation and peer observation opportunities are used only infrequently (Dymoke and Harrison, 2006). Effective CPD plays an important role in bolstering the morale of new teachers. 90 per cent of respondents involved in research by Springate et al. (2009) report that training and development needs for their second year are identified as they approach the end of their induction period, and 80 per cent of these feel it would help their transition. 15 per cent of respondents report having identified their development needs alone (Springate et al., 2009). However, contrasting research by Martin and Rippon (2004) into the experiences of new teacher induction notes that some NQTs find the formal induction process ‘undermined their attempts to establish themselves as real teachers within the school’ (Martin and Rippon, 2004:321, cited in Ashby et al., 2008). Hobson et al. (2007) also found, as part of the Becoming a Teacher project, that 54 per cent of NQTs with access to formal induction training report that nothing has hindered them in working towards the induction standards (now core standards). 11 per cent considered workload to be a problem; and 5 per cent considered lack of support staff to be a problem (4 per cent referred
Scoping the literature 22
specifically to their induction tutor). Some NQTs comment negatively on the influence of the standards in their NQT year.
The majority of comments referred to the administrative burden that NQTs felt were imposed by the need to produce evidence of meeting the Standards (mentioned by 8 NQTs), whilst some individuals were frustrated by the need to produce such evidence when they felt that experienced observers had already concluded that they were capable teachers.
Hobson et al., 2007. For NQTs, colleagues at school was the most frequently given response when asked about who had helped them in working towards the induction standards. Whilst over half the NQTs felt that nothing had hindered them working towards the induction standards, others mentioned workload (11%) and lack of support from staff (5%) as hindrances (Hobson et al., 2009). Totterdell et al. (2002) also reports that in a number of instances some of the statutory induction requirements (such as a reduced timetable and ongoing support and regular reviews) are not being met. They report that: • 75 per cent report that they had been given some non-teaching
responsibility
• 50 per cent think they had taught classes with challenging behaviour
• 37 per cent of secondary NQTs state that they have taught outside their subject
• 20 per cent feel they had not been given a reduced timetable
• 10 per cent said they have taught pupils outside the age range for which they have been trained (Totterdell et al., 2002)
Whilst this research was conducted at a time when statutory arrangements for induction had only recently been introduced, Totterdell et al.’s findings relating to NQTs’ teaching timetables are echoed by research undertaken by the National Union of Teachers (NUT) (cited in the report of the House of Commons Children, Schools and Families Committee). NUT suggests that 15 per cent of NQTs do not receive a reduced timetable, and 21 per cent do not receive their entitlement to planning, preparation and assessment time (National Union of Teachers, cited in House of Commons, 2010).
Scoping the literature 23
Induction tutors perform a monitoring and facilitating role, as well as an assessment role in determining whether or not NQTs meet the core standards at the end of their induction year... Research by Barrington (2000) to investigate the perspectives of NQTs and their induction tutors during the first year of the new statutory requirements reported that induction tutors were increasingly taking on additional roles - in addition to their monitoring and facilitating role, they also had an assessment role in determining whether or not NQTs met the induction standards (now core standards) (Barrington, 2000, cited in Ashby et al., 2008). The vast majority of respondents with access to a formal induction programme have an induction tutor or mentor who supervises their induction programme (Totterdell et al., 2002). Totterdell et al. highlight the induction activities which NQTs find particularly helpful, notably having their teaching observed and receiving feedback, meeting with induction tutors and observing other teachers. They report that NQTs find the ‘support and encouragement’ aspect of their induction more important than assessment and professional development courses (Totterdell et al., 2002). In general, NQTs have good relationships with their tutors. 94 per cent of NQTs in the Becoming a Teacher project report that their relationship with their induction tutor/mentor was either ‘good’ or ‘very good’; and only 1 per cent rate the relationship as either ‘poor’ or ‘very poor’ (Hobson et al., 2007). Statistically significant differences were found relating to whether NQTs’ mentors are (a) working in the same subject area as themselves and (b) their head teacher/principal. If the tutor has the same subject specialism as the NQT they tend to have a better relationship than other cases. Where a head teacher or line manager is the induction tutor, relationships tend to be less positive. NQTs reported that it is difficult for line managers to also be a mentor (Hobson et al., 2007). Ashby et al. (2008) find that as induction has become more formal, problems have emerged. Induction now concentrates on achievements that can be measured, rather than the quality of mentoring relationships that are important for development. The dual responsibility of induction tutors to support and assess NQTs makes their role more difficult to fulfil (Martin and Rippon, 2003, cited in Ashby et al., 2008). Heilbronn (2002) expresses this another way, arguing that there is a tension for induction tutors in implementing a
Scoping the literature 24
process-based support methodology simultaneously with an outcomes-based assessment expressed in terms of induction standards (now core standards) (Heilbronn et al., 2002, cited in Ashby et al., 2008). Heilbronn et al. (2002) stress the need for induction tutors to be adequately supported in terms of preparation, resources and dedicated professional time. NQTs’ development needs usually change quickly as their abilities develop, and the best schools allow teachers to adapt their performance management targets early in their NQT year to reflect this... Ofsted (2006) report that schools are effective in identifying the needs of NQTs, building upon their development profile established throughout their teacher training. NQT teachers’ development needs usually change quickly as their abilities progress, and the best schools allow teachers to adapt their performance management targets early in their NQT year to reflect this. In smoothing the transitions across ITT, induction and early professional development, the authors recommend that policy-makers consider the content, format and use of the career entry development profile (CEDP) and possible alternatives (Hobson, 2009) Towards the end of the NQT years, about half of teachers involved in Ofsted’s 2006 ‘Logical Chain’ research agree performance management targets for the following year. For the remaining NQTs, there is a period where performance management targets remained uncertain during this transition (Ofsted, 2006). Dymoke and Harrison (2006) also found that records of beginner teachers’ progression (e.g. a Professional Development Portfolio), were often used retrospectively rather than to aid future professional development. Hobson et al. (2007) report that a CEDP is held by 96 per cent of the NQTs who have taught since completing their initial teacher training. Introduced by the TDA in 2003, the CEDP is a tool intended to help NQTs reflect on their development needs at the beginning and end of their induction. Hobson et al. report that 56 per cent of the NQTs involved in their study have used the CEDP to help them to identify their strengths and weaknesses as teacher. This suggests that there has been a mixed response to the CEDP, which is reflected in the findings of the House of Commons Children, Schools and Families report on teacher training. The report suggests that there are difficulties in using the CEDP to make the link between initial teacher training and
Scoping the literature 25
induction: at the time the Committee’s report was published, the CEDP was due for review in 2010 (House of Commons, 2010).
2.6 Making the links Storey (2009) reports that the language of new professionalism has been widely accepted in schools, and that each of the strands has become established in school procedures (Storey, 2009). This view is echoed by Storey (2009), who reports that within schools that are able to identify the links between CPD and professional standards, specific professional development activities to meet these standards are recognised and acted upon. These schools are able to evidence the value of the links between performance management, professional standards and CPD in the professional growth of their staff. This view is endorsed by Ofsted (2006), who find:
The best results occurred where CPD was central to the schools’ improvement planning. Schools which integrated performance management, school self-review and development, and CPD into a coherent cycle of planning improved the quality of teaching and raised standards.
Ofsted, 2006:4. However, Storey also found evidence to suggest that, in some cases, the links between each of these strands are not yet fully understood. For example, at least half of the teachers involved in Storey’s research are unable to recall their performance management targets because they are not effectively linked to their CPD activities. Similarly, whilst performance management procedures are usually implemented in schools, they have yet to be integrated with the implementation of professional standards (Storey, 2009). In part, this may be attributable to the responsibilities of staff within the school: CPD leaders would like to be more involved in senior level performance management to help identify links between school and individual performance (Storey, 2009). The report of the House of Commons Children, Schools and Families Committee (2010) also suggests that, although the frameworks put in place by the TDA to help schools manage teachers’ development have been ‘a step towards a more systematic approach’, progress is still required to ensure that this is effective across all schools (House of Commons, 2010:46). This view is endorsed by Pedder et al. (2008), who report that some schools demonstrate a
Scoping the literature 26
‘symbiotic’ approach to integrating the various strands of teachers’ development, characterised by a strong correlation between performance management processes and opportunities for staff to engage in CPD. By contrast, the approach of other schools is characterised by dislocation, where CPD opportunities do not necessarily match the needs of teachers identified during the performance management process (Pedder et al., 2008). It may also help to have recognition that the different strands of new professionalism can play a reciprocal relationship. For example, mentors who helped NQTs achieve their induction professional standards find this to be a CPD opportunity for themselves (Storey, 2009).
2.6.1 Whole school development
Performance management is an important way of linking school improvement plans to CPD plans. Teachers typically ‘had to agree at least one objective that was related to a school priority and another that was related to a departmental or key stage development’ (Ofsted, 2006:9). Effective leadership is essential to effectiveness of staff development, by linking it strategically to school improvements (Bubb et al., 2008). ‘In some schools performance management (PM) contributed strongly to keeping a school improvement project on track because individuals’ targets were closely related to the overall goal. Gaining people’s ‘buy-in’ was vital to improvement (only individuals can learn and change) and they wanted to feel listened to, valued and have their needs met’ (Bubb and Earley, 2008:29).
2.6.2 Barriers to implementing new professionalism
A number of barriers have been identified implementing new professionalism. Bubb et al. (2008) report that the main barriers relate to finance, time and support. Research by Storey (2009) supports this perspective, identifying key barriers as: competing priorities or initiatives; whole school training on specific issues prioritised over individual development needs; lack of strategic planning by senior leadership; lack of funding (or lack of awareness about funding available); and lack of opportunity to try new approaches. Coldwell et al. (2008) also report that effective CPD was limited when: there were competing priorities within school; there was nobody in place to champion the project; or SLT involvement was limited. CPD was also less
Scoping the literature 27
successful in schools with a ‘teacher-dominated culture’, leading to lack of understanding regarding the development needs of support staff. CPD was less successful when school structures and processes made communication difficult or left key staff groups uncertain of their role within the school. The House of Commons Children, Schools and Families Committee also expresses concern that the introduction of the ‘rarely cover’ policy in September 2009 will make it difficult for teachers to access CPD opportunities (House of Commons, 2010), because it places limits on the number of times teachers can be asked to cover for absent colleagues. The Committee report that this may have the unintended consequence of restricting opportunities for teachers to leave their classrooms to engage in CPD activities.
2.7 Conclusion The evidence base for the uptake and impact of the four strands of new professionalism indicates that the more effective schools are making the links between the strands and that more widely the language of new professionalism is becoming accepted in schools. It appears, however, that in many schools the links between strands are limited, underdeveloped, or not yet fully understood. In particular, the key issues identified for further study in this scoping phase relate to school staff’s familiarly with and use of the four strands of new professionalism; the impacts of the strands both individually and collectively on teaching and learning; and the extent to which links are being made between the strands. This research is therefore timely in helping to further understand how and to what extent schools have implemented new professionalism and the impacts new professionalism is having on teaching and learning in schools.
The professional standards for teachers 28
3. The professional standards for teachers
Key findings • Overall, staff at all levels were familiar with the professional standards –
most to a ‘great extent’. These findings are consistent with the evidence from the literature, which suggests that the professional standards are widely recognised by school staff.
• Headteachers and induction tutors reported being particularly familiar with the standards (more than four out of five report this ‘to a great extent’). NQTs/2nd year teachers were slightly more familiar than teachers (just over three-fifths of NQTs reported their familiarity ‘to a great extent’, while under three-fifths of teachers did so).
• The responses from the 57 LA respondents suggested that many schools were receiving some form of advice and guidance from their LA on how to implement the professional standards, with the majority (40 out of 57) reporting that they had provided advice ‘to a great extent’.
• Overall, NQTs/2nd year teachers and induction tutors reported using the professional standards more so than other teaching staff.
• Teaching headteachers were making notably less use of the standards to identify their CPD needs (almost one-fifth of teaching heads were not using them at all in this way).
• While familiarity with the standards was generally high across all groups, the extent to which the standards were reported to have contributed to impacts in school was more varied.
• While the majority of headteachers and teachers surveyed ‘agreed’ or ‘strongly agreed’ that use of the standards had helped to improve teaching and learning practices (65 per cent and 53 per cent respectively), a notable minority were not sure or disagreed (34 per cent and 47 per cent respectively).
• About half of the teachers reported that using the standards had helped to contribute to whole school improvement or had led to improvements in their pupils’ outcomes/progress. However, more than one in ten teachers ‘disagreed’ or ‘strongly disagreed’ that the standards had impacted on either area (12 per cent and 15 per cent respectively).
3.1 Introduction This chapter presents respondents’ views on the professional standards. It explores their familiarity with the standards, the usage and usefulness of the standards, and the impacts related to the professional standards.
The professional standards for teachers 29
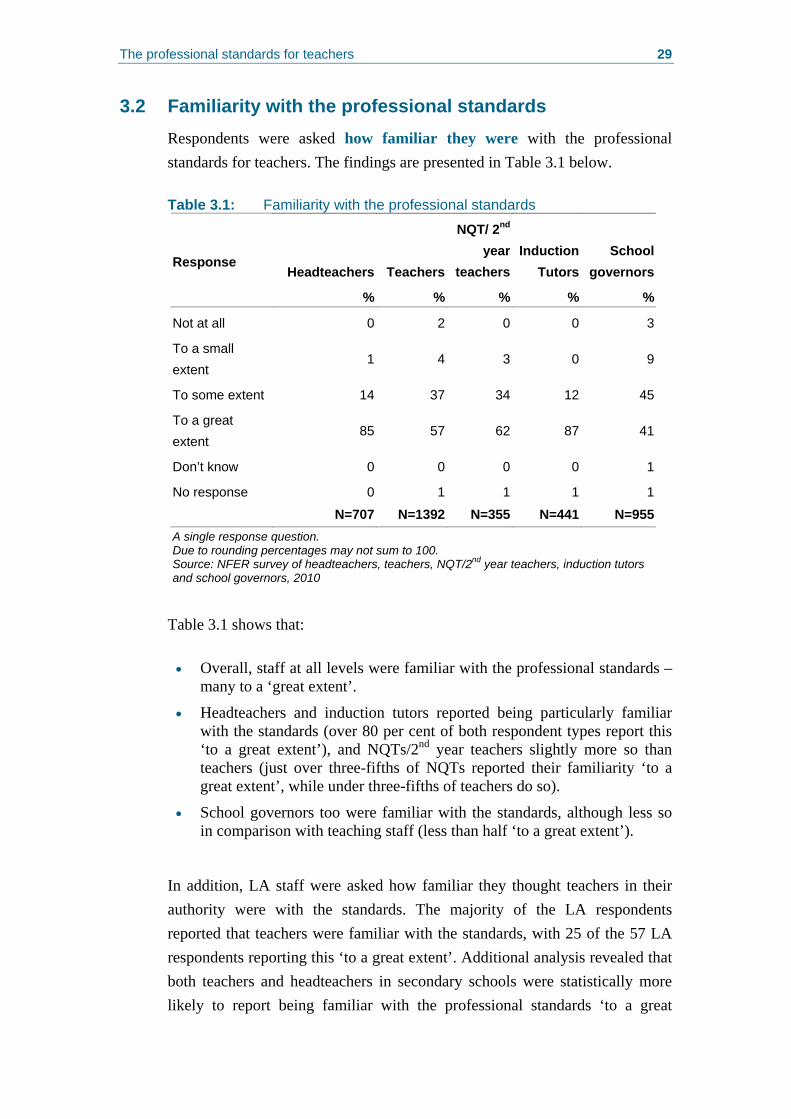
3.2 Familiarity with the professional standards Respondents were asked how familiar they were with the professional standards for teachers. The findings are presented in Table 3.1 below. Table 3.1: Familiarity with the professional standards
Headteachers Teachers
NQT/ 2nd
year teachers
Induction Tutors
School governors
Response
% % % % %
Not at all 0 2 0 0 3
To a small extent
1 4 3 0 9
To some extent 14 37 34 12 45
To a great extent
85 57 62 87 41
Don’t know 0 0 0 0 1
No response 0 1 1 1 1
N=707 N=1392 N=355 N=441 N=955A single response question. Due to rounding percentages may not sum to 100. Source: NFER survey of headteachers, teachers, NQT/2nd year teachers, induction tutors and school governors, 2010
Table 3.1 shows that: • Overall, staff at all levels were familiar with the professional standards –
many to a ‘great extent’.
• Headteachers and induction tutors reported being particularly familiar with the standards (over 80 per cent of both respondent types report this ‘to a great extent’), and NQTs/2nd year teachers slightly more so than teachers (just over three-fifths of NQTs reported their familiarity ‘to a great extent’, while under three-fifths of teachers do so).
• School governors too were familiar with the standards, although less so in comparison with teaching staff (less than half ‘to a great extent’).
In addition, LA staff were asked how familiar they thought teachers in their authority were with the standards. The majority of the LA respondents reported that teachers were familiar with the standards, with 25 of the 57 LA respondents reporting this ‘to a great extent’. Additional analysis revealed that both teachers and headteachers in secondary schools were statistically more likely to report being familiar with the professional standards ‘to a great
The professional standards for teachers 30
extent’ (66 per cent and 93 per cent respectively) than their counterparts in special schools (56 per cent and 83 per cent), primary schools (52 per cent and 83 per cent), or PRUs (50 per cent and 74 per cent). A full breakdown of the responses to these questions can be found in Appendix B1, Tables B1.1-B1.3. These findings are consistent with the evidence from the literature review (see Chapter 2, Section 2.2), which suggests that the professional standards are widely recognised by school staff. Headteachers were also asked whether they had promoted the professional standards to teachers in their school. Nearly two thirds (63 per cent) reported that they had ‘to a great extent’ (see Table B1.4). Additional analysis revealed that there were no statistically significant differences in the responses from headteachers in primary schools, secondary schools, special schools or PRUs. The responses from LA respondents suggested that many schools were receiving some form of advice and guidance from their LA on how to implement the professional standards, with the majority (40 out of 57) reporting that they had provided advice ‘to a great extent’(see Table B1.1).
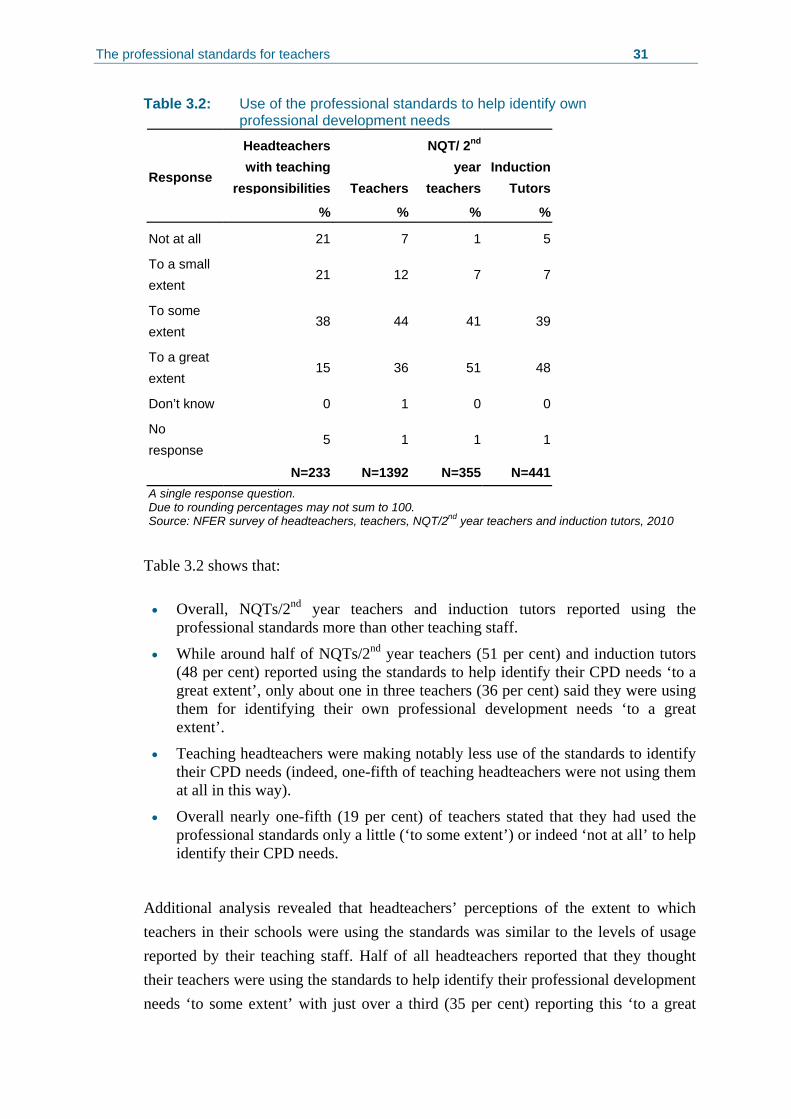
3.3 Usage and usefulness of the professional standards Headteachers with teaching responsibilities, teachers, NQTs/2nd year teachers and induction tutors were asked to what extent they had used the professional standards to help identify their own professional development needs. The findings are presented in Table 3.2 below.
The professional standards for teachers 31
Table 3.2: Use of the professional standards to help identify own professional development needs
Headteachers with teaching
responsibilities Teachers
NQT/ 2nd
year teachers
Induction Tutors
Response
% % % %
Not at all 21 7 1 5
To a small extent
21 12 7 7
To some extent
38 44 41 39
To a great extent
15 36 51 48
Don’t know 0 1 0 0
No response
5 1 1 1
N=233 N=1392 N=355 N=441A single response question. Due to rounding percentages may not sum to 100. Source: NFER survey of headteachers, teachers, NQT/2nd year teachers and induction tutors, 2010
Table 3.2 shows that: • Overall, NQTs/2nd year teachers and induction tutors reported using the
professional standards more than other teaching staff.
• While around half of NQTs/2nd year teachers (51 per cent) and induction tutors (48 per cent) reported using the standards to help identify their CPD needs ‘to a great extent’, only about one in three teachers (36 per cent) said they were using them for identifying their own professional development needs ‘to a great extent’.
• Teaching headteachers were making notably less use of the standards to identify their CPD needs (indeed, one-fifth of teaching headteachers were not using them at all in this way).
• Overall nearly one-fifth (19 per cent) of teachers stated that they had used the professional standards only a little (‘to some extent’) or indeed ‘not at all’ to help identify their CPD needs.
Additional analysis revealed that headteachers’ perceptions of the extent to which teachers in their schools were using the standards was similar to the levels of usage reported by their teaching staff. Half of all headteachers reported that they thought their teachers were using the standards to help identify their professional development needs ‘to some extent’ with just over a third (35 per cent) reporting this ‘to a great
The professional standards for teachers 32
extent’. School governors perceived there to be a similar level of use (56 per cent ‘to a great extent’), although perhaps not surprisingly, a notable minority (13 per cent) said they did not know. A smaller proportion of LA officers thought that teachers in their authority were using the standards to help identify their CPD needs ‘to a great extent’ (10 out of 57) (see Table B1.6). Headteachers with teaching responsibilities, induction tutors and teachers were also asked to what extent they had used the standards to inform performance management discussions with their reviewers. Almost half of the induction tutors (46 per cent) reported using the standards to inform their performance management discussions ‘to a great extent’, while about one in three teachers (35 per cent) reported using them to this degree. Teaching headteachers reported making notably less use of the standards to inform their performance management discussions than the other respondents (indeed, one-fifth of teaching heads were not using them at all in this way). Additional analysis revealed that teachers in secondary schools were statistically more likely to report having used the professional standards to inform their performance management discussions ‘to a great extent’ (38 per cent) than their counterparts in special schools (35 per cent), primary schools (34 per cent), or PRUs (33 per cent) (see Tables B1.5, B1.7, B1.8 and B1). Again, these findings are broadly consistent with the findings from the literature review, which suggest there is emerging evidence that use of the professional standards to inform performance management activities is increasing (see Chapter 2, Section 2.2). Headteachers, teachers, NQTs/2nd year teachers, induction tutors and school governors were asked to what extent the professional standards had given them/their teachers’ greater clarity about the professional expectations at each stage of their career stage. The findings are presented in Table 3.3 below.
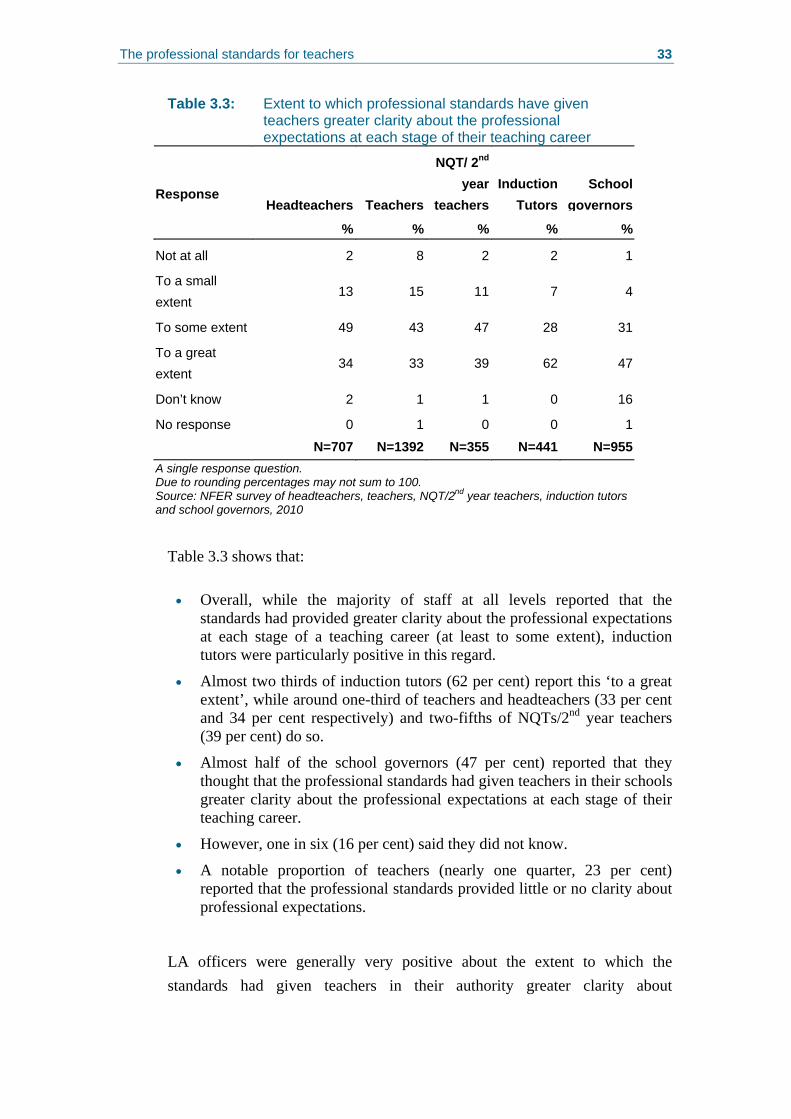
The professional standards for teachers 33
Table 3.3: Extent to which professional standards have given teachers greater clarity about the professional expectations at each stage of their teaching career
Headteachers Teachers
NQT/ 2nd
year teachers
Induction Tutors
School
governors Response
% % % % %
Not at all 2 8 2 2 1
To a small extent
13 15 11 7 4
To some extent 49 43 47 28 31
To a great extent
34 33 39 62 47
Don’t know 2 1 1 0 16
No response 0 1 0 0 1
N=707 N=1392 N=355 N=441 N=955 A single response question. Due to rounding percentages may not sum to 100. Source: NFER survey of headteachers, teachers, NQT/2nd year teachers, induction tutors and school governors, 2010
Table 3.3 shows that: • Overall, while the majority of staff at all levels reported that the
standards had provided greater clarity about the professional expectations at each stage of a teaching career (at least to some extent), induction tutors were particularly positive in this regard.
• Almost two thirds of induction tutors (62 per cent) report this ‘to a great extent’, while around one-third of teachers and headteachers (33 per cent and 34 per cent respectively) and two-fifths of NQTs/2nd year teachers (39 per cent) do so.
• Almost half of the school governors (47 per cent) reported that they thought that the professional standards had given teachers in their schools greater clarity about the professional expectations at each stage of their teaching career.
• However, one in six (16 per cent) said they did not know.
• A notable proportion of teachers (nearly one quarter, 23 per cent) reported that the professional standards provided little or no clarity about professional expectations.
LA officers were generally very positive about the extent to which the standards had given teachers in their authority greater clarity about
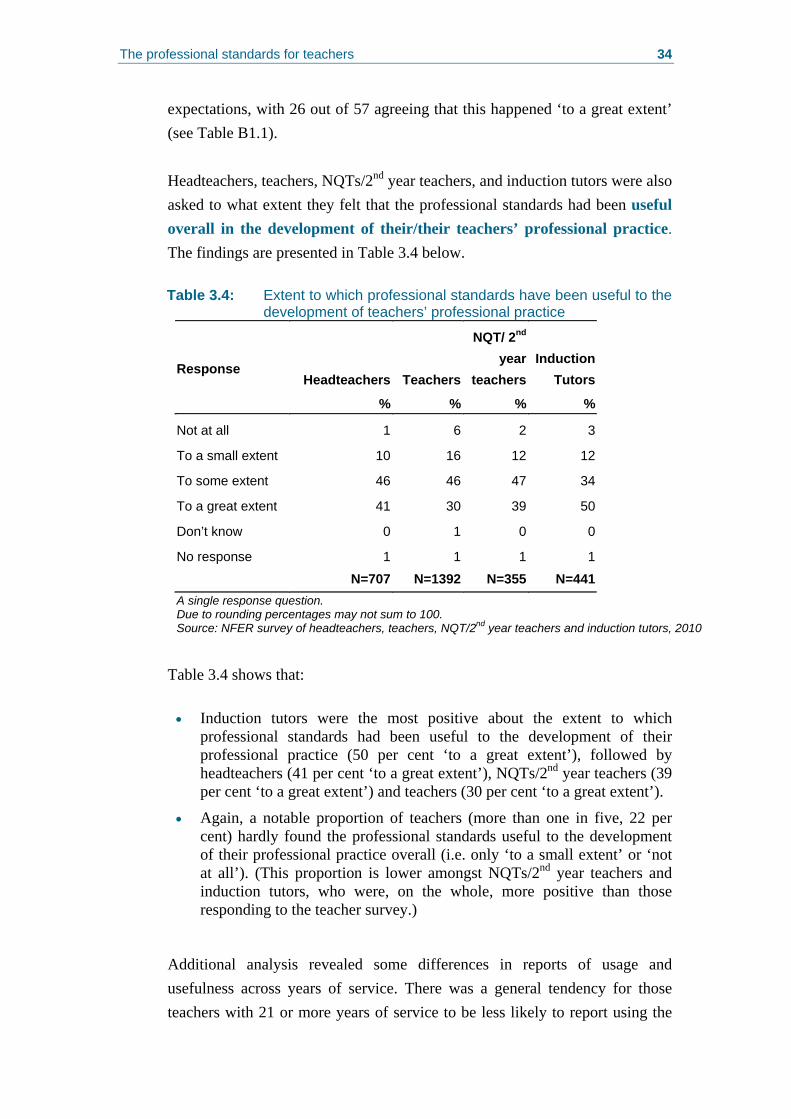
The professional standards for teachers 34
expectations, with 26 out of 57 agreeing that this happened ‘to a great extent’ (see Table B1.1). Headteachers, teachers, NQTs/2nd year teachers, and induction tutors were also asked to what extent they felt that the professional standards had been useful overall in the development of their/their teachers’ professional practice. The findings are presented in Table 3.4 below. Table 3.4: Extent to which professional standards have been useful to the
development of teachers’ professional practice
Headteachers Teachers
NQT/ 2nd
year teachers
Induction Tutors
Response
% % % %
Not at all 1 6 2 3
To a small extent 10 16 12 12
To some extent 46 46 47 34
To a great extent 41 30 39 50
Don’t know 0 1 0 0
No response 1 1 1 1
N=707 N=1392 N=355 N=441 A single response question. Due to rounding percentages may not sum to 100. Source: NFER survey of headteachers, teachers, NQT/2nd year teachers and induction tutors, 2010
Table 3.4 shows that:
• Induction tutors were the most positive about the extent to which
professional standards had been useful to the development of their professional practice (50 per cent ‘to a great extent’), followed by headteachers (41 per cent ‘to a great extent’), NQTs/2nd year teachers (39 per cent ‘to a great extent’) and teachers (30 per cent ‘to a great extent’).
• Again, a notable proportion of teachers (more than one in five, 22 per cent) hardly found the professional standards useful to the development of their professional practice overall (i.e. only ‘to a small extent’ or ‘not at all’). (This proportion is lower amongst NQTs/2nd year teachers and induction tutors, who were, on the whole, more positive than those responding to the teacher survey.)
Additional analysis revealed some differences in reports of usage and usefulness across years of service. There was a general tendency for those teachers with 21 or more years of service to be less likely to report using the
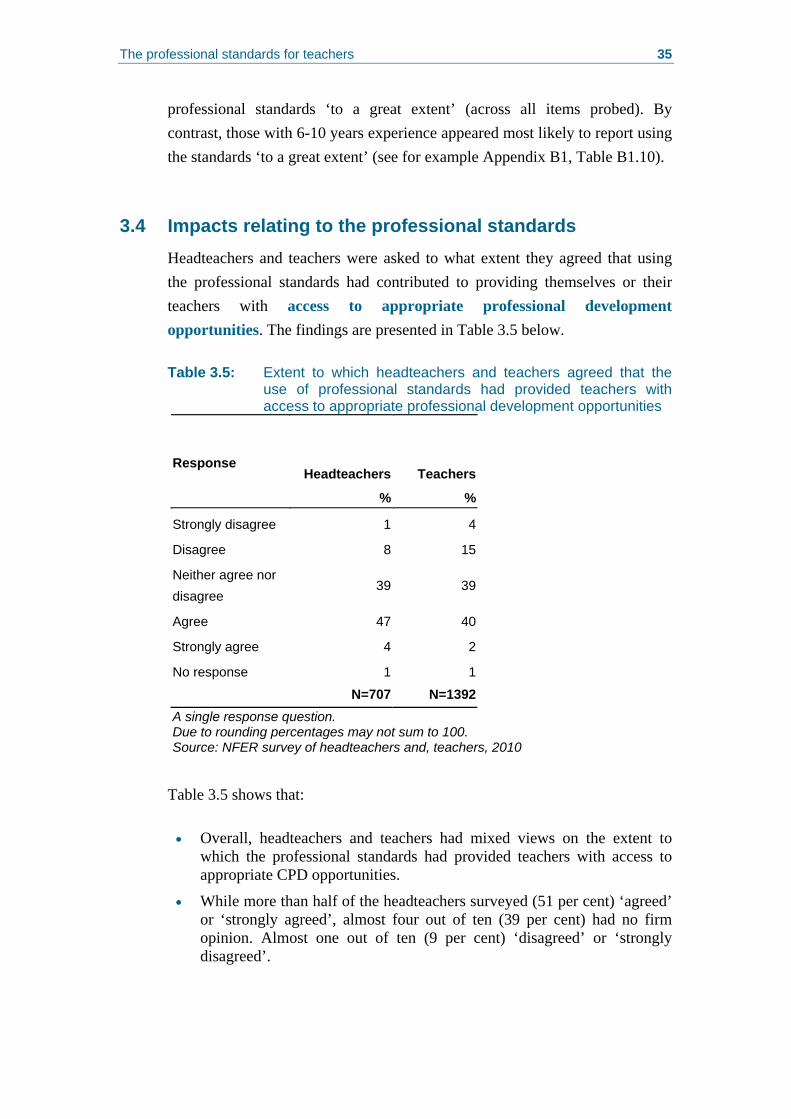
The professional standards for teachers 35
professional standards ‘to a great extent’ (across all items probed). By contrast, those with 6-10 years experience appeared most likely to report using the standards ‘to a great extent’ (see for example Appendix B1, Table B1.10).
3.4 Impacts relating to the professional standards Headteachers and teachers were asked to what extent they agreed that using the professional standards had contributed to providing themselves or their teachers with access to appropriate professional development opportunities. The findings are presented in Table 3.5 below. Table 3.5: Extent to which headteachers and teachers agreed that the
use of professional standards had provided teachers with access to appropriate professional development opportunities
Headteachers TeachersResponse
% %
Strongly disagree 1 4
Disagree 8 15
Neither agree nor disagree
39 39
Agree 47 40
Strongly agree 4 2
No response 1 1
N=707 N=1392A single response question. Due to rounding percentages may not sum to 100. Source: NFER survey of headteachers and, teachers, 2010
Table 3.5 shows that: • Overall, headteachers and teachers had mixed views on the extent to
which the professional standards had provided teachers with access to appropriate CPD opportunities.
• While more than half of the headteachers surveyed (51 per cent) ‘agreed’ or ‘strongly agreed’, almost four out of ten (39 per cent) had no firm opinion. Almost one out of ten (9 per cent) ‘disagreed’ or ‘strongly disagreed’.
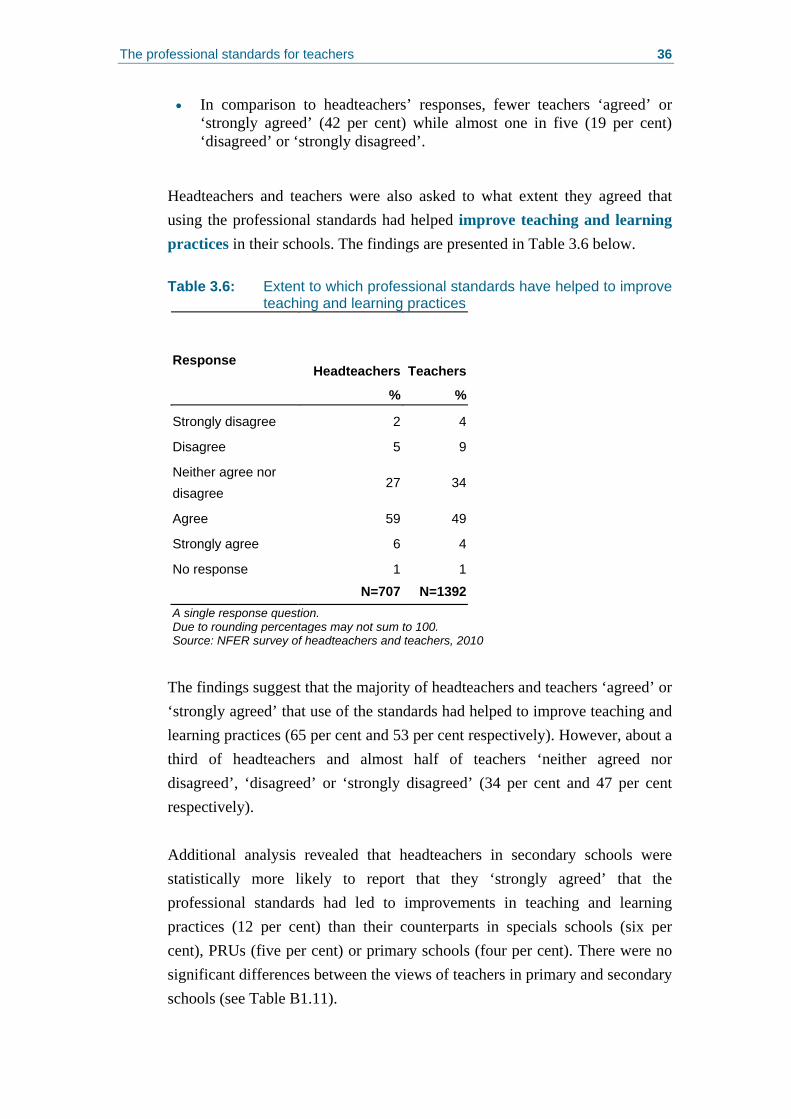
The professional standards for teachers 36
• In comparison to headteachers’ responses, fewer teachers ‘agreed’ or ‘strongly agreed’ (42 per cent) while almost one in five (19 per cent) ‘disagreed’ or ‘strongly disagreed’.
Headteachers and teachers were also asked to what extent they agreed that using the professional standards had helped improve teaching and learning practices in their schools. The findings are presented in Table 3.6 below. Table 3.6: Extent to which professional standards have helped to improve
teaching and learning practices
Headteachers TeachersResponse
% %
Strongly disagree 2 4
Disagree 5 9
Neither agree nor disagree
27 34
Agree 59 49
Strongly agree 6 4
No response 1 1
N=707 N=1392A single response question. Due to rounding percentages may not sum to 100. Source: NFER survey of headteachers and teachers, 2010
The findings suggest that the majority of headteachers and teachers ‘agreed’ or ‘strongly agreed’ that use of the standards had helped to improve teaching and learning practices (65 per cent and 53 per cent respectively). However, about a third of headteachers and almost half of teachers ‘neither agreed nor disagreed’, ‘disagreed’ or ‘strongly disagreed’ (34 per cent and 47 per cent respectively). Additional analysis revealed that headteachers in secondary schools were statistically more likely to report that they ‘strongly agreed’ that the professional standards had led to improvements in teaching and learning practices (12 per cent) than their counterparts in specials schools (six per cent), PRUs (five per cent) or primary schools (four per cent). There were no significant differences between the views of teachers in primary and secondary schools (see Table B1.11).
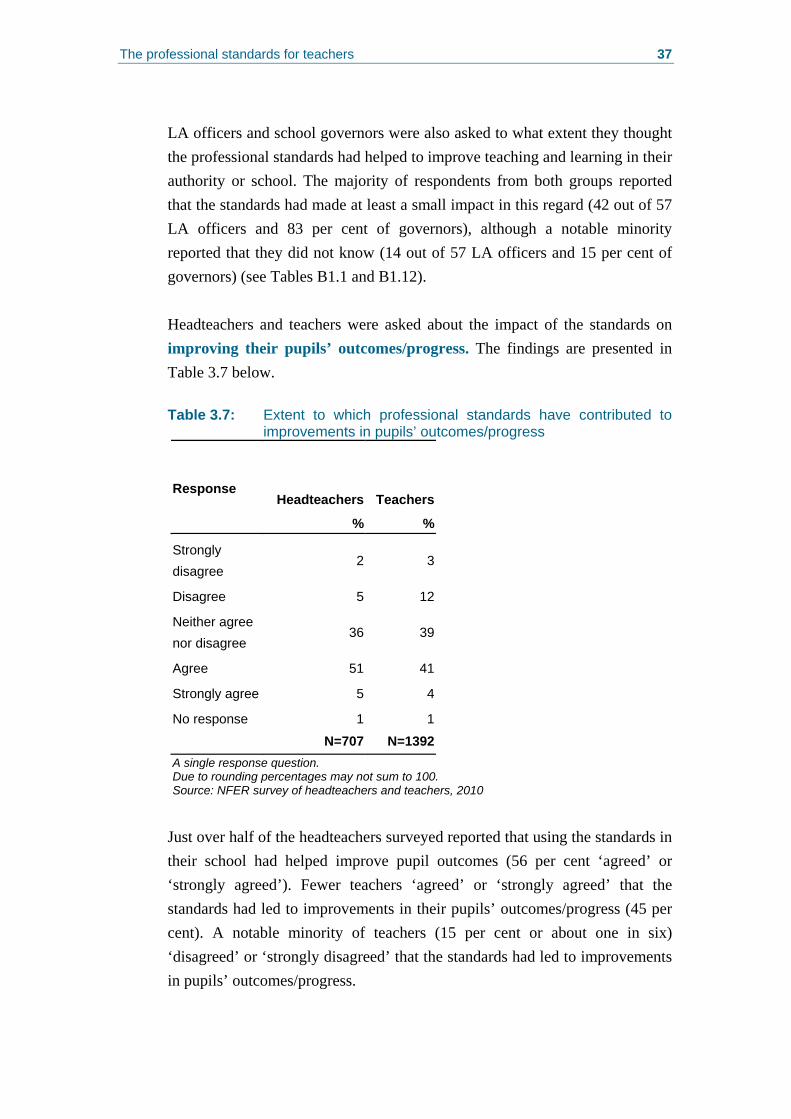
The professional standards for teachers 37
LA officers and school governors were also asked to what extent they thought the professional standards had helped to improve teaching and learning in their authority or school. The majority of respondents from both groups reported that the standards had made at least a small impact in this regard (42 out of 57 LA officers and 83 per cent of governors), although a notable minority reported that they did not know (14 out of 57 LA officers and 15 per cent of governors) (see Tables B1.1 and B1.12). Headteachers and teachers were asked about the impact of the standards on improving their pupils’ outcomes/progress. The findings are presented in Table 3.7 below. Table 3.7: Extent to which professional standards have contributed to
improvements in pupils’ outcomes/progress
Headteachers TeachersResponse
% %
Strongly disagree
2 3
Disagree 5 12
Neither agree nor disagree
36 39
Agree 51 41
Strongly agree 5 4
No response 1 1
N=707 N=1392A single response question. Due to rounding percentages may not sum to 100. Source: NFER survey of headteachers and teachers, 2010
Just over half of the headteachers surveyed reported that using the standards in their school had helped improve pupil outcomes (56 per cent ‘agreed’ or ‘strongly agreed’). Fewer teachers ‘agreed’ or ‘strongly agreed’ that the standards had led to improvements in their pupils’ outcomes/progress (45 per cent). A notable minority of teachers (15 per cent or about one in six) ‘disagreed’ or ‘strongly disagreed’ that the standards had led to improvements in pupils’ outcomes/progress.
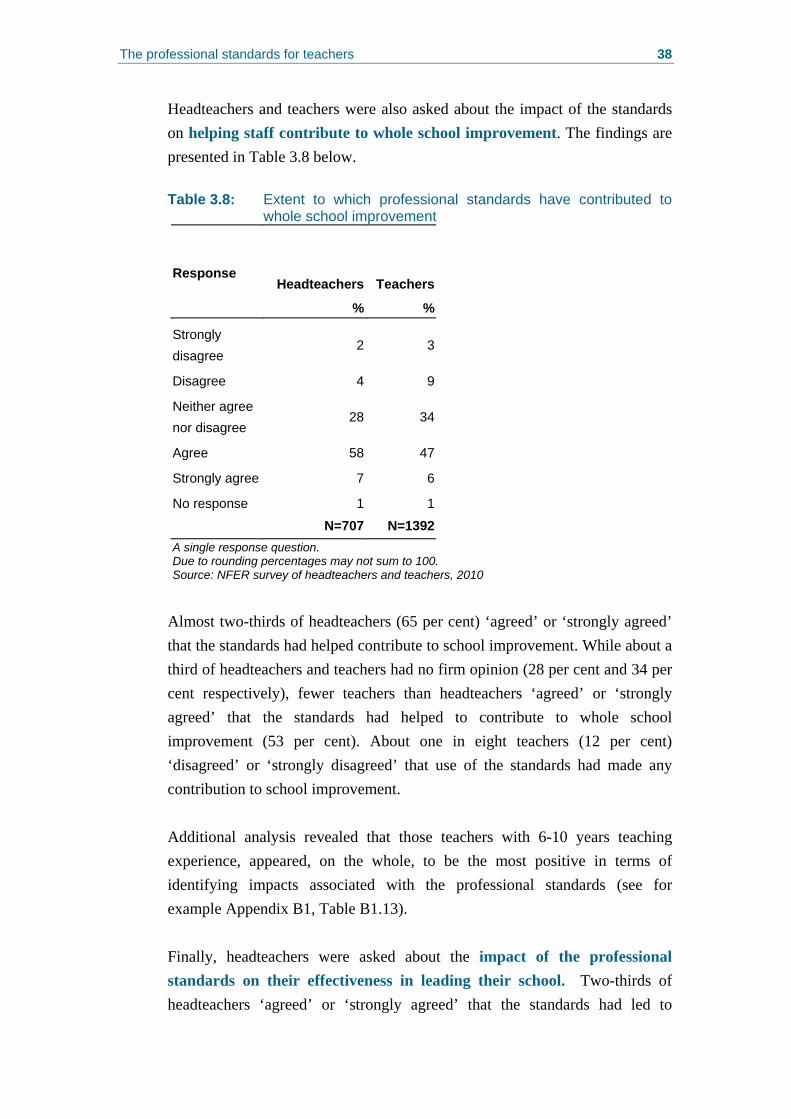
The professional standards for teachers 38
Headteachers and teachers were also asked about the impact of the standards on helping staff contribute to whole school improvement. The findings are presented in Table 3.8 below. Table 3.8: Extent to which professional standards have contributed to
whole school improvement
Headteachers TeachersResponse
% %
Strongly disagree
2 3
Disagree 4 9
Neither agree nor disagree
28 34
Agree 58 47
Strongly agree 7 6
No response 1 1
N=707 N=1392A single response question. Due to rounding percentages may not sum to 100. Source: NFER survey of headteachers and teachers, 2010
Almost two-thirds of headteachers (65 per cent) ‘agreed’ or ‘strongly agreed’ that the standards had helped contribute to school improvement. While about a third of headteachers and teachers had no firm opinion (28 per cent and 34 per cent respectively), fewer teachers than headteachers ‘agreed’ or ‘strongly agreed’ that the standards had helped to contribute to whole school improvement (53 per cent). About one in eight teachers (12 per cent) ‘disagreed’ or ‘strongly disagreed’ that use of the standards had made any contribution to school improvement. Additional analysis revealed that those teachers with 6-10 years teaching experience, appeared, on the whole, to be the most positive in terms of identifying impacts associated with the professional standards (see for example Appendix B1, Table B1.13). Finally, headteachers were asked about the impact of the professional standards on their effectiveness in leading their school. Two-thirds of headteachers ‘agreed’ or ‘strongly agreed’ that the standards had led to
The professional standards for teachers 39
improvements in the effectiveness with which they managed and led the school, with one in eight (12 per cent) strongly agreeing (see Table B1.14).
3.5 Regression analysis on findings relating to the professional standards for teachers Further regression analysis2 allowed us to build on the basic descriptive work by considering the effect of background variables on each of the factor scores (or outcomes) once other background variables had been controlled for (for a further explanation of this analysis see Appendix D).
3.6 Usage and usefulness of the professional standards for teachers: regression analysis Regression analysis explored which groups of respondents scored higher and lower on the measure of usage and usefulness of the professional standards (see Appendix D, Table D3.2).
3.6.1 More reported use and perceived usefulness of the professional standards for teachers
Regression analysis revealed that, when compared to their counterparts, the following groups were significantly more likely to report using the professional standards and also significantly more likely to report that they found them useful: • those who identified the strongest links between the professional
standards, performance management and CPD in their school
• those who reported experiencing the greatest impacts from performance management
• those who felt most able to exercise their own professional judgement in their teaching and learning practices
• those teachers trained overseas3
2 The significance of relationships with some background variables needs to be treated with caution where the numbers in the subgroup are small. The significance of such results may be affected by the small number of people in the subgroup rather than there being a strong relationship between the group and the outcome itself. See Appendix D for full explanations of each factor. For the regression analyses, only variables that have a statistically significant relationship with the outcome (at the 5 per cent level) are reported. The variables are reported in order, with those showing the strongest relationship reported first. 3 This variable might be significant due to the small number of overseas trained teachers in the sample

The professional standards for teachers 40
• those who reported being most engaged with the performance management process.
3.6.2 Less reported use and perceived usefulness of the professional standards for teachers
Regression analysis also revealed that, when compared to their counterparts, the following groups were significantly less likely to report using the professional standards and also significantly less likely to report that they found them useful: • those who had been teaching for longer
• those who felt their CPD needs were being met more
• those who were in a part time post
• male teachers.
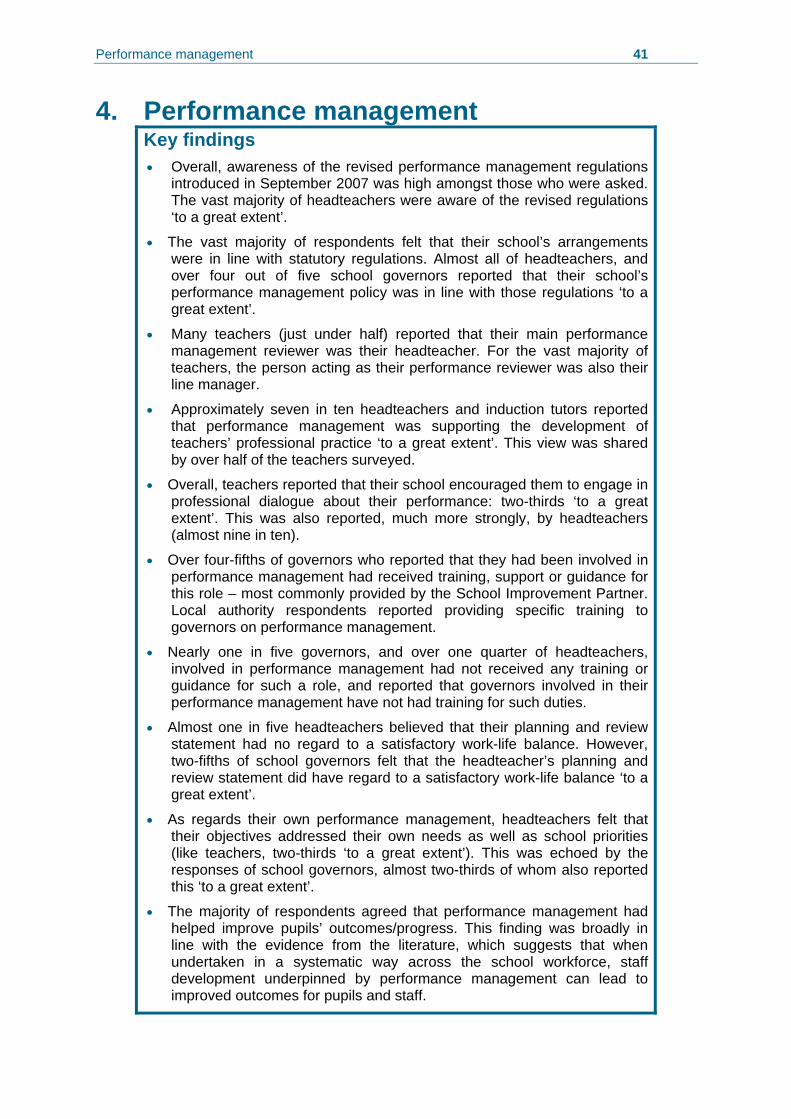
Performance management 41
4. Performance management Key findings • Overall, awareness of the revised performance management regulations
introduced in September 2007 was high amongst those who were asked. The vast majority of headteachers were aware of the revised regulations ‘to a great extent’.
• The vast majority of respondents felt that their school’s arrangements were in line with statutory regulations. Almost all of headteachers, and over four out of five school governors reported that their school’s performance management policy was in line with those regulations ‘to a great extent’.
• Many teachers (just under half) reported that their main performance management reviewer was their headteacher. For the vast majority of teachers, the person acting as their performance reviewer was also their line manager.
• Approximately seven in ten headteachers and induction tutors reported that performance management was supporting the development of teachers’ professional practice ‘to a great extent’. This view was shared by over half of the teachers surveyed.
• Overall, teachers reported that their school encouraged them to engage in professional dialogue about their performance: two-thirds ‘to a great extent’. This was also reported, much more strongly, by headteachers (almost nine in ten).
• Over four-fifths of governors who reported that they had been involved in performance management had received training, support or guidance for this role – most commonly provided by the School Improvement Partner. Local authority respondents reported providing specific training to governors on performance management.
• Nearly one in five governors, and over one quarter of headteachers, involved in performance management had not received any training or guidance for such a role, and reported that governors involved in their performance management have not had training for such duties.
• Almost one in five headteachers believed that their planning and review statement had no regard to a satisfactory work-life balance. However, two-fifths of school governors felt that the headteacher’s planning and review statement did have regard to a satisfactory work-life balance ‘to a great extent’.
• As regards their own performance management, headteachers felt that their objectives addressed their own needs as well as school priorities (like teachers, two-thirds ‘to a great extent’). This was echoed by the responses of school governors, almost two-thirds of whom also reported this ‘to a great extent’.
• The majority of respondents agreed that performance management had helped improve pupils’ outcomes/progress. This finding was broadly in line with the evidence from the literature, which suggests that when undertaken in a systematic way across the school workforce, staff development underpinned by performance management can lead to improved outcomes for pupils and staff.
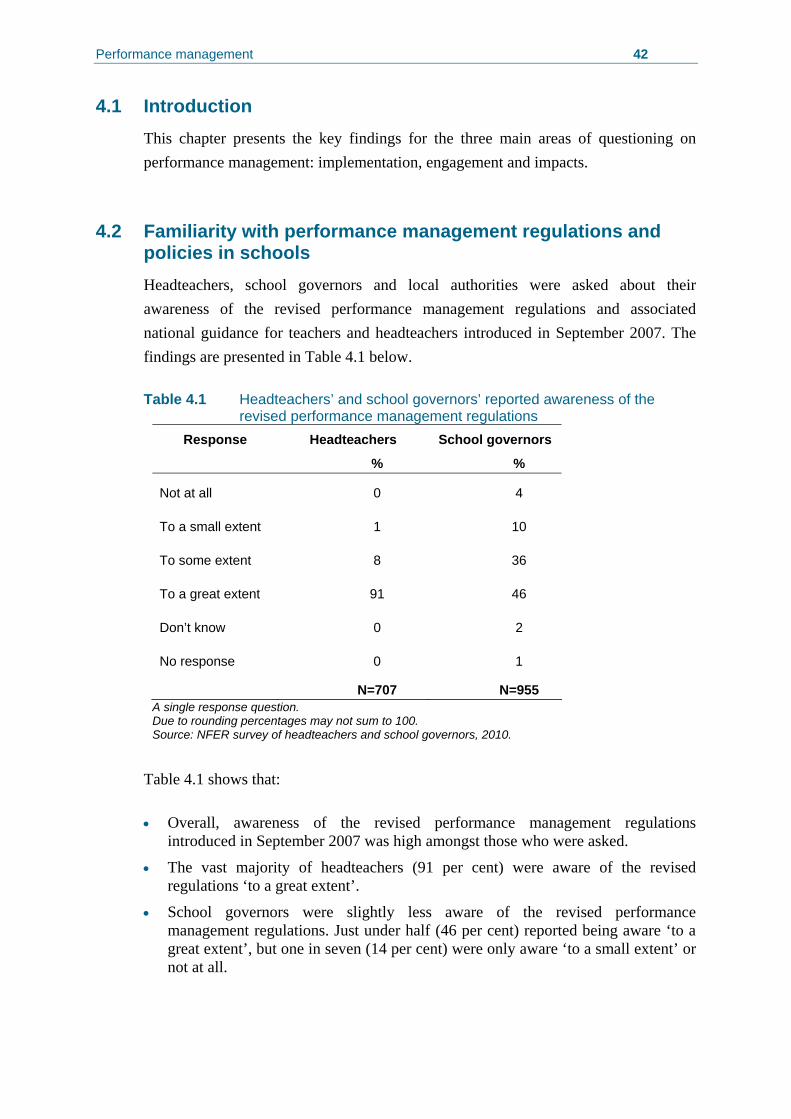
Performance management 42
4.1 Introduction This chapter presents the key findings for the three main areas of questioning on performance management: implementation, engagement and impacts.
4.2 Familiarity with performance management regulations and policies in schools Headteachers, school governors and local authorities were asked about their awareness of the revised performance management regulations and associated national guidance for teachers and headteachers introduced in September 2007. The findings are presented in Table 4.1 below. Table 4.1 Headteachers’ and school governors’ reported awareness of the
revised performance management regulations Response Headteachers School governors
% %
Not at all 0 4
To a small extent 1 10
To some extent 8 36
To a great extent 91 46
Don’t know 0 2
No response 0 1
N=707 N=955 A single response question. Due to rounding percentages may not sum to 100. Source: NFER survey of headteachers and school governors, 2010.
Table 4.1 shows that: • Overall, awareness of the revised performance management regulations
introduced in September 2007 was high amongst those who were asked.
• The vast majority of headteachers (91 per cent) were aware of the revised regulations ‘to a great extent’.
• School governors were slightly less aware of the revised performance management regulations. Just under half (46 per cent) reported being aware ‘to a great extent’, but one in seven (14 per cent) were only aware ‘to a small extent’ or not at all.
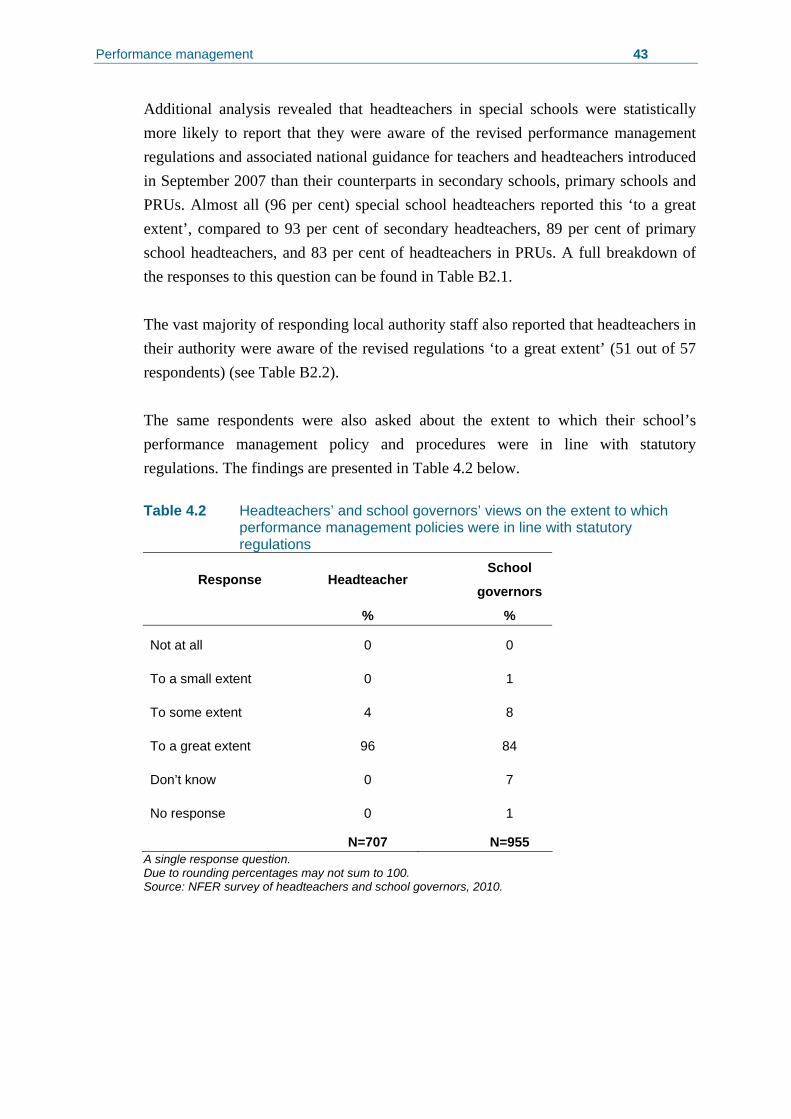
Performance management 43
Additional analysis revealed that headteachers in special schools were statistically more likely to report that they were aware of the revised performance management regulations and associated national guidance for teachers and headteachers introduced in September 2007 than their counterparts in secondary schools, primary schools and PRUs. Almost all (96 per cent) special school headteachers reported this ‘to a great extent’, compared to 93 per cent of secondary headteachers, 89 per cent of primary school headteachers, and 83 per cent of headteachers in PRUs. A full breakdown of the responses to this question can be found in Table B2.1. The vast majority of responding local authority staff also reported that headteachers in their authority were aware of the revised regulations ‘to a great extent’ (51 out of 57 respondents) (see Table B2.2). The same respondents were also asked about the extent to which their school’s performance management policy and procedures were in line with statutory regulations. The findings are presented in Table 4.2 below. Table 4.2 Headteachers’ and school governors’ views on the extent to which
performance management policies were in line with statutory regulations
Response Headteacher School
governors
% %
Not at all 0 0
To a small extent 0 1
To some extent 4 8
To a great extent 96 84
Don’t know 0 7
No response 0 1
N=707 N=955 A single response question. Due to rounding percentages may not sum to 100. Source: NFER survey of headteachers and school governors, 2010.
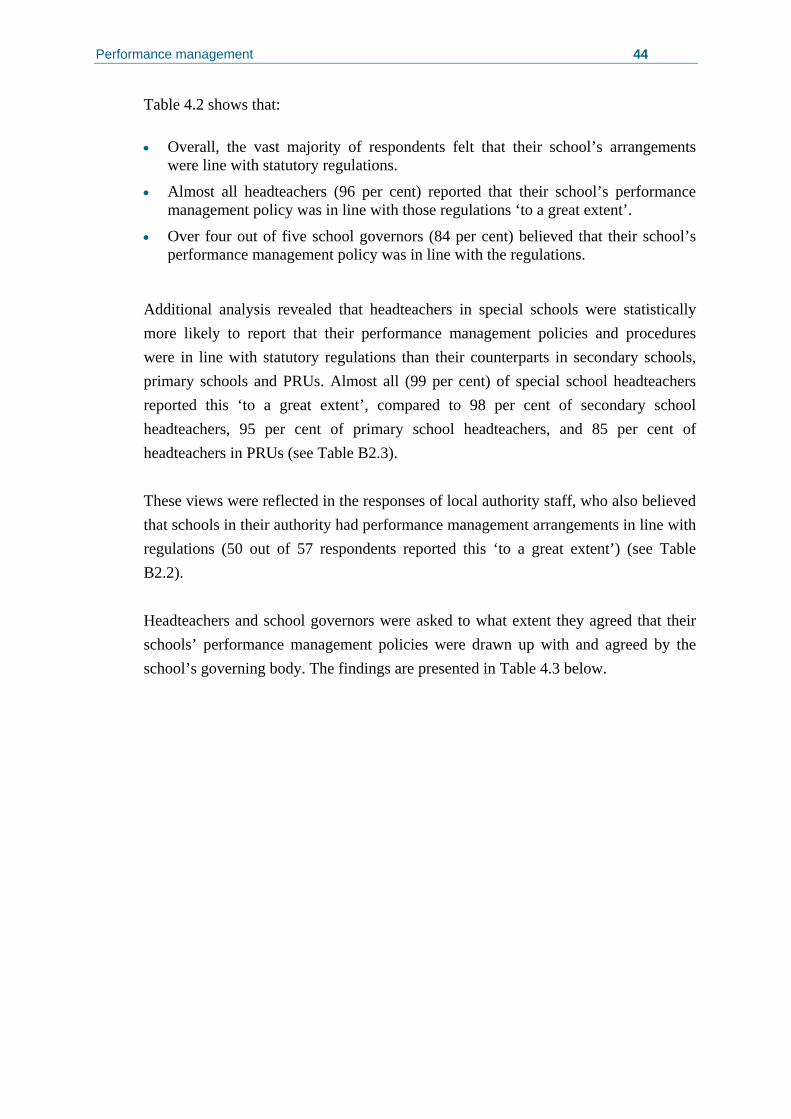
Performance management 44
Table 4.2 shows that: • Overall, the vast majority of respondents felt that their school’s arrangements
were line with statutory regulations.
• Almost all headteachers (96 per cent) reported that their school’s performance management policy was in line with those regulations ‘to a great extent’.
• Over four out of five school governors (84 per cent) believed that their school’s performance management policy was in line with the regulations.
Additional analysis revealed that headteachers in special schools were statistically more likely to report that their performance management policies and procedures were in line with statutory regulations than their counterparts in secondary schools, primary schools and PRUs. Almost all (99 per cent) of special school headteachers reported this ‘to a great extent’, compared to 98 per cent of secondary school headteachers, 95 per cent of primary school headteachers, and 85 per cent of headteachers in PRUs (see Table B2.3). These views were reflected in the responses of local authority staff, who also believed that schools in their authority had performance management arrangements in line with regulations (50 out of 57 respondents reported this ‘to a great extent’) (see Table B2.2). Headteachers and school governors were asked to what extent they agreed that their schools’ performance management policies were drawn up with and agreed by the school’s governing body. The findings are presented in Table 4.3 below.
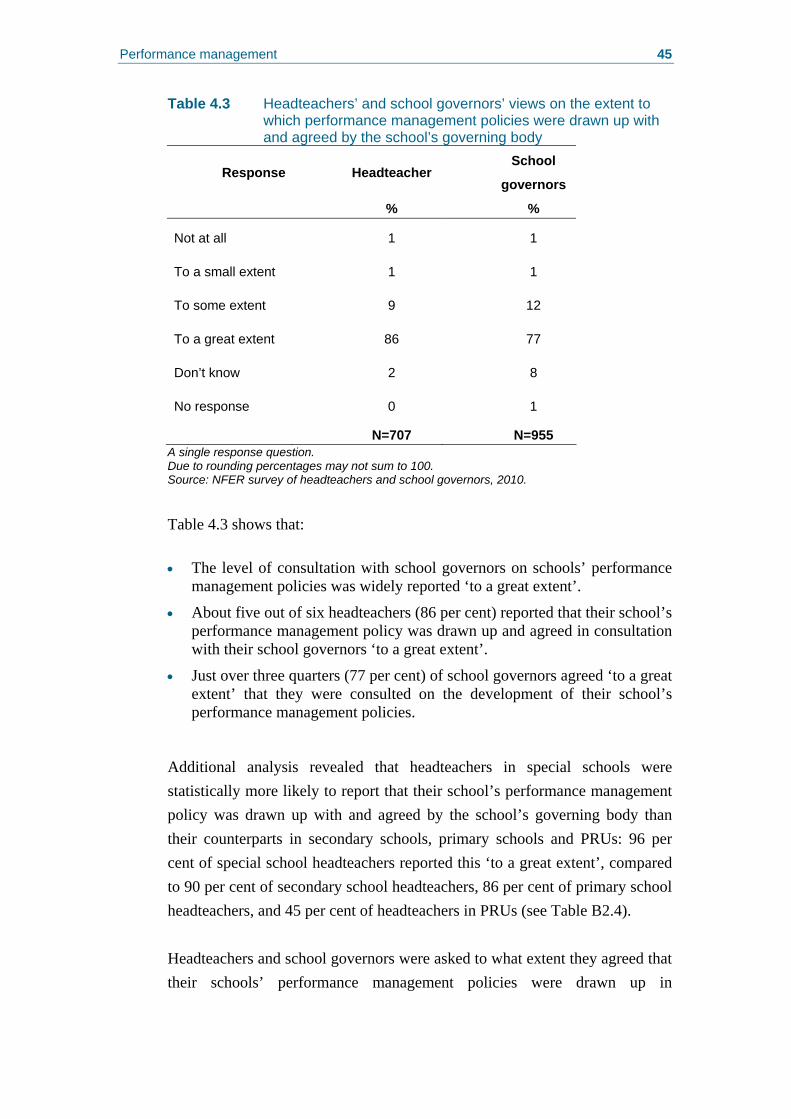
Performance management 45
Table 4.3 Headteachers’ and school governors’ views on the extent to which performance management policies were drawn up with and agreed by the school’s governing body
Response Headteacher School
governors
% %
Not at all 1 1
To a small extent 1 1
To some extent 9 12
To a great extent 86 77
Don’t know 2 8
No response 0 1
N=707 N=955 A single response question. Due to rounding percentages may not sum to 100. Source: NFER survey of headteachers and school governors, 2010.
Table 4.3 shows that: • The level of consultation with school governors on schools’ performance
management policies was widely reported ‘to a great extent’.
• About five out of six headteachers (86 per cent) reported that their school’s performance management policy was drawn up and agreed in consultation with their school governors ‘to a great extent’.
• Just over three quarters (77 per cent) of school governors agreed ‘to a great extent’ that they were consulted on the development of their school’s performance management policies.
Additional analysis revealed that headteachers in special schools were statistically more likely to report that their school’s performance management policy was drawn up with and agreed by the school’s governing body than their counterparts in secondary schools, primary schools and PRUs: 96 per cent of special school headteachers reported this ‘to a great extent’, compared to 90 per cent of secondary school headteachers, 86 per cent of primary school headteachers, and 45 per cent of headteachers in PRUs (see Table B2.4). Headteachers and school governors were asked to what extent they agreed that their schools’ performance management policies were drawn up in
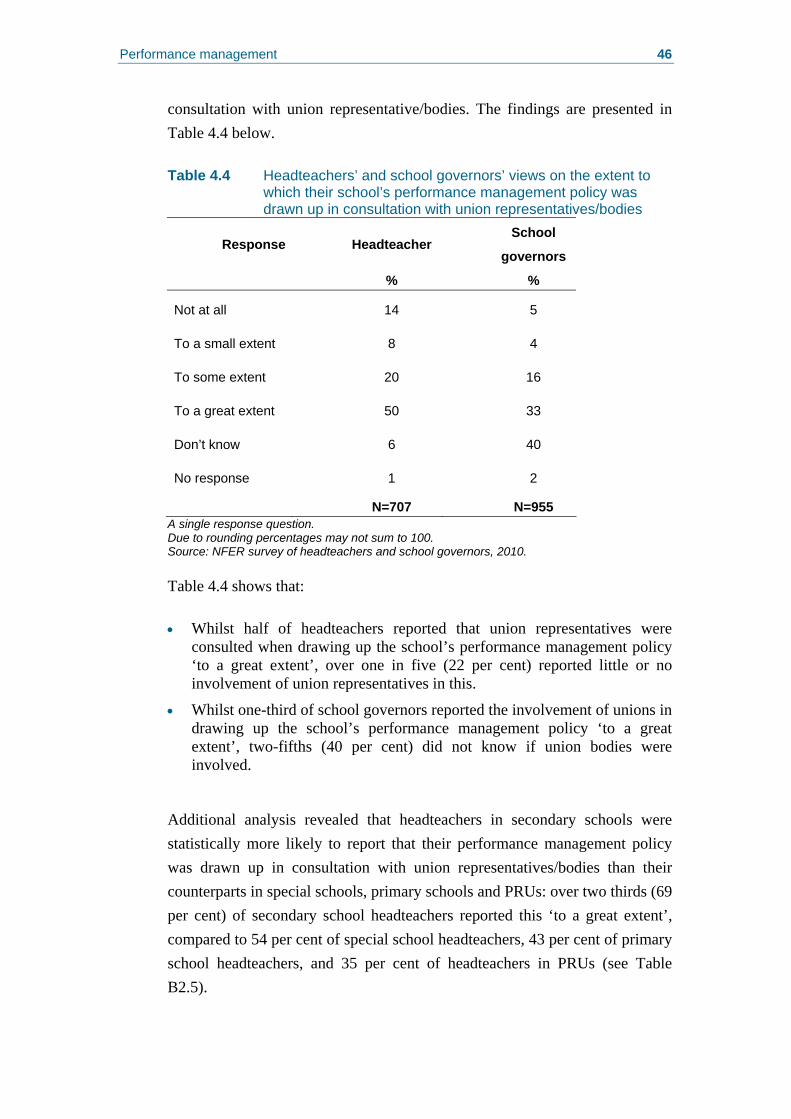
Performance management 46
consultation with union representative/bodies. The findings are presented in Table 4.4 below. Table 4.4 Headteachers’ and school governors’ views on the extent to
which their school’s performance management policy was drawn up in consultation with union representatives/bodies
Response Headteacher School
governors
% %
Not at all 14 5
To a small extent 8 4
To some extent 20 16
To a great extent 50 33
Don’t know 6 40
No response 1 2
N=707 N=955 A single response question. Due to rounding percentages may not sum to 100. Source: NFER survey of headteachers and school governors, 2010. Table 4.4 shows that: • Whilst half of headteachers reported that union representatives were
consulted when drawing up the school’s performance management policy ‘to a great extent’, over one in five (22 per cent) reported little or no involvement of union representatives in this.
• Whilst one-third of school governors reported the involvement of unions in drawing up the school’s performance management policy ‘to a great extent’, two-fifths (40 per cent) did not know if union bodies were involved.
Additional analysis revealed that headteachers in secondary schools were statistically more likely to report that their performance management policy was drawn up in consultation with union representatives/bodies than their counterparts in special schools, primary schools and PRUs: over two thirds (69 per cent) of secondary school headteachers reported this ‘to a great extent’, compared to 54 per cent of special school headteachers, 43 per cent of primary school headteachers, and 35 per cent of headteachers in PRUs (see Table B2.5).

Performance management 47
This was supported by the responses of school governors: almost half (48 per cent) of school governors in secondary schools reported that the performance management arrangements in their school were drawn up in consultation with union representatives/bodies, compared to just less than a quarter (23 per cent) of primary school governors. This difference is statistically significant (see Table B2.6).
4.3 About teachers’ performance management and their engagement with the process This section explores respondents’ perspectives on teachers’ performance management arrangements, and teachers’ engagement with the performance management process.
4.3.1 Teachers’ performance management arrangements
Most teachers reported that their main performance management reviewer was their headteacher (44 per cent of responding teachers), with 22 per cent identifying the deputy head in this regard, and 20 per cent their head of department. Headteachers too cited heads (94 per cent) and deputy heads (74 per cent) as the most common performance management reviewers, and the vast majority (89 per cent) reported that performance reviewers have received training for this role (see Tables B2.6-B2.9). Proportionally more teachers from primary schools (66 per cent), PRUs (59 per cent) and special schools (47 per cent) reported that, more than any other person, their main performance management reviewer was their headteacher. By contrast, proportionally more teachers in secondary schools reported that their main performance management reviewer was their head of department (41 per cent), than any other person (Table B2.10). This is perhaps not surprising given that as secondary schools are generally larger and employ more staff than primary or special schools or PRUs, it would be difficult for the headteacher to line manage as many staff. Proportionally more teachers with 21+ years experience reported that, more than any other person, their main performance management reviewer was their headteacher. Over half of these teachers (58 per cent) reported this, compared to half of teachers with 11-20 years experience, just over four in ten (41 per
Performance management 48
cent) teachers with 6-10 years experience, and a third of teachers with 0-5 years’ experience (see Table B2.11). For the vast majority of teachers, the person acting as their performance reviewer was also their line manager (78 per cent). Teachers in PRUs and secondary schools were statistically more likely to report that this person was also their line manager (82 per cent), when compared to primary school teachers (76 per cent) and special school teachers (76 per cent) (see Tables B2.12 and B2.13). Additional analysis revealed that proportionally more teachers with 21+ years experience (85 per cent), reported that their performance management reviewer was also their line manager, compared to teachers with 6-10 years experience (82 per cent), teachers with 11-20 years’ experience (77 per cent), and teachers with 0-5 years experience (71 per cent) (see Table B2.14). Teachers most commonly met with their performance management reviewers twice in a performance management cycle (they were asked to include in this their planning and review meeting) (44 per cent of teachers), with just under one-quarter (24 per cent) meeting once, and a similar proportion (23 per cent) meeting three times. Fewer than one in ten (7 per cent) met with their performance management reviewer more than three times during a performance management cycle (see Table B2.15). Additional analysis revealed that teachers in special schools were statistically more likely to report that they met with their performance reviewer twice a year as part of their performance management review cycle. Almost half (49 per cent) of special school teachers reported that this was the case, compared to 45 per cent of primary school teachers, and 42 per cent of teachers in secondary schools and PRUs (see Table B2.16). Teachers most commonly cited having one hour’s worth of lesson observation provided for on their planning and review statement (46 per cent of teachers), followed by 29 per cent reporting two hours’ worth, and 17 per cent reporting three hours. Teachers in primary schools were statistically more likely to report that a greater amount of lesson observation is provided for their performance management planning and review statement: just under a quarter (23 per cent) of primary school teachers reported receiving three hours,
Performance management 49
compared to 19 per cent of PRUs, 17 per cent of special schools and notably only eight per cent of secondary school teachers.= (see Tables B2.17 and B2.18). The vast majority of teachers reported that the amount of lesson observation provided for them was proportionate to their needs (76 per cent). Teachers in special schools were statistically more likely to report that this was the case than their counterparts in PRUs, secondary schools and primary schools: more than eight in ten (84 per cent) of special school teachers reported that this was the case, compared to 79 per cent of PRU teachers, 77 per cent of secondary school teachers, and 73 per cent of primary school teachers (see Tables B2.19 and B2.20). Teachers with 21+ years experience (82 per cent) were also statistically more likely to report that the amount of lesson observation outlined in their performance management planning and review statement was proportionate to their needs, compared to those with 11-20 years experience (80 per cent), those with 6-10 years experience (74 per cent), and those with 0-5 years experience (70 per cent) (see Table B2.21). Just over two-thirds (68 per cent) of teachers reported that their headteacher reviews their planning and review statement; one quarter did not know. Almost three-quarters of teachers in primary schools and PRUs (74 per cent) reported that their headteacher reviews their planning and review statement, which is statistically greater than their counterparts in special schools (72 per cent) and secondary schools (56 per cent) (see Tables B2.22-B2.23). Teachers with 21+ years experience were also statistically more likely to report that their headteacher reviews their planning and review statement (77 per cent), than those with 11-20 years experience (70 per cent), those with 6-10 years experience (67 per cent), and those with 0-5 years experience (60 per cent) (see Table B2.24).
4.3.2 Teachers’ engagement with the performance management process
Headteachers, teachers, induction tutors and NQTs/2nd year teachers and school governors were asked about teachers’ familiarity with the performance management process.
Performance management 50
Headteachers believed that their teachers were aware of the school’s performance management policy (72 per cent agreed with this ‘to a great extent’), and indeed the same proportion of teachers reported this. Induction tutors were even more familiar with the school’s policy on performance management (89 per cent agreed with this ‘to a great extent’), but those second year teachers responding to the NQT/2nd year teacher survey were less so (51 per cent agreed ‘to a great extent’). (see Tables B2.25 to B2.28). Teachers in secondary schools were statistically more likely to report that they were familiar with the performance management policy in their school ‘to a great extent’ (78 per cent) than their counterparts in special schools (74 per cent), PRUs (71 per cent) and primary schools (70 per cent). This view was echoed by headteachers in secondary schools, 82 per cent of whom reported that teachers in their school were aware of the school’s performance management policy, compared to 73 per cent of special school headteachers, 70 per cent of PRUs and 67 per cent of primary school headteachers (see Tables B2.29 and B2.30). Longstanding teachers with 21+ years experience (85 per cent) were also statistically more likely to report that they were familiar with the performance management policy in their school ‘to a great extent’ than their counterparts with 11-20 years experience (77 per cent), those with 6-10 years experience (73 per cent) and early career teachers with 0-5 years experience (61 per cent) (see Table B2.31). Over half of headteachers (57 per cent), and indeed of school governors (54 per cent) , felt that teachers were consulted on their school’s performance management policy (‘to a great extent’), just one-quarter of teachers reported consultation to this degree, and indeed two-fifths (40 per cent) reported little or no consultation. (see Tables B2.25-B2.26 and B2.32). Additional analysis revealed that longstanding teachers with 21+ years experience were statistically more likely to report that they were consulted on the development of the school’s performance management policy (40 per cent reported this ‘to a great extent’) than their counterparts with 11-20 years experience (29 per cent of whom agreed ‘to a great extent’), those with 6-10
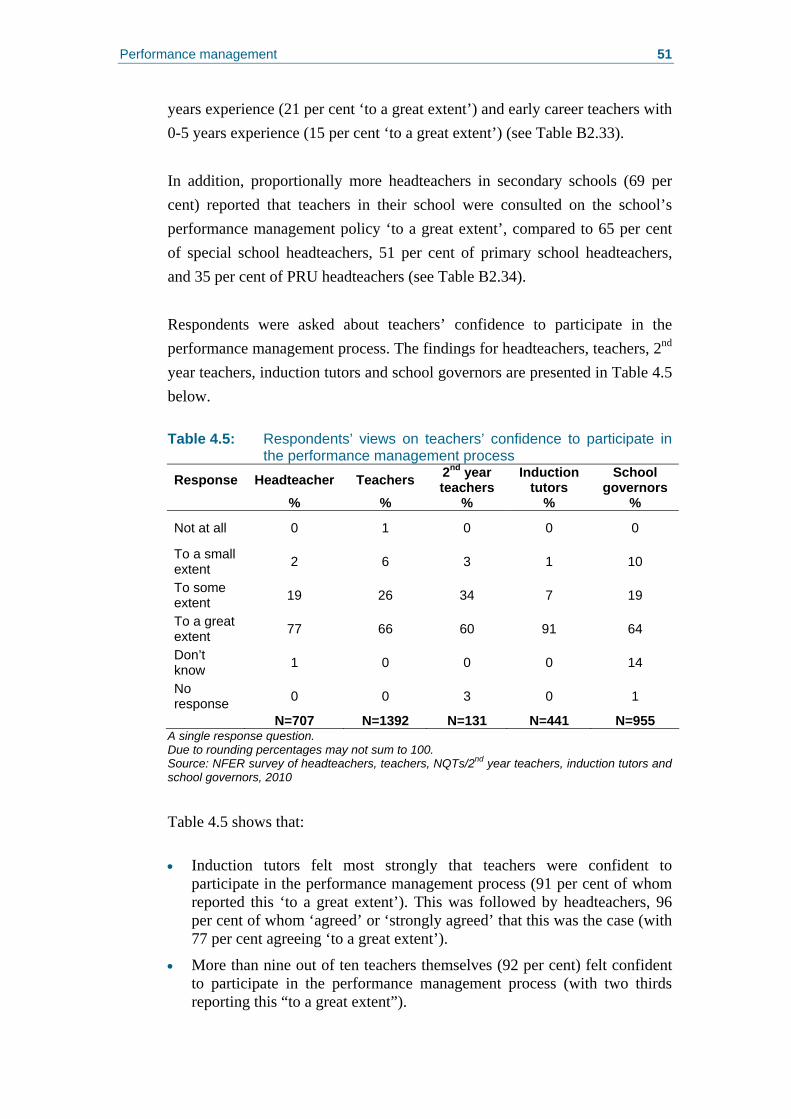
Performance management 51
years experience (21 per cent ‘to a great extent’) and early career teachers with 0-5 years experience (15 per cent ‘to a great extent’) (see Table B2.33). In addition, proportionally more headteachers in secondary schools (69 per cent) reported that teachers in their school were consulted on the school’s performance management policy ‘to a great extent’, compared to 65 per cent of special school headteachers, 51 per cent of primary school headteachers, and 35 per cent of PRU headteachers (see Table B2.34). Respondents were asked about teachers’ confidence to participate in the performance management process. The findings for headteachers, teachers, 2nd year teachers, induction tutors and school governors are presented in Table 4.5 below. Table 4.5: Respondents’ views on teachers’ confidence to participate in the performance management process Response Headteacher Teachers 2nd year
teachers Induction
tutors School
governors % % % % %
Not at all 0 1 0 0 0
To a small extent 2 6 3 1 10
To some extent 19 26 34 7 19
To a great extent 77 66 60 91 64
Don’t know 1 0 0 0 14
No response 0 0 3 0 1
N=707 N=1392 N=131 N=441 N=955 A single response question. Due to rounding percentages may not sum to 100. Source: NFER survey of headteachers, teachers, NQTs/2nd year teachers, induction tutors and school governors, 2010
Table 4.5 shows that: • Induction tutors felt most strongly that teachers were confident to
participate in the performance management process (91 per cent of whom reported this ‘to a great extent’). This was followed by headteachers, 96 per cent of whom ‘agreed’ or ‘strongly agreed’ that this was the case (with 77 per cent agreeing ‘to a great extent’).
• More than nine out of ten teachers themselves (92 per cent) felt confident to participate in the performance management process (with two thirds reporting this “to a great extent”).
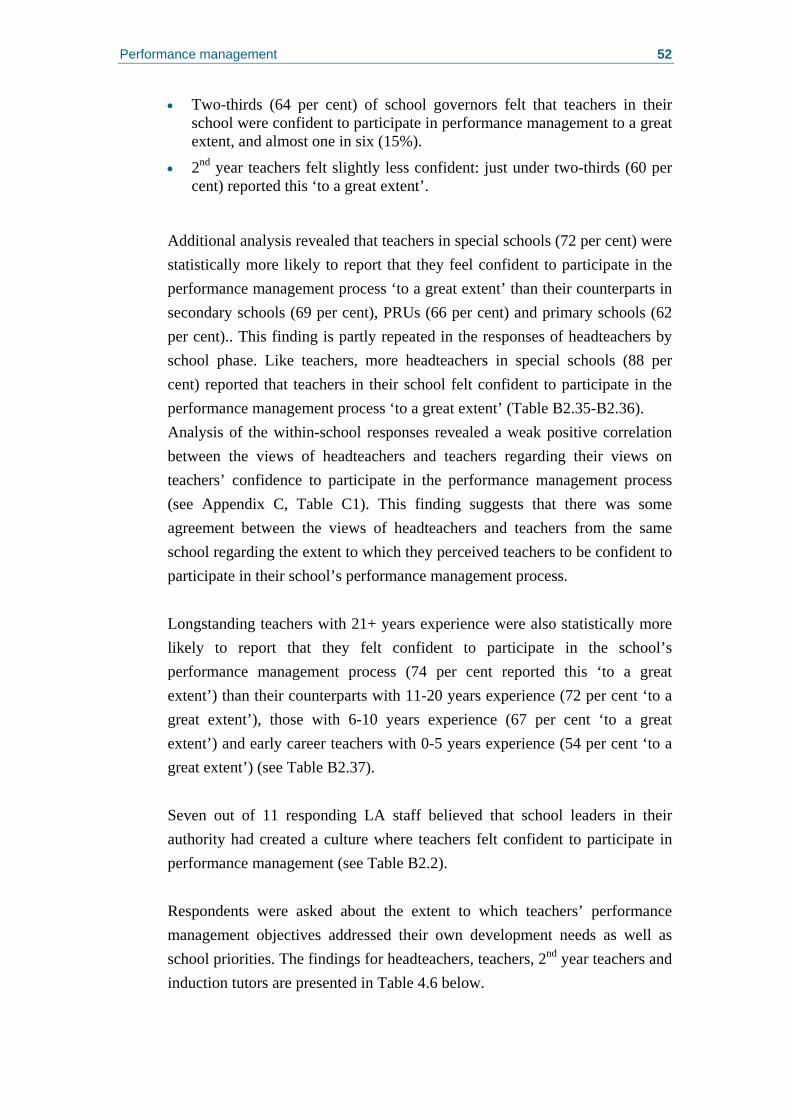
Performance management 52
• Two-thirds (64 per cent) of school governors felt that teachers in their school were confident to participate in performance management to a great extent, and almost one in six (15%).
• 2nd year teachers felt slightly less confident: just under two-thirds (60 per cent) reported this ‘to a great extent’.
Additional analysis revealed that teachers in special schools (72 per cent) were statistically more likely to report that they feel confident to participate in the performance management process ‘to a great extent’ than their counterparts in secondary schools (69 per cent), PRUs (66 per cent) and primary schools (62 per cent).. This finding is partly repeated in the responses of headteachers by school phase. Like teachers, more headteachers in special schools (88 per cent) reported that teachers in their school felt confident to participate in the performance management process ‘to a great extent’ (Table B2.35-B2.36). Analysis of the within-school responses revealed a weak positive correlation between the views of headteachers and teachers regarding their views on teachers’ confidence to participate in the performance management process (see Appendix C, Table C1). This finding suggests that there was some agreement between the views of headteachers and teachers from the same school regarding the extent to which they perceived teachers to be confident to participate in their school’s performance management process. Longstanding teachers with 21+ years experience were also statistically more likely to report that they felt confident to participate in the school’s performance management process (74 per cent reported this ‘to a great extent’) than their counterparts with 11-20 years experience (72 per cent ‘to a great extent’), those with 6-10 years experience (67 per cent ‘to a great extent’) and early career teachers with 0-5 years experience (54 per cent ‘to a great extent’) (see Table B2.37). Seven out of 11 responding LA staff believed that school leaders in their authority had created a culture where teachers felt confident to participate in performance management (see Table B2.2). Respondents were asked about the extent to which teachers’ performance management objectives addressed their own development needs as well as school priorities. The findings for headteachers, teachers, 2nd year teachers and induction tutors are presented in Table 4.6 below.
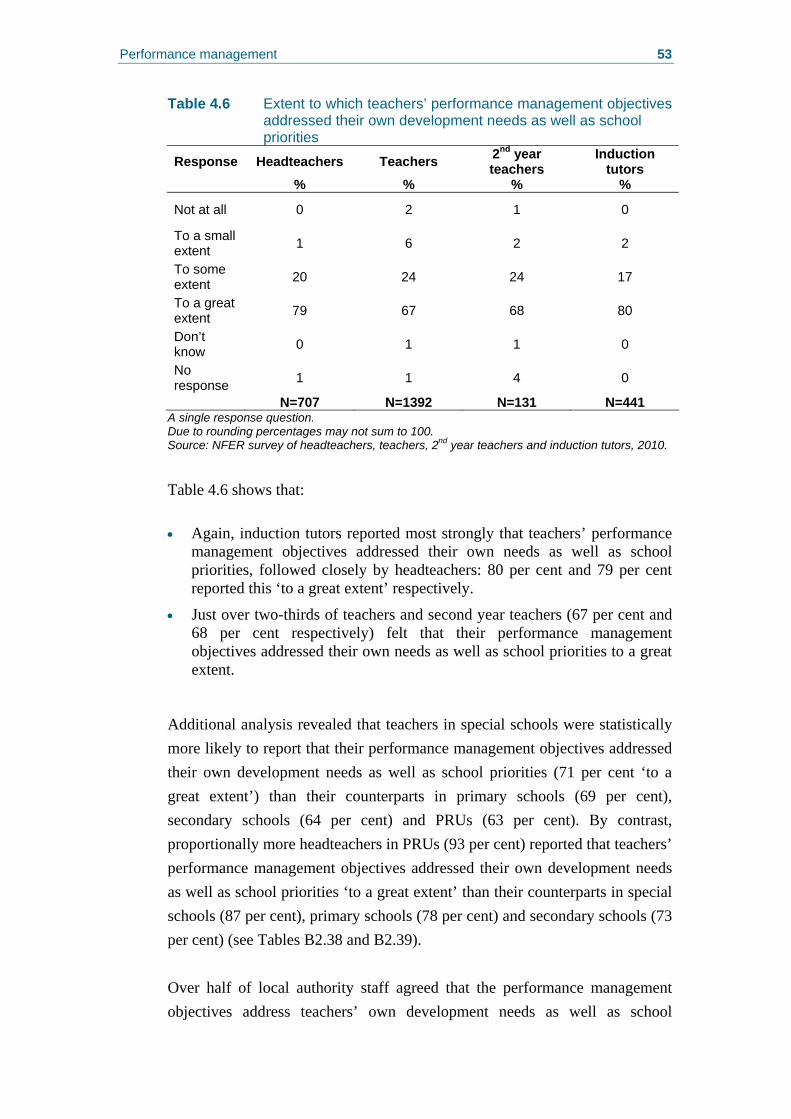
Performance management 53
Table 4.6 Extent to which teachers’ performance management objectives addressed their own development needs as well as school priorities Response Headteachers Teachers 2nd year
teachers Induction
tutors % % % %
Not at all 0 2 1 0
To a small extent 1 6 2 2
To some extent 20 24 24 17
To a great extent 79 67 68 80
Don’t know 0 1 1 0
No response 1 1 4 0
N=707 N=1392 N=131 N=441 A single response question. Due to rounding percentages may not sum to 100. Source: NFER survey of headteachers, teachers, 2nd year teachers and induction tutors, 2010.
Table 4.6 shows that: • Again, induction tutors reported most strongly that teachers’ performance
management objectives addressed their own needs as well as school priorities, followed closely by headteachers: 80 per cent and 79 per cent reported this ‘to a great extent’ respectively.
• Just over two-thirds of teachers and second year teachers (67 per cent and 68 per cent respectively) felt that their performance management objectives addressed their own needs as well as school priorities to a great extent.
Additional analysis revealed that teachers in special schools were statistically more likely to report that their performance management objectives addressed their own development needs as well as school priorities (71 per cent ‘to a great extent’) than their counterparts in primary schools (69 per cent), secondary schools (64 per cent) and PRUs (63 per cent). By contrast, proportionally more headteachers in PRUs (93 per cent) reported that teachers’ performance management objectives addressed their own development needs as well as school priorities ‘to a great extent’ than their counterparts in special schools (87 per cent), primary schools (78 per cent) and secondary schools (73 per cent) (see Tables B2.38 and B2.39). Over half of local authority staff agreed that the performance management objectives address teachers’ own development needs as well as school
Performance management 54
priorities: 25 respondents reported this ‘to a great extent’, and a further 29 ‘to some extent’ (see Table B2.2). Respondents were asked about the extent to which teachers’ planning and review statements set out how their professional development needs would be met. The findings for headteachers, teachers, 2nd year teachers and induction tutors are presented in Table 4.7 below. Table 4.7 Extent to which people’s planning and review statements set out how professional development needs will be met Response Headteacher Teachers 2nd year
teachers Induction
tutors % % % %
Not at all 0 3 1 1
To a small extent 2 6 3 4
To some extent 28 32 32 22
To a great extent 69 56 53 72
Don’t know 1 2 4 0
No response 1 0 5 1
N=707 N=1392 N=131 N=441 A single response question. Due to rounding percentages may not sum to 100. Source: NFER survey of headteachers, teachers, 2nd year teachers and induction tutors, 2010.
Table 4.7 shows that: • Almost three quarters (72 per cent) of induction tutors reported that the
planning and review statement set out how teachers’ CPD needs would be met ‘to a great extent’. This was closely followed by the views of headteachers, 69 per cent of whom reported this (‘to a great extent’).
• This was also reported (although less strongly) by teachers. Over half (56 per cent) of teachers reported this ‘to a great extent’. However, almost one in ten teachers (9 per cent) reported this ‘to a small extent’ or not at all.
• 2nd year teachers reported this slightly less strongly than other respondents: 53 per cent reported this ‘to a great extent’.
Additional analysis revealed that proportionally more headteachers in special schools (79 per cent) reported that teachers’ planning and review statements set out how their professional development needs would be met ‘to a great extent’, compared to 72 per cent of PRU headteachers, 71 per cent primary
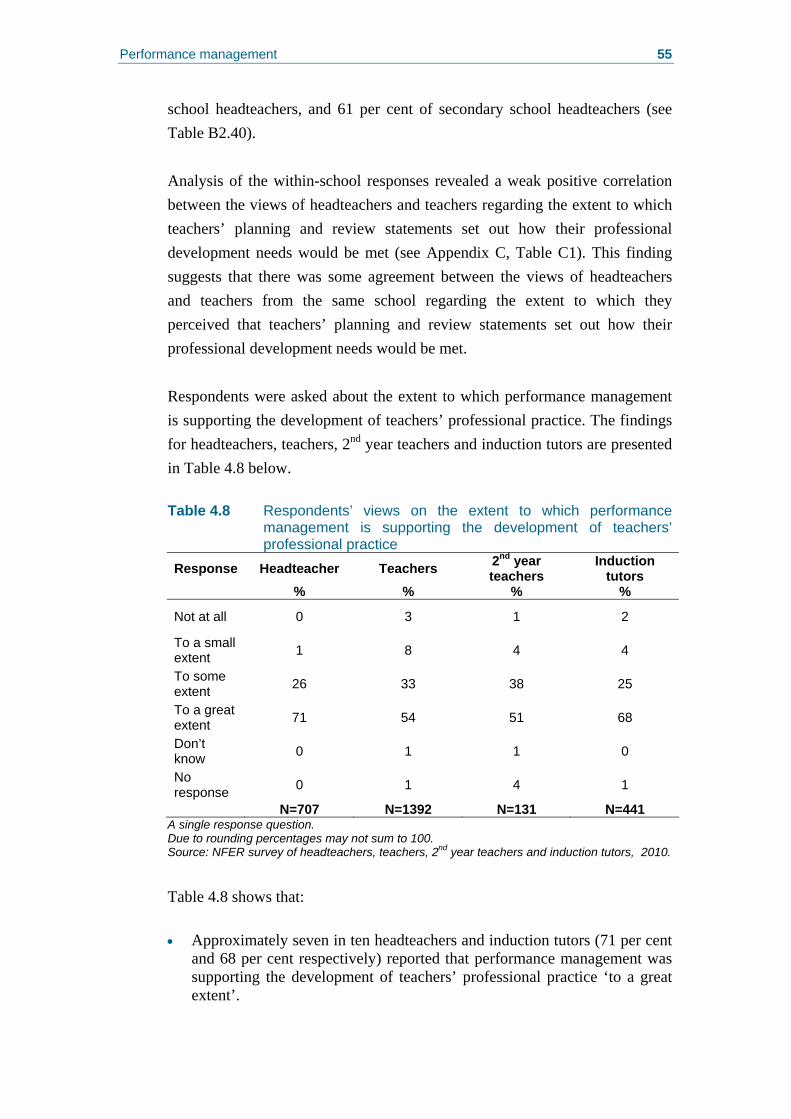
Performance management 55
school headteachers, and 61 per cent of secondary school headteachers (see Table B2.40). Analysis of the within-school responses revealed a weak positive correlation between the views of headteachers and teachers regarding the extent to which teachers’ planning and review statements set out how their professional development needs would be met (see Appendix C, Table C1). This finding suggests that there was some agreement between the views of headteachers and teachers from the same school regarding the extent to which they perceived that teachers’ planning and review statements set out how their professional development needs would be met. Respondents were asked about the extent to which performance management is supporting the development of teachers’ professional practice. The findings for headteachers, teachers, 2nd year teachers and induction tutors are presented in Table 4.8 below. Table 4.8 Respondents’ views on the extent to which performance
management is supporting the development of teachers’ professional practice
Response Headteacher Teachers 2nd year teachers
Induction tutors
% % % %
Not at all 0 3 1 2
To a small extent 1 8 4 4
To some extent 26 33 38 25
To a great extent 71 54 51 68
Don’t know 0 1 1 0
No response 0 1 4 1
N=707 N=1392 N=131 N=441 A single response question. Due to rounding percentages may not sum to 100. Source: NFER survey of headteachers, teachers, 2nd year teachers and induction tutors, 2010.
Table 4.8 shows that: • Approximately seven in ten headteachers and induction tutors (71 per cent
and 68 per cent respectively) reported that performance management was supporting the development of teachers’ professional practice ‘to a great extent’.
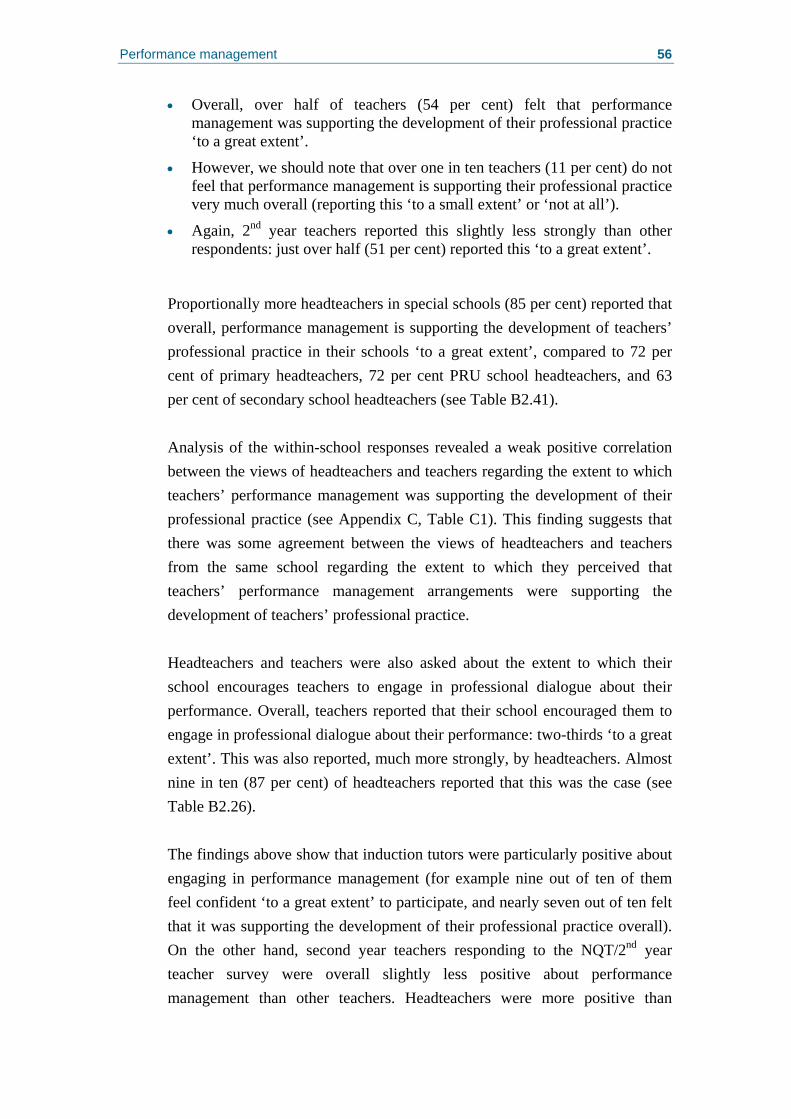
Performance management 56
• Overall, over half of teachers (54 per cent) felt that performance management was supporting the development of their professional practice ‘to a great extent’.
• However, we should note that over one in ten teachers (11 per cent) do not feel that performance management is supporting their professional practice very much overall (reporting this ‘to a small extent’ or ‘not at all’).
• Again, 2nd year teachers reported this slightly less strongly than other respondents: just over half (51 per cent) reported this ‘to a great extent’.
Proportionally more headteachers in special schools (85 per cent) reported that overall, performance management is supporting the development of teachers’ professional practice in their schools ‘to a great extent’, compared to 72 per cent of primary headteachers, 72 per cent PRU school headteachers, and 63 per cent of secondary school headteachers (see Table B2.41). Analysis of the within-school responses revealed a weak positive correlation between the views of headteachers and teachers regarding the extent to which teachers’ performance management was supporting the development of their professional practice (see Appendix C, Table C1). This finding suggests that there was some agreement between the views of headteachers and teachers from the same school regarding the extent to which they perceived that teachers’ performance management arrangements were supporting the development of teachers’ professional practice. Headteachers and teachers were also asked about the extent to which their school encourages teachers to engage in professional dialogue about their performance. Overall, teachers reported that their school encouraged them to engage in professional dialogue about their performance: two-thirds ‘to a great extent’. This was also reported, much more strongly, by headteachers. Almost nine in ten (87 per cent) of headteachers reported that this was the case (see Table B2.26). The findings above show that induction tutors were particularly positive about engaging in performance management (for example nine out of ten of them feel confident ‘to a great extent’ to participate, and nearly seven out of ten felt that it was supporting the development of their professional practice overall). On the other hand, second year teachers responding to the NQT/2nd year teacher survey were overall slightly less positive about performance management than other teachers. Headteachers were more positive than
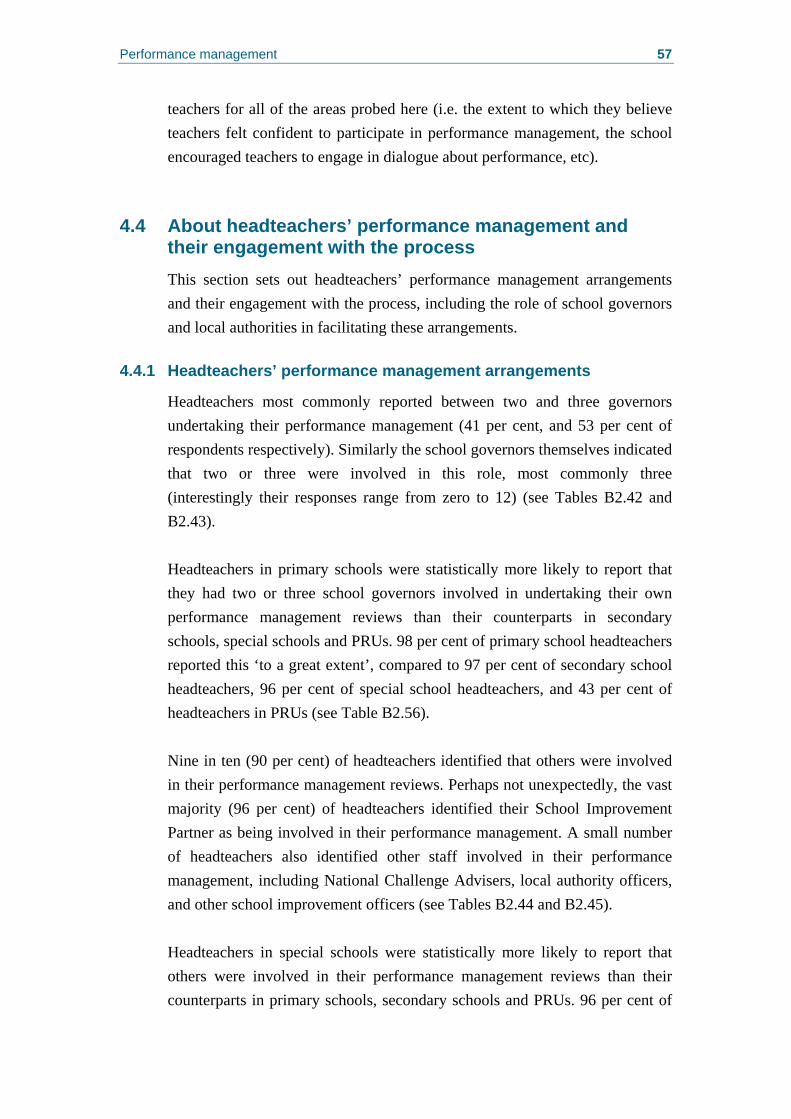
Performance management 57
teachers for all of the areas probed here (i.e. the extent to which they believe teachers felt confident to participate in performance management, the school encouraged teachers to engage in dialogue about performance, etc).
4.4 About headteachers’ performance management and their engagement with the process This section sets out headteachers’ performance management arrangements and their engagement with the process, including the role of school governors and local authorities in facilitating these arrangements.
4.4.1 Headteachers’ performance management arrangements
Headteachers most commonly reported between two and three governors undertaking their performance management (41 per cent, and 53 per cent of respondents respectively). Similarly the school governors themselves indicated that two or three were involved in this role, most commonly three (interestingly their responses range from zero to 12) (see Tables B2.42 and B2.43). Headteachers in primary schools were statistically more likely to report that they had two or three school governors involved in undertaking their own performance management reviews than their counterparts in secondary schools, special schools and PRUs. 98 per cent of primary school headteachers reported this ‘to a great extent’, compared to 97 per cent of secondary school headteachers, 96 per cent of special school headteachers, and 43 per cent of headteachers in PRUs (see Table B2.56). Nine in ten (90 per cent) of headteachers identified that others were involved in their performance management reviews. Perhaps not unexpectedly, the vast majority (96 per cent) of headteachers identified their School Improvement Partner as being involved in their performance management. A small number of headteachers also identified other staff involved in their performance management, including National Challenge Advisers, local authority officers, and other school improvement officers (see Tables B2.44 and B2.45). Headteachers in special schools were statistically more likely to report that others were involved in their performance management reviews than their counterparts in primary schools, secondary schools and PRUs. 96 per cent of
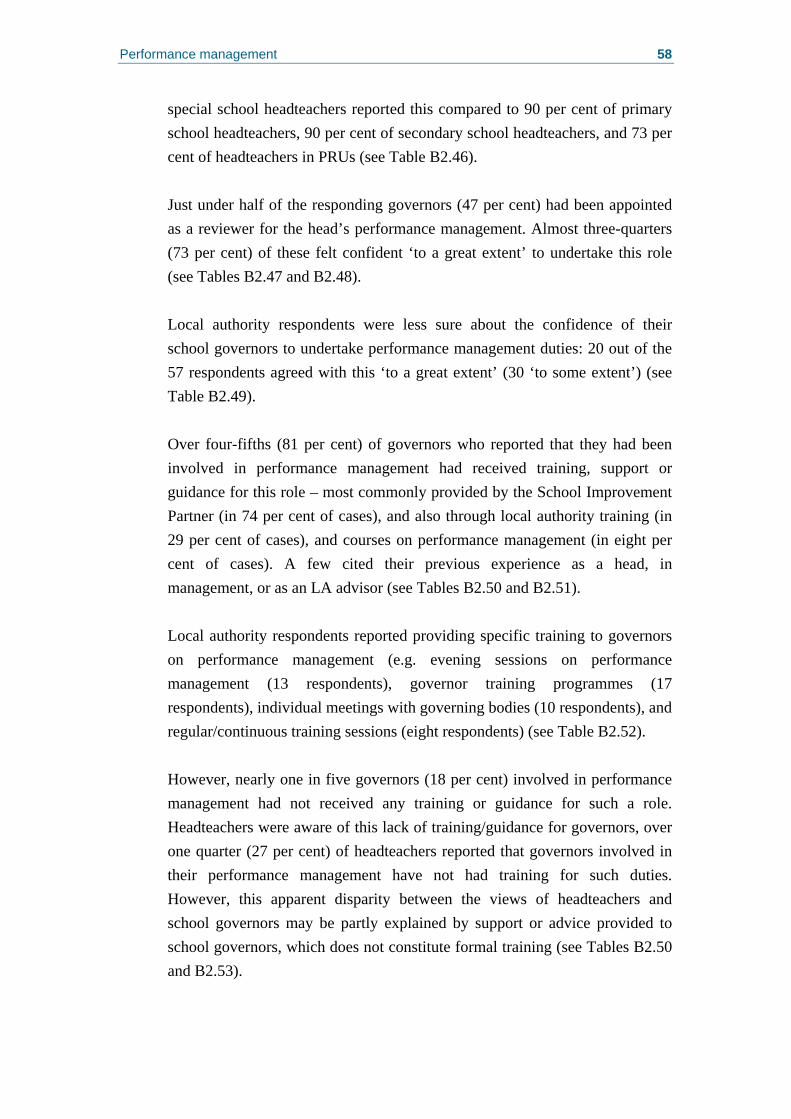
Performance management 58
special school headteachers reported this compared to 90 per cent of primary school headteachers, 90 per cent of secondary school headteachers, and 73 per cent of headteachers in PRUs (see Table B2.46). Just under half of the responding governors (47 per cent) had been appointed as a reviewer for the head’s performance management. Almost three-quarters (73 per cent) of these felt confident ‘to a great extent’ to undertake this role (see Tables B2.47 and B2.48). Local authority respondents were less sure about the confidence of their school governors to undertake performance management duties: 20 out of the 57 respondents agreed with this ‘to a great extent’ (30 ‘to some extent’) (see Table B2.49). Over four-fifths (81 per cent) of governors who reported that they had been involved in performance management had received training, support or guidance for this role – most commonly provided by the School Improvement Partner (in 74 per cent of cases), and also through local authority training (in 29 per cent of cases), and courses on performance management (in eight per cent of cases). A few cited their previous experience as a head, in management, or as an LA advisor (see Tables B2.50 and B2.51). Local authority respondents reported providing specific training to governors on performance management (e.g. evening sessions on performance management (13 respondents), governor training programmes (17 respondents), individual meetings with governing bodies (10 respondents), and regular/continuous training sessions (eight respondents) (see Table B2.52). However, nearly one in five governors (18 per cent) involved in performance management had not received any training or guidance for such a role. Headteachers were aware of this lack of training/guidance for governors, over one quarter (27 per cent) of headteachers reported that governors involved in their performance management have not had training for such duties. However, this apparent disparity between the views of headteachers and school governors may be partly explained by support or advice provided to school governors, which does not constitute formal training (see Tables B2.50 and B2.53).
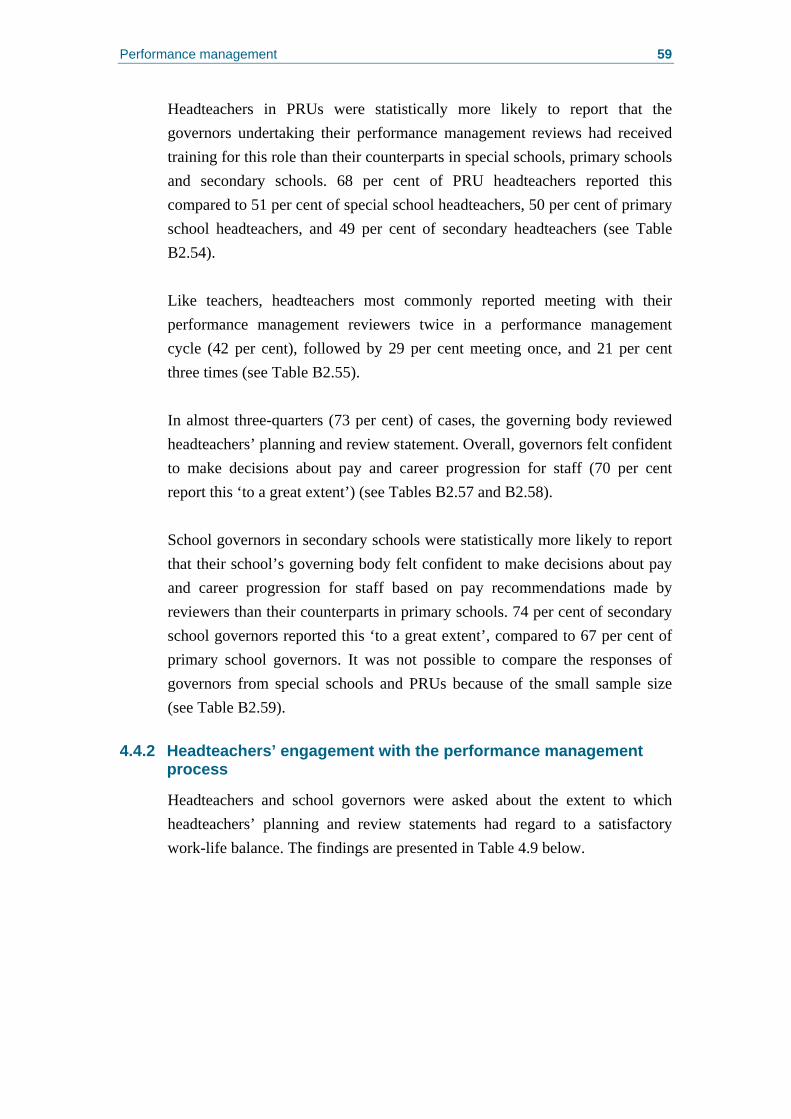
Performance management 59
Headteachers in PRUs were statistically more likely to report that the governors undertaking their performance management reviews had received training for this role than their counterparts in special schools, primary schools and secondary schools. 68 per cent of PRU headteachers reported this compared to 51 per cent of special school headteachers, 50 per cent of primary school headteachers, and 49 per cent of secondary headteachers (see Table B2.54). Like teachers, headteachers most commonly reported meeting with their performance management reviewers twice in a performance management cycle (42 per cent), followed by 29 per cent meeting once, and 21 per cent three times (see Table B2.55). In almost three-quarters (73 per cent) of cases, the governing body reviewed headteachers’ planning and review statement. Overall, governors felt confident to make decisions about pay and career progression for staff (70 per cent report this ‘to a great extent’) (see Tables B2.57 and B2.58). School governors in secondary schools were statistically more likely to report that their school’s governing body felt confident to make decisions about pay and career progression for staff based on pay recommendations made by reviewers than their counterparts in primary schools. 74 per cent of secondary school governors reported this ‘to a great extent’, compared to 67 per cent of primary school governors. It was not possible to compare the responses of governors from special schools and PRUs because of the small sample size (see Table B2.59).
4.4.2 Headteachers’ engagement with the performance management process
Headteachers and school governors were asked about the extent to which headteachers’ planning and review statements had regard to a satisfactory work-life balance. The findings are presented in Table 4.9 below.
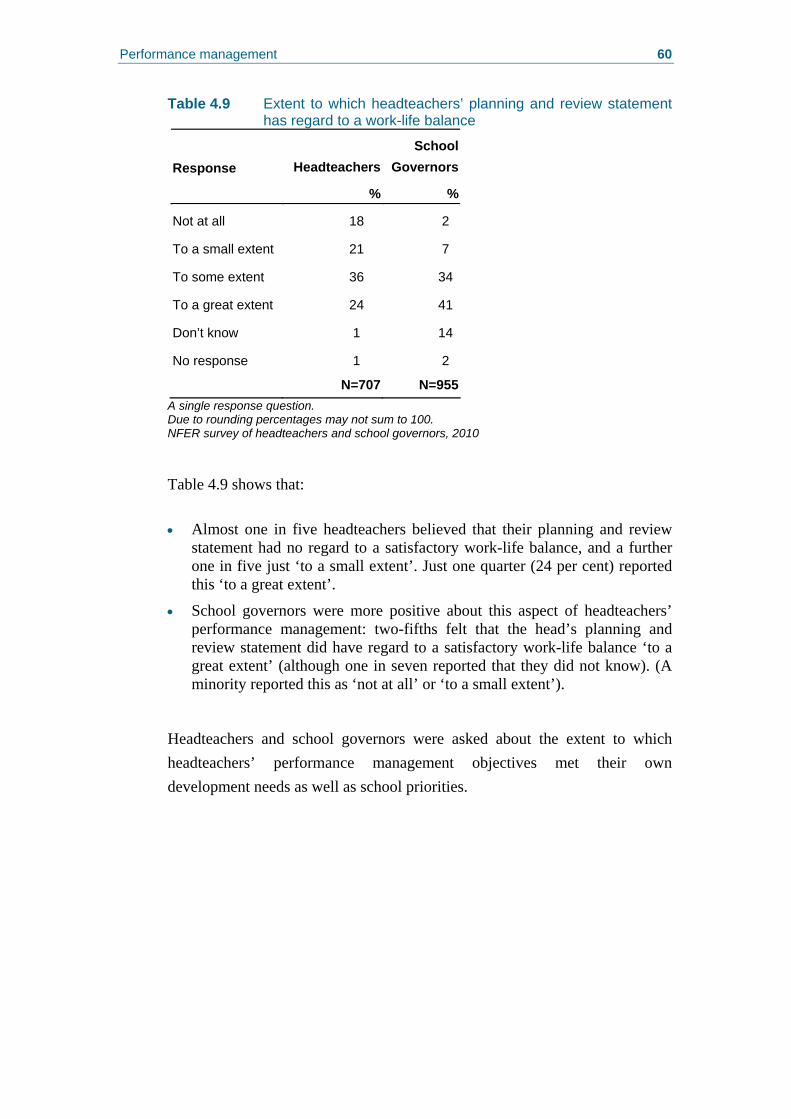
Performance management 60
Table 4.9 Extent to which headteachers’ planning and review statement has regard to a work-life balance
HeadteachersSchool
GovernorsResponse
% %
Not at all 18 2
To a small extent 21 7
To some extent 36 34
To a great extent 24 41
Don’t know 1 14
No response 1 2
N=707 N=955A single response question. Due to rounding percentages may not sum to 100. NFER survey of headteachers and school governors, 2010
Table 4.9 shows that:
• Almost one in five headteachers believed that their planning and review
statement had no regard to a satisfactory work-life balance, and a further one in five just ‘to a small extent’. Just one quarter (24 per cent) reported this ‘to a great extent’.
• School governors were more positive about this aspect of headteachers’ performance management: two-fifths felt that the head’s planning and review statement did have regard to a satisfactory work-life balance ‘to a great extent’ (although one in seven reported that they did not know). (A minority reported this as ‘not at all’ or ‘to a small extent’).
Headteachers and school governors were asked about the extent to which headteachers’ performance management objectives met their own development needs as well as school priorities.
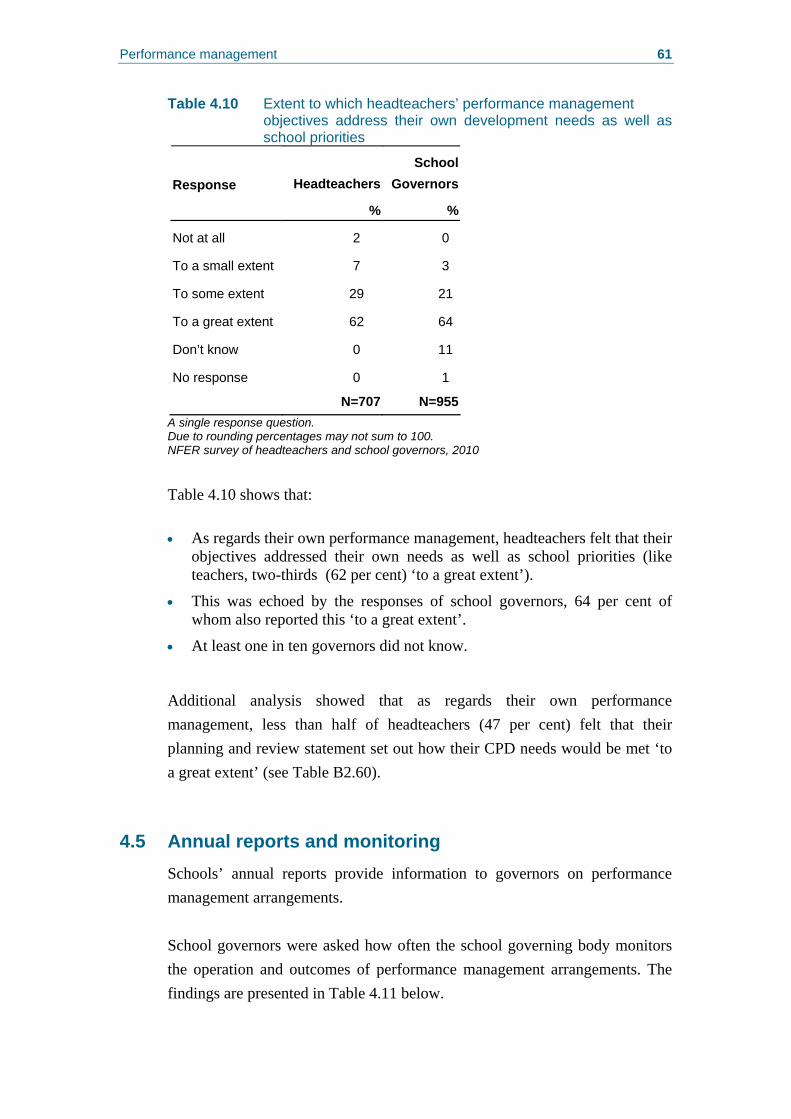
Performance management 61
Table 4.10 Extent to which headteachers’ performance management objectives address their own development needs as well as school priorities
HeadteachersSchool
GovernorsResponse
% %
Not at all 2 0
To a small extent 7 3
To some extent 29 21
To a great extent 62 64
Don’t know 0 11
No response 0 1
N=707 N=955A single response question. Due to rounding percentages may not sum to 100. NFER survey of headteachers and school governors, 2010
Table 4.10 shows that: • As regards their own performance management, headteachers felt that their
objectives addressed their own needs as well as school priorities (like teachers, two-thirds (62 per cent) ‘to a great extent’).
• This was echoed by the responses of school governors, 64 per cent of whom also reported this ‘to a great extent’.
• At least one in ten governors did not know.
Additional analysis showed that as regards their own performance management, less than half of headteachers (47 per cent) felt that their planning and review statement set out how their CPD needs would be met ‘to a great extent’ (see Table B2.60).
4.5 Annual reports and monitoring Schools’ annual reports provide information to governors on performance management arrangements. School governors were asked how often the school governing body monitors the operation and outcomes of performance management arrangements. The findings are presented in Table 4.11 below.
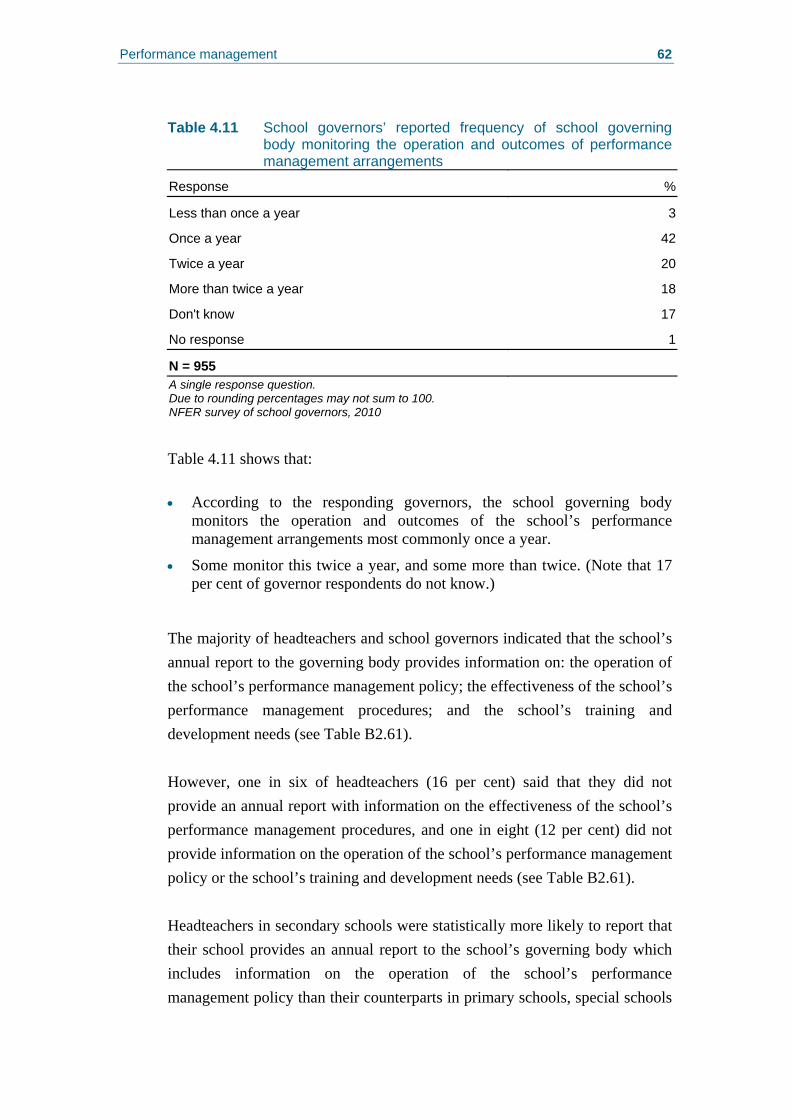
Performance management 62
Table 4.11 School governors’ reported frequency of school governing
body monitoring the operation and outcomes of performance management arrangements
Response %
Less than once a year 3
Once a year 42
Twice a year 20
More than twice a year 18
Don't know 17
No response 1
N = 955 A single response question. Due to rounding percentages may not sum to 100. NFER survey of school governors, 2010
Table 4.11 shows that: • According to the responding governors, the school governing body
monitors the operation and outcomes of the school’s performance management arrangements most commonly once a year.
• Some monitor this twice a year, and some more than twice. (Note that 17 per cent of governor respondents do not know.)
The majority of headteachers and school governors indicated that the school’s annual report to the governing body provides information on: the operation of the school’s performance management policy; the effectiveness of the school’s performance management procedures; and the school’s training and development needs (see Table B2.61). However, one in six of headteachers (16 per cent) said that they did not provide an annual report with information on the effectiveness of the school’s performance management procedures, and one in eight (12 per cent) did not provide information on the operation of the school’s performance management policy or the school’s training and development needs (see Table B2.61). Headteachers in secondary schools were statistically more likely to report that their school provides an annual report to the school’s governing body which includes information on the operation of the school’s performance management policy than their counterparts in primary schools, special schools
Performance management 63
and PRUs. Nine in ten (91 per cent) of secondary school headteachers reported this ‘to a great extent’, compared to 87 per cent of primary school headteachers, 86 per cent of special school headteachers, and 63 per cent of headteachers in PRUs (see Table B2.62). Headteachers in secondary schools were also statistically more likely to report that their school provides an annual report to the school’s governing body which includes information on the effectiveness of the school’s performance management procedures than their counterparts in primary schools, special schools and PRUs. The vast majority (86 per cent) of secondary school headteachers reported this ‘to a great extent’, compared to 83 per cent of primary school headteachers, 79 per cent of special school headteachers, and 63 per cent of headteachers in PRUs (see Table B2.63).
4.6 The local authority’s role Local authority respondents were asked about the extent to which the Rewards and Incentives Group’s (RIG) guidance on performance management removed the burden from the local authority to provide their own guidance for schools in their authority. Local authority respondents felt that the Rewards and Incentives Group’s (RIG) guidance on performance management had somewhat removed the need to provide their own guidance to schools in their authority – i.e. ‘to a great extent’ (27 out of the 57 respondents) and ‘to some extent’ (23 out of the 57 respondents). That said, a total of 51 respondents reported their local authority providing support specifically to school governors on performance management (see Table B2.64). Local authority respondents were asked about the extent to which their local authority’s pay and performance management policies reflect unattached teachers’ entitlements to performance management, and the extent to which the local authority reviewer is able to consult with school staff that manage or support the unattached teacher. Half of the local authority respondents indicated that the local authority’s pay and performance management policies reflected these teachers’ entitlements to performance management (and 14 of the 57 rated this ‘to some extent’ and 13 ‘do not know’). However, fewer felt confident that the local authority reviewer was able to consult with the relevant school staff as regards that unattached teacher’s performance
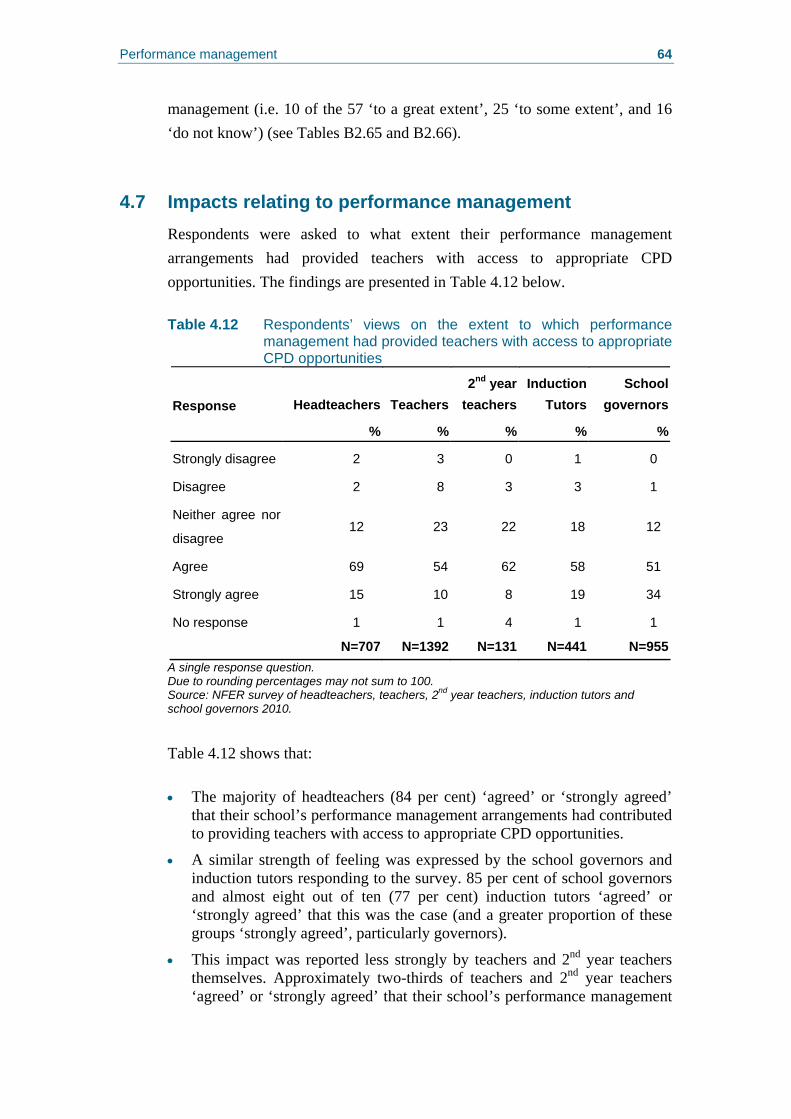
Performance management 64
management (i.e. 10 of the 57 ‘to a great extent’, 25 ‘to some extent’, and 16 ‘do not know’) (see Tables B2.65 and B2.66).
4.7 Impacts relating to performance management Respondents were asked to what extent their performance management arrangements had provided teachers with access to appropriate CPD opportunities. The findings are presented in Table 4.12 below. Table 4.12 Respondents’ views on the extent to which performance
management had provided teachers with access to appropriate CPD opportunities
Headteachers Teachers2nd year
teachersInduction
Tutors School
governorsResponse
% % % % %
Strongly disagree 2 3 0 1 0
Disagree 2 8 3 3 1
Neither agree nor
disagree 12 23 22 18 12
Agree 69 54 62 58 51
Strongly agree 15 10 8 19 34
No response 1 1 4 1 1
N=707 N=1392 N=131 N=441 N=955A single response question. Due to rounding percentages may not sum to 100. Source: NFER survey of headteachers, teachers, 2nd year teachers, induction tutors and school governors 2010.
Table 4.12 shows that: • The majority of headteachers (84 per cent) ‘agreed’ or ‘strongly agreed’
that their school’s performance management arrangements had contributed to providing teachers with access to appropriate CPD opportunities.
• A similar strength of feeling was expressed by the school governors and induction tutors responding to the survey. 85 per cent of school governors and almost eight out of ten (77 per cent) induction tutors ‘agreed’ or ‘strongly agreed’ that this was the case (and a greater proportion of these groups ‘strongly agreed’, particularly governors).
• This impact was reported less strongly by teachers and 2nd year teachers themselves. Approximately two-thirds of teachers and 2nd year teachers ‘agreed’ or ‘strongly agreed’ that their school’s performance management
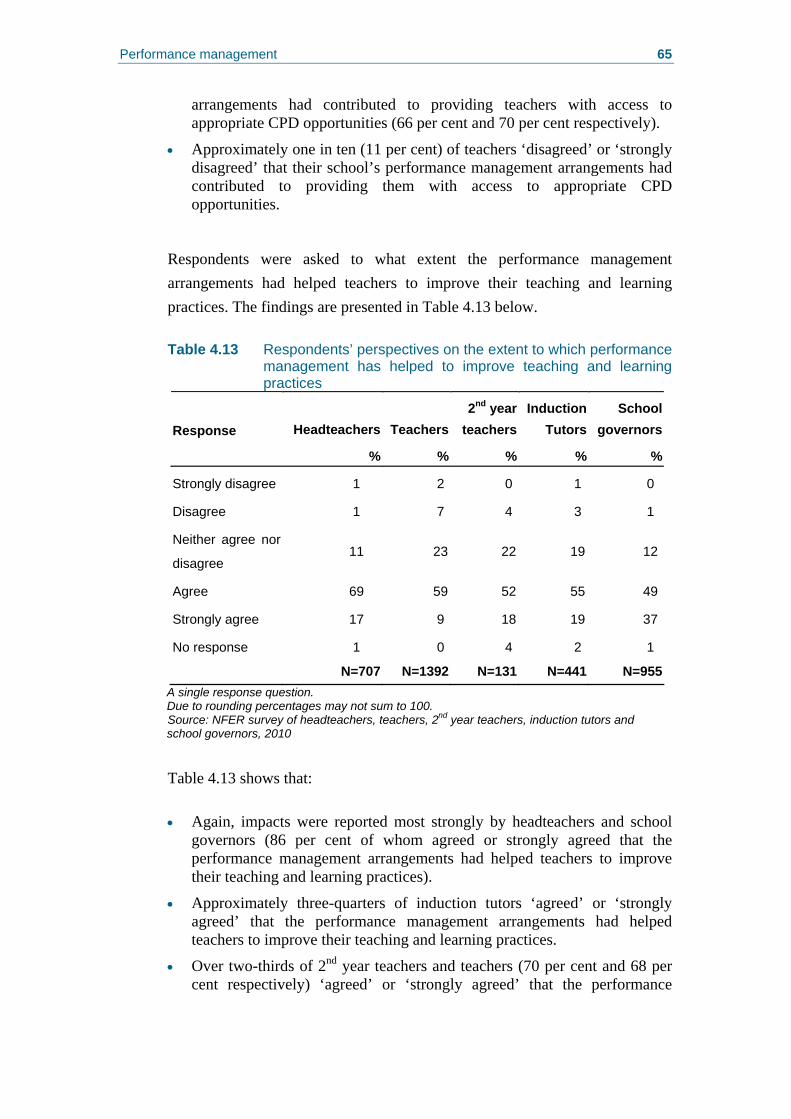
Performance management 65
arrangements had contributed to providing teachers with access to appropriate CPD opportunities (66 per cent and 70 per cent respectively).
• Approximately one in ten (11 per cent) of teachers ‘disagreed’ or ‘strongly disagreed’ that their school’s performance management arrangements had contributed to providing them with access to appropriate CPD opportunities.
Respondents were asked to what extent the performance management arrangements had helped teachers to improve their teaching and learning practices. The findings are presented in Table 4.13 below. Table 4.13 Respondents’ perspectives on the extent to which performance
management has helped to improve teaching and learning practices
Headteachers Teachers2nd year
teachersInduction
Tutors School
governorsResponse
% % % % %
Strongly disagree 1 2 0 1 0
Disagree 1 7 4 3 1
Neither agree nor
disagree 11 23 22 19 12
Agree 69 59 52 55 49
Strongly agree 17 9 18 19 37
No response 1 0 4 2 1
N=707 N=1392 N=131 N=441 N=955A single response question. Due to rounding percentages may not sum to 100. Source: NFER survey of headteachers, teachers, 2nd year teachers, induction tutors and school governors, 2010
Table 4.13 shows that: • Again, impacts were reported most strongly by headteachers and school
governors (86 per cent of whom agreed or strongly agreed that the performance management arrangements had helped teachers to improve their teaching and learning practices).
• Approximately three-quarters of induction tutors ‘agreed’ or ‘strongly agreed’ that the performance management arrangements had helped teachers to improve their teaching and learning practices.
• Over two-thirds of 2nd year teachers and teachers (70 per cent and 68 per cent respectively) ‘agreed’ or ‘strongly agreed’ that the performance
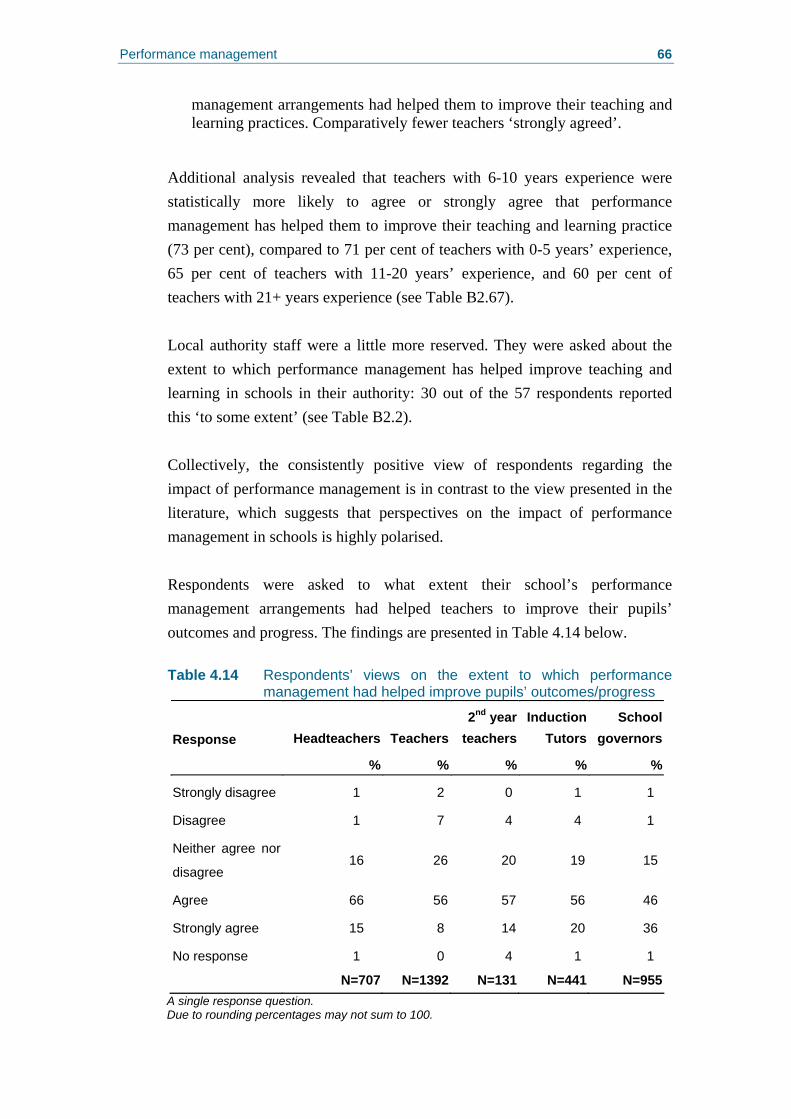
Performance management 66
management arrangements had helped them to improve their teaching and learning practices. Comparatively fewer teachers ‘strongly agreed’.
Additional analysis revealed that teachers with 6-10 years experience were statistically more likely to agree or strongly agree that performance management has helped them to improve their teaching and learning practice (73 per cent), compared to 71 per cent of teachers with 0-5 years’ experience, 65 per cent of teachers with 11-20 years’ experience, and 60 per cent of teachers with 21+ years experience (see Table B2.67). Local authority staff were a little more reserved. They were asked about the extent to which performance management has helped improve teaching and learning in schools in their authority: 30 out of the 57 respondents reported this ‘to some extent’ (see Table B2.2). Collectively, the consistently positive view of respondents regarding the impact of performance management is in contrast to the view presented in the literature, which suggests that perspectives on the impact of performance management in schools is highly polarised. Respondents were asked to what extent their school’s performance management arrangements had helped teachers to improve their pupils’ outcomes and progress. The findings are presented in Table 4.14 below. Table 4.14 Respondents’ views on the extent to which performance
management had helped improve pupils’ outcomes/progress
Headteachers Teachers2nd year
teachersInduction
Tutors School
governorsResponse
% % % % %
Strongly disagree 1 2 0 1 1
Disagree 1 7 4 4 1
Neither agree nor
disagree 16 26 20 19 15
Agree 66 56 57 56 46
Strongly agree 15 8 14 20 36
No response 1 0 4 1 1
N=707 N=1392 N=131 N=441 N=955A single response question. Due to rounding percentages may not sum to 100.

Performance management 67
Source: NFER survey of headteachers, teachers, 2nd year teachers, induction tutors and school governors, 2010.
Table 4.14 shows that: • Impacts relating to pupils’ outcomes and progress were most strongly
reported by school governors, 82 per cent of whom strongly agreed that the performance management arrangements had helped teachers in this regard.
• A similar proportion of headteachers (81 per cent) reported that this was the case (although fewer headteachers than school governors ‘strongly agreed’).
• This view was shared by three-quarters of induction tutors (76 percent), just over seven in ten (71 per cent) 2nd year teachers, and by two-thirds (64 per cent) of teachers. Again a notably lower percentage of tutors ‘strongly agreed’.
Additional analysis revealed that teachers in primary schools were statistically more likely to agree or strongly agree that performance management has contributed to helping improve their pupils’ outcomes/progress (67 per cent), than their counterparts in secondary schools and special schools (64 percent) and PRUs (54 per cent) (see Table B2.68). These findings were broadly in line with the evidence from the literature, which suggests that when undertaken in a systematic way across the school workforce, staff development can lead to improved outcomes for pupils and staff (see Chapter 2; Section 2.3) Respondents were asked what extent the performance management arrangements have helped teachers to contribute to whole-school improvement. The findings are presented in Table 4.15 below.
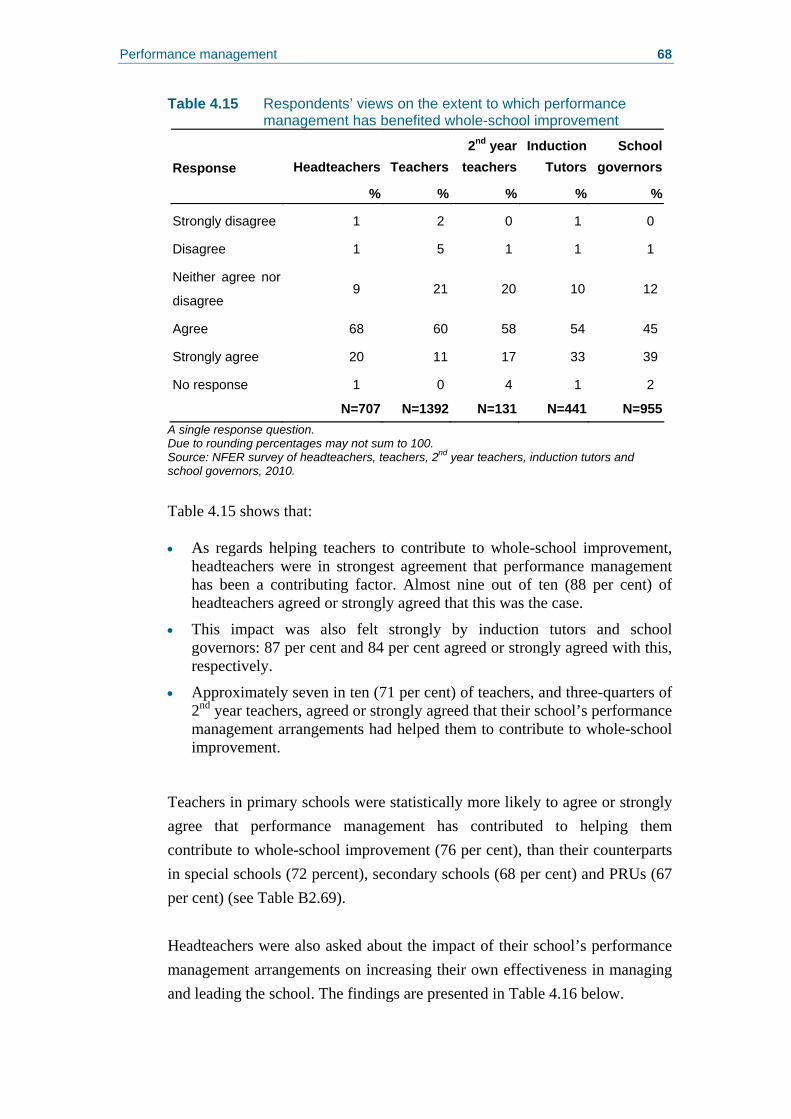
Performance management 68
Table 4.15 Respondents’ views on the extent to which performance management has benefited whole-school improvement
Headteachers Teachers2nd year
teachersInduction
Tutors School
governorsResponse
% % % % %
Strongly disagree 1 2 0 1 0
Disagree 1 5 1 1 1
Neither agree nor
disagree 9 21 20 10 12
Agree 68 60 58 54 45
Strongly agree 20 11 17 33 39
No response 1 0 4 1 2
N=707 N=1392 N=131 N=441 N=955A single response question. Due to rounding percentages may not sum to 100. Source: NFER survey of headteachers, teachers, 2nd year teachers, induction tutors and school governors, 2010.
Table 4.15 shows that: • As regards helping teachers to contribute to whole-school improvement,
headteachers were in strongest agreement that performance management has been a contributing factor. Almost nine out of ten (88 per cent) of headteachers agreed or strongly agreed that this was the case.
• This impact was also felt strongly by induction tutors and school governors: 87 per cent and 84 per cent agreed or strongly agreed with this, respectively.
• Approximately seven in ten (71 per cent) of teachers, and three-quarters of 2nd year teachers, agreed or strongly agreed that their school’s performance management arrangements had helped them to contribute to whole-school improvement.
Teachers in primary schools were statistically more likely to agree or strongly agree that performance management has contributed to helping them contribute to whole-school improvement (76 per cent), than their counterparts in special schools (72 percent), secondary schools (68 per cent) and PRUs (67 per cent) (see Table B2.69). Headteachers were also asked about the impact of their school’s performance management arrangements on increasing their own effectiveness in managing and leading the school. The findings are presented in Table 4.16 below.
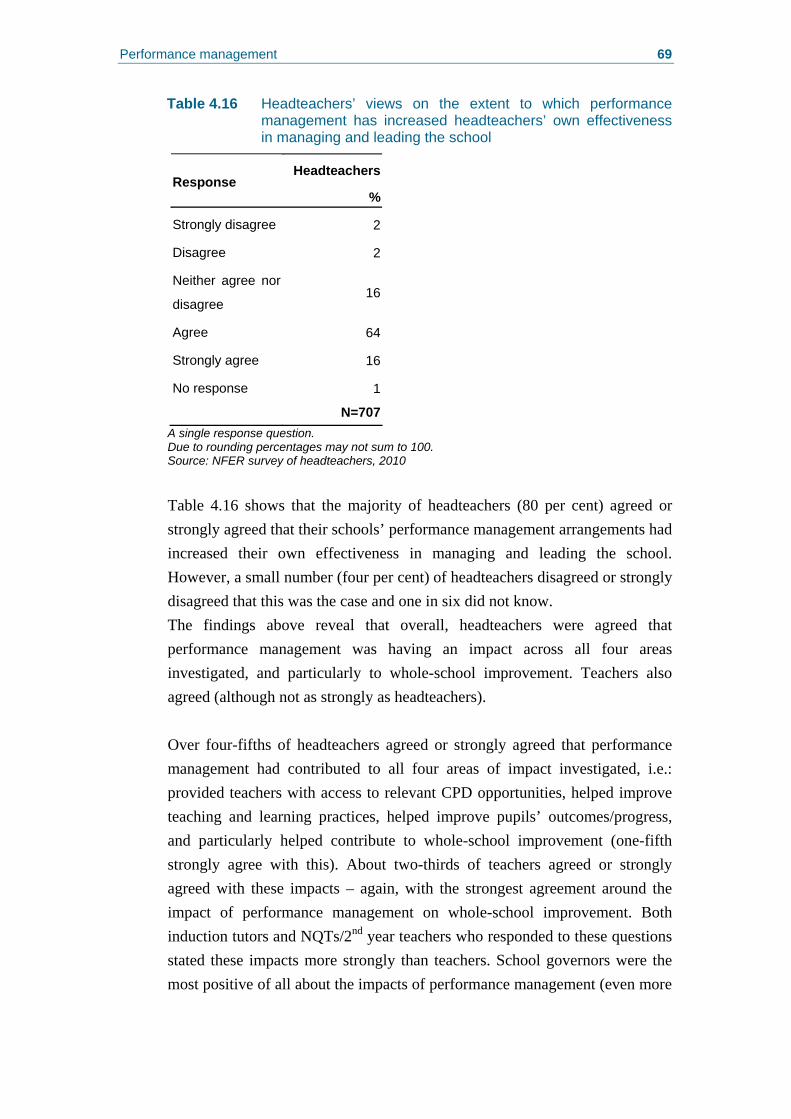
Performance management 69
Table 4.16 Headteachers’ views on the extent to which performance management has increased headteachers’ own effectiveness in managing and leading the school
HeadteachersResponse
%
Strongly disagree 2
Disagree 2
Neither agree nor
disagree 16
Agree 64
Strongly agree 16
No response 1
N=707A single response question. Due to rounding percentages may not sum to 100. Source: NFER survey of headteachers, 2010
Table 4.16 shows that the majority of headteachers (80 per cent) agreed or strongly agreed that their schools’ performance management arrangements had increased their own effectiveness in managing and leading the school. However, a small number (four per cent) of headteachers disagreed or strongly disagreed that this was the case and one in six did not know. The findings above reveal that overall, headteachers were agreed that performance management was having an impact across all four areas investigated, and particularly to whole-school improvement. Teachers also agreed (although not as strongly as headteachers). Over four-fifths of headteachers agreed or strongly agreed that performance management had contributed to all four areas of impact investigated, i.e.: provided teachers with access to relevant CPD opportunities, helped improve teaching and learning practices, helped improve pupils’ outcomes/progress, and particularly helped contribute to whole-school improvement (one-fifth strongly agree with this). About two-thirds of teachers agreed or strongly agreed with these impacts – again, with the strongest agreement around the impact of performance management on whole-school improvement. Both induction tutors and NQTs/2nd year teachers who responded to these questions stated these impacts more strongly than teachers. School governors were the most positive of all about the impacts of performance management (even more
Performance management 70
so than headteachers). Indeed, nearly two-fifths strongly agreed that performance management had contributed to whole-school improvement. Despite these positive reports of impact, we should note that some one in ten teachers disagreed that performance management had contributed to their access to CPD opportunities, improvements in their teaching and learning or to their pupil outcomes.
4.8 Regression analysis on findings relating to performance management Regression analysis was undertaken to explore which groups of respondents scored higher and lower on the measure of engagement with performance management and impacts of performance management (for a full explanation of this analysis see Appendix D).
4.9 Engagement with performance management: regression analysis
4.9.1 Greater engagement with performance management
Regression analysis revealed that, when compared to their counterparts, the following groups were significantly more likely to report engagement with performance management: • those who reported experiencing the greatest impacts of performance
management
• those with a higher score on the measure of meeting CPD needs
• those who identified the strongest links between the professional standards, performance management and CPD in their school
• those who reported greater usage and usefulness of the professional standards.
4.9.2 Less engagement with performance management
Regression analysis also revealed that, when compared to their counterparts, the following groups were significantly less likely to report engagement with performance management: • NQTs
• those who reported experiencing the greatest impacts of CPD.
Performance management 71
4.10 Impacts of performance management: regression analysis
4.10.1 Greater reported impacts of performance management
Regression analysis revealed that, when compared to their counterparts, the following groups were significantly more likely to report impacts of performance management: • those who reported the greatest impacts from CPD
• those who reported greater engagement with and usefulness of performance management
• those who felt more able to exercise their own professional judgement in learning practices
• those who reported greater usage and usefulness of the professional standards
• those who identified the strongest links between the professional standards, performance management and CPD in their school.
• those teachers trained overseas4.
4.10.1 Fewer reported impacts of performance management
Regression analysis revealed that, when compared to their counterparts, the following groups were significantly less likely to report impacts of performance management: • those aged between 45 and 54
• those aged 55 or over.
4 This variable might be significant due to the small number of overseas trained teachers in the sample
Induction 72
5. Induction
Key findings • Overall, headteachers and local authority respondents reported that
headteachers were aware of the revised induction arrangements introduced in September 2008, and the majority of respondents reported having induction arrangements in place which took account of these revisions.
• Staff at all levels reported that schools’ current induction arrangements were providing NQTs with the support that they needed ‘to a great extent’. This was felt more strongly by induction tutors and by headteachers, than by NQTs/2nd year teachers themselves.
• Staff at all levels reported that their school’s current induction arrangements were providing NQTs with the statutory reduction in their teaching timetable. The majority of headteachers, induction tutors and NQTs/2nd year teachers reported that their schools’ current induction arrangements were tailored to NQTs’ individual needs. The literature also suggests that the majority of NQTs feel well supported in their induction year, with evidence suggesting that the induction process eases the transition between initial teacher training and the NQT year.
• NQTs/2nd year teachers found the opportunity to meet with other NQTs; support from staff and the school; support from a mentor; and observing other teachers in their own or other schools particularly useful aspects of their induction.
• When asked what other support would be/would have been useful, answers included support for planning lessons, behaviour management and assessment.
• The vast majority of all respondent types ‘agreed’ or ‘strongly agreed’ that NQTs’ experiences of induction were having an impact particularly in helping them to work towards meeting the Core Standards and improving their teaching and learning practices. Other impacts included access to relevant CPD opportunities, improving pupils’ outcomes and progress, and to a slightly lesser extent, contributing to whole-school improvement.
5.1 Introduction This chapter presents respondents’ views on the revised induction arrangements introduced in September 2008. It explores their awareness of the arrangements and their reported use, perceived usefulness of the arrangements and support received, and the impacts associated with their use.
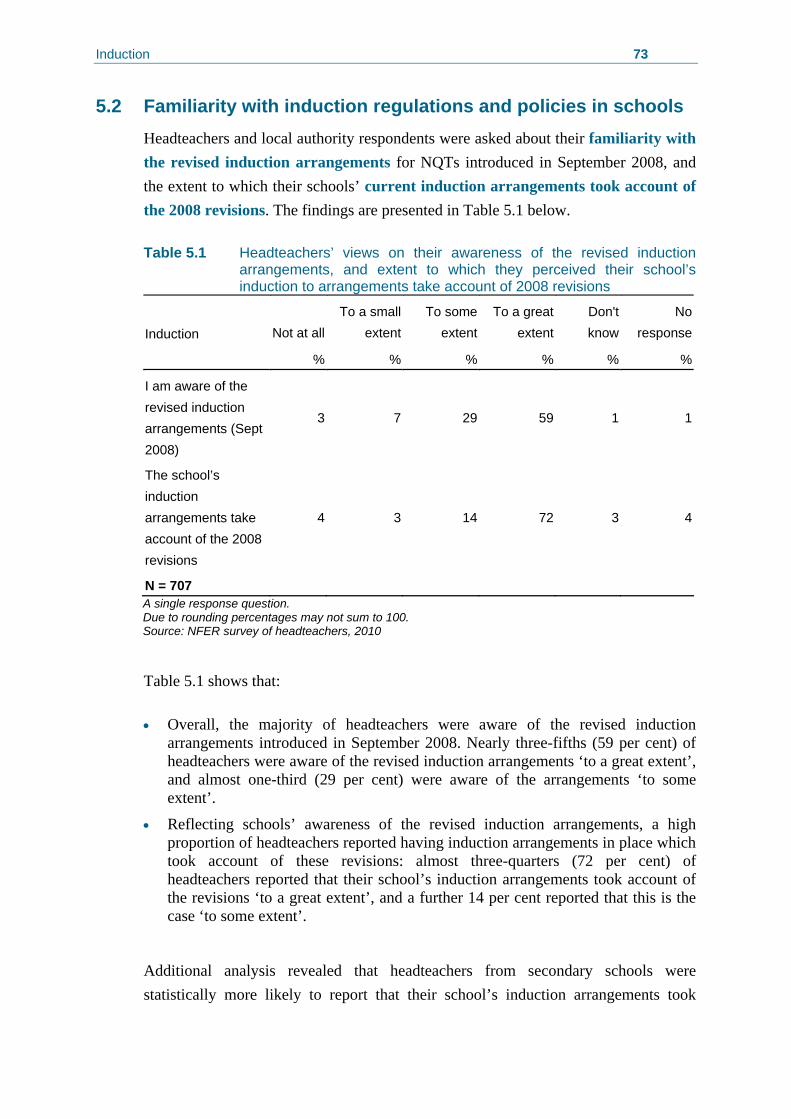
Induction 73
5.2 Familiarity with induction regulations and policies in schools Headteachers and local authority respondents were asked about their familiarity with the revised induction arrangements for NQTs introduced in September 2008, and the extent to which their schools’ current induction arrangements took account of the 2008 revisions. The findings are presented in Table 5.1 below. Table 5.1 Headteachers’ views on their awareness of the revised induction
arrangements, and extent to which they perceived their school’s induction to arrangements take account of 2008 revisions
Not at all To a small
extentTo some
extentTo a great
extentDon't know
No responseInduction
% % % % % %
I am aware of the revised induction arrangements (Sept 2008)
3 7 29 59 1 1
The school’s induction arrangements take account of the 2008 revisions
4 3 14 72 3 4
N = 707 A single response question. Due to rounding percentages may not sum to 100. Source: NFER survey of headteachers, 2010
Table 5.1 shows that: • Overall, the majority of headteachers were aware of the revised induction
arrangements introduced in September 2008. Nearly three-fifths (59 per cent) of headteachers were aware of the revised induction arrangements ‘to a great extent’, and almost one-third (29 per cent) were aware of the arrangements ‘to some extent’.
• Reflecting schools’ awareness of the revised induction arrangements, a high proportion of headteachers reported having induction arrangements in place which took account of these revisions: almost three-quarters (72 per cent) of headteachers reported that their school’s induction arrangements took account of the revisions ‘to a great extent’, and a further 14 per cent reported that this is the case ‘to some extent’.
Additional analysis revealed that headteachers from secondary schools were statistically more likely to report that their school’s induction arrangements took
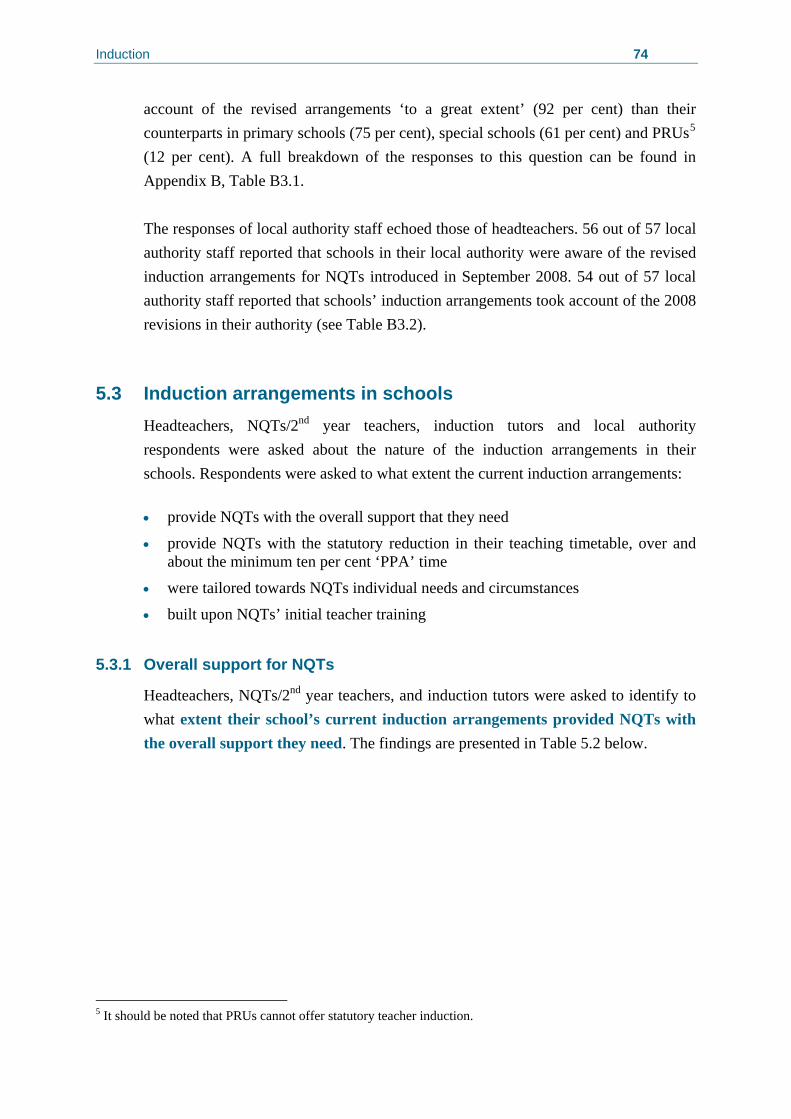
Induction 74
account of the revised arrangements ‘to a great extent’ (92 per cent) than their counterparts in primary schools (75 per cent), special schools (61 per cent) and PRUs5 (12 per cent). A full breakdown of the responses to this question can be found in Appendix B, Table B3.1. The responses of local authority staff echoed those of headteachers. 56 out of 57 local authority staff reported that schools in their local authority were aware of the revised induction arrangements for NQTs introduced in September 2008. 54 out of 57 local authority staff reported that schools’ induction arrangements took account of the 2008 revisions in their authority (see Table B3.2).
5.3 Induction arrangements in schools Headteachers, NQTs/2nd year teachers, induction tutors and local authority respondents were asked about the nature of the induction arrangements in their schools. Respondents were asked to what extent the current induction arrangements: • provide NQTs with the overall support that they need
• provide NQTs with the statutory reduction in their teaching timetable, over and about the minimum ten per cent ‘PPA’ time
• were tailored towards NQTs individual needs and circumstances
• built upon NQTs’ initial teacher training
5.3.1 Overall support for NQTs
Headteachers, NQTs/2nd year teachers, and induction tutors were asked to identify to what extent their school’s current induction arrangements provided NQTs with the overall support they need. The findings are presented in Table 5.2 below.
5 It should be noted that PRUs cannot offer statutory teacher induction.
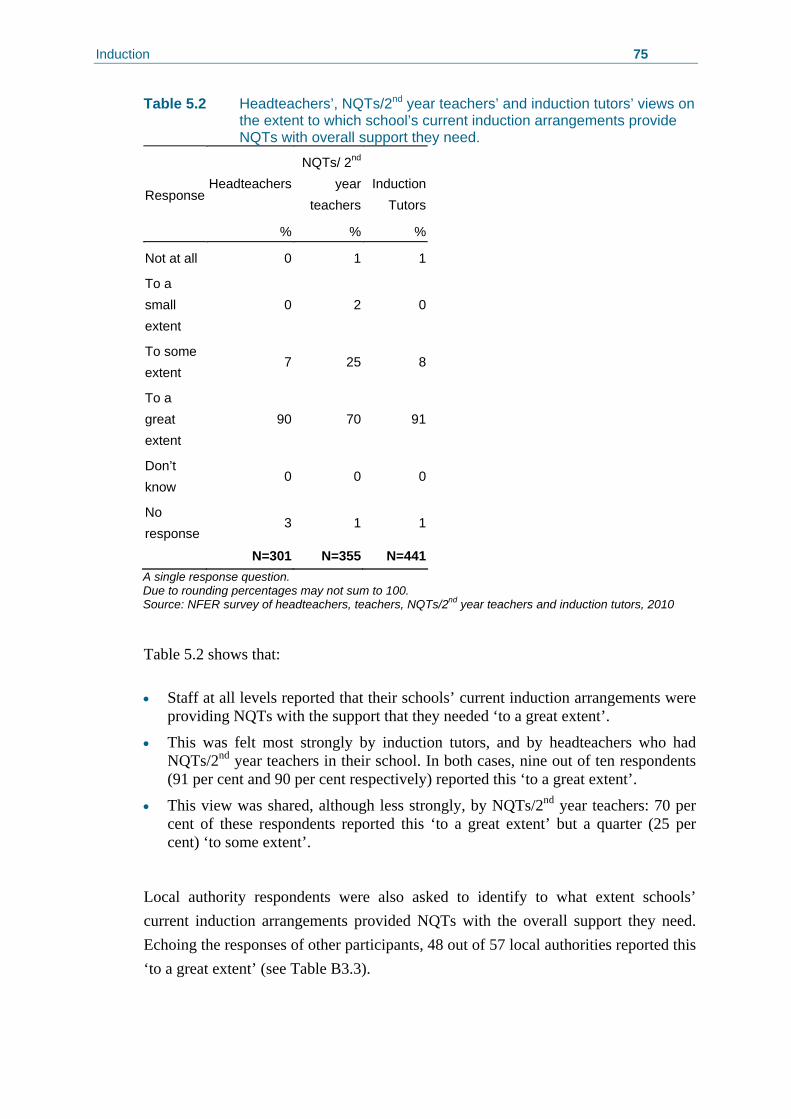
Induction 75
Table 5.2 Headteachers’, NQTs/2nd year teachers’ and induction tutors’ views on the extent to which school’s current induction arrangements provide NQTs with overall support they need.
Headteachers NQTs/ 2nd
year teachers
Induction Tutors
Response
% % %
Not at all 0 1 1
To a small extent
0 2 0
To some extent
7 25 8
To a great extent
90 70 91
Don’t know
0 0 0
No response
3 1 1
N=301 N=355 N=441A single response question. Due to rounding percentages may not sum to 100. Source: NFER survey of headteachers, teachers, NQTs/2nd year teachers and induction tutors, 2010
Table 5.2 shows that: • Staff at all levels reported that their schools’ current induction arrangements were
providing NQTs with the support that they needed ‘to a great extent’.
• This was felt most strongly by induction tutors, and by headteachers who had NQTs/2nd year teachers in their school. In both cases, nine out of ten respondents (91 per cent and 90 per cent respectively) reported this ‘to a great extent’.
• This view was shared, although less strongly, by NQTs/2nd year teachers: 70 per cent of these respondents reported this ‘to a great extent’ but a quarter (25 per cent) ‘to some extent’.
Local authority respondents were also asked to identify to what extent schools’ current induction arrangements provided NQTs with the overall support they need. Echoing the responses of other participants, 48 out of 57 local authorities reported this ‘to a great extent’ (see Table B3.3).
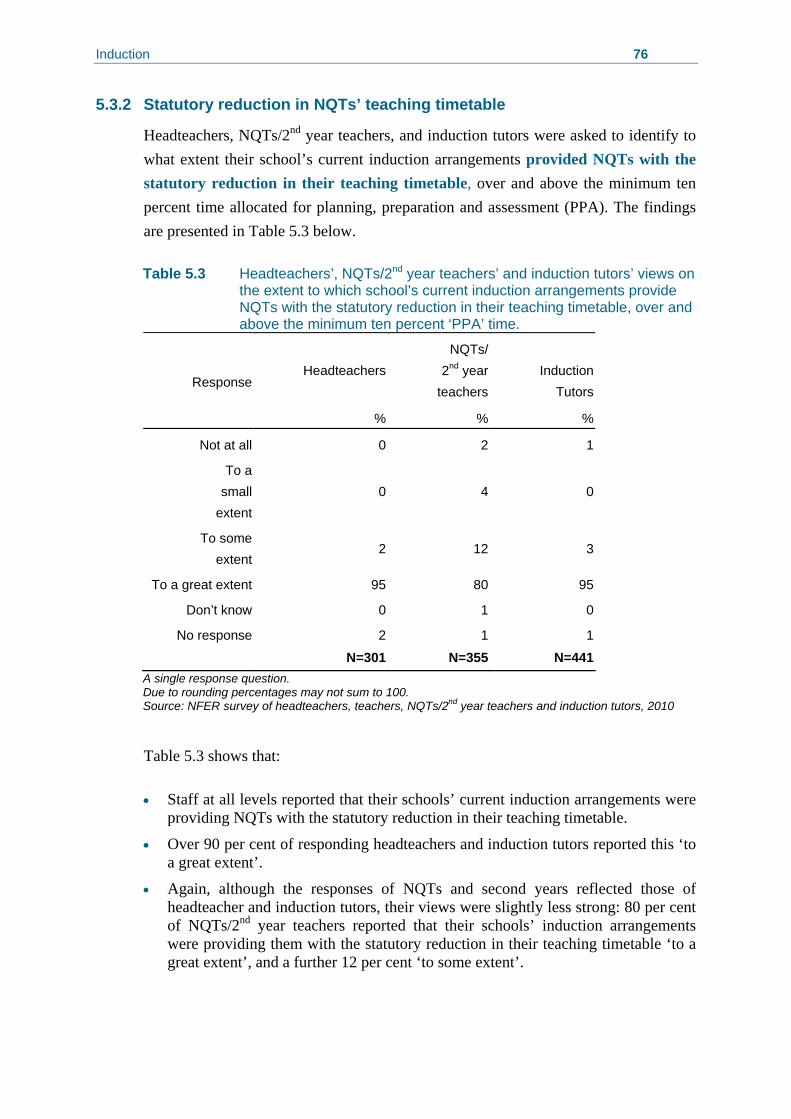
Induction 76
5.3.2 Statutory reduction in NQTs’ teaching timetable
Headteachers, NQTs/2nd year teachers, and induction tutors were asked to identify to what extent their school’s current induction arrangements provided NQTs with the statutory reduction in their teaching timetable, over and above the minimum ten percent time allocated for planning, preparation and assessment (PPA). The findings are presented in Table 5.3 below. Table 5.3 Headteachers’, NQTs/2nd year teachers’ and induction tutors’ views on the extent to which school’s current induction arrangements provide NQTs with the statutory reduction in their teaching timetable, over and above the minimum ten percent ‘PPA’ time.
Headteachers NQTs/
2nd year teachers
Induction Tutors
Response
% % %
Not at all 0 2 1
To a small
extent 0 4 0
To some extent
2 12 3
To a great extent 95 80 95
Don’t know 0 1 0
No response 2 1 1
N=301 N=355 N=441 A single response question. Due to rounding percentages may not sum to 100. Source: NFER survey of headteachers, teachers, NQTs/2nd year teachers and induction tutors, 2010
Table 5.3 shows that: • Staff at all levels reported that their schools’ current induction arrangements were
providing NQTs with the statutory reduction in their teaching timetable.
• Over 90 per cent of responding headteachers and induction tutors reported this ‘to a great extent’.
• Again, although the responses of NQTs and second years reflected those of headteacher and induction tutors, their views were slightly less strong: 80 per cent of NQTs/2nd year teachers reported that their schools’ induction arrangements were providing them with the statutory reduction in their teaching timetable ‘to a great extent’, and a further 12 per cent ‘to some extent’.
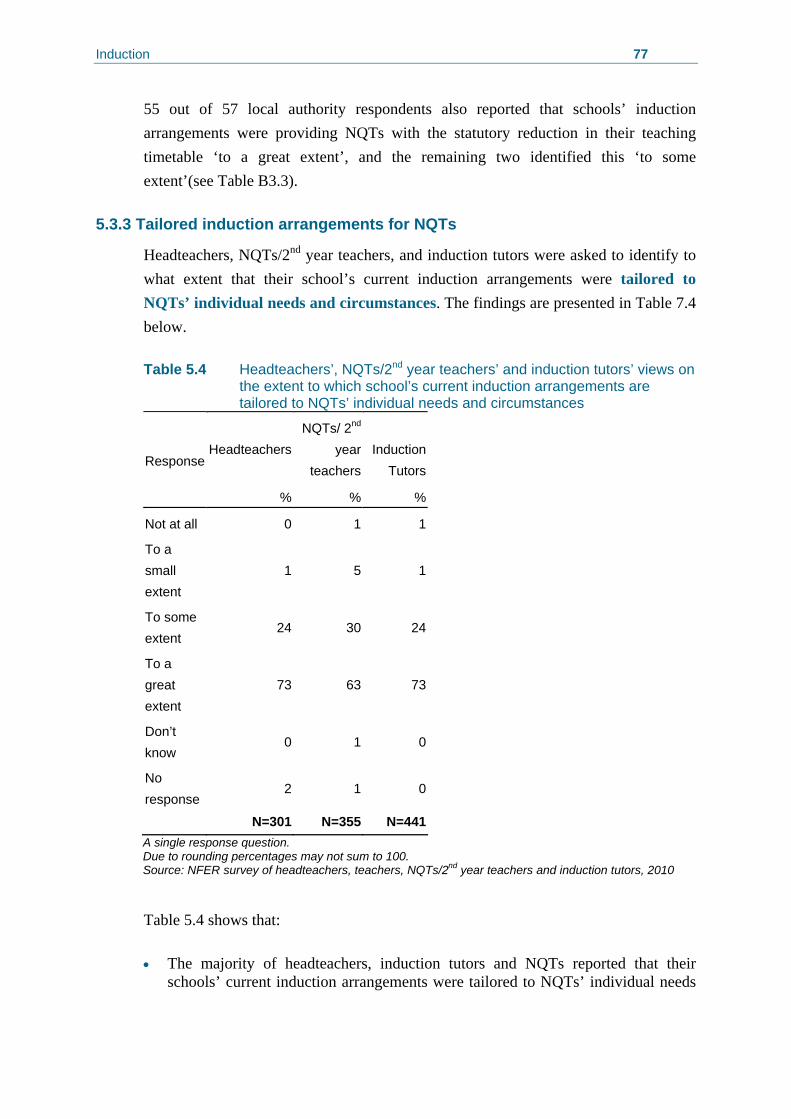
Induction 77
55 out of 57 local authority respondents also reported that schools’ induction arrangements were providing NQTs with the statutory reduction in their teaching timetable ‘to a great extent’, and the remaining two identified this ‘to some extent’(see Table B3.3).
5.3.3 Tailored induction arrangements for NQTs
Headteachers, NQTs/2nd year teachers, and induction tutors were asked to identify to what extent that their school’s current induction arrangements were tailored to NQTs’ individual needs and circumstances. The findings are presented in Table 7.4 below. Table 5.4 Headteachers’, NQTs/2nd year teachers’ and induction tutors’ views on the extent to which school’s current induction arrangements are tailored to NQTs’ individual needs and circumstances
Headteachers NQTs/ 2nd
year teachers
Induction Tutors
Response
% % %
Not at all 0 1 1
To a small extent
1 5 1
To some extent
24 30 24
To a great extent
73 63 73
Don’t know
0 1 0
No response
2 1 0
N=301 N=355 N=441A single response question. Due to rounding percentages may not sum to 100. Source: NFER survey of headteachers, teachers, NQTs/2nd year teachers and induction tutors, 2010
Table 5.4 shows that: • The majority of headteachers, induction tutors and NQTs reported that their
schools’ current induction arrangements were tailored to NQTs’ individual needs
Induction 78
(although the strength of opinion is a little less positive than that reported above for overall support).
• Again, this was most strongly felt by induction tutors and by headteachers. Almost three-quarters (73 per cent in both cases) reported this ‘to a great extent’.
• The findings show that NQTs also overall shared this view: 63 per cent reported it ‘to a great extent’, and a further 30 per cent reported it ‘to some extent’.
This finding supports the evidence from the literature, which suggests that NQTs’ development needs usually change quickly as their abilities develop, and the best schools allow teachers to adapt their performance management targets early in their NQT year to reflect this. Additional analysis revealed that NQTs/2nd year teachers in primary schools were statistically more likely to report that the current induction arrangements are tailored to their individual needs and circumstances than their counterparts in secondary schools. 73 per cent of NQT/2nd year teachers in primary schools reported this ‘to a great extent’, compared to 56 per cent of in secondary schools (Appendix A, Table 2) (see Table B3.4). Again, this view was reflected in the responses of local authorities: 39 out of 57 local authorities reported that school’s current induction arrangements were tailored to NQTs’ individual needs and circumstances ‘to a great extent’ (see Table B3.3).
5.3.4 Building on NQTs initial teacher training
Headteachers, NQTs/2nd year teachers and induction tutors were asked to identify to what extent their school’s current induction arrangements built upon NQTs’ initial teacher training. The findings are presented in Table 7.5 below.
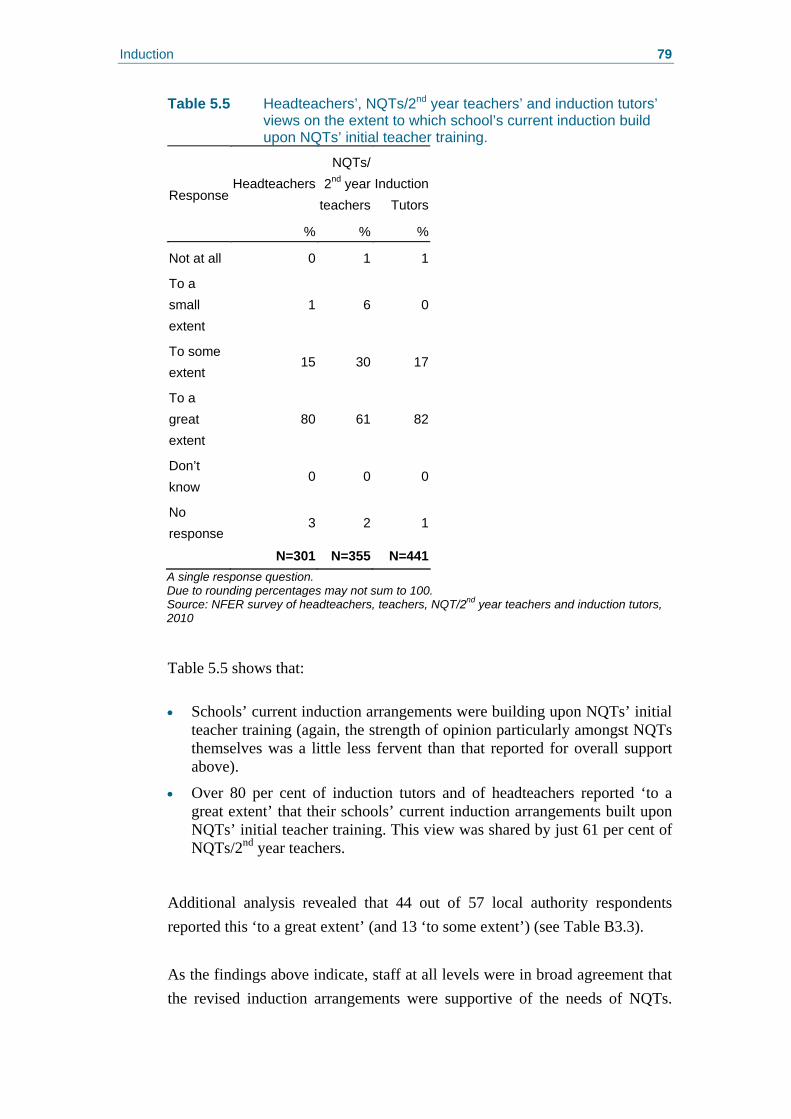
Induction 79
Table 5.5 Headteachers’, NQTs/2nd year teachers’ and induction tutors’ views on the extent to which school’s current induction build upon NQTs’ initial teacher training.
Headteachers NQTs/
2nd year teachers
Induction Tutors
Response
% % %
Not at all 0 1 1
To a small extent
1 6 0
To some extent
15 30 17
To a great extent
80 61 82
Don’t know
0 0 0
No response
3 2 1
N=301 N=355 N=441A single response question. Due to rounding percentages may not sum to 100. Source: NFER survey of headteachers, teachers, NQT/2nd year teachers and induction tutors, 2010
Table 5.5 shows that: • Schools’ current induction arrangements were building upon NQTs’ initial
teacher training (again, the strength of opinion particularly amongst NQTs themselves was a little less fervent than that reported for overall support above).
• Over 80 per cent of induction tutors and of headteachers reported ‘to a great extent’ that their schools’ current induction arrangements built upon NQTs’ initial teacher training. This view was shared by just 61 per cent of NQTs/2nd year teachers.
Additional analysis revealed that 44 out of 57 local authority respondents reported this ‘to a great extent’ (and 13 ‘to some extent’) (see Table B3.3).
As the findings above indicate, staff at all levels were in broad agreement that the revised induction arrangements were supportive of the needs of NQTs.
Induction 80
However, although staff were most strongly in agreement when considering levels of overall support, there was less parity of views when considering the individual requirements of NQTs: this was most noticeable in relation to schools’ capacity to tailor support to the needs of individual NQTs, and to build upon their initial teacher training. Headteachers were consistently more positive in their responses than NQTs themselves. These findings support those from the literature, which suggest that the majority of NQTs feel well supported in their induction year, with evidence suggesting that the induction process eases the transition between initial teacher training and the NQT year (see Chapter 2; Section 2.5).
5.4 NQTs' engagement with and views on induction Almost all NQTs/2nd year teachers (99 per cent) reported that their school’s induction arrangements included providing them with an induction tutor (see Table B3.5). NQTs/2nd year teachers were asked about the extent to which the induction tutors were able to support their needs. The findings are presented in Table 5.6 below. Table 5.6 NQTs/2nd year teachers’ views of the extent to which induction tutors are able to support their needs
NQTs/2nd year teachers %
Not at all 0
To a small extent 6
To some extent 20
To a great extent 73
Don't know 0
No response 1
N = 351 A single response question. Due to rounding percentages may not sum to 100. Source: NFER survey of NQTs/2nd year teachers, 2010
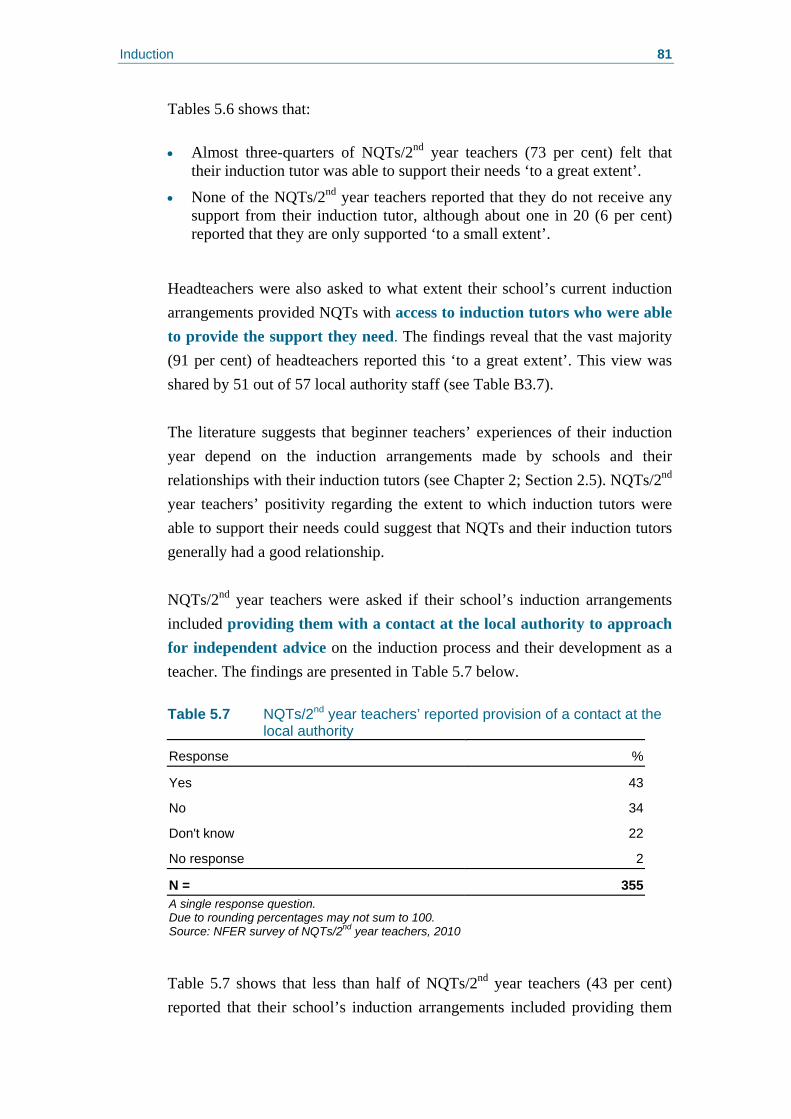
Induction 81
Tables 5.6 shows that: • Almost three-quarters of NQTs/2nd year teachers (73 per cent) felt that
their induction tutor was able to support their needs ‘to a great extent’.
• None of the NQTs/2nd year teachers reported that they do not receive any support from their induction tutor, although about one in 20 (6 per cent) reported that they are only supported ‘to a small extent’.
Headteachers were also asked to what extent their school’s current induction arrangements provided NQTs with access to induction tutors who were able to provide the support they need. The findings reveal that the vast majority (91 per cent) of headteachers reported this ‘to a great extent’. This view was shared by 51 out of 57 local authority staff (see Table B3.7). The literature suggests that beginner teachers’ experiences of their induction year depend on the induction arrangements made by schools and their relationships with their induction tutors (see Chapter 2; Section 2.5). NQTs/2nd year teachers’ positivity regarding the extent to which induction tutors were able to support their needs could suggest that NQTs and their induction tutors generally had a good relationship. NQTs/2nd year teachers were asked if their school’s induction arrangements included providing them with a contact at the local authority to approach for independent advice on the induction process and their development as a teacher. The findings are presented in Table 5.7 below. Table 5.7 NQTs/2nd year teachers’ reported provision of a contact at the
local authority
Response %
Yes 43
No 34
Don't know 22
No response 2
N = 355 A single response question. Due to rounding percentages may not sum to 100. Source: NFER survey of NQTs/2nd year teachers, 2010
Table 5.7 shows that less than half of NQTs/2nd year teachers (43 per cent) reported that their school’s induction arrangements included providing them
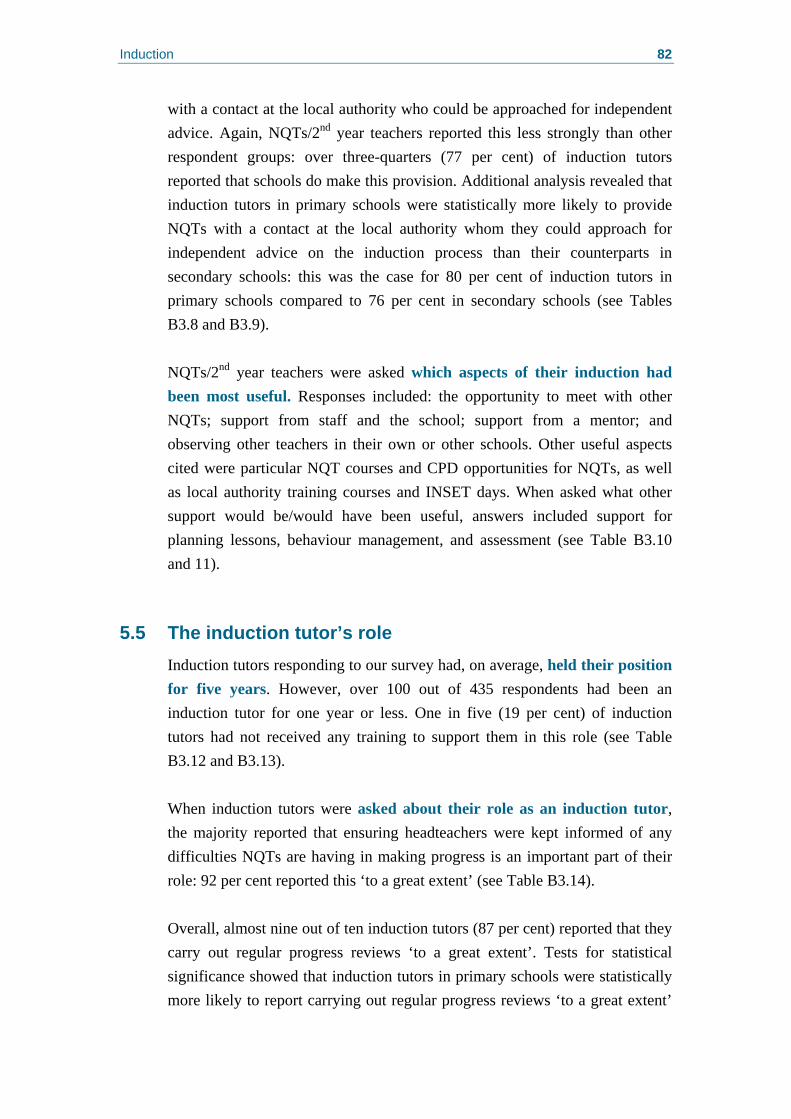
Induction 82
with a contact at the local authority who could be approached for independent advice. Again, NQTs/2nd year teachers reported this less strongly than other respondent groups: over three-quarters (77 per cent) of induction tutors reported that schools do make this provision. Additional analysis revealed that induction tutors in primary schools were statistically more likely to provide NQTs with a contact at the local authority whom they could approach for independent advice on the induction process than their counterparts in secondary schools: this was the case for 80 per cent of induction tutors in primary schools compared to 76 per cent in secondary schools (see Tables B3.8 and B3.9). NQTs/2nd year teachers were asked which aspects of their induction had been most useful. Responses included: the opportunity to meet with other NQTs; support from staff and the school; support from a mentor; and observing other teachers in their own or other schools. Other useful aspects cited were particular NQT courses and CPD opportunities for NQTs, as well as local authority training courses and INSET days. When asked what other support would be/would have been useful, answers included support for planning lessons, behaviour management, and assessment (see Table B3.10 and 11).
5.5 The induction tutor’s role Induction tutors responding to our survey had, on average, held their position for five years. However, over 100 out of 435 respondents had been an induction tutor for one year or less. One in five (19 per cent) of induction tutors had not received any training to support them in this role (see Table B3.12 and B3.13). When induction tutors were asked about their role as an induction tutor, the majority reported that ensuring headteachers were kept informed of any difficulties NQTs are having in making progress is an important part of their role: 92 per cent reported this ‘to a great extent’ (see Table B3.14). Overall, almost nine out of ten induction tutors (87 per cent) reported that they carry out regular progress reviews ‘to a great extent’. Tests for statistical significance showed that induction tutors in primary schools were statistically more likely to report carrying out regular progress reviews ‘to a great extent’
Induction 83
than their counterparts in secondary schools (90 per cent of primary schools reported this ‘to a great extent’ compared to 83 per cent of secondary schools) (see Table B3.14 and B3.15). To a lesser extent, induction tutors provided NQTs with day-to-day support (42 per cent ‘to a great extent’ and 39 per cent ‘to some extent’). Of those induction tutors providing this support ‘to a great extent’, 50 per cent worked in primary schools and 30 per cent in secondary schools. This difference is statistically significant (see Table B3.14 and B3.16). Some induction tutors also monitored NQTs on a day-to-day basis (68 per cent reported this either ‘to a great extent’ or to ‘to some extent’). Again, induction tutors in primary schools are statistically more likely to monitor NQTs on a day-to-day basis ‘to a great extent’ than their counterparts in secondary schools (20 per cent of primary school teachers reported this ‘to a great extent’, compared to 14 per cent of secondary school teachers) (see Table B3.14 and B3.17).
5.6 The local authority’s role 55 out of 57 LA respondents reported that the local authority provided guidance to schools in relation to NQTs’ induction programmes, suggesting that providing guidance to schools is an important feature of local authorities’ role. The majority of local authority respondents also reported providing specific training for induction tutors in their authority: 51 out of 57 reported that this is the case (see Table B3.18). Fewer local authority respondents reported taking responsibility with headteachers for training NQTs: 42 out of 57 local authority respondents reported that this is the case (see Table B3.18).
5.7 Impacts relating to induction Headteachers, NQTs/2nd year teachers, induction tutors and local authorities were asked about the impact that the current induction arrangements have had on NQTs. Respondents were asked to rate impacts of induction in the following areas:
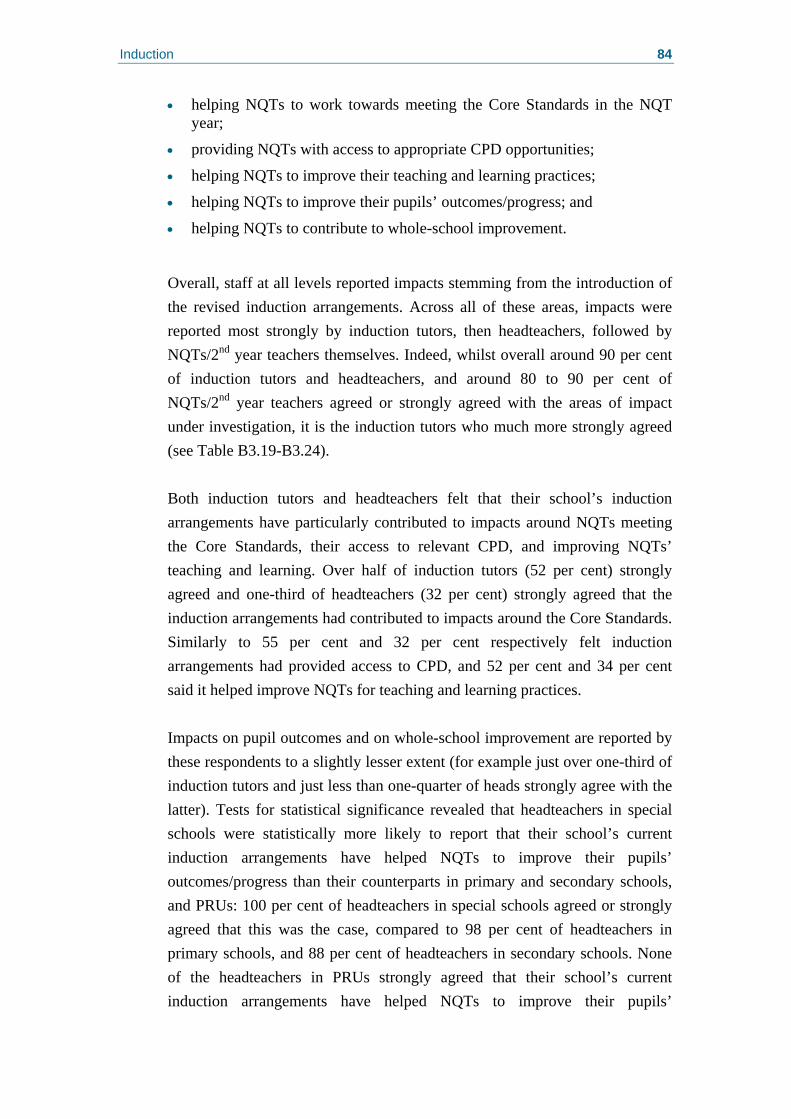
Induction 84
• helping NQTs to work towards meeting the Core Standards in the NQT year;
• providing NQTs with access to appropriate CPD opportunities;
• helping NQTs to improve their teaching and learning practices;
• helping NQTs to improve their pupils’ outcomes/progress; and
• helping NQTs to contribute to whole-school improvement.
Overall, staff at all levels reported impacts stemming from the introduction of the revised induction arrangements. Across all of these areas, impacts were reported most strongly by induction tutors, then headteachers, followed by NQTs/2nd year teachers themselves. Indeed, whilst overall around 90 per cent of induction tutors and headteachers, and around 80 to 90 per cent of NQTs/2nd year teachers agreed or strongly agreed with the areas of impact under investigation, it is the induction tutors who much more strongly agreed (see Table B3.19-B3.24). Both induction tutors and headteachers felt that their school’s induction arrangements have particularly contributed to impacts around NQTs meeting the Core Standards, their access to relevant CPD, and improving NQTs’ teaching and learning. Over half of induction tutors (52 per cent) strongly agreed and one-third of headteachers (32 per cent) strongly agreed that the induction arrangements had contributed to impacts around the Core Standards. Similarly to 55 per cent and 32 per cent respectively felt induction arrangements had provided access to CPD, and 52 per cent and 34 per cent said it helped improve NQTs for teaching and learning practices. Impacts on pupil outcomes and on whole-school improvement are reported by these respondents to a slightly lesser extent (for example just over one-third of induction tutors and just less than one-quarter of heads strongly agree with the latter). Tests for statistical significance revealed that headteachers in special schools were statistically more likely to report that their school’s current induction arrangements have helped NQTs to improve their pupils’ outcomes/progress than their counterparts in primary and secondary schools, and PRUs: 100 per cent of headteachers in special schools agreed or strongly agreed that this was the case, compared to 98 per cent of headteachers in primary schools, and 88 per cent of headteachers in secondary schools. None of the headteachers in PRUs strongly agreed that their school’s current induction arrangements have helped NQTs to improve their pupils’
Induction 85
outcomes/progress, although all agreed that this was the case overall (see Table B3.25). By contrast, NQTs/2nd year teachers themselves reported the strongest impact around their teaching and learning practices (over 90 per cent agreed or strongly agreed, with 37 per cent of these strongly agreeing). NQTs/2nd year teachers also reported weaker impacts around their access to CPD. Indeed, one in 20 NQTs (five per cent) disagreed or strongly disagreed that induction has provided them with access to relevant CPD opportunities. 87 per cent of NQTs/2nd year teachers agreed or strongly agreed that induction had helped them to work towards the Core Standards, with over a quarter (28 per cent) strongly agreeing. Again, NQTs/2nd year teachers in primary schools were statistically more likely to ‘strongly agree’ that their school’s induction arrangements had provided them with access to CPD opportunities than their counterparts in secondary schools: 29 per cent of NQTs from primary schools and 22 per cent of NQTs from secondary school reported this respectively (see Table B3.26). Like other respondents, NQTs/2nd year teachers reported impacts in terms of their contribution to whole-school improvement to a slightly lesser extent: whilst 23 per cent strongly agreed that their school’s induction arrangements had helped them to contribute to whole school improvement and 56 per cent agreed, three per cent of NQTs/2nd year teachers disagreed or strongly disagreed that this was the case.
5.8 Regression analysis on findings relating to induction Regression analysis was undertaken to explore which groups of respondents scored higher and lower on the measure of positivity towards induction arrangements (for a full explanation of this analysis see Appendix D).
Induction 86
5.9 Positivity towards induction arrangements: regression analysis
5.9.1 More reported positivity towards induction arrangements
Regression analysis revealed that, when compared to their counterparts, the following groups were significantly more likely to report positivity towards their school’s induction arrangements: • those who reported experiencing the greatest impacts from induction
• those with a higher score on the measure of meeting CPD needs
• those who identified the strongest links between the professional standards, performance management and CPD in their school.
5.9.2 Less reported positivity towards induction arrangements
Regression analysis also revealed that, when compared to their counterparts, the following groups were significantly less likely to report positivity towards their school’s induction arrangements: • those who reported experiencing the greatest impacts from performance
management.
5.10 Impacts of induction: regression analysis
5.10.1 Greater reported impacts of induction
Regression analysis revealed that, when compared to their counterparts, the following groups were significantly more likely to identify impacts resulting from induction: • those who were most positive towards their school’s induction
arrangements
• those who reported the greatest impacts from CPD
• those who have been teaching for longer
• those who identified the strongest links between the professional standards, performance management and CPD in their school.

Continuing Professional Development 87
6. Continuing Professional Development
Key findings • In general school staff, and governors, appeared to believe that their
school enabled teachers to access relevant CPD opportunities. There were some differences in opinion by professional group and setting.
• The overwhelming majority of school staff agreed that ‘to a great extent’ it was their responsibility to engage with CPD, though there were again some differences in the balance of opinion by professional group and setting.
• The majority of school staff and governors reported that teachers’ professional development needs were being met. Headteachers and school governors were less likely to report that headteachers’ professional development needs were being met.
• Teachers new to the profession were most likely to have been mentored or coached, and analysis of responses by length of service suggested a loosely inverse relationship between years as a teacher and experience of being mentored or coached.
• Induction tutors reported the highest level of involvement as a mentor or coach, followed by headteachers. Within the latter professional group, there were small, but statistically significant, differences by school type.
• Nine out of ten headteachers reported that the impact of CPD was evaluated, typically as part of the performance management process, and in terms of impact on pupils. This finding differs from the view presented in the literature, which suggests that evaluation of CPD is underdeveloped, with many schools failing to identify appropriate outcomes and outcome measures.
• There was a firm and widespread belief that CPD had helped improve teaching and learning in schools, with only limited variation between professional groups and no statistically significant differences by school type or teachers’ length of service.
• The majority of respondents also ‘agreed’, or ‘strongly agreed’, that CPD had had a positive impact on pupil progress and outcomes. However, there were more marked variations by professional group and, in the case of early career teachers, by school phase.
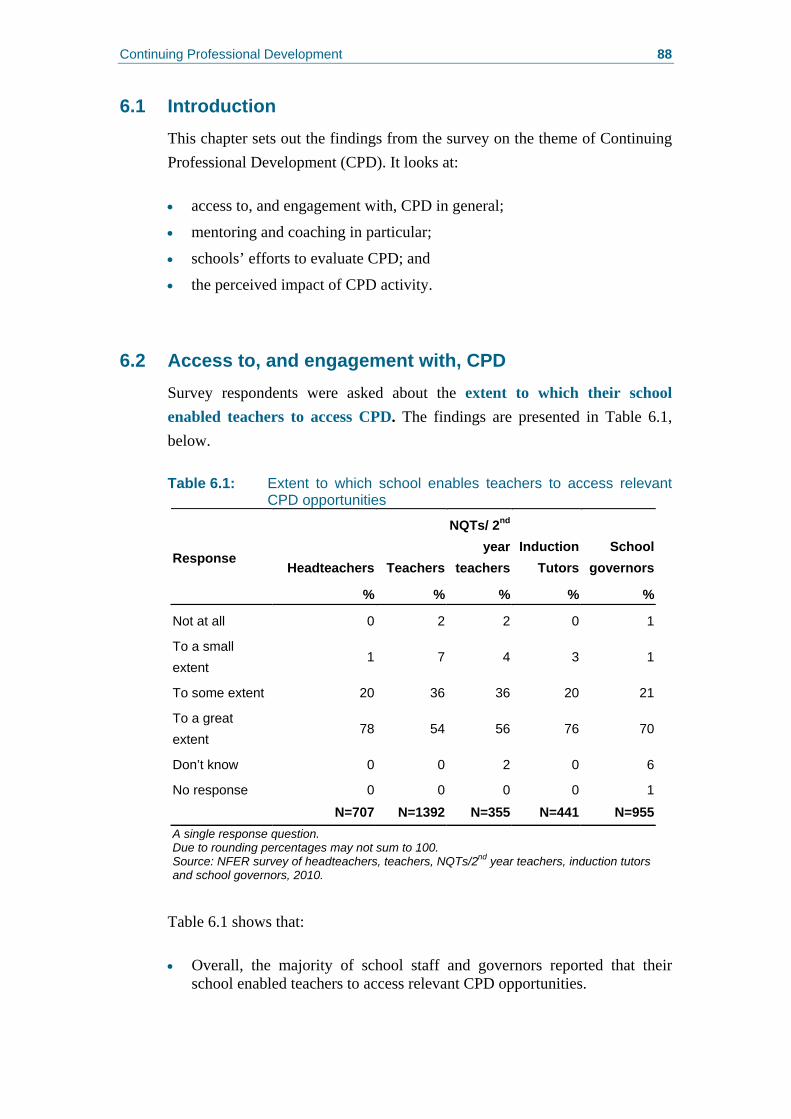
Continuing Professional Development 88
6.1 Introduction This chapter sets out the findings from the survey on the theme of Continuing Professional Development (CPD). It looks at: • access to, and engagement with, CPD in general;
• mentoring and coaching in particular;
• schools’ efforts to evaluate CPD; and
• the perceived impact of CPD activity.
6.2 Access to, and engagement with, CPD Survey respondents were asked about the extent to which their school enabled teachers to access CPD. The findings are presented in Table 6.1, below. Table 6.1: Extent to which school enables teachers to access relevant
CPD opportunities
Headteachers Teachers
NQTs/ 2nd
year teachers
Induction Tutors
School governors
Response
% % % % %
Not at all 0 2 2 0 1
To a small extent
1 7 4 3 1
To some extent 20 36 36 20 21
To a great extent
78 54 56 76 70
Don’t know 0 0 2 0 6
No response 0 0 0 0 1
N=707 N=1392 N=355 N=441 N=955A single response question. Due to rounding percentages may not sum to 100. Source: NFER survey of headteachers, teachers, NQTs/2nd year teachers, induction tutors and school governors, 2010.
Table 6.1 shows that: • Overall, the majority of school staff and governors reported that their
school enabled teachers to access relevant CPD opportunities.
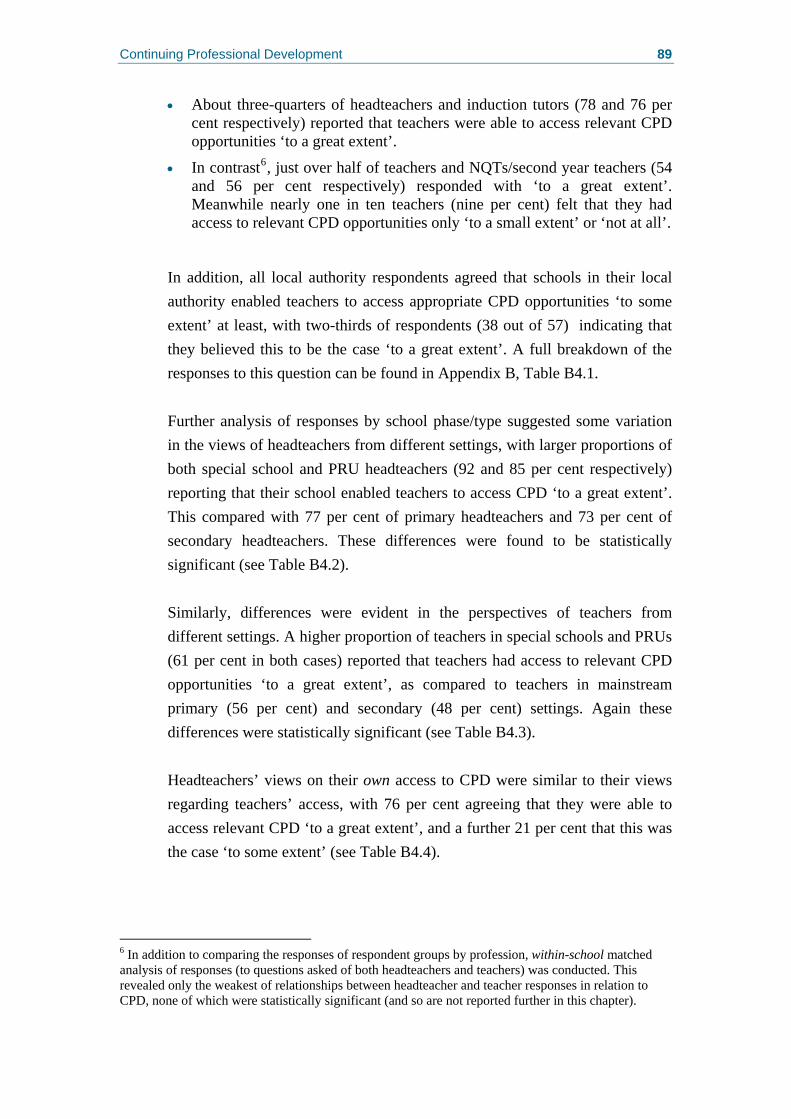
Continuing Professional Development 89
• About three-quarters of headteachers and induction tutors (78 and 76 per cent respectively) reported that teachers were able to access relevant CPD opportunities ‘to a great extent’.
• In contrast6, just over half of teachers and NQTs/second year teachers (54 and 56 per cent respectively) responded with ‘to a great extent’. Meanwhile nearly one in ten teachers (nine per cent) felt that they had access to relevant CPD opportunities only ‘to a small extent’ or ‘not at all’.
In addition, all local authority respondents agreed that schools in their local authority enabled teachers to access appropriate CPD opportunities ‘to some extent’ at least, with two-thirds of respondents (38 out of 57) indicating that they believed this to be the case ‘to a great extent’. A full breakdown of the responses to this question can be found in Appendix B, Table B4.1. Further analysis of responses by school phase/type suggested some variation in the views of headteachers from different settings, with larger proportions of both special school and PRU headteachers (92 and 85 per cent respectively) reporting that their school enabled teachers to access CPD ‘to a great extent’. This compared with 77 per cent of primary headteachers and 73 per cent of secondary headteachers. These differences were found to be statistically significant (see Table B4.2). Similarly, differences were evident in the perspectives of teachers from different settings. A higher proportion of teachers in special schools and PRUs (61 per cent in both cases) reported that teachers had access to relevant CPD opportunities ‘to a great extent’, as compared to teachers in mainstream primary (56 per cent) and secondary (48 per cent) settings. Again these differences were statistically significant (see Table B4.3).
Headteachers’ views on their own access to CPD were similar to their views regarding teachers’ access, with 76 per cent agreeing that they were able to access relevant CPD ‘to a great extent’, and a further 21 per cent that this was the case ‘to some extent’ (see Table B4.4).
6 In addition to comparing the responses of respondent groups by profession, within-school matched analysis of responses (to questions asked of both headteachers and teachers) was conducted. This revealed only the weakest of relationships between headteacher and teacher responses in relation to CPD, none of which were statistically significant (and so are not reported further in this chapter).
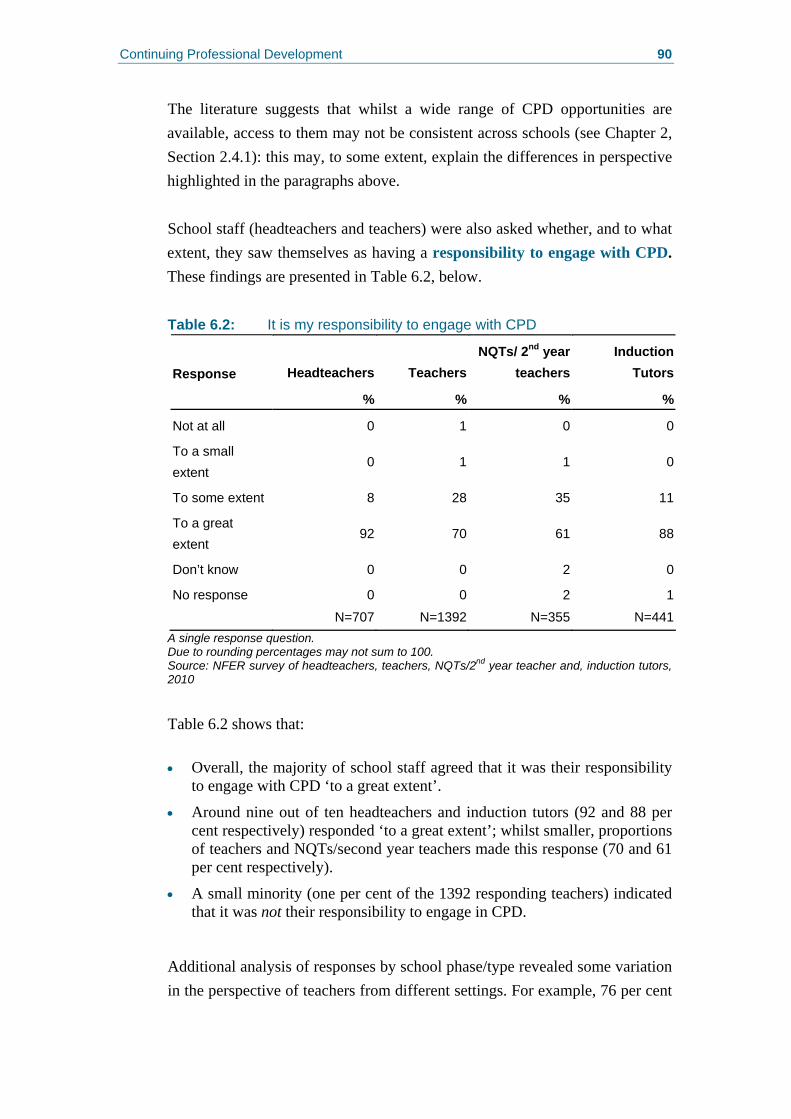
Continuing Professional Development 90
The literature suggests that whilst a wide range of CPD opportunities are available, access to them may not be consistent across schools (see Chapter 2, Section 2.4.1): this may, to some extent, explain the differences in perspective highlighted in the paragraphs above. School staff (headteachers and teachers) were also asked whether, and to what extent, they saw themselves as having a responsibility to engage with CPD. These findings are presented in Table 6.2, below. Table 6.2: It is my responsibility to engage with CPD
Headteachers TeachersNQTs/ 2nd year
teachers Induction
TutorsResponse
% % % %
Not at all 0 1 0 0
To a small extent
0 1 1 0
To some extent 8 28 35 11
To a great extent
92 70 61 88
Don’t know 0 0 2 0
No response 0 0 2 1
N=707 N=1392 N=355 N=441A single response question. Due to rounding percentages may not sum to 100. Source: NFER survey of headteachers, teachers, NQTs/2nd year teacher and, induction tutors, 2010 Table 6.2 shows that: • Overall, the majority of school staff agreed that it was their responsibility
to engage with CPD ‘to a great extent’.
• Around nine out of ten headteachers and induction tutors (92 and 88 per cent respectively) responded ‘to a great extent’; whilst smaller, proportions of teachers and NQTs/second year teachers made this response (70 and 61 per cent respectively).
• A small minority (one per cent of the 1392 responding teachers) indicated that it was not their responsibility to engage in CPD.
Additional analysis of responses by school phase/type revealed some variation in the perspective of teachers from different settings. For example, 76 per cent
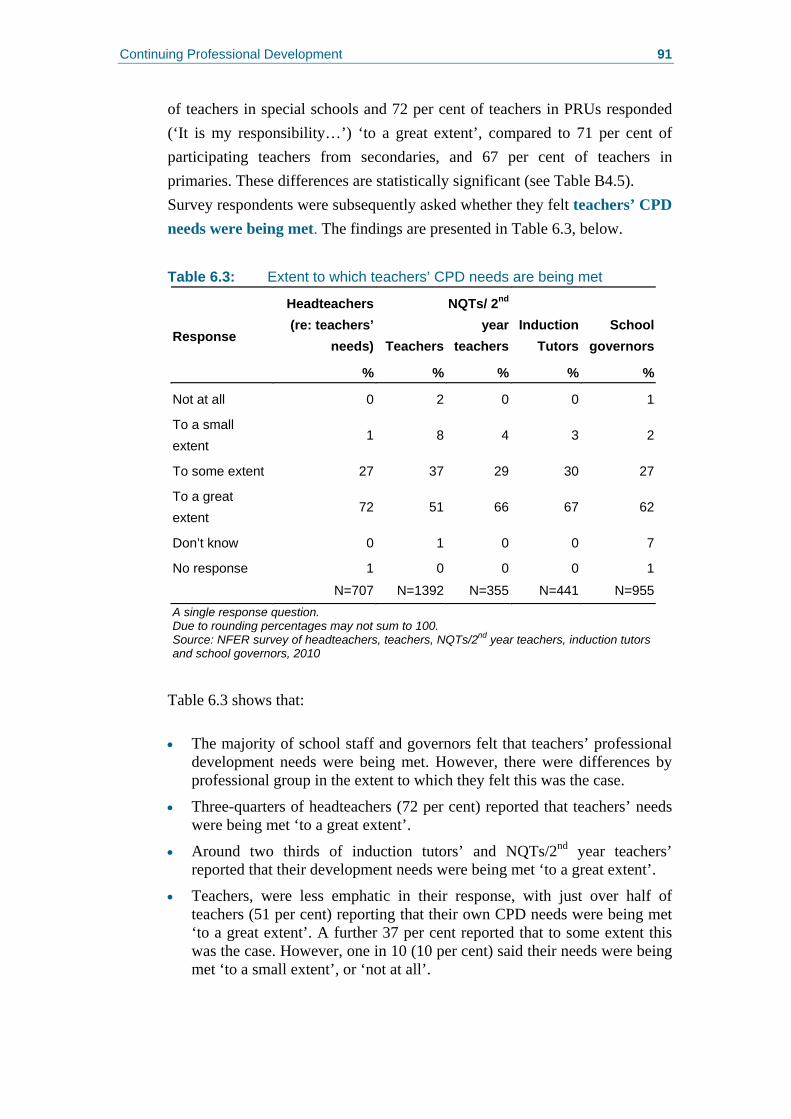
Continuing Professional Development 91
of teachers in special schools and 72 per cent of teachers in PRUs responded (‘It is my responsibility…’) ‘to a great extent’, compared to 71 per cent of participating teachers from secondaries, and 67 per cent of teachers in primaries. These differences are statistically significant (see Table B4.5). Survey respondents were subsequently asked whether they felt teachers’ CPD needs were being met. The findings are presented in Table 6.3, below. Table 6.3: Extent to which teachers’ CPD needs are being met
Headteachers (re: teachers’
needs) Teachers
NQTs/ 2nd
year teachers
Induction Tutors
School governors
Response
% % % % %
Not at all 0 2 0 0 1
To a small extent
1 8 4 3 2
To some extent 27 37 29 30 27
To a great extent
72 51 66 67 62
Don’t know 0 1 0 0 7
No response 1 0 0 0 1
N=707 N=1392 N=355 N=441 N=955A single response question. Due to rounding percentages may not sum to 100. Source: NFER survey of headteachers, teachers, NQTs/2nd year teachers, induction tutors and school governors, 2010
Table 6.3 shows that: • The majority of school staff and governors felt that teachers’ professional
development needs were being met. However, there were differences by professional group in the extent to which they felt this was the case.
• Three-quarters of headteachers (72 per cent) reported that teachers’ needs were being met ‘to a great extent’.
• Around two thirds of induction tutors’ and NQTs/2nd year teachers’ reported that their development needs were being met ‘to a great extent’.
• Teachers, were less emphatic in their response, with just over half of teachers (51 per cent) reporting that their own CPD needs were being met ‘to a great extent’. A further 37 per cent reported that to some extent this was the case. However, one in 10 (10 per cent) said their needs were being met ‘to a small extent’, or ‘not at all’.
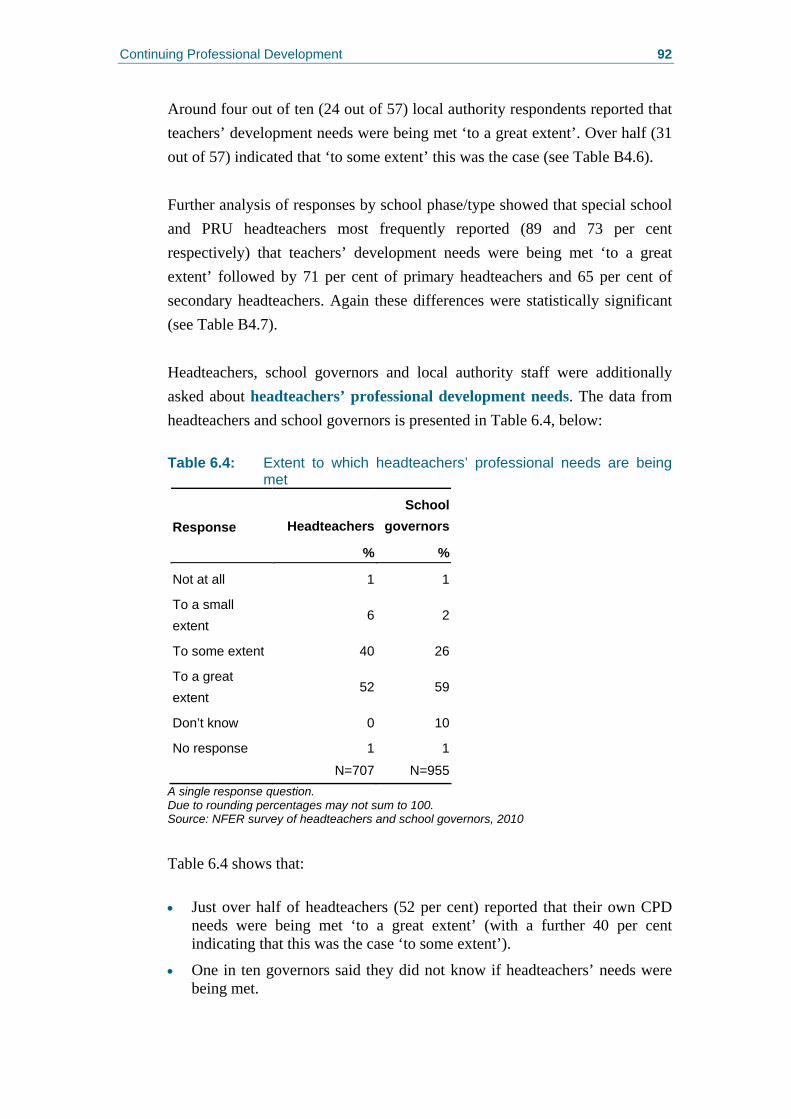
Continuing Professional Development 92
Around four out of ten (24 out of 57) local authority respondents reported that teachers’ development needs were being met ‘to a great extent’. Over half (31 out of 57) indicated that ‘to some extent’ this was the case (see Table B4.6). Further analysis of responses by school phase/type showed that special school and PRU headteachers most frequently reported (89 and 73 per cent respectively) that teachers’ development needs were being met ‘to a great extent’ followed by 71 per cent of primary headteachers and 65 per cent of secondary headteachers. Again these differences were statistically significant (see Table B4.7). Headteachers, school governors and local authority staff were additionally asked about headteachers’ professional development needs. The data from headteachers and school governors is presented in Table 6.4, below: Table 6.4: Extent to which headteachers’ professional needs are being
met
HeadteachersSchool
governorsResponse
% %
Not at all 1 1
To a small extent
6 2
To some extent 40 26
To a great extent
52 59
Don’t know 0 10
No response 1 1
N=707 N=955A single response question. Due to rounding percentages may not sum to 100. Source: NFER survey of headteachers and school governors, 2010 Table 6.4 shows that: • Just over half of headteachers (52 per cent) reported that their own CPD
needs were being met ‘to a great extent’ (with a further 40 per cent indicating that this was the case ‘to some extent’).
• One in ten governors said they did not know if headteachers’ needs were being met.
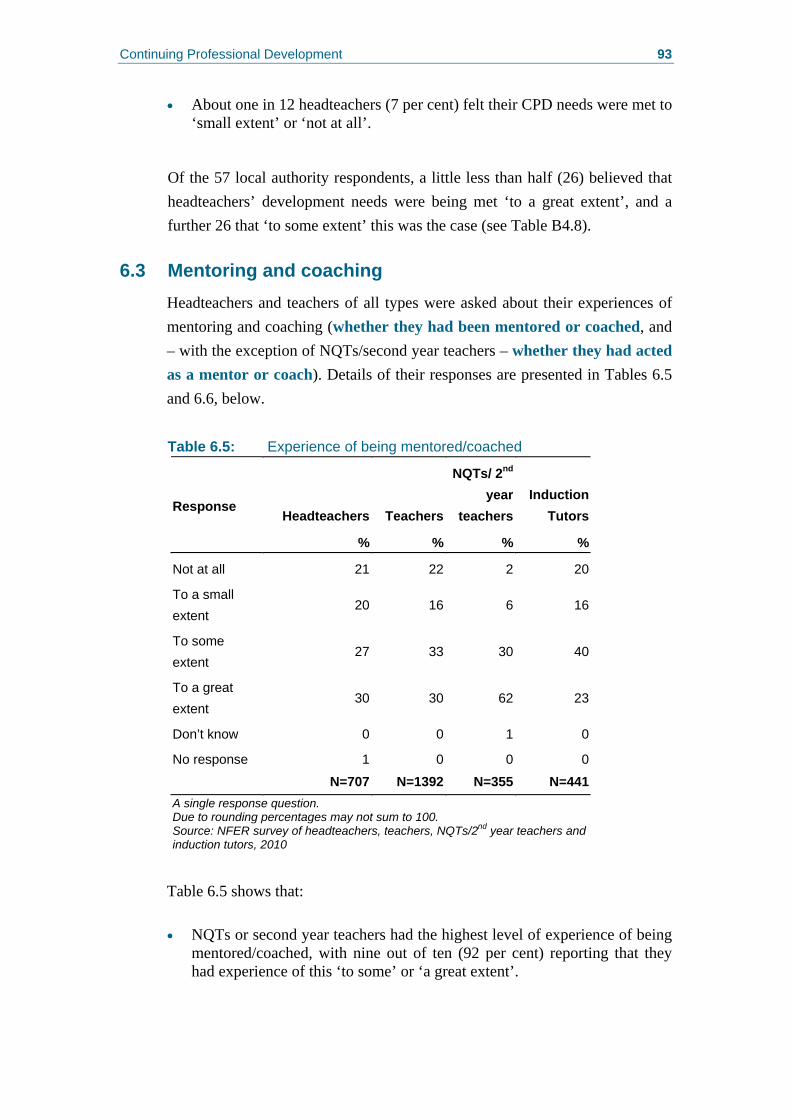
Continuing Professional Development 93
• About one in 12 headteachers (7 per cent) felt their CPD needs were met to ‘small extent’ or ‘not at all’.
Of the 57 local authority respondents, a little less than half (26) believed that headteachers’ development needs were being met ‘to a great extent’, and a further 26 that ‘to some extent’ this was the case (see Table B4.8).
6.3 Mentoring and coaching Headteachers and teachers of all types were asked about their experiences of mentoring and coaching (whether they had been mentored or coached, and – with the exception of NQTs/second year teachers – whether they had acted as a mentor or coach). Details of their responses are presented in Tables 6.5 and 6.6, below. Table 6.5: Experience of being mentored/coached
Headteachers Teachers
NQTs/ 2nd
year teachers
Induction Tutors
Response
% % % %
Not at all 21 22 2 20
To a small extent
20 16 6 16
To some extent
27 33 30 40
To a great extent
30 30 62 23
Don’t know 0 0 1 0
No response 1 0 0 0
N=707 N=1392 N=355 N=441 A single response question. Due to rounding percentages may not sum to 100. Source: NFER survey of headteachers, teachers, NQTs/2nd year teachers and induction tutors, 2010
Table 6.5 shows that: • NQTs or second year teachers had the highest level of experience of being
mentored/coached, with nine out of ten (92 per cent) reporting that they had experience of this ‘to some’ or ‘a great extent’.
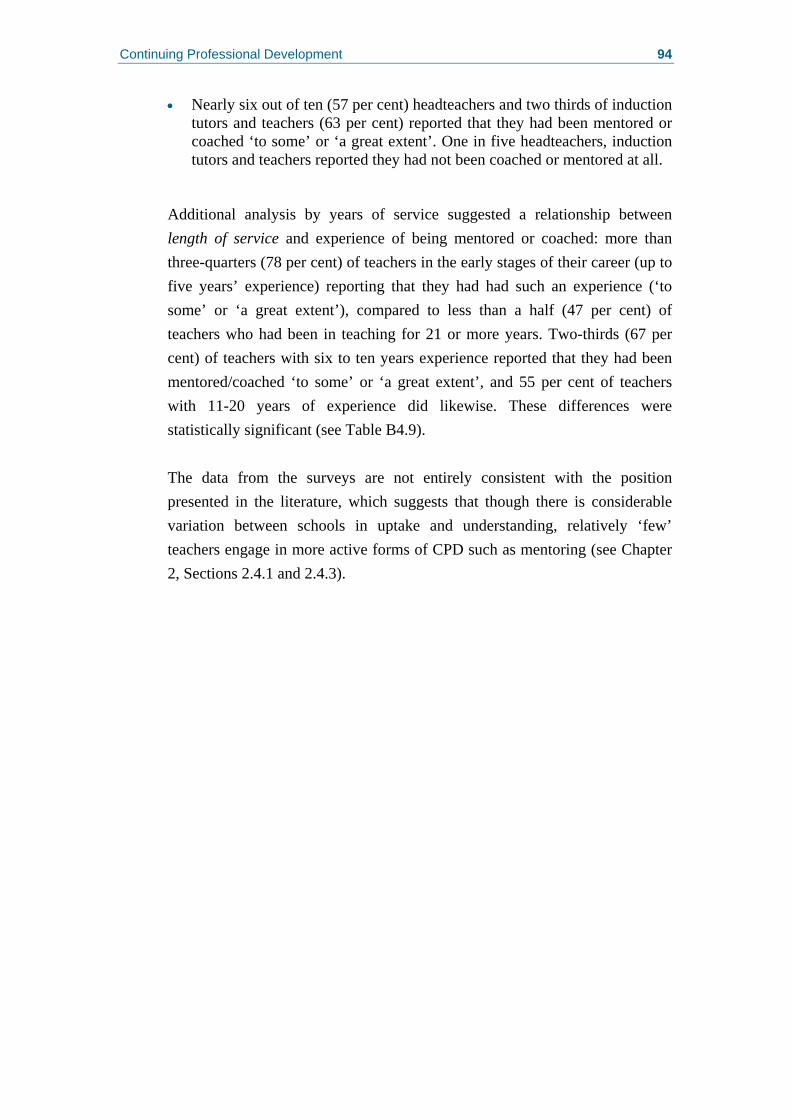
Continuing Professional Development 94
• Nearly six out of ten (57 per cent) headteachers and two thirds of induction tutors and teachers (63 per cent) reported that they had been mentored or coached ‘to some’ or ‘a great extent’. One in five headteachers, induction tutors and teachers reported they had not been coached or mentored at all.
Additional analysis by years of service suggested a relationship between length of service and experience of being mentored or coached: more than three-quarters (78 per cent) of teachers in the early stages of their career (up to five years’ experience) reporting that they had had such an experience (‘to some’ or ‘a great extent’), compared to less than a half (47 per cent) of teachers who had been in teaching for 21 or more years. Two-thirds (67 per cent) of teachers with six to ten years experience reported that they had been mentored/coached ‘to some’ or ‘a great extent’, and 55 per cent of teachers with 11-20 years of experience did likewise. These differences were statistically significant (see Table B4.9). The data from the surveys are not entirely consistent with the position presented in the literature, which suggests that though there is considerable variation between schools in uptake and understanding, relatively ‘few’ teachers engage in more active forms of CPD such as mentoring (see Chapter 2, Sections 2.4.1 and 2.4.3).
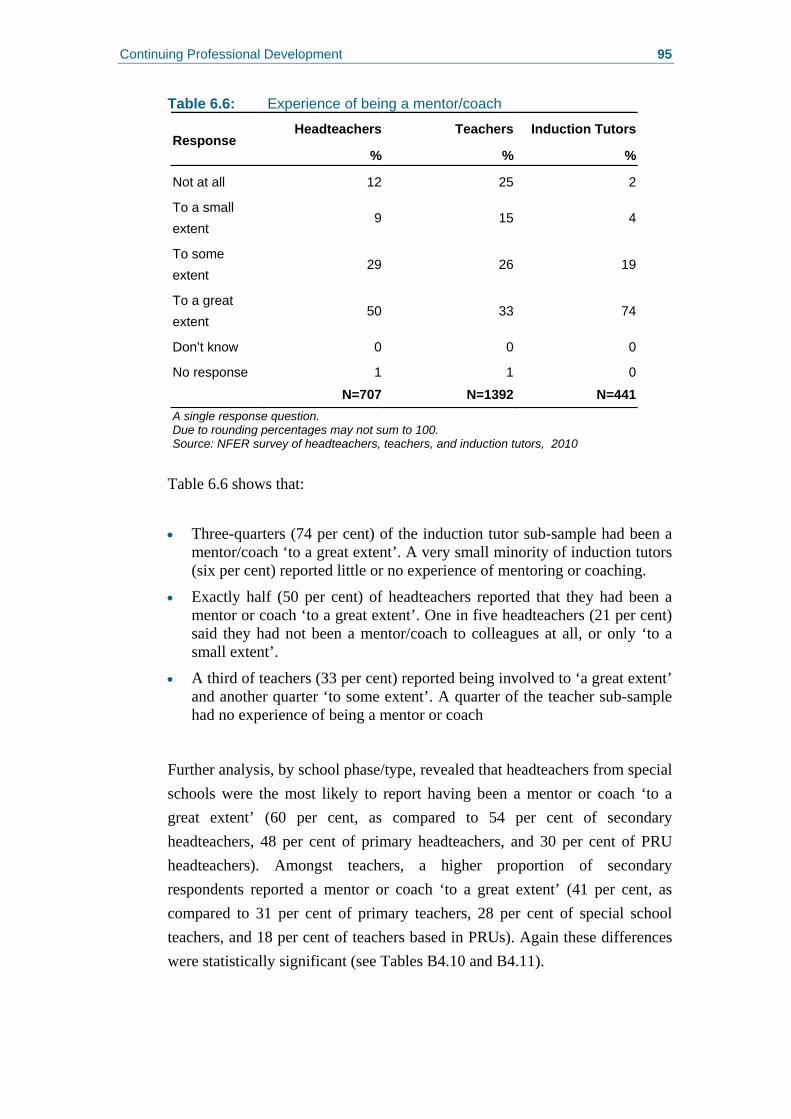
Continuing Professional Development 95
Table 6.6: Experience of being a mentor/coach
Headteachers Teachers Induction Tutors Response
% % %
Not at all 12 25 2
To a small extent
9 15 4
To some extent
29 26 19
To a great extent
50 33 74
Don’t know 0 0 0
No response 1 1 0
N=707 N=1392 N=441 A single response question. Due to rounding percentages may not sum to 100. Source: NFER survey of headteachers, teachers, and induction tutors, 2010
Table 6.6 shows that: • Three-quarters (74 per cent) of the induction tutor sub-sample had been a
mentor/coach ‘to a great extent’. A very small minority of induction tutors (six per cent) reported little or no experience of mentoring or coaching.
• Exactly half (50 per cent) of headteachers reported that they had been a mentor or coach ‘to a great extent’. One in five headteachers (21 per cent) said they had not been a mentor/coach to colleagues at all, or only ‘to a small extent’.
• A third of teachers (33 per cent) reported being involved to ‘a great extent’ and another quarter ‘to some extent’. A quarter of the teacher sub-sample had no experience of being a mentor or coach
Further analysis, by school phase/type, revealed that headteachers from special schools were the most likely to report having been a mentor or coach ‘to a great extent’ (60 per cent, as compared to 54 per cent of secondary headteachers, 48 per cent of primary headteachers, and 30 per cent of PRU headteachers). Amongst teachers, a higher proportion of secondary respondents reported a mentor or coach ‘to a great extent’ (41 per cent, as compared to 31 per cent of primary teachers, 28 per cent of special school teachers, and 18 per cent of teachers based in PRUs). Again these differences were statistically significant (see Tables B4.10 and B4.11).
Continuing Professional Development 96
Further analysis of teacher responses, this time by length of service, found teachers in the early stage of their career (up to five years’ experience) to be the least likely to have had experience of being a mentor or coach. However 46 per cent reported that ‘to some’, or ‘a great extent’, they had experience of this. Teachers with six to ten years’ experience appeared the most likely to have functioned as a mentor or coach, with two-thirds of this group (66 per cent) reporting that ‘to some’, or ‘a great extent’ they had done this. These differences by length of service were also statistically significant (see Table B4.12).
6.4 Evaluating CPD Headteachers, school governors and local authority officers were asked (slightly different) sets of questions relating to the evaluation of CPD – exploring whether it was evaluated, and if so how, who the information was shared with; and what it was useful for. Key findings are outlined below. Almost nine out of ten headteachers (88 per cent) reported that the impact of CPD was evaluated (by contrast, the literature suggests that evaluation of CPD is underdeveloped, with many schools failing to identify appropriate outcomes and outcome measures (see Chapter 2, Section 2.4.5)). Additional analysis revealed variation by school phase/type, with a larger proportion of secondary headteachers (93 per cent) reporting that they evaluated the impact of CPD in their school. This compared with 90 per cent of primary headteachers, 87 per cent of those from special schools and 78 per cent of headteachers from PRUs. These differences, though relatively small, were statistically significant (see Table B4.13). In terms of how and according to what criteria the impact of CPD was evaluated: • The vast majority of headteachers (91 per cent) reported evaluating the
impact of CPD ‘as part of performance management procedures’.
• Roughly four out of five (82 per cent) indicated that they evaluated CPD ‘in terms of impact on pupils’ learning’. Additional analysis identified some statistically significant differences by school phase/type, with more primary headteachers (87 per cent) using this criteria than PRU headteachers (81 per cent), special school headteachers (80 per cent) or secondary headteachers (73 per cent) (see Table B4.15).
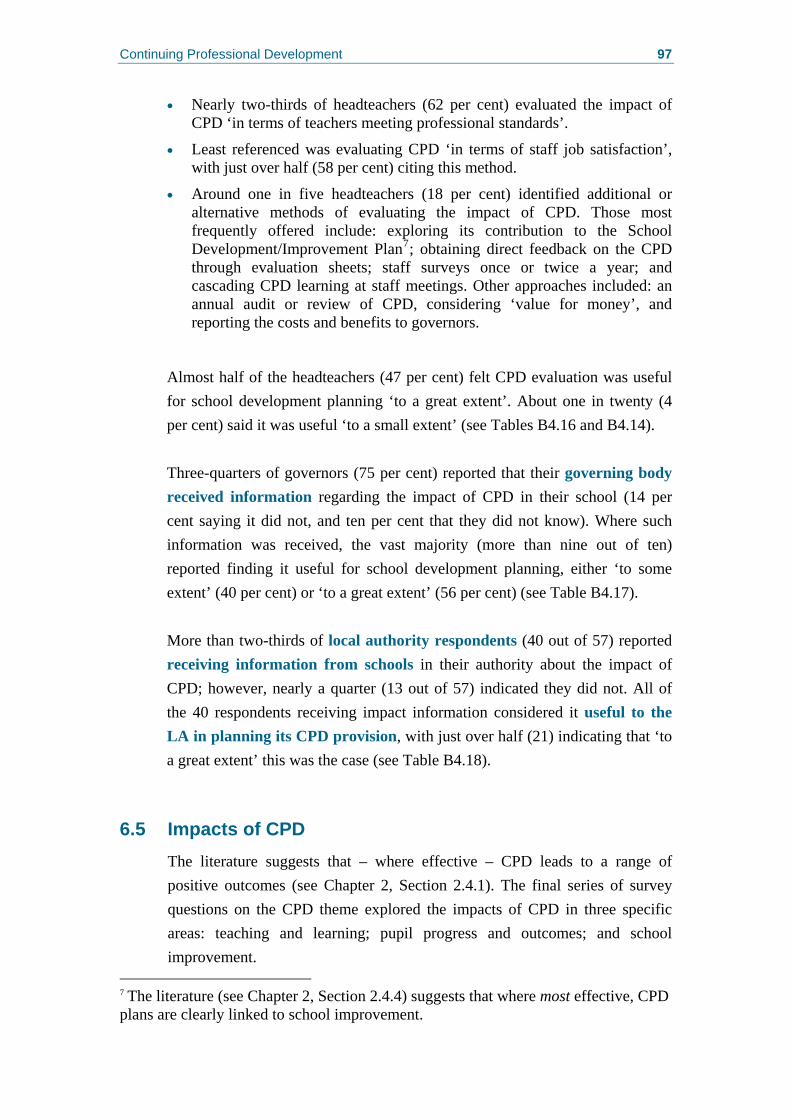
Continuing Professional Development 97
• Nearly two-thirds of headteachers (62 per cent) evaluated the impact of CPD ‘in terms of teachers meeting professional standards’.
• Least referenced was evaluating CPD ‘in terms of staff job satisfaction’, with just over half (58 per cent) citing this method.
• Around one in five headteachers (18 per cent) identified additional or alternative methods of evaluating the impact of CPD. Those most frequently offered include: exploring its contribution to the School Development/Improvement Plan7; obtaining direct feedback on the CPD through evaluation sheets; staff surveys once or twice a year; and cascading CPD learning at staff meetings. Other approaches included: an annual audit or review of CPD, considering ‘value for money’, and reporting the costs and benefits to governors.
Almost half of the headteachers (47 per cent) felt CPD evaluation was useful for school development planning ‘to a great extent’. About one in twenty (4 per cent) said it was useful ‘to a small extent’ (see Tables B4.16 and B4.14). Three-quarters of governors (75 per cent) reported that their governing body received information regarding the impact of CPD in their school (14 per cent saying it did not, and ten per cent that they did not know). Where such information was received, the vast majority (more than nine out of ten) reported finding it useful for school development planning, either ‘to some extent’ (40 per cent) or ‘to a great extent’ (56 per cent) (see Table B4.17). More than two-thirds of local authority respondents (40 out of 57) reported receiving information from schools in their authority about the impact of CPD; however, nearly a quarter (13 out of 57) indicated they did not. All of the 40 respondents receiving impact information considered it useful to the LA in planning its CPD provision, with just over half (21) indicating that ‘to a great extent’ this was the case (see Table B4.18).
6.5 Impacts of CPD The literature suggests that – where effective – CPD leads to a range of positive outcomes (see Chapter 2, Section 2.4.1). The final series of survey questions on the CPD theme explored the impacts of CPD in three specific areas: teaching and learning; pupil progress and outcomes; and school improvement.
7 The literature (see Chapter 2, Section 2.4.4) suggests that where most effective, CPD plans are clearly linked to school improvement.
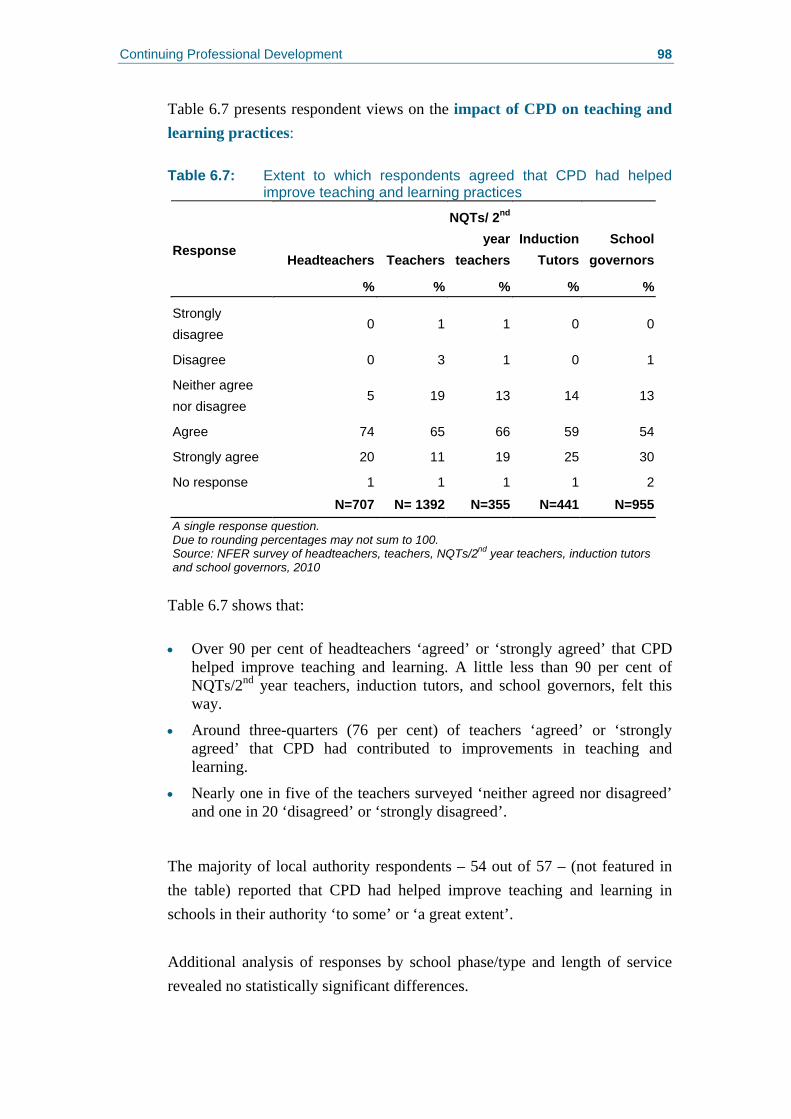
Continuing Professional Development 98
Table 6.7 presents respondent views on the impact of CPD on teaching and learning practices: Table 6.7: Extent to which respondents agreed that CPD had helped
improve teaching and learning practices
Headteachers Teachers
NQTs/ 2nd
year teachers
Induction Tutors
School governors
Response
% % % % %
Strongly disagree
0 1 1 0 0
Disagree 0 3 1 0 1
Neither agree nor disagree
5 19 13 14 13
Agree 74 65 66 59 54
Strongly agree 20 11 19 25 30
No response 1 1 1 1 2
N=707 N= 1392 N=355 N=441 N=955A single response question. Due to rounding percentages may not sum to 100. Source: NFER survey of headteachers, teachers, NQTs/2nd year teachers, induction tutors and school governors, 2010
Table 6.7 shows that: • Over 90 per cent of headteachers ‘agreed’ or ‘strongly agreed’ that CPD
helped improve teaching and learning. A little less than 90 per cent of NQTs/2nd year teachers, induction tutors, and school governors, felt this way.
• Around three-quarters (76 per cent) of teachers ‘agreed’ or ‘strongly agreed’ that CPD had contributed to improvements in teaching and learning.
• Nearly one in five of the teachers surveyed ‘neither agreed nor disagreed’ and one in 20 ‘disagreed’ or ‘strongly disagreed’.
The majority of local authority respondents – 54 out of 57 – (not featured in the table) reported that CPD had helped improve teaching and learning in schools in their authority ‘to some’ or ‘a great extent’. Additional analysis of responses by school phase/type and length of service revealed no statistically significant differences.
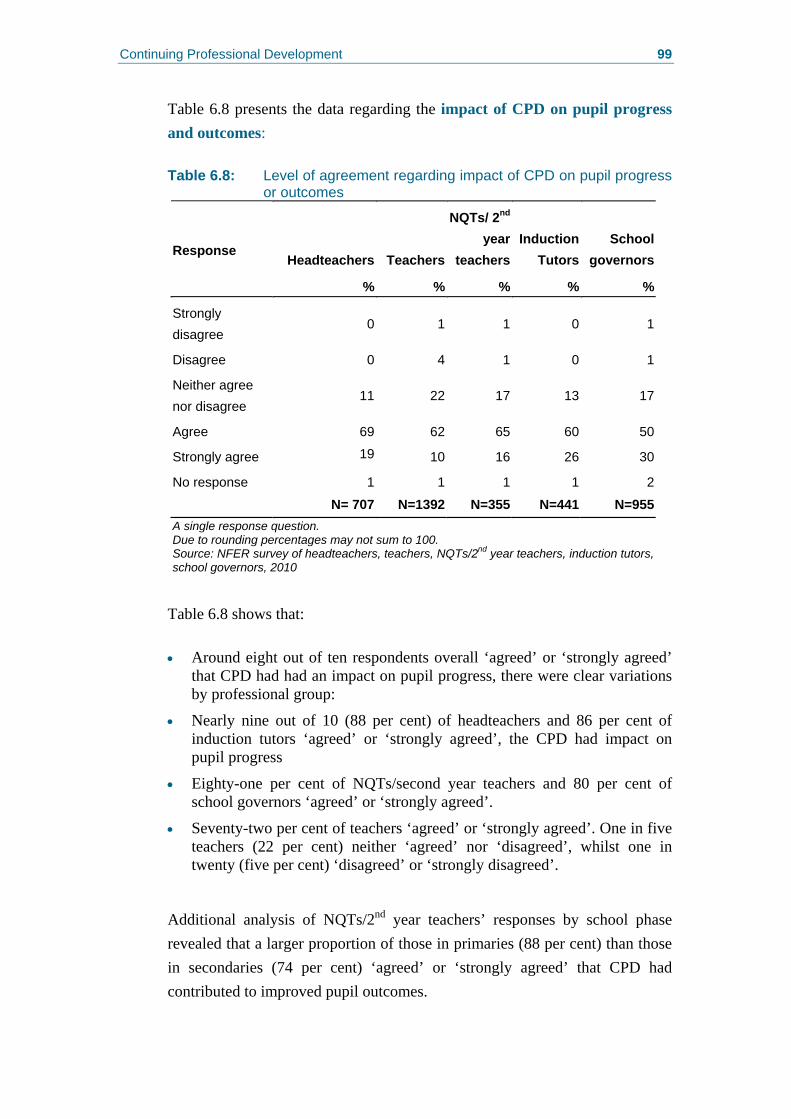
Continuing Professional Development 99
Table 6.8 presents the data regarding the impact of CPD on pupil progress and outcomes: Table 6.8: Level of agreement regarding impact of CPD on pupil progress
or outcomes
Headteachers Teachers
NQTs/ 2nd
year teachers
Induction Tutors
School governors
Response
% % % % %
Strongly disagree
0 1 1 0 1
Disagree 0 4 1 0 1
Neither agree nor disagree
11 22 17 13 17
Agree 69 62 65 60 50
Strongly agree 19 10 16 26 30
No response 1 1 1 1 2
N= 707 N=1392 N=355 N=441 N=955A single response question. Due to rounding percentages may not sum to 100. Source: NFER survey of headteachers, teachers, NQTs/2nd year teachers, induction tutors, school governors, 2010
Table 6.8 shows that: • Around eight out of ten respondents overall ‘agreed’ or ‘strongly agreed’
that CPD had had an impact on pupil progress, there were clear variations by professional group:
• Nearly nine out of 10 (88 per cent) of headteachers and 86 per cent of induction tutors ‘agreed’ or ‘strongly agreed’, the CPD had impact on pupil progress
• Eighty-one per cent of NQTs/second year teachers and 80 per cent of school governors ‘agreed’ or ‘strongly agreed’.
• Seventy-two per cent of teachers ‘agreed’ or ‘strongly agreed’. One in five teachers (22 per cent) neither ‘agreed’ nor ‘disagreed’, whilst one in twenty (five per cent) ‘disagreed’ or ‘strongly disagreed’.
Additional analysis of NQTs/2nd year teachers’ responses by school phase revealed that a larger proportion of those in primaries (88 per cent) than those in secondaries (74 per cent) ‘agreed’ or ‘strongly agreed’ that CPD had contributed to improved pupil outcomes.
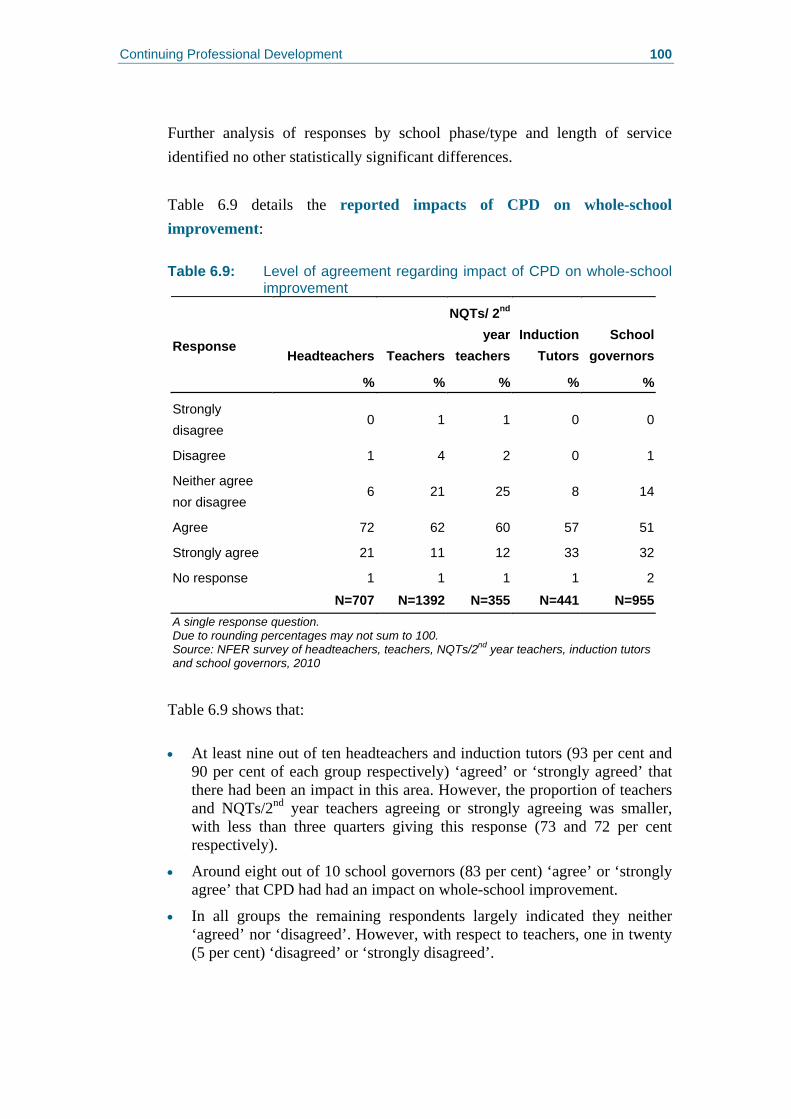
Continuing Professional Development 100
Further analysis of responses by school phase/type and length of service identified no other statistically significant differences. Table 6.9 details the reported impacts of CPD on whole-school improvement: Table 6.9: Level of agreement regarding impact of CPD on whole-school
improvement
Headteachers Teachers
NQTs/ 2nd
year teachers
Induction Tutors
School governors
Response
% % % % %
Strongly disagree
0 1 1 0 0
Disagree 1 4 2 0 1
Neither agree nor disagree
6 21 25 8 14
Agree 72 62 60 57 51
Strongly agree 21 11 12 33 32
No response 1 1 1 1 2
N=707 N=1392 N=355 N=441 N=955A single response question. Due to rounding percentages may not sum to 100. Source: NFER survey of headteachers, teachers, NQTs/2nd year teachers, induction tutors and school governors, 2010
Table 6.9 shows that: • At least nine out of ten headteachers and induction tutors (93 per cent and
90 per cent of each group respectively) ‘agreed’ or ‘strongly agreed’ that there had been an impact in this area. However, the proportion of teachers and NQTs/2nd year teachers agreeing or strongly agreeing was smaller, with less than three quarters giving this response (73 and 72 per cent respectively).
• Around eight out of 10 school governors (83 per cent) ‘agree’ or ‘strongly agree’ that CPD had had an impact on whole-school improvement.
• In all groups the remaining respondents largely indicated they neither ‘agreed’ nor ‘disagreed’. However, with respect to teachers, one in twenty (5 per cent) ‘disagreed’ or ‘strongly disagreed’.
Continuing Professional Development 101
Additional analysis of teacher responses by school phase/type showed variation within this professional group, with primary teachers being most likely (78 per cent) to ‘agree’ or ‘strongly agree’ that CPD had contributed to whole-school improvement. Seventy-four and 77 per cent of teachers from special schools and PRUs (respectively) were in agreement, whilst a markedly smaller proportion of secondary teachers (67 per cent) ‘agreed’ or ‘strongly agreed’. Analysis of NQTs/second year responses by phase (primary versus secondary only) also found some variation, with 82 per cent of respondents from primaries, as compared to 60 per cent of those from secondaries, ‘agreeing’ or ‘strongly agreeing’ that CPD had contributed to whole-school improvement. All these differences were statistically significant (see Tables B4.19 and B4.20). Headteachers were asked two further questions regarding the impact of CPD. The first of these concerned its contribution with respect to providing teachers with career progression opportunities, with the response of eight out of ten (82 per cent) being to ‘agree’ or ‘strongly agree ‘that this had been an area of impact. Additional analysis, by school phase/type, revealed some statistically significant variation within this professional group, with a very large proportion of secondary headteachers (91 per cent) ‘agreeing’ or ‘strongly agreeing’ that CPD had provided teachers with career progression opportunities. In contrast 86 per cent of special school headteachers ‘agreed’ or ‘strongly agreed’, whilst 79 per cent of primary headteachers, and 75 per cent of PRU headteachers did so (see Table B4.21). In addition, headteachers were asked about the impact of CPD on their own effectiveness in leading and managing the school. Eighty-three per cent ‘agreed’ or ‘strongly agreed’ that it had had a positive effect. Additional analysis of headteachers’ responses by school phase/type revealed no statistically significant differences (see Table B4.22).
6.6 Regression analysis of findings relating to CPD Regression analysis was undertaken to explore which groups of respondents scored higher and lower on the measure of meeting of teachers’ CPD needs and the impact of CPD provision (for a full explanation of this analysis see Appendix D).
Continuing Professional Development 102
6.7 Meeting CPD needs: regression analysis
6.7.1 CPD needs more likely to be met
Regression analysis revealed that, when compared to their counterparts, the following groups were significantly more likely to report that their CPD needs were being met: • those engaged with performance management, and perceiving it as useful
• those perceiving impacts from CPD
• those perceiving links between the professional standards, performance management and CPD in the school
• those who were an NQT or main-scale teacher.
6.7.2 CPD needs less likely to be met
Regression analysis also revealed that, when compared to their counterparts, the following groups were significantly less likely to report that their CPD needs were being met:
• those reporting the use and usefulness of the Professional Standards
• those who were a teacher on the upper pay scale, or with ‘Excellent Teacher’ or ‘Advanced Skills Teacher’ status.
6.8 Impacts of CPD: regression analysis
6.8.1 Greater reported impacts of CPD
Regression analysis revealed that, when compared to their counterparts, the following groups were significantly more likely to report impacts of CPD: • those perceiving impacts from performance management
• those perceiving the meeting of their CPD needs
• those perceiving impacts from the implementation of the wider new professionalism agenda which include feeling more able to exercise their own professional judgement
• those perceiving links between the professional standards, performance management and CPD in the school
• those who were on the leadership spine
• those who had been a teacher for longer.

Continuing Professional Development 103
6.8.2 Fewer reported impacts of CPD
Regression analysis revealed that, when compared to their counterparts, the following groups were significantly less likely to report impacts of CPD: • those engaging with performance management, and perceiving it as useful
• those who were male.
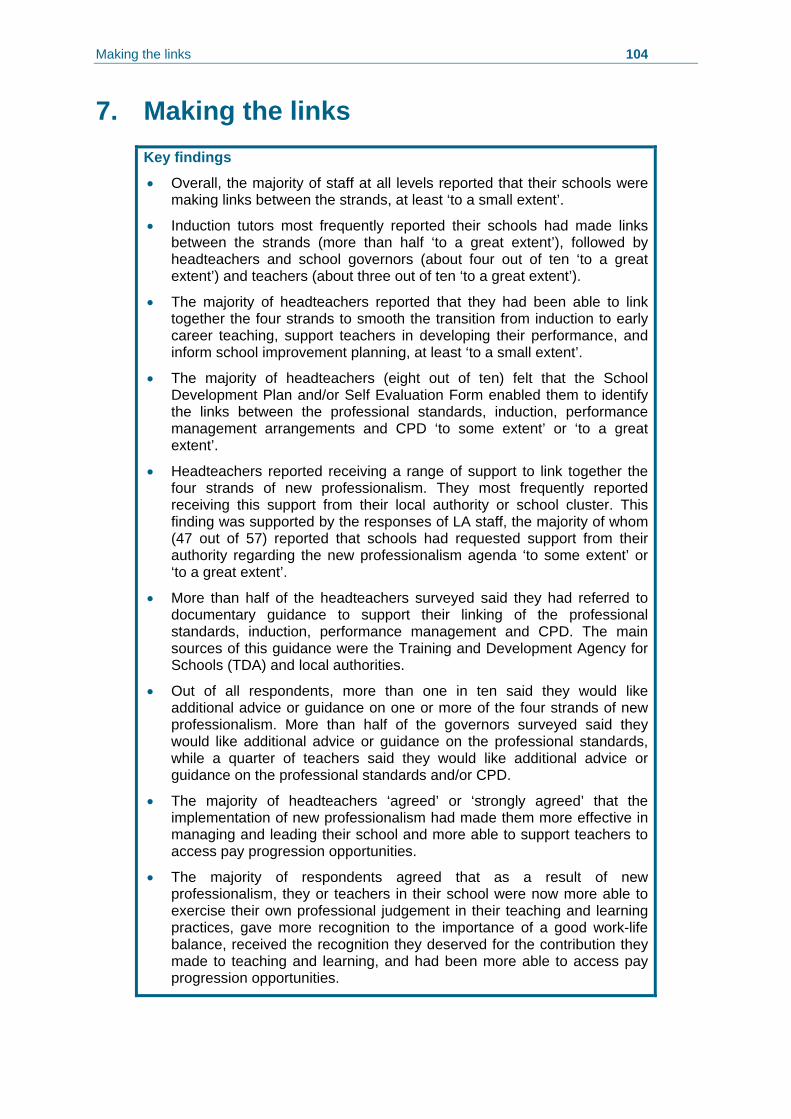
Making the links 104
7. Making the links Key findings
• Overall, the majority of staff at all levels reported that their schools were making links between the strands, at least ‘to a small extent’.
• Induction tutors most frequently reported their schools had made links between the strands (more than half ‘to a great extent’), followed by headteachers and school governors (about four out of ten ‘to a great extent’) and teachers (about three out of ten ‘to a great extent’).
• The majority of headteachers reported that they had been able to link together the four strands to smooth the transition from induction to early career teaching, support teachers in developing their performance, and inform school improvement planning, at least ‘to a small extent’.
• The majority of headteachers (eight out of ten) felt that the School Development Plan and/or Self Evaluation Form enabled them to identify the links between the professional standards, induction, performance management arrangements and CPD ‘to some extent’ or ‘to a great extent’.
• Headteachers reported receiving a range of support to link together the four strands of new professionalism. They most frequently reported receiving this support from their local authority or school cluster. This finding was supported by the responses of LA staff, the majority of whom (47 out of 57) reported that schools had requested support from their authority regarding the new professionalism agenda ‘to some extent’ or ‘to a great extent’.
• More than half of the headteachers surveyed said they had referred to documentary guidance to support their linking of the professional standards, induction, performance management and CPD. The main sources of this guidance were the Training and Development Agency for Schools (TDA) and local authorities.
• Out of all respondents, more than one in ten said they would like additional advice or guidance on one or more of the four strands of new professionalism. More than half of the governors surveyed said they would like additional advice or guidance on the professional standards, while a quarter of teachers said they would like additional advice or guidance on the professional standards and/or CPD.
• The majority of headteachers ‘agreed’ or ‘strongly agreed’ that the implementation of new professionalism had made them more effective in managing and leading their school and more able to support teachers to access pay progression opportunities.
• The majority of respondents agreed that as a result of new professionalism, they or teachers in their school were now more able to exercise their own professional judgement in their teaching and learning practices, gave more recognition to the importance of a good work-life balance, received the recognition they deserved for the contribution they made to teaching and learning, and had been more able to access pay progression opportunities.
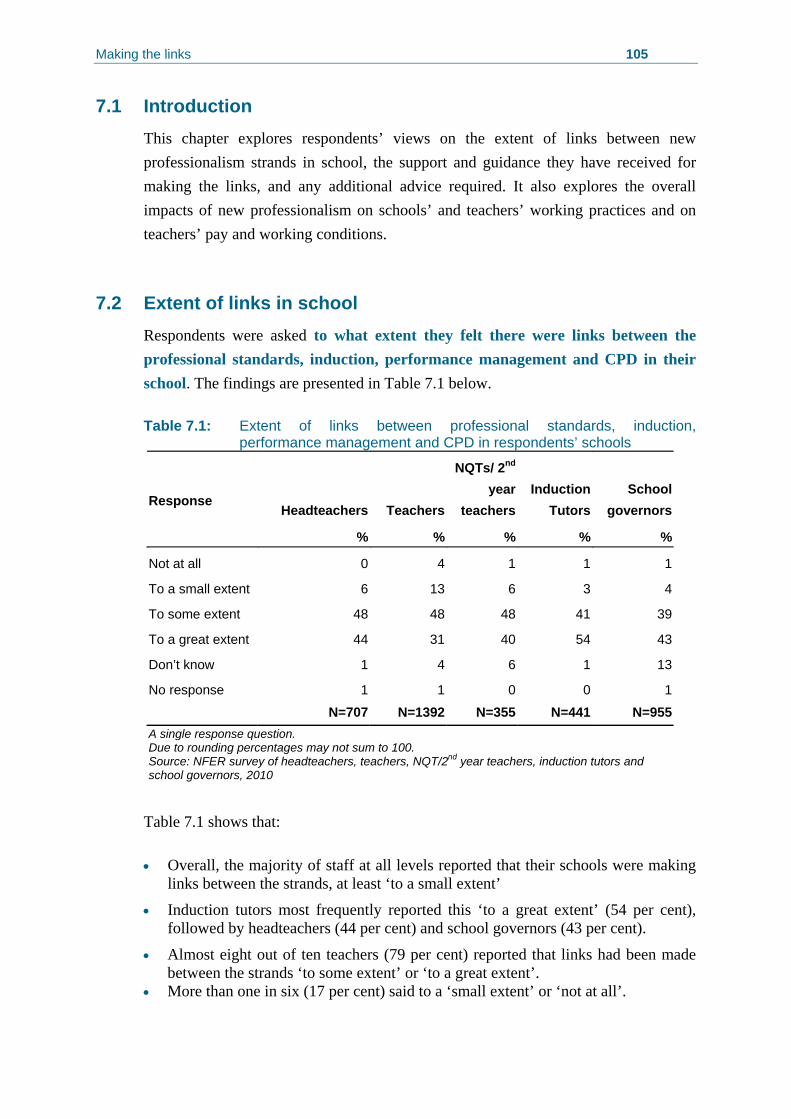
Making the links 105
7.1 Introduction This chapter explores respondents’ views on the extent of links between new professionalism strands in school, the support and guidance they have received for making the links, and any additional advice required. It also explores the overall impacts of new professionalism on schools’ and teachers’ working practices and on teachers’ pay and working conditions.
7.2 Extent of links in school Respondents were asked to what extent they felt there were links between the professional standards, induction, performance management and CPD in their school. The findings are presented in Table 7.1 below. Table 7.1: Extent of links between professional standards, induction,
performance management and CPD in respondents’ schools
Headteachers Teachers
NQTs/ 2nd
year teachers
Induction Tutors
School governors
Response
% % % % %
Not at all 0 4 1 1 1
To a small extent 6 13 6 3 4
To some extent 48 48 48 41 39
To a great extent 44 31 40 54 43
Don’t know 1 4 6 1 13
No response 1 1 0 0 1
N=707 N=1392 N=355 N=441 N=955A single response question. Due to rounding percentages may not sum to 100. Source: NFER survey of headteachers, teachers, NQT/2nd year teachers, induction tutors and school governors, 2010
Table 7.1 shows that: • Overall, the majority of staff at all levels reported that their schools were making
links between the strands, at least ‘to a small extent’
• Induction tutors most frequently reported this ‘to a great extent’ (54 per cent), followed by headteachers (44 per cent) and school governors (43 per cent).
• Almost eight out of ten teachers (79 per cent) reported that links had been made between the strands ‘to some extent’ or ‘to a great extent’.
• More than one in six (17 per cent) said to a ‘small extent’ or ‘not at all’.
Making the links 106
In addition, the majority of the LA respondents reported that they thought that schools in their LA were making links between the strands, with 37 out of 57 reporting this ‘to some extent’, and 18 out of 57 ‘to a great extent’. These findings broadly support those from the literature, that the language of new professionalism has been widely accepted in schools, and that each of the strands has become largely established in school procedures (see Chapter 2, Section 2.6). Additional analysis revealed that secondary headteachers were significantly more likely to report that their schools were making links between the strands ‘to a great extent’ (49 per cent), compared to their counterparts in primary schools (43 per cent), special schools (42 per cent) and PRUs (37 per cent). Analysis of the within-school responses revealed a weak positive correlation between the views of headteachers and teachers regarding the perceived links between the four strands (see Appendix C, Table C1). This finding suggests that there was some agreement between the views of headteachers and teachers from the same school regarding the extent to which they perceived there to be links between the professional standards, induction, performance management and CPD. A full breakdown of the responses to this question can be found in Appendix B, Table B5.1. Headteachers were asked how far they had been able to link together the four strands of new professionalism to achieve a range of outcomes in their schools. The findings are presented in Table 7.2 below.
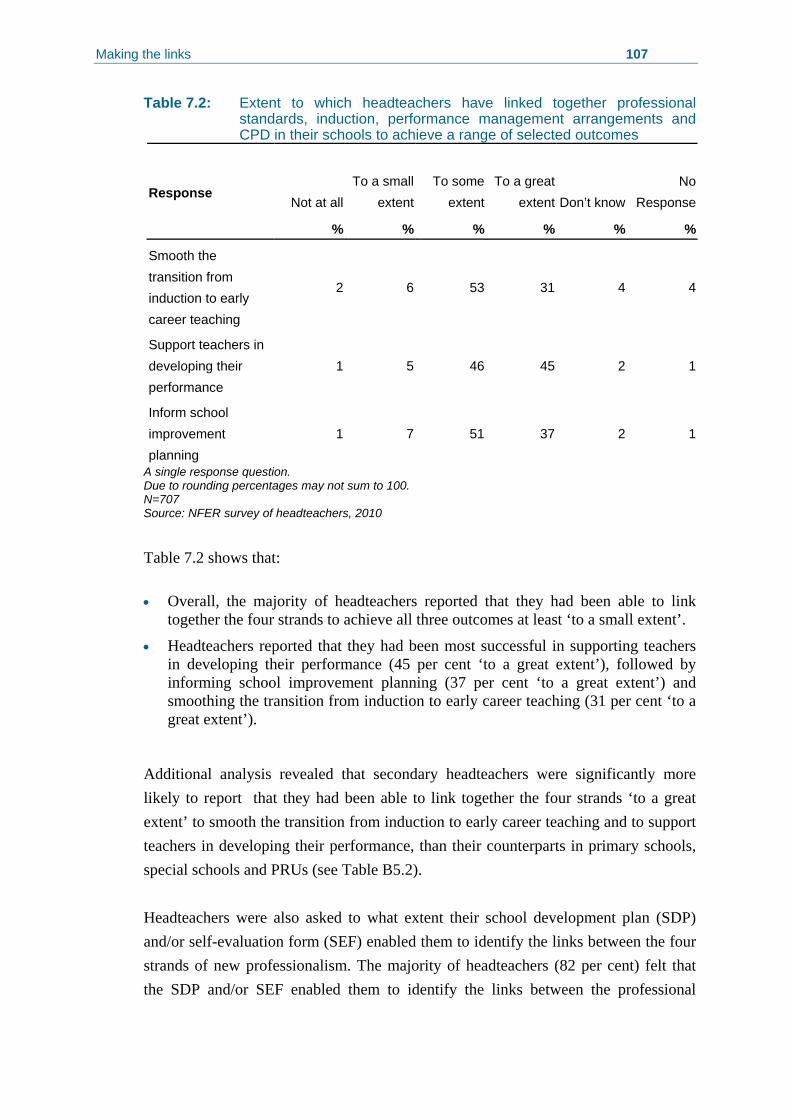
Making the links 107
Table 7.2: Extent to which headteachers have linked together professional standards, induction, performance management arrangements and CPD in their schools to achieve a range of selected outcomes
Not at allTo a small
extentTo some
extentTo a great
extent Don’t know No
ResponseResponse
% % % % % %
Smooth the transition from induction to early career teaching
2 6 53 31 4 4
Support teachers in developing their performance
1 5 46 45 2 1
Inform school improvement planning
1 7 51 37 2 1
A single response question. Due to rounding percentages may not sum to 100. N=707 Source: NFER survey of headteachers, 2010 Table 7.2 shows that: • Overall, the majority of headteachers reported that they had been able to link
together the four strands to achieve all three outcomes at least ‘to a small extent’.
• Headteachers reported that they had been most successful in supporting teachers in developing their performance (45 per cent ‘to a great extent’), followed by informing school improvement planning (37 per cent ‘to a great extent’) and smoothing the transition from induction to early career teaching (31 per cent ‘to a great extent’).
Additional analysis revealed that secondary headteachers were significantly more likely to report that they had been able to link together the four strands ‘to a great extent’ to smooth the transition from induction to early career teaching and to support teachers in developing their performance, than their counterparts in primary schools, special schools and PRUs (see Table B5.2). Headteachers were also asked to what extent their school development plan (SDP) and/or self-evaluation form (SEF) enabled them to identify the links between the four strands of new professionalism. The majority of headteachers (82 per cent) felt that the SDP and/or SEF enabled them to identify the links between the professional
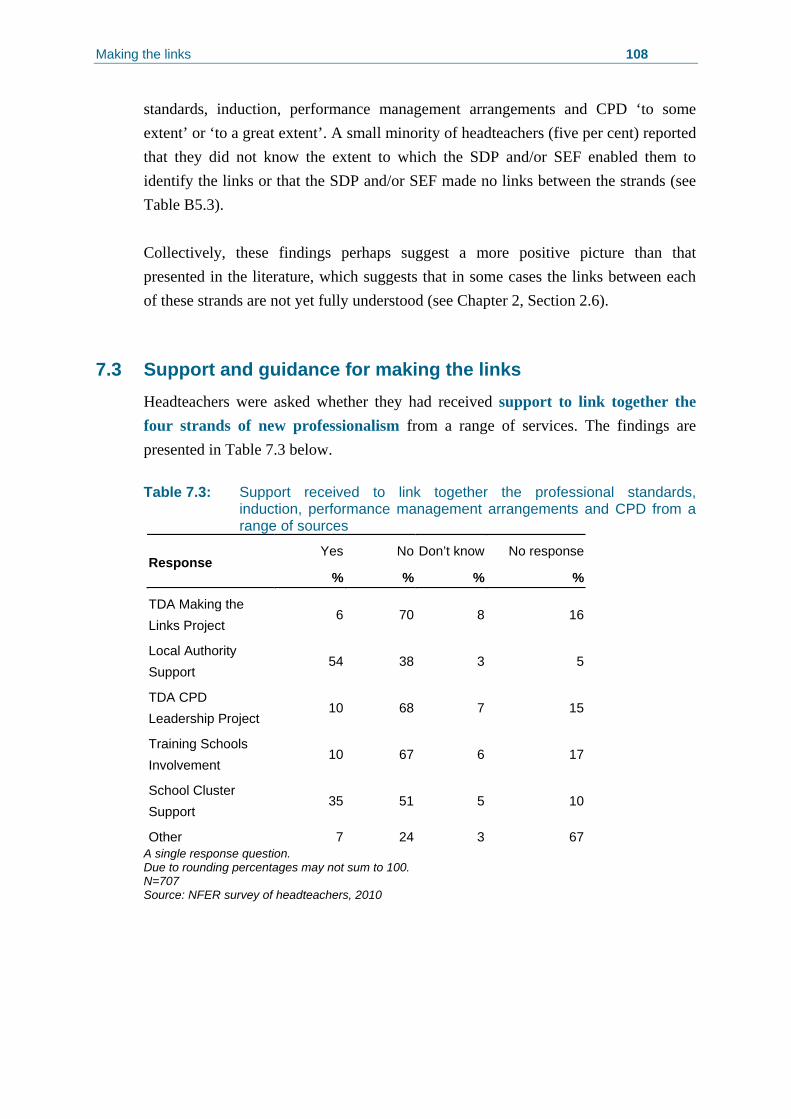
Making the links 108
standards, induction, performance management arrangements and CPD ‘to some extent’ or ‘to a great extent’. A small minority of headteachers (five per cent) reported that they did not know the extent to which the SDP and/or SEF enabled them to identify the links or that the SDP and/or SEF made no links between the strands (see Table B5.3). Collectively, these findings perhaps suggest a more positive picture than that presented in the literature, which suggests that in some cases the links between each of these strands are not yet fully understood (see Chapter 2, Section 2.6).
7.3 Support and guidance for making the links Headteachers were asked whether they had received support to link together the four strands of new professionalism from a range of services. The findings are presented in Table 7.3 below. Table 7.3: Support received to link together the professional standards,
induction, performance management arrangements and CPD from a range of sources
Yes No Don’t know No response Response
% % % %
TDA Making the Links Project
6 70 8 16
Local Authority Support
54 38 3 5
TDA CPD Leadership Project
10 68 7 15
Training Schools Involvement
10 67 6 17
School Cluster Support
35 51 5 10
Other 7 24 3 67 A single response question. Due to rounding percentages may not sum to 100. N=707 Source: NFER survey of headteachers, 2010
Making the links 109
Table 7.3 shows that: • The most frequently cited sources of support for helping to link together the
strands of new professionalism were local authorities (54 per cent), followed by support from school clusters (35 per cent).
• One in ten headteachers reported receiving support from the TDA CPD Leadership Project and/or from training schools.
• Only a small number (six per cent) reported receiving support from the TDA Making the Links Project.
Additional analysis revealed that about two thirds of headteachers (67 per cent) received support to link together the four strands from one or more sources. By contrast, three in ten headteachers (29 per cent) indicated that they had received no such support (see Table B5.4a). Further analysis revealed that of the seven per cent of headteachers who reported receiving support on making the links from other sources, the single most frequently cited source of support was their school improvement partner (SIP) (n=15). Other sources of support accessed by headteachers included: local universities; National Challenge Advisors; and external trainers (see Table B5.4b). Additional analysis revealed some differences by phase. For example, secondary headteachers were significantly more likely to report that they had received support to link together the four strands of new professionalism from the TDA Making the Links Project (10 per cent), than their counterparts in PRUs (7 per cent), primary schools (6 per cent) and special schools (5 per cent). In addition, headteachers in PRUs were significantly more likely to report they had received support from a local authority (70 per cent) than their counterparts in primary schools (59 per cent), special schools (55 per cent) and secondary schools (52 per cent) (see Table B5.5). Headteachers were also asked whether they had referred to any documentary guidance to support their linking of the professional standards, induction, performance management and CPD. About three in ten headteachers (29 per cent) said they had, while more than half (56 per cent) said they had not. Of the remaining headteachers, 11 per cent did not know and four per cent gave no response. Of those headteachers who said they had referred to documentary evidence, the most frequently cited sources were from the TDA (n=47), local authority guidance (n=31),
Making the links 110
and from national documentation on the professional standards (n=25)8 (see Tables B5.6 and B5.7). Additional analysis revealed that secondary headteachers were significantly more likely to report referring to documentary guidance to support their linking of the professional standards, induction, performance management and CPD (‘33 per cent’), than their counterparts in primary schools (30 per cent), special schools (28 per cent) and PRUs (27 per cent) (see Table B5.8). LA staff were asked to what extent their schools requested support from their authority regarding the new professionalism agenda. The majority (35 out of 57) reported that schools requested support ‘to some extent’, while a smaller proportion (12 out of 57) reported schools requested this support ‘to a great extent’. Those LA respondents who reported that their schools had requested support, were asked to provide details of the nature of the support they provided. The most frequent types of support included: customised/tailored CPD programmes; training on performance management and/or induction; and running workshops for school staff to help build the links between the different strands of new professionalism (see Tables B5.9 and B5.10).
7.4 Additional advice required Respondents were asked whether they would like additional advice or guidance on any of the different strands of new professionalism. The findings are presented in Table 7.4 below.
8 Without respondents knowing it, the ‘national documentation’ that respondents refer to may have been produced by the TDA and so there could be some overlap in the reported figures.
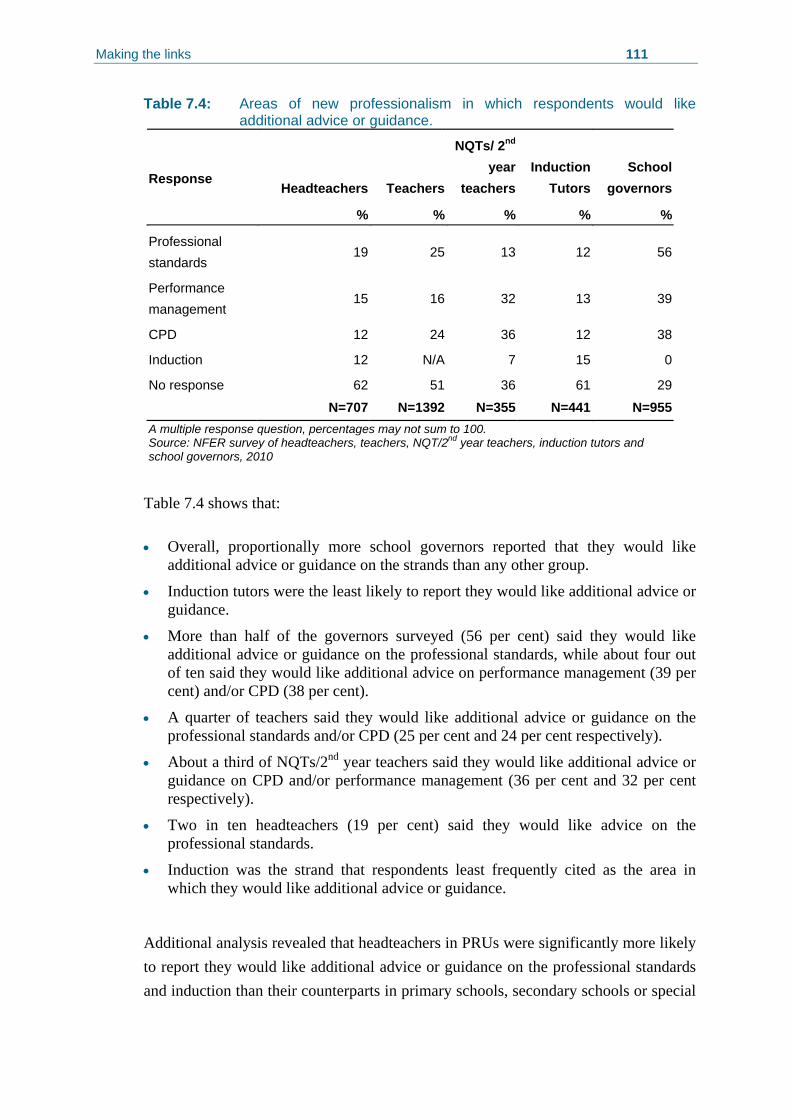
Making the links 111
Table 7.4: Areas of new professionalism in which respondents would like additional advice or guidance.
Headteachers Teachers
NQTs/ 2nd
year teachers
Induction Tutors
School governors
Response
% % % % %
Professional standards
19 25 13 12 56
Performance management
15 16 32 13 39
CPD 12 24 36 12 38
Induction 12 N/A 7 15 0
No response 62 51 36 61 29
N=707 N=1392 N=355 N=441 N=955A multiple response question, percentages may not sum to 100. Source: NFER survey of headteachers, teachers, NQT/2nd year teachers, induction tutors and school governors, 2010
Table 7.4 shows that: • Overall, proportionally more school governors reported that they would like
additional advice or guidance on the strands than any other group.
• Induction tutors were the least likely to report they would like additional advice or guidance.
• More than half of the governors surveyed (56 per cent) said they would like additional advice or guidance on the professional standards, while about four out of ten said they would like additional advice on performance management (39 per cent) and/or CPD (38 per cent).
• A quarter of teachers said they would like additional advice or guidance on the professional standards and/or CPD (25 per cent and 24 per cent respectively).
• About a third of NQTs/2nd year teachers said they would like additional advice or guidance on CPD and/or performance management (36 per cent and 32 per cent respectively).
• Two in ten headteachers (19 per cent) said they would like advice on the professional standards.
• Induction was the strand that respondents least frequently cited as the area in which they would like additional advice or guidance.
Additional analysis revealed that headteachers in PRUs were significantly more likely to report they would like additional advice or guidance on the professional standards and induction than their counterparts in primary schools, secondary schools or special
Making the links 112
schools. A full breakdown of the responses to this question can be found in Appendix B, Table B5.11. LA staff were asked the same question. The single highest valid response was professional standards (25 out of 57), followed by CPD (n=15), performance management (n=14) and induction (n=11). Almost a third of LA respondents (n=22) gave no response (see Table B5.12). Where applicable, respondents were asked to give details about the additional advice or guidance they would like. Responses were received from 92 per cent of school governors (n=878), 80 per cent of induction tutors (n=355), 77 per cent of NQTs/2nd year teachers (n=275), 13 per cent of headteachers (n=92), and 12 per cent of teachers (n=170). Across most groups, the guidance requested related to how the four areas of new professionalism (professional standards, performance management, CPD and induction) could be effectively linked together. Some respondents suggested that case study examples would be helpful, while others suggested coaching/mentoring or external training would be the best way to do this. There were also role-related guidance requests. For example, some headteachers (n=10) suggested that advice on managing threshold applications would be helpful, while some teachers reported they would like more information on how the professional standards could be used (n=19), and guidance on which standards should be met at each career stage (n=16). A small number of induction tutors (n=4) reported they would like advice on how to provide performance management to employees, while some NQTs/2nd year teachers reported they would like more guidance on performance management processes and/or information on training courses available in their area (n=10). School governors identified a wide range of areas in which they would like additional guidance, including some form of overview document on the implications of new professionalism for governors (n=33). Thirty of the 57 LA officers gave at least one suggestion for additional advice or guidance they would like. Many of these comments related to the professional standards, including: being kept up-to-date with new developments/changes in the professional standards (n=5); and being provided with examples of good practice in the use of professional standards (n=3) (see Tables B5.13-B.5.17).
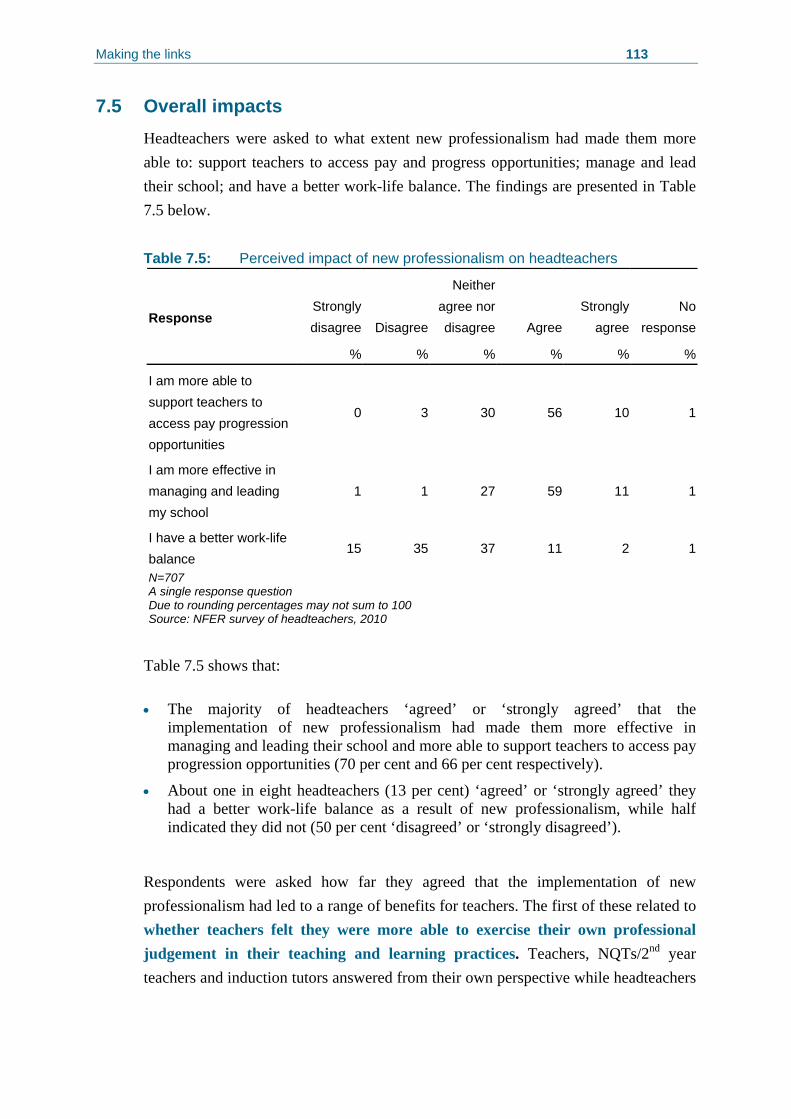
Making the links 113
7.5 Overall impacts Headteachers were asked to what extent new professionalism had made them more able to: support teachers to access pay and progress opportunities; manage and lead their school; and have a better work-life balance. The findings are presented in Table 7.5 below. Table 7.5: Perceived impact of new professionalism on headteachers
Strongly disagree Disagree
Neither agree nor disagree Agree
Strongly agree
No response
Response
% % % % % %
I am more able to support teachers to access pay progression opportunities
0 3 30 56 10 1
I am more effective in managing and leading my school
1 1 27 59 11 1
I have a better work-life balance
15 35 37 11 2 1
N=707 A single response question Due to rounding percentages may not sum to 100 Source: NFER survey of headteachers, 2010
Table 7.5 shows that: • The majority of headteachers ‘agreed’ or ‘strongly agreed’ that the
implementation of new professionalism had made them more effective in managing and leading their school and more able to support teachers to access pay progression opportunities (70 per cent and 66 per cent respectively).
• About one in eight headteachers (13 per cent) ‘agreed’ or ‘strongly agreed’ they had a better work-life balance as a result of new professionalism, while half indicated they did not (50 per cent ‘disagreed’ or ‘strongly disagreed’).
Respondents were asked how far they agreed that the implementation of new professionalism had led to a range of benefits for teachers. The first of these related to whether teachers felt they were more able to exercise their own professional judgement in their teaching and learning practices. Teachers, NQTs/2nd year teachers and induction tutors answered from their own perspective while headteachers
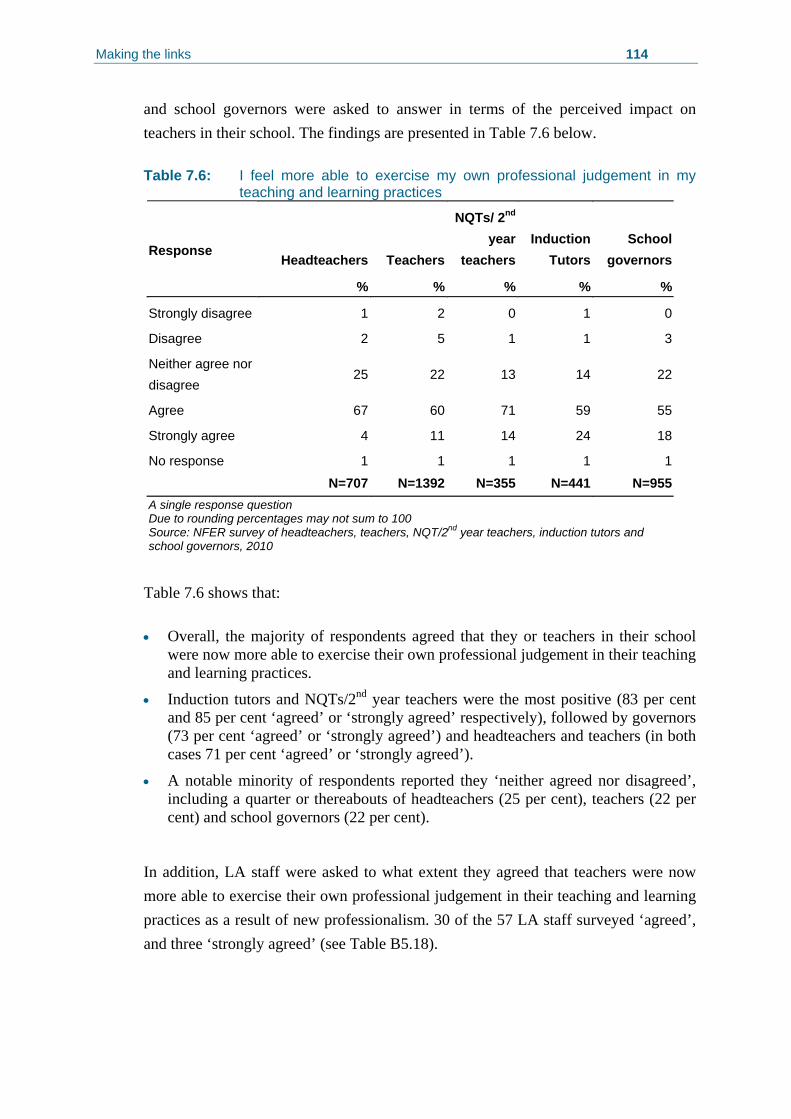
Making the links 114
and school governors were asked to answer in terms of the perceived impact on teachers in their school. The findings are presented in Table 7.6 below. Table 7.6: I feel more able to exercise my own professional judgement in my
teaching and learning practices
Headteachers Teachers
NQTs/ 2nd
year teachers
Induction Tutors
School governors
Response
% % % % %
Strongly disagree 1 2 0 1 0
Disagree 2 5 1 1 3
Neither agree nor disagree
25 22 13 14 22
Agree 67 60 71 59 55
Strongly agree 4 11 14 24 18
No response 1 1 1 1 1
N=707 N=1392 N=355 N=441 N=955A single response question Due to rounding percentages may not sum to 100 Source: NFER survey of headteachers, teachers, NQT/2nd year teachers, induction tutors and school governors, 2010
Table 7.6 shows that: • Overall, the majority of respondents agreed that they or teachers in their school
were now more able to exercise their own professional judgement in their teaching and learning practices.
• Induction tutors and NQTs/2nd year teachers were the most positive (83 per cent and 85 per cent ‘agreed’ or ‘strongly agreed’ respectively), followed by governors (73 per cent ‘agreed’ or ‘strongly agreed’) and headteachers and teachers (in both cases 71 per cent ‘agreed’ or ‘strongly agreed’).
• A notable minority of respondents reported they ‘neither agreed nor disagreed’, including a quarter or thereabouts of headteachers (25 per cent), teachers (22 per cent) and school governors (22 per cent).
In addition, LA staff were asked to what extent they agreed that teachers were now more able to exercise their own professional judgement in their teaching and learning practices as a result of new professionalism. 30 of the 57 LA staff surveyed ‘agreed’, and three ‘strongly agreed’ (see Table B5.18).
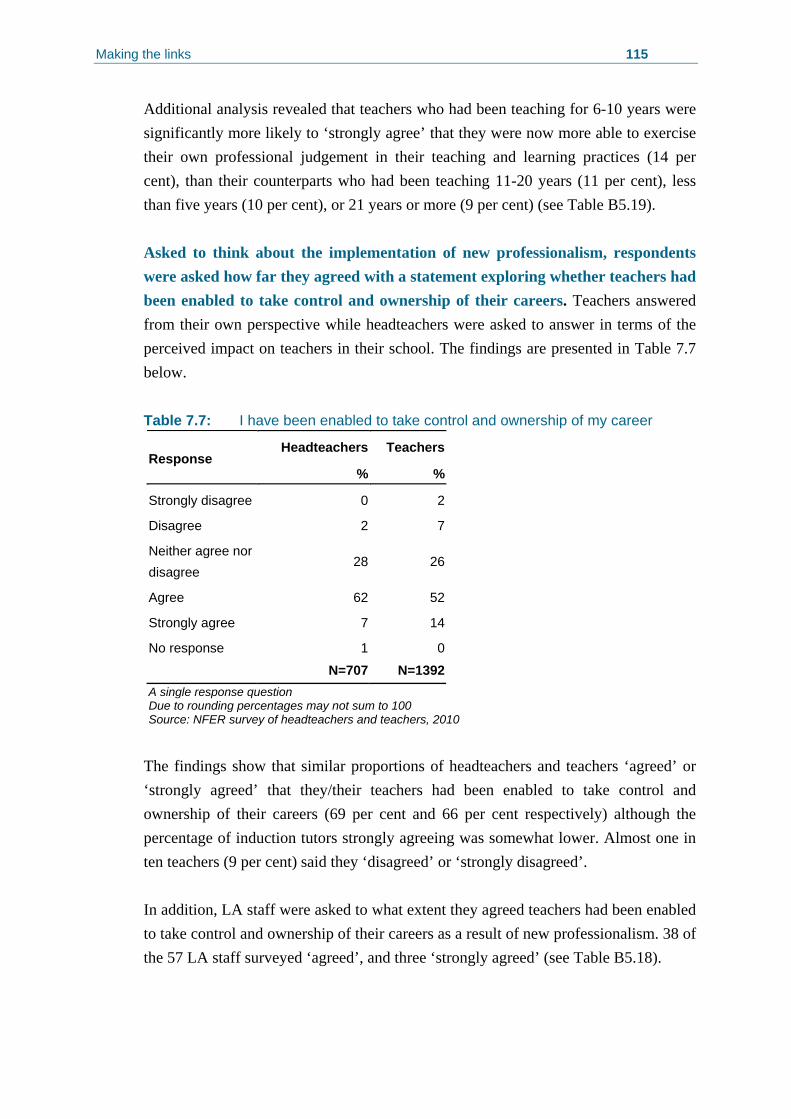
Making the links 115
Additional analysis revealed that teachers who had been teaching for 6-10 years were significantly more likely to ‘strongly agree’ that they were now more able to exercise their own professional judgement in their teaching and learning practices (14 per cent), than their counterparts who had been teaching 11-20 years (11 per cent), less than five years (10 per cent), or 21 years or more (9 per cent) (see Table B5.19). Asked to think about the implementation of new professionalism, respondents were asked how far they agreed with a statement exploring whether teachers had been enabled to take control and ownership of their careers. Teachers answered from their own perspective while headteachers were asked to answer in terms of the perceived impact on teachers in their school. The findings are presented in Table 7.7 below. Table 7.7: I have been enabled to take control and ownership of my career
Headteachers TeachersResponse
% %
Strongly disagree 0 2
Disagree 2 7
Neither agree nor disagree
28 26
Agree 62 52
Strongly agree 7 14
No response 1 0
N=707 N=1392A single response question Due to rounding percentages may not sum to 100 Source: NFER survey of headteachers and teachers, 2010
The findings show that similar proportions of headteachers and teachers ‘agreed’ or ‘strongly agreed’ that they/their teachers had been enabled to take control and ownership of their careers (69 per cent and 66 per cent respectively) although the percentage of induction tutors strongly agreeing was somewhat lower. Almost one in ten teachers (9 per cent) said they ‘disagreed’ or ‘strongly disagreed’. In addition, LA staff were asked to what extent they agreed teachers had been enabled to take control and ownership of their careers as a result of new professionalism. 38 of the 57 LA staff surveyed ‘agreed’, and three ‘strongly agreed’ (see Table B5.18).
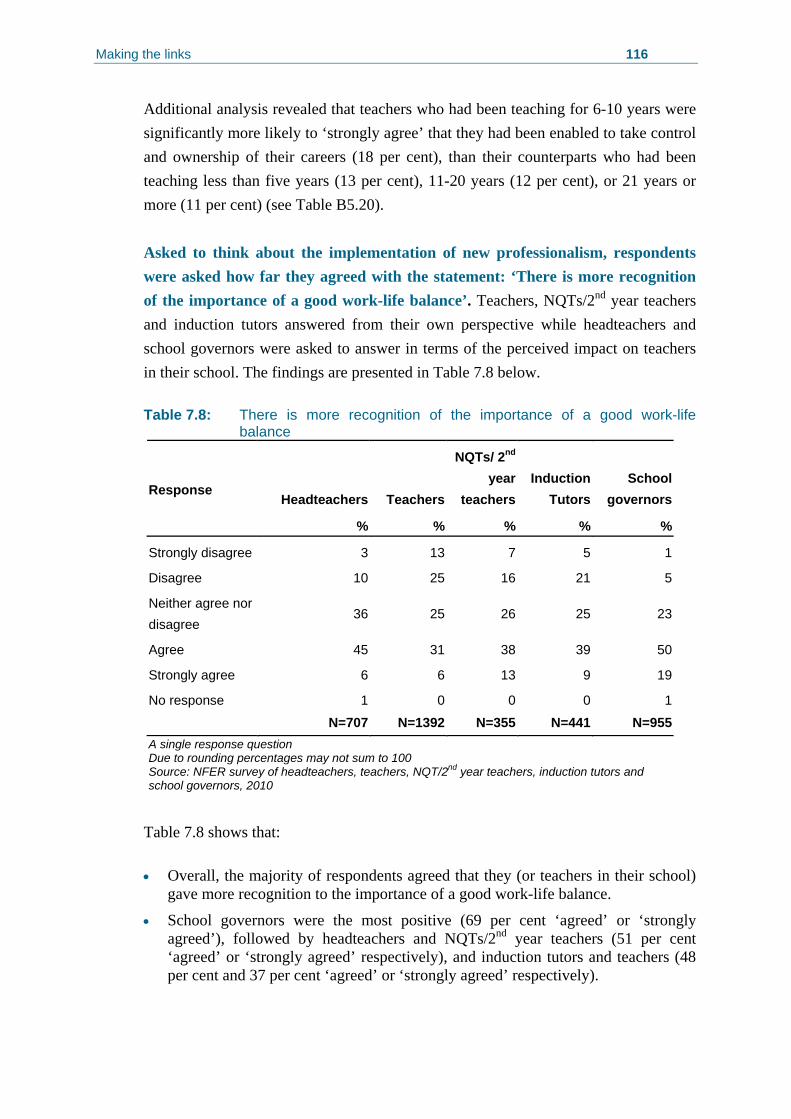
Making the links 116
Additional analysis revealed that teachers who had been teaching for 6-10 years were significantly more likely to ‘strongly agree’ that they had been enabled to take control and ownership of their careers (18 per cent), than their counterparts who had been teaching less than five years (13 per cent), 11-20 years (12 per cent), or 21 years or more (11 per cent) (see Table B5.20). Asked to think about the implementation of new professionalism, respondents were asked how far they agreed with the statement: ‘There is more recognition of the importance of a good work-life balance’. Teachers, NQTs/2nd year teachers and induction tutors answered from their own perspective while headteachers and school governors were asked to answer in terms of the perceived impact on teachers in their school. The findings are presented in Table 7.8 below. Table 7.8: There is more recognition of the importance of a good work-life
balance
Headteachers Teachers
NQTs/ 2nd
year teachers
Induction Tutors
School governors
Response
% % % % %
Strongly disagree 3 13 7 5 1
Disagree 10 25 16 21 5
Neither agree nor disagree
36 25 26 25 23
Agree 45 31 38 39 50
Strongly agree 6 6 13 9 19
No response 1 0 0 0 1
N=707 N=1392 N=355 N=441 N=955A single response question Due to rounding percentages may not sum to 100 Source: NFER survey of headteachers, teachers, NQT/2nd year teachers, induction tutors and school governors, 2010
Table 7.8 shows that: • Overall, the majority of respondents agreed that they (or teachers in their school)
gave more recognition to the importance of a good work-life balance.
• School governors were the most positive (69 per cent ‘agreed’ or ‘strongly agreed’), followed by headteachers and NQTs/2nd year teachers (51 per cent ‘agreed’ or ‘strongly agreed’ respectively), and induction tutors and teachers (48 per cent and 37 per cent ‘agreed’ or ‘strongly agreed’ respectively).
Making the links 117
• A notable minority of respondents reported they ‘neither agreed nor disagreed’, including more than a third of headteachers (36 per cent).
• Almost four out of ten induction tutors (38 per cent) ‘disagreed’ or ‘strongly disagreed’.
In addition, LA staff were asked to what extent they agreed there was more recognition amongst teachers of the importance of a good work-life balance as a result of new professionalism. 34 of the 57 LA staff surveyed ‘agreed’, and six ‘strongly agreed’ (see Table B5.18). Asked to think about the implementation of new professionalism, respondents were asked how far they agreed with a statement exploring whether teachers felt they received the recognition they deserved for the contribution they made to teaching and learning. Teachers, NQTs/2nd year teachers and induction tutors answered from their own perspective while headteachers and school governors were asked to answer in terms of the perceived impact on teachers in their school. The findings are presented in Table 7.9 below.
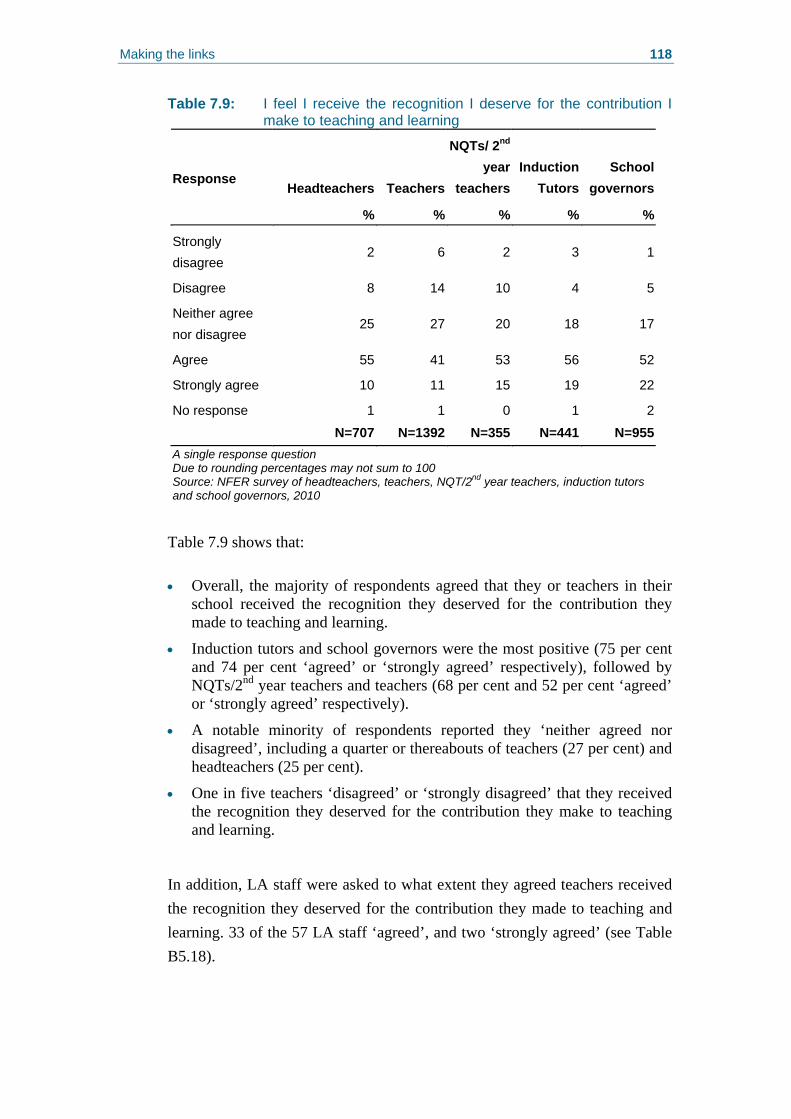
Making the links 118
Table 7.9: I feel I receive the recognition I deserve for the contribution I make to teaching and learning
Headteachers Teachers
NQTs/ 2nd
year teachers
Induction Tutors
School governors
Response
% % % % %
Strongly disagree
2 6 2 3 1
Disagree 8 14 10 4 5
Neither agree nor disagree
25 27 20 18 17
Agree 55 41 53 56 52
Strongly agree 10 11 15 19 22
No response 1 1 0 1 2
N=707 N=1392 N=355 N=441 N=955A single response question Due to rounding percentages may not sum to 100 Source: NFER survey of headteachers, teachers, NQT/2nd year teachers, induction tutors and school governors, 2010
Table 7.9 shows that: • Overall, the majority of respondents agreed that they or teachers in their
school received the recognition they deserved for the contribution they made to teaching and learning.
• Induction tutors and school governors were the most positive (75 per cent and 74 per cent ‘agreed’ or ‘strongly agreed’ respectively), followed by NQTs/2nd year teachers and teachers (68 per cent and 52 per cent ‘agreed’ or ‘strongly agreed’ respectively).
• A notable minority of respondents reported they ‘neither agreed nor disagreed’, including a quarter or thereabouts of teachers (27 per cent) and headteachers (25 per cent).
• One in five teachers ‘disagreed’ or ‘strongly disagreed’ that they received the recognition they deserved for the contribution they make to teaching and learning.
In addition, LA staff were asked to what extent they agreed teachers received the recognition they deserved for the contribution they made to teaching and learning. 33 of the 57 LA staff ‘agreed’, and two ‘strongly agreed’ (see Table B5.18).
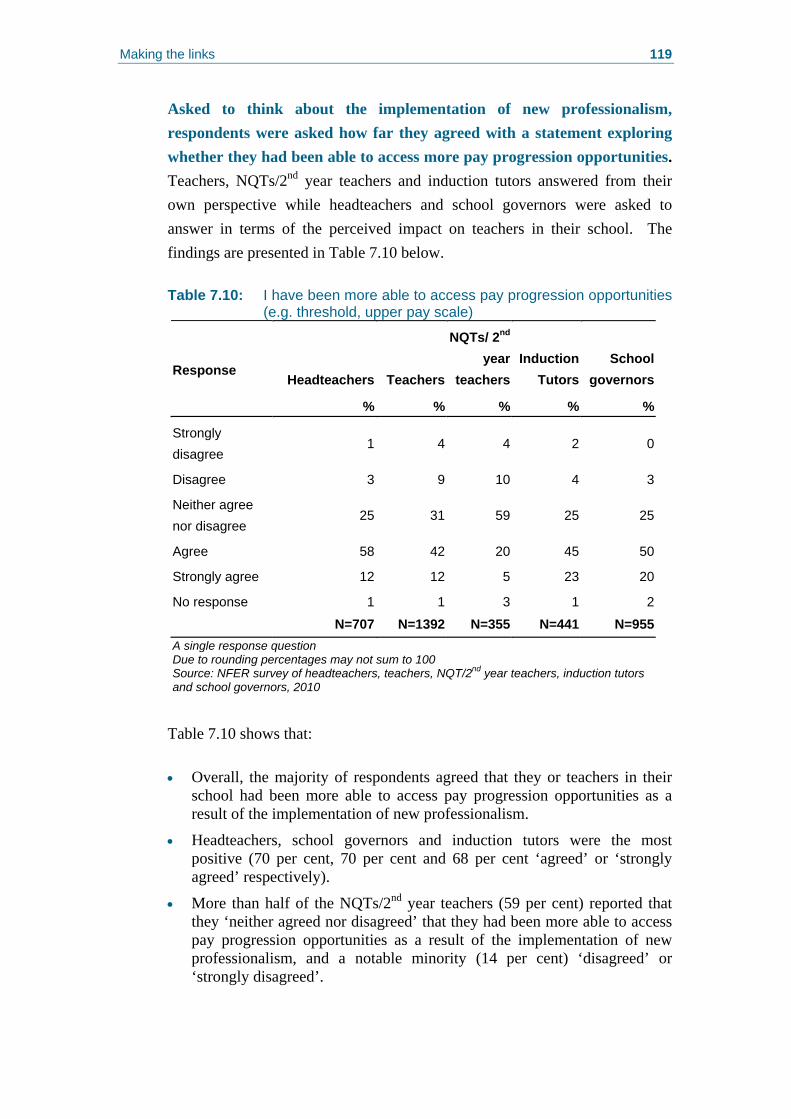
Making the links 119
Asked to think about the implementation of new professionalism, respondents were asked how far they agreed with a statement exploring whether they had been able to access more pay progression opportunities. Teachers, NQTs/2nd year teachers and induction tutors answered from their own perspective while headteachers and school governors were asked to answer in terms of the perceived impact on teachers in their school. The findings are presented in Table 7.10 below. Table 7.10: I have been more able to access pay progression opportunities
(e.g. threshold, upper pay scale)
Headteachers Teachers
NQTs/ 2nd
year teachers
Induction Tutors
School governors
Response
% % % % %
Strongly disagree
1 4 4 2 0
Disagree 3 9 10 4 3
Neither agree nor disagree
25 31 59 25 25
Agree 58 42 20 45 50
Strongly agree 12 12 5 23 20
No response 1 1 3 1 2
N=707 N=1392 N=355 N=441 N=955A single response question Due to rounding percentages may not sum to 100 Source: NFER survey of headteachers, teachers, NQT/2nd year teachers, induction tutors and school governors, 2010
Table 7.10 shows that: • Overall, the majority of respondents agreed that they or teachers in their
school had been more able to access pay progression opportunities as a result of the implementation of new professionalism.
• Headteachers, school governors and induction tutors were the most positive (70 per cent, 70 per cent and 68 per cent ‘agreed’ or ‘strongly agreed’ respectively).
• More than half of the NQTs/2nd year teachers (59 per cent) reported that they ‘neither agreed nor disagreed’ that they had been more able to access pay progression opportunities as a result of the implementation of new professionalism, and a notable minority (14 per cent) ‘disagreed’ or ‘strongly disagreed’.
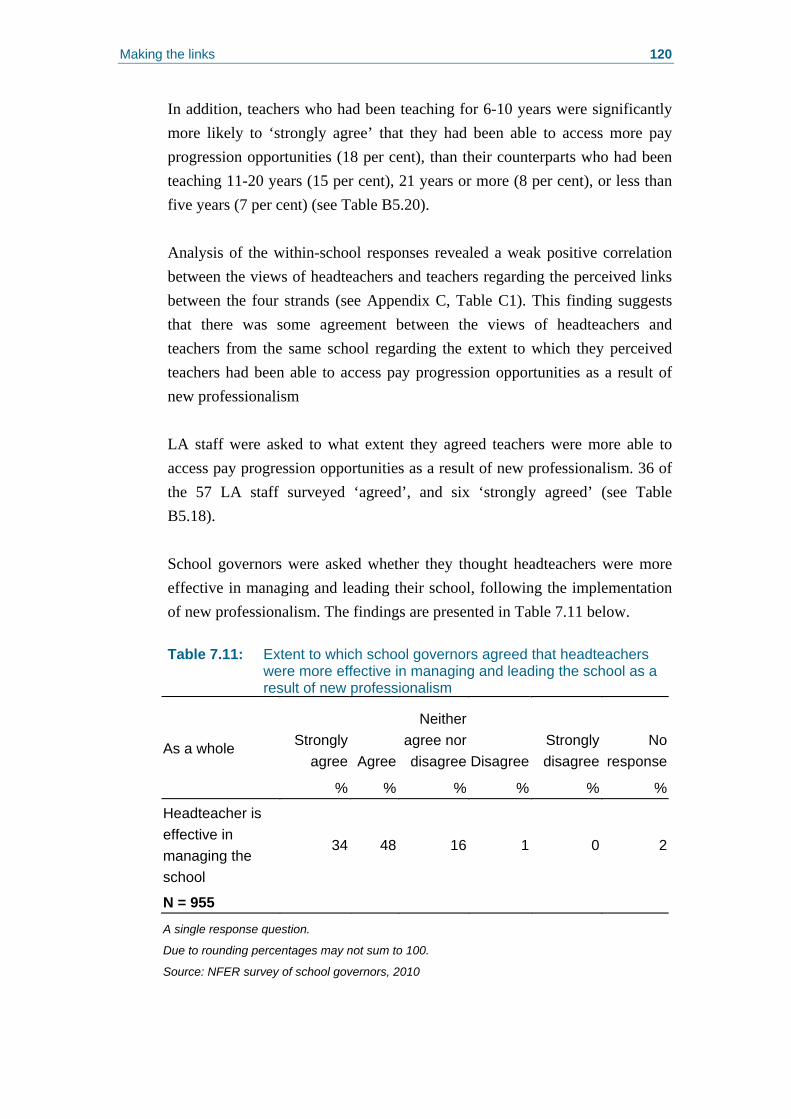
Making the links 120
In addition, teachers who had been teaching for 6-10 years were significantly more likely to ‘strongly agree’ that they had been able to access more pay progression opportunities (18 per cent), than their counterparts who had been teaching 11-20 years (15 per cent), 21 years or more (8 per cent), or less than five years (7 per cent) (see Table B5.20). Analysis of the within-school responses revealed a weak positive correlation between the views of headteachers and teachers regarding the perceived links between the four strands (see Appendix C, Table C1). This finding suggests that there was some agreement between the views of headteachers and teachers from the same school regarding the extent to which they perceived teachers had been able to access pay progression opportunities as a result of new professionalism LA staff were asked to what extent they agreed teachers were more able to access pay progression opportunities as a result of new professionalism. 36 of the 57 LA staff surveyed ‘agreed’, and six ‘strongly agreed’ (see Table B5.18). School governors were asked whether they thought headteachers were more effective in managing and leading their school, following the implementation of new professionalism. The findings are presented in Table 7.11 below. Table 7.11: Extent to which school governors agreed that headteachers
were more effective in managing and leading the school as a result of new professionalism
Strongly agree Agree
Neither agree nor disagree Disagree
Strongly disagree
No response
As a whole
% % % % % %
Headteacher is effective in managing the school
34 48 16 1 0 2
N = 955
A single response question.
Due to rounding percentages may not sum to 100.
Source: NFER survey of school governors, 2010
Making the links 121
Table 7.11 shows that: • Almost half of the school governors (48 per cent) ‘agreed’, while more
than a third (34 per cent) ‘strongly agreed’ that their headteacher was more effective in managing and leading the school as a result of new professionalism.
• Approximately one in six (16 per cent) ‘neither agreed nor disagreed’.
LA staff were asked the same question. 38 of the 57 LA staff surveyed ‘agreed’, while six ‘strongly agreed’ (see Tables B5.18). Finally, all six groups of respondents were asked whether they had encountered any other impacts as a result of the new professionalism agenda. In response, a comparatively small proportion of respondents raised a number of issues related to the implementation of new professionalism, or its impact on their work-life balance. For example, a small number of headteachers (two per cent) reported that their workload had increased significantly, and that this had put them under additional stress. Others (one per cent or less) reported that their teaching staff had become more accountable, but that they needed time to fully embed the changes. A small proportion of the surveyed teaching staff (two per cent) reported that new professionalism had had an adverse effect on their work-life balance, and had put them under increased stress. Others (one per cent or less) said they needed more time to familiarise themselves with the new agenda, and particularly with the professional standards. Similarly, a small proportion of NQTs/2nd year teachers (one per cent) said they felt they had insufficient time to engage with the new agenda, while a number of induction tutors reported that their schools had made links between the different strands of new professionalism and that new professionalism had clarified the expectations placed on teachers. One per cent of school governors reported that teachers in their schools had become ‘more accountable’, and that staff morale and confidence had increased. LA staff identified a range of additional impacts including a positive impact on teaching and learning (n=3) and increased networking between schools (n=2) (see Tables B5.22-B5.27).

The New Professionalism Journey 122
8. The New Professionalism Journey
8.1 NFER’s impact model This chapter draws on the NFER impact model (see Figure 8.1 below) to provide some initial insights into the overall journey made by schools. This four stage model of impact suggests different levels of impact over time. Figure 8.1: NFER’s impact model
Institutional/systemic embedding
Changes to outcomes
Changes to routines, experiences, attitudes
Changes to processes/inputs
T i me
Population affected
The model comprises: • Level 1 impacts: Respondents’ experiences of the implementation of the four
strands of new professionalism (the professional standards, performance management, CPD and induction) in their school (e.g. what has been introduced over recent years, what is working well and what have respondents found challenging).
• Level 2 impacts: The difference that new professionalism and its four strands are making to teachers’ and headteachers’ everyday working practices and professional experiences.
• Level 3 impacts: The impact of new professionalism on teaching and learning in the classroom (perceptions).
• Level 4 impacts: How embedded the strands of new professionalism and the links between the strands are in schools (perceptions and other evidence).
The New Professionalism Journey 123
8.2 Level 1 impacts (awareness of new professionalism and experiences of implementation) Overall, the survey data suggests that schools are implementing the four strands of new professionalism, and that this is making a difference to aspects of teachers’ and headteachers’ working practices. For example, staff at all levels reported they were familiar with the professional standards – most ‘to a great extent’. Similarly, most headteachers and governors reported they were aware of the revised performance management regulations and associated national guidance for teachers and headteachers, while most teachers, NQTs/2nd year teachers, and induction tutors reported being familiar with the performance management policy in their school. In addition, the majority of respondents reported that their schools enabled teachers to access relevant CPD opportunities and most headteachers reported they were aware of the revised induction arrangements, and that their schools’ induction arrangements took account of the 2008 revisions.
8.3 Level 2 impacts (changes to professionals’ experience and attitudes) Overall, the majority of respondents reported that each of the four strands had led to improvements in teachers’ teaching and learning practices. Specifically, more than half of the teachers, and about six out of ten headteachers ‘agreed’ or ‘strongly agreed’ that the professional standards have helped to improve teaching and learning practices, while about nine out of ten headteachers and eight out of ten teachers ‘agreed’ or ‘strongly agreed’ that teachers’ experiences of CPD had helped improve teaching and learning practices. Moreover, about nine out of ten headteachers, NQTs/2nd year teachers and induction tutors ‘agreed’ or ‘strongly agreed’ that their school’s current induction arrangements had helped NQTs to improve their teaching and learning practices. In addition, about nine out of ten headteachers and seven out of ten teachers ‘agreed’ or ‘strongly agreed’ that their school’s performance management arrangements also helped to improve teaching and learning practices. However, a substantial proportion of respondents indicated that new professionalism was not making a positive difference to their work-life balance. For example, half of the headteachers surveyed indicated they did not have a better work-life balance as a result of new professionalism. Moreover,
The New Professionalism Journey 124
about four in ten teachers, a quarter of NQTs/2nd year teachers and induction tutors, and about one in ten headteachers and governors ‘disagreed’ or ‘strongly disagreed’ that new professionalism had led to greater recognition of the importance of a good work-life balance. Indeed, a very small minority of respondents (two per cent) reported that their workload had increased significantly as a result of new professionalism, and that this had put them under additional stress.
The survey results suggest that schools’ journeys through Levels 1 and 2 of the impact model could be enhanced through further guidance and support, with more than one in ten respondents reporting they would like additional advice or guidance on one or more of the four strands. For example, more than half of the governors surveyed said they would like additional advice or guidance on the professional standards, while a quarter of teachers said they would like additional advice or guidance on the professional standards and/or CPD. Where applicable, respondents were asked to give details about the additional advice or guidance they would like. Across most groups, this related to how the four areas of new professionalism (professional standards, performance management, CPD and induction) could be effectively linked together. Some respondents suggested that case study examples would be helpful, while others suggested coaching/mentoring or external training would be the best way to do this
8.4 Level 3 impacts (outcomes for children and young people) Perceptions of Level 3 impacts were also revealed through the survey, with many respondents reporting impacts on pupils’ outcomes/progress. The professional standards, schools’ performance management and induction arrangements, and respondents’ experiences of CPD were all perceived as contributing to improving pupils’ progress.
8.5 Level 4 impacts (embedding) The surveys did not explicitly explore how embedded the four strands and the links between the strands were in schools. However, while no quantifiable evidence of impact (e.g. on pupil attainment and school improvement) was collected, there is emerging evidence to suggest that some of the perceived
The New Professionalism Journey 125
impacts could be becoming embedded. For example, the majority of staff at all levels reported that their schools were making links between the strands, at least ‘to a small extent’. The majority of headteachers reported that they had been able to link together the four strands to smooth the transition from induction to early career teaching, to support teachers in developing their performance, and to inform school improvement planning, at least ‘to a small extent’. In addition, eight out of ten headteachers felt that their School Development Plan and/or Self Evaluation Form enabled them to identify the links between the professional standards, induction, performance management arrangements and CPD ‘to some extent’ or ‘to a great extent’. Further evidence of Level 4 impacts could be explored through case-study visits to schools and analysis of performance data.
8.6 The strands compared The survey data also allows us to draw out some emerging insights into the differences between the strands and the overall journey made by schools into embracing the new professionalism agenda. A summary of the model for each of the four strands is presented in Figure 8.2 below.
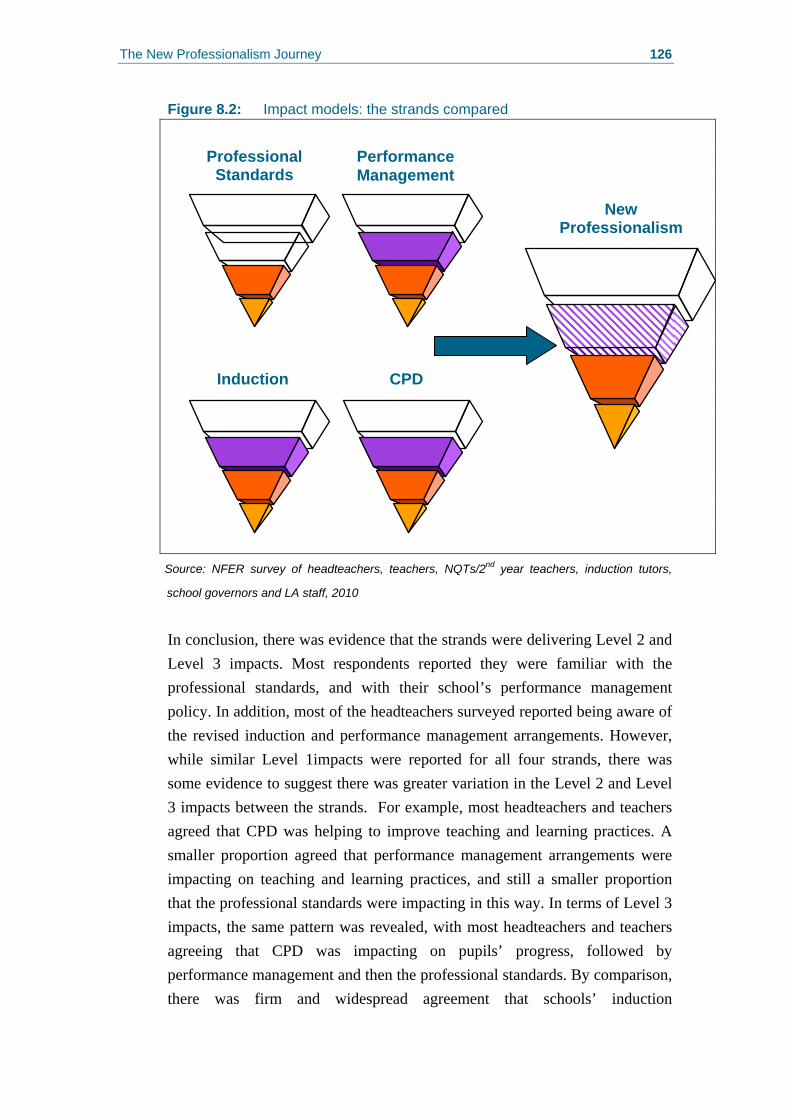
The New Professionalism Journey 126
Figure 8.2: Impact models: the strands compared
Professional Standards
Performance Management
Induction CPD
New Professionalism
Source: NFER survey of headteachers, teachers, NQTs/2nd year teachers, induction tutors,
school governors and LA staff, 2010
In conclusion, there was evidence that the strands were delivering Level 2 and Level 3 impacts. Most respondents reported they were familiar with the professional standards, and with their school’s performance management policy. In addition, most of the headteachers surveyed reported being aware of the revised induction and performance management arrangements. However, while similar Level 1impacts were reported for all four strands, there was some evidence to suggest there was greater variation in the Level 2 and Level 3 impacts between the strands. For example, most headteachers and teachers agreed that CPD was helping to improve teaching and learning practices. A smaller proportion agreed that performance management arrangements were impacting on teaching and learning practices, and still a smaller proportion that the professional standards were impacting in this way. In terms of Level 3 impacts, the same pattern was revealed, with most headteachers and teachers agreeing that CPD was impacting on pupils’ progress, followed by performance management and then the professional standards. By comparison, there was firm and widespread agreement that schools’ induction

The New Professionalism Journey 127
arrangements were helping NQTs to improve their teaching and learning practices and their pupils’ progress. Overall, CPD, performance management and induction were perceived to be having a greater impact on teaching and learning in the classroom than the professional standards. Unfortunately, there is insufficient evidence to draw any conclusions regarding Level 4 impacts, or to draw out any differences between the strands in this respect.
Conclusion 128
9. Conclusion The overarching aim of the research was to establish how and to what extent schools had implemented new professionalism, and to explore the impacts of new professionalism on teaching and learning in schools. The findings were based on the perceptions of headteachers, teachers, NQTs/2nd year teachers, induction tutors, LA staff and school governors and collected from self-completed questionnaires. This chapter provides some key messages regarding: the perceived positives or benefits of new professionalism for staff working practices; the impact of new professionalism on teaching and learning in schools; and the variations in reported practice and impact of new professionalism across different settings and teacher types. Key message: the perceived positives or benefits of new professionalism for staff working practices Overall, most schools reported that they are implementing the four strands of new professionalism, and that this is making a difference to aspects of teachers’ and headteachers’ working practices and experiences. The majority of respondents reported being familiar with the four strands, and many reported using them in their practice. However, a notable proportion of respondents reported that new professionalism had not led to a greater recognition of the importance of a good work-life balance, and a small minority (about 2 per cent) reported that it had added to their workload. Many respondents reported using the professional standards to help identify their professional development needs and to inform their performance management discussions. Respondents generally felt confident in participating in their school’s performance management processes, and many reported that performance management was supporting the development of their professional practice. Headteachers, NQTs/2nd year teachers and induction tutors reported that their school’s current induction arrangements were providing NQTs with the statutory reduction in their teaching timetable, and the majority reported that their schools’ current induction arrangements were tailored to NQTs’ individual needs. Similarly, the majority of respondents felt they were being provided with relevant CPD opportunities, and that their professional development needs were being met.
Conclusion 129
A substantial proportion of respondents indicated that new professionalism was not making a positive difference to their work-life balance. For example, half of the headteachers surveyed indicated they did not have a better work-life balance as a result of new professionalism. Moreover, about four in ten teachers, a quarter of NQTs/2nd year teachers and induction tutors, and about one in ten headteachers and governors ‘disagreed’ or ‘strongly disagreed’ that new professionalism had led to greater recognition of the importance of a good work-life balance. Indeed, a small minority of respondents (about 2 per cent) reported that their workload had increased significantly as a result of new professionalism, and that this had put them under additional stress. Key message: the impact of new professionalism on teaching and learning in schools The majority of respondents reported that each of the four strands (professional standards, performance management, CPD and NQT induction) had helped to improve teaching and learning practices in their school. However, some of the strands were perceived to be having more of an impact than others. For example, while most headteachers and teachers agreed that CPD was helping in this regard (94 per cent and 76 per cent ‘agreed’ or ‘strongly agreed’ respectively), a smaller proportion agreed that performance management arrangements were impacting on teaching and learning practices (86 per cent and 68 per cent ‘agreed’ or ‘strongly agreed’ respectively), and a smaller proportion still that the professional standards were impacting in this way (65 per cent and 53 per cent ‘agreed’ or ‘strongly agreed’ respectively). By contrast, there was firm and widespread agreement that schools’ induction arrangements were helping NQTs to improve their teaching and learning practices (97 per cent of headteachers and 91 per cent of NQTs/2nd year teachers ‘agreed’ or ‘strongly agreed’). The same pattern was observed in terms of the perceived impact of the four strands on pupils’ progress. Overall, CPD, performance management and induction were perceived to be having a greater impact on teaching and learning in the classroom than the professional standards.
Conclusion 130
Key message: the variations in reported practice and impact of new professionalism across different settings and teacher types In the context of comparatively high levels of awareness and impact across all respondent groups, induction tutors and headteachers were generally the most positive groups of respondents in terms of their awareness of the four strands and the usefulness and impact they perceived them as having. By contrast, teachers (main scale and above) were consistently amongst the least positive groups of respondents in terms of reported changes to practice and the perceived impacts of new professionalism. Across settings, the picture was mixed. Headteachers and teachers from secondary schools and PRUs were consistently identified as being statistically more likely to identify impacts ‘to a great extent’ than their counterparts in primary and special schools. However, respondents from PRUs were also amongst the least likely to identify impacts resulting from new professionalism (i.e. their responses tended to take the two extremes). Across respondent groups, headteachers and induction tutors were more likely than teachers and NQTs/2nd year teachers to report: being familiar with the professional standards; that teachers were able to access relevant CPD opportunities; that teachers’ CPD needs were being met; and that their schools had made links between the strands. Overall, teachers were least likely to report: being familiar with the professional standards; using the standards to identify their CPD needs; being more able to exercise their own professional judgement in their teaching and learning practices; and that there was now more recognition of the importance of a good work-life balance as a result of new professionalism. However, these findings should be viewed in the context of comparatively high levels of awareness and impact. Compared to their counterparts in other schools, respondents from secondary schools were, inter alia, more likely to report the following: being familiar with the professional standards; using the professional standards to inform their performance management discussions; referring to documentary guidance to support their linking of the strands; and linking the four strands to smooth the transition from induction to early career teaching and to support teachers to develop their performance. By contrast, respondents from PRUs were least likely to report: using the professional standards to inform their
Conclusion 131
performance management discussions; being aware of the revised induction arrangements; that their induction arrangements take account of the 2008 revisions; and that CPD had provided teachers with career progression opportunities. In addition, staff from PRUs were more likely to report that they would like additional advice or guidance on the professional standards and induction. There were also some interesting differences between primary and secondary teachers’ experiences of performance management. For example, secondary school teachers were more likely to report receiving one hour of classroom observation and much less likely to report receiving three hours. They were also less likely to report that their objectives addressed their own development needs as well as school priorities, or to agree that their experience of performance management had helped them to contribute to whole-school improvement. It is possible that these findings are linked. For example, a line manager who observes a teacher for three hours may have a better idea of their development needs than one who observes for only one hour (although observation is just one source of information about a teacher’s development needs). Where line managers understand their teachers’ needs better, it is possible they will be better placed to agree performance management objectives that address them. If development needs are addressed, the performance management system is more likely to contribute to whole-school improvement. Overall, the survey data suggests that schools are implementing the four strands of new professionalism, and that this is making a difference to aspects of teachers’ and headteachers’ working practices. Awareness of the four strands was high, and the majority of respondents reported that each of the four strands had led to improvements in teaching and learning practices. The professional standards, schools’ performance management and induction arrangements, and respondents’ experiences of CPD were all perceived as contributing to improving pupils’ progress, albeit to varying degrees.
References 132
References Ashby, P., Hobson, A.J., Tracey, L., Malderez, A., Tomlinson, P. Ashby, P., Hobson, A.J., Tracey, L., Malderez, A., Tomlinson, P.D., Roper, T., Chambers, G.N., Healy, J. (2008). Beginner Teachers’ Experiences of Initial Teacher Preparation, Induction and Early Professional Development: A review of literature. DCSF, GTC and TDA. DCSF Research Report No. RW076. Available online: http://publications.dcsf.gov.uk/eOrderingDownload/DCSF-RW076.pdf [3rd April 2009]. Bubb, S. and Earley, P. (2008). From self-evaluation to school improvement: the importance of effective staff development. Reading: CfBT Education Trust. Bubb, S., Earley, P. and Hempel-Jorgensen, A. (2008). Staff Development Outcomes Study (Institute of Education). Available online at: www.tda.gov.uk/upload/resources/pdf/s/staff_development_outcomes_study.pdf Coldwell, M., Simkins, T., Coldron, J. and Smith, R., with Aspinwall, K., Close, P., Elliot, N., Garrett, V., Maxwell, B., Wainwright, J., Willis, B. and Wolstenholme, C.. (2008). Developing the whole school workforce: An evaluation of the Testbed programme. Sheffield Hallam University. Available online at: www.tda.gov.uk/upload/resources/pdf/t/testbedsfinalreportandappendixfeb08.pdf Dymoke, S. and Harrison, J.K. (2006). ‘Professional development and the beginning teacher: issues of teacher autonomy and institutional conformity in the performance review process’, Journal of Education for Teaching, 32, 1, 71-92. General Teaching Council for England (GTC) (2009). Accountability in Teaching – Key messages from two research studies. Available online: http://www.gtce.org.uk/documents/publicationpdfs/accountability_findings0909.pdf [12 August 2010] Hobson, A.J, Malderez, A.,Tracey, L., Homer, M., Mitchell, N., Biddulph, M., Giannakaki, M.S, Rose, A., Pell, R.G., Roper, T., Chambers, G.N., & Tomlinson, P.D (2007). Newly Qualified Teachers’ Experiences of their First Year of Teaching: Findings from Phase III of the Becoming a Teacher Project. London: DCSF Hobson, A.J., Malderez, A., Tracey, L., Homer, M.S., Tomlinson, P.D., Ashby, P., Mitchell, N., McIntyre, J, Cooper, D., Roper, T., Chambers, G.N., Tomlinson, P.D. (2009). Becoming a Teacher: Teachers’ Experiences of Initial Teacher Training, Induction and Early Professional Development: Research Report. DCSF Research Report No. RR115. Available online:
References 133
http://www.dcsf.gov.uk/research/data/uploadfiles/DCSF-RR115.pdf [19 October 2009]. House of Commons Committee on Children, Schools and Families (2010). Training of teachers (HC 275-I). London: The Stationery Office. Ofsted (2006). The logical chain: continuing professional development in effective schools. HMI 2639. Available online: http://www.ofsted.gov.uk/Ofsted-home/Publications-and-research/Browse-all-by/Education/Leadership/Management/The-logical-chain-continuing-professional-development-in-effective-schools [12 August 2010] Ofsted (2010a). Good professional development in schools. How does leadership contribute? HMI 080254. Available online: http://www.ofsted.gov.uk/Ofsted-home/Publications-and-research/Browse-all-by/Documents-by-type/Thematic-reports/Good-professional-development-in-schools [12 August 2010] Ofsted (2010b). Workforce reform in schools: has it made a difference? An evaluation of changes made to the school workforce 2003-2009. HMI 080263. Available online: http://www.ofsted.gov.uk/Ofsted-home/Publications-and-research/Browse-all-by/Documents-by-type/Thematic-reports/Workforce-reform-in-schools-has-it-made-a-difference [12 August 2010] Pedder, D., Storey, A., Opfer, V. (2008). Schools and continuing professional development (CPD) in England – State of the Nation research project. Cambridge University, Open University and TDA. Springate, I., Bramley, G., Flack, J., Hart, R., Kinder, K., Akram, S. and Scott, E. (2009). Research into early career teachers’ professional development. Slough: NFER. Available online at: http://www.tda.gov.uk/upload/resources/pdf/e/earlycpd_execsummary.pdf Storey, A. (2009). ‘How fares the New Professionalism in schools? Findings from the State of the Nation project’, Curriculum Journal, 20, 2, 121-138.
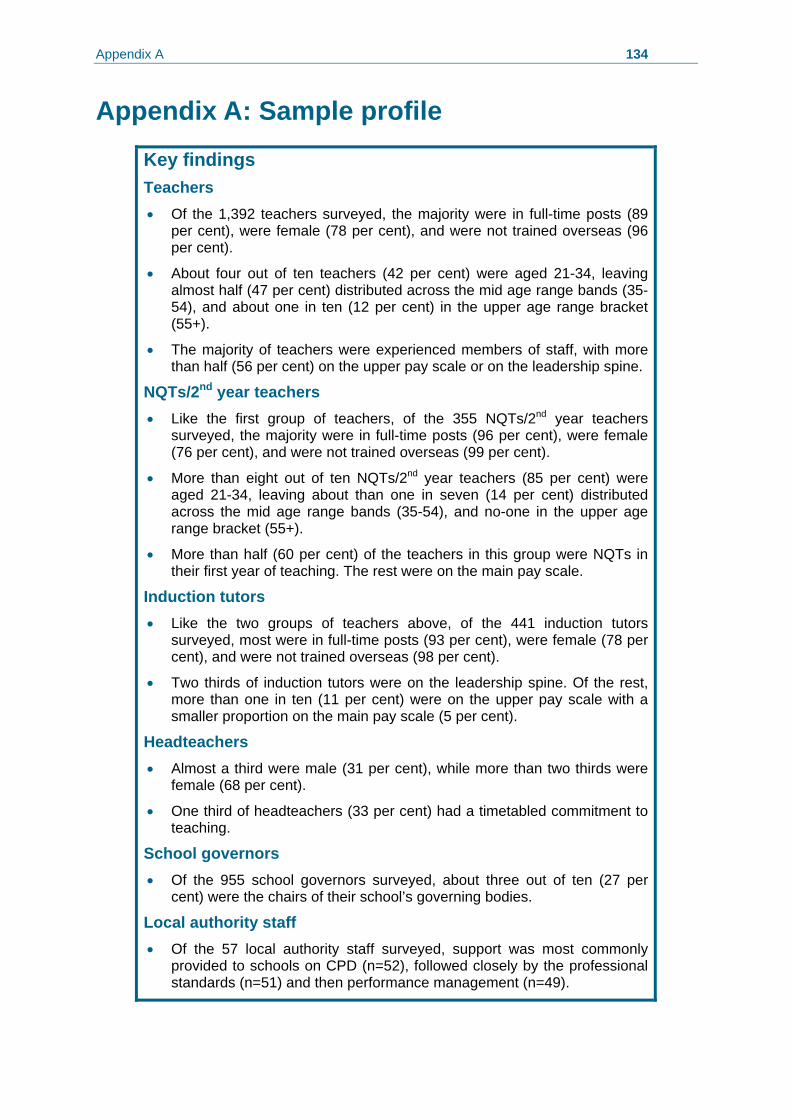
Appendix A 134
Appendix A: Sample profile
Key findings Teachers • Of the 1,392 teachers surveyed, the majority were in full-time posts (89
per cent), were female (78 per cent), and were not trained overseas (96 per cent).
• About four out of ten teachers (42 per cent) were aged 21-34, leaving almost half (47 per cent) distributed across the mid age range bands (35-54), and about one in ten (12 per cent) in the upper age range bracket (55+).
• The majority of teachers were experienced members of staff, with more than half (56 per cent) on the upper pay scale or on the leadership spine.
NQTs/2nd year teachers • Like the first group of teachers, of the 355 NQTs/2nd year teachers
surveyed, the majority were in full-time posts (96 per cent), were female (76 per cent), and were not trained overseas (99 per cent).
• More than eight out of ten NQTs/2nd year teachers (85 per cent) were aged 21-34, leaving about than one in seven (14 per cent) distributed across the mid age range bands (35-54), and no-one in the upper age range bracket (55+).
• More than half (60 per cent) of the teachers in this group were NQTs in their first year of teaching. The rest were on the main pay scale.
Induction tutors • Like the two groups of teachers above, of the 441 induction tutors
surveyed, most were in full-time posts (93 per cent), were female (78 per cent), and were not trained overseas (98 per cent).
• Two thirds of induction tutors were on the leadership spine. Of the rest, more than one in ten (11 per cent) were on the upper pay scale with a smaller proportion on the main pay scale (5 per cent).
Headteachers • Almost a third were male (31 per cent), while more than two thirds were
female (68 per cent).
• One third of headteachers (33 per cent) had a timetabled commitment to teaching.
School governors • Of the 955 school governors surveyed, about three out of ten (27 per
cent) were the chairs of their school’s governing bodies.
Local authority staff • Of the 57 local authority staff surveyed, support was most commonly
provided to schools on CPD (n=52), followed closely by the professional standards (n=51) and then performance management (n=49).
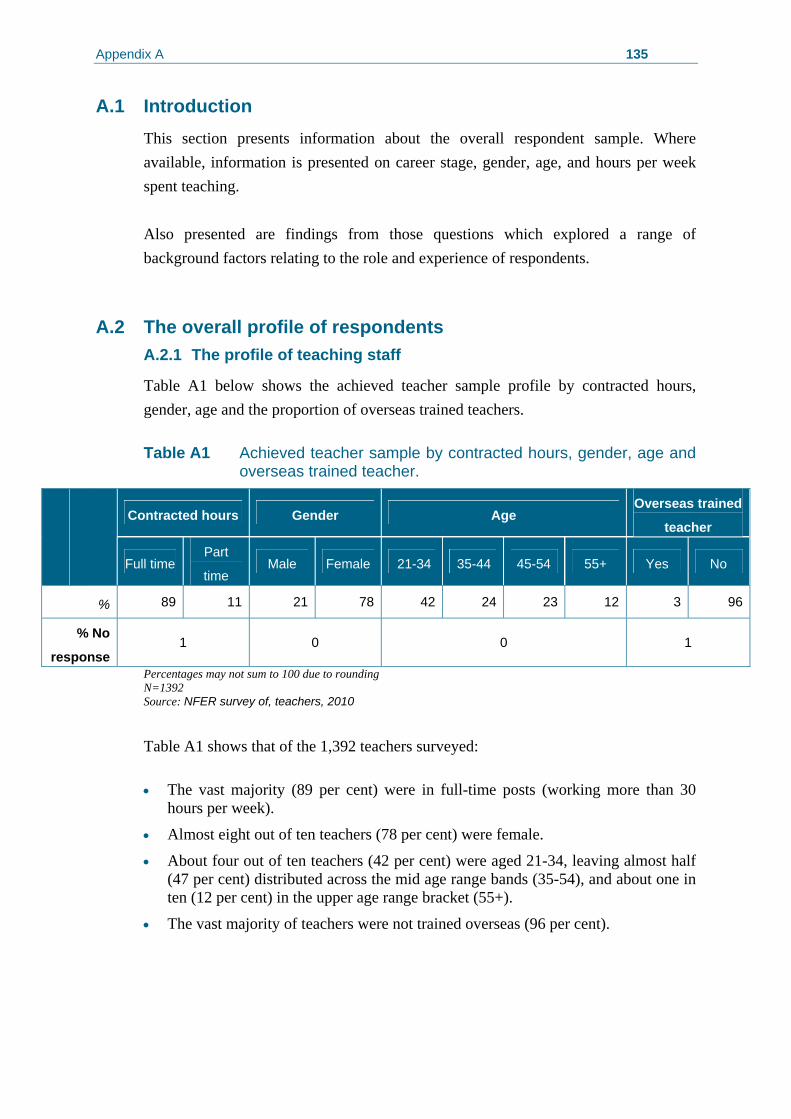
Appendix A 135
A.1 Introduction This section presents information about the overall respondent sample. Where available, information is presented on career stage, gender, age, and hours per week spent teaching. Also presented are findings from those questions which explored a range of background factors relating to the role and experience of respondents.
A.2 The overall profile of respondents A.2.1 The profile of teaching staff
Table A1 below shows the achieved teacher sample profile by contracted hours, gender, age and the proportion of overseas trained teachers. Table A1 Achieved teacher sample by contracted hours, gender, age and
overseas trained teacher.
Contracted hours Gender Age Overseas trained
teacher
Full time Part
time Male Female 21-34 35-44 45-54 55+ Yes No
% 89 11 21 78 42 24 23 12 3 96
% No
response 1 0 0 1
Percentages may not sum to 100 due to rounding N=1392
Source: NFER survey of, teachers, 2010
Table A1 shows that of the 1,392 teachers surveyed: • The vast majority (89 per cent) were in full-time posts (working more than 30
hours per week).
• Almost eight out of ten teachers (78 per cent) were female.
• About four out of ten teachers (42 per cent) were aged 21-34, leaving almost half (47 per cent) distributed across the mid age range bands (35-54), and about one in ten (12 per cent) in the upper age range bracket (55+).
• The vast majority of teachers were not trained overseas (96 per cent).
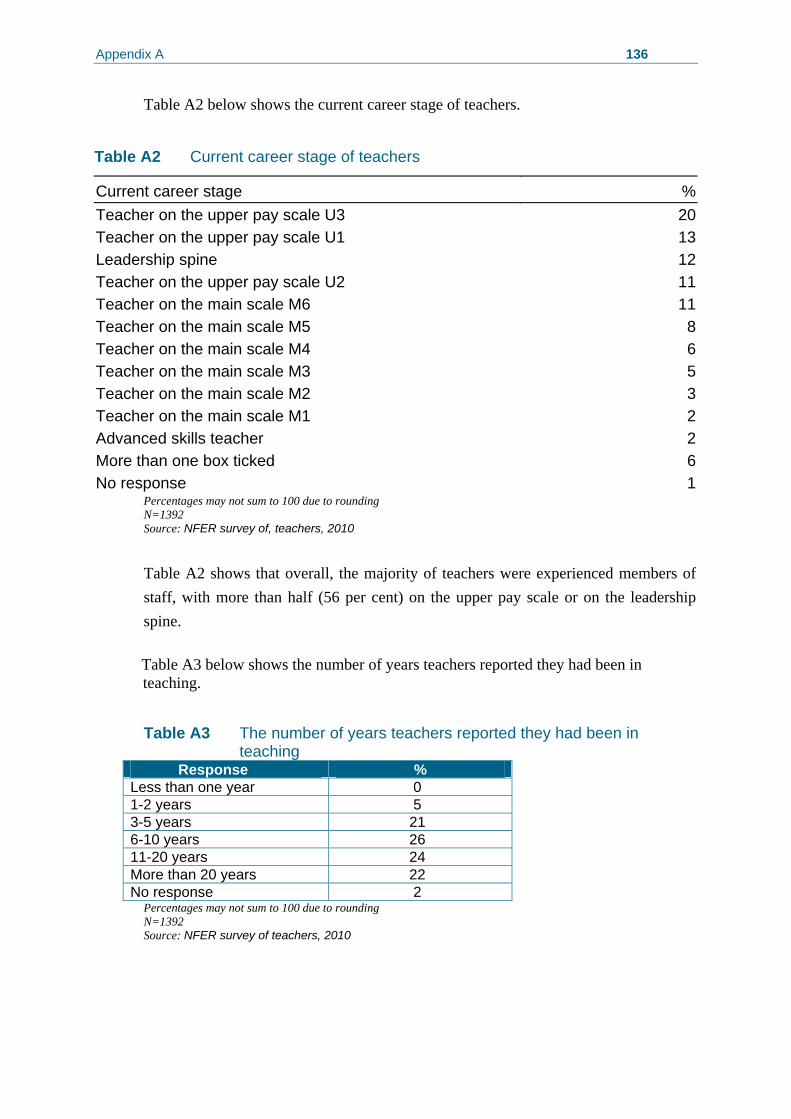
Appendix A 136
Table A2 below shows the current career stage of teachers.
Table A2 Current career stage of teachers
Current career stage %Teacher on the upper pay scale U3 20Teacher on the upper pay scale U1 13Leadership spine 12Teacher on the upper pay scale U2 11Teacher on the main scale M6 11Teacher on the main scale M5 8Teacher on the main scale M4 6Teacher on the main scale M3 5Teacher on the main scale M2 3Teacher on the main scale M1 2Advanced skills teacher 2More than one box ticked 6No response 1
Percentages may not sum to 100 due to rounding N=1392
Source: NFER survey of, teachers, 2010
Table A2 shows that overall, the majority of teachers were experienced members of staff, with more than half (56 per cent) on the upper pay scale or on the leadership spine. Table A3 below shows the number of years teachers reported they had been in teaching.
Table A3 The number of years teachers reported they had been in
teaching Response % Less than one year 0 1-2 years 5 3-5 years 21 6-10 years 26 11-20 years 24 More than 20 years 22 No response 2
Percentages may not sum to 100 due to rounding N=1392
Source: NFER survey of teachers, 2010
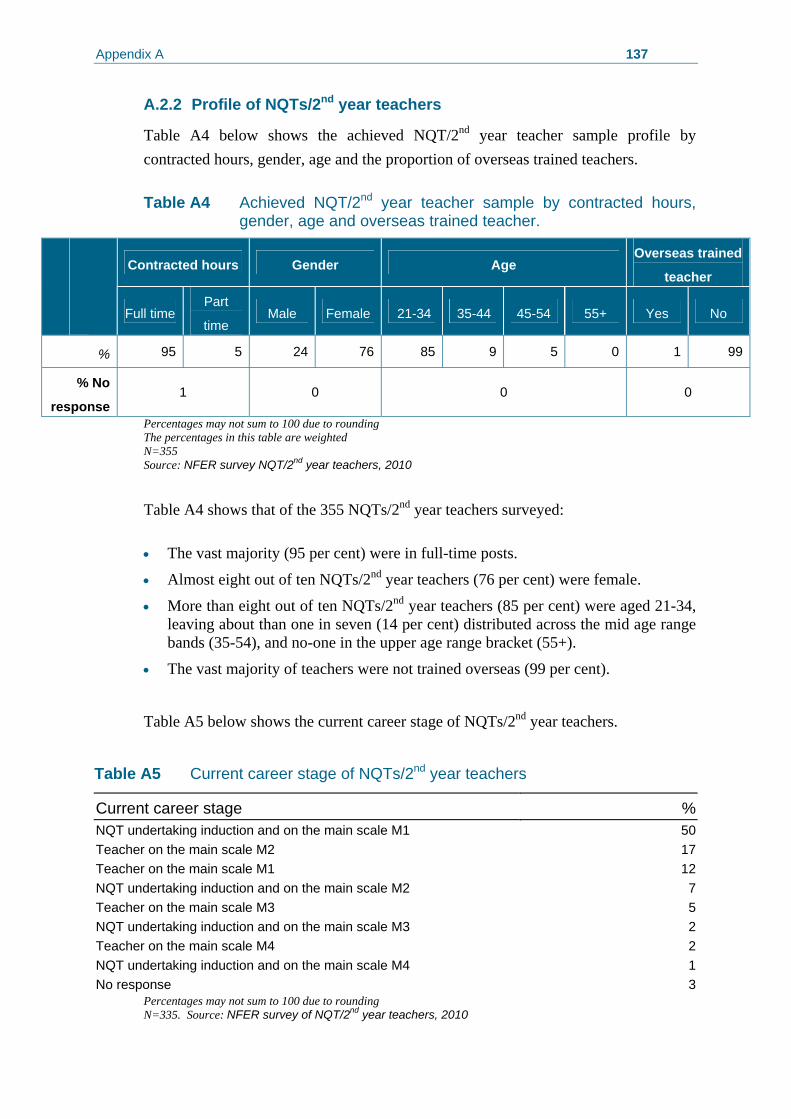
Appendix A 137
A.2.2 Profile of NQTs/2nd year teachers
Table A4 below shows the achieved NQT/2nd year teacher sample profile by contracted hours, gender, age and the proportion of overseas trained teachers. Table A4 Achieved NQT/2nd year teacher sample by contracted hours,
gender, age and overseas trained teacher.
Contracted hours Gender Age Overseas trained
teacher
Full time Part
time Male Female 21-34 35-44 45-54 55+ Yes No
% 95 5 24 76 85 9 5 0 1 99
% No
response 1 0 0 0
Percentages may not sum to 100 due to rounding The percentages in this table are weighted
N=355 Source: NFER survey NQT/2nd year teachers, 2010
Table A4 shows that of the 355 NQTs/2nd year teachers surveyed: • The vast majority (95 per cent) were in full-time posts.
• Almost eight out of ten NQTs/2nd year teachers (76 per cent) were female.
• More than eight out of ten NQTs/2nd year teachers (85 per cent) were aged 21-34, leaving about than one in seven (14 per cent) distributed across the mid age range bands (35-54), and no-one in the upper age range bracket (55+).
• The vast majority of teachers were not trained overseas (99 per cent).
Table A5 below shows the current career stage of NQTs/2nd year teachers.
Table A5 Current career stage of NQTs/2nd year teachers
Current career stage %NQT undertaking induction and on the main scale M1 50Teacher on the main scale M2 17Teacher on the main scale M1 12NQT undertaking induction and on the main scale M2 7Teacher on the main scale M3 5NQT undertaking induction and on the main scale M3 2Teacher on the main scale M4 2NQT undertaking induction and on the main scale M4 1No response 3
Percentages may not sum to 100 due to rounding N=335. Source: NFER survey of NQT/2nd year teachers, 2010
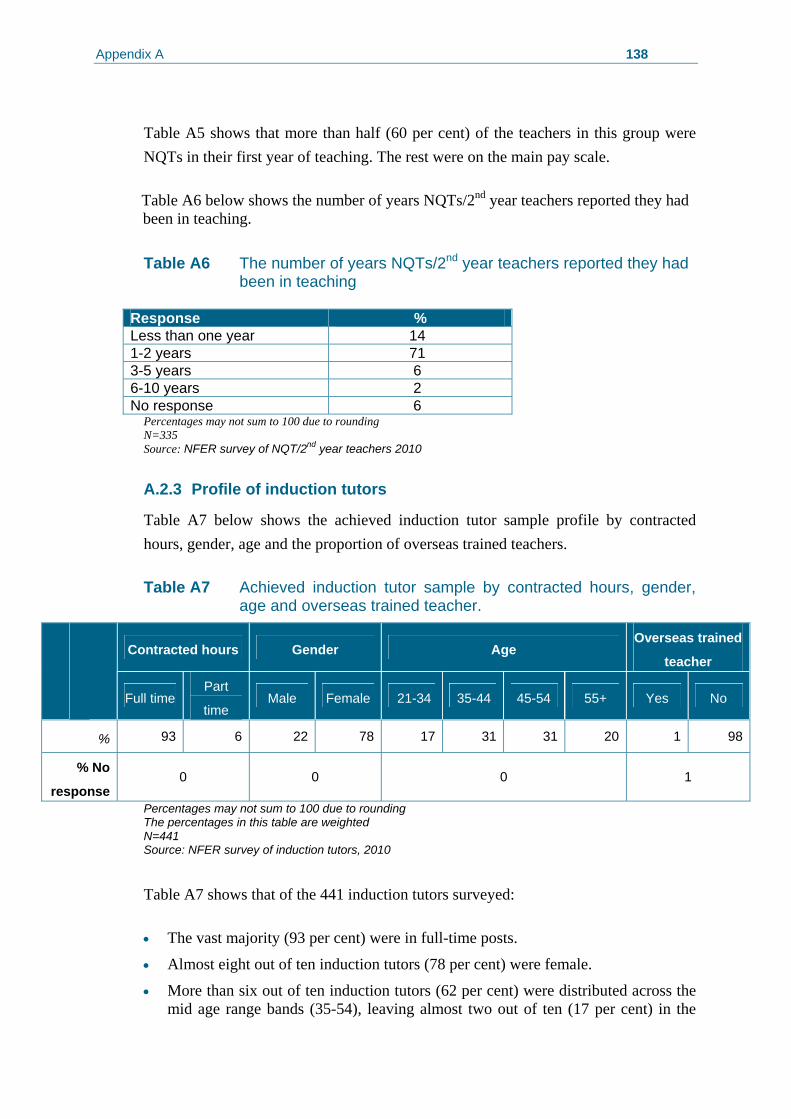
Appendix A 138
Table A5 shows that more than half (60 per cent) of the teachers in this group were NQTs in their first year of teaching. The rest were on the main pay scale. Table A6 below shows the number of years NQTs/2nd year teachers reported they had been in teaching.
Table A6 The number of years NQTs/2nd year teachers reported they had
been in teaching
Response % Less than one year 14 1-2 years 71 3-5 years 6 6-10 years 2 No response 6
Percentages may not sum to 100 due to rounding N=335
Source: NFER survey of NQT/2nd year teachers 2010
A.2.3 Profile of induction tutors
Table A7 below shows the achieved induction tutor sample profile by contracted hours, gender, age and the proportion of overseas trained teachers. Table A7 Achieved induction tutor sample by contracted hours, gender,
age and overseas trained teacher.
Contracted hours Gender Age Overseas trained
teacher
Full time
Part
time Male Female 21-34 35-44 45-54 55+ Yes No
% 93 6 22 78 17 31 31 20 1 98
% No
response 0 0 0 1
Percentages may not sum to 100 due to rounding The percentages in this table are weighted
N=441 Source: NFER survey of induction tutors, 2010
Table A7 shows that of the 441 induction tutors surveyed: • The vast majority (93 per cent) were in full-time posts.
• Almost eight out of ten induction tutors (78 per cent) were female.
• More than six out of ten induction tutors (62 per cent) were distributed across the mid age range bands (35-54), leaving almost two out of ten (17 per cent) in the
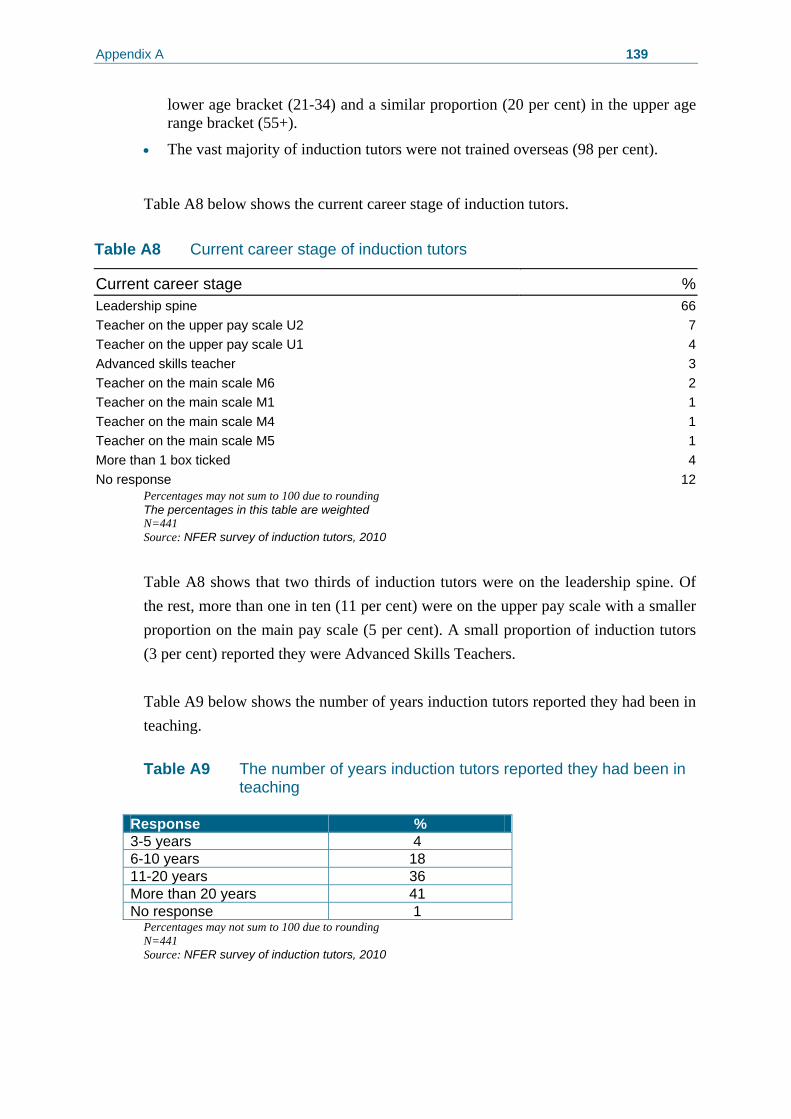
Appendix A 139
lower age bracket (21-34) and a similar proportion (20 per cent) in the upper age range bracket (55+).
• The vast majority of induction tutors were not trained overseas (98 per cent).
Table A8 below shows the current career stage of induction tutors.
Table A8 Current career stage of induction tutors
Current career stage %Leadership spine 66Teacher on the upper pay scale U2 7Teacher on the upper pay scale U1 4Advanced skills teacher 3Teacher on the main scale M6 2Teacher on the main scale M1 1Teacher on the main scale M4 1Teacher on the main scale M5 1More than 1 box ticked 4No response 12
Percentages may not sum to 100 due to rounding The percentages in this table are weighted
N=441 Source: NFER survey of induction tutors, 2010
Table A8 shows that two thirds of induction tutors were on the leadership spine. Of the rest, more than one in ten (11 per cent) were on the upper pay scale with a smaller proportion on the main pay scale (5 per cent). A small proportion of induction tutors (3 per cent) reported they were Advanced Skills Teachers. Table A9 below shows the number of years induction tutors reported they had been in teaching. Table A9 The number of years induction tutors reported they had been in
teaching
Response % 3-5 years 4 6-10 years 18 11-20 years 36 More than 20 years 41 No response 1
Percentages may not sum to 100 due to rounding N=441
Source: NFER survey of induction tutors, 2010
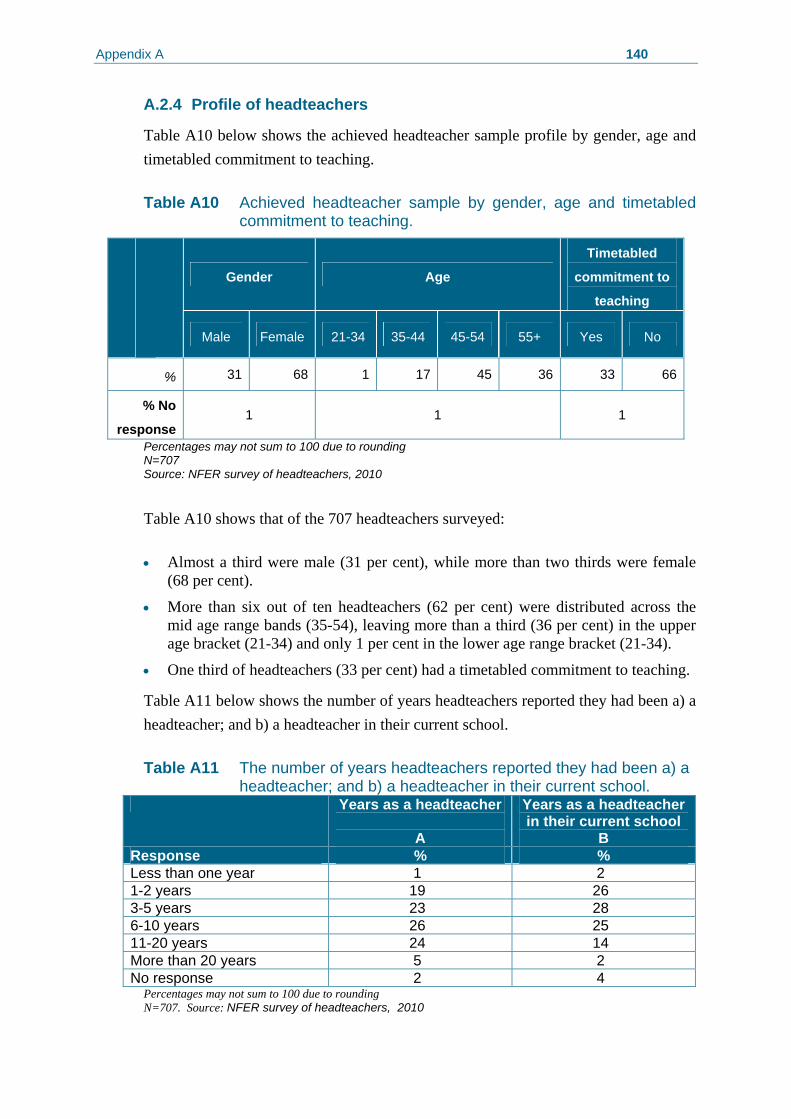
Appendix A 140
A.2.4 Profile of headteachers
Table A10 below shows the achieved headteacher sample profile by gender, age and timetabled commitment to teaching. Table A10 Achieved headteacher sample by gender, age and timetabled
commitment to teaching.
Gender Age
Timetabled
commitment to
teaching
Male Female 21-34 35-44 45-54 55+ Yes No
% 31 68 1 17 45 36 33 66
% No
response 1 1 1
Percentages may not sum to 100 due to rounding N=707
Source: NFER survey of headteachers, 2010
Table A10 shows that of the 707 headteachers surveyed: • Almost a third were male (31 per cent), while more than two thirds were female
(68 per cent).
• More than six out of ten headteachers (62 per cent) were distributed across the mid age range bands (35-54), leaving more than a third (36 per cent) in the upper age bracket (21-34) and only 1 per cent in the lower age range bracket (21-34).
• One third of headteachers (33 per cent) had a timetabled commitment to teaching.
Table A11 below shows the number of years headteachers reported they had been a) a headteacher; and b) a headteacher in their current school. Table A11 The number of years headteachers reported they had been a) a
headteacher; and b) a headteacher in their current school. Years as a headteacher
A
Years as a headteacher in their current school
B Response % % Less than one year 1 2 1-2 years 19 26 3-5 years 23 28 6-10 years 26 25 11-20 years 24 14 More than 20 years 5 2 No response 2 4
Percentages may not sum to 100 due to rounding N=707. Source: NFER survey of headteachers, 2010
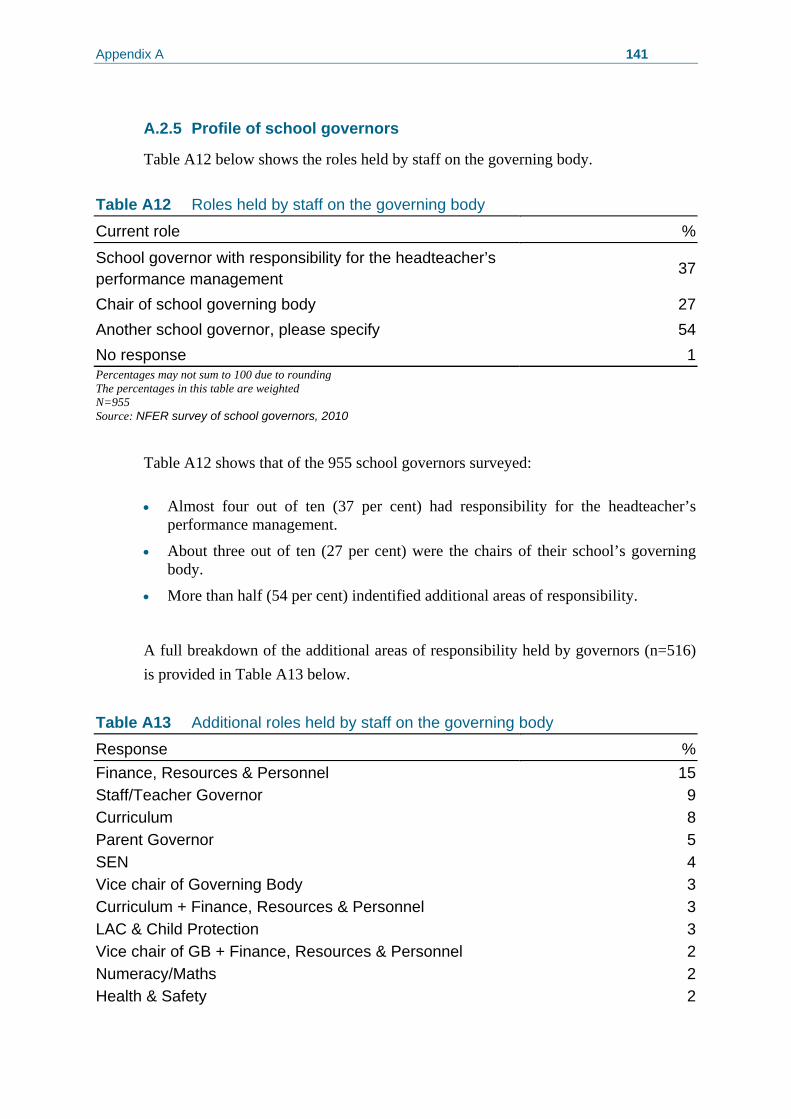
Appendix A 141
A.2.5 Profile of school governors
Table A12 below shows the roles held by staff on the governing body.
Table A12 Roles held by staff on the governing body
Current role %
School governor with responsibility for the headteacher’s performance management
37
Chair of school governing body 27Another school governor, please specify 54No response 1Percentages may not sum to 100 due to rounding The percentages in this table are weighted N=955 Source: NFER survey of school governors, 2010
Table A12 shows that of the 955 school governors surveyed: • Almost four out of ten (37 per cent) had responsibility for the headteacher’s
performance management.
• About three out of ten (27 per cent) were the chairs of their school’s governing body.
• More than half (54 per cent) indentified additional areas of responsibility.
A full breakdown of the additional areas of responsibility held by governors (n=516) is provided in Table A13 below.
Table A13 Additional roles held by staff on the governing body
Response %Finance, Resources & Personnel 15Staff/Teacher Governor 9Curriculum 8Parent Governor 5SEN 4Vice chair of Governing Body 3Curriculum + Finance, Resources & Personnel 3LAC & Child Protection 3Vice chair of GB + Finance, Resources & Personnel 2Numeracy/Maths 2Health & Safety 2
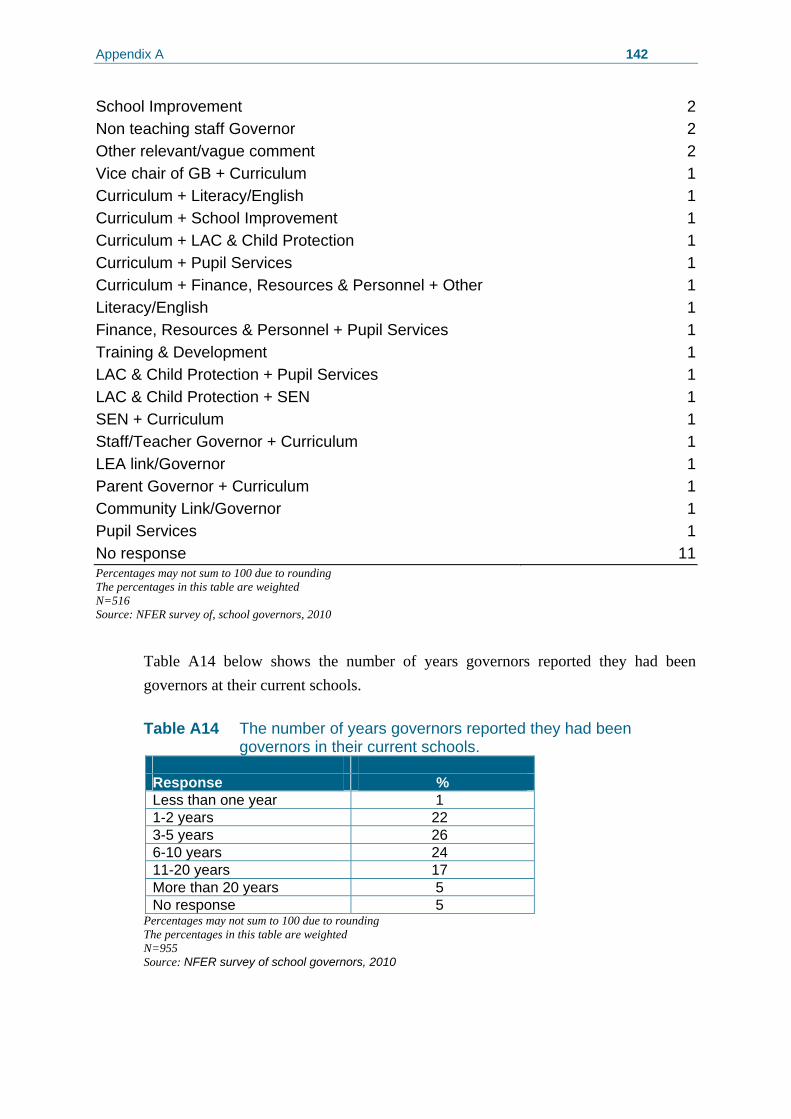
Appendix A 142
School Improvement 2Non teaching staff Governor 2Other relevant/vague comment 2Vice chair of GB + Curriculum 1Curriculum + Literacy/English 1Curriculum + School Improvement 1Curriculum + LAC & Child Protection 1Curriculum + Pupil Services 1Curriculum + Finance, Resources & Personnel + Other 1Literacy/English 1Finance, Resources & Personnel + Pupil Services 1Training & Development 1LAC & Child Protection + Pupil Services 1LAC & Child Protection + SEN 1SEN + Curriculum 1Staff/Teacher Governor + Curriculum 1LEA link/Governor 1Parent Governor + Curriculum 1Community Link/Governor 1Pupil Services 1No response 11Percentages may not sum to 100 due to rounding The percentages in this table are weighted N=516 Source: NFER survey of, school governors, 2010
Table A14 below shows the number of years governors reported they had been governors at their current schools. Table A14 The number of years governors reported they had been
governors in their current schools. Response % Less than one year 1 1-2 years 22 3-5 years 26 6-10 years 24 11-20 years 17 More than 20 years 5 No response 5
Percentages may not sum to 100 due to rounding The percentages in this table are weighted
N=955 Source: NFER survey of school governors, 2010
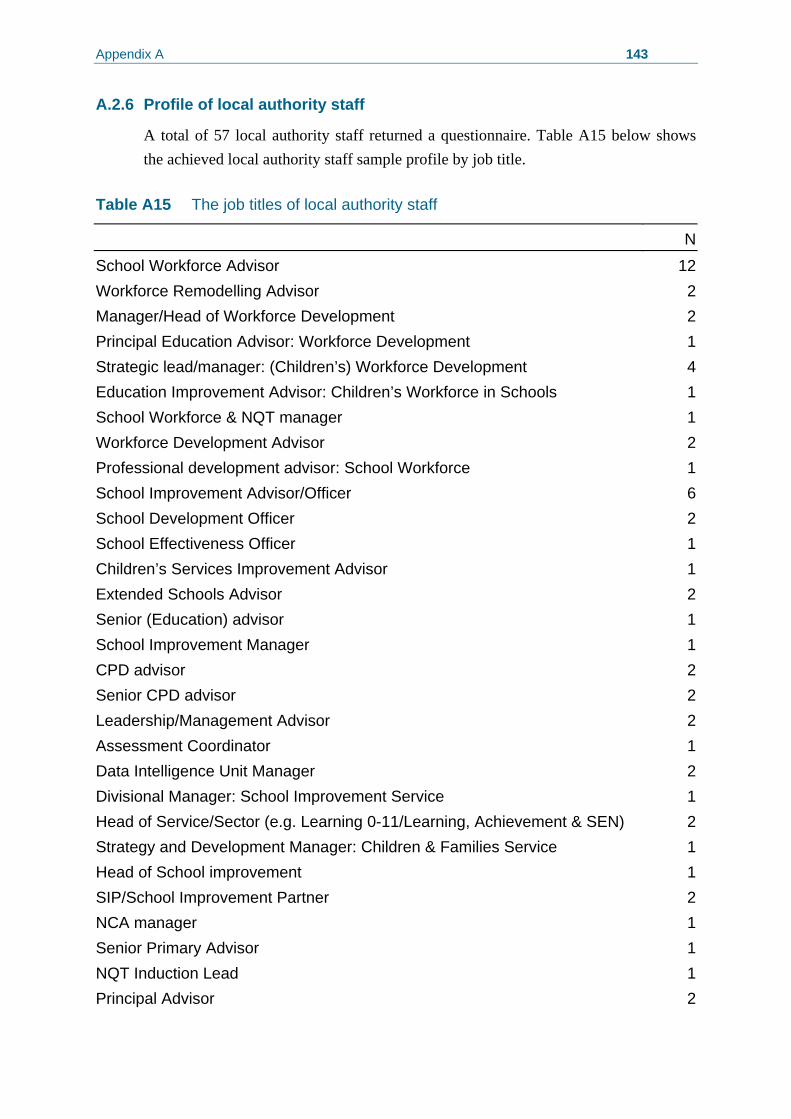
Appendix A 143
A.2.6 Profile of local authority staff
A total of 57 local authority staff returned a questionnaire. Table A15 below shows the achieved local authority staff sample profile by job title.
Table A15 The job titles of local authority staff
N
School Workforce Advisor 12Workforce Remodelling Advisor 2Manager/Head of Workforce Development 2Principal Education Advisor: Workforce Development 1Strategic lead/manager: (Children’s) Workforce Development 4Education Improvement Advisor: Children’s Workforce in Schools 1School Workforce & NQT manager 1Workforce Development Advisor 2Professional development advisor: School Workforce 1School Improvement Advisor/Officer 6School Development Officer 2School Effectiveness Officer 1Children’s Services Improvement Advisor 1Extended Schools Advisor 2Senior (Education) advisor 1School Improvement Manager 1CPD advisor 2Senior CPD advisor 2Leadership/Management Advisor 2Assessment Coordinator 1Data Intelligence Unit Manager 2Divisional Manager: School Improvement Service 1Head of Service/Sector (e.g. Learning 0-11/Learning, Achievement & SEN) 2Strategy and Development Manager: Children & Families Service 1Head of School improvement 1SIP/School Improvement Partner 2NCA manager 1Senior Primary Advisor 1NQT Induction Lead 1Principal Advisor 2
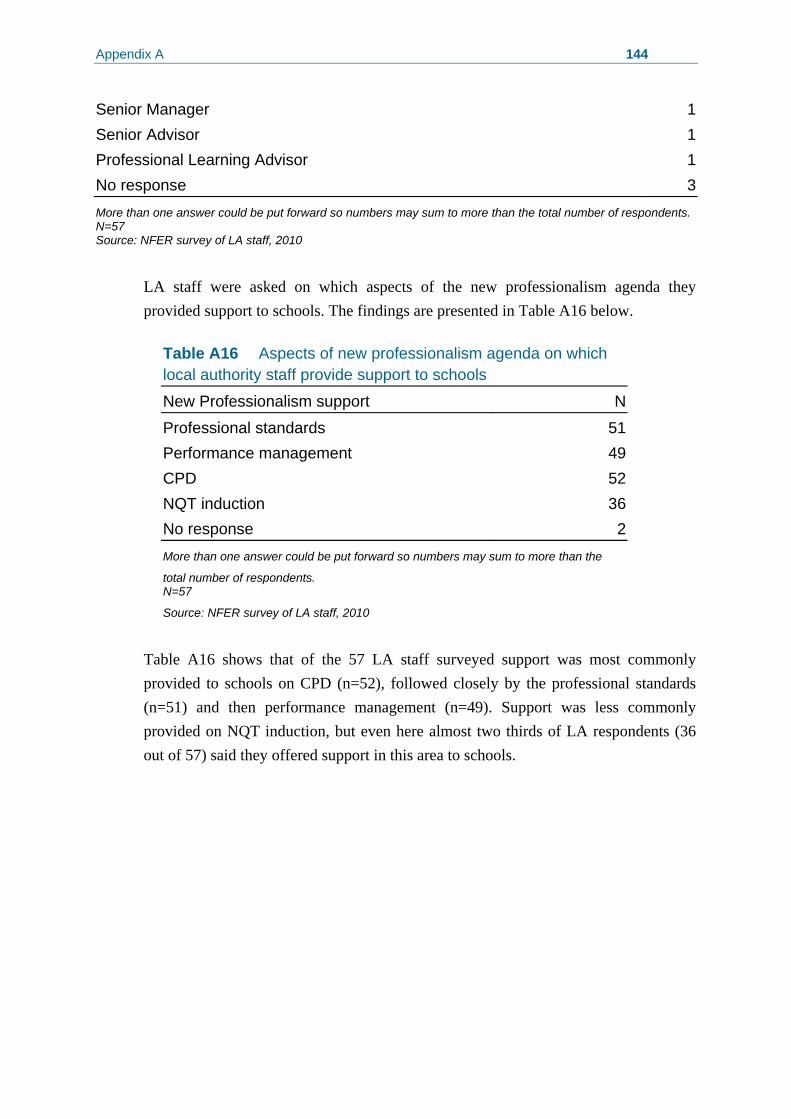
Appendix A 144
Senior Manager 1Senior Advisor 1Professional Learning Advisor 1No response 3More than one answer could be put forward so numbers may sum to more than the total number of respondents. N=57 Source: NFER survey of LA staff, 2010
LA staff were asked on which aspects of the new professionalism agenda they provided support to schools. The findings are presented in Table A16 below.
Table A16 Aspects of new professionalism agenda on which local authority staff provide support to schools
New Professionalism support N
Professional standards 51 Performance management 49 CPD 52 NQT induction 36 No response 2 More than one answer could be put forward so numbers may sum to more than the
total number of respondents. N=57
Source: NFER survey of LA staff, 2010
Table A16 shows that of the 57 LA staff surveyed support was most commonly provided to schools on CPD (n=52), followed closely by the professional standards (n=51) and then performance management (n=49). Support was less commonly provided on NQT induction, but even here almost two thirds of LA respondents (36 out of 57) said they offered support in this area to schools.
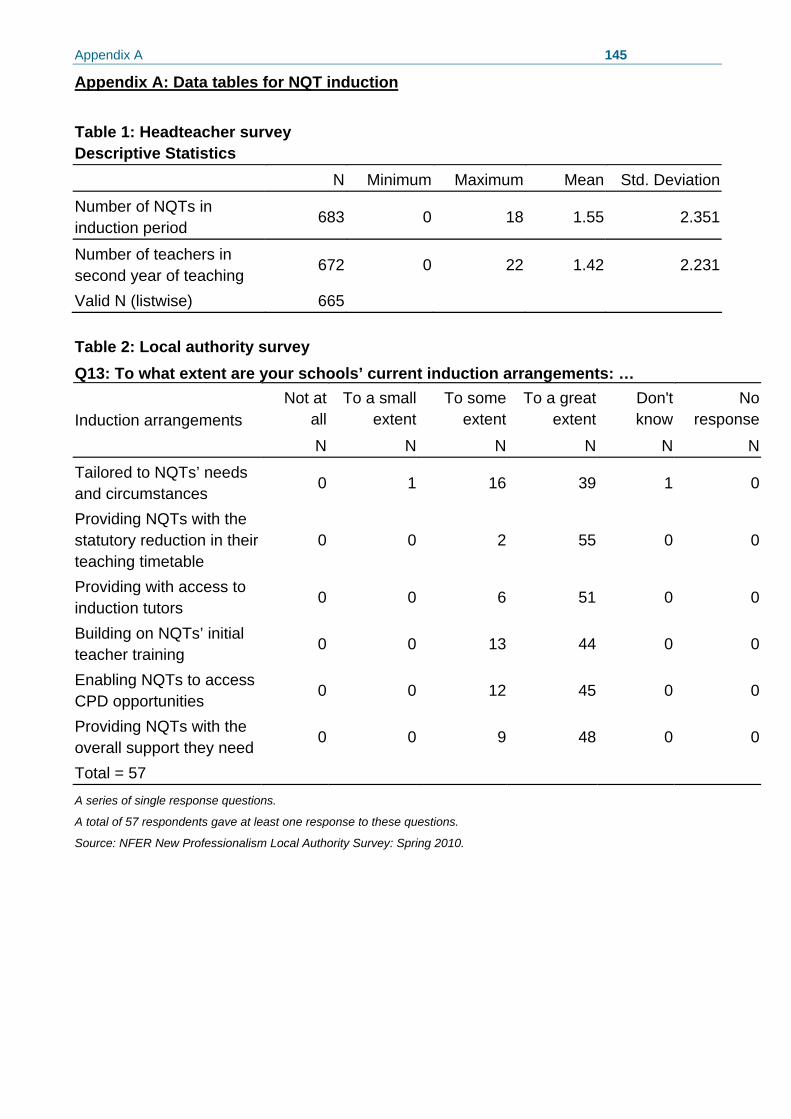
Appendix A 145
Appendix A: Data tables for NQT induction Table 1: Headteacher survey Descriptive Statistics
N Minimum Maximum Mean Std. Deviation
Number of NQTs in induction period
683 0 18 1.55 2.351
Number of teachers in second year of teaching
672 0 22 1.42 2.231
Valid N (listwise) 665
Table 2: Local authority survey Q13: To what extent are your schools’ current induction arrangements: …
Not at all
To a small extent
To some extent
To a great extent
Don't know
No responseInduction arrangements
N N N N N N
Tailored to NQTs’ needs and circumstances
0 1 16 39 1 0
Providing NQTs with the statutory reduction in their teaching timetable
0 0 2 55 0 0
Providing with access to induction tutors
0 0 6 51 0 0
Building on NQTs’ initial teacher training 0 0 13 44 0 0
Enabling NQTs to access CPD opportunities
0 0 12 45 0 0
Providing NQTs with the overall support they need
0 0 9 48 0 0
Total = 57
A series of single response questions.
A total of 57 respondents gave at least one response to these questions.
Source: NFER New Professionalism Local Authority Survey: Spring 2010.
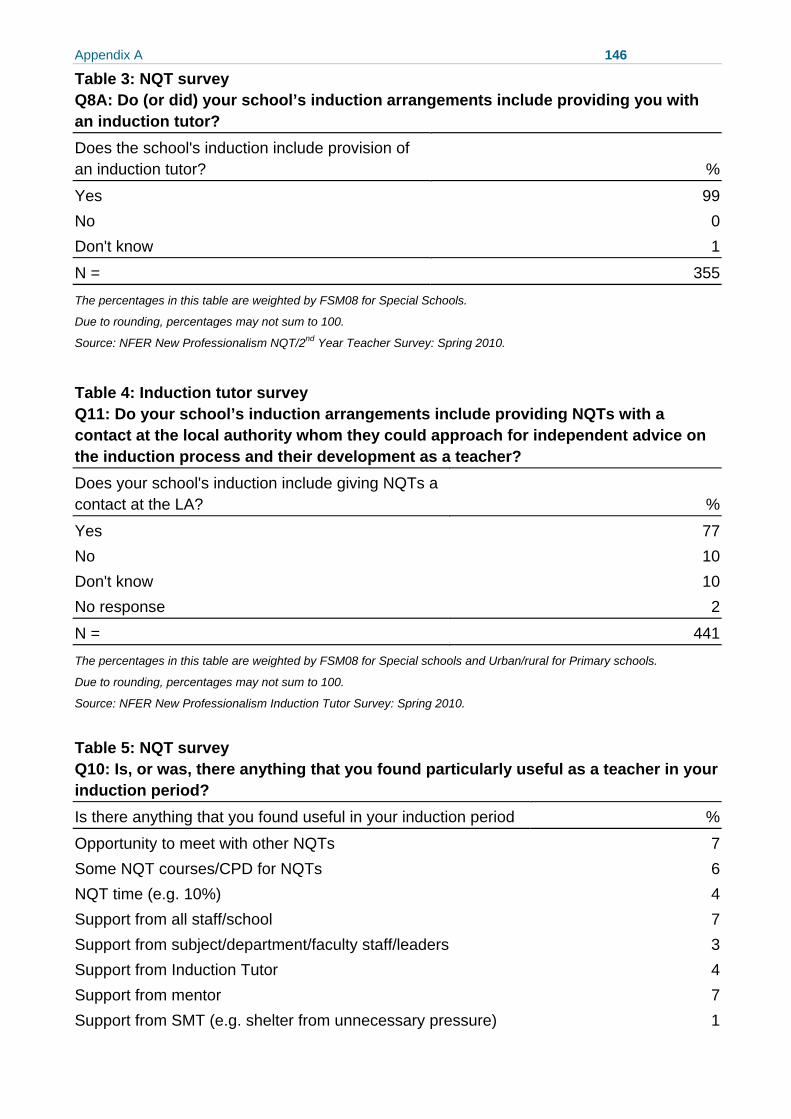
Appendix A 146
Table 3: NQT survey Q8A: Do (or did) your school’s induction arrangements include providing you with an induction tutor?
Does the school's induction include provision of an induction tutor? %
Yes 99No 0Don't know 1
N = 355The percentages in this table are weighted by FSM08 for Special Schools.
Due to rounding, percentages may not sum to 100.
Source: NFER New Professionalism NQT/2nd Year Teacher Survey: Spring 2010.
Table 4: Induction tutor survey Q11: Do your school’s induction arrangements include providing NQTs with a contact at the local authority whom they could approach for independent advice on the induction process and their development as a teacher? Does your school's induction include giving NQTs a contact at the LA? %
Yes 77No 10Don't know 10No response 2
N = 441The percentages in this table are weighted by FSM08 for Special schools and Urban/rural for Primary schools.
Due to rounding, percentages may not sum to 100.
Source: NFER New Professionalism Induction Tutor Survey: Spring 2010.
Table 5: NQT survey Q10: Is, or was, there anything that you found particularly useful as a teacher in your induction period?
Is there anything that you found useful in your induction period %
Opportunity to meet with other NQTs 7Some NQT courses/CPD for NQTs 6NQT time (e.g. 10%) 4Support from all staff/school 7Support from subject/department/faculty staff/leaders 3Support from Induction Tutor 4Support from mentor 7Support from SMT (e.g. shelter from unnecessary pressure) 1
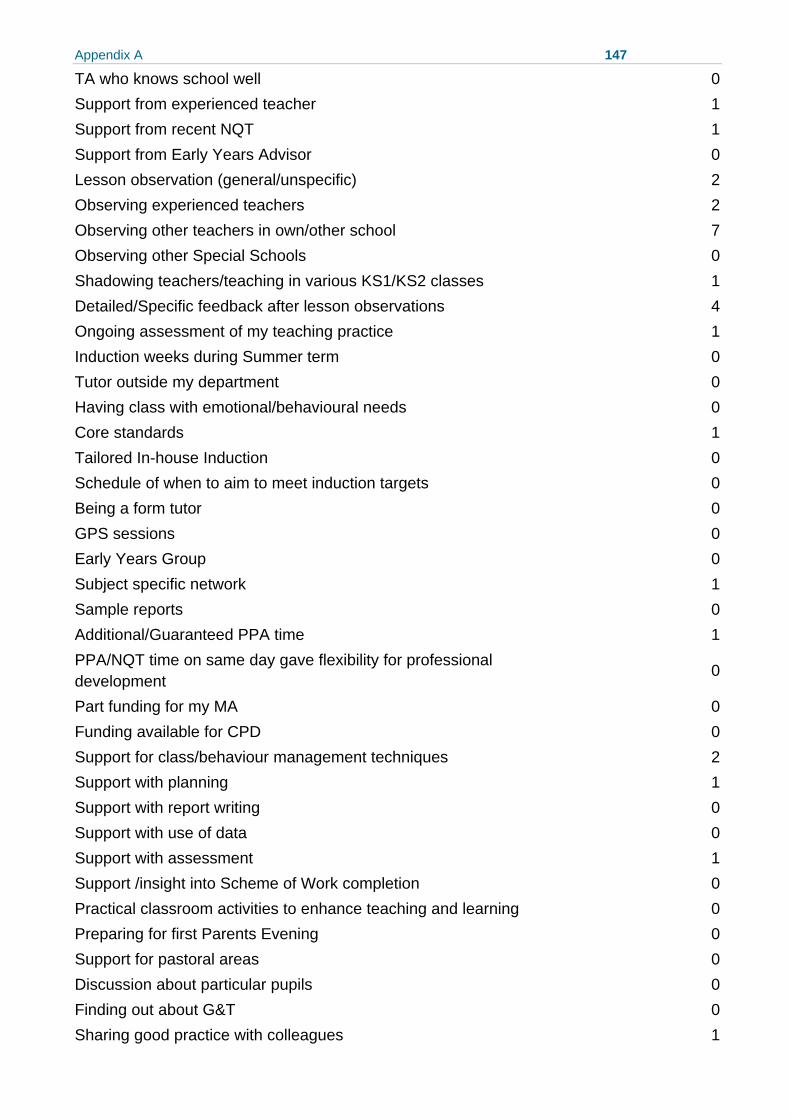
Appendix A 147
TA who knows school well 0Support from experienced teacher 1Support from recent NQT 1Support from Early Years Advisor 0Lesson observation (general/unspecific) 2Observing experienced teachers 2Observing other teachers in own/other school 7Observing other Special Schools 0Shadowing teachers/teaching in various KS1/KS2 classes 1Detailed/Specific feedback after lesson observations 4Ongoing assessment of my teaching practice 1Induction weeks during Summer term 0Tutor outside my department 0Having class with emotional/behavioural needs 0Core standards 1Tailored In-house Induction 0Schedule of when to aim to meet induction targets 0Being a form tutor 0GPS sessions 0Early Years Group 0Subject specific network 1Sample reports 0Additional/Guaranteed PPA time 1PPA/NQT time on same day gave flexibility for professional development
0
Part funding for my MA 0Funding available for CPD 0Support for class/behaviour management techniques 2Support with planning 1Support with report writing 0Support with use of data 0Support with assessment 1Support /insight into Scheme of Work completion 0Practical classroom activities to enhance teaching and learning 0Preparing for first Parents Evening 0Support for pastoral areas 0Discussion about particular pupils 0Finding out about G&T 0Sharing good practice with colleagues 1
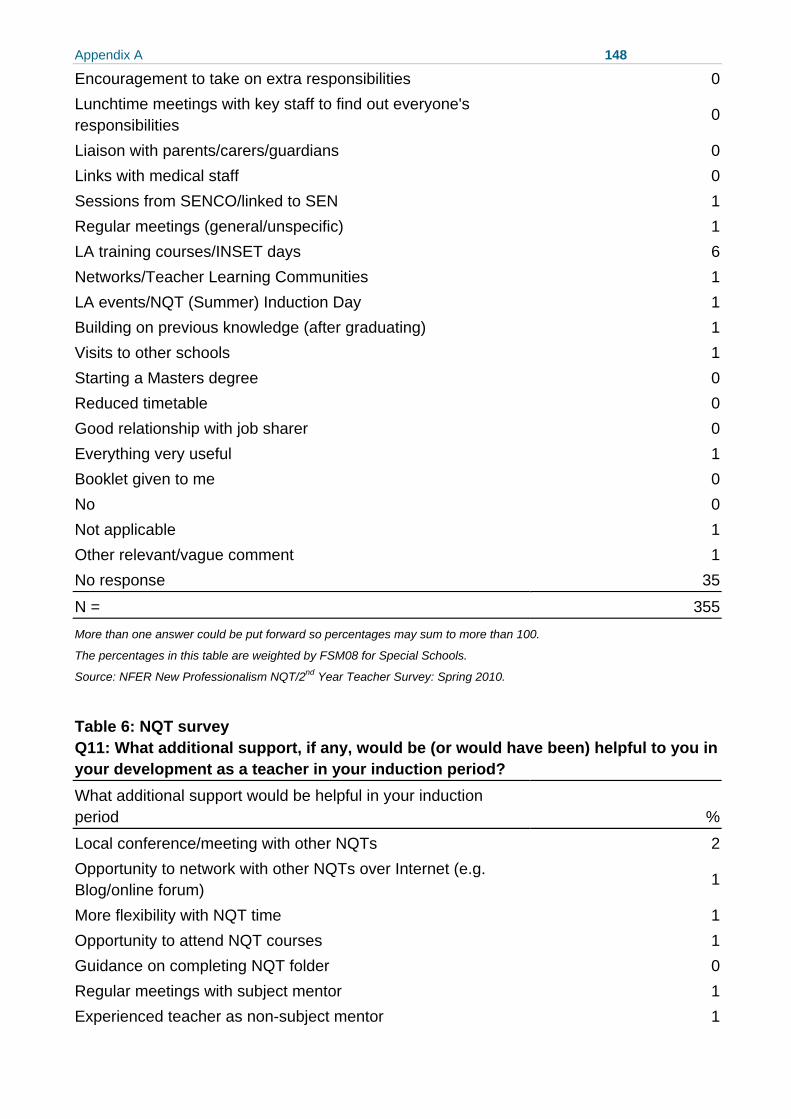
Appendix A 148
Encouragement to take on extra responsibilities 0Lunchtime meetings with key staff to find out everyone's responsibilities
0
Liaison with parents/carers/guardians 0Links with medical staff 0Sessions from SENCO/linked to SEN 1Regular meetings (general/unspecific) 1LA training courses/INSET days 6Networks/Teacher Learning Communities 1LA events/NQT (Summer) Induction Day 1Building on previous knowledge (after graduating) 1Visits to other schools 1Starting a Masters degree 0Reduced timetable 0Good relationship with job sharer 0Everything very useful 1Booklet given to me 0No 0Not applicable 1Other relevant/vague comment 1No response 35
N = 355More than one answer could be put forward so percentages may sum to more than 100.
The percentages in this table are weighted by FSM08 for Special Schools.
Source: NFER New Professionalism NQT/2nd Year Teacher Survey: Spring 2010.
Table 6: NQT survey Q11: What additional support, if any, would be (or would have been) helpful to you in your development as a teacher in your induction period? What additional support would be helpful in your induction period %
Local conference/meeting with other NQTs 2Opportunity to network with other NQTs over Internet (e.g. Blog/online forum) 1
More flexibility with NQT time 1Opportunity to attend NQT courses 1Guidance on completing NQT folder 0Regular meetings with subject mentor 1Experienced teacher as non-subject mentor 1
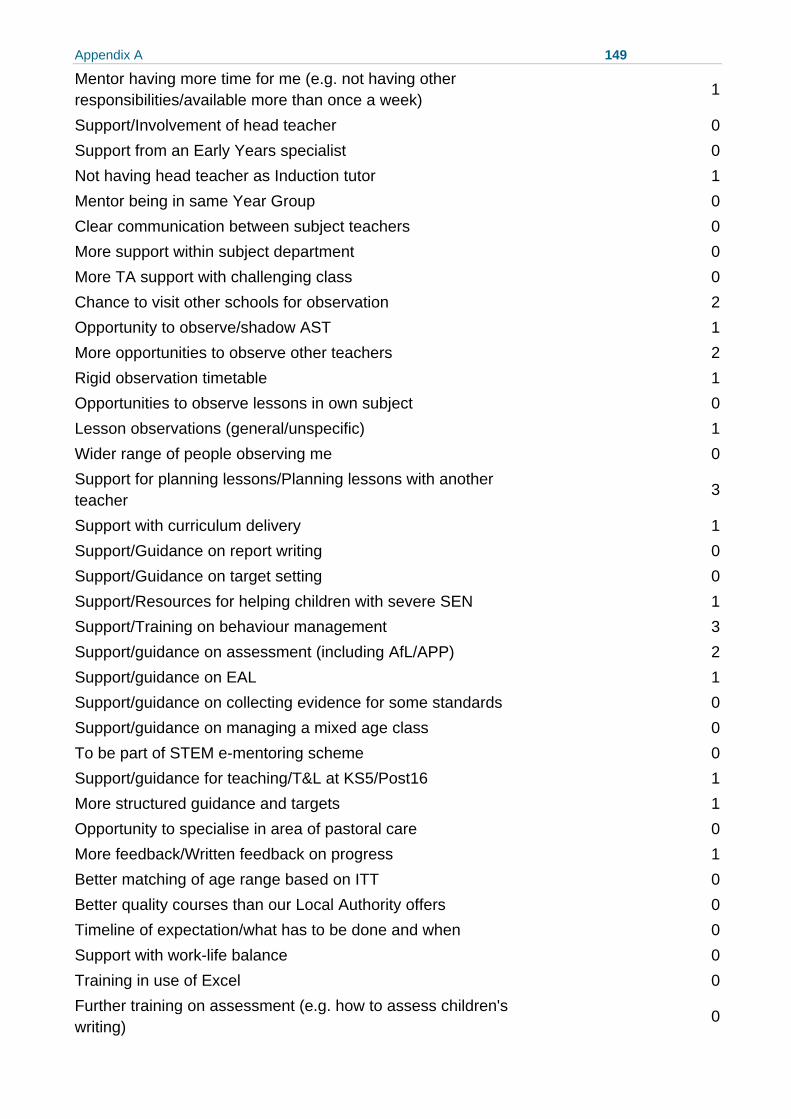
Appendix A 149
Mentor having more time for me (e.g. not having other responsibilities/available more than once a week) 1
Support/Involvement of head teacher 0Support from an Early Years specialist 0Not having head teacher as Induction tutor 1Mentor being in same Year Group 0Clear communication between subject teachers 0More support within subject department 0More TA support with challenging class 0Chance to visit other schools for observation 2Opportunity to observe/shadow AST 1More opportunities to observe other teachers 2Rigid observation timetable 1Opportunities to observe lessons in own subject 0Lesson observations (general/unspecific) 1Wider range of people observing me 0Support for planning lessons/Planning lessons with another teacher
3
Support with curriculum delivery 1Support/Guidance on report writing 0Support/Guidance on target setting 0Support/Resources for helping children with severe SEN 1Support/Training on behaviour management 3Support/guidance on assessment (including AfL/APP) 2Support/guidance on EAL 1Support/guidance on collecting evidence for some standards 0Support/guidance on managing a mixed age class 0To be part of STEM e-mentoring scheme 0Support/guidance for teaching/T&L at KS5/Post16 1More structured guidance and targets 1Opportunity to specialise in area of pastoral care 0More feedback/Written feedback on progress 1Better matching of age range based on ITT 0Better quality courses than our Local Authority offers 0Timeline of expectation/what has to be done and when 0Support with work-life balance 0Training in use of Excel 0Further training on assessment (e.g. how to assess children's writing)
0
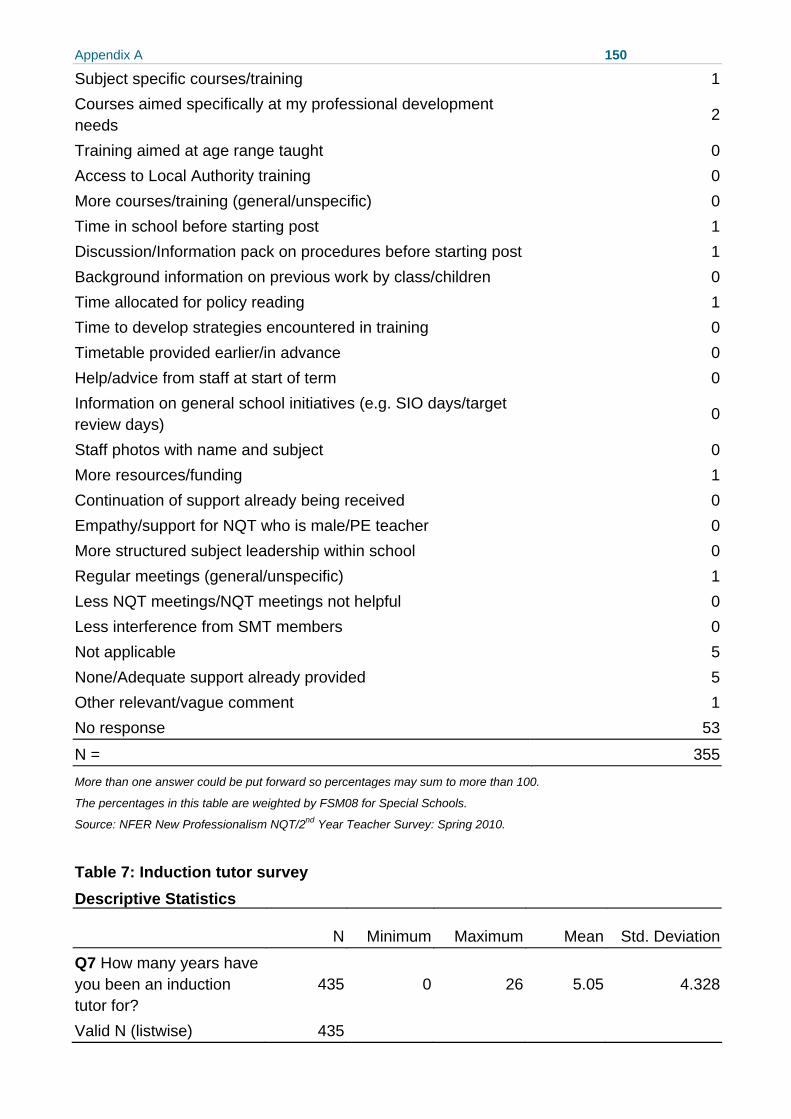
Appendix A 150
Subject specific courses/training 1Courses aimed specifically at my professional development needs
2
Training aimed at age range taught 0Access to Local Authority training 0More courses/training (general/unspecific) 0Time in school before starting post 1Discussion/Information pack on procedures before starting post 1Background information on previous work by class/children 0Time allocated for policy reading 1Time to develop strategies encountered in training 0Timetable provided earlier/in advance 0Help/advice from staff at start of term 0Information on general school initiatives (e.g. SIO days/target review days)
0
Staff photos with name and subject 0More resources/funding 1Continuation of support already being received 0Empathy/support for NQT who is male/PE teacher 0More structured subject leadership within school 0Regular meetings (general/unspecific) 1Less NQT meetings/NQT meetings not helpful 0Less interference from SMT members 0Not applicable 5None/Adequate support already provided 5Other relevant/vague comment 1No response 53
N = 355More than one answer could be put forward so percentages may sum to more than 100.
The percentages in this table are weighted by FSM08 for Special Schools.
Source: NFER New Professionalism NQT/2nd Year Teacher Survey: Spring 2010.
Table 7: Induction tutor survey Descriptive Statistics
N Minimum Maximum Mean Std. Deviation
Q7 How many years have you been an induction tutor for?
435 0 26 5.05 4.328
Valid N (listwise) 435
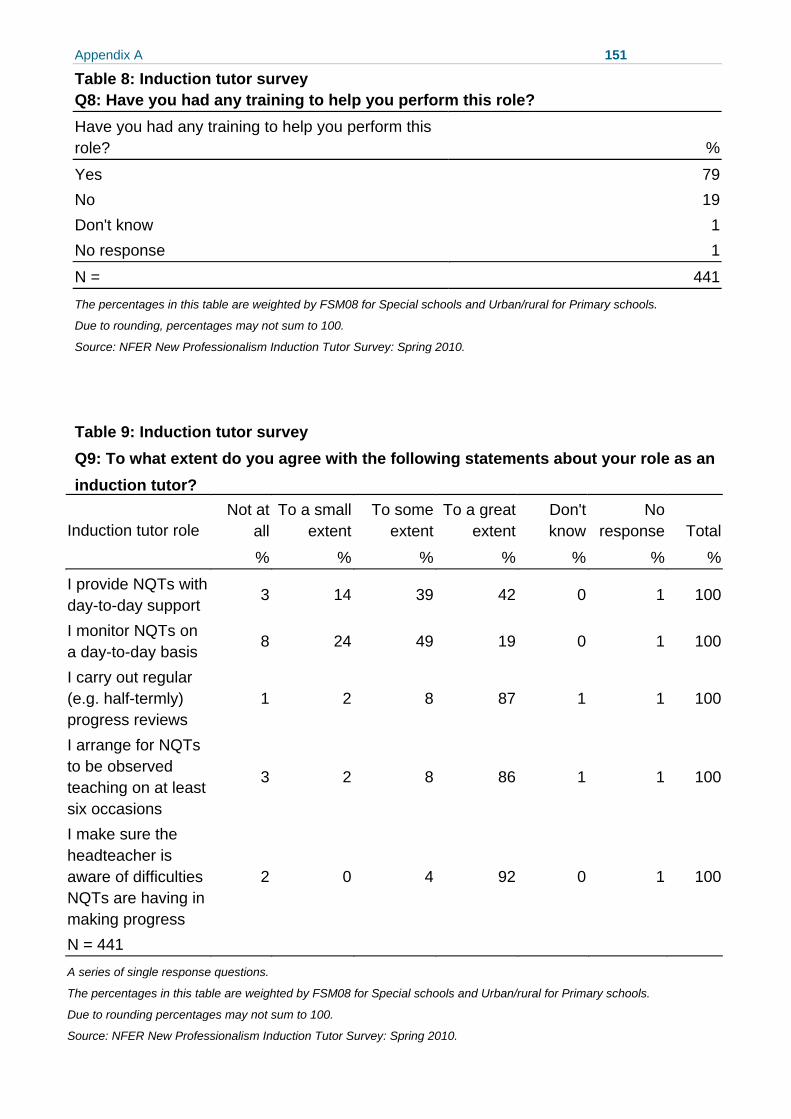
Appendix A 151
Table 8: Induction tutor survey Q8: Have you had any training to help you perform this role?
Have you had any training to help you perform this role? %
Yes 79No 19Don't know 1No response 1
N = 441The percentages in this table are weighted by FSM08 for Special schools and Urban/rural for Primary schools.
Due to rounding, percentages may not sum to 100.
Source: NFER New Professionalism Induction Tutor Survey: Spring 2010.
Table 9: Induction tutor survey Q9: To what extent do you agree with the following statements about your role as an induction tutor?
Not at all
To a small extent
To some extent
To a great extent
Don't know
No response TotalInduction tutor role
% % % % % % %
I provide NQTs with day-to-day support
3 14 39 42 0 1 100
I monitor NQTs on a day-to-day basis
8 24 49 19 0 1 100
I carry out regular (e.g. half-termly) progress reviews
1 2 8 87 1 1 100
I arrange for NQTs to be observed teaching on at least six occasions
3 2 8 86 1 1 100
I make sure the headteacher is aware of difficulties NQTs are having in making progress
2 0 4 92 0 1 100
N = 441
A series of single response questions.
The percentages in this table are weighted by FSM08 for Special schools and Urban/rural for Primary schools.
Due to rounding percentages may not sum to 100.
Source: NFER New Professionalism Induction Tutor Survey: Spring 2010.
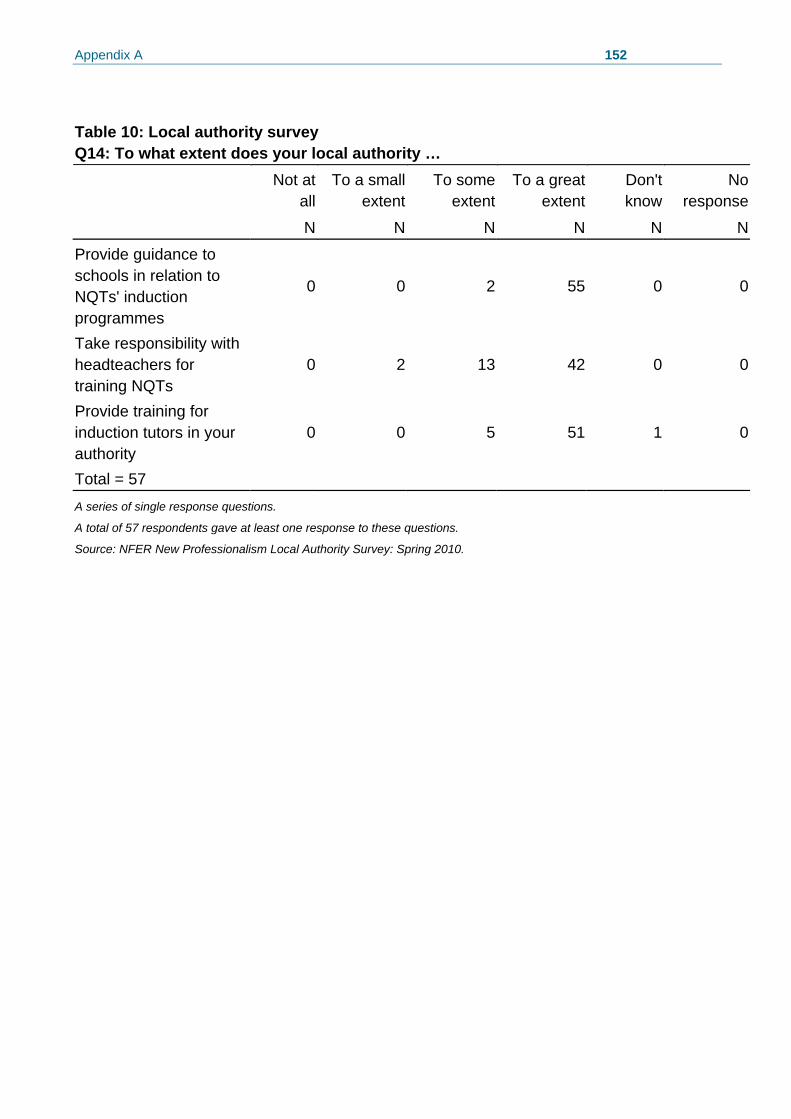
Appendix A 152
Table 10: Local authority survey Q14: To what extent does your local authority …
Not at all
To a small extent
To some extent
To a great extent
Don't know
No response
N N N N N N
Provide guidance to schools in relation to NQTs' induction programmes
0 0 2 55 0 0
Take responsibility with headteachers for training NQTs
0 2 13 42 0 0
Provide training for induction tutors in your authority
0 0 5 51 1 0
Total = 57
A series of single response questions.
A total of 57 respondents gave at least one response to these questions.
Source: NFER New Professionalism Local Authority Survey: Spring 2010.

© National Foundation for Educational Research January 2011
Ref: DFE-RR075 ISBN: 978-1-84775-846-0