malaya lim qian ying of - um
TRANSCRIPT

LIPID NANOPARTICLES IN THERMORESPONSIVE GEL FOR TOPICAL APPLICATION
LIM QIAN YING
FACULTY OF SCIENCE
UNIVERSITY OF MALAYA KUALA LUMPUR
2018
Univers
ity of
Mala
ya

LIPID NANOPARTICLES IN THERMORESPONSIVE GEL FOR TOPICAL APPLICATION
LIM QIAN YING
DISSERTATION SUBMITTED IN FULFILMENT OF THE REQUIREMENTS FOR THE DEGREE OF
MASTER OF SCIENCE
DEPARTMENT OF CHEMISTRY FACULTY OF SCIENCE
UNIVERSITY OF MALAYA KUALA LUMPUR
2018
Univers
ity of
Mala
ya

ii
Univers
ity of
Mala
ya

iii
ABSTRACT
Medicated topical gel having thermoresponsive feature is advantageous with respect to
spreadability and drug delivery. However, gels are restricted by insolubility due to the
hydrophobic drug compounds used and chemical degradation of active compounds in an
aqueous system. Therefore, lipid nanoparticles are incorporated as a carrier for the active
ingredients. In present work, alpha-tocopherol and hydroquinone were loaded in lecithin-
fatty acid nanoparticles which was then incorporated into a thermoresponsive gel,
consisting of carboxymethyl cellulose (CMC) and iota-carrageenan (ι-C). Temperature
and Ca2+ ions effect on the rheological behavior of the prepared gel mixture was
investigated. The nanostructured lipid carrier (NLC) was evaluated for its mean particle
size, zeta potential, morphology, encapsulation efficiency and in vitro release.
Physicochemical characterization showed that both alpha-tocopherol and hydroquinone
loaded NLCs being stored at 4 ˚C were stable for 30 days, while the encapsulation
efficiency was different more than 30% due to the distinct hydrophobicity. In vitro release
studies showed that NLC had the capability to slow release both the hydrophobic and
hydrophilic active ingredients. Meanwhile, a gel system was formulated to transform
from gel-like to liquid-like consistency in the vicinity of body temperature. NLC gave
advantages to the pure gel system as the NLC-gel showed slightly higher elasticity,
indicating contribution of NLC to rigidity of the gel system. Nevertheless, the effect of
NLC on gelling point was negligible. These results suggest that gel mixture of CMC and
ι-C is likely to be developed as a thermoresponsive gel while NLC is a potential active
ingredient carrier system in topical application.
Univers
ity of
Mala
ya

iv
ABSTRAK
Gel topikal berubat yang peka terhadap suhu amat berguna dalam keupayaan untuk
menyebar dan pengangkutan ubat. Walau bagaimanapun, kegunaan gel selalu terhad oleh
masalah kelarutan ubat hidrofobik dan degradasi bahan aktif secara kimia dalam sistem
akueus. Oleh itu, lipid zarah nano diperkenalkan sebagai pembawa untuk bahan aktif ini.
Dalam kajian ini, alfa-tokoferol dan hidrokuinon dimuatkan dalam zarah nano yang
diperbuat daripada lecitin dan asid lemak dan seterusnya diperkenalkan ke dalam gel peka
suhu yang mengandungi karboksimetil selulosa (CMC) dan iota-karagenan (ι-C). Kesan
suhu dan kation pada kelakuan reologi gel campuran yang disediakan disiasati. Purata
saiz, keupayaan Zeta, morfologi, kecekapan pengkapsulan dan pelepasan in vitro bagi
pembawa lipid berstruktur-nano (NLC) dinilaikan. Pencirian fizikokimia menunjukkan
bahawa kedua-dua NLC yang dimuatkan oleh alfa-tokoferol dan hidrokuinon adalah
stabil selama 30 hari apabila disimpan pada suhu 4 ˚C, namun kecekapan pengkapsulan
berbeza lebih daripada 30% disebabkan oleh sifat hidrofobik yang berbeza. Kajian
pelepasan in vitro membuktikan bahawa NLC berupaya untuk melepaskan kedua-dua
bahan aktif hidrofobik dan hidrofilik secara perlahan. Sementara itu, satu sistem gel yang
berubah daripada gel ke cecair pada suhu di sekitar suhu badan telah diformulasikan. NLC
memberikan kelebihan kepada sistem gel tulen memandangkan NLC-gel menunjukkan
kekenyalan yang lebih tinggi, menyatakan sumbangan NLC terhadap ketegaran sistem
gel. Walau bagaimanapun, kesan NLC pada suhu pembentukan gel boleh diabaikan.
Keputusan tersebut mencadangkan bahawa gel campuran CMC dan ι-C adalah
berkemungkinan untuk dibangunkan sebagai gel peka suhu manakala NLC merupakan
sistem pembawa bahan aktif yang berpotensi dalam aplikasi topikal.
Univers
ity of
Mala
ya

v
ACKNOWLEDGEMENTS
I would like to express my deepest gratitude to my supervisor, Prof. Dr. Misni Misran
for his patient guidance and useful comments on this project. He had been sharing his
experiences and knowledge to his students liberally and his willingness to give his
precious time generously was greatly appreciated.
I am also grateful for the valuable and constructive suggestions given by the members
of Colloid and Surfaces Laboratory including Dr. Anita Marlina, Mr. Vicit Rizal Eh Suk,
Dr. Yew Han Choi, Ms. Premanarayani Menon, Ms. Tiew Shu Xian, Mrs. Sumaira
Naeem, Mr. Tang Nyiak Tao, Ms. Rabi’Atul’Adawiyah, Ms. Farhanim and others.
Advices given by them had been a great help in planning and development of this research
work. Furthermore, my special thanks are extended to the Ministry of Science,
Technology and Innovation (MOSTI) and University of Malaya that have provided
financial support for the entire project. Also thanks to the staff of Department of
Chemistry, University of Malaya for their kind assistance throughout the study period.
Finally, I am particularly appreciative of the continuous support from my beloved
family and friends who have been encouraging and inspiring me throughout my study.
Univers
ity of
Mala
ya

vi
TABLE OF CONTENTS
Abstract……………………………………………………………….…............. iii
Abstrak………………………………………………………………….……….. iv
Acknowledgements………………………………………………………............ v
Table of Contents………………………………………………………............... vi
List of Figures……………………………………………………………............ ix
List of Tables…………………………………………...……………………….. xiii
List of Symbol and Abbreviations…………...…………………………….......... xiv
CHAPTER 1: INTRODUCTION……………………………………………... 1
1.1 General introduction………………………………………………….….. 1
1.2 Objectives of research…..…………………………………………….….. 4
CHAPTER 2: LITERATURE REVIEW……………………………………… 5
2.1 Topical delivery……………………………………………………….…. 5
2.2 Gels……………………………………………………………….…….... 6
2.2.1 Thermoresponsive gels…………………………………….…….. 7
2.2.2 iota-Carrageenan (ι-C)……………………………….….……….. 9
2.3 Colloidal carrier systems………………………………………………… 10
2.3.1 Solid lipid nanoparticles (SLN)………………………….………. 11
2.3.2 Nanostructured lipid carriers (NLC)………………………….….. 13
2.4 Lipid nanoparticles in topical formulations…………………………….... 15
2.5 Rheology in topical application………………………………….………. 17
CHAPTER 3: MATERIALS AND METHOD……………………………….. 20
3.1 Materials…………………………………………………………………. 20
3.2 Methodology……………………………………………………………... 20
Univers
ity of
Mala
ya

vii
3.2.1 Preparation of NLC……………………………….…………….... 20
3.2.2 Mean particle size and polydispersity index of NLC……….……. 21
3.2.3 Zeta potential of NLC……………………………………………. 24
3.2.4 Optical polarizing microscope (OPM)………………….………... 25
3.2.5 Transmission electron microscope (TEM)……………….………. 26
3.2.6 Differential scanning calorimetry (DSC)………..………,……..... 26
3.2.7 Encapsulation efficiency of active ingredients in NLC………….. 28
3.2.8 Preparation of gel samples for rheological measurements………. 29
3.2.9 Rheological characterization of gel samples…………….………. 30
3.2.9.1 Viscometry test…............................................................... 31
3.2.9.2 Oscillatory tests………………………………….…...….. 32
3.2.10 Field emission scanning electron microscope (FESEM)……...…. 34
3.2.11 Preparation of samples for in vitro release studies………………. 34
3.2.12 In vitro release……………………………………………...……. 35
3.2.12.1 Determination of amount of active compound…………. 36
3.2.12.2 Mathematical model evaluations……………………….. 36
CHAPTER 4: RESULTS AND DISCUSSION……………………………….. 39
4.1 Physicochemical characterization of NLC………………………………. 39
4.1.1 Mean particle size and zeta potential of NLC………………….... 39
4.1.1.1 Effect of preparation parameters…………………………. 39
4.1.1.2 Effect of lipid composition…………………………......... 40
4.1.1.3 Effect of types of nonionic surfactant……………………. 42
4.1.1.4 Effect of surfactant ratio Tween 80 to lecithin…….…….. 44
4.1.1.5 Incorporation of alpha-tocopherol………………….…..... 47
4.1.1.6 Incorporation of hydroquinone…………………………… 49
4.1.2 Morphology of NLC……………………………………………… 50
Univers
ity of
Mala
ya

viii
4.1.2.1 Optical polarizing microscope (OPM)………………...…. 50
4.1.2.2 Transmission electron microscope (TEM)…………..…… 52
4.1.3 Thermal analysis of NLC…………………………………….…... 53
4.1.4 Encapsulation efficiency of active ingredients in NLC……....….. 57
4.2 Characterization of thermoresponsive gel……………………………….. 59
4.2.1 Rheological characterization…………………………………….. 59
4.2.1.1 Viscometry test…………………………………………... 59
4.2.1.2 Linear viscoelastic behavior………………………….….. 61
4.2.1.3 Isothermal frequency sweep test…………………….…... 63
4.2.1.4 Temperature ramp test……………………………….…... 66
4.2.2 Morphology of thermoresponsive gel…………………………..... 72
4.3 Characterization of NLC-gel…………………………………………….. 73
4.3.1 Rheological characterization of gel samples…………………….. 73
4.3.1.1 Viscometry test…………………………………………... 74
4.3.1.2 Oscillatory tests………………………………………….. 75
4.3.2 In vitro release………………………………………………….... 78
4.3.2.1 Mathematical model evaluations……………………........ 83
CHAPTER 5: CONCLUSION…………………………………………………. 88
References………………………………………………………………………... 90
List of publications.……………………………………………………………..... 100
Appendix………………………………………………………………………….. 101
Univers
ity of
Mala
ya

ix
LIST OF FIGURES
Figure 2.1:
Schematic illustration of emulsion droplets and lipid nanoparticles…………………………………………….............
12
Figure 3.1:
Schematic illustration of preparation of NLC using hot homogenization method………...…………………………….…
21
Figure 3.2: Schematic illustration of measurement volume of sample at (a) normal scatter 90˚ and (b) backscatter 173˚……………………...
23
Figure 3.3:
Schematic illustration of zeta potential of a particle…………….. 25
Figure 3.4:
Determination of phase transition and enthalpy change from a DSC curve………...……………………………………….…….
27
Figure 3.5:
Determination of yield stress, σy from the shear viscosity-shear stress curve……………...……………………………….………
32
Figure 3.6:
Determination of critical strain, γc from the storage modulus-strain curve…................................................................................
33
Figure 3.7:
Determination of crossover temperature, Tc from the moduli-temperature curve…………………………………………….....
33
Figure 4.1:
Chemical structure of lecithin………….………….……...…….. 42
Figure 4.2:
Mean particle size (solid symbol) and polydispersity index (open symbol) of T40 (■), T60 (●) and T80 (▲) as a function of storage time, at 25 ˚C………………………………….............................
44
Figure 4.3:
Mean particle size (solid symbol) and polydispersity index (open symbol) of TL1 (■), TL3 (●), TL4 (▲), TL5 (▼) and TL6 ( ) as a function of storage time, at 25 ˚C…….……………...……...
46
Figure 4.4: Zeta potential of TL1 (■), TL3 (●), TL4 (▲), TL5 (▼) and TL6 ( ) as a function of storage time, at 25 ̊ C……………………......
47
Figure 4.5: Mean particle size (solid symbol) and polydispersity index (open
symbol) of NLCs loaded with alpha-tocopherol at concentrations of 0.1% (■), 0.2% (●), 0.3% (▲), 0.4% (▼) and 0.6% ( ) as a function of storage time, at 25 ˚C....………...........
48
Univers
ity of
Mala
ya
x
Figure 4.6: Mean particle size (solid symbol) and polydispersity index (open symbol) of NLCs loaded with hydroquinone at concentrations of 0.1% (■), 0.2% (●) and 0.3% (▲) as a function of storage time, at 25 ˚C……………………………………………………….….
50
Figure 4.7: Polarizing micrographs of lecithin at 28.4 ˚C and 182.8 ˚C……. 51
Figure 4.8:
Polarizing micrographs of lecithin before and after addition of oleic acid………………………………………………………...
51
Figure 4.9:
The melting and re-crystallization processes of air-dried NLC…. 51
Figure 4.10:
TEM micrographs of NLCs (a) without lecithin, TL1 and (b) with lecithin, TL4…………………………………………...…..
52
Figure 4.11: TEM micrographs of NLCs loaded with (a) 0.1% and (b) 0.6% alpha-tocopherol………………………………………………...
53
Figure 4.12:
Endothermic thermogram of stearic acid……………...….…….. 54
Figure 4.13:
Endothermic thermograms of NLCs containing 0% ( ̶ ), 0.1% ( ̶ ), 0.2% ( ̶ ) and 1.5% ( ̶ ) of lecithin…………………..………..…
56
Figure 4.14: Thermogram shows the melting and recrystallization processes of air-dried TL1 upon heating and cooling scans, corresponding to the polarizing micrographs………………..……………….....
56
Figure 4.15: Chemical structure of alpha-tocopherol……………...……….… 57
Figure 4.16: Encapsulation efficiency of alpha-tocopherol (■) and hydroquinone (●) as a function of concentration of active ingredient loaded in NLC……………………...………………..
58
Figure 4.17:
Chemical structure of hydroquinone...……...……………........... 58
Figure 4.18: (a) Yield stress, σy and (b) Power-Law index, n of gel mixtures ιc28 (□), ιc37 (○), ιc55 ( ), ιc73 ( ) and ιc82 (◊) as a function of percentage concentration of Ca2+ ions, at 25 ̊ C.........................
59
Figure 4.19: Shear viscosity, η of gel mixtures (a) ιc55 and (b) ιc73 in 0% (□), 0.02% (○), 0.04% ( ), 0.06% ( ) and 0.08% (◊) of Ca2+ ion solutions as a function of shear rate, at 25 ̊ C…...……...………...
60
Univers
ity of
Mala
ya

xi
Figure 4.20: Critical strain, γc of gel mixtures ιc28 (■), ιc37 (●), ιc55 (▲), ιc73 (▼) and ιc82 (♦) as a function of percentage of Ca2+ ions, at 25 ˚C………………………………………………………….....
62
Figure 4.21:
Storage modulus, G’ (solid symbol) and loss modulus, G’’ (open symbol) of gel mixtures (a) ιc37 and (b) ιc73 in 0% (■), 0.02% (●), 0.04% (▲), 0.06% (▼) and 0.08% (♦) of Ca2+solutions as a function of strain, at 25 ̊ C……………………………………….
63
Figure 4.22: Storage modulus, G’ (solid symbol) and loss modulus, G’’ (open symbol) of gel mixtures (a) ιc28 (■), ιc37 (●), ιc55 (▲), ιc73 (▼) and ιc82 (♦) in 0.06% Ca2+ solution, at 25 ̊ C………….....…
64
Figure 4.23: Storage modulus, G’ (solid symbol) and loss modulus, G’’ (open symbol) of gel mixture ιc73 in 0% (■), 0.02% (●), 0.04% (▲), 0.06% (▼) and 0.08% (♦) of Ca2+ solutions as a function of frequency, at 25 ˚C………………….……………………….......
65
Figure 4.24: The slope of G’ of gel mixtures ιc28 (■), ιc37 (●), ιc55 (▲), ιc73 (▼) and ιc82 (♦) as a function of percentage of Ca2+ ions, at 25 ˚C……………………………………...……………….……......
66
Figure 4.25: Storage modulus, G’ (solid symbol) and loss modulus, G’’ (open symbol) of gel mixture ιc73d as a function of temperature during heating (■) and cooling (●) processes...........................................
67
Figure 4.26:
Storage modulus, G’ (■), loss modulus, G’’ (□) and phase angle, δ (●) of gel mixtures (a) ιc28d and (b) ιc55d as a function of temperature during heating process……………………………...
69
Figure 4.27: Proposed electrostatic interactions formed between Ca2+ ion and the negatively charged center oxygen on sulfate functional groups of ι-C molecules…………………………………………
71
Figure 4.28:
Proposed electrostatic interactions formed between Ca2+ ion and the negatively charged center oxygen on carbonyl functional groups of CMC molecules……….…………………………........
71
Figure 4.29: Proposed linkage between CMC and ι-C molecules by forming electrostatic interactions with Ca2+ ion respectively….…..……...
71
Figure 4.30: Coupled network formed between double helices of ι-C and CMC molecules, producing a rigid gel at low temperature. The double helices transform into coils upon heating, losing the gel network and therefore the solution starts flowing………....……..
72
Univers
ity of
Mala
ya

xii
Figure 4.31:
FESEM micrographs of freeze-dried gel mixtures (a) ιc73a and (b) ιc73c…………………………………………………………
73
Figure 4.32: Viscosity, η of gel samples ιc37d (■), NLC-gel (●), alpha-
tocopherol gel (▲), alpha-tocopherol loaded NLC-gel (▼), hydroquinone gel (♦) and hydroquinone loaded NLC-gel (◄) as a function of shear rate, at 25 °C………………..…………..........
74
Figure 4.33: Storage modulus, G’ (solid symbol) and loss modulus, G’’ (open symbol) of gel samples ιc37d (■), NLC-gel (●), alpha-tocopherol gel (▲), alpha-tocopherol loaded NLC-gel (▼), hydroquinone gel (♦) and hydroquinone loaded NLC-gel (◄) as a function of (a) strain in amplitude sweep and (b) frequency in frequency sweep, at 25 ˚C………….……....................................
76
Figure 4.34: Storage modulus, G’ (solid symbol) and loss modulus, G’’ (open symbol) of gel samples ιc37d (■), NLC-gel (●), alpha-tocopherol gel (▲), alpha-tocopherol loaded NLC-gel (▼), hydroquinone gel (♦) and hydroquinone loaded NLC-gel (◄) as a function of temperature…………………………...…….……..
78
Figure 4.35: Images of hydroquinone loaded NLC-gel (left) and hydroquinone gel (right)……………………………….………..
78
Figure 4.36: Cumulative release of active ingredients from active ingredient
solution (■), active ingredient loaded NLC dispersion (●), active ingredient gel (▲) and active ingredient loaded NLC-gel (▼) for (a) alpha-tocopherol and (b) hydroquinone as a function of time, at 37 ˚C………………...….…………………………………......
79
Figure 4.37: Cumulative release of active ingredients from active ingredient gel (■) and active ingredient loaded NLC-gel (●) for (a) alpha-tocopherol and (b) hydroquinone as a function of time, at 37 ˚C (solid symbol) and 30 ˚C (open symbol)………...……………...
82
Figure 4.38: Schematic illustrations of alpha-tocopherol and hydroquinone loaded NLCs, respectively...…………………...………………..
83
Univers
ity of
Mala
ya
xiii
LIST OF TABLES
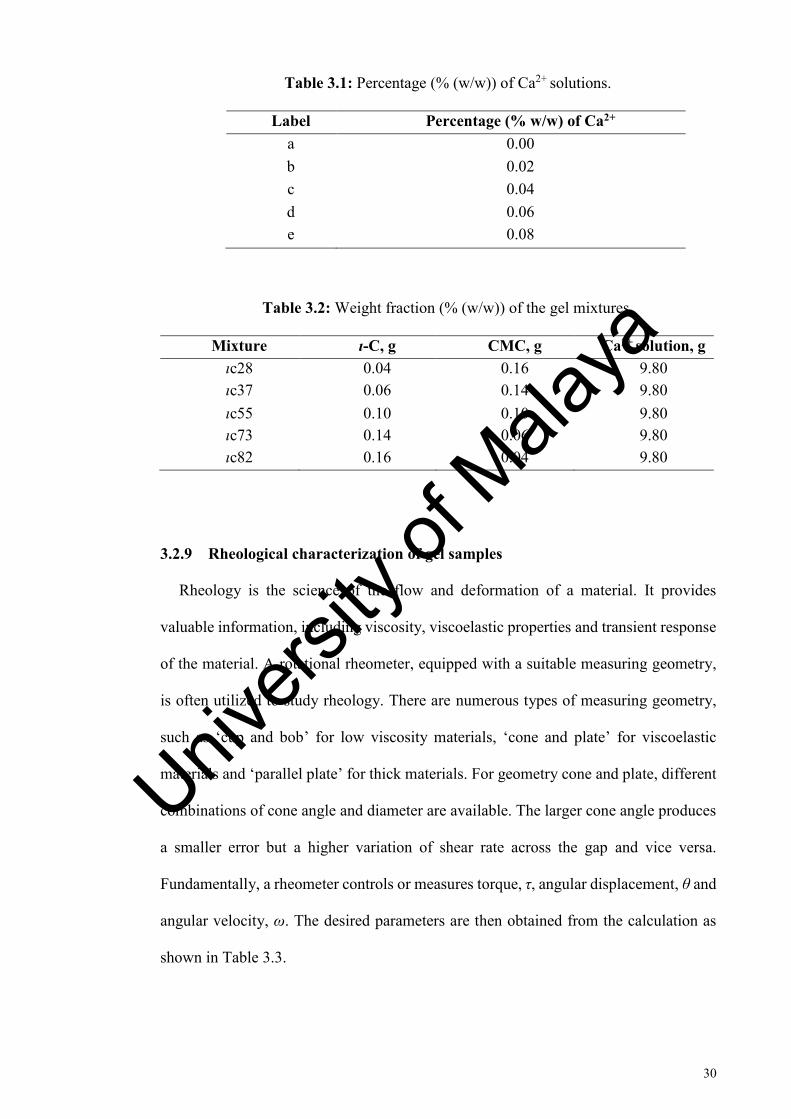
Table 3.1: Percentage (% (w/w)) of Ca2+ solutions……...……………….….. 30
Table 3.2: Weight fraction (% (w/w)) of the gel mixtures...………….…....... 30
Table 3.3: Mathematical functions of rheology parameters………...…….…. 31
Table 3.4: Mathematical models for drug release characterization (Singhvi & Singh, 2011)……………………………………………....……
37
Table 3.5: Types of drug transport determined by Korsmeyer-Peppas and Peppas-Sahlin models (Singhvi & Singh, 2011)…………....…….
38
Table 4.1: Effect of production parameters on mean particle size and PDI of NLCs……………………………………………………………..
40
Table 4.2: Effect of lipid composition on mean particle size, PDI and zeta
potential of NLCs……………………...……………………........
41
Table 4.3: Types of Tween surfactants…………………………………….... 43
Table 4.4: Formulations of NLCs with different surfactant compositions....... 45
Table 4.5: Melting point (Tm), peak width at half minimum (∆T1/2), melting enthalpy (∆H) and degree of crystallinity of NLCs ...……..….....
55
Table 4.6: Crossover temperature, Tc (˚C) of gel mixtures……..…………... 68
Table 4.7: Mathematical model evaluations of alpha-tocopherol released
from samples B, C and D at 37 ˚C……………………………….
84
Table 4.8: Mathematical model evaluations of hydroquinone released from sample F at 37 ˚C………………………………...………………
85
Table 4.9: Mathematical model evaluations of hydroquinone released from
sample G at 37 ˚C……………………………………………...…
86
Table 4.10: Mathematical model evaluations of hydroquinone released from sample H at 37 ˚C………………………………………………...
86
Univers
ity of
Mala
ya

xiv
LIST OF SYMBOLS AND ABBREVIATIONS
BEMT : Bis-ethylhexyloxyphenol methoxyphenyl triazine
CMC : Carboxymethyl cellulose
CoQ10 : Coenzyme-Q10
DLS : Dynamic light scattering
DSC : Differential scanning calorimetry
FESEM : Field emission scanning electron microscope
HLB : Hydrophilic-lipophilic balance
LCST : Low critical solution temperature
LVR : Linear viscoelastic region
NIBS : Non-invasive backscatter
NLC : Nanostructured lipid carriers
o/w : Oil-in-water
OCT : 2-Ethylhexyl-2-cyano-3,3-diphenylacrylate
OMC : 2-Ethylhexyl trans-4-methoxycinnamate
OPM : Optical Polarizing Microscope
PAA : Poly(acrylic acid)
PBS : Phosphate buffer saline
PDEAAm : Poly(N,N-diethylacrylamide)
PDI : Polydispersity index
PLI : Power-Law index
PMAA : Poly(methacrylic acid)
PNIPAM : Poly(N-isopropylacrylamide)
SLN : Solid lipid nanoparticles
SPF : Sun protector factor
Univers
ity of
Mala
ya

xv
TEM : Transmission electron microscope
UCST : Upper critical solution temperature
UV : Ultraviolet
UV-vis : Ultraviolet-visible
w/o : Water-in-oil
ι-C : iota-Carrageenan
�̇� : Shear rate
∆H : Melting enthalpy
∆Hf298 : Bond dissociation energy
∆T1/2 : Peak width at half minimum
C1 : Stress constant
C2 : Strain constant
f : Frequency
G’ : Storage modulus
G’’ : Loss modulus
n : Power-Law index
r : Diameter of measuring geometry cone and plate
R2 : Coefficient of determination
R2adj. : Adjusted coefficient of determination
T : Temperature
Tc : Crossover temperature
Tm : Melting point
γc : Critical strain
δ : Phase angle
η : Viscosity
θ : Angular displacement
Univers
ity of
Mala
ya

xvi
θG : Cone angle of measuring geometry cone and plate
λ : Wavelength
σ : Shear stress
σy : Yield stress
τ : Torque
ω : Angular velocity
𝛾 : Shear strain
Univers
ity of
Mala
ya

1
CHAPTER 1: INTRODUCTION
1.1 General introduction
Personal appearance is always related to first impression, self-esteem and self-
confidence although it is an often disregarded part of communication skills. As such,
people today are more concerned about taking care of their appearance. This has allowed
a rapid growth in the cosmetic industry in the last 20 years, where the global beauty
market had grown by 4.5% a year on average, proving its ability to achieve stable and
continuous growth, even in unfavorable economic conditions (Lopaciuk & Loboda,
2013). In order to design an appropriate cosmetic formulation, understanding how the
skin functions is necessary. Being the largest organ of our body, the skin interfaces with
the environment and protects the body against pathogens and excessive water loss,
making it vital in guarding muscles, bones, ligaments and internal organs. There are
many skin types, ranging from dry to oily, providing a diverse habitat for various
bacteria, which causes skin problems and diseases. The outer most layer of skin, known
as epidermis, has no blood vessels and is nourished by diffusion of liquid and nutrients
from the dermis. Therefore, topical application is important to nourish the skin from the
exterior (Souto & Müller, 2008).
Semisolid formulations have been in use in topical application since the ancient
times. Both cream and gel systems are well established for topical delivery of drugs and
active ingredients to supplement the skin in pharmaceutical and cosmetic industries.
During the development of novel topical formulations, stability and shelf life become
the main concern. Gel formulations are considered superior to cream formulations,
which are always limited by potential separation problems. Moreover, the absence of
greasiness and residue upon application on haired skin adds credit to the gel
formulations (Beaurline et al., 1999; Richter & Steiger, 1999). Nonetheless, gels are
Univers
ity of
Mala
ya
2
restricted by insolubility or degradation of active ingredients in the aqueous system and,
in some cases, poor spreadability on skin upon usage. For a gel system with good
spreadability and stability, the gel has to remain as a solid at room temperature and
easily flow when applied to the skin. Therefore, a thermoresponsive material falls in the
priority of choices to produce a gel system with such properties. Alternatively, a carrier
system can be incorporated into the gel system to deliver hydrophobic active
ingredients, while at the same time protecting the active ingredients from chemical
degradation by the surrounding dispersion medium.
Solid lipid nanoparticles (SLN), an alternative carrier system to emulsions, liposomes
and polymeric nanoparticles, were developed at the beginning of 1990s-, by replacing
the liquid lipid of an emulsion with solid lipids (Lucks & Muller, 1998). While most
colloidal carrier systems are designed to modify the release profile of the loaded drug,
SLN has the added advantage that it has a minimum risk of toxicity as organic solvents
are not involved in the production. Moreover, incorporation of a drug into the solid lipid
matrix can prevent chemical degradation of the active compound, caused by the
dispersing aqueous medium where the drug is easily diffused and being degraded.
However, the crystalline state of nanoparticles which tends to transform into a more
stable modification is associated with the risk of gelation, particle growth and potential
expulsion of active compounds during storage (Freitas & Müller, 1999; Liu et al., 2007;
zur Mühlen et al., 1998). The second generation of lipid nanoparticles, known as
nanostructured lipid carriers (NLC), was developed to minimize the limitations of SLN
by introducing liquid lipids into the solid lipid matrix to reduce its crystallinity (Mehnert
& Mäder, 2001; Mueller et al., 2000). This difference in structure increases the loading
capacity of nanoparticles for active compounds. Both SLN and NLC are useful in topical
application for their excellent tolerability and occlusive properties. In comparison, with
direct addition of active compounds, which are sensitive to light and oxidation,
Univers
ity of
Mala
ya

3
enhancement of the chemical stability of the active compounds can be achieved by
loading into the lipid nanoparticles before incorporation into the semisolid formulation
(Pardeike et al., 2009).
Vitamin E is a lipid-soluble compound essential for health. By acting against
oxidation, which is linked to numerous diseases, especially cancer and ageing, vitamin
E has been merchandised for its antioxidant properties (Albanes et al., 1995; Podda &
Grundmann-Kollmann, 2001). Besides being taken as dietary supplements, vitamin E
can be applied topically to delay ageing by nourishing the skin and protecting the cells
from damaging effects caused by free radicals (Rizvi et al., 2014). However, vitamin E
is sensitive to light and water-insoluble, posing a problem to the formulators. In order
to enhance its stability and shelf-life, vitamin E can be loaded into lipid nanoparticles
for topical use.
Hydroquinone is a ubiquitous ingredient used in the cosmeceutical field for
depigmentation purposes. There are various mechanisms suggested for its action,
including inhibition of tyrosinase synthesis, prohibition of tyrosinase effects, which are
responsible for melanin production and destruction of melanocytes. Nonetheless, it was
known to cause undesirable side effects when used excessively such as ochronosis, post-
inflammatory pigmentation, discoloration of nails and contact dermatitis (Agorku et al.,
2016; Couteau & Coiffard, 2016). In addition, formulation of hydroquinone is limited
by its oxidation instability and poor skin penetration due to the hydrophilic structure.
As such, a carrier system is required to load the active compound into the aqueous
dispersing medium to provide an effective treatment of hydroquinone, while minimizing
the dosage (Ghanbarzadeh et al., 2015).
In present study, the ability of NLC to carry active ingredients with different water
solubility, which were alpha-tocopherol (a type of Vitamin E) and hydroquinone, was
Univers
ity of
Mala
ya

4
investigated. The materials used to prepare the NLC were fatty acid and lecithin that
had been studied extensively to produce a stable NLC system besides their low cost and
easy availability. The loaded NLC was then incorporated into a thermoresponsive gel,
which exhibited flow behavior in the vicinity of body temperature. Carboxymethyl
cellulose (CMC) and iota-carrageenan (ι-C) were chosen as the gelling polymers for
their temperature-dependent gelling properties with good sensorial during application.
The rheological properties and in vitro release profile of the samples were evaluated.
1.2 Objectives of research
1. To formulate a thermoresponsive gel system.
2. To prepare fatty acid-lecithin lipid nanoparticles for loading active ingredients
alpha-tocopherol and hydroquinone.
3. To study in vitro release of active ingredients and rheology of nanolipid
incorporated thermoresponsive gel.
Univers
ity of
Mala
ya
5
CHAPTER 2: LITERATURE REVIEW
2.1 Topical delivery
Topical formulations are no longer simple emulsions or lotions to deliver plant
extracts to nourish our skin. Actives delivery technologies are extensively developed as
formulation approaches that improve stability and efficacy, while reducing irritation in
a meaningful way. Topical delivery has always been the first choice, either for cosmetic
or treatment of localized disease purposes, due to its convenience and pain-free self-
administration. It is also considered safer and generally inexpensive compared to the
other administration route such as oral and intravenous (Paudel et al., 2010).
Nonetheless, the main function of our skin as protection barrier has become the major
disadvantage in topical application, causing poor penetration and ineffectiveness of
active compounds.
Structurally, skin is made of two primary layers, known as the epidermis and dermis.
The outermost sub-layer of epidermis, stratum corneum, provides protection against the
intrusion of external substances into our body. Various approaches have been developed
to weaken the skin barrier, so that active ingredients, drugs or even toxins may penetrate
across the barrier layer. One of these approaches is the use of semisolid formulations,
such as creams and gels, by targeting skin appendages that are surrounded by capillary
networks, such as hair follicles and sweat glands (Zhang et al., 2014). Depending on the
designed delivery system, the extent and rate of transportation of active compounds can
be variable due to physicochemical properties of the drugs and constituent components
of the vehicle (Weiss, 2011). At the meanwhile, deep penetration into dermis layer is
not desired for general topical formulations as the contacting compounds may bring
adverse effects on dermal structure and more seriously systemic toxicity.
Univers
ity of
Mala
ya

6
2.2 Gels
A gel system is generally defined as a network of one phase dispersed in another
continuous phase, forming a three-dimensional network by either chemical covalent
bonds or non-covalent interactions. To be more specific, a gel system can be defined
both from structural features, based on the connectivity of the system, and also from a
rheological behavior, where the system does not flow. This is characterized by the
presence of a plateau region of storage modulus, G’ and the low tan phase angle, δ at an
angular frequency range from 10-3 to 102 rad s-1. There are two mechanisms of gelation,
classified as chemical and physical. Chemical gelation is irreversible, whereby the
weight average molecular weight diverges to infinity, while physical gelation formed
by hydrogen bonds or hydrophobic interactions is a reversible transformation (Nishinari,
2009; Winter, 1987).
Hydrogels are ubiquitous biopolymers widely used in the food, cosmetic,
pharmaceutical and medical sectors for their emulsifying and thickening properties. In
addition, their high water content and soft consistency, similar to natural tissue,
contribute to their biocompatibility (Janaswamy & Youngren, 2012; Peppas et al.,
2000). In topical applications, release of active compounds can be manipulated with
respect to the viscosity of hydrogel. A gelled solution enhances the drug flux when the
solvent or liquid phase evaporates, leaving high concentrations of drug in the
evaporating vehicle, while a highly viscous gel sustains drug release by trapping the
drug molecules in the porous gel network scaffold, causing hindered diffusion of the
drug molecules (Aulton & Taylor, 2013). The nature of side groups of the gel molecules
can also be utilized to manage the property of the gel under different environmental
conditions such as pH, temperature, ionic strength and UV-irradiation. Therefore, a gel
formulation can be designed to change their properties under certain conditions to serve
different purposes.
Univers
ity of
Mala
ya

7
2.2.1 Thermoresponsive gels
Thermoresponsive hydrogels like poly(N-isopropylacrylamide) (PNIPAM),
poly(N,N-diethylacrylamide) (PDEAAm), poly(acrylic acid) (PAA) and
poly(methacrylic acid) (PMAA) exhibit different gelling behavior in response to
temperature changes. There are two types of thermoresponsive behavior in which gel
with low critical solution temperature (LCST) becomes insoluble above a certain
temperature, while gel with upper critical solution temperature (UCST) becomes soluble
upon heating.
In previous years, studies for biomedical applications were mainly focused on
thermoresponsive hydrogels which are liquid at ambient temperature and transform into
gel at physiological temperature. This transition provides a user-friendly means for drug
delivery, cell encapsulation and tissue engineering. Hydrogels with LCST are able to
squeeze out the loaded drug below the LCST, due to gel collapsed by pressure generated
at high temperature (Bromberg & Ron, 1998; Jeong et al., 2012). In cell culture
substrates, the cells attach to the hydrophobic surfaces at temperature above LCST and
detach the hydrophilic surfaces at temperature below LCST (Klouda & Mikos, 2008).
Similarly, a combination of deacetylated chitosan and glycerol phosphate disodium salt
was investigated for its potential in tissue engineering. The formulation was reported to
form gel in the vicinity of 37 ˚C and was able to maintain the bioactivity of loaded bone
protein and viability of entrapped cells, then release them in the body (Chenite et al.,
2000). The proposed mechanisms for these reversible physical crosslinking of the
polymer chains include micelle packing and coil to helix transition. The response of
hydrogels towards temperature changes by swelling or contracting recently have also
found its application in catalysis. The catalyst is induced to move in and out of the
reactant layer according to the temperature applied, and as such playing a role as a
chemical reaction on/off switch (Hapiot et al., 2013).
Univers
ity of
Mala
ya

8
In topical applications, a thermorsensitive poloxamers gel system was developed as
a vehicle for an antifungal drug, fluconazole, which is delivered topically on to the
affected area (Gandra et al., 2015). The gel was formulated to transform from
Newtonian (liquid-like) behavior at 20 ˚C to non-Newtonian (solid-like) behavior at 37
˚C. Sustained release of fluconazole from the gel matrix at 37 ˚C was reported in the
study. On the other hand, a method utilizing thermoresponsive hydrogel for sustained
delivery of a drug to an ocular organ was invented (Fedorchak et al., 2014). A liquid
thermoresponsive hydrogel comprising drug loaded polymer microparticles was
topically delivered to the ocular surface, wherein the drug was sustainably released for
five days. In-situ gelation occurred in the lower fornix of the eye and therein the loaded
drug was released.
Typical pharmaceutical and cosmetic formulations involve a wide range of
ingredients, including electrolytes, co-solvent and surfactants. The effect of these
additives on the thermoresponsive behavior of hydrogel should be taken into
consideration, as the interactions between solvent and polymer directly affect the
hydrophobic/hydrophilic balance within the polymer molecules, where hydrophobic
interaction promotes gelation while hydrophilic interaction enhances solubility in
solvent. Therefore, the extent of shifted transition temperature can be counted in
(Schmaljohann, 2006).
Despite the concepts of thermoresponsive hydrogels being sound in research to date,
the practical application in industry is not common due to its slow response time and
poor biocompatibility. Hence, natural polysaccharides that have a rapid response to
temperature changes are preferred. In contrast to polymers used in biomedical
applications, a rigid hydrogel which flows as liquid at body temperature is desired for
topical applications (Qiu & Park, 2001).
Univers
ity of
Mala
ya
9
2.2.2 iota-Carrageenan (ι-C)
Carrageenan is one of the popular natural polysaccharides that possess
thermoresponsive properties. In general, it gels at low temperature and dissolve in water
upon heating. Carrageenan had been widely used as thickening or gelling agent in food,
cosmetic and pharmaceutical industries due to its economic benefits and easy
availability. This polymer is comprised of alternate units of d-galactose and 3, 6-
anhydro-galactose joined by α-1, 3 and β-1, 4-glycosidic linkage and can be obtained
by extraction from certain species of red seaweeds of the Rhodophyceae class. The three
main types of carrageenan, kappa (κ-), iota (ι-) and lambda (λ-) are, distinguished by
the number of sulfate groups per repeat unit of disaccharide, one, two and three,
respectively (Janaswamy & Chandrasekaran, 2005). The primary differences in the
degree of sulfation and position of the sulfate groups influences the polymer properties.
For instance, higher levels of ester sulfate gives lower solubility temperature and weaker
gel strength (Necas & Bartosikova, 2013). Therefore, κ-carrageenan forms the strongest
gel while λ-carrageenan does not form gel at any concentration.
Alternatively, ι-C in aqueous solution can be reversibly transformed from an ordered
conformation at low temperature to a random coil conformation at high temperature.
This disorder-order transition was observed by using a semi-empirical method which
correlated the optical rotation with the conformations at glycosidic linkage (Rees et al.,
1982). X-ray investigation also confirmed the double helix conformation in solid state
and its dissociation into single strands when the interchain hydrogen bonds in the double
helix were broken at high temperature (Janaswamy & Chandrasekaran, 2002).
Nevertheless, the gelation behavior of ι-C strongly depends on the types of counter ions
and its concentration. It was reported that the divalent cations, especially Ca2+ ions,
affect more on the ι-C gel system compared to monovalent cations (Kara et al., 2007;
Yuguchi et al., 2003).
Univers
ity of
Mala
ya
10
2.3 Colloidal carrier systems
In the past few decades, colloidal carrier systems have been employed to deliver
drugs or active ingredients through various administration routes, such as parenteral,
oral, topical and intravenous. Among these particulate carriers, liposomes, micelles,
microemulsions and polymeric nanoparticles possess the most appropriate
characteristics for encapsulation of drugs and active ingredients. As well as being
encapsulated in the core of particles, drug molecules can be covalently attached or
adsorbed onto the surface of nanocarriers.
Microemulsions are thermodynamically stable droplet type dispersion of oil and
water that is stabilized by surfactants (Lawrence & Rees, 2000). They are normally
transparent or translucent in appearance due to the small droplet size, typically less than
140 nm. Basically, there are two types of microemulsions, oil-in-water (o/w) to
encapsulate hydrophobic drugs and water-in-oil (w/o) to load hydrophilic drugs. Even
though microemulsions can be designed to slow or enhance release of the loaded drug,
high amounts of surfactants used are not favorable in body use.
Another famous nanocarrier is liposomes, which are spherical vesicles formed by
one or more phospholipid bilayers enclosing an aqueous compartment (Akbarzadeh et
al., 2013). Ideally, liposomes are able to encapsulate both hydrophobic and hydrophilic
drugs concurrently, making their use in drug delivery particularly attractive. Liposomes
were designed to mimic red blood cells in term of shape, size, surface charge and
material composition for intravenous application (Doshi et al., 2009; Naeem et al.,
2015). In spite of these advantages, liposomes are limited by potential systemic toxicity
as an organic solvent is required to dissolve the lipids. The fluidity of liposomes is also
possible to affect its stability in semisolid formulations, especially emulsions in which
the lipid content may fuse with the phospholipid bilayer of liposomes.
Univers
ity of
Mala
ya

11
Polymeric nanoparticles are either nanospheres (solid matrix particles) with lower
loading capacity or nanocapsules (vesicular systems surrounded by solid material shell)
with higher loading capacity (Rao & Geckeler, 2011). Nanocapsules are preferred
compared to nanospheres for their higher encapsulation and protection ability in
polymer shells against degradation activities. Nevertheless, production of polymeric
nanoparticles mostly involves organic solvents and thus lower biocompatibility.
2.3.1 Solid lipid nanoparticles (SLN)
Lipid nanoparticles was developed as an alternative drug carrier to microemulsions,
liposomes and polymeric nanoparticles, that combines their advantages including
modified release and protection of loaded ingredients, which are sensitive to light,
oxidation and hydrolysis, while at the same time avoiding their drawbacks. Lipid
nanoparticles possesses lower risk of toxicity and are biocompatible under physiological
conditions. Moreover, they meet industrial needs, such as low cost and high feasibility
for large scale production. The first generation, known as SLN, is a colloidal particle
composed of a solid lipid core which is stabilized by surfactants, ranging in size between
10 nm to 1000 nm (Puri et al., 2009).
In general, SLN has a similar structure to a lipid nanoemulsions, with the exception
of the replacement of liquid lipid by solid lipid. As shown in Figure 2.1, controlled
release of the loaded drug is achievable as the mobility of the drug in solid lipid should
be lower compared to liquid lipid (Garud et al., 2012; Mehnert & Mäder, 2001). SLN
can also protect the loaded drug against chemical degradation caused by the dispersing
medium as the drug molecules in lipid nanoemulsions easily diffuse through the
interfacial film of the droplet and enter the dispersing medium, where degradation
activities occur. Enhancement of stability and sustained release of labile compounds in
SLN were reported by many studies in the literature, for instances clotrimazole (Souto
Univers
ity of
Mala
ya

12
et al., 2004), frankincense and myrrh oil (Shi et al., 2012), coenzyme-Q10 (CoQ10)
(Teeranachaideekul et al., 2007), neem oil (Vijayan et al., 2013), retinoid (Jenning &
Gohla, 2001) and vitamin E (Shylaja & Mathew, 2016). However, not all encapsulated
drugs show slow release properties, a burst release of active compound can also occur.
Both burst release and slow release are of interest as burst release improves the
penetration of active compounds whilst sustained release controls the release of
irritating ingredients (Müller et al., 2000).
Figure 2.1: Schematic illustration of emulsion droplets and lipid nanoparticles.
A study comparing liposomes and SLN as carrier systems for CoQ10 demonstrated
that both SLN and liposomes were biocompatible and suitable for cell proliferation
(Gokce et al., 2012). In spite of having smaller particle size and higher drug entrapment
efficiency, SLN provided less protection against accumulation of reactive oxygen
species. Therefore, liposomes were considered more efficient in terms of topical
delivery of CoQ10 for antioxidant purposes.
SLN was also utilized to encapsulate sunscreen agents, which were related to
photoallergies, phototoxic reactions and skin irritation. Controlled release of the solar
screens from SLN could avoid those side effects, while enabling longer persistence on
the skin surface and as such providing prolonged photoprotection. For example, SLN
Univers
ity of
Mala
ya

13
incorporated with benzophenone-3 (Beck et al., 2011), 2-ethylhexyl-2-cyano-3,3-
diphenylacrylate (OCT), 2-ethylhexyl trans-4-methoxycinnamate (OMC) and bis-
ethylhexyloxyphenol methoxyphenyl triazine (BEMT) (Lacatusu et al., 2010) did not
exhibit allergenic potential and possessed higher sun protector factor (SPF) than the free
sunscreen unloaded in any carrier system due to the crystallization of sunscreens inside
the lipid core.
Using electron diffraction technique, it was discovered that lipids in the outermost
layer of the skin, the stratum corneum, were highly ordered (Pilgram et al., 1999).
Despite the hydrophobic nature of SLN, hydrophilic drugs could be loaded in SLN by
adsorbing on to the interfacial layer (surfactant) around the nanoparticles. As such, SLN
was assumed to increase the penetration and permeation of hydrophilic drugs by
carrying to diffusion across the lipid-enriched intercellular regions of the skin barrier.
For instances, diclofenac sodium (Liu et al., 2014), isoniazid (Nair et al., 2011; Rohit
& Pa, 2013), ciprofloxacin hydrochloride (Shah et al., 2012) and fluorescent dye
(Becker Peres et al., 2016) were all loaded in SLN using different methods to ensure
high encapsulation efficiency and prolonged release profiles.
Since encapsulated drugs are located within crystal lattice imperfections and between
fatty acid chains, the crystalline state of SLN is therefore associated with the risk of
gelation, particle growth and potential expulsion of active compounds during storage
(Freitas & Müller, 1999; Liu et al., 2007; Mueller et al., 2000).
2.3.2 Nanostructured lipid carriers (NLC)
In order to minimize the limitations of SLN, the second generation of lipid
nanoparticles was developed, commonly known as NLC. In NLC, solid lipid and liquid
lipid are blended and mixed to increase the loading capacity of SLN. Incorporated liquid
Univers
ity of
Mala
ya

14
lipid increases the distance between fatty acid chains and therefore generates
imperfections within the crystal lattice. These imperfections provide more room to
accommodate the guest active molecules (Mehnert & Mäder, 2001; Mueller et al., 2000;
Mukherjee et al., 2009).
According to Souto et al. (2004), both SLN and NLC were promising carriers for
topical delivery of clotrimazole, an antifungal medication. Even though the stability of
both systems were similar, NLC exhibited higher entrapment efficiency due to the
presence of liquid lipids. NLC showed a faster release and lower occlusive effect
compared with SLN with the same lipid content. These results were explained by the
physical morphology of the lipid particles. Due to the protective effect of NLC against
chemical degradation, NLC was always used to encapsulate antioxidants such as
ascorbyl palmitate (Teeranachaideekul et al., 2007) and β-carotene (Lacatusu et al.,
2012). Natural active compounds including green tea extract (Manea et al., 2014) and
Zingiber zerumbet oil (Rosli et al., 2015) were also loaded in NLC for enhanced
pharmaceutical and nutritional applications. Overall, these active compounds were
reported to be more stable and effective in NLC.
Despite the majority of attention being focused on cosmetic and pharmaceutical
applications, lipid nanoparticles also have the potential to be developed as a novel carrier
for chemotherapeutic drugs. Doktorovova et al. (2009) had done a review on the
different types of lipid carrier systems for paclitaxel in cancer treatment. Pre-clinical
data obtained from the previous studies indicated that SLN, NLC and lipid nanocapsules
were promising colloidal carriers to be used in future cancer therapy.
Alternatively, different compositions of NLC were studied to investigate their effect
on skin hydration and occlusion (Loo et al., 2013). It was observed that NLCs increased
skin hydration significantly, compared with untreated control and high physical
Univers
ity of
Mala
ya

15
stability, and it could be achieved with the highest amount of lipid and highest
concentration of solid lipid. Furthermore, addition of propylene glycol and lecithin into
the NLC formulation showed a more pronounced occlusion effect and long term
stability. Once again this emphasized the vital role of NLC in topical applications.
In spite of providing good sensory feel upon application, the aqueous medium of a
gel formulation can cause problems to the stability of the loaded active ingredients, such
as insolubility of the hydrophobic active ingredients and chemical degradation of the
sensitive active ingredients. Meanwhile, NLC dispersions, which enhance chemical
stability of the loaded active ingredients, are too flowing to be applied on the skin.
Therefore, incorporation of NLC into a gel formulation combines their advantages,
producing a topical product with good sensory feel, improved stability of the loaded
active ingredients and enhanced occlusive properties. Higher viscosity of a gel
formulation is also able to prevent the sedimentation of NLC, which is mainly caused
by the gravitational effect (Pardeike et al., 2009).
2.4 Lipid nanoparticles in topical formulations
Development of novel topical products is enhanced by the introduction of SLN or
NLC into the topical product formulations. SLN and NLC are well-tolerated carrier
systems, highly efficient in controlled release of loaded active ingredients besides acting
as a protection. In the past decade, there have been numerous studies related to the effect
of incorporation of lipid nanoparticles into topical formulations.
Effects of a conventional oil-in-water (o/w) cream and of the same cream enriched
with SLN on skin hydration and viscoelastic properties in vivo were evaluated (Wissing
& Müller, 2003). The results demonstrated that it was possible to incorporate SLN into
a cosmetic o/w cream to produce a physically stable formulation. The SLN-cream
Univers
ity of
Mala
ya

16
showed pronounced skin hydration and viscoelasticity compared to the conventional
cream. The increased hydration was assumed to be due to the occlusion properties of
SLN, which could help to reduce water loss from the skin’s surface. In the study,
nanoparticles with high crystallinity were observed to form a dense film on skin upon
application, which subsequently contributed to the occlusion effect.
Lipid nanoparticles have always been used to encapsulate water insoluble and
chemically unstable compounds such as CoQ10. CoQ10 has potent antioxidant
properties which had been shown to have beneficial effects on liver, heart, lung and skin
(Kocharian et al., 2009). It was also reported the effect of SLN on skin hydration by
comparing a simple cream of CoQ10 with a cream consisting of CoQ10-loaded SLN
(Farboud et al., 2011; Pardeike et al., 2010). Both the research groups reported
prolonged release of CoQ10 from SLN and improved skin hydration with lower
transepidermal water loss. The main reason suggested for the increased skin hydration
was the occlusion effect of SLN which further enhanced the penetration of CoQ10 into
the stratum corneum. Meanwhile, a good correlation between polymorphic transitions
and drug release was observed in a study which investigated the drug release of active
ingredient from a hydrogel and an o/w cream containing Vitamin A-loaded SLN
(Jenning et al., 2000). Humectants, thickening agents and surfactants used in the
hydrogel and o/w cream were found to protect the ß’ form of the lipid matrix from
transforming into the ß form rapidly. Such system showed slow drug expulsion and
hence stabilize the sustained release properties of SLN.
Besides cosmetic compounds, pharmaceutical and therapeutic drugs were also
incorporated into lipid nanoparticles to minimize the irritation effect. SLN was reported
as a promising carrier for follicular delivery of adapalene (Harde et al., 2015). The drug
encapsulated in SLN-gel performed better as an anti-acne agent and also revealed
Univers
ity of
Mala
ya

17
improved skin tolerability, compared with the conventional gel. Furthermore, poor
solubility and low bioavailability of an anti-T cell drug, known as Tacrolimus, were
successfully solved by loading the drug into a modified NLC consisting of lipophilic
solubilizers (Pople & Singh, 2011). The encapsulation efficiency was increased up to
96.66%. Same as the aforementioned studies, NLC showed advantages in gel
formulations with respect to the stability of Tacrolimus and skin localization.
As a conclusion, the literature reported many features of SLN and NLC that were
advantageous in topical application for cosmetic and pharmaceutical products. Lipid
nanoparticles have assured occlusive properties to enable deep penetration of loaded
drugs into the skin. There are several topical products containing lipid nanoparticles
found on the market, such as Dr. Rimpler Cutanova Cream Nano Repair Q10 (2005),
Beate Johnen NLC Deep Effect Repair Cream (2006), Chemisches Laboratorium Dr.
Kurt Richter Nanolipid Q10 CLR (2006), Scholl Regenerationscreme Intensive (2007),
Isabelle Lancray SURMER Crème Contour Des Yeux (2008) and Dr. Theiss
NanoRemodelante Olivenöl Anti Falten Pflegekonzentrat (2008) (Woo, 2014).
2.5 Rheology in topical application
Rheology is fundamental in the optimization of a topical formulation as it is
associated with the flow behavior of a semisolid system under physical deformations,
which gives rise to the prediction of spreadability on the skin, dispensing from the
packaging and physical stability during storage (Martin, 1993). In particular, the
plasticity, viscoelasticity and rigidity of a material under the influence of stress are
investigated in rheological tests. These rheological properties are useful in designing the
manufacturing processes, packaging materials and even delivery of active ingredients
(Gennaro, 2000; Lieberman et al., 1996).
Univers
ity of
Mala
ya

18
Surfactants are commonly used in topical products. Above the critical concentration,
surfactants tend to form micelles, which may appear in spherical or anisometric shapes,
such as rods. In contrast to the monodisperse spherical micelles, micelles in rods shape
are always polydisperse where the average length rises with the concentration. The
viscosity of the surfactant solution can be increased dramatically by adding electrolyte
to form thread-like, flexible micelles that overlap and entangle with one another
(Hoffmann et al., 1992). Regardless to the application, an oscillation viscometer was
employed to investigate the effects of different ionic strength of surfactants and salt on
the network of surfactant solutions (Balzer et al., 1995). Aqueous solutions of fatty
alcohol ether sulfate and carboxymethylated fatty alcohol ethoxylate (anionic
surfactants), when blended with salt or cation surfactants or zwitterionic surfactants,
showed viscoelastic properties and Maxwell behavior. In the study, the properties of a
liquid thread was related to the balance of elasticity and viscosity.
With respect to the complexity of the nanostructured carriers, which are incorporated
in semisolid system, rheological analysis is essential to understand the interactions
between the dispersing system, nanoparticles and active ingredients. For example,
liposomes (Tan & Misni, 2014), polymeric nanoparticles (Alves et al., 2005; Milao et
al., 2003; Terroso et al., 2009) and lipid nanoparticles (Junyaprasert et al., 2009;
Pardeike et al., 2009) were incorporated into hydrogels and creams to evaluate their
rheological pattern before and after incorporation of active ingredients, loaded or
unloaded nanoparticles. It was reported that a wide range of viscosities could be
achieved by manipulating the solid content of the nanocarriers.
Junyaprasert et al. (2009) and his co-workers had studied the difference between
CoQ10-loaded nanoemulsions and CoQ10-loaded NLC in terms of stability, rheology
and skin permeation before and after incorporation into a hydrogel. It was observed that
Univers
ity of
Mala
ya

19
both CoQ10-loaded carrier systems, stored at all temperatures without exposure to light,
were stable up to 12 months. After 6 months storage, storage modulus, G’ of CoQ10-
loaded NLC gel slightly increased, explained by the spatial arrangement in lipid matrix
of NLC during storage. Alternatively, the incorporation of triamcinolone acetonide
acetate-loaded SLN improved the thixotropy properties of a Carbopol gel, compared
with the blank gel (Liu et al., 2008). Similar results were obtained in a rheological study
of Carbopol gel loaded with NLC containing minoxidil (Silva et al., 2009).
On the basis of rheological studies, distribution of topical products on skin or hair,
and their thread-forming behavior can be tailored to meet the consumers’ expectations.
The literature proved that performance of a topical product can be evaluated via
rheological tests prior to in vivo tests, and as such, saves the analysis cost.
Univers
ity of
Mala
ya

20
CHAPTER 3: MATERIALS AND METHOD
3.1 Materials
Stearic acid (95%), oleic acid (99%), Tween 80, iota-carrageenan (ι-C),
phosphotungstic acid hydrate and phosphate buffered saline tablets (pH 7.4) were
purchased from Sigma Aldrich (St. Louis, USA). Calcium chloride (CaCl2) anhydrous
and methanol (analytical grade) were obtained from Merck and carboxymethyl cellulose
(CMC) was supplied by Dai-Ichi Kogyo Seiyaku (Kyoto, Japan), respectively. Lecithin
was purchased from Alfa Aesar (Massachusetts, USA) and ethanol 95% was supplied
by Bumi-Pharma (Malaysia). Hydroquinone was obtained from BDH Laboratory
Supplies (UK) and alpha-tocopherol was purchased from Spectrum (New Jersey, USA).
All solutions and samples were prepared with deionized water of 18.2 Ω cm-1 resistivity,
which was supplied from a Barnstead Diamond Nanopure Water Purification unit
coupled with a Barnstead Diamond RO unit (Barnstead International, USA).
3.2 Methodology
3.2.1 Preparation of NLC
NLC was prepared by employing the hot homogenization method using a high shear
homogenizer (Heidolph Silent Crusher M, Germany). NLC of different concentration
of fatty acid and surfactants were prepared to obtain the optimized formulation.
Similarly, the speed and time of homogenization were manipulated to obtain the most
stable formulation. Nevertheless, the ratio of lipid phase to aqueous phase was remained
at 2 to 23. The lipid phase, containing stearic acid and oleic acid was heated in a water
bath thermostated at 80 ˚C until the mixture became a clear liquid. Surfactant solution
(Tween 80) was pre-heated at the same temperature and dispersed into the lipid phase
under strong agitation. The hot emulsion was then poured into cold water, at
approximately 2 ˚C under magnetic stirring, where solidification of lipids occurred.
Univers
ity of
Mala
ya
21
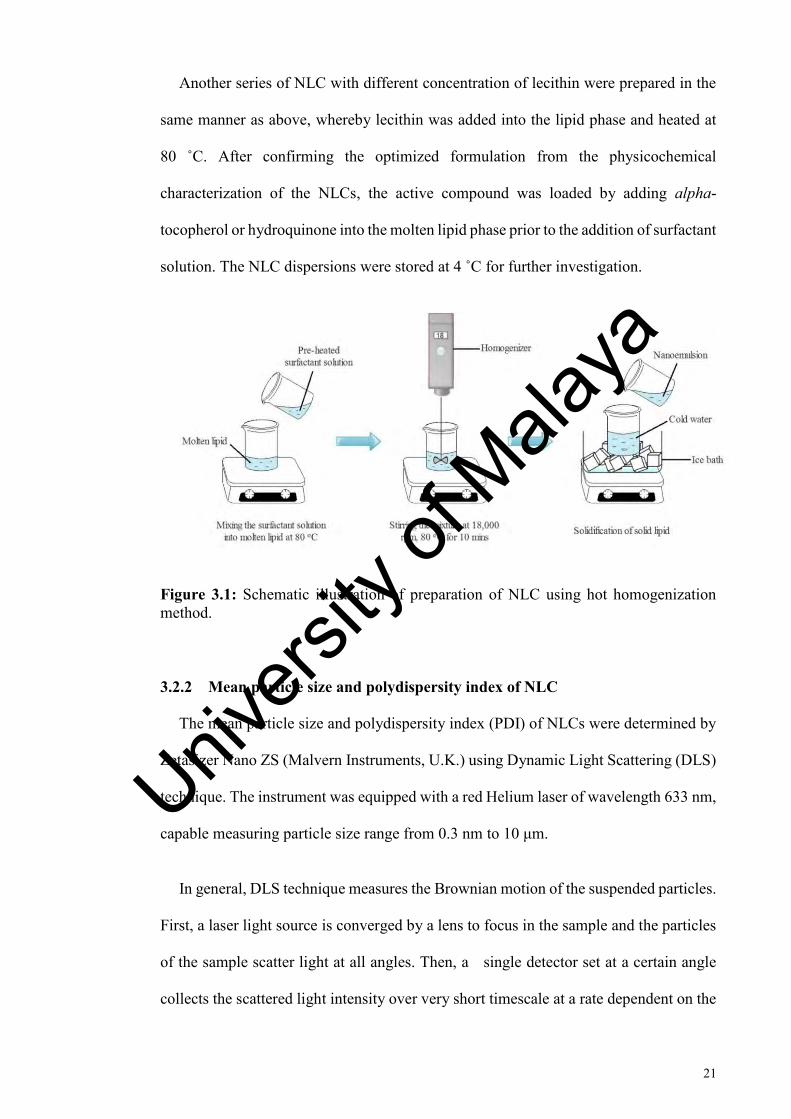
Another series of NLC with different concentration of lecithin were prepared in the
same manner as above, whereby lecithin was added into the lipid phase and heated at
80 ˚C. After confirming the optimized formulation from the physicochemical
characterization of the NLCs, the active compound was loaded by adding alpha-
tocopherol or hydroquinone into the molten lipid phase prior to the addition of surfactant
solution. The NLC dispersions were stored at 4 ˚C for further investigation.
Figure 3.1: Schematic illustration of preparation of NLC using hot homogenization method.
3.2.2 Mean particle size and polydispersity index of NLC
The mean particle size and polydispersity index (PDI) of NLCs were determined by
Zetasizer Nano ZS (Malvern Instruments, U.K.) using Dynamic Light Scattering (DLS)
technique. The instrument was equipped with a red Helium laser of wavelength 633 nm,
capable measuring particle size range from 0.3 nm to 10 μm.
In general, DLS technique measures the Brownian motion of the suspended particles.
First, a laser light source is converged by a lens to focus in the sample and the particles
of the sample scatter light at all angles. Then, a single detector set at a certain angle
collects the scattered light intensity over very short timescale at a rate dependent on the
Univers
ity of
Mala
ya

22
particle size. The intensity fluctuations yields velocity of Brownian motion known as
translational diffusion coefficient by a correlation function, as shown in Eq. 3.1.
𝐺(𝑡) = 𝐴𝑐[1 + 𝐵 𝑒𝑥𝑝 (−2𝛤𝑡)] Eq. 3.1
Γ = 2𝐷𝑞2 Eq. 3.2
Where G(t) is the scattered intensity, Ac is the baseline of correlation function, B is the
intercept of correlation function, Г is the relaxation time, D is the translational diffusion
coefficient, q is the scattering vector and t is the delay time between two intensity
measurements.
Since small particles move more rapidly and large particles move more slowly,
Stokes-Einstein relationship is then used to correlate the diffusion speed with particle
size as shown in the following equation:
𝑑 =𝑘𝑇
3𝜋𝜂𝐷 Eq. 3.3
Where d is the hydrodynamic diameter of particle, k is the Boltzmann’s constant, T is
the absolute temperature, η is the viscosity of sample and D is the translational diffusion
coefficient. This relationship assumes that the particles are spherical and there is no
interaction among them. The particle size distribution is obtained from Eq. 3.3 as well.
The broadness of the size distribution is then calculated and indicated by PDI, ranges
from 0 to 1. PDI that close to 0 reveals a monodisperse sample while PDI close to 1
indicates a polydisperse sample.
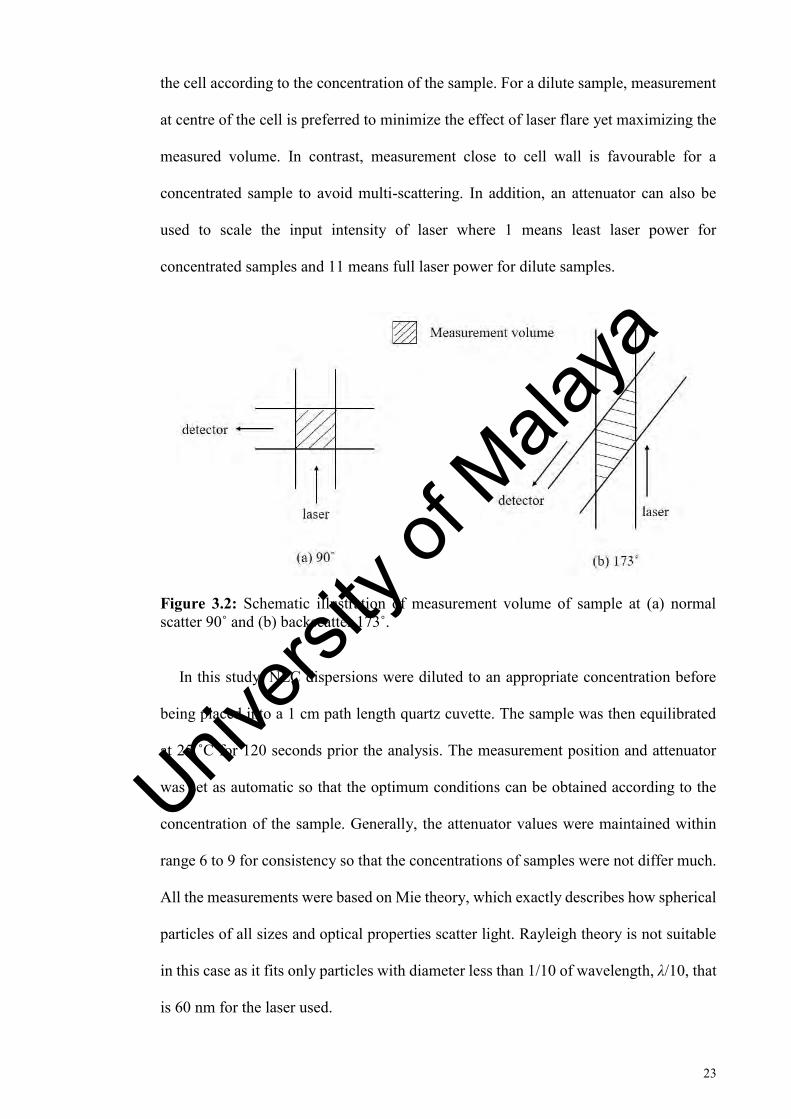
The instrument utilizes non-invasive backscatter (NIBS) technology for detection.
The light scattered by a sample is measured at a scattering angle of 173˚ to increase the
measurement volume where a higher volume of sample is illuminated by laser (Figure
3.2). The effect of large particles such as dust or contaminant can also be minimized in
this detection attributed to the fact that large particles scatter light primarily at forward
angle. Moreover, the focus lens can be moved to adjust the measurement position within
Univers
ity of
Mala
ya
23
the cell according to the concentration of the sample. For a dilute sample, measurement
at centre of the cell is preferred to minimize the effect of laser flare yet maximizing the
measured volume. In contrast, measurement close to cell wall is favourable for a
concentrated sample to avoid multi-scattering. In addition, an attenuator can also be
used to scale the input intensity of laser where 1 means least laser power for
concentrated samples and 11 means full laser power for dilute samples.
Figure 3.2: Schematic illustration of measurement volume of sample at (a) normal scatter 90˚ and (b) backscatter 173˚.
In this study, NLC dispersions were diluted to an appropriate concentration before
being placed into a 1 cm path length quartz cuvette. The sample was then equilibrated
at 25 ˚C for 120 seconds prior the analysis. The measurement position and attenuator
was set as automatic so that the optimum conditions can be obtained according to the
concentration of the sample. Generally, the attenuator values were maintained within
range 6 to 9 for consistency so that the concentrations of samples were not differ much.
All the measurements were based on Mie theory, which exactly describes how spherical
particles of all sizes and optical properties scatter light. Rayleigh theory is not suitable
in this case as it fits only particles with diameter less than 1/10 of wavelength, λ/10, that
is 60 nm for the laser used.
Univers
ity of
Mala
ya

24
3.2.3 Zeta potential of NLC
Zeta potential of NLCs was measured by Zetasizer Nano ZS (Malvern Instruments,
U.K.). Electrophoresis and laser Doppler velocimetry techniques are utilized to measure
the velocity of a particle moving in liquid when an electric field is applied and zeta
potential is calculated using Henry equation (Eq. 3.4) as below:
𝑈𝐸 =2𝜀𝜁 𝑓(𝑘𝑎)
3𝜂 Eq. 3.4
Where UE is the electrophoretic mobility or velocity, ε is the electric constant, ζ is the
zeta potential, f(ka) is the Henry’s function where Smoluchowski approximation = 1.5
is applied for polar media while Huckel approximation = 1.0 is applied for non-polar
media, and η is the viscosity of the sample.
On the whole, zeta potential is the potential difference exists between the slipping
plane of the double layer and dispersing medium (Figure 3.3). It is always used to
determine the tendency of particles in a dispersion to flocculate. Regardless of the
positive or negative sign, the magnitude of zeta potential indicates the physical stability
of a colloidal dispersion. The higher magnitude shows higher repulsion between the
particles and hence sedimentation is less likely to occur. In general, surface charge of a
particle is originated from the dissociation of surface groups, for instance acidic groups
give negatively charged surface. In some cases, adsorption of charged surfactants is also
used to modify the surface charge. Zeta potential can be affected by several factors
including pH and conductivity of the dispersing medium and the concentration of a
formulation component.
In present work, a disposable folded capillary cell (DTS1070) was employed to
perform the zeta potential measurement. The diluted sample was added into the folded
capillary cell slowly to ensure no formation of bubbles, and then equilibrated at 25 ˚C
for 120 seconds before the measurements.
Univers
ity of
Mala
ya

25
Figure 3.3: Schematic illustration of zeta potential of a particle.
3.2.4 Optical polarizing microscope (OPM)
The morphology of NLC dispersions was observed using Leica Polarizing
Microscope (Leica Mycrosystems, Germany). NLC dispersion was placed on a glass
slide and covered with a cover glass. The object was then viewed under the microscope.
Although OPM is not suitable for viewing nanoparticles, due to its small magnification
and low resolution, it can be used to observe any aggregates of NLC or liposomes
formed in the NLC dispersions. Lecithin used in an adequate amount can form
liposomes or micelles in aqueous dispersing medium. Since liposomes possess optically
active properties, resulting from the ordered and concentric arrangement of the
phospholipid layer, the presence of liposomes can therefore be determined by using an
OPM (Placzek & Kosela, 2016).
OPM, equipped with a heating stage THMS 600 connected to a temperature
programmer TMS 91 (Linkam Scientific Instruments Ltd., UK), was employed to
observe the phase transitions of dried NLC, such as melting and crystallization. NLC
Univers
ity of
Mala
ya

26
dispersions were air-dried in a desiccator for 24 hours and then solid form NLC was
viewed under OPM. The morphology of each sample was investigated during the
heating and cooling processes, from 30 ˚C to 80 ˚C and then back to 30 ˚C, at a rate of
5 ˚C min-1. Additionally, lecithin powder was heated up to 200 ˚C to examine its phase
transition during the heating and cooling processes.
3.2.5 Transmission electron microscope (TEM)
Morphology of NLCs was observed by an Energy Filtered TEM model LIBRA 120
(Zeiss, Germany) with an accelerating voltage of 120 kV. TEM is an essential tool in
viewing nanoparticles due to its high magnification and resolution power. TEM operates
based on the same principle as a light microscope, except that the sample is illuminated
by electrons instead of light. The transmitted and scattered primary electrons which pass
through the sample are detected to create a sample image. As NLC deflects electrons
weakly, staining the sample is necessary to visualize the shape, size and surface structure
of the sample.
A drop of NLC dispersion was placed on a 400 mesh copper-coated carbon grid for
1 minute. The excess dispersion was removed by blotting with a piece of filter paper
then the sample was negatively stained with 1% (w/w) phosphotungstic acid solution
and dried by the same method. The grid was kept in a desiccator for 24 hours before
examination under TEM (Eh Suk & Misran, 2017).
3.2.6 Differential scanning calorimetry (DSC)
Thermal analysis of the dried NLC was conducted by utilizing TzeroTM DSC Q20
(TA Instruments, USA). DSC is a convenient and inexpensive method to examine the
matrix state and phase behaviour of NLCs. In DSC, energy is supplied independently to
reference and sample to maintain constant temperature. The relative heat flow between
Univers
ity of
Mala
ya
27
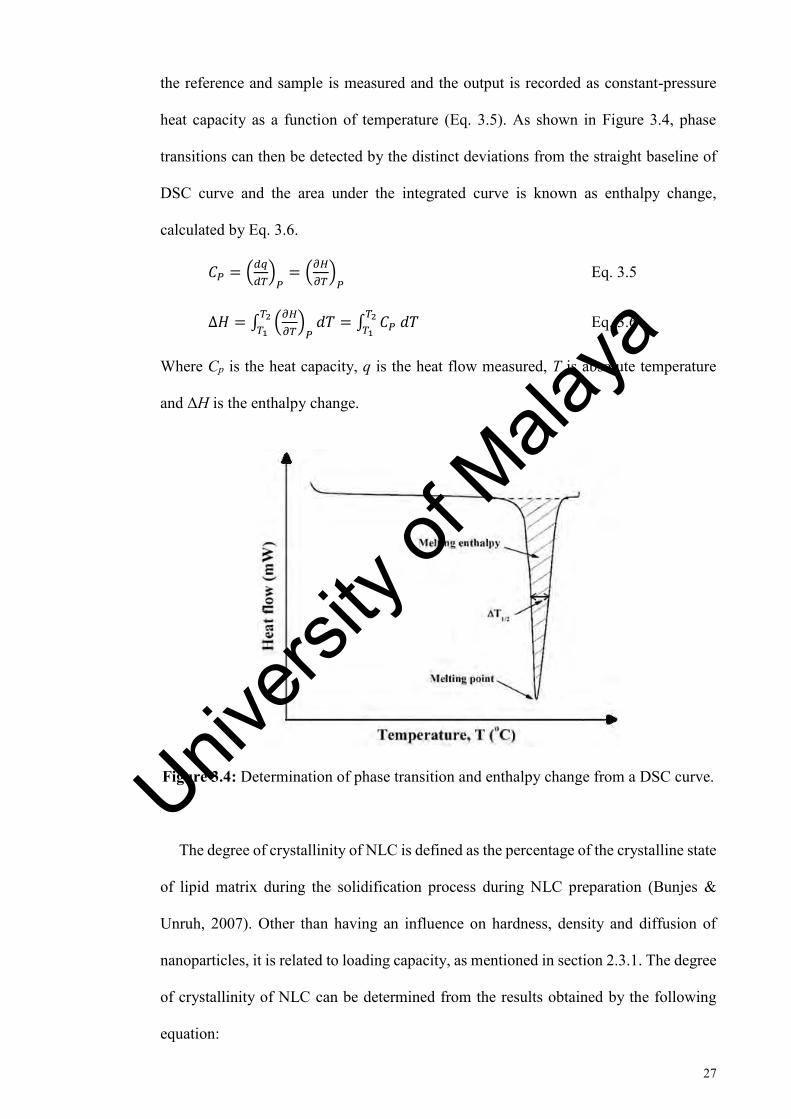
the reference and sample is measured and the output is recorded as constant-pressure
heat capacity as a function of temperature (Eq. 3.5). As shown in Figure 3.4, phase
transitions can then be detected by the distinct deviations from the straight baseline of
DSC curve and the area under the integrated curve is known as enthalpy change,
calculated by Eq. 3.6.
𝐶𝑃 = (𝑑𝑞
𝑑𝑇)
𝑃= (
𝜕𝐻
𝜕𝑇)
𝑃 Eq. 3.5
∆𝐻 = ∫ (𝜕𝐻
𝜕𝑇)
𝑃𝑑𝑇 = ∫ 𝐶𝑃 𝑑𝑇
𝑇2
𝑇1
𝑇2
𝑇1 Eq. 3.6
Where Cp is the heat capacity, q is the heat flow measured, T is absolute temperature
and ΔH is the enthalpy change.
Figure 3.4: Determination of phase transition and enthalpy change from a DSC curve.
The degree of crystallinity of NLC is defined as the percentage of the crystalline state
of lipid matrix during the solidification process during NLC preparation (Bunjes &
Unruh, 2007). Other than having an influence on hardness, density and diffusion of
nanoparticles, it is related to loading capacity, as mentioned in section 2.3.1. The degree
of crystallinity of NLC can be determined from the results obtained by the following
equation:
Univers
ity of
Mala
ya

28
𝐶𝐷 = (∆𝐻𝑁𝐿𝐶
∆𝐻𝑆𝐴) × 100% Eq. 3.7
Where CD is the crystallinity degree, ΔHNLC is the enthalpy change of NLC and ΔHSA
is the enthalpy change of bulk stearic acid, respectively.
Dried NLCs were obtained by air-drying the NLC dispersions in a desiccator for 2
days. Approximately 5 mg of the dried sample was weighed and put into an aluminium
pan for DSC analysis. An empty aluminium pan was used as reference. The temperature
ramp was performed from 30 ̊ C to 80 ̊ C, at a heating rate of 5 ̊ C min-1 under continuous
flushing of nitrogen gas at the rate of 50 mL min-1. The results were analysed using TA
Universal Analysis Software (TA Instruments, USA).
3.2.7 Encapsulation efficiency of active ingredients in NLC
Theoretically, encapsulation efficiency can be calculated by knowing either the
amount of encapsulated or free active ingredient, which was separated from the carrier
using a centrifuge. However, the nanoparticles were too small to be separated and high
centrifugal forces would destroy the carrier. Therefore, a centrifugal filter tube
consisting of membrane with 50,000 Da molecular weight cut-off (Vivaspin 6, Sartorius
Stedim Biotech, Germany) was utilized to entrap the nanoparticles while water and free
ingredients flowed through the membrane and collected in the bottom chamber of the
centrifugal tube. In this study, the dispersion was filled into the upper chamber of a
centrifugal filter tube and centrifuged at 10,000 rpm for 1 hour utilizing a centrifuge
Velocity 18r (Dynamica, UK). After centrifugation of the dispersion, supernatant in the
bottom chamber was collected.
For alpha-tocopherol loaded NLC, methanol was added to the supernatant and mixed
homogeneously. Supernatant of hydroquinone loaded NLC was diluted with deionized
water to an appropriate concentration for UV analysis. Both alpha-tocopherol and
Univers
ity of
Mala
ya

29
hydroquinone were then detected spectrophotometrically (Cary 50 UV-Vis
Spectrometer, Agilent Technologies, USA) at a wavelength of 290 nm. The
concentration of active compounds in each sample was determined from their standard
calibration curves respectively. Encapsulation efficiency was calculated with the
following equation:
𝐸𝐸 = ( 𝑊𝑇−𝑊𝐹
𝑊𝑇 ) × 100% Eq. 3.8
Where EE is encapsulation efficiency of active compounds in NLC, WT is the weight of
active compounds added during preparation and WF is the weight of unloaded active
compounds detected in filtered aqueous phase, respectively.
3.2.8 Preparation of gel samples for rheological measurements
Ca2+ solutions were prepared by adding different weight percentages of CaCl2 salt
into a beaker and deionized water was added up to 100 g. They were then being labeled
a-e (Table 3.1). A series of mixtures of ι-C and CMC was prepared by adding different
amounts of ι-C powder and CMC powder into 9.80 g of Ca2+ solution (Table 3.2). The
samples were labeled according to the ratio of ι-C to CMC and the concentration of Ca2+
ions. For example, ιc28b represents a gel mixture of ι-C and CMC at ratio 2:8 in 0.02%
Ca2+ solution. The active ingredient gel was prepared by adding alpha-tocopherol or
hydroquinone, together with CMC and ι-C into the Ca2+ solution. All solutions were
heated in a water bath thermostated at 80 ˚C until a clear gel was obtained. Samples
were then being kept at room temperature for 24 hours before the rheological
measurements.
For the preparation of NLC-gel, 30% of NLC dispersion (w/w) was incorporated into
the gel system and mixed homogeneously at 8,000 rpm for 1 minute. The NLC-gel was
stored at 4 ˚C for 24 hours for further characterization.
Univers
ity of
Mala
ya
30
Table 3.1: Percentage (% (w/w)) of Ca2+ solutions.
Label Percentage (% w/w) of Ca2+ a 0.00 b 0.02 c 0.04 d 0.06 e 0.08
Table 3.2: Weight fraction (% (w/w)) of the gel mixtures.
Mixture ι-C, g CMC, g Ca2+ solution, g ιc28 0.04 0.16 9.80 ιc37 0.06 0.14 9.80 ιc55 0.10 0.10 9.80 ιc73 0.14 0.06 9.80 ιc82 0.16 0.04 9.80
3.2.9 Rheological characterization of gel samples
Rheology is the science of the flow and deformation of a material. It provides
valuable information, including viscosity, viscoelastic properties and transient response
of the material. A rotational rheometer, equipped with a suitable measuring geometry,
is often utilized to study rheology. There are numerous types of measuring geometry,
such as ‘cup and bob’ for low viscosity materials, ‘cone and plate’ for viscoelastic
materials and ‘parallel plate’ for thick materials. For geometry cone and plate, different
combinations of cone angle and diameter are available. The larger cone angle produces
a smaller error but a higher variation of shear rate across the gap and vice versa.
Fundamentally, a rheometer controls or measures torque, τ, angular displacement, θ and
angular velocity, ω. The desired parameters are then obtained from the calculation as
shown in Table 3.3.
Univers
ity of
Mala
ya

31
Table 3.3: Mathematical functions of rheology parameters.
Parameter Mathematical function Unit Shear stress, σ 𝜎 = 𝐶1𝜏 Pa Eq. 3.9 Shear strain, γ 𝛾 = 𝐶2𝜃 - Eq. 3.10 Shear rate, �̇� �̇� = 𝐶2𝜔 s-1 Eq. 3.11
Viscosity, η 𝜂 =𝜎
�̇�=
𝜏
𝜔∙
𝐶1
𝐶2 Pa s Eq. 3.12
Modulus, G 𝐺 =𝜎
𝛾=
𝜏
θ∙
𝐶1
𝐶2 Pa Eq. 3.13
Stress constant, C1* 𝐶1 =
3
2𝜋𝑟3 m-3 Eq. 3.14
Strain constant, C2* 𝐶2 =
1
𝜃𝐺 rad-1 Eq. 3.15
* For measuring geometry cone and plate with cone angle θG and diameter r.
A strain rate/stress controlled Rheometer MCR 301 (Anton-Paar, Austria) was
employed to carry out the rheological measurements of gel samples: a series of CMC-
ι-C gel mixture, NLC-gel, active ingredient gel and active ingredient loaded NLC-gel.
All the tests were done at 25 ± 1 ˚C (except for temperature sweep) with a measuring
geometry cone and plate of 1˚/50 mm with a gap of 0.100 mm.
3.2.9.1 Viscometry test
A viscometry test was performed at a controlled shear rate, varying from 0.01 to 100
s-1. Generally, gel systems are non-Newtonian fluids and are either pseudoplastics, that
exhibit shear thinning behavior, or dilatants, that display shear thickening behavior. In
some cases, the polymeric gels show both behaviors under different shear rate. For
example, a gel network possessing yield stress, σy, shows shear thickening at low shear
rate and shear thinning at high shear rate. σy is defined as the maximum stress bearable
by the structure before deformation occurs and can be obtained from a shear viscosity
profile as a function of shear stress (Figure 3.5). In order to study the behavior of a gel,
the viscosity profiles were fitted by Power-Law model with the following equation:
Univers
ity of
Mala
ya
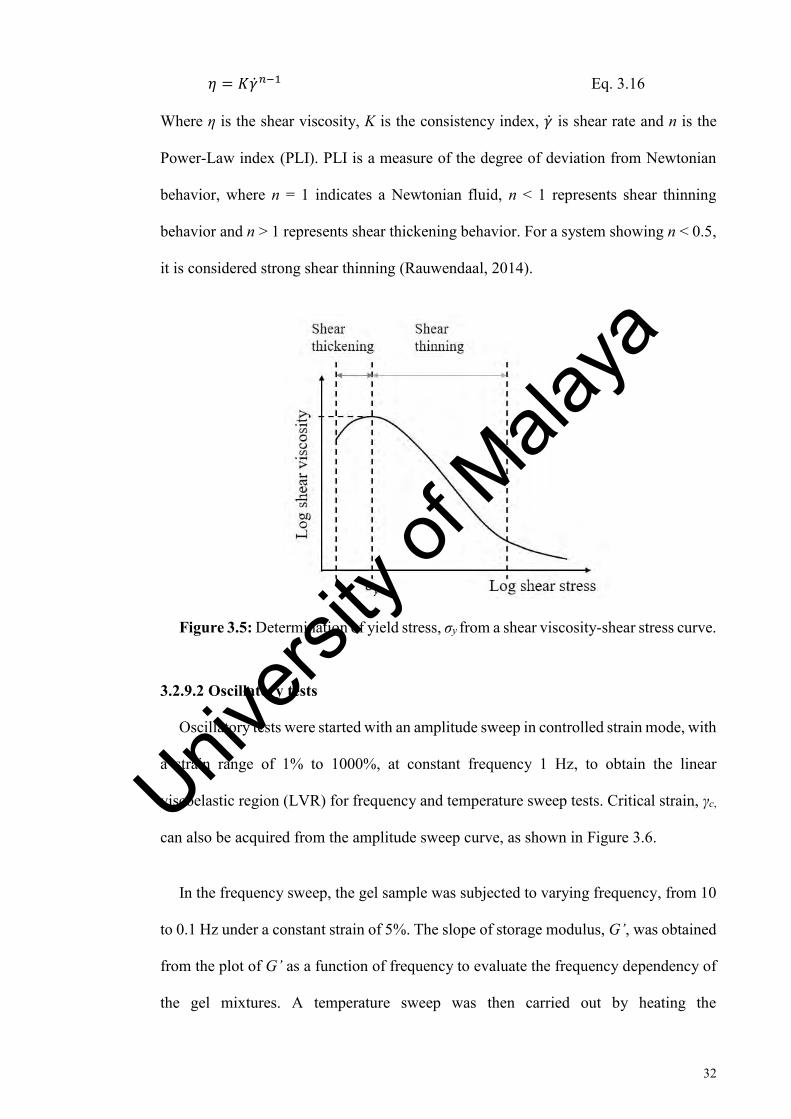
32
𝜂 = 𝐾�̇�𝑛−1 Eq. 3.16
Where η is the shear viscosity, K is the consistency index, �̇� is shear rate and n is the
Power-Law index (PLI). PLI is a measure of the degree of deviation from Newtonian
behavior, where n = 1 indicates a Newtonian fluid, n < 1 represents shear thinning
behavior and n > 1 represents shear thickening behavior. For a system showing n < 0.5,
it is considered strong shear thinning (Rauwendaal, 2014).
Figure 3.5: Determination of yield stress, σy from a shear viscosity-shear stress curve.
3.2.9.2 Oscillatory tests
Oscillatory tests were started with an amplitude sweep in controlled strain mode, with
a strain range of 1% to 1000%, at constant frequency 1 Hz, to obtain the linear
viscoelastic region (LVR) for frequency and temperature sweep tests. Critical strain, γc,
can also be acquired from the amplitude sweep curve, as shown in Figure 3.6.
In the frequency sweep, the gel sample was subjected to varying frequency, from 10
to 0.1 Hz under a constant strain of 5%. The slope of storage modulus, G’, was obtained
from the plot of G’ as a function of frequency to evaluate the frequency dependency of
the gel mixtures. A temperature sweep was then carried out by heating the
Univers
ity of
Mala
ya

33
thermoresponsive gel mixture from 20 ˚C to 80 ˚C, at a rate of 10 ˚C min-1, single
frequency 1 Hz and constant strain 5%. For gel samples incorporated with NLCs and
active ingredients, the heating range was decreased to 20 ˚C to 60 ˚C, at a rate of 10 ˚C
min-1, to avoid degradation of fatty acids and active ingredients. Solvent traps were used
to minimize the evaporation of the sample. The crossover temperature of G’ and G’’,
Tc, was acquired as shown in Figure 3.7.
Figure 3.6: Determination of critical strain, γc from the storage modulus-strain curve.
Figure 3.7: Determination of crossover temperature, Tc from the moduli-temperature curve.
Univers
ity of
Mala
ya

34
3.2.10 Field emission scanning electron microscope (FESEM)
Morphology of the gel sample in solid form was observed under FESEM (Hitachi
SU8220 Ultimate Cold Field Emission SEM, Tokyo, Japan) at a low accelerating
voltage of 1.0 kV. FESEM differs from TEM due to the construction and principle of
operation. Instead of transmission through the sample, the emitted concentrated electron
beam scans the sample surface. The emitted secondary electrons, together with the
backscattered electrons are then detected, assessing the sample topography to provide a
three-dimensional image. As such, it is an excellent method to examine the
macrostructure of a gel system. As the FESEM has lower resolution power compared to
TEM, due to the low accelerating voltage used, it is not suitable to observe the
morphology of nanoparticles (Placzek & Kosela, 2016).
FESEM operates in a high vacuum condition and therefore, it is not suitable to
analyze a liquid sample. The aqueous gel mixtures underwent freeze-drying processes
by being frozen at -20 ˚C for 24 hours and transferred to the freeze-dryer at -55 ˚C for
72 hours. Prior viewing under FESEM, a layer of carbon paint was put on the sample
stage and the gel in solid form was placed onto it.
3.2.11 Preparation of samples for in vitro release studies
There were four systems prepared for each active compound. Sample A was alpha-
tocopherol solution being prepared by dissolving the active ingredient in ethanol 95%:
deionized water (80:20 (v/v)). Sample B was diluted alpha-tocopherol loaded NLC
dispersion and sample C was alpha-tocopherol gel, respectively. As prepared in section
3.2.8, sample D was alpha-tocopherol loaded NLC-gel.
Univers
ity of
Mala
ya

35
Samples containing hydroquinone were prepared in the same manner as above except
for hydroquinone solution, which was prepared by simply dissolving hydroquinone in
deionized water. Hydroquinone solution, diluted hydroquinone loaded NLC,
hydroquinone gel and hydroquinone loaded NLC-gel were then denoted as samples E,
F, G and H. All samples were kept at 4 ˚C for 24 hours before the experiments.
3.2.12 In vitro release
The release rate of active compounds from samples A to H was studied by using an
Automated Franz Diffusion Cell System (Microette Plus Autosampling System, Hanson
Research Co., USA). Six vertical Franz diffusion cells with diffusate chamber volume
of 4 mL and effective diffusion area of 0.636 cm2 were used. The diffusion cells were
water-jacketed and connected to a water bath circulator (PolyScience, USA) to maintain
the experiment temperature. A helix spring magnetic stirrer was placed in each cell to
ensure medium homogeneity.
The Franz diffusion cells were fitted with pre-hydrated regenerated cellulose
membranes with 10,000 Da molecular weight cut-off. A different medium was chosen
for different active compounds, according to their solubility. For alpha-tocopherol,
ethanol 95%: phosphate buffer saline solution (PBS) (80:20 v/v) was filled into the
receptor chambers to ensure pseudo-sink conditions by increasing the solubility of
active compound in the receiving phase. A similar receptor medium had been used for
the study of release of vitamin E in previous studies (Sharipova et al., 2016; Shylaja et
al., 2016; Yenilmez et al., 2011). In contrast, receiving medium PBS pH 7.4 was used
for hydroquinone. The receiving phase was stirred continuously at 400 rpm and
thermostated at 37 ± 1 ˚C. Approximately 1 mL of sample was loaded into each donor
chamber with the experiments run for 24 hours. Samples were withdrawn and replaced
with fresh medium from reservoir at each predetermined time interval. The temperature
Univers
ity of
Mala
ya

36
effect on the release of active compounds from samples C, D, G and H were investigated
by repeating the experiments at 30 ˚C.
3.2.12.1 Determination of amount of active compound
The amount of active compound was determined from a standard calibration curve
by employing Cary 50 UV-Vis Spectrometer (Agilent Technologies, USA). A stock
solution of 100 μg mL-1 was prepared by adding 10 mg of the active ingredient, alpha-
tocopherol, into 50 mL of ethanol 95% and PBS solution (80:20 (v/v)), and then made
up to the mark 100 mL in a volumetric flask. Next, a series of alpha-tocopherol solutions
with different concentrations were prepared by diluting the stock solution.
A stock solution of 50 μg mL-1 of hydroquinone solution was prepared by dissolving
5 mg of hydroquinone into 50 mL of PBS solution and made up to 100 mL in a
volumetric flask. A series of hydroquinone solutions with different concentrations were
prepared by diluting the stock solution.
The prepared solutions were measured spectrophotometrically and both the active
ingredients were detected at a wavelength of 290 nm. The standard calibration curves
of alpha-tocopherol and hydroquinone were plotted.
3.2.12.2 Mathematical model evaluations
The release curves of alpha-tocopherol and hydroquinone were evaluated by fitting
into selected mathematical models using DDSolver software program (China).
Mathematical models were applied to represent the active ingredients release kinetics
by translating the release curve in the function of different parameters associated with
the dosage form. The generic equations that can be deduced from a theoretical analysis
of the process are mechanistic such as zero order, first order, Higuchi and Korsmeyer-
Univers
ity of
Mala
ya

37
Peppas, while in some cases where the theoretical fundament does not exist, an
empirical equation such as Peppas-Sahlin is used (Table 3.4). The most widely used
criteria for selection of the best fitted mathematical model employs the coefficient of
determination, R2. Nevertheless, a modification is required when comparing models
with different parameters, and therefore the adjusted coefficient of determination, R2adj.
was used (Eq. 3.17). Model with the highest R2adj. is considered the best model in
describing the release kinetic properties of the active ingredient.
𝑅𝑎𝑑𝑗.2 = 1 −
𝑛−1
𝑛−𝑝(1 − 𝑅2) Eq. 3.17
Where n is the number of dissolution data points and p is the number of parameters in
the model.
Table 3.4: Mathematical models for drug release characterization (Singhvi & Singh, 2011).
Mathematical model Equation
Zero order 𝑄𝑡 = 𝑄0 + 𝐾0𝑡 Eq. 3.18
First order log 𝑄𝑡 = log 𝑄0 −𝐾1𝑡
2.303 Eq. 3.19
Higuchi 𝑀𝑡 = 𝐾𝐻𝑡1 2⁄ Eq. 3.20
Korsmeyer-Peppas 𝑀𝑡
𝑀= 𝐾𝐾𝑃𝑡𝑛 Eq. 3.21
Peppas-Sahlin 𝑀𝑡
𝑀= 𝐾𝑑𝑡𝑚 + 𝐾𝑟𝑡2𝑚 Eq. 3.22
Where Qt is the amount of drug dissolved in time t, Q0 is the initial amount of drug, K0
is the zero order release constant, K1 is the first order release constant, Mt is the amount
of drug released in time t, M is total amount of drug, KH is the Higuchi release constant,
KKP is the Korsmeyer-Peppas release constant, n is the release exponent, Kd is the
diffusion constant, Kr is the relaxation constant and m is the purely fickian diffusion
exponent for device of any geometrical shape, which exhibit controlled release. Table
Univers
ity of
Mala
ya

38
3.5 indicates the type of drug transport determined by n value of Korsmeyer-Peppas
model and m value of Peppas-Sahlin model.
Table 3.5: Types of drug transport determined by Korsmeyer-Peppas and Peppas-Sahlin models (Singhvi & Singh, 2011).
Mathematical model Exponent Type of drug transport
Korsmeyer-Peppas
n < 0.45 Quasi fickian
n = 0.45 Fickian diffusion
0.45 < n < 0.89 Anomalous or non-fickian diffusion
0.89 < n < 1 Case II relaxation or non-fickian case 2
n > 1 Non-fickian super case 2
Peppas-Sahlin
m < 0.43 Fickian diffusion
0.43 < m < 0.85 Anomalous transport
m > 0.85 Case II transport
Univers
ity of
Mala
ya

39
CHAPTER 4: RESULTS AND DISCUSSION
4.1 Physicochemical characterization of NLC
4.1.1 Mean particle size and zeta potential of NLC
The main concerns in formulating a suitable carrier for topical application are
suitable size and agglomeration of the particles. The particle size should be small enough
to pass through the skin barrier, but not too small to avoid systemic uptake by entering
the blood system. Particles within a size range of 3 to 10 μm concentrate in the hair
follicles, while particles smaller than 3 μm penetrate both the follicle and stratum
corneum via follicular localization (Shekunov et al., 2007). It has been reported that
skin penetration of nanoparticles smaller than 200 nm was achieved via follicle
localization (Alvarez-Román et al., 2004; Shim et al., 2004). In order to obtain the
desired particle size of NLC, the effects of different preparation parameters and
composition of NLC on mean particle size, PDI and zeta potential of NLC formed were
investigated.
4.1.1.1 Effect of preparation parameters
In emulsion system preparation, energy input is mostly required for a liquid phase to
homogeneously disperse in the dispersing medium. In this experiment, the composition
of NLC remained constant but variations in homogenization time and speed were
manipulated. From the results presented in Table 4.1, it was observed that increasing
the homogenization speed from 16,000 rpm to 18,000 rpm successfully reduced the
mean particle size and PDI of the NLC as much as 62.7% and 79.16%, respectively.
This is attributed to the higher shear force overcoming the interfacial force of the
emulsion droplets, which broke down the large droplets into smaller droplets
(McClements, 2004). Similarly, the mean particle size decreased with increasing
homogenization time, from 8 min to 10 min, where the mean particle size was reduced
Univers
ity of
Mala
ya
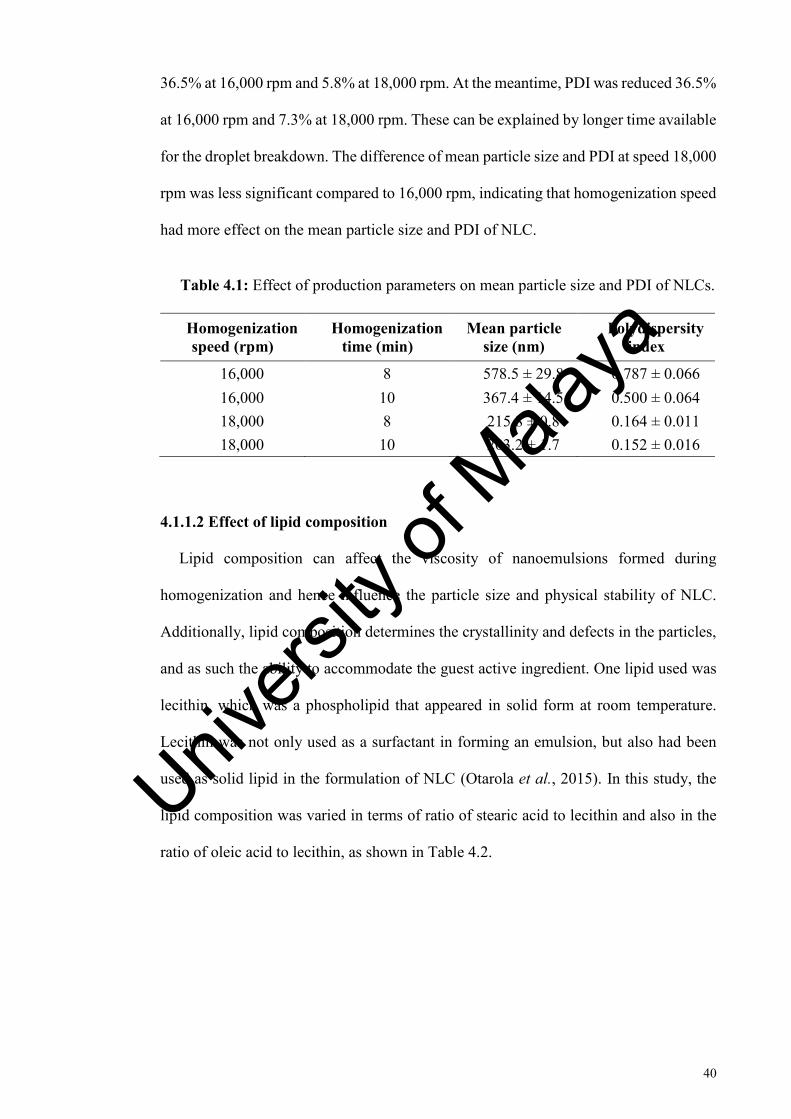
40
36.5% at 16,000 rpm and 5.8% at 18,000 rpm. At the meantime, PDI was reduced 36.5%
at 16,000 rpm and 7.3% at 18,000 rpm. These can be explained by longer time available
for the droplet breakdown. The difference of mean particle size and PDI at speed 18,000
rpm was less significant compared to 16,000 rpm, indicating that homogenization speed
had more effect on the mean particle size and PDI of NLC.
Table 4.1: Effect of production parameters on mean particle size and PDI of NLCs.
Homogenization speed (rpm)
Homogenization time (min)
Mean particle size (nm)
Polydispersity index
16,000 8 578.5 ± 29.8 0.787 ± 0.066 16,000 10 367.4 ± 14.5 0.500 ± 0.064 18,000 8 215.8 ± 0.8 0.164 ± 0.011 18,000 10 203.2 ± 1.7 0.152 ± 0.016
4.1.1.2 Effect of lipid composition
Lipid composition can affect the viscosity of nanoemulsions formed during
homogenization and hence influence the particle size and physical stability of NLC.
Additionally, lipid composition determines the crystallinity and defects in the particles,
and as such the ability to accommodate the guest active ingredient. One lipid used was
lecithin, which was a phospholipid that appeared in solid form at room temperature.
Lecithin was not only used as a surfactant in forming an emulsion, but also had been
used as solid lipid in the formulation of NLC (Otarola et al., 2015). In this study, the
lipid composition was varied in terms of ratio of stearic acid to lecithin and also in the
ratio of oleic acid to lecithin, as shown in Table 4.2.
Univers
ity of
Mala
ya

41
Table 4.2: Effect of lipid composition on mean particle size, PDI and zeta potential of NLCs.
Sample Percentage Composition (% (w/w)) Mean
particle size (nm)
PDI Zeta
potential (mV) Tween
80 Stearic
acid Oleic acid Lecithin
SL1 1.00 4.48 1.60 1.92 599.9 ± 61.41
0.635 ± 0.041
-58.4 ± 0.835
SL2 1.00 5.76 1.60 0.64 373.3 ± 11.87
0.446 ± 0.019
-51.1 ± 0.943
SL3 1.00 5.90 1.60 0.50 230.5 ± 2.273
0.191 ± 0.010
-44.7 ± 0.594
OL1 1.00 5.90 1.80 0.30 237.4 ± 1.337
0.210 ± 0.014
-40.7 ± 0.701
OL2 1.00 5.90 1.90 0.20 232.0 ± 1.549
0.178 ± 0.003
-38.0 ± 0.335
Table 4.2 demonstrated that increased lecithin gave higher mean particle size, PDI
and zeta potential. The increment in zeta potential was expected as lecithin was an ionic
surfactant. As shown in Figure 4.1, lecithin was a zwitterion surfactant that possessed
both positively charged amine group and negatively charged phosphate group.
Nevertheless, lecithin gave an overall negative charge as the phosphate group with lower
bond dissociation energy, ∆Hf298 = 596.6 kJ mol-1, tended to dissociate more in the
aqueous solution, compared to the amine group with higher bond dissociation energy,
∆Hf298 = 770.0 kJ mol-1 (Cottrell, 1958; Darwent, 1970). Despite the high zeta potential,
sedimentation was observed in SL1 after storage for 1 week. This was potentially due
to the high concentration of lecithin which produced an emulsion with high viscosity,
subsequently forming nanoparticles of high density. The dense particles were easier to
form sediment under gravity effect. Additionally, lecithin multilayers plausibly
accumulated on the surface of particles, leading to agglomeration and particle growth
when fusion of the lecithin bilayers occurred (Schubert & Müller-Goymann, 2005).
Univers
ity of
Mala
ya

42
CH3
OOO
H
OO
PO
N
CH3
CH3
H3C
CH3
OO
Figure 4.1: Chemical structure of lecithin.
Alternatively, there was no significant difference in mean particle size and PDI of
SL3, OL1 and OL2, which indicated that lecithin and oleic acid possessed similar
properties within the lipid matrix. Lecithin appeared in solid form at room temperature
but did not re-solidify during the rapid cooling process. Instead, it dissolved in the liquid
lipid and did not act as solid lipid in NLC. This assumption was further supported by
observation under OPM (in section 4.2.1), where lecithin dissolved in oleic acid at room
temperature (Figure 4.8) and altered its appearance at approximately 182.8 ˚C (Figure
4.7). Unlike stearic acid, this was an irreversible process and the lecithin remained as
liquid when cooled to room temperature. As such, it can be presumed that instead of
solid lipid, lecithin could potentially act as a liquid lipid and ionic surfactant, which
stabilized the system by contributing high surface charge.
4.1.1.3 Effect of types of nonionic surfactant
As a nonionic surfactant cannot ionize into a charging group in an aqueous system,
the surfactant adsorption by its hydroxyl groups can lead it to be negatively charged.
Meanwhile, the bulky hydrophilic head groups of the nonionic surfactant provides steric
stabilization to stabilize the NLC dispersion. Tweens are hydrophilic surfactants that are
Univers
ity of
Mala
ya
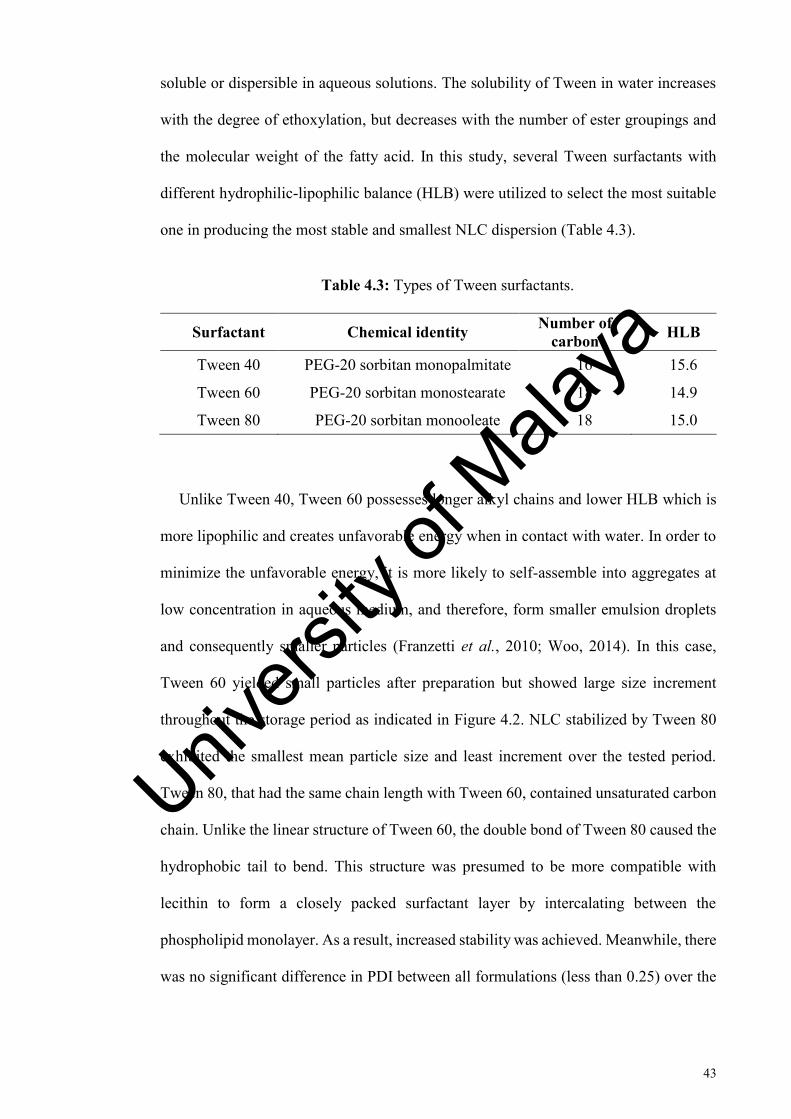
43
soluble or dispersible in aqueous solutions. The solubility of Tween in water increases
with the degree of ethoxylation, but decreases with the number of ester groupings and
the molecular weight of the fatty acid. In this study, several Tween surfactants with
different hydrophilic-lipophilic balance (HLB) were utilized to select the most suitable
one in producing the most stable and smallest NLC dispersion (Table 4.3).
Table 4.3: Types of Tween surfactants.
Surfactant Chemical identity Number of carbon HLB
Tween 40 PEG-20 sorbitan monopalmitate 16 15.6
Tween 60 PEG-20 sorbitan monostearate 18 14.9
Tween 80 PEG-20 sorbitan monooleate 18 15.0
Unlike Tween 40, Tween 60 possesses longer alkyl chains and lower HLB which is
more lipophilic and creates unfavorable energy when in contact with water. In order to
minimize the unfavorable energy, it is more likely to self-assemble into aggregates at
low concentration in aqueous medium, and therefore, form smaller emulsion droplets
and consequently smaller particles (Franzetti et al., 2010; Woo, 2014). In this case,
Tween 60 yielded small particles after preparation but showed large size increment
throughout the storage period as indicated in Figure 4.2. NLC stabilized by Tween 80
exhibited the smallest mean particle size and least increment over the tested period.
Tween 80, that had the same chain length with Tween 60, contained unsaturated carbon
chain. Unlike the linear structure of Tween 60, the double bond of Tween 80 caused the
hydrophobic tail to bend. This structure was presumed to be more compatible with
lecithin to form a closely packed surfactant layer by intercalating between the
phospholipid monolayer. As a result, increased stability was achieved. Meanwhile, there
was no significant difference in PDI between all formulations (less than 0.25) over the
Univers
ity of
Mala
ya
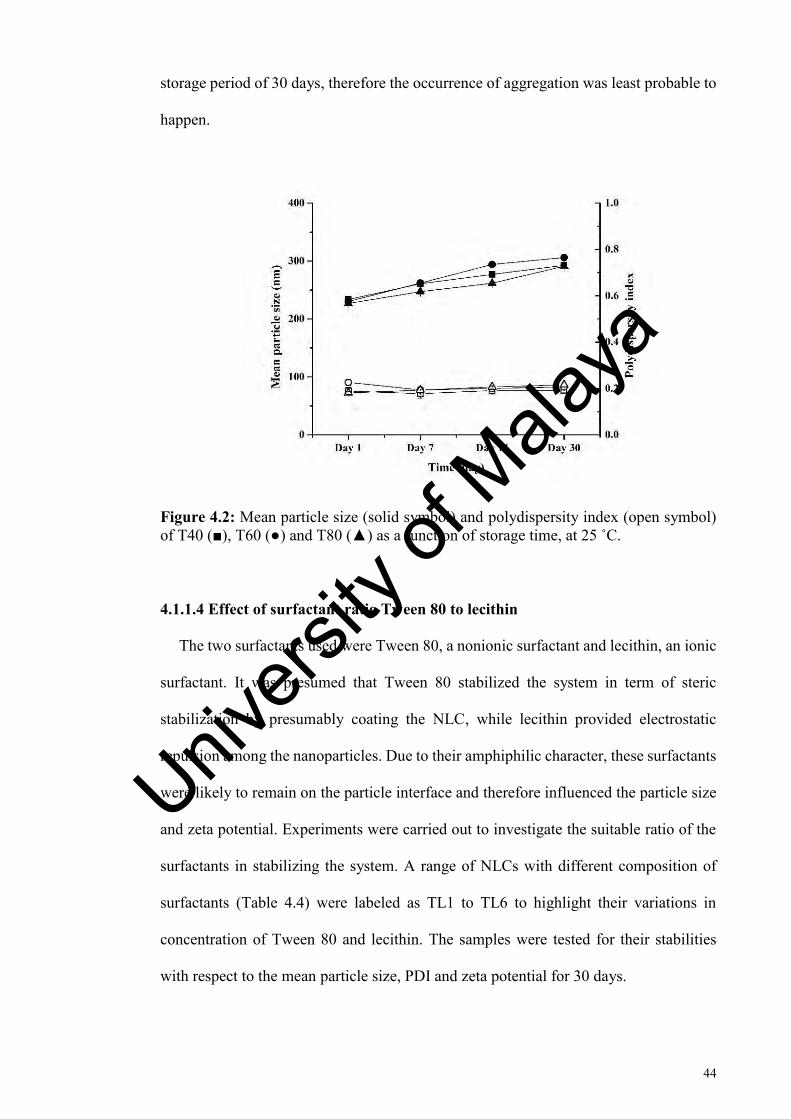
44
storage period of 30 days, therefore the occurrence of aggregation was least probable to
happen.
Figure 4.2: Mean particle size (solid symbol) and polydispersity index (open symbol) of T40 (■), T60 (●) and T80 (▲) as a function of storage time, at 25 ˚C.
4.1.1.4 Effect of surfactant ratio Tween 80 to lecithin
The two surfactants used were Tween 80, a nonionic surfactant and lecithin, an ionic
surfactant. It was presumed that Tween 80 stabilized the system in term of steric
stabilization by presumably coating the NLC, while lecithin provided electrostatic
repulsion among the nanoparticles. Due to their amphiphilic character, these surfactants
were likely to remain on the particle interface and therefore influenced the particle size
and zeta potential. Experiments were carried out to investigate the suitable ratio of the
surfactants in stabilizing the system. A range of NLCs with different composition of
surfactants (Table 4.4) were labeled as TL1 to TL6 to highlight their variations in
concentration of Tween 80 and lecithin. The samples were tested for their stabilities
with respect to the mean particle size, PDI and zeta potential for 30 days.
Univers
ity of
Mala
ya

45
TL2 with only lecithin as surfactant formed large particulates during the rapid
cooling process, and as such was not subjected to particle size and zeta potential
analysis. During the solidification process, the surface condition changed dramatically
from a liquid emulsion droplet to a solid nanoparticle. Surfactants were added to the
newly formed particles in order to help stabilize the particles in suspension. When high
concentration of lecithin was used alone as a surfactant, it tended to form vesicles in the
aqueous medium which therefore slowed down the molecular movement to cover the
newly formed naked nanoparticle surface. The particle surface, without protection of a
surfactant prone to flocculate due to the intermolecular Van der Waals attractive forces,
leading to the failure in nanoparticles formation (Shekhawat, 2013).
Table 4.4: Formulations of NLCs with different surfactant compositions.
Sample Percentage of ingredient (% (w/w))
Stearic acid Oleic acid Lecithin Tween 80 Deionized
water TL1 5.9 1.6 0 1.5 91.0
TL2 5.9 1.6 1.5 0 91.0
TL3 5.9 1.6 0.1 1.4 91.0
TL4 5.9 1.6 0.2 1.3 91.0
TL5 5.9 1.6 0.3 1.2 91.0
TL6 5.9 1.6 0.4 1.1 91.0
This work has demonstrated that NLCs with mixed lecithin and Tween 80 surfactants
were successfully prepared. In Figure 4.3, the mean particle size decreased from TL1 to
TL4, but increased from TL4 to TL6. This could potentially be attributed to lecithin
favoring a large oil/water interface which was able to increase the interfacial area, and
as such produced a smaller particle. When the curvature radius reached a critical value,
further reduction in particle size was disfavored by lecithin (Schubert & Müller-
Goymann, 2005). Additionally, lecithin at high concentrations destabilized the system,
Univers
ity of
Mala
ya

46
which was indicated by the fluctuating mean particle size and PDI of TL6 across the
storage period. This could possibly be due to the formation of micelles by lecithin in the
aqueous phase, producing a higher PDI. According to Schubert and Müller-Goymann
(2005), a monolayer of lecithin at the surface of particle was formed only at a low
concentration of lecithin. As such, the amount of lecithin should be minimized to avoid
the formation of other structures in the system.
Figure 4.3: Mean particle size (solid symbol) and polydispersity index (open symbol) of TL1 (■), TL3 (●), TL4 (▲), TL5 (▼) and TL6 ( ) as a function of storage time, at 25 ˚C.
In Figure 4.4, there was negligible changes in zeta potential of the NLCs, implying
constant interface properties of the particles. This indicated that migration of lecithin
molecules into the aqueous system to form vesicles was unlikely to occur (Schubert et
al., 2006). TL1 without lecithin had a zeta potential of less than -30 mV, showing
increased stability of the stearic acid-nanoparticles. The negative sign of zeta potential
was plausibly dominated by the carboxylic groups of stearic acid, phosphate group of
lecithin and the hydroxyl adsorption by Tween 80 in the aqueous medium. Incorporation
of lecithin enhanced the stability of the system with stronger repulsion forces, indicated
Univers
ity of
Mala
ya
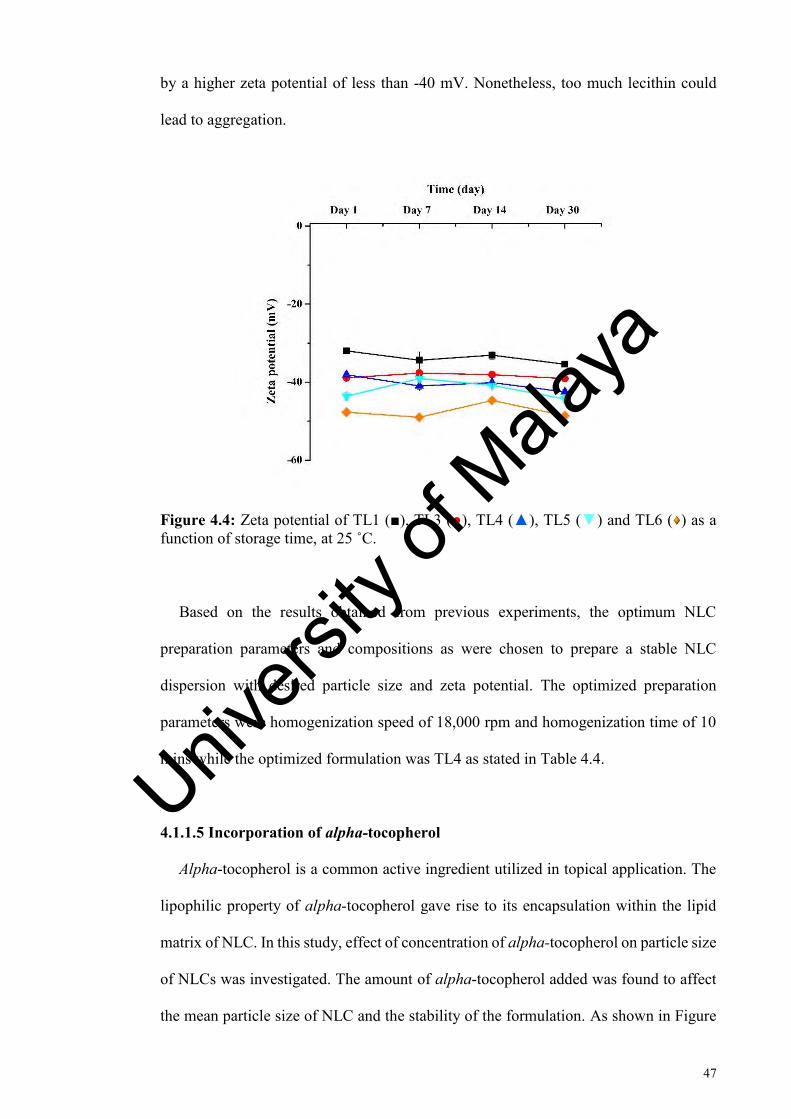
47
by a higher zeta potential of less than -40 mV. Nonetheless, too much lecithin could
lead to aggregation.
Figure 4.4: Zeta potential of TL1 (■), TL3 (●), TL4 (▲), TL5 (▼) and TL6 ( ) as a function of storage time, at 25 ˚C.
Based on the results obtained from previous experiments, the optimum NLC
preparation parameters and compositions as were chosen to prepare a stable NLC
dispersion with desired particle size and zeta potential. The optimized preparation
parameters were homogenization speed of 18,000 rpm and homogenization time of 10
mins while the optimized formulation was TL4 as stated in Table 4.4.
4.1.1.5 Incorporation of alpha-tocopherol
Alpha-tocopherol is a common active ingredient utilized in topical application. The
lipophilic property of alpha-tocopherol gave rise to its encapsulation within the lipid
matrix of NLC. In this study, effect of concentration of alpha-tocopherol on particle size
of NLCs was investigated. The amount of alpha-tocopherol added was found to affect
the mean particle size of NLC and the stability of the formulation. As shown in Figure
Univers
ity of
Mala
ya

48
4.5, mean particle size and PDI of NLCs increased with increasing amount of alpha-
tocopherol. Sedimentation was observed in NLCs with 0.4% and 0.6% of alpha-
tocopherol after 21 days, potentially due to the denser particles formed during lipid
solidification. High amount of alpha-tocopherol produced highly viscous
nanoemulsions and formed dense nanoparticles upon solidification. Even though NLCs
containing 0.1% and 0.2% of alpha-tocopherol were having similar mean particle size
after 30 days, 0.1% was considered more stable due to its lower and increasingly more
stable increment in mean particle size and PDI. The increasing mean particle size and
PDI of alpha-tocopherol loaded NLCs across the storage period were probably caused
by the expulsion of alpha-tocopherol from the lipid matrix, where the free alpha-
tocopherol could potentially form larger nanoemulsions with excess surfactant and
consequently contribute to the higher PDI (Woo et al., 2014).
Figure 4.5: Mean particle size (solid symbol) and polydispersity index (open symbol) of NLCs loaded with alpha-tocopherol at concentrations of 0.1% (■), 0.2% (●), 0.3% (▲), 0.4% (▼) and 0.6% ( ) as a function of time, at 25 ˚C.
Univers
ity of
Mala
ya

49
Meanwhile, the alpha-tocopherol loaded NLCs showed a negligible difference of
average zeta potential with the unloaded NLC and there was also no significant changes
across the investigation period. This indicated consistent condition on the surface
structure of the particles. Additionally, the zeta potential for all formulations was found
to be lower than -30 mV, and as such it was generally accepted as a stable colloidal
dispersion (Müller et al., 2001). Nonetheless, the steric stabilizer present in the system
was not taken into account in this prediction. For instance, Tween 80 as a nonionic
surfactant was able to adsorb onto the surface of particles to provide steric stabilization
between the particles (Han et al., 2008).
4.1.1.6 Incorporation of hydroquinone
For studying the ability of NLC to encapsulate active ingredients of different
properties, hydroquinone, which is water-soluble, was loaded into NLC in the same
manner as alpha-tocopherol. Since NLCs loaded with 0.4% and 0.6% of alpha-
tocopherol were not stable in the previous experiment, the stability test for hydroquinone
loaded NLCs was carried out at concentrations of 0.1%, 0.2% and 0.3% only. From the
particle size analysis as shown in Figure 4.6, the mean particle size and PDI of NLC
were directly proportional to the amount of hydroquinone loaded and the storage time.
This phenomena might be explained by the aggregation of particles during storage under
the effect of gravity. Nonetheless, all the formulations were considered monodisperse
throughout the analysis period, indicated by the low PDI, which was less than 0.25. The
low increments in mean particle size and PDI were owing to the hydrophilic nature of
hydroquinone, where the hydroquinone molecules that diffused into the dispersing
medium preferably stayed in the aqueous system, rather than forming emulsion with the
excess surfactant.
Univers
ity of
Mala
ya

50
Figure 4.6: Mean particle size (solid symbol) and polydispersity index (open symbol) of NLCs loaded with hydroquinone at concentrations of 0.1% (■), 0.2% (●) and 0.3% (▲) as a function of time, at 25 ˚C.
4.1.2 Morphology of NLC
4.1.2.1 Optical polarizing microscope (OPM)
Although OPM has limited resolution in examining the morphology of NLC, it was
employed to investigate the formation of liposomes by lecithin in the aqueous medium.
According to Placzek & Kosela (2016), liposomes showed a birefringence effect under
polarized light. As the structure could not be found in the NLC dispersion, it was
assumed that liposomes did not form in the system. Lecithin appeared as solid at room
temperature but did not melt and recrystalize during the heating and cooling processes
(Figure 4.7). As shown in Figure 4.8, lecithin dissolved in oleic acid at room
temperature, therefore could not be used as a solid lipid in forming the SLN or NLC.
To visualize the crystallization process, NLC was melted and cooled back to room
temperature. It was observed that the air-dried NLC melted upon heating and
recrystallized upon cooling, ensuring the formation of lipid nanoparticles by stearic acid.
This observation was further supported by the thermal analysis of NLC in section 4.1.3.
Univers
ity of
Mala
ya

51
Crystallization of melted NLC started from the center of the droplet outwards (Figure
4.9). Therefore, active ingredients incorporated in the lipid matrix might be settled
around the lipid outer shell. According to Grana et al. (2013), this was known as a shell
model.
Figure 4.7: Polarizing micrograph of lecithin at 28.4 ˚C and 182.8 ˚C.
Figure 4.8: Polarizing micrograph of lecithin before and after addition of oleic acid.
Figure 4.9: The melting and re-crystallization processes of air-dried NLC.
Univers
ity of
Mala
ya

52
4.1.2.2 Transmission electron microscope (TEM)
The effect of lecithin and the concentration of alpha-tocopherol on morphology of
NLC was scrutinized using TEM microscopy. TEM micrographs of the NLCs revealed
the round shape of particles, which was in agreement with the assumption in particle
size measurement. In Figure 4.10 (b), addition of lecithin managed to stabilize the
system by electrostatic repulsion forces so that particles stayed distant. In contrast, NLC
without lecithin demonstrated particles of different size with potent aggregation (Figure
4.10 (a)). As shown in Figure 4.11 (a), NLC with 0.1% alpha-tocopherol had
monodisperse particle size and no evident aggregation. Nevertheless, NLC with 0.6%
alpha-tocopherol in Figure 4.11 (b) were not as solid as NLC with 0.1% alpha-
tocopherol. NLC particles were smearing due to the high vacuum condition of TEM,
indicating that nanoemulsions might instead form rather than nanoparticles.
Aggregation was obvious and this explains the occurrence of sedimentation after storage
for 21 days.
(a)
(b)
Figure 4.10: TEM micrographs of NLCs (a) without lecithin, TL1 and (b) with lecithin, TL4.
Univers
ity of
Mala
ya

53
(a)
(b)
Figure 4.11: TEM micrographs of NLCs loaded with (a) 0.1% and (b) 0.6% alpha-tocopherol.
It was noticed that the particle size shown in the TEM micrographs was smaller
compared to the mean particle size reported by Zetasizer analysis. This was due to TEM
that displayed the image of the particle core as the surfactant layer was too thin to be
visualized by electrons, while Zetasizer measured the hydrodynamic diameter of a
particle dependent on its surface structure, concentration and type of ions in the medium.
Additionally, all particles, including contaminants and dust, present in the sample were
taken into account by Zetasizer, influencing the mean particle size obtained.
4.1.3 Thermal analysis of NLC
Thermal properties of NLCs, such as melting point (Tm), peak width at half minimum
(∆T1/2) and melting enthalpy (∆H), were analyzed by using a DSC. The differences in
these thermal properties reflected different molecular packing of the hydrocarbon chains
in the crystal lattice. The endotherm of nanoparticles were broadened and shifted to a
lower temperature due to the adsorption of surfactant molecules.
Stearic acid is a solid lipid with high crystallinity at both atmospheric and body
temperature. In NLC, the incorporated lipidic components had dissimilar structures
which caused a mismatch in the hydrocarbon chains and subsequent imperfections in
the lipid matrix of stearic acid (Nahak et al., 2015). These lipidic components include
Univers
ity of
Mala
ya

54
oleic acid and stabilizers used in the system, such as lecithin and Tween 80. In this study,
DSC was utilized to shed light on the location of the surfactants. A higher volume of
hydrophobic surfactant would penetrate deeper into the lipid core, contributing to a
lower crystallinity, while hydrophilic surfactant preferentially resided on the particle’s
surface. This perturbed the packing of the hydrocarbon chains in the lipid matrix in a
smaller extent, and hence, remained the thermal properties.
Figure 4.12 showed the thermogram of stearic acid analyzed by TA Universal
Analysis Software. The peak of minimum heat flow represented the melting point, Tm
(70.8 ˚C) with the enthalpy change, ∆H (210.1 J g-1) obtained from integration of the
shaded area of the endothermic peak. The peak width can also be used to mark the
presence of multicrystallinity. A sharp peak with narrow ∆T1/2 (3.6 ˚C) indicated that
the pure stearic acid was highly crystalline.
Figure 4.12: Endothermic thermogram of stearic acid.
As shown in Table 4.5 and Figure 4.13, there was no obvious trend in the crystallinity
of the NLCs with surfactant content. This indicated that the packing of lecithin and
Univers
ity of
Mala
ya

55
Tween 80 was different at different concentrations. For example, the crystallinity degree
was high when lecithin was used alone as the surfactant. As mentioned in section
4.1.1.4, the nanoemulsions did not form nanoparticles during rapid cooling process.
Instead, it formed large particulates containing stearic acid matrix incorporated with
only oleic acid, and therefore possessed higher crystallinity. Alternatively, NLC without
lecithin had higher crystallinity degree compared to NLCs with low amount of lecithin,
suggesting that lecithin was more hydrophobic and penetrated deeper into the lipid core
than Tween 80. In addition, lecithin which possessed two hydrophobic tails could
potentially induce heterogeneous nucleation caused by the interaction between the lipid
melt and the surfactant layer (Bunjes & Unruh, 2007). However, 0.5% of lecithin
provided slightly higher crystallinity compared to 0.2% of lecithin. This was in
agreement with a previous observation in section 4.1.1.4, where not all lecithin
participated in the formation of lipid nanoparticles. Excess lecithin molecules could
potentially form other structures in the dispersing medium. Additionally, there were
previous studies reporting faster polymorphic transition in lecithin-loaded lipid
matrices, and as such lecithin should be used at an appropriate amount to provide low
crystallinity and minimize the polymorphic transition rate (Schubert et al., 2006;
Schubert & Müller-Goymann, 2005; Schubert et al., 2005).
Table 4.5: Melting point (Tm), peak width at half minimum (∆T1/2), melting enthalpy (∆H) and degree of crystallinity of NLCs.
Lecithin content (%)
Tween 80 content (%)
Thermal properties of NLC
Tm (˚C) ∆T1/2 (˚C) ∆H (J g-1) Crystallinity degree (%)
0 1.5 65.1 4.7 135.6 64.5 0.2 1.3 65.0 5.4 133.6 63.6 0.5 1.0 65.4 5.2 134.5 64.0 1.5 0 66.4 3.4 136.6 65.0
Univers
ity of
Mala
ya
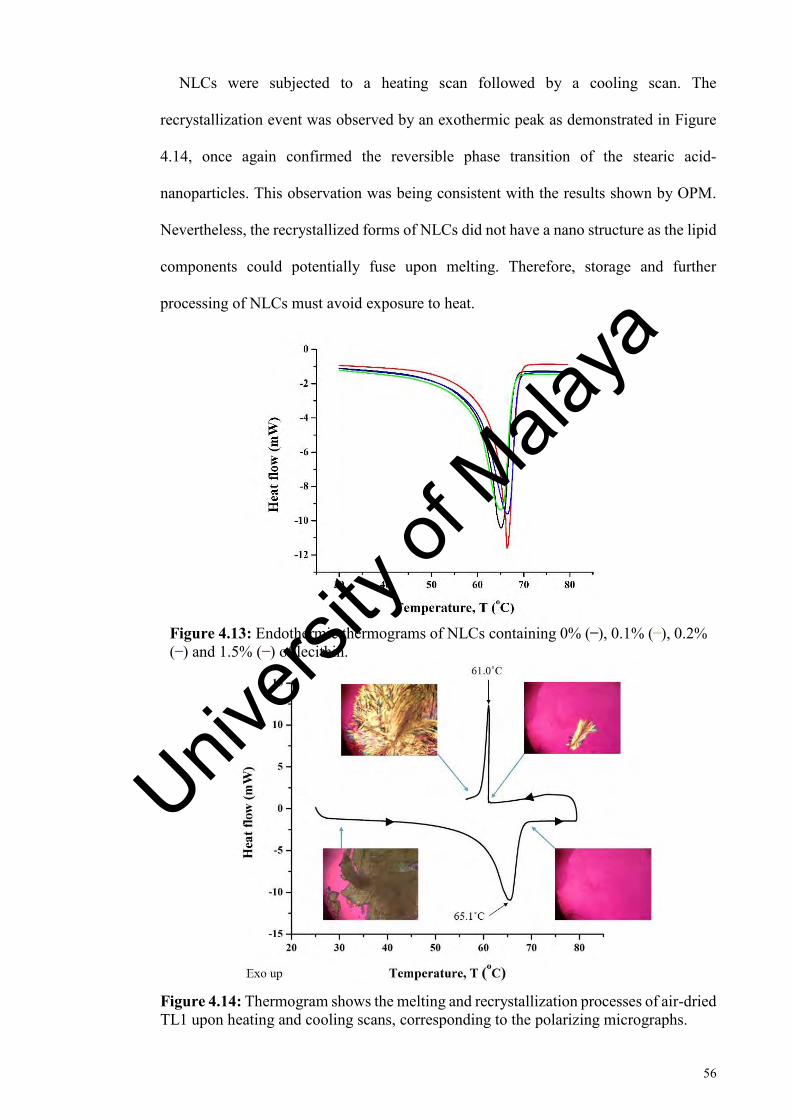
56
NLCs were subjected to a heating scan followed by a cooling scan. The
recrystallization event was observed by an exothermic peak as demonstrated in Figure
4.14, once again confirmed the reversible phase transition of the stearic acid-
nanoparticles. This observation was being consistent with the results shown by OPM.
Nevertheless, the recrystallized forms of NLCs did not have a nano structure as the lipid
components could potentially fuse upon melting. Therefore, storage and further
processing of NLCs must avoid exposure to heat.
Figure 4.13: Endothermic thermograms of NLCs containing 0% ( ̶ ), 0.1% ( ̶ ), 0.2% ( ̶ ) and 1.5% ( ̶ ) of lecithin.
Figure 4.14: Thermogram shows the melting and recrystallization processes of air-dried TL1 upon heating and cooling scans, corresponding to the polarizing micrographs.
Univers
ity of
Mala
ya

57
4.1.4 Encapsulation efficiency of active ingredients in NLC
For an effective carrier system, it is very important to be aware of the encapsulation
efficiency of active ingredients in the carrier to minimize the loss. Only stable NLC
formulations, without any appearance of sedimentation, were evaluated for the
encapsulation efficiency of alpha-tocopherol and hydroquinone.
Incorporation of oleic acid into the solid lipid perturbed the crystalline matrix of the
solid lipid matrix, which increased the loading space for the active compound (Woo et
al., 20.14). It can be observed in Figure 4.16 that the encapsulation efficiency of alpha-
tocopherol was inversely proportional to the amount of alpha-tocopherol added. The
active ingredient could plausibly exceed its maximum capacity in the lipid matrix due
to the limited space to accommodate the guest molecules or because it has reached the
optimum molecular compatibility in the NLC matrix composition. Nevertheless, the
encapsulation efficiency was high overall, more than 90% for all formulations under
investigation. This observation might be attributed to the two-membered ring with long
hydrocarbon chain of alpha-tocopherol, as shown in Figure 4.15, which has higher
preference in the lipid matrix compared to the aqueous dispersing medium. As such, the
main criteria in selecting the optimum concentration of alpha-tocopherol was not only
based on the encapsulation efficiency but also on the compatibility of the lipid matrix
and also the stability of the formulation during storage, according to the particle size
measurement.
O
CH3
CH3
HO
CH3
CH3
CH3
CH3 CH3 CH3
Figure 4.15: Chemical structure of alpha-tocopherol.
Univers
ity of
Mala
ya

58
Figure 4.16: Encapsulation efficiency of alpha-tocopherol (■) and hydroquinone (●) as a function of concentration of active ingredient loaded in NLC.
In contrast, the encapsulation efficiency of hydroquinone was much lower than that
of alpha-tocopherol. In Figure 4.16, NLC loaded with 0.1% of hydroquinone exhibited
the highest encapsulation efficiency of 60.48%, the number was then decreased
significantly to around 50% when 0.2% and 0.3% of hydroquinone were loaded. The
low encapsulation of hydroquinone in NLC was probably due to its hydrophilic
structure, as shown in Figure 4.17, to disproportionate in the aqueous medium,
preferably further apart from the particles. Undoubtedly, the centrifugal ultrafiltration
method could potentially give a lower encapsulation efficiency of hydroquinone as the
active ingredient was loosely adsorbed on the surface of particle. Consequently, it was
easy to be re-dispersed into the aqueous medium under strong centrifugal forces.
OH OH
Figure 4.17: Chemical structure of hydroquinone.
Univers
ity of
Mala
ya
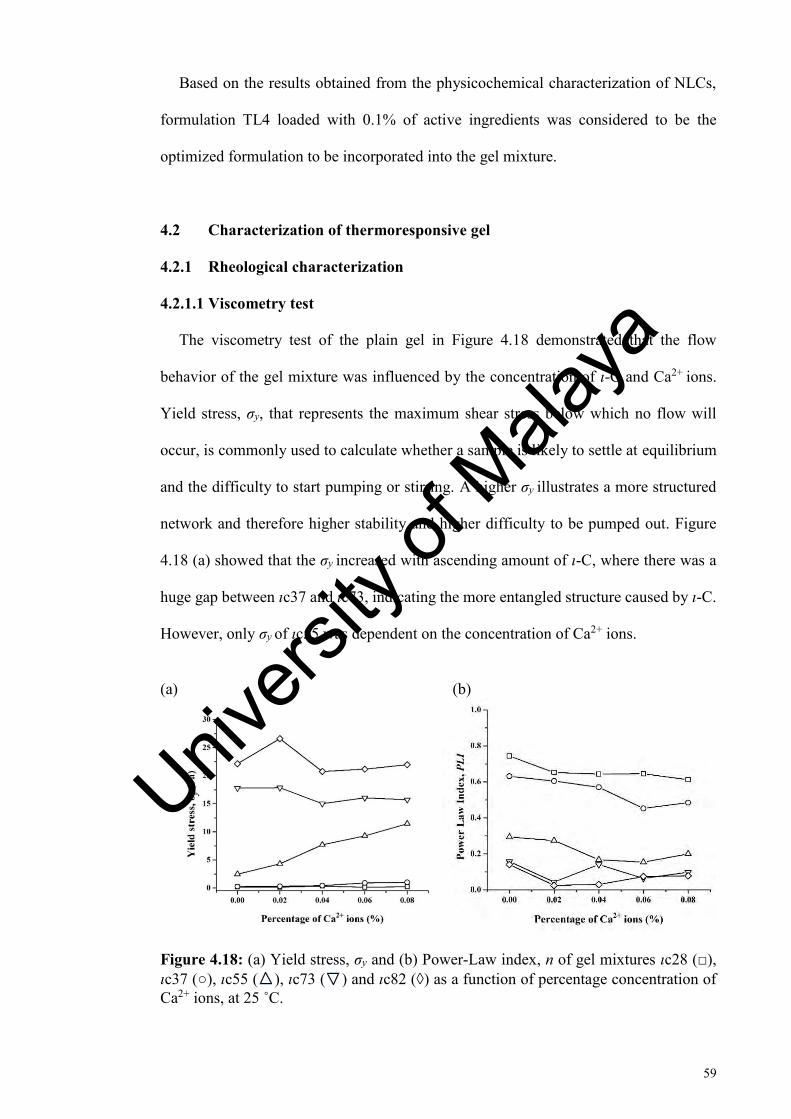
59
Based on the results obtained from the physicochemical characterization of NLCs,
formulation TL4 loaded with 0.1% of active ingredients was considered to be the
optimized formulation to be incorporated into the gel mixture.
4.2 Characterization of thermoresponsive gel
4.2.1 Rheological characterization
4.2.1.1 Viscometry test
The viscometry test of the plain gel in Figure 4.18 demonstrated that the flow
behavior of the gel mixture was influenced by the concentration of ι-C and Ca2+ ions.
Yield stress, σy, that represents the maximum shear stress below which no flow will
occur, is commonly used to calculate whether a sample is likely to settle at equilibrium
and the difficulty to start pumping or stirring. A higher σy illustrates a more structured
network and therefore higher stability and higher difficulty to be pumped out. Figure
4.18 (a) showed that the σy increased with ascending amount of ι-C, where there was a
huge gap between ιc37 and ιc73, indicating the more entangled structure caused by ι-C.
However, only σy of ιc55 was dependent on the concentration of Ca2+ ions.
(a) (b)
Figure 4.18: (a) Yield stress, σy and (b) Power-Law index, n of gel mixtures ιc28 (□), ιc37 (○), ιc55 ( ), ιc73 ( ) and ιc82 (◊) as a function of percentage concentration of Ca2+ ions, at 25 ˚C.
Univers
ity of
Mala
ya
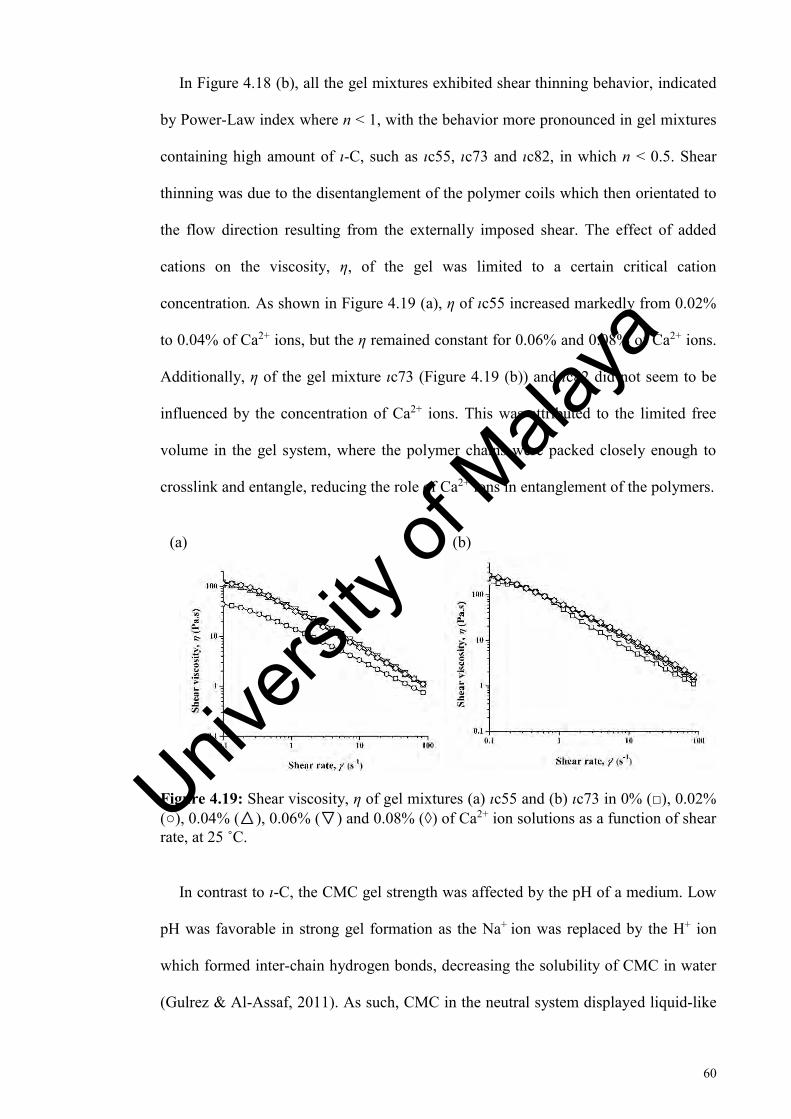
60
In Figure 4.18 (b), all the gel mixtures exhibited shear thinning behavior, indicated
by Power-Law index where n < 1, with the behavior more pronounced in gel mixtures
containing high amount of ι-C, such as ιc55, ιc73 and ιc82, in which n < 0.5. Shear
thinning was due to the disentanglement of the polymer coils which then orientated to
the flow direction resulting from the externally imposed shear. The effect of added
cations on the viscosity, η, of the gel was limited to a certain critical cation
concentration. As shown in Figure 4.19 (a), η of ιc55 increased markedly from 0.02%
to 0.04% of Ca2+ ions, but the η remained constant for 0.06% and 0.08% of Ca2+ ions.
Additionally, η of the gel mixture ιc73 (Figure 4.19 (b)) and ιc82 did not seem to be
influenced by the concentration of Ca2+ ions. This was attributed to the limited free
volume in the gel system, where the polymer chains were packed closely enough to
crosslink and entangle, reducing the role of Ca2+ ions in entanglement of the polymers.
(a) (b)
Figure 4.19: Shear viscosity, η of gel mixtures (a) ιc55 and (b) ιc73 in 0% (□), 0.02% (○), 0.04% ( ), 0.06% ( ) and 0.08% (◊) of Ca2+ ion solutions as a function of shear rate, at 25 ˚C.
In contrast to ι-C, the CMC gel strength was affected by the pH of a medium. Low
pH was favorable in strong gel formation as the Na+ ion was replaced by the H+ ion
which formed inter-chain hydrogen bonds, decreasing the solubility of CMC in water
(Gulrez & Al-Assaf, 2011). As such, CMC in the neutral system displayed liquid-like
Univers
ity of
Mala
ya

61
behavior with limited intrinsic viscosity and strength (Yang et al., 2009). CMC gel was
too weak to hold and stabilize the lipid nanoparticles in the gel system, while ι-C gel
was too rigid to spread evenly on the skin. As such, a mixture of CMC and ι-C was a
promising combination to provide an adequate flowing profile under shear and at the
same time maintain its rigidity in storage.
4.2.1.2 Linear viscoelastic behavior
Amplitude sweep delivers comprehensive information, such as linear viscoelastic
region (LVR), storage modulus, G’, loss modulus, G’’ and critical strain, γc, of the
viscoelastic sample. LVR is of main interest as it is associated with the configuration of
the polymer, which does not change substantially from the equilibrium structure of the
gel system. The point at γc is the maximum strain before the gel structure breaks beyond
the linear region. After this critical point, the entangled molecule chains start to
reorganize and align with the flow direction (Aho, 2011). Frequency sweep and
temperature ramp are then carried out under the strain within the LVR to ensure non-
destructive conditions so that the structure will not be disrupted as it does in the
continuous shear technique (Shekhawat, 2013).
In Figure 4.20, it was noteworthy that γc of gel mixtures in 0% to 0.04% Ca2+
solutions was constant until a significant increment was observed at 0.06% of Ca2+ ions.
Concurrently, γc of the gel mixtures was increased with increased concentration of ι-C.
Addition of ι-C strengthened the gel system and hence caused a higher resistance against
deformation, owing to the formation of increasingly entangled, and a subsequently more
flexible network structure.
Univers
ity of
Mala
ya

62
Figure 4.20: Critical strain, γc of gel mixtures ιc28 (■), ιc37 (●), ιc55 (▲), ιc73 (▼) and ιc82 (♦) as a function of percentage of Ca2+ ions, at 25 ˚C.
For a viscoelastic material, G’ obtained from the measurement denotes the elasticity
of the system, while G’’ demonstrates the viscous component. As previously shown in
Figure 4.19, Ca2+ ions participated in the increased G’ of gel mixtures with low content
of ι-C, yet its presence was less important for those with high content of ι-C. As shown
in Figure 4.21 (a), gel mixture ιc37 with 0% to 0.04% Ca2+ ions was dominant in the
viscous component, while gel mixtures with 0.06% and 0.08% Ca2+ ions displayed
increased gel strength with the elastic component dominating. Meanwhile for ιc73, as
shown in Figure 4.21 (b), all the gel mixtures with and without Ca2+ ions exhibited solid-
like properties, where G’ >> G’’. The crossover of G’ and G’’ was shifted to a higher
strain from approximately 40% to 120% when the concentration of ι-C increased from
ιc37 to ιc73. This revealed a stronger network formed by ι-C which was able to endure
a higher deformation.
Univers
ity of
Mala
ya

63
(a)
(b)
Figure 4.21: Storage modulus, G’ (solid symbol) and loss modulus, G’’ (open symbol) of gel mixtures (a) ιc37 and (b) ιc73 in 0% (■), 0.02% (●), 0.04% (▲), 0.06% (▼) and 0.08% (♦) of Ca2+solutions as a function of strain, at 25 ˚C.
4.2.1.3 Isothermal frequency sweep test
Frequency sweep is utilized to predict the behavior of a gel at long and short time
scales, with respect to the low and high frequencies. The results obtained are then related
to the gels condition during storage and application. In Figure 4.22, the gel mixtures
Univers
ity of
Mala
ya

64
containing high amount of ι-C, such as ιc55, ιc73 and ιc82, were stable at stationary, yet
had relatively poor spreadability as G’ > G’’ across the tested frequency range. In
contrast, ιc28 with G’ < G’’ demonstrated increased spreadability with possibility
processed a runny behavior. The crossover of G’ and G’’ in the moduli curves of ιc37d
was worth noting as it indicated the relaxation time of the gel network. Relaxation time
is the time required for a system to return to equilibrium in response to a sudden
disturbance. The crossover also implied that the system behaved like a solid at low
frequencies, but started to flow when high shear was applied at higher frequencies. As
such, it was presumed that the system possessed increased stability during storage and
good spreadability upon application.
Figure 4.22: Storage modulus, G’ (solid symbol) and loss modulus, G’’ (open symbol) of gel mixtures (a) ιc28 (■), ιc37 (●), ιc55 (▲), ιc73 (▼) and ιc82 (♦) in 0.06% Ca2+ solution, at 25 ˚C.
In general, the ι-C helices are unable to aggregate due to charge repulsion between
the sulfate groups, however the cations (Ca2+ ions) reduce the repulsion by forming
electrostatic interactions with the sulfate groups (Janaswamy & Chandrasekaran, 2008).
In accordance with the viscometry test in section 4.2.1.1, there was an unexpected
Univers
ity of
Mala
ya

65
behavior shown by the gel mixtures ιc73 (Figure 4.23) and ιc82, where their G’ were
highest with 0.04% Ca2+ ions instead of 0.08% Ca2+ ions. This was plausibly attributed
to the limited space available in the system with a high amount of ι-C, which lead to the
restriction of movement and entanglement of the polymer molecules by the extra Ca2+
ions. Consequently, the system lost its elasticity.
Figure 4.23: Storage modulus, G’ (solid symbol) and loss modulus, G’’ (open symbol) of gel mixture ιc73 in 0% (■), 0.02% (●), 0.04% (▲), 0.06% (▼) and 0.08% (♦) of Ca2+ solutions as a function of frequency, at 25 ˚C.
Small strain oscillatory frequency sweep is also employed to characterize the
rheological properties of the gel mixtures in term of frequency dependency of G’,
indicated by its slope. A weak gel shows frequency dependent G’, while a strong gel
has G’ that is independent on frequency (Garrec & Norton, 2013). From Figure 4.24, it
was proven that ι-C affected the gel strength of the gel mixtures more significantly
compared to Ca2+ ions. The slope of G’ was found to decrease with the increased
concentration of ι-C and Ca2+ ions, indicating that ι-C contributed more in the elastic
component compared with CMC, while the cations were interacting with the polymer
chains to form a rigid network.
Univers
ity of
Mala
ya

66
Figure 4.24: The slope of G’ of gel mixtures ιc28 (■), ιc37 (●), ιc55 (▲), ιc73 (▼) and ιc82 (♦) as a function of percentage of Ca2+ ions, at 25 ˚C.
4.2.1.4 Temperature ramp test
Temperature ramp testing provides insight into the microscopic structure changes of
a viscoelastic sample in response to temperature change. G’ and G’’ from the heating
and cooling curves demonstrate the changing structure of the gel system in response to
the manufacturing processes and storage conditions. For example, heating mimics the
application process while cooling can be used to design the suitable conditions for
production and packaging. With transition temperature approximate to the temperature
of the human body, the system is ideal for personal care and cosmetic application.
Phase transition of a gel mixture to solution was determined from the G’ and G’’
curves generated during the heating and cooling process. There was a steep slope
observed in the curves of Figure 4.25, indicating the structure lost its energy within a
short temperature range and became predominant in the viscous component. According
to the previous study, the structure of ι-C transformed from a double helix conformation
to a coil conformation upon heating (Rees et al., 1982). The crossover point of G’ and
Univers
ity of
Mala
ya

67
G’’, Tc, was commonly known as the rheological gelling point as the structure changed
from solid-like to liquid-like and vice versa. From Table 4.6, it can be noted that the gel
mixtures did not gel at low concentration of ι-C and Ca2+ ions and Tc was enhanced with
increasing concentrations of ι-C and Ca2+ ions. Nonetheless, the crossover point could
not represent the gelling point for all gel mixtures. The crossover points of G’ and G’’
in the heating curves of ιc73d (Figure 4.25), ιc73e, ιc82c, ιc82d and ιc82e were found
lower than that in the cooling curves. This unpredicted phenomenon was plausibly due
to entanglement and crosslinking of the concentrated polymer chains immediately after
the supply of heat was stopped. As rheology can be affected by a small degree of
crosslinking, G’ became dominant against G’’, even at temperatures higher than the
gelling point. The difference between Tc and gelling point was also reported by Winter
(1987), depending on the cross-linker.
Figure 4.25: Storage modulus, G’ (solid symbol) and loss modulus, G’’ (open symbol) of gel mixture ιc73d as a function of temperature during heating (■) and cooling (●) processes.
Univers
ity of
Mala
ya

68
Table 4.6: Crossover temperature, Tc (˚C) of gel mixtures.
ιc28 ιc37 ιc55 ιc73 ιc82 a - - 42.5 48.9 52.0 b - - 44.7 51.8 54.2 c - - 47.8 53.2 57.1 d - 38.0 50.5 56.3 59.7 e - 43.0 52.7 58.5 61.3
Phase angle, δ could also be used to observe the occurrence of phase transition in
the gel systems as the phase transition corresponds to a sudden change or maximum
peak in δ, which is a measure of elasticity, where 0˚ < δ < 45˚ indicates elastic character,
while 45˚ < δ < 90˚ indicates viscous character. As shown in figures, ιc28d (Figure 4.26
(a)) remained as a flowing solution with high δ over the tested temperature range, while
an abrupt change in δ can be clearly observed in the rigid gelling system such as ιc55d
in Figure 4.26 (b).
Univers
ity of
Mala
ya

69
(a)
(b)
Figure 4.26: Storage modulus, G’ (■), loss modulus, G’’ (□) and phase angle, δ (●) of gel mixtures (a) ιc28d and (b) ιc55d as a function of temperature during heating process.
Univers
ity of
Mala
ya

70
Another interesting event was noticed in the systems where G’ decreased as
temperature increased, and this might fit the Arrhenius equation:
𝐺′ = 𝐺𝑜′ exp [
𝐸𝑎𝑅𝑇⁄ ] Eq. 4.1
ln 𝐺′ = (𝐸𝑎
𝑅𝑇⁄ ) + ln 𝐺𝑜′ Eq. 4.2
Where Eₐ is the activation energy of the phase transition from gel to solution; R is
universal gas constant, 8.31 J mol-1 K-1 and T is absolute temperature in Kelvin, K.
Therefore, Eₐ of the phase transition can be calculated by obtaining the slope of graph
ln G’ as a function of 1/T.
During the heating process, aggregation of ι-C helices lost interactions, turning into
double helixes and then into random coils (Tari et al., 2011). The reduction of
connectivity of polymer chains in the gel system was reflected by the decreasing G’ with
rising temperature. As reported by Janaswamy and Chandrasekaran (2002), ι-C
molecules formed inter-chain hydrogen bonds to stabilize the double helix
conformation, while Ca2+ ions and water molecules enhanced the ‘helix-helix’
interactions by connections with the sulfate groups of the polymer. Figure 4.27
illustrates the potential connection between ι-C molecules and Ca2+ ions via electrostatic
interactions.
Despite the tendency of CMC to flow and dissipate energy under applied shear, the
elastic component of pure CMC solution could also be raised by adding Ca2+ ions. As
such, it could be assumed that CMC molecules were bound by interactions between
carbonyl groups of CMC, COO- and cations Ca2+ as illustrated in Figure 4.28. However,
the solution still exhibited liquid-like behavior.
Univers
ity of
Mala
ya

71
O
O
HH
R1
H HOH
H
O
O
H
O
H
HH
O
H
OR2
-O
SOO
SO
O O
Ca
OO
HH
R3
H
HOHH
O
O
H
O
H
HH
O
H
O R4
OS
O O S
O-
OO
HOOH
iota-Carrageenan iota-Carrageenan
Figure 4.27: Proposed electrostatic interactions formed between Ca2+ ion and the negatively charged center oxygen on sulfate functional groups of ι-C molecules.
H
O
H
H
HOH
R1
O
O
HHOH
HH
HO
H
OR2
O
HOHO
O-Na+
OH
O
HH
H OH
R3
O
O
HH
OH
H
HHO
H
OR4
O
HOH
O
CaO
O
O
O
+Na-OO
Carboxymethyl cellulose
Carboxymethyl cellulose
Figure 4.28: Proposed electrostatic interactions formed between Ca2+ ion and the negatively charged center oxygen on carbonyl functional groups of CMC molecules.
HO
H
H
H
HO
R3
O
O
H
HHO
H HOH
H
OR4
O
OH
HO
O-Na+
O
O
H
HR1
HH
OH
H
O
HO
O
H
O
H
HH
O
H
OR2
-O
SOO
SO
O O
Ca
O
O
O
iota-CarrageenanCarboxylmethyl Cellulose
Figure 4.29: Proposed linkage between CMC and ι-C molecules by forming electrostatic interactions with Ca2+ ion respectively.
Univers
ity of
Mala
ya
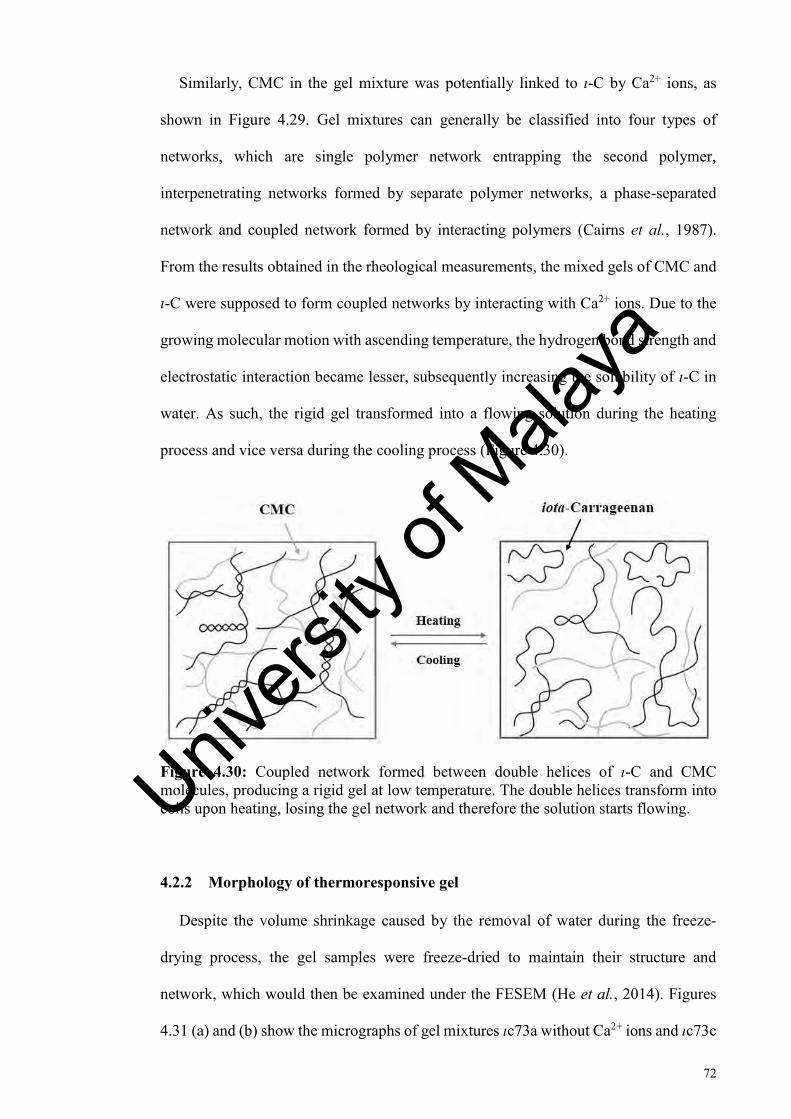
72
Similarly, CMC in the gel mixture was potentially linked to ι-C by Ca2+ ions, as
shown in Figure 4.29. Gel mixtures can generally be classified into four types of
networks, which are single polymer network entrapping the second polymer,
interpenetrating networks formed by separate polymer networks, a phase-separated
network and coupled network formed by interacting polymers (Cairns et al., 1987).
From the results obtained in the rheological measurements, the mixed gels of CMC and
ι-C were supposed to form coupled networks by interacting with Ca2+ ions. Due to the
growing molecular motion with ascending temperature, the hydrogen bond strength and
electrostatic interaction became lesser, subsequently increasing the solubility of ι-C in
water. As such, the rigid gel transformed into a flowing solution during the heating
process and vice versa during the cooling process (Figure 4.30).
Figure 4.30: Coupled network formed between double helices of ι-C and CMC molecules, producing a rigid gel at low temperature. The double helices transform into coils upon heating, losing the gel network and therefore the solution starts flowing.
4.2.2 Morphology of thermoresponsive gel
Despite the volume shrinkage caused by the removal of water during the freeze-
drying process, the gel samples were freeze-dried to maintain their structure and
network, which would then be examined under the FESEM (He et al., 2014). Figures
4.31 (a) and (b) show the micrographs of gel mixtures ιc73a without Ca2+ ions and ιc73c
Univers
ity of
Mala
ya
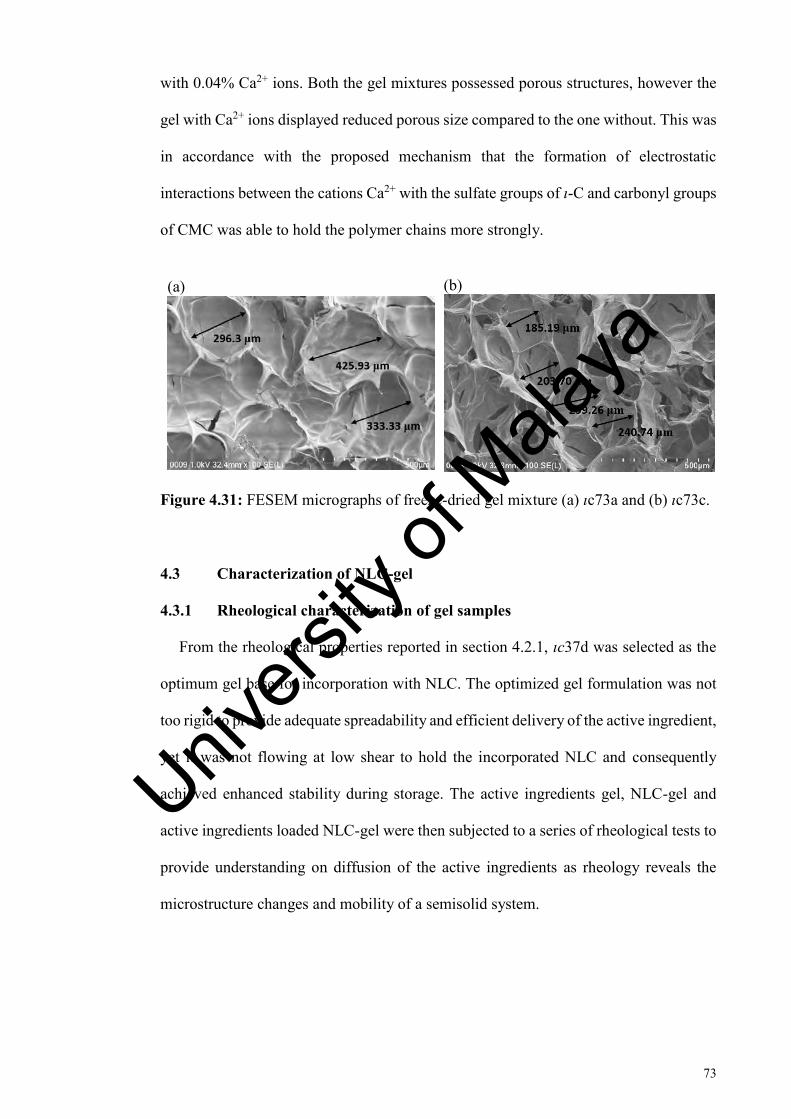
73
with 0.04% Ca2+ ions. Both the gel mixtures possessed porous structures, however the
gel with Ca2+ ions displayed reduced porous size compared to the one without. This was
in accordance with the proposed mechanism that the formation of electrostatic
interactions between the cations Ca2+ with the sulfate groups of ι-C and carbonyl groups
of CMC was able to hold the polymer chains more strongly.
(a)
(b)
Figure 4.31: FESEM micrographs of freeze-dried gel mixture (a) ιc73a and (b) ιc73c.
4.3 Characterization of NLC-gel
4.3.1 Rheological characterization of gel samples
From the rheological properties reported in section 4.2.1, ιc37d was selected as the
optimum gel base for incorporation with NLC. The optimized gel formulation was not
too rigid to provide adequate spreadability and efficient delivery of the active ingredient,
yet it was not flowing at low shear to hold the incorporated NLC and consequently
achieved enhanced stability during storage. The active ingredients gel, NLC-gel and
active ingredients loaded NLC-gel were then subjected to a series of rheological tests to
provide understanding on diffusion of the active ingredients as rheology reveals the
microstructure changes and mobility of a semisolid system.
Univers
ity of
Mala
ya

74
4.3.1.1 Viscometry test
As shown in Figure 4.32, η for all gel samples decreased with increasing shear rate,
showing shear thinning behavior of the gel systems. There was no obvious difference in
flowing curves of alpha-tocopherol-gel and the blank gel, implying that alpha-
tocopherol did not have any interaction with the polysaccharides. In contrast, η for
hydroquinone gel was lower than that of the blank gel, which indicated possible
interaction between hydroquinone and the polymer chains. As each hydroquinone
molecule contained two hydroxyl groups, hydroquinone molecules were plausibly
forming hydrogen bonds with the polysaccharides, and therefore reduced the
interactions among the polysaccharides. However, when hydroquinone was loaded in
NLC, the hydroquinone loaded NLC-gel exhibited similar flowing profile with the
empty NLC-gel. As η was unaffected by the presence of hydroquinone, hydroquinone
was assumed to adsorb on to the particles, and as such was unable to interrupt the gel
network. Shear thinning behavior is favorable to provide slow flow from the packaging
material and easy distribution on the skin (Islam et al., 2004). This is most probably due
to the disentanglement of polymer chains at high shear rate and subsequently the active
compound entrapped being able to diffuse following the direction of flow.
Figure 4.32: Viscosity, η of gel samples ιc37d (■), NLC-gel (●), alpha-tocopherol gel (▲), alpha-tocopherol loaded NLC-gel (▼), hydroquinone gel (♦) and hydroquinone loaded NLC-gel (◄) as a function of shear rate, at 25 °C.
Univers
ity of
Mala
ya

75
4.3.1.2 Oscillatory tests
Amplitude sweep was performed to obtain LVR of the gel samples to investigate the
strain bearable by the structure before it collapsed. Overall, the elastic component was
predominant against the viscous component at low strain, but the samples started
flowing at approximately 30% of the observed strain (Figure 4.33 (a)). Therefore, 5%
of strain was selected for frequency sweep and temperature ramp tests to ensure non-
destructive conditions of samples for applied shear. Being consistent with the
viscometry test, hydroquinone gel had the lowest elasticity due to the interaction
between hydroquinone and the polysaccharides. This also explains the higher G’ of
NLC-gel compared with hydroquinone loaded NLC-gel, where free hydroquinone
molecules in the system might disturb the gel matrix.
The frequency sweep indicated that all the gel samples behaved similarly, as their
moduli were frequency dependent. The gel systems were solid-like at low frequency,
indicating adequate stability during storage. Nevertheless, G’’ increased more steeply
with frequency and consequently G’’ > G’ at higher frequency, illustrating adequate
spreadability of the gels at short time scales, i.e. upon application on the skin. From
Figure 4.33 (b), a minimum of G’ occurred at high frequencies for all gel samples and
was most pronounced in the hydroquinone-gel. The minima could potentially be
induced by a partial breakage of the interconnected network, which was destructed by
the increasingly frequent deformation at high frequency (Shekhawat, 2013).
Furthermore, NLC-gel possessed slightly higher G’ compared with the blank gel, as a
result of the incorporation of NLC. This proposed that the lipid nanoparticles were rigid
and able to store energy in their elastic components when shear was applied (Tan &
Misni, 2014). Besides the rigidity of the particles, NLC potentially interacted with the
polymer molecules to enhance the elasticity. It was suggested by previous studies that
the oxygen atoms of the fatty acid could probably form hydrogen bonds with the
Univers
ity of
Mala
ya

76
hydroxyl groups (O-H) at the backbone of the polymer chains in the gel matrix (Chieng
& Chen, 2010; Tan & Misni, 2014).
(a)
(b)
Figure 4.33: Storage modulus, G’ (solid symbol) and loss modulus, G’’ (open symbol) of gel samples ιc37d (■), NLC-gel (●), alpha-tocopherol gel (▲), alpha-tocopherol loaded NLC-gel (▼), hydroquinone gel (♦) and hydroquinone loaded NLC-gel (◄) as a function of (a) strain in amplitude sweep and (b) frequency in frequency sweep, at 25 ˚C.
Univers
ity of
Mala
ya

77
Despite the slight difference of rheological properties, the crossover temperature of
G’ and G’’ for all the gel samples occurred at the desired temperature, which was in the
vicinity of body temperature (Figure 4.34). The phase transition from gel-like to liquid-
like at approximately 37 ˚C improved the spreadability of the gel upon application on
the skin, thus promoting delivery of the loaded active ingredients. The rheological
measurements revealed that alpha-tocopherol had no effect on the rheological properties
of the gel systems, while hydroquinone could potentially be forming hydrogen bonds
with the polymer molecules, interrupting the gel network, and therefore lowering η and
G’ obtained. However, NLC could reduce the effect of hydroquinone. In spite of the
presence of free hydroquinone in the system, the hydroquinone loaded NLC-gel showed
similar flowing behavior and elasticity compared to the empty NLC-gel. This prediction
was supported by the appearance of the hydroquinone gel and hydroquinone loaded
NLC-gel as shown in Figure 4.35. The gel incorporated with hydroquinone was clear
with brown coloration, while hydroquinone loaded NLC-gel was opaque with milky
white coloration, which was the same as the NLC-gel. In fact, hydroquinone gel should
be clear and colorless. The brown color indicated oxidation of hydroquinone into
complexes in the gel system (Mijangos et al., 2006). Therefore, it was proven that NLC
managed to protect the sensitive active ingredient against degradation in the aqueous
medium.
Univers
ity of
Mala
ya
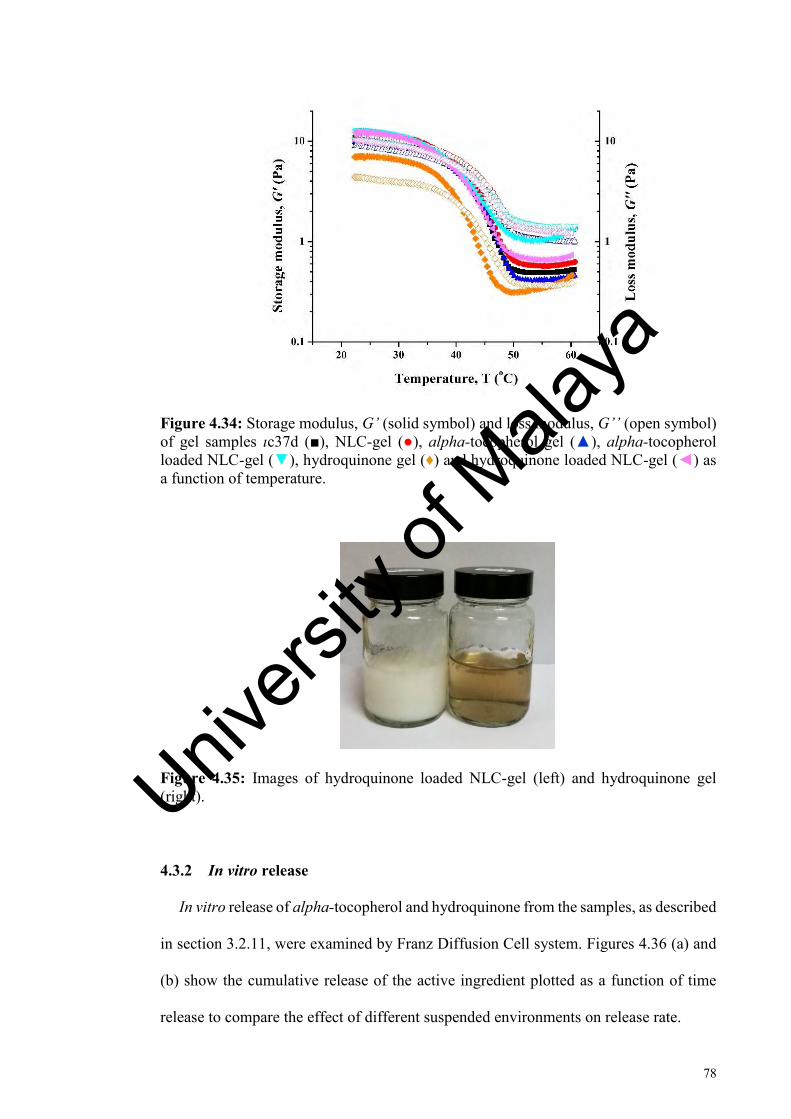
78
Figure 4.34: Storage modulus, G’ (solid symbol) and loss modulus, G’’ (open symbol) of gel samples ιc37d (■), NLC-gel (●), alpha-tocopherol gel (▲), alpha-tocopherol loaded NLC-gel (▼), hydroquinone gel (♦) and hydroquinone loaded NLC-gel (◄) as a function of temperature.
Figure 4.35: Images of hydroquinone loaded NLC-gel (left) and hydroquinone gel (right).
4.3.2 In vitro release
In vitro release of alpha-tocopherol and hydroquinone from the samples, as described
in section 3.2.11, were examined by Franz Diffusion Cell system. Figures 4.36 (a) and
(b) show the cumulative release of the active ingredient plotted as a function of time
release to compare the effect of different suspended environments on release rate.
Univers
ity of
Mala
ya

79
(a)
(b)
Figure 4.36: Cumulative release of active ingredients from active ingredient solution (■), active ingredient loaded NLC dispersion (●), active ingredient gel (▲) and active ingredient loaded NLC-gel (▼) for (a) alpha-tocopherol and (b) hydroquinone as a function of time, at 37 ˚C.
From Figure 4.36 (a), it can be observed that almost all alpha-tocopherol molecules
in sample A (alpha-tocopherol solution) diffused though the membrane after 24 hours,
whereas samples B (alpha-tocopherol loaded NLC dispersion) showed slower release
Univers
ity of
Mala
ya

80
rate owing to the limited mobility of the active ingredient in the lipid matrix of NLC.
Alpha-tocopherol was expected to be released from the lipid phase of NLC due to its
poor solubility in the aqueous medium (Jenning et al., 2000). NLC prepared by a hot
homogenization method was proposed to be the shell enrichment model, where the
active ingredient settled at the outer shell of the particles instead of the lipid core (Üner
& Yener, 2007). This was in accordance with the previous OPM observation, shown in
section 4.1.2.1, in which crystallization of particles started from the center outwards.
This caused the release rate of alpha-tocopherol from NLC to be significantly higher
compared to that from the gel system of sample C (alpha-tocopherol gel). Additionally,
the hydrophobic ingredient had increased difficulty diffusing the aqueous gel matrix
compared to the lipid matrix. High viscosity of the gel system could also delay the
diffusion of the active ingredient. As such, it was not surprising that sample D (alpha-
tocopherol loaded NLC-gel) gave the lowest cumulative release as alpha-tocopherol
needed to diffuse through both the lipid matrix and aqueous gel network before reaching
the receiving phase.
Unexpectedly, Figure 4.36 (b) shows that the cumulative amount of hydroquinone
released from hydroquinone solution (sample E) was less than 80% after 24 hours. This
could probably be explained by the hydroquinone molecules binding to the regenerated
cellulose membrane pores, which possessed a hydrophilic structure, to interact with the
hydroxyl groups of hydroquinone. Subsequently, the release curve of sample E showed
a triphasic pattern, where the compound became increasingly difficult to pass through
the blocked membrane after a period of time. Meanwhile, there was a significant gap
between the release curves of the free solution and hydroquinone gel. This indicated a
significant delay in diffusion of the active compound in the gel network. Nevertheless,
the amount of hydroquinone released from sample G (hydroquinone gel) was slightly
higher than that from sample F (hydroquinone loaded NLC dispersion) and sample H
Univers
ity of
Mala
ya

81
(hydroquinone loaded NLC-gel), indicating that the hydrophilic compound diffused
easier through the aqueous gel matrix. The slower release of hydroquinone from NLC
and NLC-gel could potentially result from the adsorption of hydroquinone on the
surface of particles. As expected, sample H, which had a double barrier, gave the lowest
cumulative release of hydroquinone after 24 hours. Similarly, triphasic patterns were
observed in the release curves of sample F, G and H. The initial fast release rate was
presumably caused by the free hydroquinone present in the dispersing medium, whereas
the slower release rate in the second phase was determined by the diffusion rate of
hydroquinone molecules from the particles. The release rate became increasingly slower
when membrane pores were blocked by the hydroquinone molecules.
Alternatively, in vitro release studies conducted at different temperatures provided
comprehensive information on how release rate of active ingredients were affected by
the thermoresponsive behavior of the gel system. In Figures 4.37 (a) and (b), it was
noticed that the cumulative release of both alpha-tocopherol and hydroquinone at 30 ˚C
was significantly lower than that at 37 ˚C, illustrating the network structure of the gel at
different temperatures. At a higher temperature, reduced interactions were observed
among the polysaccharide molecules, lowering the viscosity of the gel system and
reducing the barrier for the active ingredients to diffuse towards the receiving chamber.
In contrast, gel at a lower temperature was too rigid for the active ingredients to diffuse
through. The difference in rigidity was previously discussed in the rheology study in
section 4.3.1.2, where the gel was predominantly solid-like at 30 ˚C and became liquid-
like at 37 ˚C. The reduced viscosity of the gel at 37 ˚C suggests enhanced spreadability
upon application and therefore more efficient delivery of the active ingredients.
Univers
ity of
Mala
ya
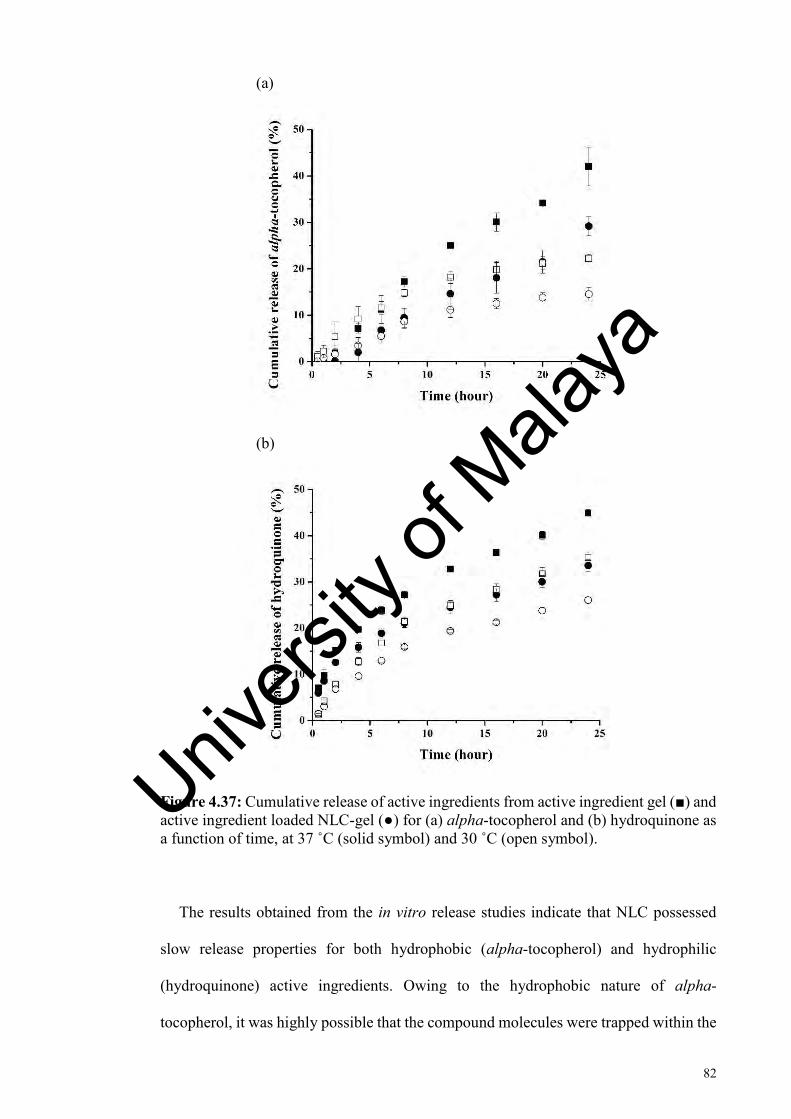
82
(a)
(b)
Figure 4.37: Cumulative release of active ingredients from active ingredient gel (■) and active ingredient loaded NLC-gel (●) for (a) alpha-tocopherol and (b) hydroquinone as a function of time, at 37 ˚C (solid symbol) and 30 ˚C (open symbol).
The results obtained from the in vitro release studies indicate that NLC possessed
slow release properties for both hydrophobic (alpha-tocopherol) and hydrophilic
(hydroquinone) active ingredients. Owing to the hydrophobic nature of alpha-
tocopherol, it was highly possible that the compound molecules were trapped within the
Univers
ity of
Mala
ya

83
lipid matrix, forming a shell model NLC, where the active ingredient settled at the outer
shell of the particles. Even though there was less attempt to encapsulate hydrophilic
compounds in lipid nanoparticles due to their poor compatibility in the lipid phase, it
could potentially be assumed that the hydrophilic molecules were adsorbed on the
surface of the particles by interacting with the hydrophilic head of the surfactant or solid
lipid (Rohit & Pa, 2013). Figure 4.38 demonstrates the schematic illustrations of active
ingredients loaded NLCs in the current study.
Figure 4.38: Schematic illustrations of alpha-tocopherol and hydroquinone loaded NLCs, respectively.
4.3.2.1 Mathematical model evaluations
In order to describe the release kinetic of alpha-tocopherol and hydroquinone from
different carrier systems, the release profiles for NLCs (sample B and F), gels (sample
C and G) and NLC-gels (sample D and H) were fitted with selected mathematical
models. The release curves of alpha-tocopherol and hydroquinone from the respective
carrier systems had different patterns. A triphasic pattern was observed for all release
curves of hydroquinone. As such, model fitting of the release curves of hydroquinone
was carried out by phase. Due to the restriction of the Peppas-Sahlin model, which
Univers
ity of
Mala
ya
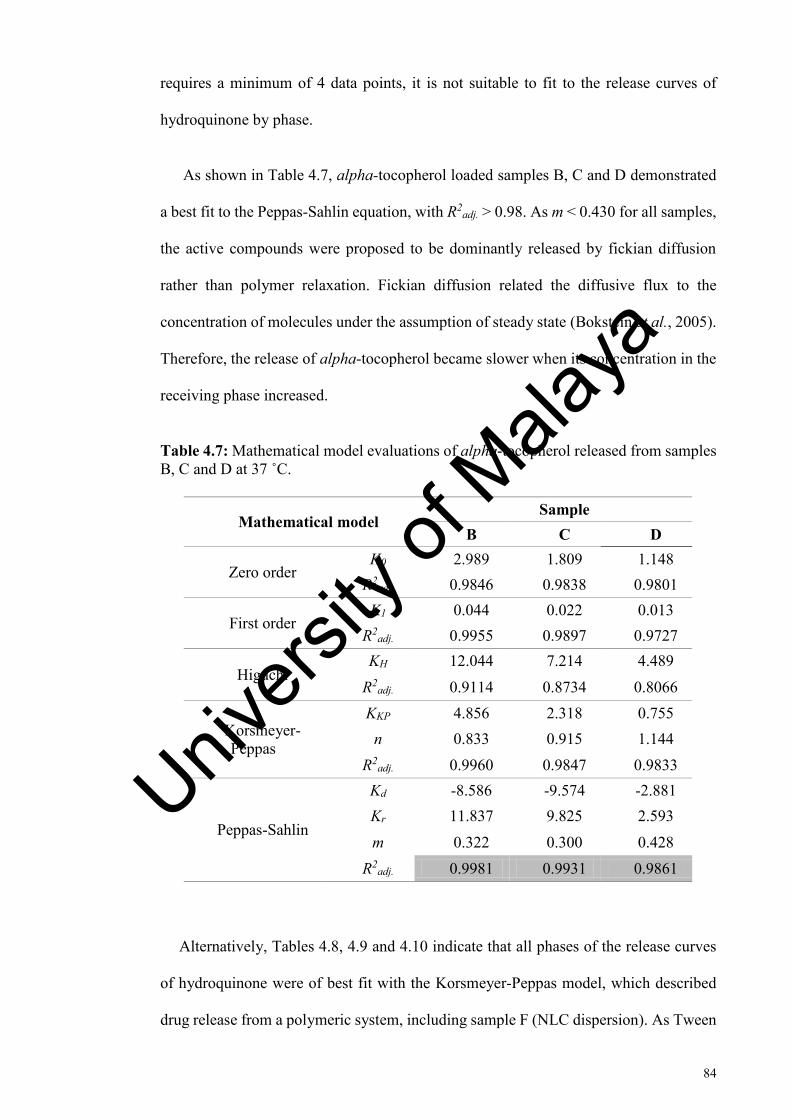
84
requires a minimum of 4 data points, it is not suitable to fit to the release curves of
hydroquinone by phase.
As shown in Table 4.7, alpha-tocopherol loaded samples B, C and D demonstrated
a best fit to the Peppas-Sahlin equation, with R2adj. > 0.98. As m < 0.430 for all samples,
the active compounds were proposed to be dominantly released by fickian diffusion
rather than polymer relaxation. Fickian diffusion related the diffusive flux to the
concentration of molecules under the assumption of steady state (Bokstein et al., 2005).
Therefore, the release of alpha-tocopherol became slower when its concentration in the
receiving phase increased.
Table 4.7: Mathematical model evaluations of alpha-tocopherol released from samples B, C and D at 37 ˚C.
Alternatively, Tables 4.8, 4.9 and 4.10 indicate that all phases of the release curves
of hydroquinone were of best fit with the Korsmeyer-Peppas model, which described
drug release from a polymeric system, including sample F (NLC dispersion). As Tween
Mathematical model Sample
B C D
Zero order K0 2.989 1.809 1.148
R2adj. 0.9846 0.9838 0.9801
First order K1 0.044 0.022 0.013
R2adj. 0.9955 0.9897 0.9727
Higuchi KH 12.044 7.214 4.489
R2adj. 0.9114 0.8734 0.8066
Korsmeyer-Peppas
KKP 4.856 2.318 0.755 n 0.833 0.915 1.144
R2adj. 0.9960 0.9847 0.9833
Peppas-Sahlin
Kd -8.586 -9.574 -2.881 Kr 11.837 9.825 2.593
m 0.322 0.300 0.428 R2
adj. 0.9981 0.9931 0.9861
Univers
ity of
Mala
ya

85
80 was a polymer that could adsorb on the surface of NLC, this observation was in
agreement with the previous assumption that hydroquinone was loaded on the surface
of particles by interaction with the hydrophilic head groups of Tween 80. However, the
release curve of sample F had a best fit with the Higuchi model when it was fitted
directly without the need to separate the sample into different phases. Despite the
Higuchi model being predominantly used to describe drug release from a granular
matrix by Fick diffusion, it is not applicable in this case as the active compound was not
encapsulated in the lipid matrix (Dash et al., 2010). Additionally, the n value of the
Korsmeyer-Peppas model indicated that hydroquinone was released by non-fickian
diffusion where 0.45 < n < 0.89.
Table 4.8: Mathematical model evaluations of hydroquinone released from sample F at 37 ˚C.
Mathematical model Sample F
0.5 – 2 h 4 – 8 h 12 – 24 h 0.5 – 24 h
Zero order K0 6.131 2.937 1.649 1.764
R2adj. 0.6825 0.7232 0.3007 0.6652
First order K1 0.065 0.033 0.020 0.022
R2adj. 0.7344 0.8322 0.6982 0.7742
Higuchi KH 7.620 7.480 7.252 7.310
R2adj. 0.9759 0.9334 0.9951 0.9961
Korsmeyer-Peppas
KKP 7.406 5.762 6.708 7.516 n 0.592 0.642 0.527 0.489
R2adj. 0.9945 0.9568 0.9963 0.9959
Peppas-Sahlin
Kd - - - 7.521 Kr - - - -0.076 m - - - 0.505
R2adj. - - - 0.9953
Univers
ity of
Mala
ya

86
Table 4.9: Mathematical model evaluations of hydroquinone released from sample G at 37 ˚C.
Mathematical model Sample G
0.5 – 2 h 4 – 8 h 12 – 24 h 0.5 – 24 h
Zero order K0 8.332 3.788 2.075 2.229
R2adj. 0.6327 -0.1440 -0.2145 0.5623
First order K1 0.091 0.044 0.027 0.030
R2adj. 0.7075 0.3021 0.5276 0.7310
Higuchi KH 10.371 9.707 9.143 9.298
R2adj. 0.9804 0.9937 0.9761 0.9923
Korsmeyer-Peppas
KKP 10.137 10.401 10.361 10.489 n 0.574 0.462 0.457 0.454
R2adj. 0.9902 0.9999 0.9763 0.9978
Peppas-Sahlin
Kd - - - 10.537 Kr - - - -0.201 m - - - 0.480
R2adj. - - - 0.9976
Table 4.10: Mathematical model evaluations of hydroquinone released from sample H at 37 ˚C.
Mathematical model Sample H
0.5 – 2 h 4 – 8 h 12 – 24 h 0.5 – 24 h
Zero order K0 6.987 2.976 1.552 1.682
R2adj. 0.5335 -0.7241 -0.1968 0.4028
First order K1 0.075 0.033 0.019 0.021
R2adj. 0.6094 -0.2387 0.3620 0.5530
Higuchi KH 8.727 7.641 6.841 7.065
R2adj. 0.9937 0.9561 0.9795 0.9724
Korsmeyer-Peppas
KKP 8.611 8.974 7.709 8.852 n 0.544 0.412 0.459 0.413
R2adj. 0.9992 0.9982 0.9804 0.9964
Peppas-Sahlin
Kd - - - 8.912 Kr - - - -0.112 m - - - 0.426
R2adj. - - - 0.9959
Univers
ity of
Mala
ya

87
Hydroquinone gel (sample G) and hydroquinone loaded NLC-gel (sample H) also
demonstrated a best fit of the Korsmeyer-Peppas model. In these samples, the active
compound was presumably released from the gel network. The Korsmeyer-Peppas
model predominantly characterized diffusion of hydroquinone through the polymeric
gel matrix by non-fickian diffusion for samples G and H as 0.45 < n < 0.89. Nonetheless,
there was an exception where the second phase of sample H described the release of
hydroquinone molecules by quasi fickian diffusion, with n < 0.45. The slight difference
between samples G and H was probably due to the presence of NLC in sample H.
Univers
ity of
Mala
ya
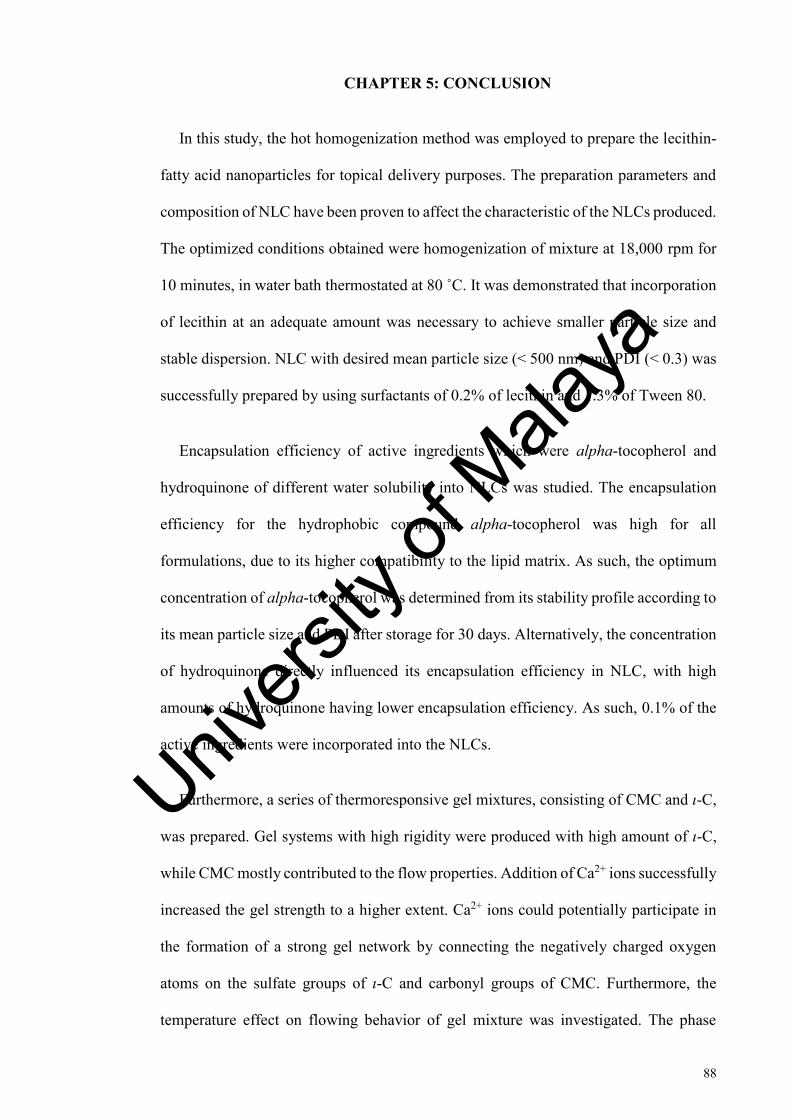
88
CHAPTER 5: CONCLUSION
In this study, the hot homogenization method was employed to prepare the lecithin-
fatty acid nanoparticles for topical delivery purposes. The preparation parameters and
composition of NLC have been proven to affect the characteristic of the NLCs produced.
The optimized conditions obtained were homogenization of mixture at 18,000 rpm for
10 minutes, in water bath thermostated at 80 ˚C. It was demonstrated that incorporation
of lecithin at an adequate amount was necessary to achieve smaller particle size and
stable dispersion. NLC with desired mean particle size (< 500 nm) and PDI (< 0.3) was
successfully prepared by using surfactants of 0.2% of lecithin and 1.3% of Tween 80.
Encapsulation efficiency of active ingredients which were alpha-tocopherol and
hydroquinone of different water solubility into NLCs was studied. The encapsulation
efficiency for the hydrophobic compound alpha-tocopherol was high for all
formulations, due to its higher compatibility to the lipid matrix. As such, the optimum
concentration of alpha-tocopherol was determined from its stability profile according to
its mean particle size and PDI after storage for 30 days. Alternatively, the concentration
of hydroquinone directly influenced its encapsulation efficiency in NLC, with high
amounts of hydroquinone having lower encapsulation efficiency. As such, 0.1% of the
active ingredients were incorporated into the NLCs.
Furthermore, a series of thermoresponsive gel mixtures, consisting of CMC and ι-C,
was prepared. Gel systems with high rigidity were produced with high amount of ι-C,
while CMC mostly contributed to the flow properties. Addition of Ca2+ ions successfully
increased the gel strength to a higher extent. Ca2+ ions could potentially participate in
the formation of a strong gel network by connecting the negatively charged oxygen
atoms on the sulfate groups of ι-C and carbonyl groups of CMC. Furthermore, the
temperature effect on flowing behavior of gel mixture was investigated. The phase
Univers
ity of
Mala
ya

89
transition from gel to solution was illustrated by the crossover point of G’ and G’’. The
gel mixture that possessed Tc at approximately the body temperature was chosen as the
optimized formulation to incorporate the loaded NLCs.
Despite the minor increase in rigidity of NLC-gel, incorporation of NLC did not show
a significant effect on the rheological properties of the gel mixture. All the gel samples
incorporated with NLCs exhibited shear thinning behavior and thermally activated
phase transition from gel to liquid at temperatures in the vicinity of 37 ̊ C. These features
are advantageous in topical application as they achieve enhanced spreadability upon
application.
In vitro release studies confirmed the slow release properties of NLC by comparing
the release profile of NLC dispersion and active ingredient solution. However, the
solubility of the active ingredients influenced the release rate from the gel matrix. The
cumulative release of alpha-tocopherol and NLC-gel was low due to their limited
mobility in the aqueous system, while diffusion of hydroquinone was controlled by
NLC. Additionally, gel samples release both active ingredients at a slower rate at 30 ˚C
compared to 37 ˚C, implying the improved flowing behavior of the gels at higher
temperature and hence more efficient delivery of the active ingredients.
The obtained results indicated that the thermoresponsive gel mixture had great
potential in topical application, while NLC is a promising carrier system for alpha-
tocopherol and hydroquinone.
Univers
ity of
Mala
ya

90
REFERENCES
Agorku, E. S., Kwaansa-Ansah, E. E., Voegborlo, R. B., Amegbletor, P., and Opoku, F. (2016). Mercury and hydroquinone content of skin toning creams and cosmetic soaps, and the potential risks to the health of Ghanaian women. SpringerPlus, 5, 319.
Aho, J. (2011). Rheological characterization of polymer melts in shear and extension: Measurement reliability and data for practical processing. Finland: Tampere University of Technology.
Akbarzadeh, A., Rezaei-Sadabady, R., Davaran, S., Joo, S. W., Zarghami, N., Hanifehpour, Y., Samiei, M., Kouhi, M., and Nejati-Koshki, K. (2013). Liposome: Classification, preparation, and applications. Nanoscale Research Letters, 8(1), 102.
Albanes, D., Heinonen, O. P., Huttunen, J. K., Taylor, P. R., Virtamo, J., Edwards, B. K., Haapakoski, J., Rautalahti, M., Hartman, A. M., and Palmgren, J. (1995). Effects of alpha-tocopherol and beta-carotene supplements on cancer incidence in the alpha-tocopherol beta-carotene cancer prevention study. The American Journal of Clinical Nutrition, 62(6), 1427S-1430S.
Alvarez-Román, R., Naik, A., Kalia, Y. N., Guy, R. H., and Fessi, H. (2004). Skin penetration and distribution of polymeric nanoparticles. Journal of Controlled Release, 99(1), 53-62.
Alves, P. M., Pohlmann, A. R., and Guterres, S. S. (2005). Semisolid topical formulations containing nimesulide-loaded nanocapsules, nanospheres or nanoemulsions: Development and rheological characterization. Pharmazie, 60(12), 900-904.
Aulton, M. E., and Taylor, K. M. G. (Ed.). (2013). Aulton's Pharmaceutics: The design and manufacture of medicines (4th ed.). Netherlands: Elsevier Health Sciences.
Balzer, D., Varwig, S., and Weihrauch, M. (1995). Viscoelasticity of personal care products. Colloids and Surfaces A: Physicochemical and Engineering Aspects, 99(2), 233-246.
Beaurline, J. M., Roddy, P. J., and Tomai, M. A. (1999). Gel formulations for topical drug delivery (pp. US5939090 A): Google Patents.
Beck, R., Guterres, S., and Pohlmann, A. (Eds.). (2011). Nanocosmetics and Nanomedicines. Berlin: Springer-Verlag.
Becker Peres, L., Becker Peres, L., de Araújo, P. H. H., and Sayer, C. (2016). Solid lipid nanoparticles for encapsulation of hydrophilic drugs by an organic solvent free double emulsion technique. Colloids and Surfaces B: Biointerfaces, 140, 317-323.
Bokstein, B. S., Mendeleev, M. I., and Srolovitz, D. J. (2005). Thermodynamics and kinetics in materials science: A short course. Oxford: Oxford University Press.
Univers
ity of
Mala
ya
91
Bromberg, L. E., and Ron, E. S. (1998). Temperature-responsive gels and thermogelling polymer matrices for protein and peptide delivery. Advanced Drug Delivery Reviews, 31(3), 197-221.
Bunjes, H., and Unruh, T. (2007). Characterization of lipid nanoparticles by differential scanning calorimetry, X-ray and neutron scattering. Advanced Drug Delivery Reviews, 59(6), 379-402.
Cairns, P., Miles, M. J., Morris, V. J., and Brownsey, G. J. (1987). X-Ray fibre-diffraction studies of synergistic, binary polysaccharide gels. Carbohydrate Research, 160, 411-423.
Chenite, A., Chaput, C., Wang, D., Combes, C., Buschmann, M. D., Hoemann, C. D., Leroux, J. C., Atkinson, B. L., Binette, F., and Selmani, A. (2000). Novel injectable neutral solutions of chitosan form biodegradable gels in situ. Biomaterials, 21(21), 2155-2161.
Chieng, Y. Y. and Chen, S. B. (2010). Rheological study of hydrophobically modified hydroxyethyl cellulose and phospholipid vesicles. Journal of Colloid and Interface Science, 349(1), 236-245.
Cottrell, T. L. (1958). The strengths of chemical bonds (2nd ed.). London: Butterworth.
Couteau, C., and Coiffard, L. (2016). Overview of skin whitening agents: Drugs and cosmetic products. Cosmetics, 3(3), 27.
Darwent, B. deB. (1970). National standard reference data series (no. 31). Washington: National Bureau of Standards.
Dash, S., Murthy, P. N., Nath, L., and Chowdhury, P. (2010). Kinetic modeling on drug release from controlled drug delivery systems. Acta Poloniae Pharmaceutica-Drug Research, 67(3), 217-223.
Doktorovova, S., Lopes, C. M., and Souto, E. B. (2009). Lipid nanoparticle mediated drug delivery for safer cancer treatment: Example of paclitaxel. Revista da Faculdade de ciencias da Saude, 84-93.
Doshi, N., Zahr, A. S., Bhaskar, S., Lahann, J., and Mitragotri, S. (2009). Red blood cell-mimicking synthetic biomaterial particles. Proceedings of the National Academy of Sciences of the United States of America, 106(51), 21495-21499.
Eh Suk, V. R. and Misran, M. (2017). Preparation, characterization and physicochemical properties of DOPE-PEG2000 stabilized oleic acid-soy lecithin liposomes (POLL). Colloids and Surfaces A: Physicochemical and Engineering Aspects, 513, 267-273.
Farboud, E. S., Nasrollahi, S. A., and Tabbakhi, Z. (2011). Novel formulation and evaluation of a Q10-loaded solid lipid nanoparticle cream: In vitro and in vivo studies. International Journal of Nanomedicine, 6, 611-617.
Univers
ity of
Mala
ya

92
Fedorchak, M. V., Little, S. R., Schuman, J. S., and Cugini, A. (2014). Thermoresponsive hydrogel containing polymer microparticles for noninvasive ocular drug delivery (pp. WO2014138085 A1): Google Patents.
Franzetti, A., Gandolfi, I., Bestetti, G., and Banat, I. (2010). (Bio)surfactant and bioremediation, successes and failures. In I. G. Plaza (Ed.), Trending in bioremediation and phytoremediation (pp. 145-156). Kerala, India: Research Signpost.
Freitas, C., and Müller, R. H. (1999). Correlation between long-term stability of solid lipid nanoparticles (SLN™) and crystallinity of the lipid phase. European Journal of Pharmaceutics and Biopharmaceutics, 47(2), 125-132.
Gandra, S. C. R., Nguyen, S., Nazzal, S., Alayoubi, A., Jung, R., and Nesamony, J. (2015). Thermoresponsive fluconazole gels for topical delivery: Rheological and mechanical properties, in vitro drug release and anti-fungal efficacy. Pharmaceutical Development and Technology, 20(1), 41-49.
Garrec, D. A., and Norton, I. T. (2013). Kappa carrageenan fluid gel material properties. Part 2: Tribology. Food Hydrocolloids, 33(1): 160-167.
Garud, A., Singh, D., and Navneet, G. (2012). Solid lipid nanoparticles (SLN): Method, characterization and applications. International Current Pharmaceutical Journal, 1(11), 384-393.
Gennaro, A. R. (Ed.). (2000). Rheology in Remington: The science and practice of pharmacy (20th ed.). Philadelphia: University of the Sciences in Philadelphia.
Ghanbarzadeh, S., Hariri, R., Kouhsoltani, M., Shokri, J., Javadzadeh, Y., and Hamishehkar, H. (2015). Enhanced stability and dermal delivery of hydroquinone using solid lipid nanoparticles. Colloids and Surfaces B: Biointerfaces, 136, 1004-1010.
Gokce, E. H., Korkmaz, E., Tuncay-Tanrıverdi, S., Dellera, E., Sandri, G., Bonferoni, M. C., and Ozer, O. (2012). A comparative evaluation of coenzyme Q10-loaded liposomes and solid lipid nanoparticles as dermal antioxidant carriers. International Journal of Nanomedicine, 7, 5109-5117.
Gulrez, S. K. H., and Al-Assaf, S. (2011). Hydrogels: Methods of preparation, characterisation and applications. Progress in Molecular and Environmental Bioengineering - From Analysis and Modeling to Technology Applications, Prof. Angelo Carpi (Ed.): InTech.
Han, F., Li, S., Yin, R., Liu, H., and Xu, L. (2008). Effect of surfactants on the formation and characterization of a new type of colloidal drug delivery system: Nanostructured lipid carriers. Colloids and Surfaces A: Physicochemical and Engineering Aspects, 315(1–3), 210-216.
Hapiot, F., Menuel, S., and Monflier, E. (2013). Thermoresponsive hydrogels in catalysis. ACS Catalysis, 3(5), 1006-1010.
Univers
ity of
Mala
ya

93
Harde, H., Agrawal, A. K., Katariya, M., Kale, D., and Jain, S. (2015). Development of a topical adapalene-solid lipid nanoparticle loaded gel with enhanced efficacy and improved skin tolerability. RSC Advances, 5, 43917-43929.
He, X., Fan, J., Zhang, F., Li, R., Pollack, K. A., Raymond, J. E., Zou, J., and Wooley, K. L. (2014). Multi-responsive hydrogels derived from the self-assembly of tethered allyl-functionalized racemic oligopeptides. Journal of Materials Chemistry B, 2(46), 8123-8130.
Hoffmann, H., Rehage, H., and Rauscher, A. (Eds.). (1992). Structure and dynamics of strongly interactive colloids and supramolecular aggregates in solution. The Netherlands: Kluwer Academic.
Islam, M. T., Rodriguez-Hornedo, N., Ciotti, S. and Ackermann, C. (2004). Rheological characterization of topical carbomer gels neutralized to different pH. Pharmaceutical Research, 21(7), 1192-1199.
Janaswamy, S., and Chandrasekaran, R. (2002). Effect of calcium ions on the organization of iota-carrageenan helices: An X-ray investigation. Carbohydrate Research, 337(6), 523-535.
Janaswamy, S., and Chandrasekaran, R. (2005). Cation-induced polymorphism in iota-carrageenan. Carbohydrate Polymers, 60(4), 499-505.
Janaswamy, S., and Chandrasekaran, R. (2008). Heterogeneity in iota-carrageenan molecular structure: Insights for polymorph II→III transition in the presence of calcium ions. Carbohydrate Research, 343(2), 364-373.
Janaswamy, S., and Youngren, S. R. (2012). Hydrocolloid-based nutraceutical delivery systems. Food and Function, 3(5), 503-507.
Jenning, V., and Gohla, S. H. (2001). Encapsulation of retinoids in solid lipid nanoparticles (SLN). Journal of Microencapsulation, 18(2), 149-158.
Jenning, V., Schäfer-Korting, M., and Gohla, S. (2000). Vitamin A-loaded solid lipid nanoparticles for topical use: Drug release properties. Journal of Controlled Release, 66(2–3), 115-126.
Jeong, B., Kim, S. W., and Bae, Y. H. (2002). Thermosensitive sol–gel reversible hydrogels. Advanced Drug Delivery Reviews, 54(1), 37-51.
Junyaprasert, V. B., Teeranachaideekul, V., Souto, E. B., Boonme, P., and Müller, R. H. (2009). Q10-loaded NLC versus nanoemulsions: Stability, rheology and in vitro skin permeation. International Journal of Pharmaceutics, 377(1–2), 207-214.
Kara, S., Arda, E., and Pekcan, Ö. (2007). Monovalent and divalent cation effects on phase transitions of ι-carrageenan. Journal of Bioactive and Compatible Polymers, 22(1), 42-61.
Univers
ity of
Mala
ya

94
Klouda, L., and Mikos, A. G. (2008). Thermoresponsive hydrogels in biomedical applications. European Journal of Pharmaceutics and Biopharmaceutics, 68(1), 34-45.
Kocharian, A., Shabanian, R., Rafiei-Khorgami, M., Kiani, A., and Heidari-Bateni, G. (2009). Coenzyme-Q10 improves diastolic function in children with idiopathic dilated cardiomyopathy. Cardiology in the Young, 19(5), 501-506.
Lacatusu, I., Badea, N., Murariu, A., Bojin, D., and Meghea, A. (2010). Effect of UV sunscreens loaded in solid lipid nanoparticles: A combinated SPF assay and photostability. Molecular Crystals and Liquid Crystals, 523(1), 247-259.
Lacatusu, I., Badea, N., Ovidiu, O., Bojin, D., and Meghea, A. (2012). Highly antioxidant carotene-lipid nanocarriers: Synthesis and antibacterial activity. Journal of Nanoparticle Research, 14(6), 902.
Lawrence, M. J., and Rees, G. D. (2000). Microemulsion-based media as novel drug delivery systems. Advanced Drug Delivery Reviews, 45(1), 89-121.
Lieberman, J. A., Rieger, M. M., and Banker, G. S. (Eds.). (1996). Pharmaceutical dosage forms: Disperse systems (2nd ed.): New York.
Liu, D., Chen, L., Jiang, S., Zhu, S., Qian, Y., Wang, F., Li, R., and Xu, Q. (2014). Formulation and characterization of hydrophilic drug diclofenac sodium-loaded solid lipid nanoparticles based on phospholipid complexes technology. Journal of Liposome Research, 24(1), 17-26.
Liu, J., Hu, W., Chen, H., Ni, Q., Xu, H., and Yang, X. (2007). Isotretinoin-loaded solid lipid nanoparticles with skin targeting for topical delivery. International Journal of Pharmaceutics, 328(2), 191-195.
Liu, W., Hu, M., Liu, W., Xue, C., Xu, H., and Yang, X. (2008). Investigation of the carbopol gel of solid lipid nanoparticles for the transdermal iontophoretic delivery of triamcinolone acetonide acetate. International Journal of Pharmaceutics, 364(1), 135-141.
Loo, C., Basri, M., Ismail, R., Lau, H., Tejo, B., Kanthimathi, M., Hassan, H., and Choo, Y. (2013). Effect of compositions in nanostructured lipid carriers (NLC) on skin hydration and occlusion. Internatonal Jornal of Nanomedicine, 8, 13-22.
Lopaciuk, A., and Loboda, M. (2013). Global beauty industry trends in the 21st century. Zadar, Croatia: International Conference 2013.
Lucks, S., and Muller, R. (1998). Medication vehicles made of solid lipid particles (solid lipid nanospheres-sln) (pp. CA2119253 A2119251): Google Patents.
Manea, A.-M., Vasile, B. S., and Meghea, A. (2014). Antioxidant and antimicrobial activities of green tea extract loaded into nanostructured lipid carriers. Comptes Rendus Chimie, 17(4), 331-341.
Univers
ity of
Mala
ya

95
Martin, A. (Ed.). (1993). Rheology in physical pharmacy: Physical chemical principles the pharmaceutical sciences (4th ed.). Philadelphia: Lippicott Williams & Wilkins.
McClements, D. J. (2004). Food emulsions: Principles, practices, and techniques (2nd ed.). United States: CRC Press.
Mehnert, W., and Mäder, K. (2001). Solid lipid nanoparticles: Production, characterization and applications. Advanced Drug Delivery Reviews, 47(2–3), 165-196.
Mijangos, F., Varona, F., and Villota, N. (2006). Changes in solution color during phenol oxidation by Fenton reagent. Environmental Science and Technology, 40(17), 5538-5543.
Milao, D., Knorst, M. T., Richter, W., and Guterres, S. S. (2003). Hydrophilic gel containing nanocapsules of diclofenac: Development, stability study and physico-chemical characterization. Pharmazie, 58(5), 325-329.
Mueller, R., Maeder, K., Lippacher, A., and Jenning, V. (2000). Lipid particles based on matrix comprising solid and liquid lipid, useful in diagnostics and for controlled release of active agents, especially pharmaceuticals (pp. DE19945203 A19945201): Google Patents.
Mukherjee, S., Ray, S., and Thakur, R. S. (2009). Solid lipid nnoparticles: A modern formulation approach in drug delivery system. Indian Journal of Pharmaceutical Sciences, 71(4), 349-358.
Müller, R. H., Jacobs, C., and Kayser, O. (2001). Nanosuspensions as particulate drug formulations in therapy: Rationale for development and what we can expect for the future. Advanced Drug Delivery Reviews, 47(1), 3-19.
Müller, R. H., Jenning, V., Mäder, K., and Lippacher, A. (2000). Lipid particles on the basis of mixtures of liquid and solid lipids and the method for producing same. (pp. 8,663,692): US Patents.
Naeem, S., Kiew, L. V., Chung, L. Y., Teo, Y. Y., and Misran, M. (2015). Drug delivery and innovative pharmaceutical development in mimicking the red blood cell membrane. Reviews in Chemical Engineering, 31(5), 491-508.
Nahak, P., Karmakar, G., Roy, B., Guha, P., Sapkota, M., Koirala, S., Chang, C. H., and Panda, A. K. (2015). Physicochemical studies on local anaesthetic loaded second generation nanolipid carriers. RSC Advances, 5, 26061-26070.
Nair, R., Priya, K. V., Kumar, K. S. A., T.Md.Badivaddin, and M, S. (2011). Formulation and evaluation of solid lipid nanoparticles of water soluble drug: Isoniazid. Journal of Pharmaceutical Sciences and Research, 3(5), 1256-1264.
Necas, J., and Bartosikova, L. (2013). Carrageenan: A review. Veterinární Medicína, 58(4), 187-205.
Univers
ity of
Mala
ya

96
Nishinari, K. (2009). Some thoughts on the definition of a gel. In M. Tokita and K. Nishinari (Eds.). Gels: Structures, properties, and functions: Fundamentals and applications (pp. 87-94). Berlin: Springer-Berlin Heidelberg.
Otarola, J., Lista, A. G., Band, B. F., and Garridon, M. (2015). Capillary electrophoresis to determine entrapment efficiency of a nanostructured lipid carrier loaded with piroxicam. Journal of Pharmaceutical Analysis, 5(1), 70-73.
Pardeike, J., Hommoss, A., and Müller, R. H. (2009). Lipid nanoparticles (SLN, NLC) in cosmetic and pharmaceutical dermal products. International Journal of Pharmaceutics, 366(1–2), 170-184.
Pardeike, J., Schwabe, K., and Muller, R. H. (2010). Influence of nanostructured lipid carriers (NLC) on the physical properties of the Cutanova Nanorepair Q10 cream and the in vivo skin hydration effect. International Journal of Pharmaceutics, 396(1-2), 166-173.
Paudel, K. S., Milewski, M., Swadley, C. L., Brogden, N. K., Ghosh, P., and Stinchcomb, A. L. (2010). Challenges and opportunities in dermal/transdermal delivery. Therapeutic Delivery, 1(1), 109-131.
Peppas, N. A., Bures, P., Leobandung, W., and Ichikawa, H. (2000). Hydrogels in pharmaceutical formulations. European Journal of Pharmaceutics and Biopharmaceutics, 50(1), 27-46.
Pilgram, G. S. K., Marjolein Engelsma-van Pelt, A., Koerten, H. K., and Bouwstra, J. A. (1999). Electron diffraction provides new information on human stratum corneum lipid organization studied in relation to depth and temperature. Journal of Investigative Dermatology, 113(3), 403-409.
Placzek, M., and Kosela, M. (2016). Microscopic methods in analysis of submicron phospholipid dispersions. Acta Pharmaceutica, 66, 1-22.
Podda, M., and Grundmann-Kollmann, M. (2001). Low molecular weight antioxidants and their role in skin ageing. Clinical and Experimental Dermatology, 26(7), 578-582.
Pople, P. V., and Singh, K. K. (2011). Development and evaluation of colloidal modified nanolipid carrier: Application to topical delivery of tacrolimus. European Journal of Pharmaceutics and Biopharmaceutics, 79(1), 82-94.
Puri, A., Loomis, K., Smith, B., Lee, J.-H., Yavlovich, A., Heldman, E., and Blumenthal, R. (2009). Lipid-based nanoparticles as pharmaceutical drug carriers: From concepts to clinic. Critical Reviews in Therapeutic Drug Carrier Systems, 26(6), 523-580.
Qiu, Y., and Park, K. (2001). Environment-sensitive hydrogels for drug delivery. Advanced Drug Delivery Reviews, 53(3), 321-339.
Rao, J. P., and Geckeler, K. E. (2011). Polymer nanoparticles: Preparation techniques and size-control parameters. Progress in Polymer Science, 36(7), 887-913.
Univers
ity of
Mala
ya
97
Rauwendaal, C. (2014). Chapter 5 - Fundamental principles. Polymer Extrusion (5th ed.) (pp. 147-189). Germany: Hanser.
Rees, D. A., Williamson, F. B., Frangou, S. A., and Morris, E. R. (1982). Fragmentation and modification of r-carrageenan and characterisation of the polysaccharide order-disorder transition in solution. European Journal of Biochemistry, 122(1), 71-79.
Richter, F., and Steiger, M. (1999). Pharmaceutical composition (pp. US5856355 A): Google Patents.
Rizvi, S., Raza, S. T., Ahmed, F., Ahmad, A., Abbas, S., and Mahdi, F. (2014). The role of vitamin E in human health and some diseases. Sultan Qaboos University Medical Journal, 14(2), e157-e165.
Rohit, B., and Pa, K. I. (2013). A method to prepare solid lipid nanoparticles with improved entrapment efficiency of hydrophilic drugs. Current Nanoscience, 9(2), 211-220.
Rosli, N. A., Hasham, R., Aziz, A. A., and Aziz, R. (2015). Formulation and characterization of nanostructured lipid carrier encapsulated Zingiber zerumbet oil using ultrasonication technique. Journal of Advanced Research in Applied Mechanics, 11(1), 16-23.
Shekunov, B. Y., Chattopadhyay, P., Tong, H. H. Y., and Chow, A. H. L. (2007). Particle size analysis in pharmaceutics: Principles, methods and applications. Pharmaceutical Research, 24(2), 203-227.
Shim, J., Kang, H. S., Park, W.-S., Han, S.-H., Kim, J., and Chang, I.-S. (2004). Transdermal delivery of mixnoxidil with block copolymer nanoparticles. Journal of Controlled Release, 97(3), 477-484.
Schmaljohann, D. (2006). Thermo- and pH-responsive polymers in drug delivery. Advanced Drug Delivery Reviews, 58(15), 1655-1670.
Schubert, M. A., Harms, M., and Müller-Goymann, C. C. (2006). Structural investigations on lipid nanoparticles containing high amounts of lecithin. European Journal of Pharmaceutical Sciences, 27(2–3), 226-236.
Schubert, M. A., and Müller-Goymann, C. C. (2005). Characterisation of surface-modified solid lipid nanoparticles (SLN): Influence of lecithin and nonionic emulsifier. European Journal of Pharmaceutics and Biopharmaceutics, 61(1–2), 77-86.
Schubert, M. A., Schicke, B. C., and Müller-Goymann, C. C. (2005). Thermal analysis of the crystallization and melting behavior of lipid matrices and lipid nanoparticles containing high amounts of lecithin. International Journal of Pharmaceutics, 298(1), 242-254.
Shah, M., Agrawal, Y. K., Garala, K., and Ramkishan, A. (2012). Solid lipid nanoparticles of a water soluble drug, ciprofloxacin hydrochloride. Indian Journal of Pharmaceutical Sciences, 74(5), 434-442.
Univers
ity of
Mala
ya
98
Sharipova, A. A., Aidarova, S. B., Grigoriev, D., Mutalieva, B., Madibekova, G., Tleuova, A. and Miller, R. (2016). Polymer-surfactant complexes for microencapsulation of Vitamin E and its release. Colloids and Surfaces B: Biointerfaces, 137, 152-157.
Shekhawat, P. B. (2013). Preparation and evaluation of clotrimazole nanostructured lipid carrier for topical delivery. International Journal of Pharma and Bio Sciences, 4(1), 407-416.
Shi, F., Zhao, J. H., Liu, Y., Wang, Z., Zhang, Y. T., and Feng, N. P. (2012). Preparation and characterization of solid lipid nanoparticles loaded with frankincense and myrrh oil. International Journal of Nanomedicine, 7, 2033-2043.
Shylaja, P. A., and Mathew, M. M. (2016). Preparation and Characterization of alpha-tocopherol loaded solid lipid nanoparticles by hot homogenization method. International Journal of Pharmacy & Pharmaceutical Research. Human Journals, 7(1), 437-448.
Silva, A. C., Santos, D., Ferreira, D. C., and Souto, E. B. (2009). Minoxidil-loaded nanostructured lipid carriers (NLC): Characterization and rheological behaviour of topical formulations. Pharmazie, 64(3), 177-182.
Singhvi, G., and Singh, M. (2011). Review: In-vitro drug release characterization models International Journal of Pharmaceutical Studies and Research, II(I), 77-84.
Souto, E. B., and Müller, R. H. (2008). Cosmetic features and applications of lipid nanoparticles (SLN®, NLC®). International Journal of Cosmetic Science, 30(3), 157-165.
Souto, E. B., Wissing, S. A., Barbosa, C. M., and Müller, R. H. (2004). Development of a controlled release formulation based on SLN and NLC for topical clotrimazole delivery. International Journal of Pharmaceutics, 278(1), 71-77.
Tan, H. W., and Misni, M. (2014). Effect of chitosan-modified fatty acid liposomes on the rheological properties of the carbohydrate-based gel. Applied Rheology, 24, 34839-34847.
Tari, Ö., Kara, S., and Pekcan, Ö. (2011). Study of thermal phase transitions in iota-carrageenan gels via fluorescence technique. Journal of Applied Polymer Science, 121(5), 2652-2661.
Teeranachaideekul, V., Müller, R. H., and Junyaprasert, V. B. (2007). Encapsulation of ascorbyl palmitate in nanostructured lipid carriers (NLC) - Effects of formulation parameters on physicochemical stability. International Journal of Pharmaceutics, 340(1–2), 198-206.
Teeranachaideekul, V., Souto, E. B., Junyaprasert, V. B., and Müller, R. H. (2007). Cetyl palmitate-based NLC for topical delivery of Coenzyme Q10 – Development, physicochemical characterization and in vitro release studies. European Journal of Pharmaceutics and Biopharmaceutics, 67(1), 141-148.
Univers
ity of
Mala
ya

99
Terroso, T., Külkamp, I. C., Jornada, D. S., Pohlmann, A. R., and Guterres, S. S. (2009). Development of semi-solid cosmetic formulations containing coenzyme Q10-loaded nanocapsules. Latin American Journal of Pharmacy, 28(6), 819–826.
Üner, M., and Yener, G. (2007). Importance of solid lipid nanoparticles (SLN) in various administration routes and future perspectives. International Journal of Nanomedicine, 2(3), 289-300.
Vijayan, V., Aafreen, S., Sakthivel, S., and Reddy, K. R. (2013). Formulation and characterization of solid lipid nanoparticles loaded Neem oil for topical treatment of acne. Journal of Acute Disease, 2(4), 282-286.
Weiss, S. C. (2011). Conventional topical delivery systems. Dermatologic Therapy, 24(5), 471-476.
Winter, H. H. (1987). Can the gel point of a cross-linking polymer be detected by the G′ – G″ crossover? Polymer Engineering & Science, 27(22), 1698-1702.
Wissing, S. A., and Müller, R. H. (2003). The influence of solid lipid nanoparticles on skin hydration and viscoelasticity – In vivo study. European Journal of Pharmaceutics and Biopharmaceutics, 56(1), 67-72.
Woo, J. O. (2014). Stearic-oleic acid nanocarriers for cream formulation. Master Thesis, University of Malaya, Kuala Lumpur, Malaysia.
Woo, J. O., Misran, M., Lee, P. F., and Tan, L. P. (2014). Development of a controlled release of salicylic acid loaded stearic acid-oleic acid nanoparticles in cream for topical delivery. The Scientific World Journal, 2014, 7.
Yang, F., Li, G., He, Y.-G., Ren, F.-X., and Wang, G.-x. (2009). Synthesis, characterization, and applied properties of carboxymethyl cellulose and polyacrylamide graft copolymer. Carbohydrate Polymers, 78(1), 95-99.
Yenilmez, E., Basaran, E. and Yazan, Y. (2011). Release characteristics of Vitamin E incorporated chitosan microspheres and in vitro-in vivo evaluation for topical application. Carbohydrate Polymers, 84(2), 807-811.
Yuguchi, Y., Urakawa, H., and Kajiwara, K. (2003). Structural characteristics of carrageenan gels: Various types of counter ions. Food Hydrocolloids, 17(4), 481-485.
Zhang, Y., Bai, Y., Jia, J., Gao, N., Li, Y., Zhang, R., Jiang, G., and Yan, B. (2014). Perturbation of physiological systems by nanoparticles. Chemical Society Reviews, 43(10), 3762-3809.
zur Mühlen, A., Schwarz, C., and Mehnert, W. (1998). Solid lipid nanoparticles (SLN) for controlled drug delivery – Drug release and release mechanism. European Journal of Pharmaceutics and Biopharmaceutics, 45(2), 149-155.
Univers
ity of
Mala
ya

100
LIST OF PUBLICATIONS
Lim, Q. Y. and Misran, M. (2017). Rheological and physicochemical characterization of alpha-tocopherol loaded lipid nanoparticles in thermoresponsive gel for topical application. Malaysian Journal of Fundamental and Applied Science, 13(3), 248-252.
Lim, Q. Y. and Misran, M. (2017). Thermoresponsive gel mixture carboxymethyl cellulose and iota-carrageenan for topical delivery of hydroquinone. Polymer Science. (Accepted)
Univers
ity of
Mala
ya

101
Univers
ity of
Mala
ya

102
Univers
ity of
Mala
ya