malaya of universitystudentsrepo.um.edu.my/10416/4/khan.pdffaculty of dentistry university of malaya...
TRANSCRIPT
DENTAL AGE ESTIMATION IN MALAYSIAN ADULTS
BASED ON VOLUMETRIC ANALYSIS OF PULP/TOOTH
RATIO USING CBCT DATA.
MUHAMMAD KHAN ASIF
FACULTY OF DENTISTRY
UNIVERSITY OF MALAYA
KUALALUMPUR
2017
Univers
ity of
Mala
ya
DENTAL AGE ESTIMATION IN MALAYSIAN ADULTS
BASED ON VOLUMETRIC ANALYSIS OF PULP/TOOTH
RATIO USING CBCT DATA.
MUHAMMAD KHAN ASIF
DISSERTATION SUBMITTED IN FULFILMENT OF THE
REQUIREMENTS FOR THE DEGREE OF MASTER OF
DENTAL SCIENCE
FACULTY OF DENTISTRY
UNIVERSITY OF MALAYA
KUALA LUMPUR
2017
Univers
ity of
Mala
ya
ii
UNIVERSITI MALAYA
ORIGINAL LITERARY WORK DECLARATION
Name of Candidate: Muhammad Khan Asif
Registration/Matric No: DGC150005
Name of Degree: Master of Dental Science.
Title of Project Paper/Research Report/Dissertation/Thesis (“this Work”):
DENTAL AGE ESTIMATION IN MALAYSIAN ADULTS BASED ON
VOLUMETRIC ANALYSIS OF PULP/TOOTH RATIO USING CBCT
DATA.
Field of Study: Forensic Odontology, Oral Biology, Oro-maxillofacial radiology.
I do solemnly and sincerely declare that:
(1) I am the sole author/writer of this Work;
(2) This Work is original;
(3) Any use of any work in which copyright exists was done by way of fair dealing
and for permitted purposes and any excerpt or extract from, or reference to or
reproduction of any copyright work has been disclosed expressly and sufficiently
and the title of the Work and its authorship have been acknowledged in this Work;
(4) I do not have any actual knowledge, nor do I ought reasonably to know that the
making of this work constitutes an infringement of any copyright work;
(5) I hereby assign all and every rights in the copyright to this Work to the University
of Malaya (“UM”), who henceforth shall be owner of the copyright in this Work
and that any reproduction or use in any form or by any means whatsoever is
prohibited without the written consent of UM having been first had and obtained;
(6) I am fully aware that if in the course of making this Work I have infringed any
copyright whether intentionally or otherwise, I may be subject to legal action or any
other action as may be determined by UM.
Candidate’s Signature Date
Subscribed and solemnly declared before,
Witness’s Signature Date
Name:
Designation:
Univers
ity of
Mala
ya
iii
ABSTRACT
Introduction
Secondary dentine formation is one of the vital physiological age-related change
that occurs in the permanent dentition throughout life. This physiological age-
related factor can be used for dental age estimation and identification of unknown
deceased persons.
Aims
To investigate the strength of association between chronological age and pulp/tooth
volume ratio among the Malaysian population and to find which amongst these 3
types (Maxillary right canines, maxillary left canines, maxillary right central
incisors) of investigated monoradicular teeth had the highest strength of correlation.
Materials and Methods
Three hundred CBCT scanned data of 153 males and 147 females’ belonging to
either Chinese or Malay ethnicity, stored in the Oral and Maxillofacial Imaging
Division, Faculty of Dentistry University of Malaya were selected according to the
quality, image acquiring parameters and age of the patients at the time of
registration. The subjects were divided into 5 age groups (10 years interval each
group), ranging from 16 to 65 years to ensure balanced sample distribution across
the 5 groups. Subsequently 100 maxillary left canines, 100 maxillary right canines
and 100 maxillary right central incisors having no pathology and fully developed
roots were selected from the database of 300 CBCT scans. Hence, one tooth per
CBCT scan was selected. Maxillary right and maxillary left canines were selected
for the study in order to investigate if any significant difference in the strength of
correlation occurred between two similar types of teeth belonging to different
Univers
ity of
Mala
ya
iv
subjects. CBCT data was acquired using the i-CAT Cone Beam 3D Dental Imaging
System (Imaging Sciences International, Hatfield, USA). The scans selected had
exposure parameters of 120 KV, 18 mA and the scans were acquired using voxel
size of 0.30 mm and scanning time of 20 sec. Volumetric analysis was performed
with MIMICS software (Materialise NV, Belgium, version 16.0). Data was analysed
using SPSS version 20.
Results
The Pearson correlation and regression analysis showed a significant inverse
association between pulp/tooth volume ratio and chronological age for all the 3 types
of investigated teeth (p<0.01). Results showed the highest coefficient of
determination (R2) values for maxillary central incisor (R2=0.696) followed by
maxillary right canine (R2=0.545) and maxillary left canine (R2=0.527). The
strength of correlation for both male and female was found to be very good. Fisher
Z test results showed no significant difference in the correlation coefficient values
between genders for all the 3 types of investigated teeth and for the whole sample
(Z critical 1.96 for p < .05). Fisher Z test indicated no significant difference in the
correlation coefficient values between maxillary right and maxillary left canines
(P=0.88), despite these teeth being selected from different individuals.
Conclusion
The present study reinforced that pulp/tooth volume ratio with age is a valuable
indicator for dental age estimation for Malaysian population. Maxillary right central
incisor has shown the highest coefficient of determination value among all 3 types
of investigated teeth. Furthermore, the results have showed that this method of
dental age estimation is indeed gender independent.
Univers
ity of
Mala
ya
v
ABSTRAK
Pengenalan
Pembentukan dentin sekunder merupakan salah satu perubahan fisiologi penting
yang berkaitan dengan usia. Ini berlaku dalam pergigian kekal sepanjang hayat
seseorang. Faktor ini boleh digunakan untuk anggaran usia pergigian dan mengenal
pasti si mendiang yang tidak dikenali.
Matlamat
Matalamt utama adalah untuk menyiasat kekuatan hubungan antara umur kronologi
dan nisbah volumetrik pulpa / gigi di kalangan penduduk Malaysia. Tambah lagi,
tujuan ini adalah untuk mencari yang mana antara 3 jenis gigi monoradikular yang
diselidik mempunyai kekuatan korelasi tertinggi.
Bahan dan Kaedah
Tiga ratus data CBCT, iaitu sebanyak 153 laki-laki dan 147 perempuan (keturunan
Cina atau Melayu), yang disimpan di Bahagian Imaging Mulut dan Maksiolofasial,
Fakulti Pergigian Universiti Malaya telah dipilih untuk kajian ini. Faktor-faktor
utama untuk pemilihan adalaah kualiti imej, kaedah-kaedah memperolehi imej yang
sama dan umur pesakit pada masa pendaftaran. Subjek-subjek dibahagikan kepada
5 kumpulan (selang 10 tahun setiap kumpulan). Mereka adalah diantara 16 hingga
65 tahun dan jaminan telah dibuat untuk memastikan pengedaran sampel yang
seimbang di dalam 5 kumpulan tersebut. Selepas itu, 100 kanin kiri maksila, 100
kanin kanan maksila dan 100 insisor sentral maksila yang tidak mempunyai apa-apa
patologi dan akarnya telah membentuk dengan sempurna dipilih dari pangkalan data
300 CBCT tersebut. Dengan ini, satu gigi bagi setiap imbasan CBCT dipilih. Gigi
Univers
ity of
Mala
ya
vi
kiri dan kanan maksila telah dipilih untuk kajian ini untuk menyiasat jika terdapat
perbezaan yang signifikan dalam kekuatan korelasi di antara dua jenis gigi yang
sama, tetapi tergolong dalam subjek yang berbeza. Data CBCT diperolehi
menggunakan Sistem Pengimejan Pergigian 3D i-CAT Cone Beam (Imaging
Sciences International, Hatfield, Amerika Syarikat). Data imbasan dipilih
mempunyai parameter pendedahan 120 KV, 18 mA dan menggunakan saiz voxel
0.30 mm dan masa pengimbasan sebanyak 20 saat. Analisis volumetrik dilakukan
dengan perisian MIMICS (Materialize NV, Belgium, versi 16.0). Data dianalisis
menggunakan SPSS versi 20.
Keputusan
Analisis korelasi dan regresi Pearson menunjukkan hubungan songsang yang
signifikan di antara nisbah volumetrik pulpa dan gigi dengan umur kronologi untuk
semua jenis gigi yang disiasat (p <0.01). Keputusan ini menunjukkan nilai koefisien
penentuan tertinggi (R2) untuk incisor sentral maksila (R2 = 0.696) diikuti oleh
kanin kanan maksila (R2 = 0.545) dan kanin kiri maksila (R2 = 0.527). Kekuatan
korelasi untuk lelaki dan wanita didapati sangat baik. Hasil ujian Fisher Z tidak
menunjukkan perbezaan yang signifikan dalam nilai koefisien korelasi di antara
jantina untuk semua 3 jenis gigi yang dikaji (Z kritikal 1.96 untuk p <.05). Ujian
Fisher Z tidak menunjukkan perbezaan yang signifikan dalam nilai koefisien
korelasi di antara kanin kanan dan kanin kiri maksila (P = 0.88), walaupun gigi ini
dipilih dari individu yang berbeza.
Kesimpulannya
Kajian ini memperkukuhkan bahawa nisbah volumetrik pulpa / gigi dengan umur
adalah petunjuk penting untuk anggaran usia pergigian bagi penduduk Malaysia.
Gigi insisor sentral maksila menunjukkan nilai koefisien penentuan tertinggi di
Univers
ity of
Mala
ya

vii
antara semua 3 jenis gigi yang diselidik. Tambah pula, hasil kajian menunjukkan
bahawa kaedah penilaian pergigian ini bebas daripada pengaruh jantina.
Univers
ity of
Mala
ya

viii
Dedicated to:
My father, Asif Ullah khan
My mother, Dilras Zafar
My beloved wife, Iqra
Univers
ity of
Mala
ya
ix
ACKNOWLEDGEMENT
In the name of Allah, most gracious, most merciful
First of all, I would like to thank the Almighty Allah for granting me the strength
and knowledge to complete this research. I pray that the blessings of Allah upon me
to continue throughout my life so that I can accomplish my future research projects
for the wellbeing of humanity.
This dissertation would not have been completed without the support and guidance
of several individuals, who always welcomed me for their expert opinions and
valuable assistance in the completion of this research study.
My utmost gratitude to the Professor Dr. Phrabhakaran Nambiar, my supervisor
whose encouragement, unfailing support, and sincerity I will never forget. The door
to Professor Phrabhakaran office was always open whenever I ran into a trouble spot
during my research or writing. It was due to his immense knowledge, enthusiasm,
motivation and patience I was able to complete this research.
Dr. Shani Ann Mani, my second supervisor, whose knowledge, perfection and
dedication has always steered me in the right direction during this research study.
Associate Prof. Dr. Norliza Binti Ibrahim for her kind concern and expert opinions
especially in the imaging software analysis.
Dr. Siti Mazlipah Binti Ismail, Head of Department of Oro-maxillofacial Surgical
and Medical Sciences for accepting as a student and the moral support and
considerations provided regarding my academic requirements.
Associate Prof. Dr. Palasuntharam Shanmuhasuntharam for sharing valuable
insights, knowledge and experience for the success of the study.
Univers
ity of
Mala
ya

x
Dr. Jacob John A/I Chiremel Chandy for his initial guidance and support to ensure
i can be enrolled as a student.
Dr. Abbas Chamkani for his never-ending support and sharing valuable inputs in
this research.
I also would like to thank the clinical staff at the Oral and Maxillofacial Imaging
Division, Faculty of Dentistry, University of Malaya for the efforts and support
during the research (this can be under acknowledgment)
I am very thankful to all those who supported me in any respect during my research
project.
Most of all I would like to thank;
My father, Mr Asif Ullah Khan for his lifetime efforts in making me what I am
today.
My mother, Dilras Zafar for her love and care.
My lovely wife, Iqra for being a moral support and for her never-ending cooperation.
My sister Mariam, my nephew Musa and my friends Dr. Ali Rizwan, Dr. Sadeeq
Khan, Waqas Mahmood, Naveed khan for their immense support during the period
of my study.
Univers
ity of
Mala
ya
xi
TABLE OF CONTENTS
ORIGINAL LITERARY WORK DECLARATION .......................................... ii
ABSTRACT ........................................................................................................... iii
ABSTRAK ............................................................................................................... v
ACKNOWLEDGEMENT .................................................................................... ix
TABLE OF CONTENTS ...................................................................................... xi
LIST OF FIGURES .......................................................................................... xviii
LIST OF TABLES ................................................................................................ xx
LIST OF SYMBOLS AND ABBREVIATIONS ............................................. xxii
LIST OF APPENDICES .................................................................................. xxiii
CHAPTER 1: INTRODUCTION .......................................................................... 1
1.1 Statement of problem ..................................................................................... 3
1.2 Rationale and Aim .......................................................................................... 3
1.3 Objectives of the study ................................................................................... 4
1.4 Research questions ......................................................................................... 4
1.5 Significance .................................................................................................... 5
CHAPTER 2: LITERATURE REVIEW .............................................................. 6
2.1 Dental age estimation methods in children .................................................... 6
2.1.1 Specific pattern of development of teeth ................................................. 6
Univers
ity of
Mala
ya
xii
2.1.1.1 Tooth eruption chart comparisons ..................................................... 6
2.1.1.2 Atlas style and scoring systems for dental age estimation. ............... 6
2.1.1.3 Application of atlas style and scoring methods on Malaysian
population ...................................................................................................... 8
2.2 Juvenile verses adult dental age estimation .................................................... 9
2.2.1 Radiographic evaluation of third molar for dental age estimation .......... 9
2.2.2 Relationship between chronological age and third molar development in
Malaysian population ........................................................................................ 9
2.3 Pre-natal, neonatal and post-natal age estimation ........................................ 10
2.4 Physiological age-related changes after completion of teeth development.. 10
2.4.1 Criticism on Gustafson method of age estimation ................................. 11
2.4.2 Modified Seven-staging system by Johanson ........................................ 11
2.4.3 Testing the relationship between chronological age and physiological age-
related variables. ............................................................................................. 12
2.4.4 Study on age-related structural changes on Malaysian population........ 13
2.4.5 Secondary dentine as a vital parameter to estimate dental age .............. 13
2.4.5.1 Two-dimensional radiographic methods for measuring secondary
dentine deposition ....................................................................................... 14
2.4.5.1.1 Relationship between chronological age and secondary dentine
deposition on periapical X-rays ............................................................... 14
Univers
ity of
Mala
ya
xiii
2.4.5.1.2 Relationship between chronological age and secondary dentine
deposition on panoramic radiographs ...................................................... 14
2.4.5.1.3 Relationship between chronological age and secondary dentine
deposition by measuring ground sections of teeth. ................................. 15
2.4.5.2 Use of Three dimensional radiographic modalities in observing
reduction of pulp cavity volume ................................................................. 15
2.4.5.2.1 Pulp/tooth volumetric studies reported on Belgian population
using 3D scans. ........................................................................................ 16
2.4.5.2.2 Pulp/tooth volumetric studies reported on Japanese population
using 3D scans. ........................................................................................ 17
2.4.5.2.2.1 Images acquired through Micro-CT for Volumetric analysis
............................................................................................................. 17
2.4.5.2.2.2 Images acquired through Multidetector Computed
Tomography for Volumetric analysis .................................................. 19
2.4.5.2.3 Pulp/tooth volumetric studies reported on French population
using 3D scans. ........................................................................................ 19
2.4.5.2.4 Pulp/tooth volumetric studies reported on Italian population using
3D scans. ................................................................................................. 19
2.4.5.2.5 Pulp/tooth volumetric studies reported on Chinese population
using 3D scans. ........................................................................................ 20
2.4.5.2.6 Pulp/tooth volumetric studies reported on Indian population using
3D scans. ................................................................................................. 20
Univers
ity of
Mala
ya
xiv
2.5 Importance of dental age estimation and identification in the legal justice
system ................................................................................................................. 21
2.6 Teeth can withstand extreme conditions ...................................................... 22
2.7 Role of forensic odontologist in mass disasters ........................................... 23
2.8 Comparison of ante mortem and post mortem records ................................ 24
CHAPTER 3: RESEARCH METHODOLOGY ............................................... 25
3.1 Introduction .................................................................................................. 25
3.2 The materials of the study ............................................................................ 25
3.2.1 Cone-Beam Computed Tomography (CBCT) ....................................... 25
3.2.2 MIMICS Software ................................................................................. 26
3.3 The subjects of the study .............................................................................. 26
3.3.1 Sample size calculation. ......................................................................... 26
3.3.2 Sampling method ................................................................................... 28
3.3.3 Selection criteria of the sample .............................................................. 30
3.3.3.1 Inclusion criteria: ............................................................................ 30
3.3.3.2 Exclusion criteria ...................................................................... 30
3.4 Methodology ................................................................................................ 31
3.4.1 Methods ................................................................................................. 31
3.4.2 Reliability of the measurements ............................................................ 38
Univers
ity of
Mala
ya
xv
3.4.2.1 Intraexaminer reliability .................................................................. 38
3.4.2.2 Interexaminer reliability .................................................................. 38
3.5 Data analysis ................................................................................................. 39
CHAPTER 4: RESULTS AND DATA ANALYSIS .......................................... 40
4.1 Introduction. ................................................................................................. 40
4.1.1 Intraexaminer and interexaminer reliability. ......................................... 41
4.1.2 Relationship between pulp/tooth volume ratio and chronological age for
the maxillary left canines. ............................................................................... 41
4.1.3 Relationship between pulp/tooth volume ratio and chronological age for
the maxillary right canines. ............................................................................. 43
4.1.4 Relationship between pulp/tooth volume ratio and chronological age for
the maxillary right central incisors. ................................................................ 45
4.1.5 Relationship between pulp/tooth volume ratio and chronological age for
maxillary left canines based on genders. ........................................................ 47
4.1.6 Relationship between pulp/tooth volume ratio and chronological age for
maxillary right canines based on genders. ...................................................... 49
4.1.7 Relationship between pulp/tooth volume ratio and chronological age for
maxillary right central incisors based on genders. .......................................... 50
4.1.8 Comparison in the mean values of pulp/tooth volume ratios between
genders for the whole research sample. .......................................................... 52
Univers
ity of
Mala
ya
xvi
4.1.9 Fisher Z-test to test the significant difference in the coefficient of
correlation values. ........................................................................................... 52
4.1.9.1 Comparison of the coefficient of correlation values between genders.
..................................................................................................................... 54
4.1.9.2 Comparison of the coefficient of correlation values between maxillary
left and maxillary right canines. .................................................................. 54
CHAPTER 5: DISCUSSION ............................................................................... 56
5.1 Rational for choice of the study topic........................................................... 56
5.2 Specimen selection ....................................................................................... 58
5.3 CBCT data and MIMICS software ............................................................... 58
5.4 CBCT scans acquired with voxel size of 0.30mm. ...................................... 59
5.5 Selection of one tooth per subject. ............................................................... 60
5.6 Pulp cavity volume alone verses pulp/tooth volume ratio............................ 60
5.7 Highest strength of correlation between chronological age and pulp/tooth
volume ratio among all the 3 types of investigated teeth. .................................. 60
5.8 Comparison with previously reported studies. ............................................. 61
5.8.1 Comparison with studies reported on the Belgian population. .............. 61
5.8.2 Comparison with studies reported on the Japanese population. ............ 64
5.8.3 Comparison with studies reported on the French populations. .............. 67
5.8.4 Comparison with studies reported on the Italian population. ................ 68
Univers
ity of
Mala
ya
xvii
5.8.5 Comparison with studies reported on the Chinese population. ............. 70
5.8.6 Comparison with study reported on the Indian population.................... 72
5.9 Comparison between right and left maxillary canines ................................. 73
5.10 Limitations of the study .............................................................................. 74
CHAPTER 6: CONCLUSION ............................................................................. 75
6.1 Introduction .................................................................................................. 75
6.2 Research outcomes ....................................................................................... 75
6.3 Clinical applications ..................................................................................... 76
6.4 Recommendations for further research ........................................................ 77
REFERENCES ...................................................................................................... 79
APPENDICES ....................................................................................................... 88
Univers
ity of
Mala
ya
xviii
LIST OF FIGURES
Figure Description Page
Figure 3.1: Process for sample size distribution ..................................................... 29
Figure 3.2: Flow chart of the methodology ............................................................. 33
Figure 3.3: Pulp “tissue thresholding or new mask creation phase” in sagittal, axial
and coronal view of maxillary right canine (13). .................................................... 34
Figure 3.4: “Multiple slice editing phase” for separation and segmentation of pulp
cavity in the maxillary right canine on axial view (13). ......................................... 35
Figure 3.5: Tooth ‘Region growing phase’ of maxillary right central incisor on
sagittal view. ........................................................................................................... 36
Figure 3.6: Tooth ‘Region growing phase’ on sagittal, axial and coronal view of the
maxillary central incisor (11). ................................................................................. 37
Figure 3.7 a: 3D view of the maxillary right canine pulp cavity; b: 3D view of
maxillary central incisor pulp cavity; c: 3D view of maxillary central incisor. ...... 38
Figure 4.1 The relationship between chronological age and pulp/tooth volume ratio
for the maxillary left canines................................................................................... 43
Figure 4.2 The relationship between chronological age and pulp/tooth volume ratio
for the maxillary right canines. ............................................................................... 45
Figure 4.3 The relationship between chronological age and pulp/tooth volume ratio
for the maxillary right incisors. ............................................................................... 47
Univers
ity of
Mala
ya

xix
Figure 4.4 The relationship between age and pulp/tooth volume ratio for the
maxillary left canine based on gender. .................................................................... 48
Figure 4.5 The relationship between age and pulp/tooth volume ratio for the
maxillary right canine based on genders. ................................................................ 50
Figure 4.6 The relationship between age and pulp/tooth volume ratio for the
maxillary right central incisor based on genders..................................................... 51
Univers
ity of
Mala
ya
xx
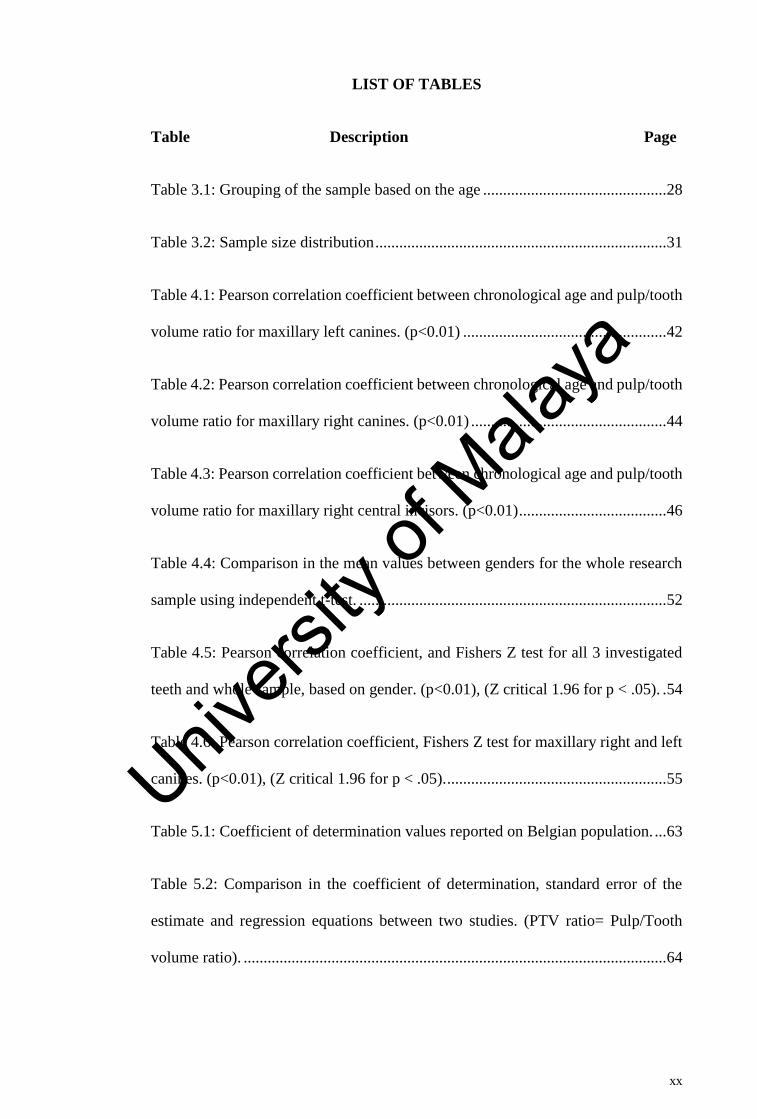
LIST OF TABLES
Table Description Page
Table 3.1: Grouping of the sample based on the age .............................................. 28
Table 3.2: Sample size distribution ......................................................................... 31
Table 4.1: Pearson correlation coefficient between chronological age and pulp/tooth
volume ratio for maxillary left canines. (p<0.01) ................................................... 42
Table 4.2: Pearson correlation coefficient between chronological age and pulp/tooth
volume ratio for maxillary right canines. (p<0.01) ................................................. 44
Table 4.3: Pearson correlation coefficient between chronological age and pulp/tooth
volume ratio for maxillary right central incisors. (p<0.01) ..................................... 46
Table 4.4: Comparison in the mean values between genders for the whole research
sample using independent t-test. ............................................................................. 52
Table 4.5: Pearson correlation coefficient, and Fishers Z test for all 3 investigated
teeth and whole sample, based on gender. (p<0.01), (Z critical 1.96 for p < .05). . 54
Table 4.6: Pearson correlation coefficient, Fishers Z test for maxillary right and left
canines. (p<0.01), (Z critical 1.96 for p < .05). ....................................................... 55
Table 5.1: Coefficient of determination values reported on Belgian population. ... 63
Table 5.2: Comparison in the coefficient of determination, standard error of the
estimate and regression equations between two studies. (PTV ratio= Pulp/Tooth
volume ratio). .......................................................................................................... 64
Univers
ity of
Mala
ya
xxi
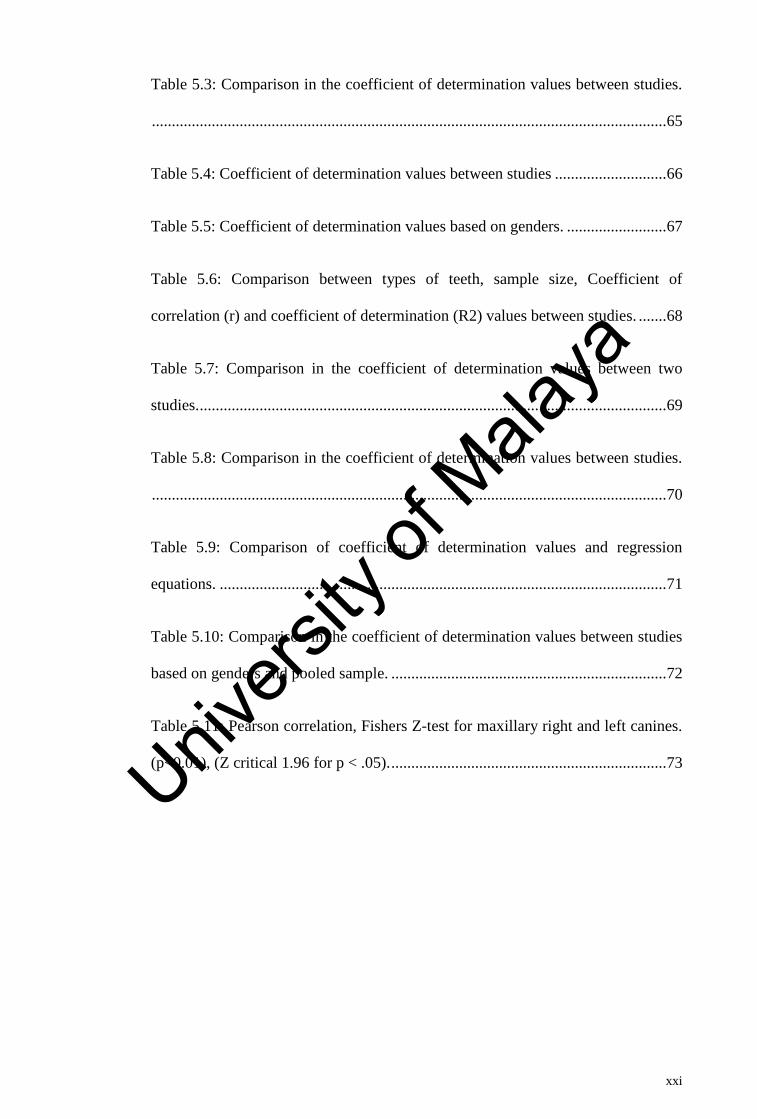
Table 5.3: Comparison in the coefficient of determination values between studies.
................................................................................................................................. 65
Table 5.4: Coefficient of determination values between studies ............................ 66
Table 5.5: Coefficient of determination values based on genders. ......................... 67
Table 5.6: Comparison between types of teeth, sample size, Coefficient of
correlation (r) and coefficient of determination (R2) values between studies. ....... 68
Table 5.7: Comparison in the coefficient of determination values between two
studies. ..................................................................................................................... 69
Table 5.8: Comparison in the coefficient of determination values between studies.
................................................................................................................................. 70
Table 5.9: Comparison of coefficient of determination values and regression
equations. ................................................................................................................ 71
Table 5.10: Comparison in the coefficient of determination values between studies
based on genders and pooled sample. ..................................................................... 72
Table 5.11: Pearson correlation, Fishers Z-test for maxillary right and left canines.
(p<0.01), (Z critical 1.96 for p < .05). ..................................................................... 73
Univers
ity of
Mala
ya
xxii
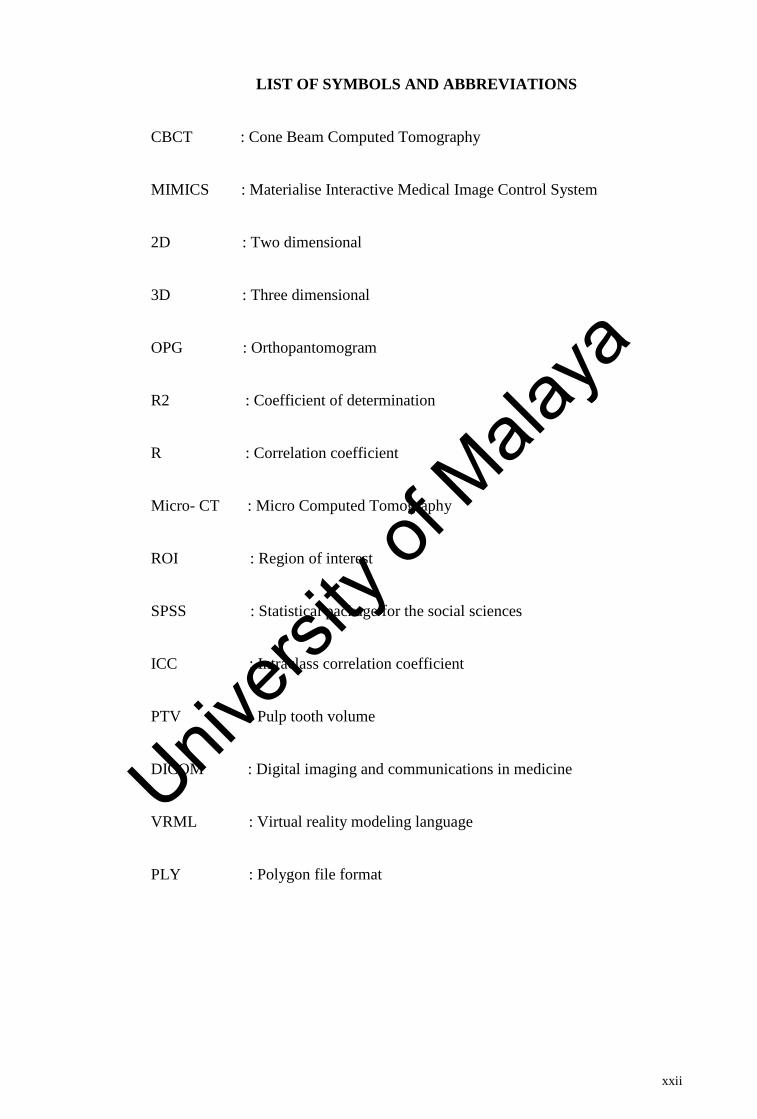
LIST OF SYMBOLS AND ABBREVIATIONS
CBCT : Cone Beam Computed Tomography
MIMICS : Materialise Interactive Medical Image Control System
2D : Two dimensional
3D : Three dimensional
OPG : Orthopantomogram
R2 : Coefficient of determination
R : Correlation coefficient
Micro- CT : Micro Computed Tomography
ROI : Region of interest
SPSS : Statistical package for the social sciences
ICC : Intraclass correlation coefficient
PTV : Pulp tooth volume
DICOM : Digital imaging and communications in medicine
VRML : Virtual reality modeling language
PLY : Polygon file format
Univers
ity of
Mala
ya
xxiii
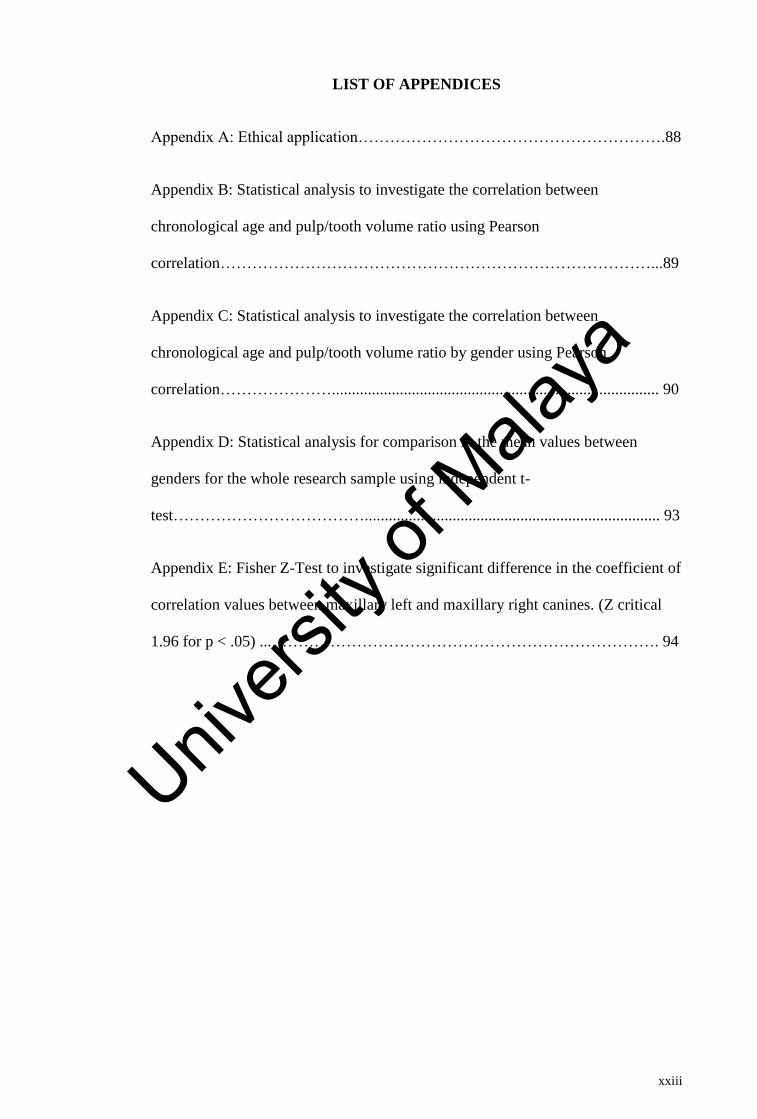
LIST OF APPENDICES
Appendix A: Ethical application………………………………………………….88
Appendix B: Statistical analysis to investigate the correlation between
chronological age and pulp/tooth volume ratio using Pearson
correlation………………………………………………………………………...89
Appendix C: Statistical analysis to investigate the correlation between
chronological age and pulp/tooth volume ratio by gender using Pearson
correlation………………….................................................................................. 90
Appendix D: Statistical analysis for comparison in the mean values between
genders for the whole research sample using independent t-
test……………………………….......................................................................... 93
Appendix E: Fisher Z-Test to investigate significant difference in the coefficient of
correlation values between maxillary left and maxillary right canines. (Z critical
1.96 for p < .05) ...………………………………………………………………. 94
Univers
ity of
Mala
ya
1
CHAPTER 1: INTRODUCTION
The importance of age estimation in clinical practice, forensic medicine and
anthropology cannot be underestimated. Studies around the world have been
conducted to find an accurate and simple method of dental age estimation (Bang &
Ramm, 1970; Kvaal et al., 1995; Gustafson, 1950; Someda et al., 2009). The refugee
crisis is rapidly increasing throughout the world due to global conflicts and
terrorism. Dental age estimation is one of the most reliable method amongst other
parameters for age estimation and identification of unknown deceased persons. The
tooth is a highly-calcified tissue which can withstand mechanical, chemical and
thermal forces in harsh conditions (Chun et al., 2014; Shekhawat & Chauhan, 2016;
Merlati et al., 2004). This aspect is very crucial during natural or manmade disasters,
where most of the bodies are mutilated or incinerated. Dental age estimation of
unknown deceased bodies is a very significant step in the reconstruction of
biological profiles of these dead persons.
The developmental pattern of human dentition is specific, and we can estimate the
age of a growing individual by observing this pattern (Schour & Massler, 1940;
Moorrees et al., 1963). But once the development of teeth is completed,
physiological age-related changes in the adult human dentition e.g. secondary dentin
deposition, root translucency, cementum apposition, root resorption can be used for
age estimation (Paewinsky et al., 2005; Gustafson, 1950; Dalitz, 1963). Secondary
dentine formation is one the reliable methods to estimate age as it forms throughout
life once root formation is completed. Many two-dimensional radiographic
techniques have been used to measure secondary dentine formation (Arora et al.,
2016; Paewinsky et al., 2005). However, it is not appropriate to measure three-
dimensional object with two-dimensional radiographs.
Univers
ity of
Mala
ya
2
The introduction of CBCT and image enhancing softwares in the past decade has
dramatically improved the techniques to measure various aspects of three-
dimensional objects. These innovative image enhancing softwares are being
introduced regularly, which can successfully measure three dimensional changes in
the tooth. CBCT technology has improved with more effective greyscale
thresholding and segmentation values. The use of CBCT for measuring secondary
dentine formation to estimate age has been reported on different populations around
the world (Vandevoort et al., 2004; Yang et al., 2006; Someda et al., 2009; Ge et al.,
2015). Most of the studies have reported different regression equations and strength
of correlation between chronological age and pulp/tooth volume ratio for their
respective populations. Some studies have reported highest strength of correlation
between chronological age and pulp/tooth ratio for permanent central incisors
amongst the single-rooted teeth (Vandevoort et al., 2004; Someda et al., 2009;
Agematsu et al., 2010; Star et al., 2011). In addition, volumetric study on multi-
rooted teeth have also been reported (Ge et al., 2016). Maxillary second molar
showed the higher strength of correlation among single and multi-rooted teeth, when
only pulp chamber volumes were taken into consideration.
So far, different non-invasive methods to estimate the dental age among Malaysian
adults have been reported (Marroquin Penaloza et al., 2016). However, no study has
been reported on volumetric measurements of pulp/tooth volume ratio using CBCT
images. They applied Kvaal’s method of dental age estimation on the volumetric
data acquired through CBCT scans. However, this methodology was time
consuming as compared to the original approach of Kvaal’s et al., (1995) method
and the values obtained for standard error of estimates were beyond the acceptable
range. Therefore, there is a need to find a simple and reliable method of dental age
estimation. More research needs to be carried out to investigate the relationship
Univers
ity of
Mala
ya
3
between chronological age and pulp/tooth volume ratio among different populations
with different types of teeth.
1.1 Statement of problem
Physiological age-related changes occur in the dental tissues throughout life. Once
the development of the teeth and jaws is completed then we can estimate the dental
age by observing these physiological age-related changes. Secondary dentine
deposition is one of the physiological age-related parameter for dental age
estimation. With increase in age, the volume of the pulp cavity decreases due to the
deposition of secondary dentine. This change in the secondary dentine formation
can be measured by observing the volumetric changes in the pulp cavity from CBCT
images with image enhancing software like MIMICS. There is no evidence in the
literature that volumetric study has been carried out on the Malaysian population for
dental age estimation with the help of any 3-D imaging modality.
1.2 Rationale and Aim
Volumetric analysis using CBCT scans with the help of MIMICS software is
currently one of the most accurate way to determine the pulp/tooth volume ratio.
Since single rooted teeth proved more accurate in dental age estimation, it is
worthwhile to study the pattern of physiological age changes employing pulp/tooth
volume ratio of maxillary canines and central incisors for age assessment purposes.
The aim of the study is to develop a regression equation for dental age estimation in
a Malaysian population using pulp/tooth volume ratio in maxillary canines and
Univers
ity of
Mala
ya
4
maxillary right central incisors from CBCT scans with the help of MIMICS
software.
1.3 Objectives of the study
The study will focus on the following specific objectives:
1. To investigate the linear association between chronological age and
pulp/tooth volume ratio of the three investigated teeth viz; maxillary right
canine, maxillary left canine and maxillary right central incisor.
2. To compare the strength of correlation between genders with respect to
maxillary left canine, maxillary right canine and maxillary right central
incisor.
3. To investigate which amongst the 3 types of investigated teeth has the
highest strength of correlation between chronological age and pulp/tooth
volume ratio.
4. To compare the strength of correlation values between maxillary right and
maxillary left canines, each belonging to different subjects.
1.4 Research questions
1. Is there any association between volume of the pulp-tooth ratio with
chronological age?
2. Is there any difference in the pattern of volumetric changes between
genders?
Univers
ity of
Mala
ya
5
3. Which among the 3 types of investigated teeth is showing highest strength
of correlation between chronological age and pulp/tooth volume ratio?
4. Is there any significant difference in the pattern of volumetric changes with
age between maxillary left and right canines?
1.5 Significance
This is the first local study on dental age estimation by volumetric analysis of pulp-
tooth ratio on Malaysian population (Malays and Chinese). The present study
focused on an easy, accurate and more likely inexpensive method of dental age
estimation. This approach will aid in the identification of unknown deceased persons
involved in mass disasters which can be natural or manmade, especially in the third
world countries, where DNA profiling is not possible on such a large scale. This
approach will be useful in identification and age estimation of unknown persons for
the implementation of law in legal justice system. The results will give the
regression equation particularly for the Malaysian population for dental age
estimation, which will help in the age estimation and identification of unknown
deceased persons in future. The findings will also indicate whether there is any
gender variation for dental age estimation by this method among the Malaysian
population. This method of dental age estimation is less-invasive.
Univers
ity of
Mala
ya
6
CHAPTER 2: LITERATURE REVIEW
2.1 Dental age estimation methods in children
2.1.1 Specific pattern of development of teeth
The development or mineralisation of teeth is one of the most reliable indicators of
chronological age, as the maturation of teeth is least influenced by environmental
and nutritional deficiencies. The growth pattern of teeth and jaws is specific. By
observing this specific pattern, dental age can be estimated at that particular phase
of development. Different studies around the world have been carried out to estimate
the age at the growing stages of teeth and jaws.
2.1.1.1 Tooth eruption chart comparisons
Observing total number and type of erupted teeth in the oral cavity is the simplest
method of dental age assessment. From as early as 6 months to 20 years of age, the
sequence of tooth eruption and maturation follows the specific chronological order
and can be trusted to estimate dental age.
2.1.1.2 Atlas style and scoring systems for dental age estimation.
The mineralisation of deciduous dentition starts at 16th week of intrauterine life and
around 30th week, mineralised cusp tips of A, B, C, D and E can be observed on
radiographs. Just before birth the mesial cusp tip of the mandibular first permanent
molar can be observed on radiographs. It is the only permanent tooth whose calcified
mesial cusp tip can be visualised on radiograph just before birth. Radiographic
dental age assessment methods or models have been developed in the past two
centuries by observing pattern of teeth development and eruption (Schour &
Univers
ity of
Mala
ya
7
Massler, 1940; Ubelaker & Grant, 1989; Moorrees et al., 1963; Demirjian et al.,
1973)
According to Schour and Massler’s (1940) model, dental age can be estimated from
the 5th months of intrauterine life to 35 years of age with the help of diagrammatic
representation of teeth development atlas. The developmental pattern on dental
panoramic radiographs (OPG) were compared with these diagrammatic
developmental phases in order to estimate age. This model has been applied on many
different populations for dental age estimation (Cesário C, 2016; Eshitha et al.,
2014). Schour and Massler’s (1940) method is simple and non-invasive, although
the diagrammatic atlas does not give gender specific representation for comparison.
However, this shortcoming was addressed in another study (Kahl & Schwarze,
1988) where they introduced gender specific diagrammatic representation.
Other methods involved scoring stages of tooth development and maturity scores at
particular stage of teeth eruption (Moorrees et al., 1963; Demirjian et al., 1973).
Demirjian standards used seven mandibular teeth for maturity scoring and his model
consisted of eight stages of tooth development ranging from A to H. Moorrees et al.
(1963) method was designed for maxillary incisors and eight mandibular teeth using
written and pictorial methods for dental age estimation. Moorrees et al. (1963)
developed maturity scores into fourteen stages. Both of these methods gave gender
specific details of age estimation. Studies have been reported on different
populations using Demirjian et al. (1973) method of dental age estimation such as,
Australian (Blenkin & Evans, 2010), Turkish (Tunc & Koyuturk, 2008), Indian
(Koshy & Tandon, 1998), South African (Phillips & van Wyk Kotze, 2009) and
Belgian population (Chaillet et al., 2004). All of the above-mentioned studies
revealed some degree of overestimation in chronological ages. It must be noted here
that each population gave different results which showed that populations belonging
Univers
ity of
Mala
ya
8
to different race must have their own regression equations or models for dental age
estimation. More validation studies were reported for Demirjian et al. (1973) method
as compared to Moorrees et al. (1963) method of dental age estimation. However,
as Demirjian et al. method is based on giving maturity scores to all seven mandibular
teeth, any missing tooth will not allow this method to be used. In contrast to
Demirjian et al. (1973) method, Moorrees et al. (1963) technique followed tooth
specific scoring system which was more practical when compared to Demirjians et
al., (1973). However, this method was based on graphical comparison rather than
using proper normative data to be statistically analysed. Researchers introduced
modified graphs of Moorrees, designed to be analysed statistically with mean ages
of tooth eruption along with standard deviations (Harris & Buck, 2002). Alqahtani
et al. introduced detailed atlas on the basis of teeth developmental pattern from
twenty-eight weeks of intrauterine life to twenty-three years of age (Alqahtani et al.,
2010). Their model was based on the modified Moorrees et al. (1963) method of
assessing teeth development. However, this atlas does not provide statistically
quantified data which is a huge disadvantage for dental age estimation in forensic
sciences.
Modified Demirjian’s model was introduced by Willems et al. (2001) and they
introduced adapted scoring system. The scoring system was more accurate than the
original model as the new model addressed the persistent overestimation in the
chronological age (Willems et al., 2001).
2.1.1.3 Application of atlas style and scoring methods on Malaysian population
Demirjian’s method is widely used for dental age estimation among children across
the world. Moreover, this method has been reported on Malaysian population as well
Univers
ity of
Mala
ya
9
(Abu Asab et al., 2011; Mani et al., 2008). Both studies have resulted in
overestimation of dental age among Malaysian children.
2.2 Juvenile verses adult dental age estimation
The time of eruption of third molar is vital in accessing the age at adulthood. A lot
of research has been carried out to find the relationship of third molar development
with chronological age.
2.2.1 Radiographic evaluation of third molar for dental age estimation
Third molar development is vital in establishing the age of adulthood. Studies have
been carried out to find a relationship between third molar development and
chronological age (Orhan et al., 2007; Bolanos et al., 2003). Radiographic
assessment of periodontal membrane in third molars were studied by Olze et
al.(Olze et al., 2010). This study developed gender specific 4 stages and concluded
that age of 18 years can be estimated with reasonably accuracy using these staging
systems.
2.2.2 Relationship between chronological age and third molar development in
Malaysian population
Relationship between chronological age and third molar development was reported
among Malaysian population (Nambiar, 1995; Johan et al., 2012). Third molar
development can be used for dental age estimation in Malaysian population. Males
showed more advanced development and the pattern of root mineralisation was
faster in males than females by 6 months (Johan et al., 2012). The development of
teeth was scored according to the Demirjian’s method from A to H (A-D for crown
development and E-H for root development).
Univers
ity of
Mala
ya
10
2.3 Pre-natal, neonatal and post-natal age estimation
The radiographic evidence of mineralisation of deciduous teeth starts at 16th week
of intrauterine life. However, tooth germs can be seen as radiolucent areas even
before mineralisation starts. Kraus & Jordan (1965) introduced 10 stages of early
mineralisation in deciduous dentition and permanent first molar (Kraus & Jordan,
1965). Mesial cusp of permanent mandibular first molar is the only mineralised
segment among all permanent teeth which can be seen on radiograph just before
birth.
2.4 Physiological age-related changes after completion of teeth development
The pattern of development of teeth is specific and the development of teeth is
completed up to 18-21 years. When the growth of the permanent teeth is completed
then the age estimation is performed through observing different physiological age-
related changes e.g. attrition, apical migration of periodontal ligament, deposition
of secondary dentin, cementum apposition, root resorption and transparency of the
root dentin. Point system was introduced for different physiological age-related
structural changes to predict age (Gustafson, 1950). He reported six structural
changes that take place as life progresses, which are as following:
1. Secondary dentine formation
2. Attrition.
3. Apical migration of periodontal ligaments.
4. Cementum apposition.
5. Root resorption.
Univers
ity of
Mala
ya
11
6. Root transparency.
The point system introduced by Gustafson ranged from 0-3 scores depending on the
physiological change with ageing. Gustafson added all the scores that he measured
from each of the six physiological factors and a regression line was derived. These
changes reported by Gustafson were very important findings but measuring these
changes with reasonably accuracy was a big challenge for researchers at that time.
The relationship between age and physiological changes reported by Gustafson were
further tested by many researchers (Johanson, 1971; Dalitz, 1963; Bang & Ramm,
1970).
2.4.1 Criticism on Gustafson method of age estimation
Cementum formation, root resorption and apical migration of periodontal ligaments
were difficult to score due to lack of any definite pattern at each stage in Gustafson
point system. Maples (1978) reported that root resorption is the least reliable out of
all the six-physiological age-related changes reported by Gustafson (1950) (Maples,
1978). He suggested that secondary dentine formation and transparent dentine
together can gave more accurate results as compared to using all the six variables
for dental age estimation. Another objection which was raised in Gustafson four-
point system was the value of standard error (4.5 years) which was found to be lower
than the actual values (Maples & Rice, 1979).
2.4.2 Modified Seven-staging system by Johanson
Johanson (1971) modified Gustafson’s method to estimate age by multiple
regression analysis and proposed a more accurate formula for age estimation. He
gave a more comprehensive staging system by assigning each variable seven stages
Univers
ity of
Mala
ya
12
based on severity or extent of physiological change. Standard error reported by
Johanson was 5.16 years.
2.4.3 Testing the relationship between chronological age and physiological age-
related variables.
Gustafson method of age estimation by adding scores of all the six variables was
further investigated by examining 146 anterior teeth of individuals ranging in age
from 14 to 76 years (Dalitz, 1963). The new 5-point system suggested by Dalitz had
greater accuracy than Gustafson model. Premolars and molars were not investigated
in the 5-point system. Root resorption and secondary cementum related least with
age in the study. Bang and Ramm (1970) conducted a microscopic study to
investigate the changes in root dentine translucency with age. Root dentin
translucency begins in the apical part of the root and increases in the coronal
direction. However, the tooth needed to be sacrificed for preparation of the ground
sections. Additionally, the standard errors reported in their study ranged from 7-13
years.
In another age assessment study, the researchers examined the association between
tooth wear with aging (Kim et al., 2000). The strength of correlation between
occlusal wear with age was significant. Age was estimated using this method with
reasonably accuracy. The strength of correlation was relatively strong between tooth
wear scores of all examined teeth (coefficient of determination, R2 = 0.4199 -
0.7465). Interestingly, the strength of correlation for molars was higher than
bicuspids.
The relationship between cemental annulations and chronological age was
investigated (Mallar et al., 2015). The study was designed to observe the annulations
at the cross-sectional and longitudinal sections of the teeth at the middle of root
Univers
ity of
Mala
ya
13
portion. Cross sections were more feasible to count. However, the study reported
underestimation in younger age group and overestimation in older age group. The
study suggested that cemental annulations can be used for dental age estimation but
it was more advisable to use it along with other age estimation modalities.
2.4.4 Study on age-related structural changes on Malaysian population
The concept of age-related structural changes for dental age estimation has been
tested on different populations. Similarly, studies have been conducted on
Malaysian population (Koh et al., 2017). The study investigated the relationship
between chronological age with buccal alveolar bone level. The strength of
correlation was found to be very good. This age related physiological change can be
used for predicting dental age among Malaysian population.
2.4.5 Secondary dentine as a vital parameter to estimate dental age
Once the development of the teeth is completed, age can be estimated only based on
the different physiological age-related changes in teeth. Among different
parameters, secondary dentine formation is a significant physiological factor to
estimate age. Different studies have been carried out to see the correlation between
chronological age and secondary dentine formation. Secondary dentine formation
starts after the completion of root development and it continues throughout life. Due
to the formation of secondary dentine, size of the pulp cavity decreases. This change
in the size of pulp cavity has been previously reported by many researchers using
two-dimensional and three-dimensional radiographic modalities.
Univers
ity of
Mala
ya
14
2.4.5.1 Two-dimensional radiographic methods for measuring secondary
dentine deposition
Two-dimensional radiographic methods have been effectively used in the twentieth
century for measuring reduction in the size of three-dimensional pulp cavity. During
that time, three-dimensional radiographic modalities (CBCT) were not available to
measure these age-related structural changes.
2.4.5.1.1 Relationship between chronological age and secondary dentine
deposition on periapical X-rays
A study reported by Kvaal et al. (1995) was one of the earliest attempts to measure
secondary dentine formation using periapical radiographs. Measurements on six
different types of teeth were performed. Ratios of pulp/root length, pulp/tooth
length, tooth/root length and pulp/root width were measured and statistical analysis
showed strong correlation between all the measured ratios and chronological age,
except for tooth/root length ratio. The coefficients of determination value (R2=0.76)
showed that this method could be used with reasonable accuracy for estimating
dental age. Canines showed weakest correlation among all the other types of teeth
investigated in the study. A study on periapical radiographs was conducted to find
the relationship between pulp/tooth area ratio with chronological age (Cameriere et
al., 2007). They reported standard error of 5.4 years in maxillary and mandibular
canines.
2.4.5.1.2 Relationship between chronological age and secondary dentine
deposition on panoramic radiographs
Bosmans et al. (2005) conducted a study to investigate the effects of Kvaal et al.
(1995) technique on panoramic radiographs to see the relationship between
Univers
ity of
Mala
ya
15
secondary dentine deposition with age (Bosmans et al., 2005). The results indicated
no significant difference between two radiographic modalities. Paiwensky et al.
(2005) reported another significant relationship between chronological age and
reduction in the size of pulp cavity using orthopantomograms. However, the
coefficient of determination value was higher for maxillary lateral incisors
(R2=0.913).
Another study reported on underestimation of Kvaal et al. (1995) method and
overestimation of Paewinsky et al. (2005) method using dental panoramic
radiographs among Austrian population (Meinl et al., 2007). Regression equations
derived from the above-mentioned studies were used to estimate dental age among
individuals ranging in age from 13 to 24 years.
2.4.5.1.3 Relationship between chronological age and secondary dentine
deposition by measuring ground sections of teeth.
Arora et al. (2016) conducted a study to investigate the reliability of Gustafson’s
qualitative method and Kedici’s quantitative method of measuring ground sections
of secondary dentine for dental age prediction among North Western adult Indians.
Study reported ±10.4 years error in Gustafson’s method while ±13 years error in
Kedici’s technique. The results showed that both methods were gender independent
and there was no statistical difference in the strength of correlation between genders.
2.4.5.2 Use of Three dimensional radiographic modalities in observing
reduction of pulp cavity volume
There are different radiological methods to measure the secondary dentine formation
but to be more effective, the use of 3-dimensional techniques has been preferred
over 2-dimensional techniques. It is not logical to measure 3-dimensional structures
Univers
ity of
Mala
ya
16
with 2-dimensional techniques. Thus far, no volumetric study has been reported on
Malaysian population using CBCT technology for estimating dental age. Following
are the studies which have been conducted to document pulp cavity volume
reduction with age in the last few decades on different populations.
2.4.5.2.1 Pulp/tooth volumetric studies reported on Belgian population using
3D scans.
The first two studies reported on volumetric analysis of pulp cavity using 3D scans
were carried on Belgian population (Vandevoort et al., 2004; Yang et al., 2006).
Images used for the volumetric reconstruction of pulp/tooth volumes were acquired
through X-ray micro focus computed tomography by Vandevoort et al. (2004).
However, Yang et al. (2006) used CBCT images for volumetric analysis. Single
rooted teeth were examined in the studies. Both of these studies showed weak
strength of correlation between chronological age and pulp/tooth volume ratio as
compared to the studies carried on other populations. As this technique was less-
invasive it can be used on living individuals for identification and age estimation.
So, these studies provided simple and a new concept of volumetric analysis among
the forensic researchers.
The above-mentioned studies were pilot studies and involved small sample size.
However, another study was reported on Belgian population using CBCT images
with comparatively large sample size (n=111) (Star et al., 2011). This study involved
single rooted teeth for volumetric analysis. Volumetric analysis of pulp cavity and
tooth was performed using Simplant Pro software. Despite using adequate sample
size, the strength of correlation (0.34) between chronological age and pulp/tooth
volume ratio were similar to the previously reported studies on Belgian population
(Vandevoort et al., 2004; Yang et al., 2006). The study reported no significant
Univers
ity of
Mala
ya
17
difference in the strength of correlation values between different single rooted teeth
involved in the study (Incisors, canines, premolars). The study suggested future
research to be carried out on larger sample size and on different types of teeth.
Improvements in CBCT technology and image enhancing softwares with more
reliable thresholding and segmentation will improve the volumetric analysis of pulp
cavity and tooth.
2.4.5.2.2 Pulp/tooth volumetric studies reported on Japanese population using
3D scans.
This simple, non-invasive and more likely less expensive way of estimating age has
drawn the attention of the researchers among forensic science experts from all over
the world. Studies on Japanese populations were conducted to investigate the
relationship between chronological age and pulp/tooth volume ratio (Someda et al.,
2009; Agematsu et al., 2010; Aboshi et al., 2010; Sakuma et al., 2013).
2.4.5.2.2.1 Images acquired through Micro-CT for Volumetric analysis
Someda et al. (2009) reported a different approach of dental age estimation. The aim
of the study was to investigate the strength of correlation between chronological age
and volumetric changes in pulp/tooth ratio. The study also aimed to investigate
significant difference in the strength of correlation between genders and to observe
the association of age with enamel, dentin and pulp cavity. Images for volumetric
analysis were acquired through micro-CT. Only mandibular central incisors were
studied. Following ratios were analysed for dental age estimation.
1. Pulp cavity/ whole tooth including enamel.
2. Pulp cavity/ whole tooth excluding enamel.
Univers
ity of
Mala
ya
18
3. Pulp cavity/ whole crown including enamel.
4. Pulp cavity/ whole crown excluding enamel.
5. Pulp cavity/ root region.
The highest correlation out of the above-mentioned segments was observed for the
pulp cavity/ whole tooth excluding enamel (R2; Male=0.67, Female=0.76). This
study suggested gender specific results.
Agematsu et al. (2010) also used images acquired through Micro-CT for volumetric
analysis. The study used the method as suggested by Someda et al. (2009) by using
the pulp/tooth ratio excluding enamel to investigate the relationship between
chronological age and pulp/tooth volume ratio. In contrast to the study of Someda
et al (2009) this study investigated two single-rooted teeth (mandibular central
incisors and second premolars). Like Someda et al. (2009), this study also reported
strong correlation between chronological age and pulp/tooth volume ratio for both
the investigated teeth. However, the correlation was higher in mandibular central
incisors (male, R2=0.67; female, R2=0.75) as compared to mandibular second
premolars.
In another research from Japan, a dental age estimation technique was investigated
by measuring the pulp cavity volumes using Micro-CT among first and second
premolars (Aboshi et al., 2010). The pulp/tooth volumes at four levels (crown area,
coronal one third, mid-root and apical one third of the root) were investigated. The
coronal one third of the root showed the greatest strength of correlation between
chronological age and pulp/tooth ratio. This study also reported strong correlation
for both investigated teeth (first premolars=0.64, second premolars=0.70).
Univers
ity of
Mala
ya
19
2.4.5.2.2.2 Images acquired through Multidetector Computed Tomography for
Volumetric analysis
Sakuma at el. (2013) for the first time investigated the relationship between age and
pulp/tooth volume ratio on dead bodies using MDCT. The investigated tooth was
mandibular first premolar. The results indicated strong correlation between age and
pulp/tooth volume ratio (R=0.76)(Sakuma et al., 2013).
2.4.5.2.3 Pulp/tooth volumetric studies reported on French population using 3D
scans.
An age estimation method was investigated by measuring the volumes of pulp
cavities in canines through CT images with the help of MIMICS software (Tardivo
et al., 2011; Tardivo et al., 2014). Both studies were performed using same image
enhancing software and investigated tooth. However, there was striking difference
in the strength of correlation values between the two studies (study 1; R=0.59, study
2; R=0.95). The only difference between the two studies were the sample size (study
1; n=133, study 2; n=840).
2.4.5.2.4 Pulp/tooth volumetric studies reported on Italian population using 3D
scans.
The relationship between chronological age and pulp/tooth volume ratio in
maxillary canines was reported from Italy (De Angelis et al., 2015). The volumetric
analysis was performed using images acquired with the help of CBCT. The
correlation was moderate (R2=0.39) and significant in both genders where the
female showed higher correlation than males. However, they also reported that this
method of age estimation is gender independent.
Univers
ity of
Mala
ya
20
Another study was reported on maxillary left central incisors (Pinchi et al., 2015).
The study showed good correlation between pulp/tooth volume ratio and
chronological age. This authors also found that this method of dental age estimation
was gender independent. They concluded that the reduction in the volume of pulp
cavity is a reliable method of age estimation.
2.4.5.2.5 Pulp/tooth volumetric studies reported on Chinese population using
3D scans.
For the first time, volumetric study on multi-rooted teeth was reported in 2015 for
dental age estimation (Ge et al., 2015). But instead of investigating pulp/tooth
volume ratio, this study used just pulp chamber volumes alone. Maxillary and
mandibular first molars were investigated. The strength of correlation was very good
between chronological age and pulp chamber volume (R2=0.56) and can be used
with precision for dental age estimation.
Another recent study was conducted in China for age estimation based on pulp
cavity/chamber volume of 13 types of teeth using CBCT scans (Ge et al., 2016).
The goal of the study was to find which amongst the investigated teeth is showing
the highest strength of correlation between chronological age and pulp/tooth volume
ratio. Maxillary second molars had the largest coefficient of determination value
(R2=0.498).
2.4.5.2.6 Pulp/tooth volumetric studies reported on Indian population using 3D
scans.
Another study on Indian population was reported to observe pulp/tooth volume ratio
with aging among mandibular canines (Jagannathan et al., 2011). Cone beam
computed tomography scans of mandibular canines from 140 individuals ranging in
Univers
ity of
Mala
ya
21
age from 10 to 70 years were analysed to measure pulp and tooth volumes. Moderate
correlation was established for Indian population (r = -0.63).
2.5 Importance of dental age estimation and identification in the legal justice
system
To evaluate the methods for age estimation (due to the rise in the illegal immigrants)
a group of specialists were asked to investigate at Berlin in the year 2000. They
suggested that dental age estimation methods are effective for age estimation where
age is unknown (Schmeling et al., 2001). Moreover, the Norwegian Dental Age
Estimation Project is well recognised to estimate the dental age of the illegal
immigrants who are less than 18 years of age (Solheim & Vonen, 2006).
Dental age estimation plays a vital role not only in the criminal investigations but
also in the identification of the victims due to mass disasters or during immigrant
crises. The forensic odontologist coordinates with the investigation team using their
scientific and updated technological skills to estimate the dental age of suspects,
victims or migrants (Nuzzolese & Di Vella, 2008). For the last few centuries dentists
were providing their expertise in legal justice system. One of the initial cases was
documented in Scotland in 1814 (Campbell, 1963). Dr. Granville Sheep Pattison
and his two students were blamed for transferring the remains of Mrs. Mc Alister
from the grave. It was the dentist (Dr. James Alexander) of Mrs. Alister who
confirmed these allegations when he discovered the maxillary denture of Mrs.
Alister in one of the heads in the dissecting room. A dentist also shared their
expertise in one of the trials about the Caroline Walsh missing woman case in 1831
(Churchill, 1905).
In 1795 prince Louis XVII died at young age of 10 years and it was one of the early
documented cases of forensic dental age estimation. Through dental evaluation it
Univers
ity of
Mala
ya
22
was concluded that the remains and skeleton in the coffin was aged above 16 years
and therefore it was not the prince Louis XVII (Amoedo, 1898).
Nineteenth century was the era of rapid industrialization in Europe and thousands
of children were hired as labourers in industries. Different methods of age
assessment were introduced for hiring children for work. Edwin Saunders in 1837
suggested that teeth provided the most reliable guide to age when compared to
height (Shamim et al., 2006).
2.6 Teeth can withstand extreme conditions
Dental structures play a very important role in the forensic investigations as it can
withstand physical, thermal, chemical, nutritional deficiencies and dental hard
tissues are the last to be destroyed under extreme conditions (Shekhawat &
Chauhan, 2016). Tooth is the most highly-calcified tissue of the body.
A study was conducted in 2008 to analyse the effects of high temperatures on dental
hard tissues (Fereira et al., 2008). One group of teeth were exposed to direct heat
and another group was exposed to a gradual raise of temperature. Teeth which were
exposed to direct heat showed more structural damage than those exposed to gradual
raise of temperature. Although in both situations teeth were able to withstand high
temperatures.
In 2004, another study was conducted to see the effects of high temperatures on the
teeth having restorations and without restorations (Merlati et al., 2004). The changes
in the pattern of these samples can be of great importance in forensic investigations
and identification of unknown individuals.
The radiographic evaluation of dental structures plays a significant role in the
forensic odontology. A study investigated the effects of high temperatures on
Univers
ity of
Mala
ya
23
different restorations and endodontically treated teeth. The results of the study
showed that composite fillings can maintain its shape till 600-degree C, amalgam
fillings can maintain its shape till 1000-degree C and endodontically treated teeth
can withstand up to 1100-degree C (Savio et al., 2006).
In the period 1992-1996 a total of 89 unidentified bodies were found in Danish
water (Kringsholm et al., 2001). The forensic experts identified 78% of the cases
through dental examination. This study suggested that teeth can be a good tissue to
rely on for identification and also age estimation even though they have been
exposed to harsh and extreme conditions.
2.7 Role of forensic odontologist in mass disasters
Natural and manmade disasters are sudden, unexpected and involves large amount
of loss of life and it is very difficult to manage with the help of local government
resources. Thus, forensic odontologist plays a very important role in the
identification of deceased in mass disasters. Mass disasters can be due to human
errors like roadside accidents, aviation disasters or through sea route involving large
amount of loss of life. Mass disasters can also be naturally caused like earth quakes,
tsunamis, volcanic eruptions and landslides.
When large amount of loss of life is involved then it is very difficult to go for DNA
profiling or finger printing to identify each victim as biometric fingerprinting
records are not available in the third world countries. Moreover, it is tedious, time-
consuming and requires accredited expensive laboratories. Thus, forensic
odontologist provide more likely inexpensive and quickest way of identification in
such events.
Univers
ity of
Mala
ya
24
It is very challenging to identify burnt victims especially when the remains are badly
incinerated. In Spain, 28 incinerated victims of bus accident were examined and it
was possible to identify 57% of the cases by dental means, including age estimations
(Valenzuela et al., 2000).
2.8 Comparison of ante mortem and post mortem records
Record keeping by the dentist is essential for the forensic implications and legal
documentation of the patient. Patient records consists of demographics (including
age), diagnosis, examination, investigations, previous and current treatments,
anatomical discrepancies and prognosis of the patient. Tooth is a highly calcified
tissue of the body and it’s the last to be destroyed in the extreme fire or any aviation
disasters. If ante mortem dental records of the unidentified remains of the individual
are provided, then it can be compared with the post mortem records and assist in the
identification process (Charangowda, 2010; Sarode et al., 2009). In 1988 Lockerbie
air disaster, 209 victims of the 270 passengers were identified with the help of dental
comparison methods (Moody & Busuttil, 1994). Subsequently, in 2002 Bali
bombings, more than 60% of victims were similarly identified (Lain et al., 2003). In
2004, Boxing Day tsunami in Thailand, dental identification was the primary
identifier in more than 75% of cases (James, 2005). The important role played by
forensic odontology in the identification protocols in mass disasters cannot be
ignored. Apart from comparison of dental records for this identification process, the
other important scope of the dental tissues is the ability to perform age
estimation.
Univers
ity of
Mala
ya
25
CHAPTER 3: RESEARCH METHODOLOGY
3.1 Introduction
The research study was designed to investigate the relationship between the
chronological age and ratio of the pulp/tooth volume among the Malaysian
population (Malays and Chinese). The teeth included in the study were maxillary
right central incisors, maxillary right canines and maxillary left canines. The study
was designed to investigate which among the 3 types of investigated teeth are
showing the highest strength of correlation and whether, this method of dental age
estimation is gender dependent. This study was also aimed to compare the strength
of correlation values between maxillary right and maxillary left canines, each
belonging to different subjects.
3.2 The materials of the study
3.2.1 Cone-Beam Computed Tomography (CBCT)
Cone-Beam Computed Tomography (CBCT) scans stored in the Division of Oral
Radiology, Faculty of Dentistry, University of Malaya, were used for the present
study using i-CAT Cone Beam 3D Dental Imaging System (version 3.1.62 supplied
by Imaging Sciences International, Hatfield, USA). The scans selected had exposure
parameters of 120 KV, 18 mA and the scans were acquired using voxel size of 0.30
mm and scanning time of 20 sec. The required data was selected and then saved in
the external hard disk for the purpose of this study. The data was then transferred to
the MIMICS software for the volumetric measurements of the maxillary right
central incisors and canines. The cases selected for the study dated back from
January 2004 to June 2016. Latest CBCT images were given the priority for the
selection process.
Univers
ity of
Mala
ya
26
3.2.2 MIMICS Software
MIMICSs (Materialise Interactive Medical Image Control System) is an image
enhancing software for 3D reconstruction and modelling, manufactured
by Materialize NV, a Belgian company specialized in additive
manufacturing software and technology for medical, dental and additive
manufacturing industries ("3D Medical Image Processing Software; Materialise
Mimics", 2016). Images from CBCT data can be further enhanced with MIMICS
(Materialise Interactive Medical Image Control System) software. MIMICS with the
assistance of ‘Image segmentation module’ calculates the volume of the three-
dimensional models from stacked image data provided by CBCT. MIMICS
calculate and create images in the XZ (coronal) and YZ (sagittal) direction. This
enables a more comprehensive 3D feel of the 2D data. The region of interest (ROI),
selected in the segmentation process is converted to a 3D surface model using an
adapted marching cube algorithm that takes the partial volume effect into account,
leading to very accurate 3D models. The 3D files are represented in the STL format.
Other formats are VRML, PLY and DXF. Commonly used input format is DICOM.
This software is capable of creating 3D models for the pulp cavity and calcified
tooth. Caution must be expressed here that the software is not able to demarcate
small structural details, particularly in the radicular portion of the tooth. As a
consequence, manual intervention is required in the radicular portion during
‘multiple slice editing phase’ of the software.
3.3 The subjects of the study
3.3.1 Sample size calculation.
Sample size was calculated using G Power 3.1.9.2 software (Faul et al., 2009). This
calculation is based on the correlational study previously reported by Ge ZP et al.,
Univers
ity of
Mala
ya
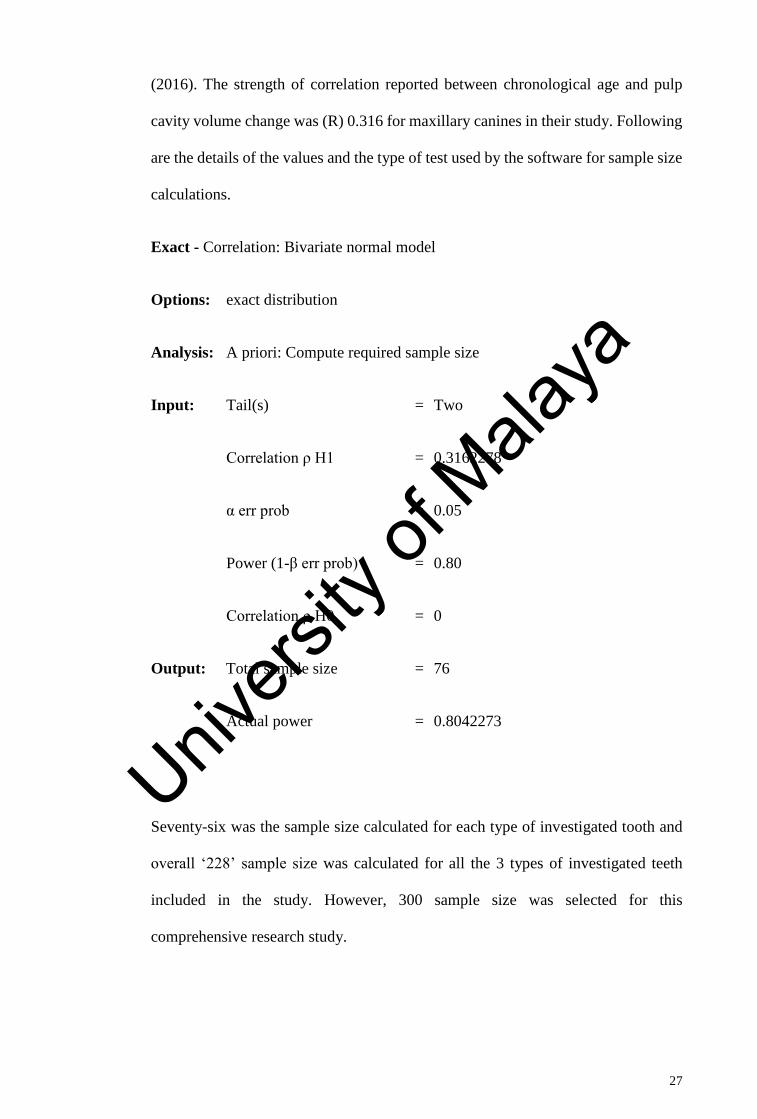
27
(2016). The strength of correlation reported between chronological age and pulp
cavity volume change was (R) 0.316 for maxillary canines in their study. Following
are the details of the values and the type of test used by the software for sample size
calculations.
Exact - Correlation: Bivariate normal model
Options: exact distribution
Analysis: A priori: Compute required sample size
Input: Tail(s) = Two
Correlation ρ H1 = 0.3162278
α err prob = 0.05
Power (1-β err prob) = 0.80
Correlation ρ H0 = 0
Output: Total sample size = 76
Actual power = 0.8042273
Seventy-six was the sample size calculated for each type of investigated tooth and
overall ‘228’ sample size was calculated for all the 3 types of investigated teeth
included in the study. However, 300 sample size was selected for this
comprehensive research study.
Univers
ity of
Mala
ya
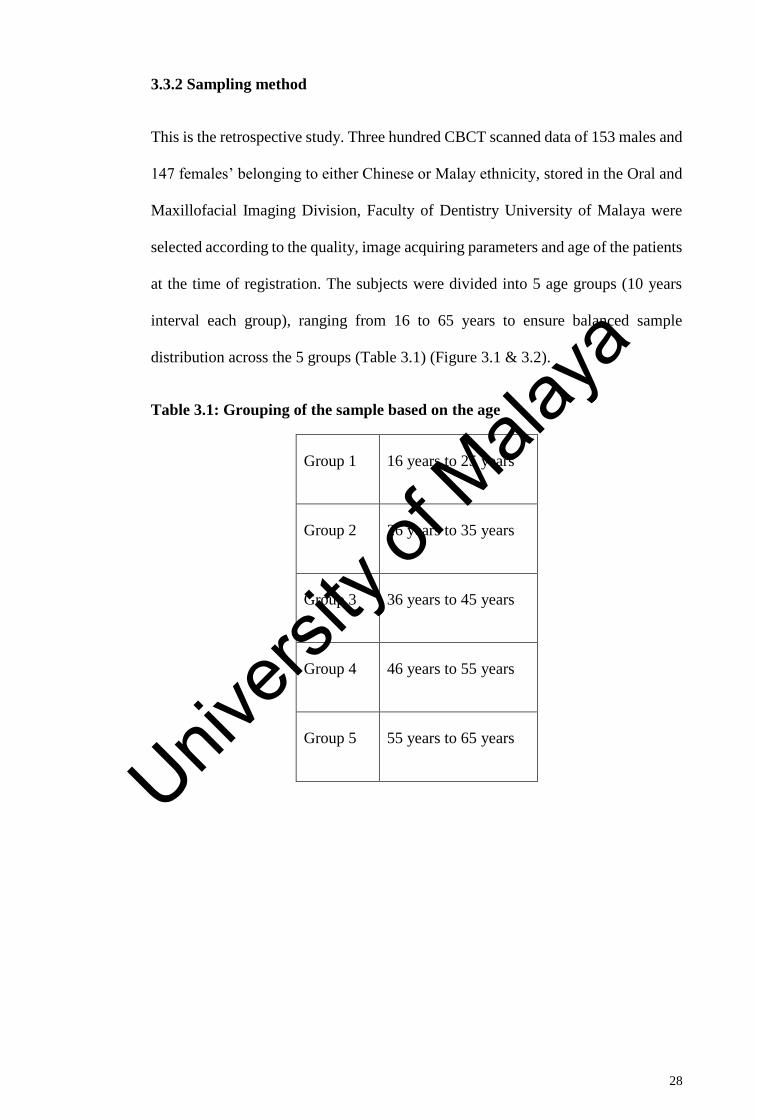
28
3.3.2 Sampling method
This is the retrospective study. Three hundred CBCT scanned data of 153 males and
147 females’ belonging to either Chinese or Malay ethnicity, stored in the Oral and
Maxillofacial Imaging Division, Faculty of Dentistry University of Malaya were
selected according to the quality, image acquiring parameters and age of the patients
at the time of registration. The subjects were divided into 5 age groups (10 years
interval each group), ranging from 16 to 65 years to ensure balanced sample
distribution across the 5 groups (Table 3.1) (Figure 3.1 & 3.2).
Table 3.1: Grouping of the sample based on the age
Group 1 16 years to 25 years
Group 2 26 years to 35 years
Group 3 36 years to 45 years
Group 4 46 years to 55 years
Group 5 55 years to 65 years
Univers
ity of
Mala
ya
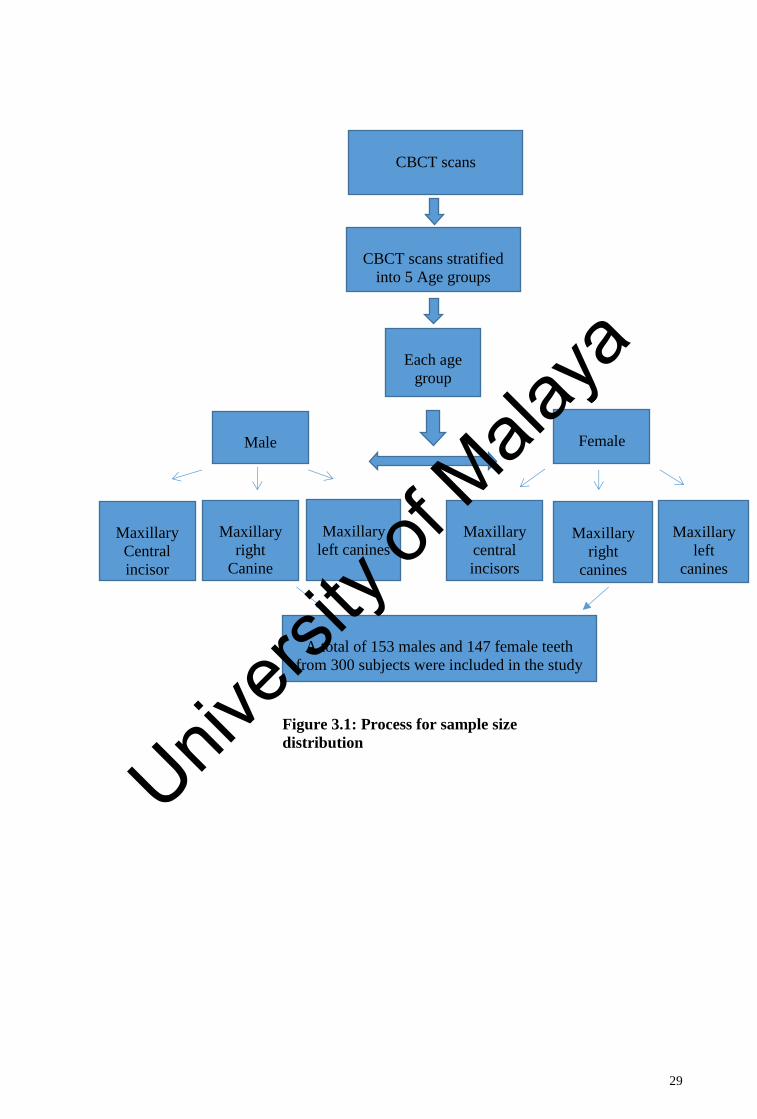
29
Each age
group
Male Female
Maxillary
Central
incisor
Maxillary
right
Canine
Maxillary
left canines Maxillary
central
incisors
Maxillary
right
canines
Maxillary
left
canines
A total of 153 males and 147 female teeth
from 300 subjects were included in the study
CBCT scans stratified
into 5 Age groups
Figure 3.1: Process for sample size
distribution
CBCT scans
Univers
ity of
Mala
ya
30
3.3.3 Selection criteria of the sample
The study sample was chosen according to the inclusion and exclusion criteria as
follows:
3.3.3.1 Inclusion criteria:
1. CBCT scans having exposure parameters of 120KV,18Ma and scans with
voxel size of 0.30mm, available in the database of Oral and maxillofacial
Imaging Division, Faculty of Dentistry University of Malaya.
2. Scans of Malaysians belonging to the Malay and Chinese race, as recorded
at the time of registration.
3. Patients aged 15 to 65 years as recorded at the time of registration.
4. No evidence of caries or pathology associated with maxillary canines and
maxillary right central incisors and completely developed roots on the
radiographic images.
3.3.3.2 Exclusion criteria
1. Patients aged below 15 and above 65 years.
2. Non-Mongoloid population.
3. Caries or any pathology associated with maxillary left and right canines
and maxillary central incisors.
4. Roots of the investigated tooth not fully developed on the images.
Univers
ity of
Mala
ya
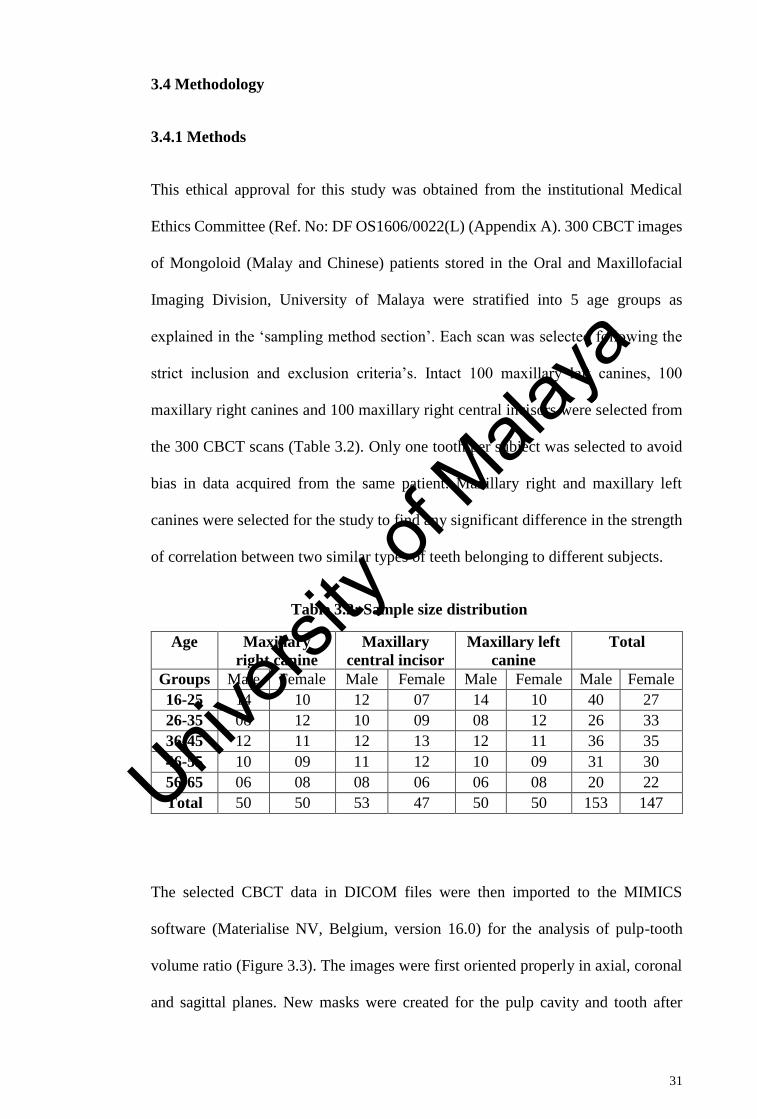
31
3.4 Methodology
3.4.1 Methods
This ethical approval for this study was obtained from the institutional Medical
Ethics Committee (Ref. No: DF OS1606/0022(L) (Appendix A). 300 CBCT images
of Mongoloid (Malay and Chinese) patients stored in the Oral and Maxillofacial
Imaging Division, University of Malaya were stratified into 5 age groups as
explained in the ‘sampling method section’. Each scan was selected following the
strict inclusion and exclusion criteria’s. Intact 100 maxillary left canines, 100
maxillary right canines and 100 maxillary right central incisors were selected from
the 300 CBCT scans (Table 3.2). Only one tooth per subject was selected to avoid
bias in data acquired from the same patient. Maxillary right and maxillary left
canines were selected for the study to find any significant difference in the strength
of correlation between two similar types of teeth belonging to different subjects.
Table 3.2: Sample size distribution
Age Maxillary
right canine
Maxillary
central incisor
Maxillary left
canine
Total
Groups Male Female Male Female Male Female Male Female
16-25 14 10 12 07 14 10 40 27
26-35 08 12 10 09 08 12 26 33
36-45 12 11 12 13 12 11 36 35
46-55 10 09 11 12 10 09 31 30
56-65 06 08 08 06 06 08 20 22
Total 50 50 53 47 50 50 153 147
The selected CBCT data in DICOM files were then imported to the MIMICS
software (Materialise NV, Belgium, version 16.0) for the analysis of pulp-tooth
volume ratio (Figure 3.3). The images were first oriented properly in axial, coronal
and sagittal planes. New masks were created for the pulp cavity and tooth after
Univers
ity of
Mala
ya
32
setting different grayscale threshold values for each of the investigated tooth (Figure
3.4). The masks were cropped in all 3 planes to separate the tooth from the
surrounding structures. In the ‘multiple slice editing phase’, masks were manually
checked slice by slice for segmentation and separation from the surrounding
structures, taking more care in the radicular portion of the tooth. Areas of the pulp
cavity and calcified tooth structures, which were not automatically selected by the
software were manually checked and edited in the required area (Figure 3.5). After
editing the mask in the multiple slice editing phase the pulp cavity and tooth were
grown in the ‘Region growing phase’ of the software (Figure 3.6 and 3.7). Three
dimensional models of the pulp tissue and tooth were created (Figure 3.8). The
software then automatically calculated the volumes (mm3) of the pulp cavity and
tooth.
Univers
ity of
Mala
ya
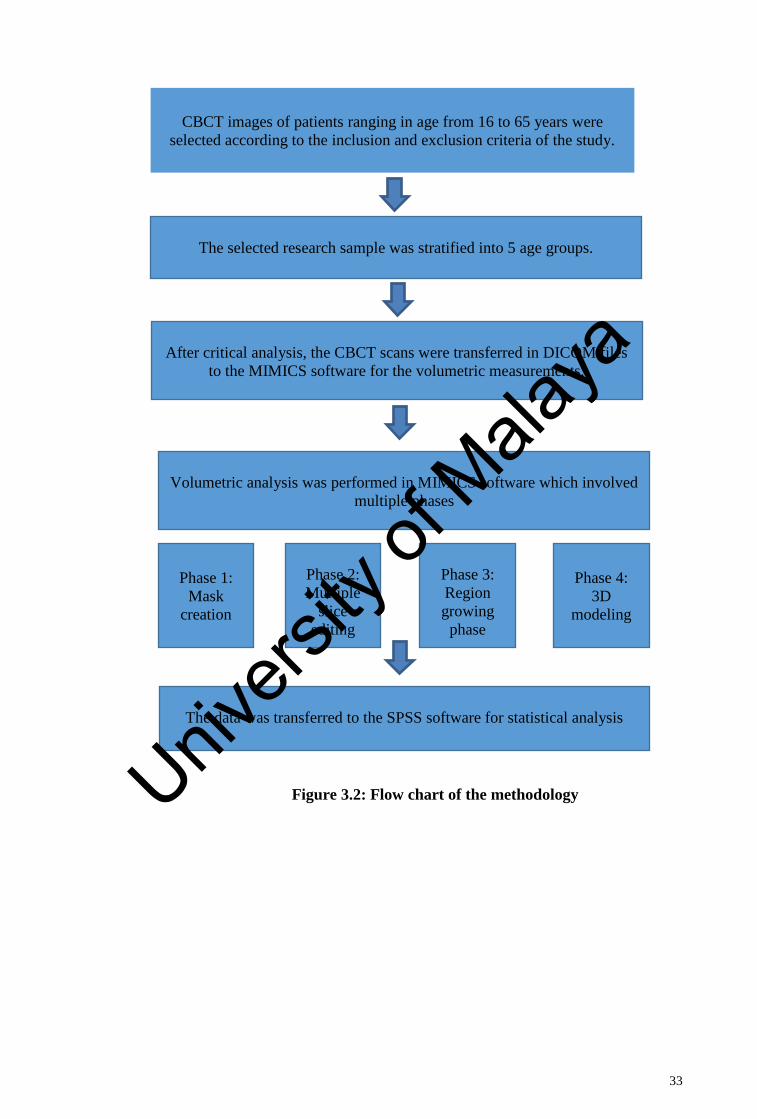
33
The selected research sample was stratified into 5 age groups.
After critical analysis, the CBCT scans were transferred in DICOM files
to the MIMICS software for the volumetric measurements.
CBCT images of patients ranging in age from 16 to 65 years were
selected according to the inclusion and exclusion criteria of the study.
Figure 3.2: Flow chart of the methodology
The data was transferred to the SPSS software for statistical analysis
Volumetric analysis was performed in MIMICS software which involved
multiple phases
Phase 3:
Region
growing
phase
Phase 2:
Multiple
slice
editing
Phase 4:
3D
modeling
Phase 1:
Mask
creation
Univers
ity of
Mala
ya
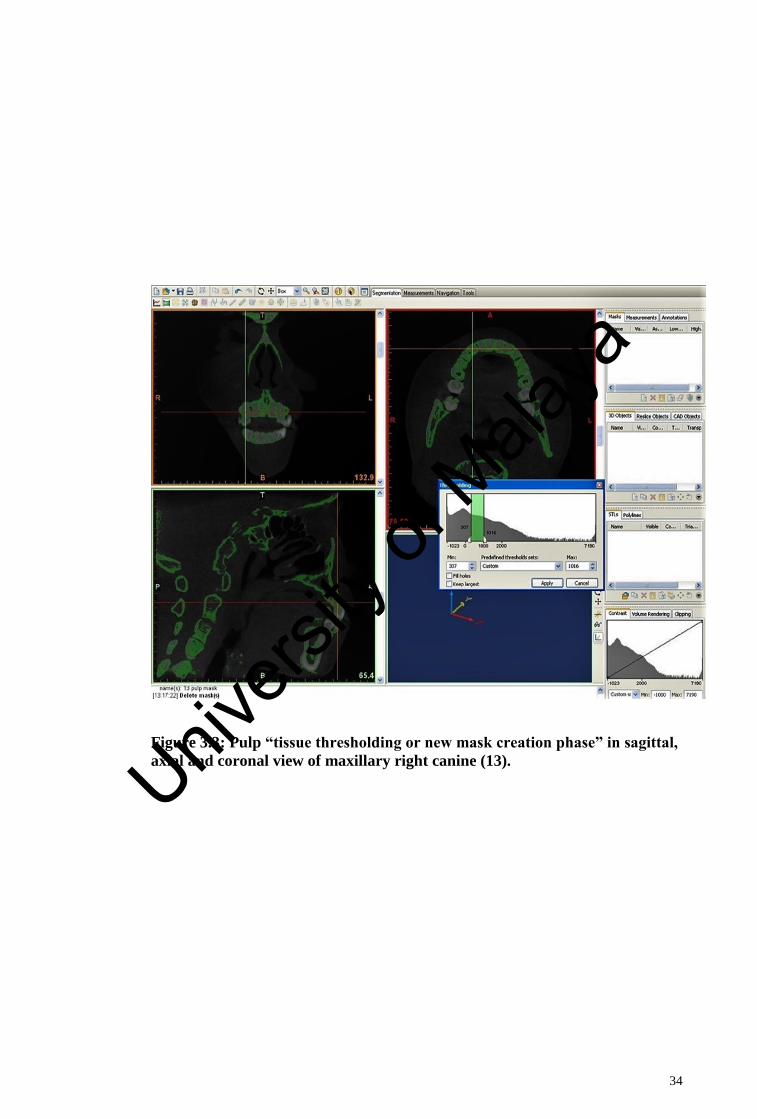
34
Figure 3.3: Pulp “tissue thresholding or new mask creation phase” in sagittal,
axial and coronal view of maxillary right canine (13).
Univers
ity of
Mala
ya
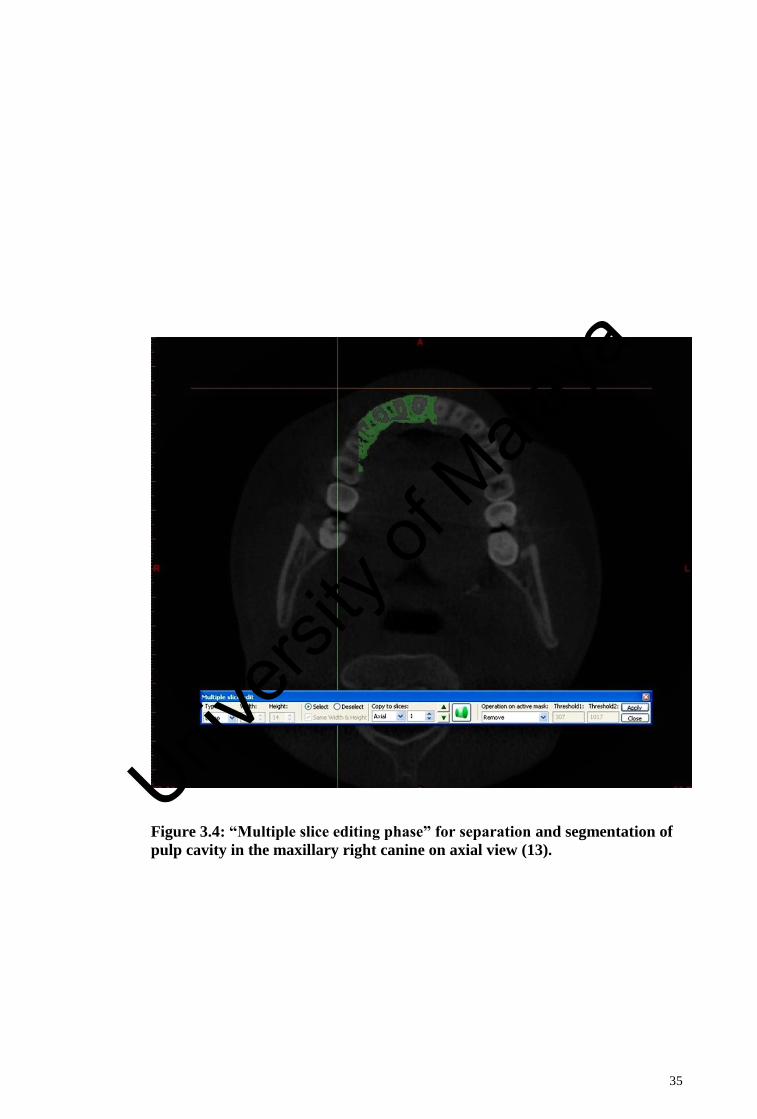
35
Figure 3.4: “Multiple slice editing phase” for separation and segmentation of
pulp cavity in the maxillary right canine on axial view (13).
Univers
ity of
Mala
ya
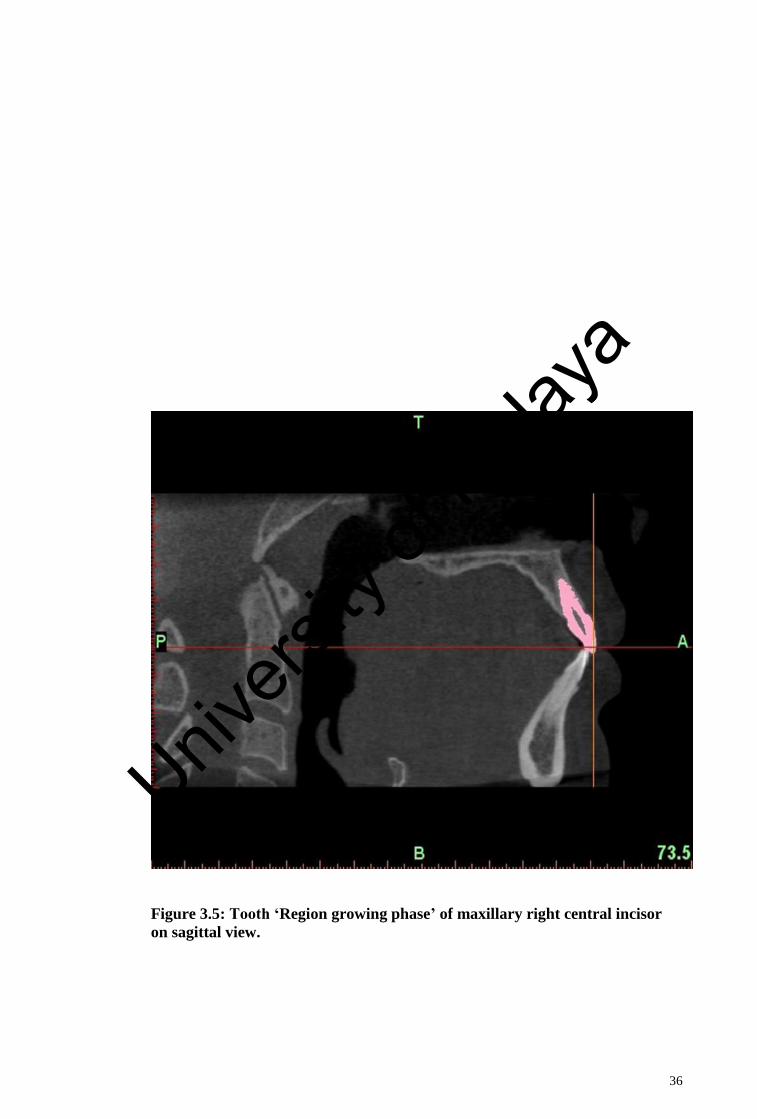
36
Figure 3.5: Tooth ‘Region growing phase’ of maxillary right central incisor
on sagittal view.
Univers
ity of
Mala
ya
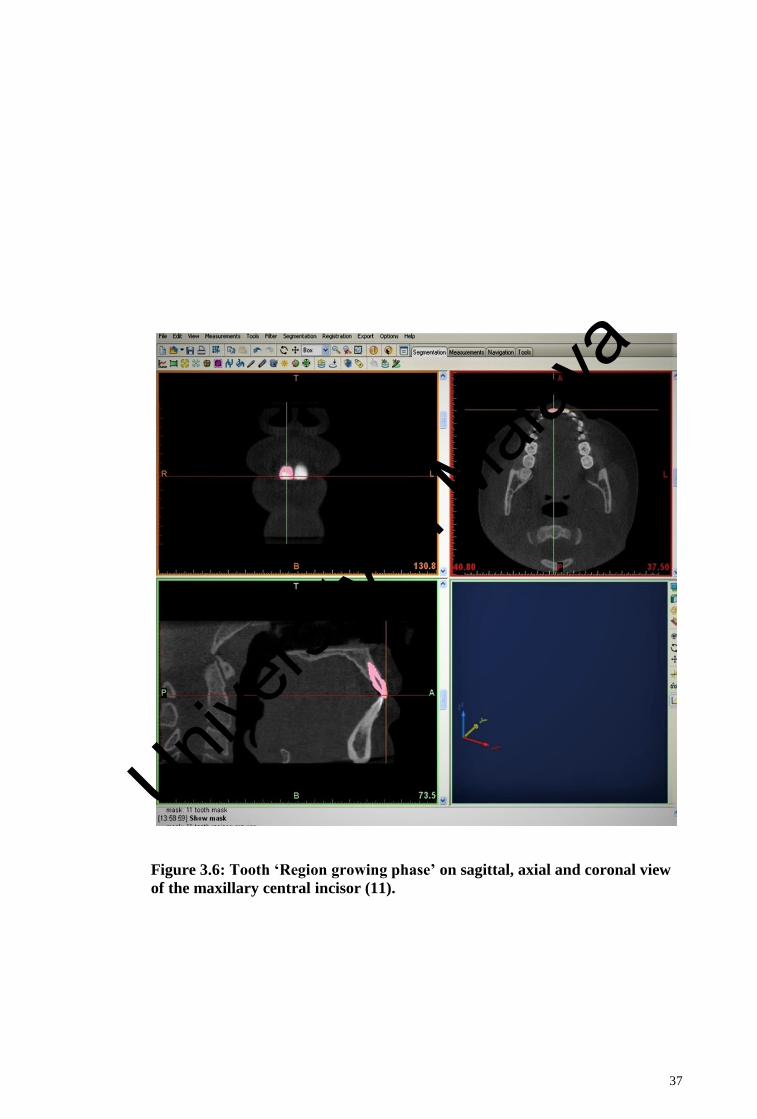
37
Figure 3.6: Tooth ‘Region growing phase’ on sagittal, axial and coronal view
of the maxillary central incisor (11).
Univers
ity of
Mala
ya
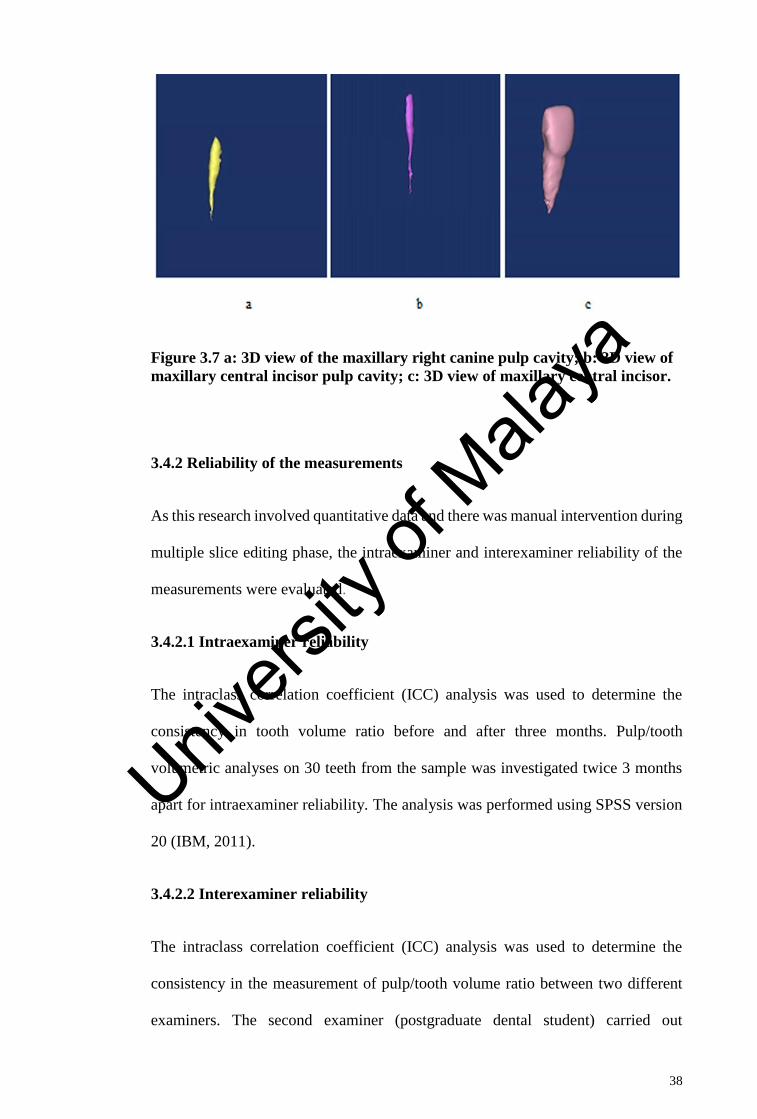
38
Figure 3.7 a: 3D view of the maxillary right canine pulp cavity; b: 3D view of
maxillary central incisor pulp cavity; c: 3D view of maxillary central incisor.
3.4.2 Reliability of the measurements
As this research involved quantitative data and there was manual intervention during
multiple slice editing phase, the intraexaminer and interexaminer reliability of the
measurements were evaluated.
3.4.2.1 Intraexaminer reliability
The intraclass correlation coefficient (ICC) analysis was used to determine the
consistency in tooth volume ratio before and after three months. Pulp/tooth
volumetric analyses on 30 teeth from the sample was investigated twice 3 months
apart for intraexaminer reliability. The analysis was performed using SPSS version
20 (IBM, 2011).
3.4.2.2 Interexaminer reliability
The intraclass correlation coefficient (ICC) analysis was used to determine the
consistency in the measurement of pulp/tooth volume ratio between two different
examiners. The second examiner (postgraduate dental student) carried out
Univers
ity of
Mala
ya
39
volumetric analysis to test for the interexaminer reliability on the same 30 teeth from
the sample. The analysis was performed using SPSS version 20 (IBM, 2011).
3.5 Data analysis
All the measurements and the data was analysed by using SPSS statistical software
(version 20) (IBM, 2011)The intraclass correlation coefficient (ICC) analysis was
used to measure intra and interexaminer reliability. Squared Pearson correlation
coefficient analysis was performed to find the association between the chronological
age and pulp/tooth volume ratio for each type of the investigated teeth and for the
whole research sample. Linear regression analysis was performed by using
chronological age as a dependent variable and pulp/tooth volume ratios as predictor.
Independent t-test analysis was used for the comparison of mean values of
pulp/tooth volume ratio between genders. Fishers Z test was used to find the
significant difference in the correlation coefficient values between, gender and for
the maxillary right and left canines belonging to different subjects.
Univers
ity of
Mala
ya
40
CHAPTER 4: RESULTS AND DATA ANALYSIS
4.1 Introduction.
This study investigated the relationship between the chronological age and
pulp/tooth volume ratio in maxillary right and left canines and maxillary right
central incisors. The results of the study are presented in different sections as
follows:
4.1.1 Intraexaminer and interexaminer reliability.
4.1.2 Relationship between pulp/tooth volume ratio and chronological age for the
maxillary left canines.
4.1.3 Relationship between pulp/tooth volume ratio and chronological age for the
maxillary right canines.
4.1.4 Relationship between pulp/tooth volume ratio and chronological age for the
maxillary right central incisors.
4.1.5 Relationship between pulp/tooth volume ratio and chronological age for the
left canines based on genders.
4.1.6 Relationship between pulp/tooth volume ratio and chronological age for the
right canines based on genders.
4.1.7 Relationship between pulp/tooth volume ratio and chronological age for the
maxillary right central incisors based on genders.
4.1.8 Comparison in the mean values of pulp/tooth volume ratios between genders
for the whole research sample.
Univers
ity of
Mala
ya
41
4.1.9 Fisher Z-test to investigate significant difference in the coefficient of
correlation values.
4.1.9.1 Comparison of the coefficient of correlation values between genders.
4.1.9.2 Comparison of the coefficient of correlation values between
maxillary left and maxillary right canines.
4.1.1 Intraexaminer and interexaminer reliability.
The intraclass correlation coefficient (ICC) analysis was performed to determine the
intraexaminer and interexaminer reliability. Volumetric analyses on 30 randomly
selected teeth from the sample was performed in a span of 3 months for
intraexaminer reliability. Similarly, a second examiner (postgraduate dental student)
carried out volumetric analysis to test for the interexaminer reliability on the same
sample. The obtained ICC value was 0.945 for intraexaminer reliability and 0.968
for the interexaminer reliability. The results suggested that the consistency value
was almost perfect.
4.1.2 Relationship between pulp/tooth volume ratio and chronological age for
the maxillary left canines.
The Pearson correlation analysis showed that there was significant inverse
association between maxillary left canine pulp/tooth volume ratio and chronological
age (p<0.01) (Table 4.1) (Appendix B). The strength of correlation was found to be
very good to perfect correlation (r=-0.73).
Univers
ity of
Mala
ya
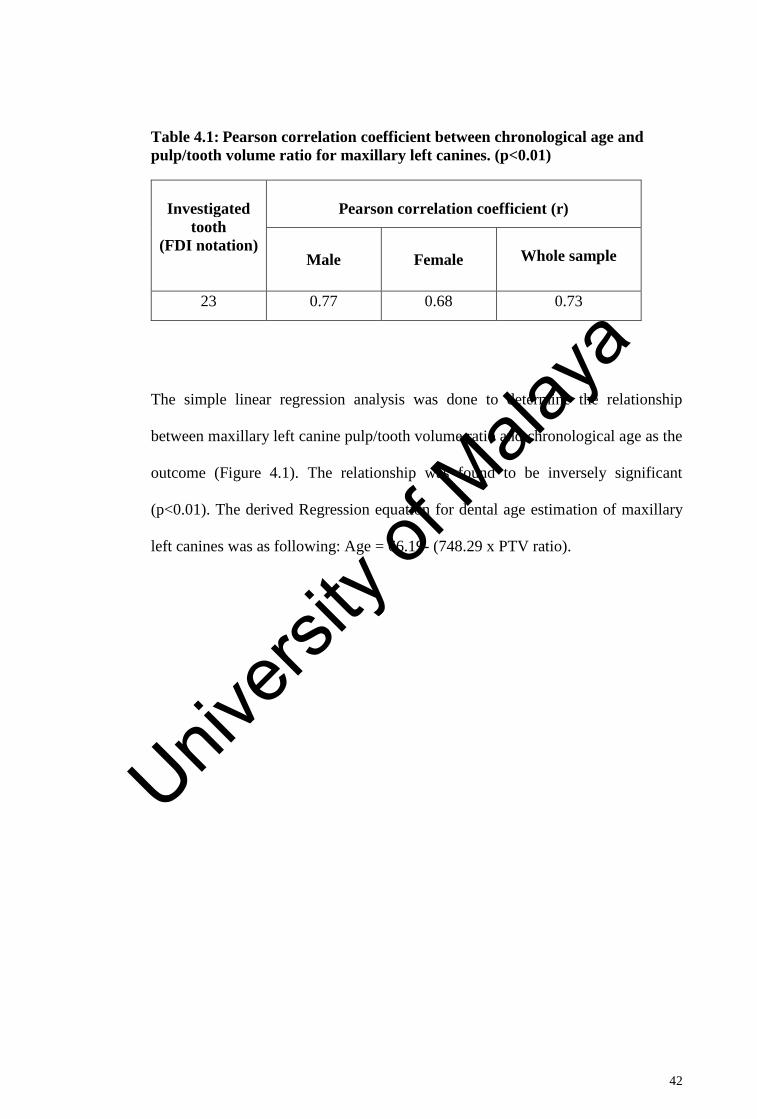
42
Table 4.1: Pearson correlation coefficient between chronological age and
pulp/tooth volume ratio for maxillary left canines. (p<0.01)
Investigated
tooth
(FDI notation)
Pearson correlation coefficient (r)
Male Female
Whole sample
23 0.77 0.68 0.73
The simple linear regression analysis was done to determine the relationship
between maxillary left canine pulp/tooth volume ratio and chronological age as the
outcome (Figure 4.1). The relationship was found to be inversely significant
(p<0.01). The derived Regression equation for dental age estimation of maxillary
left canines was as following: Age = 66.19- (748.29 x PTV ratio).
Univers
ity of
Mala
ya
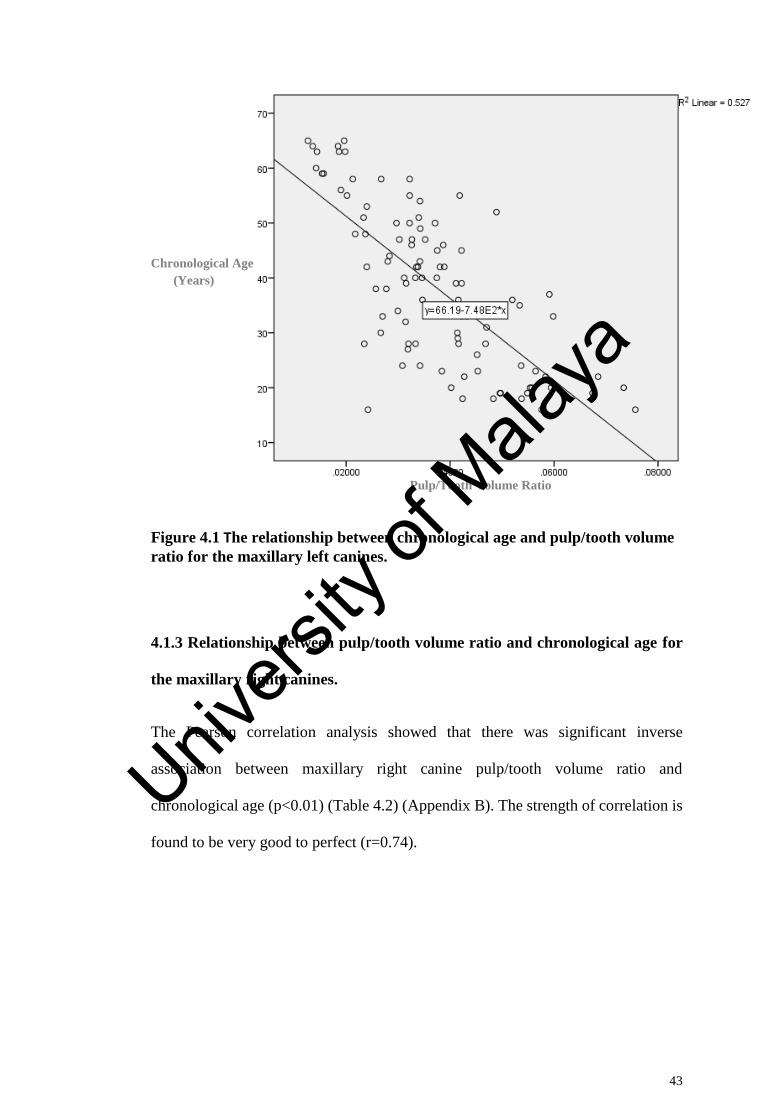
43
Figure 4.1 The relationship between chronological age and pulp/tooth volume
ratio for the maxillary left canines.
4.1.3 Relationship between pulp/tooth volume ratio and chronological age for
the maxillary right canines.
The Pearson correlation analysis showed that there was significant inverse
association between maxillary right canine pulp/tooth volume ratio and
chronological age (p<0.01) (Table 4.2) (Appendix B). The strength of correlation is
found to be very good to perfect (r=0.74).
Age
Pulp/Tooth Volume Ratio
Chronological Age
(Years)
Pulp/Tooth Volume Ratio
Univers
ity of
Mala
ya
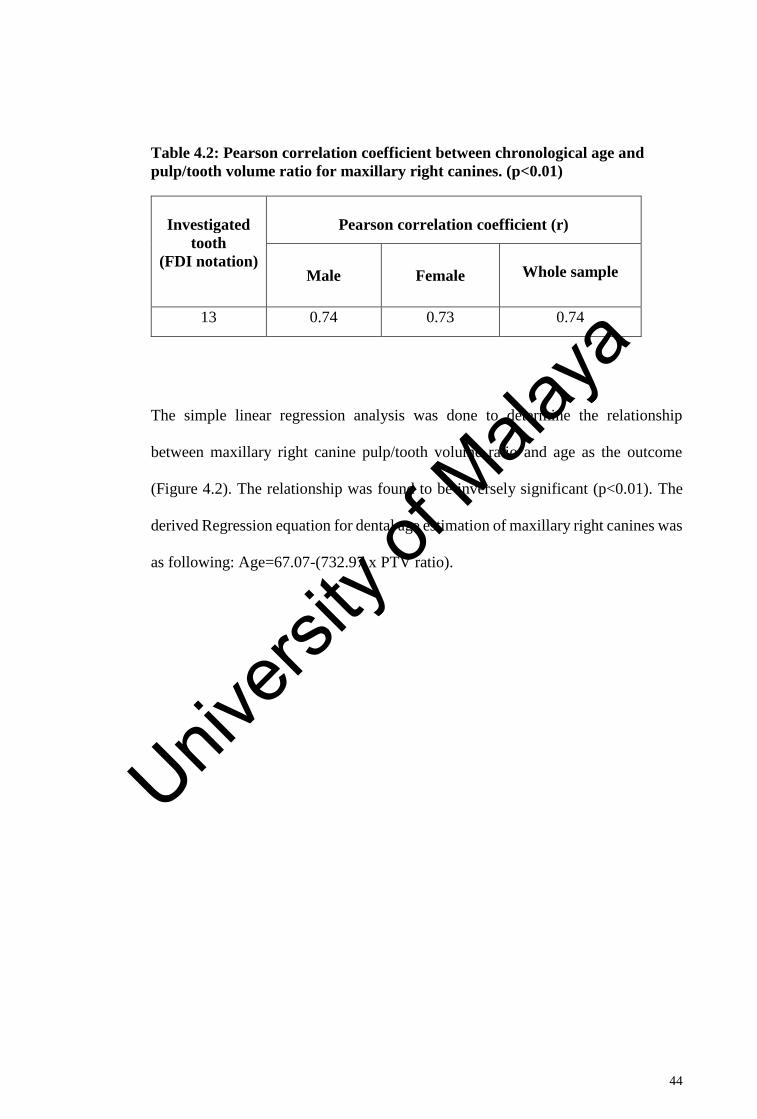
44
Table 4.2: Pearson correlation coefficient between chronological age and
pulp/tooth volume ratio for maxillary right canines. (p<0.01)
Investigated
tooth
(FDI notation)
Pearson correlation coefficient (r)
Male Female
Whole sample
13 0.74 0.73 0.74
The simple linear regression analysis was done to determine the relationship
between maxillary right canine pulp/tooth volume ratio and age as the outcome
(Figure 4.2). The relationship was found to be inversely significant (p<0.01). The
derived Regression equation for dental age estimation of maxillary right canines was
as following: Age=67.07-(732.97 x PTV ratio).
Univers
ity of
Mala
ya
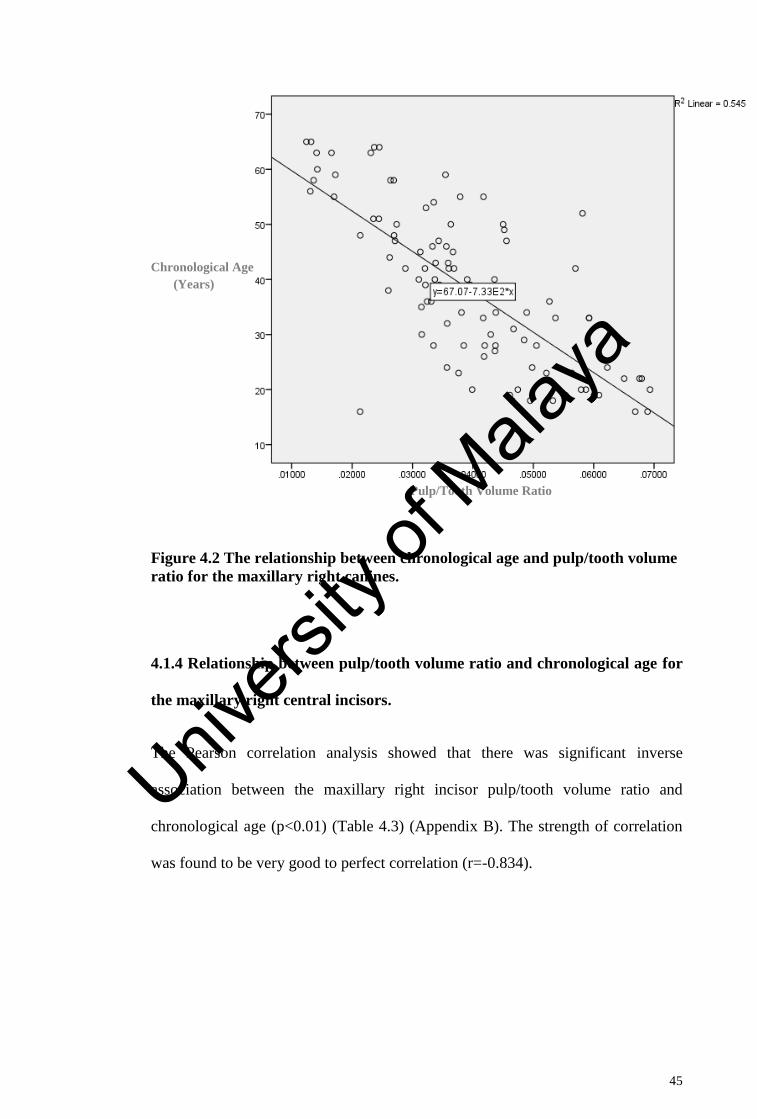
45
Figure 4.2 The relationship between chronological age and pulp/tooth volume
ratio for the maxillary right canines.
4.1.4 Relationship between pulp/tooth volume ratio and chronological age for
the maxillary right central incisors.
The Pearson correlation analysis showed that there was significant inverse
association between the maxillary right incisor pulp/tooth volume ratio and
chronological age (p<0.01) (Table 4.3) (Appendix B). The strength of correlation
was found to be very good to perfect correlation (r=-0.834).
Age
Pulp/Tooth Volume Ratio
Chronological Age
(Years)
Pulp/Tooth Volume Ratio
Univers
ity of
Mala
ya
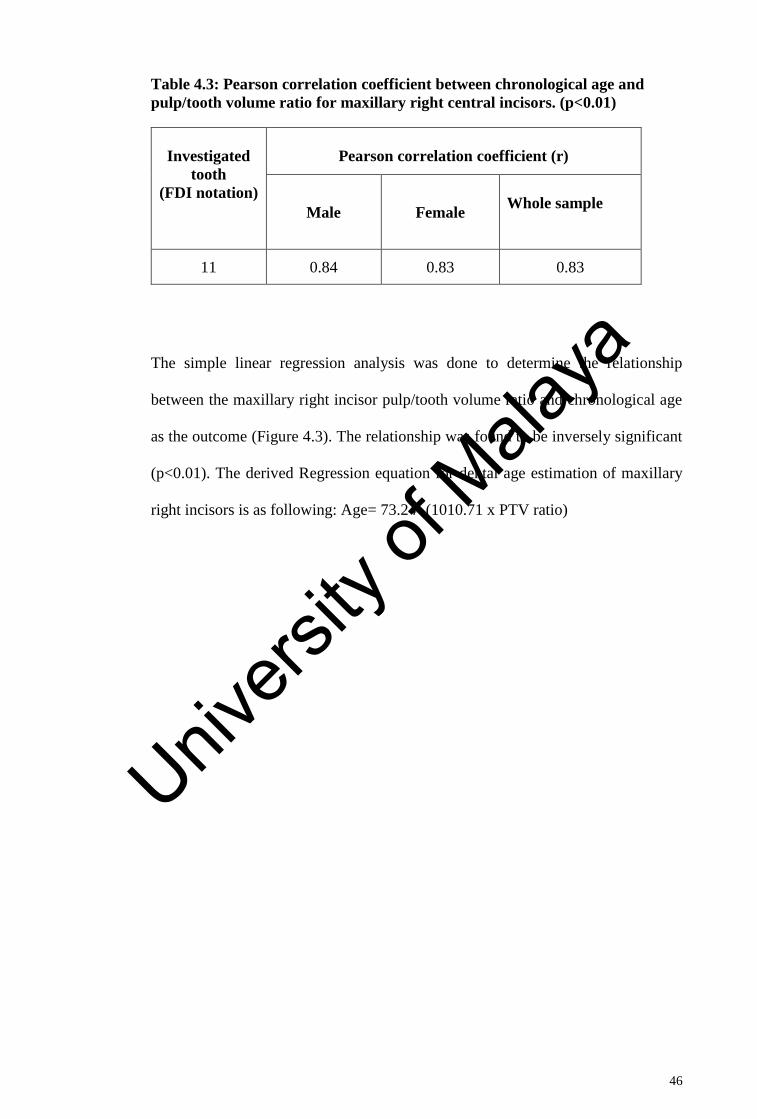
46
Table 4.3: Pearson correlation coefficient between chronological age and
pulp/tooth volume ratio for maxillary right central incisors. (p<0.01)
Investigated
tooth
(FDI notation)
Pearson correlation coefficient (r)
Male Female
Whole sample
11 0.84 0.83 0.83
The simple linear regression analysis was done to determine the relationship
between the maxillary right incisor pulp/tooth volume ratio and chronological age
as the outcome (Figure 4.3). The relationship was found to be inversely significant
(p<0.01). The derived Regression equation for dental age estimation of maxillary
right incisors is as following: Age= 73.24- (1010.71 x PTV ratio)
Univers
ity of
Mala
ya
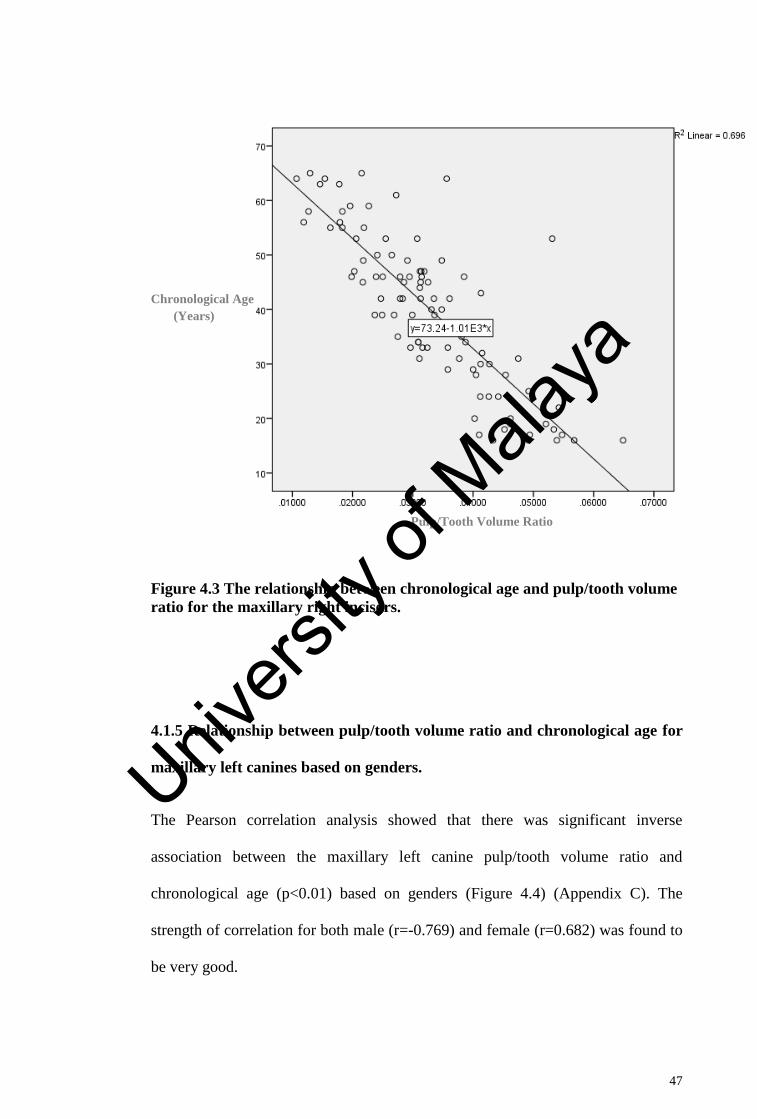
47
Figure 4.3 The relationship between chronological age and pulp/tooth volume
ratio for the maxillary right incisors.
4.1.5 Relationship between pulp/tooth volume ratio and chronological age for
maxillary left canines based on genders.
The Pearson correlation analysis showed that there was significant inverse
association between the maxillary left canine pulp/tooth volume ratio and
chronological age (p<0.01) based on genders (Figure 4.4) (Appendix C). The
strength of correlation for both male (r=-0.769) and female (r=0.682) was found to
be very good.
Age
Pulp/Tooth Volume Ratio
Chronological Age
(Years)
Pulp/Tooth Volume Ratio
Univers
ity of
Mala
ya
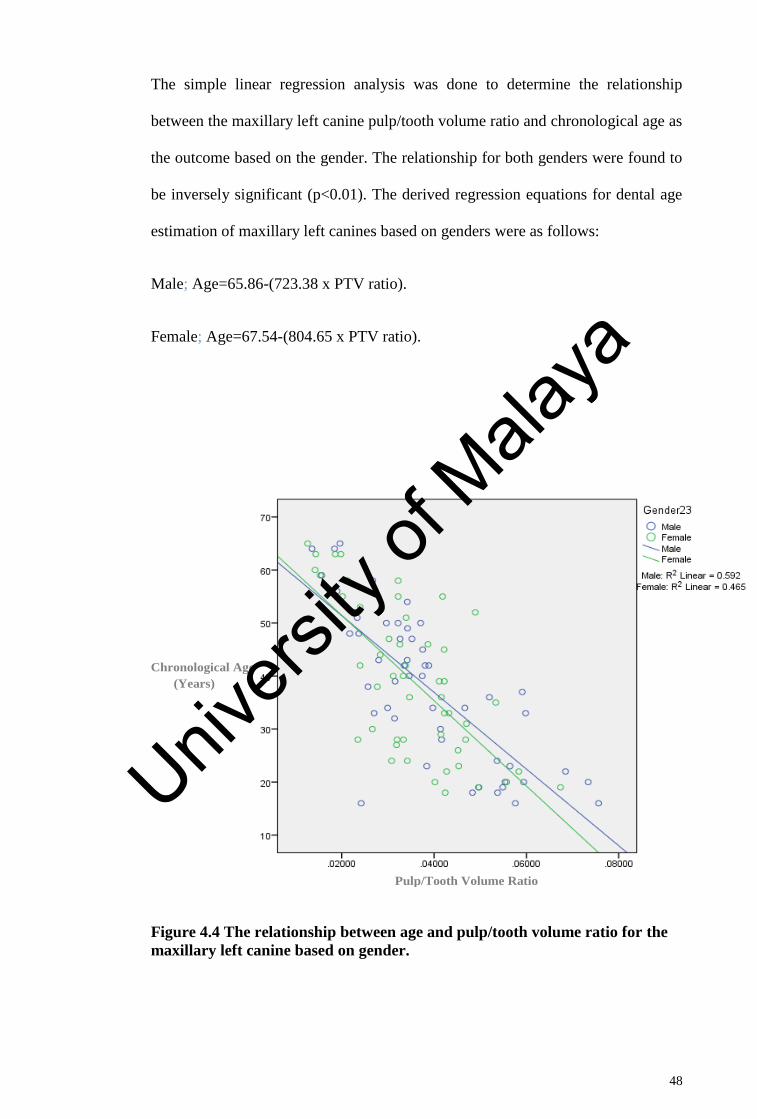
48
The simple linear regression analysis was done to determine the relationship
between the maxillary left canine pulp/tooth volume ratio and chronological age as
the outcome based on the gender. The relationship for both genders were found to
be inversely significant (p<0.01). The derived regression equations for dental age
estimation of maxillary left canines based on genders were as follows:
Male; Age=65.86-(723.38 x PTV ratio).
Female; Age=67.54-(804.65 x PTV ratio).
Figure 4.4 The relationship between age and pulp/tooth volume ratio for the
maxillary left canine based on gender.
Age
Pulp/Tooth Volume Ratio
Chronological Age
(Years)
Pulp/Tooth Volume Ratio
Univers
ity of
Mala
ya
49
4.1.6 Relationship between pulp/tooth volume ratio and chronological age for
maxillary right canines based on genders.
The Pearson correlation analysis showed that there was significant inverse
association between the maxillary right canine pulp/tooth volume ratio and
chronological age (p<0.01) based on genders (Figure 4.5) (Appendix C). The
strength of correlation for both male (r=-0.744) and female (r=0.731) was found to
be very good.
The simple linear regression analysis was done to determine the relationship
between the maxillary right canine pulp/tooth volume ratio and chronological age
as the outcome based on the gender. The relationship for both genders was found to
be inversely significant (p<0.01). The derived regression equations for dental age
estimation of maxillary left canines based on genders are as following:
Male; Age=67.45-(732.81 x PTV ratio).
Female; Age=66.93-(739.43 x PTV ratio).
Univers
ity of
Mala
ya
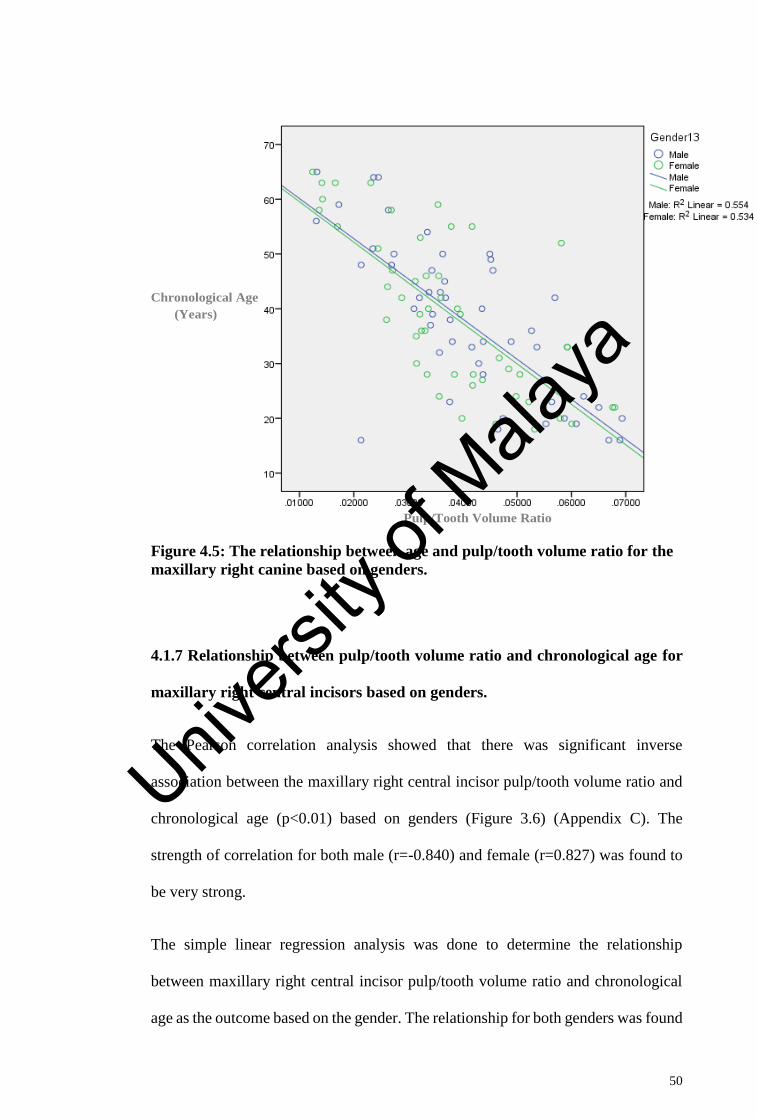
50
Figure 4.5: The relationship between age and pulp/tooth volume ratio for the
maxillary right canine based on genders.
4.1.7 Relationship between pulp/tooth volume ratio and chronological age for
maxillary right central incisors based on genders.
The Pearson correlation analysis showed that there was significant inverse
association between the maxillary right central incisor pulp/tooth volume ratio and
chronological age (p<0.01) based on genders (Figure 3.6) (Appendix C). The
strength of correlation for both male (r=-0.840) and female (r=0.827) was found to
be very strong.
The simple linear regression analysis was done to determine the relationship
between maxillary right central incisor pulp/tooth volume ratio and chronological
age as the outcome based on the gender. The relationship for both genders was found
Age
Pulp/Tooth Volume Ratio
Chronological Age
(Years)
Pulp/Tooth Volume Ratio
Univers
ity of
Mala
ya
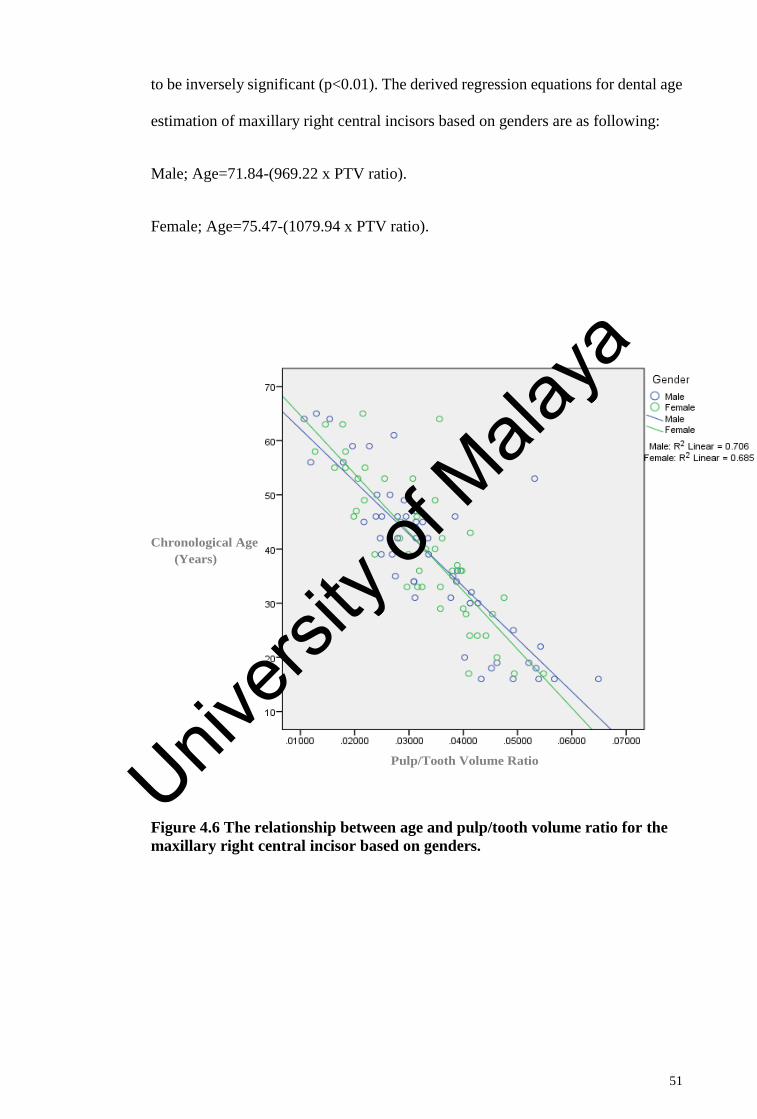
51
to be inversely significant (p<0.01). The derived regression equations for dental age
estimation of maxillary right central incisors based on genders are as following:
Male; Age=71.84-(969.22 x PTV ratio).
Female; Age=75.47-(1079.94 x PTV ratio).
Figure 4.6 The relationship between age and pulp/tooth volume ratio for the
maxillary right central incisor based on genders.
Age
Pulp/Tooth Volume Ratio
Chronological Age
(Years)
Pulp/Tooth Volume Ratio
Univers
ity of
Mala
ya
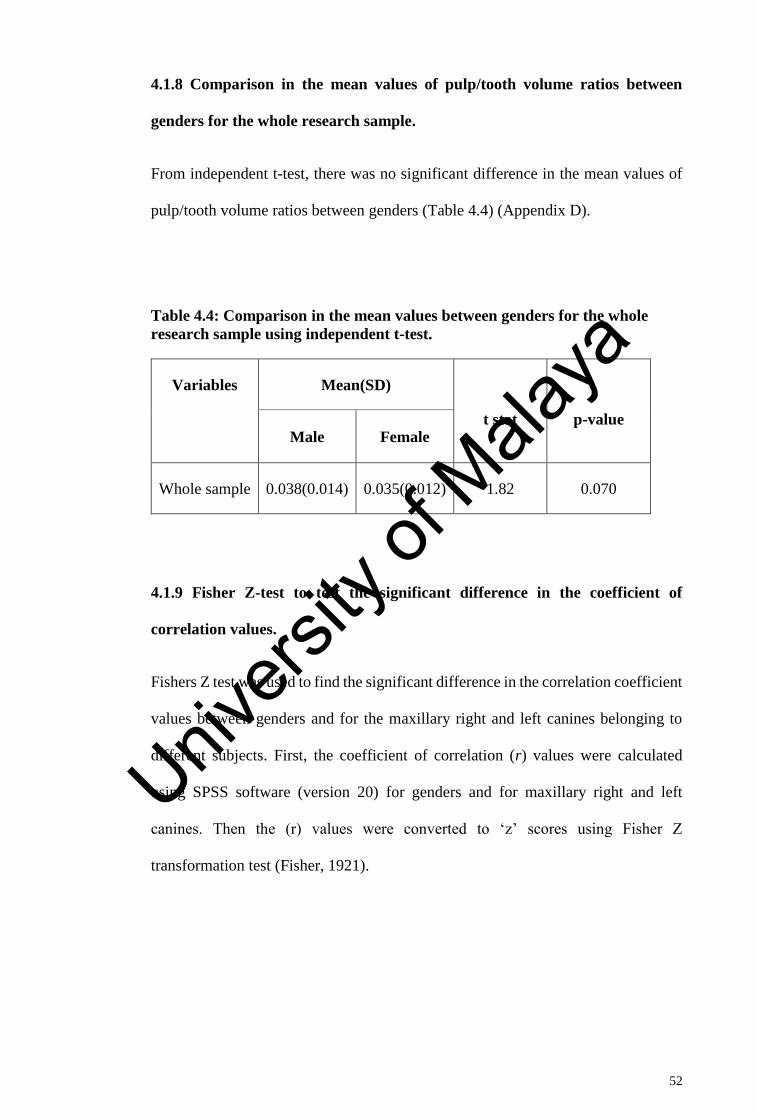
52
4.1.8 Comparison in the mean values of pulp/tooth volume ratios between
genders for the whole research sample.
From independent t-test, there was no significant difference in the mean values of
pulp/tooth volume ratios between genders (Table 4.4) (Appendix D).
Table 4.4: Comparison in the mean values between genders for the whole
research sample using independent t-test.
Variables Mean(SD)
t stat
p-value Male Female
Whole sample 0.038(0.014) 0.035(0.012) 1.82 0.070
4.1.9 Fisher Z-test to test the significant difference in the coefficient of
correlation values.
Fishers Z test was used to find the significant difference in the correlation coefficient
values between genders and for the maxillary right and left canines belonging to
different subjects. First, the coefficient of correlation (r) values were calculated
using SPSS software (version 20) for genders and for maxillary right and left
canines. Then the (r) values were converted to ‘z’ scores using Fisher Z
transformation test (Fisher, 1921).
Univers
ity of
Mala
ya
53
Transformation of the two correlation coefficients to z score:
r = 1/2 ln [1+r / 1-r]
(“ln" is the natural logarithm function)
(“r” is the correlation coefficient)
After conversion of R values to z scores, following formula is used to get ‘Z’
observed.
The Z-test is computed as:
Z (obs)=Z1–Z2 / [1 / (n1-3) + 1 / (n2-3)]
(Z-critical is 1.96 for p < .05).
(Z1 and Z2 correspond to the correlation coefficients (r)
(n1 and n2 correspond to sample sizes).
The significance of Z observed value can be assessed by comparing it with the
critical value. Since the level of significance was set at 0.05 in this study it indicates
that critical value is ± 1.96. If the observed Z value is beyond this range, then the
difference between the two correlation values is significant.
Univers
ity of
Mala
ya
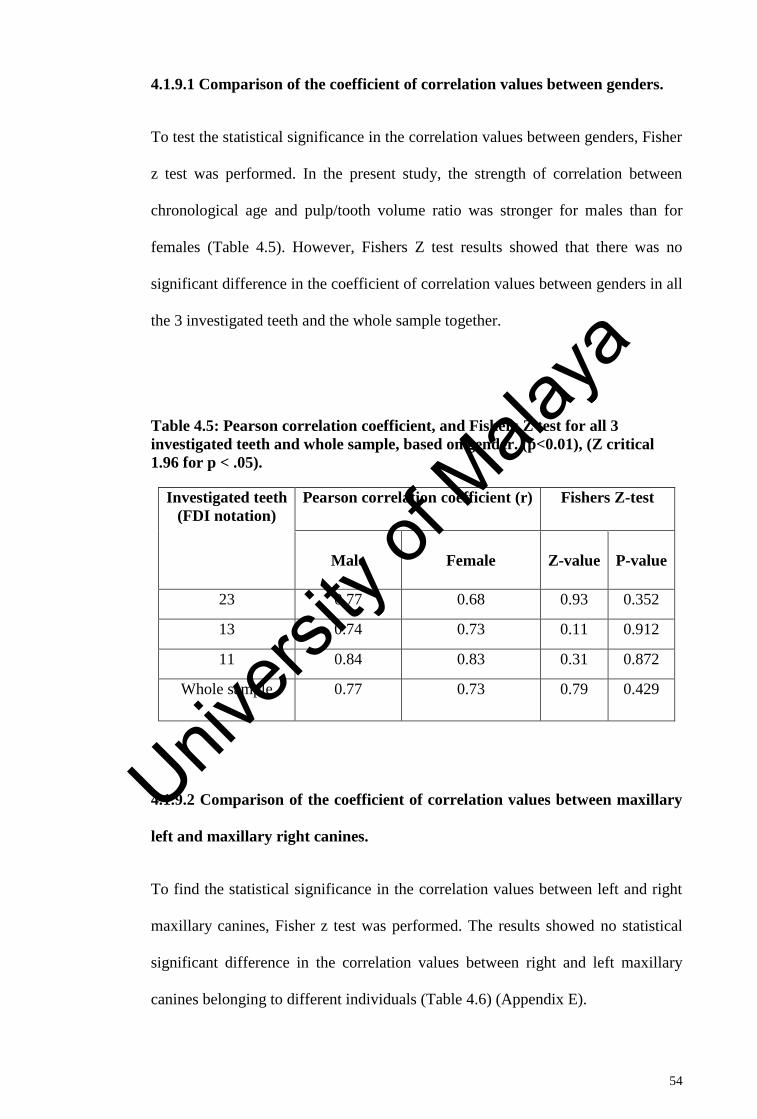
54
4.1.9.1 Comparison of the coefficient of correlation values between genders.
To test the statistical significance in the correlation values between genders, Fisher
z test was performed. In the present study, the strength of correlation between
chronological age and pulp/tooth volume ratio was stronger for males than for
females (Table 4.5). However, Fishers Z test results showed that there was no
significant difference in the coefficient of correlation values between genders in all
the 3 investigated teeth and the whole sample together.
Table 4.5: Pearson correlation coefficient, and Fishers Z test for all 3
investigated teeth and whole sample, based on gender. (p<0.01), (Z critical
1.96 for p < .05).
Investigated teeth
(FDI notation)
Pearson correlation coefficient (r) Fishers Z-test
Male Female Z-value P-value
23 0.77 0.68 0.93 0.352
13 0.74 0.73 0.11 0.912
11 0.84 0.83 0.31 0.872
Whole sample 0.77 0.73 0.79 0.429
4.1.9.2 Comparison of the coefficient of correlation values between maxillary
left and maxillary right canines.
To find the statistical significance in the correlation values between left and right
maxillary canines, Fisher z test was performed. The results showed no statistical
significant difference in the correlation values between right and left maxillary
canines belonging to different individuals (Table 4.6) (Appendix E).
Univers
ity of
Mala
ya
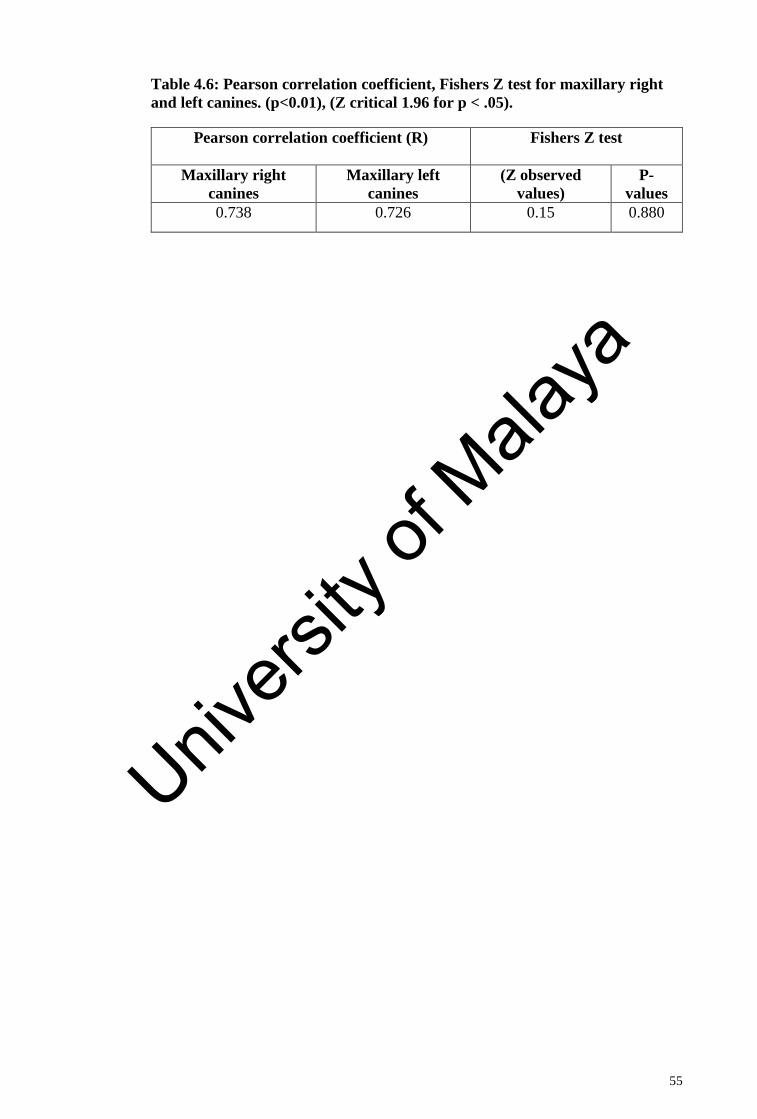
55
Table 4.6: Pearson correlation coefficient, Fishers Z test for maxillary right
and left canines. (p<0.01), (Z critical 1.96 for p < .05).
Pearson correlation coefficient (R) Fishers Z test
Maxillary right
canines
Maxillary left
canines
(Z observed
values)
P-
values
0.738 0.726 0.15 0.880
Univers
ity of
Mala
ya
56
CHAPTER 5: DISCUSSION
5.1 Rational for choice of the study topic.
This study was designed to derive a regression equation for dental age estimation by
obtaining pulp/tooth volume ratio in maxillary canines and maxillary right central
incisors with the help of CBCT data and Mimics software. In addition, maxillary
right and maxillary left canines were selected for the study to investigate any
significant difference in the strengths of correlation between two similar types of
teeth belonging to different subjects. The study was further designed to explore
whether there is any statistical difference in the correlation coefficient values
between genders.
The selection of this topic was based on the fact that to date, there is no data available
on dental age estimation by volumetric analysis on maxillary canines and maxillary
central incisors pulp cavity for the Malaysian population. The findings of the pattern
of physiological age changes in the canines and central incisors pulp cavity would
be beneficial for dental age estimation of adult Malaysians in the future and also to
compare the strength of correlation values with the studies carried on other
populations.
Previous studies reported different strength of correlations between chronological
age and pulp/tooth volume ratio for single rooted teeth (Yang et al., 2006; Agematsu
et al., 2010; Aboshi et al., 2010; Star et al., 2011; Jagannathan et al., 2011; Pinchi et
al., 2015; Tardivo et al., 2011). This variations in the strength of correlations
between different populations compelled us to investigate the relationship between
chronological age and pulp/tooth volume ratio exclusively for the Malaysian
population.
Univers
ity of
Mala
ya
57
Another reason for selection of this topic was the dramatic increase in the frequency
of natural disasters such as earth quakes, aviation disasters and tsunamis (Moody &
Busuttil, 1994). Natural disasters are unexpected, sudden and involves large amount
of loss of life so it becomes very important to find a simple and reliable method of
dental age estimation to assist in human identification. Although, the other primary
identifiers, namely DNA profiling and fingerprints matching are available. When
large number of loss of lives are involved it may prove difficult and time-consuming
to carry out DNA investigations on such a large scale. Moreover, biometric
fingerprinting records are not available in most of the third world countries.
The rapid increase in the illegal immigrants and terrorist attacks has also drawn the
attention of the worldwide researchers to find the reliable and easy method of age
estimation and identification especially in case of incinerated bodies. Most often
these attacks involve large number of casualties and forensic odontologist plays a
very vital role in such events for dental age estimation and identification (Lain et al.,
2003; James, 2005).
This study involves a less-invasive method of age estimation. In this method, CBCT
is used as the imaging technique which is less expensive as compared to other CT
modalities and emits low radiations. CBCT has been used in different specialties of
dentistry for implant placements, third molar surgical extractions and endodontics
(van Vlijmen et al., 2009; Haney et al., 2010; Kamburoglu et al., 2009; Worthington
et al., 2010; Ahmad et al., 2012).
Univers
ity of
Mala
ya
58
5.2 Specimen selection
This study involved 300 sample size of single-rooted teeth (Maxillary canines and
maxillary right central incisors), which were selected based on gender, ethnicity,
radiological parameters employed and age groups. Racial groups belonging to
Malays and Chinese aged between 16 to 65 years with no pathology associated with
the selected teeth were included in this study. Permanent canines and permanent
central incisors among single rooted teeth were selected for the study since previous
studies reported that most often these 2 types of teeth provided excellent correlation
values with chronological age (Someda et al., 2009; Agematsu et al., 2010; Star et
al., 2011; Tardivo et al., 2014). Thus, it was useful to include these 2 types of teeth
to compare the results of strength of correlations with previously reported studies.
Secondly permanent maxillary canine is the longest tooth in the oral cavity.
Employing this tooth is ideal as the longevity of this tooth benefits identification of
deceased persons in mass disasters.
CBCT scans for each selected tooth were thoroughly examined to eliminate teeth
with any associated pathology, since they may have impeded growth and
development. In cases of trauma on teeth, there is a possibility of lack of apical
closure, total or partial obliteration of the root and even root fracture.
5.3 CBCT data and MIMICS software
The sample size for this study was selected from the records stored in the Division
of Oral Radiology, Faculty of Dentistry, University of Malaya. As this study did not
involve direct interaction of the examiner with the patients, exclusion and inclusion
criteria were strictly based on information associated with the CBCT scans. One of
the positive aspects of this study is that the CBCT images were chosen as an imaging
technique due to less exposure time to radiation and reduced cost of CBCT as
Univers
ity of
Mala
ya
59
compared to other imaging modalities (Kumar et al., 2015; Dawood et al., 2009;
Ziegler et al., 2002; Scarfe et al., 2006). Some studies have shown that CBCT is
more accurate and has a higher resolution than CT, despite having less X-ray
radiation exposure (Cotton et al., 2007).
MIMICS software was used for the volumetric analysis of the pulp cavity and
calcified tooth structures in this study. This software has the advantage of altering
the segmentation process and the ability to do the volumetric analysis in axial,
coronal, sagittal and 3D views. It allows the investigator to add or remove mask in
the area of concern, where the software is not able to automatically demarcate
minute structural details. It also allows to accurately measure distances, angles,
diameters and densities either on 2D images or directly on the 3D model. Another
distinct advantage is that this software allows the operator to scroll through the entire
volume with simultaneous viewing of axial, coronal and sagittal sections. Even
complex measurements like ellipses, centrelines, multi-planar re-slice and curve
planar re-slice can be measured ("3D Medical Image Processing Software;
Materialise Mimics", 2016). Simulating surgical interventions on patient data can
be performed with this software. This allows deriving optimal surgical plans by
evaluating outcomes of various approaches or validating custom-made implants in
advance.
5.4 CBCT scans acquired with voxel size of 0.30mm.
The CBCT scans selected for this study had exposure parameters of 120 KV, 18 mA
and the scans were acquired using voxel size of 0.30 mm and scanning time of 20
sec. The CBCT scans with same voxel size of 0.30 mm were used for this study to
nullify partial volume averaging effect of voxels on volumetric measurements (van
Univers
ity of
Mala
ya
60
Vlijmen et al., 2009). Surprisingly, in another study by Tardivo et al. (2011) CBCT
images with different voxel sizes were used. This is inappropriate because CBCT
scans acquired with different voxel sizes have different volumetric results for the
same anatomical structures (Whyms et al., 2013). Therefore, our study was strictly
restricted to CBCT scans acquired with only 0.30 mm voxel sizes.
5.5 Selection of one tooth per subject.
Only one tooth per subject was selected for this study as opposed to previous studies
reported by Tardivo et al. (2011 & 2014). This is to avoid selecting two samples that
have similar developmental origin. Two teeth of similar type and having same
developmental origin will have same pattern of physiological age-related changes.
Thus, to avoid bias in the results only one tooth per subject was selected.
Additionally, it was not statistically appropriate to include more than one sample
per subject for regression analysis.
5.6 Pulp cavity volume alone verses pulp/tooth volume ratio.
Secondary dentine formation occurs throughout the life with age once the root
formation is completed. This study included the pulp/tooth volume measurements
instead of measuring the volume of the pulp cavity alone to nullify the effects of
variations in tooth sizes amongst different individuals (Star et al., 2011). This
approach is more scientifically acceptable and the findings are unbiased as
compared to measuring the pulp cavity volumes alone.
5.7 Highest strength of correlation between chronological age and pulp/tooth
volume ratio among all the 3 types of investigated teeth.
The Pearson correlation and regression analysis showed the significant inverse
association between pulp/tooth volume ratio and chronological age (p<0.01) for all
Univers
ity of
Mala
ya
61
the 3 types of investigated teeth. Maxillary right central incisors have shown the
strongest coefficient of determination values (R2= 0.70). This is similar to the results
reported by other researchers in their respective studies involving incisors (Kvaal et
al., 1995; Paewinsky et al., 2005; Star et al., 2011; Agematsu et al., 2010). Maxillary
right canine (R2=0.55) and maxillary left canines (R2=0.53) followed maxillary
right central incisor in the strength of correlation values. Star et al. (2011) also
reported the same in their study as permanent canine’s strength of correlation was
less than permanent incisors.
5.8 Comparison with previously reported studies.
The aim of the present study was to find an association between chronological age
and pulp/tooth volume ratio among Malaysian population (Malays and Chinese).
The strength of correlation values for all the 3-investigated teeth was compared with
other studies carried out on other populations. This section discusses the results of
the present study with the previous studies.
5.8.1 Comparison with studies reported on the Belgian population.
A pilot study was reported on 43 single rooted teeth (30 incisors, 8 canines and 5
premolars) using microfocus computed tomography (micro CT) to estimate dental
age (Vandevoort et al., 2004). This study was one of the first, which used volumetric
analysis for dental age estimation using micro CT. The coefficient of determination
value for the Belgian population was 0.31 for an association between chronological
age and pulp/tooth volume ratio, which is far less than our study (R2 ranged 0.53 to
0.70) (Table 5.1). The study on Belgian population did not investigate any
significant difference between different types of single rooted teeth involved in the
study nor between the genders. Findings similar to our study were noted by
Vandevoort et al. (2004), that suggested that maxillary right central incisors have
Univers
ity of
Mala
ya
62
shown highest strength of correlation as compared to maxillary canines and dental
age estimation method is gender independent.
Yang et al. (2006) reported in their study that moderate correlation exists between
chronological age and pulp/tooth volume ratio in single rooted teeth (R2=0.29).
Their study included 28 single rooted teeth scans of 19 individuals acquired with
CBCT. However, their study sample size included only 1 premolar, 12 canines and
15 incisors. The strength of correlation values (R2=0.70,0.53,0.55) in our study was
stronger than that reported in their study (Yang et al., 2006). The reason for such a
difference in strength of correlation may be attributed to low sample size and
grouping of 3 different types of investigated single rooted teeth collectively in a
regression analysis instead of measuring strength of correlation for each type of
single rooted tooth separately.
Yang et al. (2006) further reported that the periodontal ligaments space was not
detectable by the ‘iDixel software (J Morita corporation, Kyoto Japan) during the
volumetric analysis. Thus, they used ‘Microsoft Paint’ to draw the contours of the
periodontal ligaments space before segmentation procedure. In contrast, MIMICS
software allows the operator to do any manual segmentation and drawing the
contours of the periodontal space during the segmentation phase in slice by slice
‘multiple slice editing phase’. Therefore, for 3D measurements, it is advisable to use
scientifically acceptable 3-dimensional manual manipulating software instead of
relying on 2D software like ‘Microsoft Paint’ for manual interventions.
A weak correlation was reported between pulp/tooth volume ratio and chronological
age in 111 single rooted teeth on the Belgian population (Star et al., 2011). Their
study included 64 incisors, 32 canines, and 15 premolars from 54 male and 57
female CBCT scans. Volumetric analysis was performed using Simplant software
Univers
ity of
Mala
ya
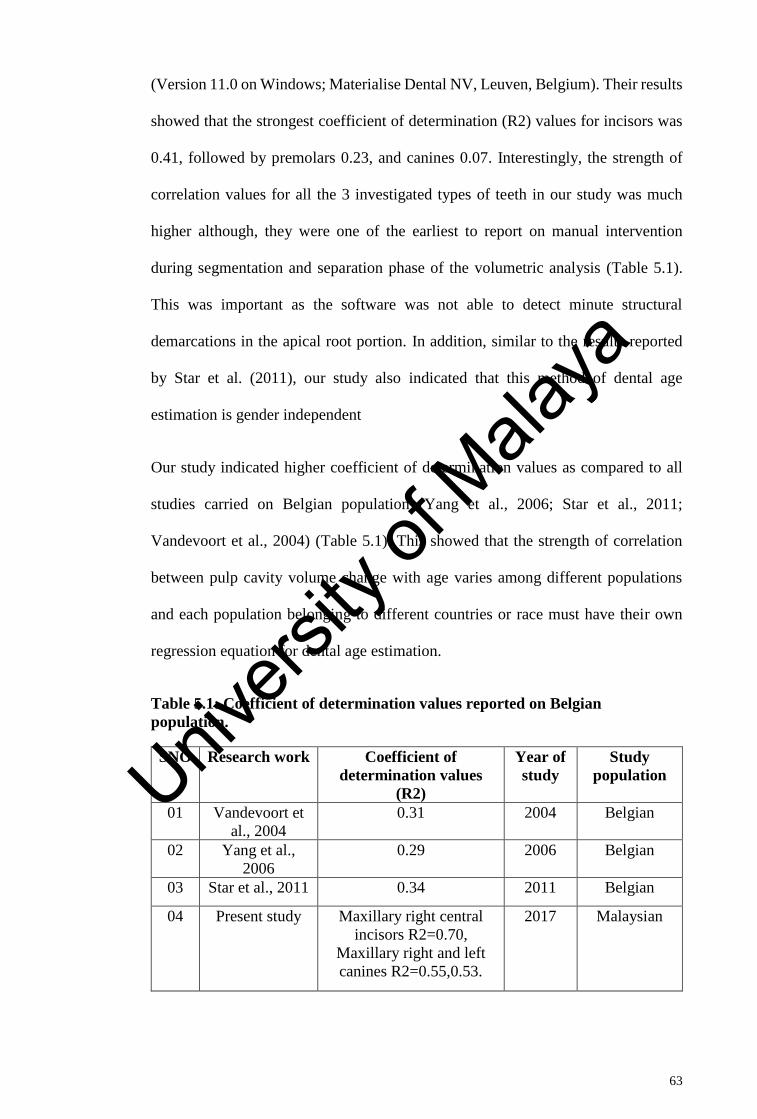
63
(Version 11.0 on Windows; Materialise Dental NV, Leuven, Belgium). Their results
showed that the strongest coefficient of determination (R2) values for incisors was
0.41, followed by premolars 0.23, and canines 0.07. Interestingly, the strength of
correlation values for all the 3 investigated types of teeth in our study was much
higher although, they were one of the earliest to report on manual intervention
during segmentation and separation phase of the volumetric analysis (Table 5.1).
This was important as the software was not able to detect minute structural
demarcations in the apical root portion. In addition, similar to the results reported
by Star et al. (2011), our study also indicated that this method of dental age
estimation is gender independent
Our study indicated higher coefficient of determination values as compared to all
studies carried on Belgian population (Yang et al., 2006; Star et al., 2011;
Vandevoort et al., 2004) (Table 5.1). This showed that the strength of correlation
between pulp cavity volume change with age varies among different populations
and each population belonging to different countries or race must have their own
regression equation for dental age estimation.
Table 5.1: Coefficient of determination values reported on Belgian
population.
SNO Research work Coefficient of
determination values
(R2)
Year of
study
Study
population
01 Vandevoort et
al., 2004
0.31 2004 Belgian
02 Yang et al.,
2006
0.29 2006 Belgian
03 Star et al., 2011 0.34 2011 Belgian
04 Present study Maxillary right central
incisors R2=0.70,
Maxillary right and left
canines R2=0.55,0.53.
2017 Malaysian
Univers
ity of
Mala
ya
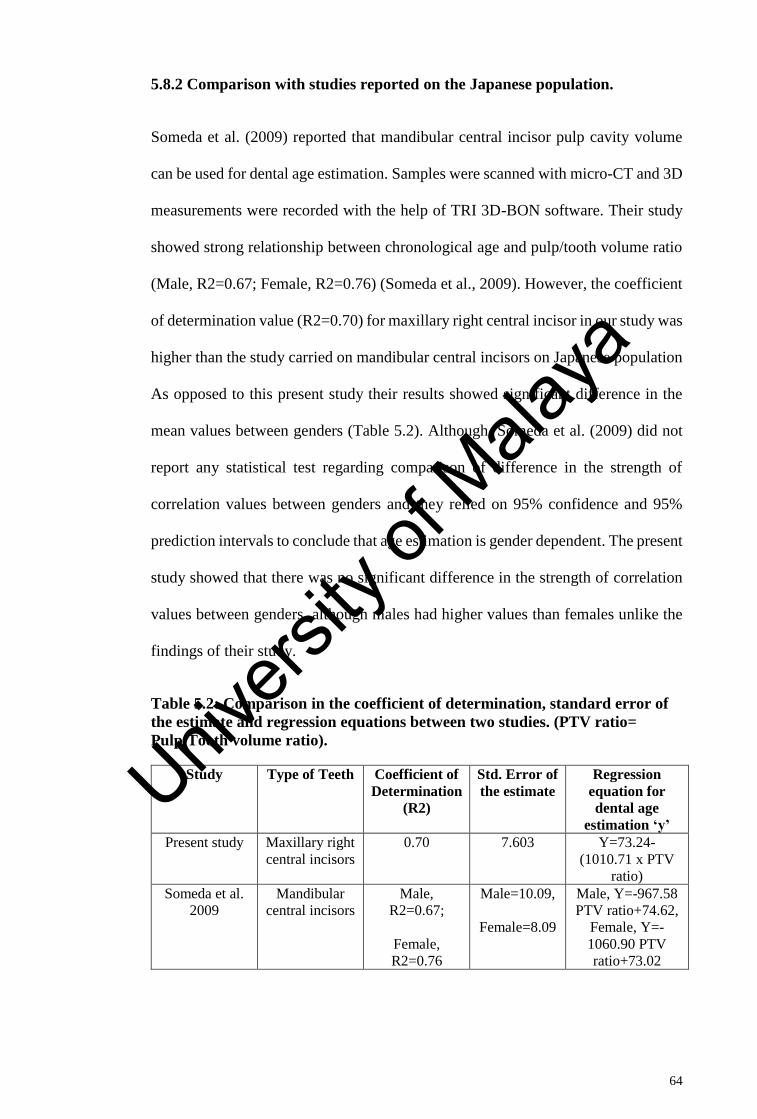
64
5.8.2 Comparison with studies reported on the Japanese population.
Someda et al. (2009) reported that mandibular central incisor pulp cavity volume
can be used for dental age estimation. Samples were scanned with micro-CT and 3D
measurements were recorded with the help of TRI 3D-BON software. Their study
showed strong relationship between chronological age and pulp/tooth volume ratio
(Male, R2=0.67; Female, R2=0.76) (Someda et al., 2009). However, the coefficient
of determination value (R2=0.70) for maxillary right central incisor in our study was
higher than the study carried on mandibular central incisors on Japanese population
As opposed to this present study their results showed significant difference in the
mean values between genders (Table 5.2). Although, Someda et al. (2009) did not
report any statistical test regarding comparison of difference in the strength of
correlation values between genders and they relied on 95% confidence and 95%
prediction intervals to conclude that age estimation is gender dependent. The present
study showed that there was no significant difference in the strength of correlation
values between genders, although males had higher values than females unlike the
findings of their study.
Table 5.2: Comparison in the coefficient of determination, standard error of
the estimate and regression equations between two studies. (PTV ratio=
Pulp/Tooth volume ratio).
Study Type of Teeth Coefficient of
Determination
(R2)
Std. Error of
the estimate Regression
equation for
dental age
estimation ‘y’ Present study Maxillary right
central incisors 0.70 7.603 Y=73.24-
(1010.71 x PTV
ratio) Someda et al.
2009 Mandibular
central incisors Male,
R2=0.67;
Female,
R2=0.76
Male=10.09,
Female=8.09
Male, Y=-967.58
PTV ratio+74.62,
Female, Y=-
1060.90 PTV
ratio+73.02
Univers
ity of
Mala
ya
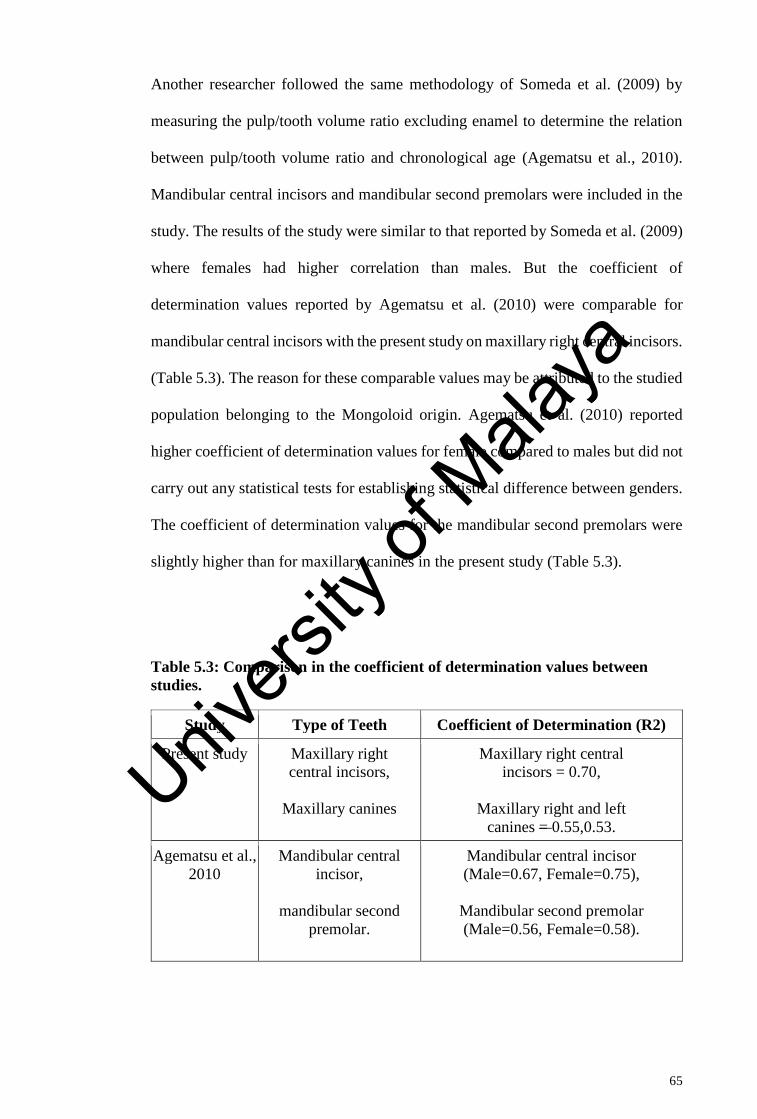
65
Another researcher followed the same methodology of Someda et al. (2009) by
measuring the pulp/tooth volume ratio excluding enamel to determine the relation
between pulp/tooth volume ratio and chronological age (Agematsu et al., 2010).
Mandibular central incisors and mandibular second premolars were included in the
study. The results of the study were similar to that reported by Someda et al. (2009)
where females had higher correlation than males. But the coefficient of
determination values reported by Agematsu et al. (2010) were comparable for
mandibular central incisors with the present study on maxillary right central incisors.
(Table 5.3). The reason for these comparable values may be attributed to the studied
population belonging to the Mongoloid origin. Agematsu et al. (2010) reported
higher coefficient of determination values for female compared to males but did not
carry out any statistical tests for establishing statistical difference between genders.
The coefficient of determination values for the mandibular second premolars were
slightly higher than for maxillary canines in the present study (Table 5.3).
Table 5.3: Comparison in the coefficient of determination values between
studies.
Study Type of Teeth Coefficient of Determination (R2)
Present study Maxillary right
central incisors,
Maxillary canines
Maxillary right central
incisors = 0.70,
Maxillary right and left
canines = 0.55,0.53.
Agematsu et al.,
2010
Mandibular central
incisor,
mandibular second
premolar.
Mandibular central incisor
(Male=0.67, Female=0.75),
Mandibular second premolar
(Male=0.56, Female=0.58).
Univers
ity of
Mala
ya
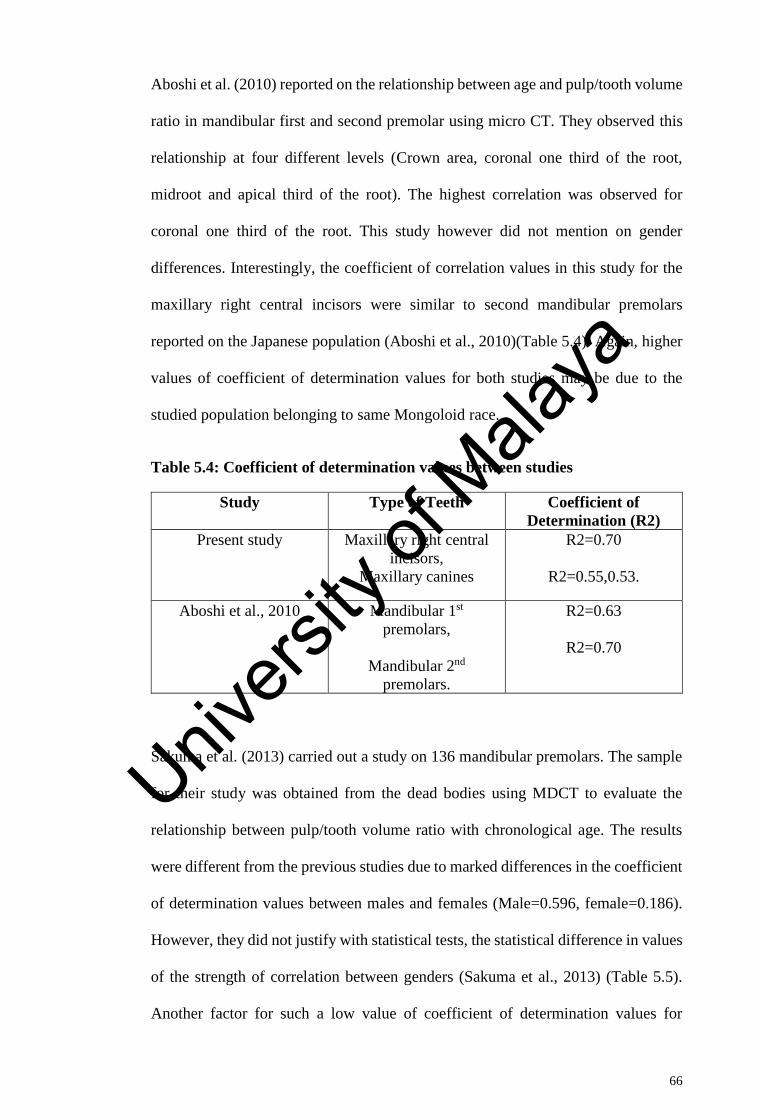
66
Aboshi et al. (2010) reported on the relationship between age and pulp/tooth volume
ratio in mandibular first and second premolar using micro CT. They observed this
relationship at four different levels (Crown area, coronal one third of the root,
midroot and apical third of the root). The highest correlation was observed for
coronal one third of the root. This study however did not mention on gender
differences. Interestingly, the coefficient of correlation values in this study for the
maxillary right central incisors were similar to second mandibular premolars
reported on the Japanese population (Aboshi et al., 2010)(Table 5.4). Again, higher
values of coefficient of determination values for both studies may be due to the
studied population belonging to same Mongoloid race.
Table 5.4: Coefficient of determination values between studies
Study Type of Teeth Coefficient of
Determination (R2)
Present study Maxillary right central
incisors,
Maxillary canines
R2=0.70
R2=0.55,0.53.
Aboshi et al., 2010 Mandibular 1st
premolars,
Mandibular 2nd
premolars.
R2=0.63
R2=0.70
Sakuma et al. (2013) carried out a study on 136 mandibular premolars. The sample
for their study was obtained from the dead bodies using MDCT to evaluate the
relationship between pulp/tooth volume ratio with chronological age. The results
were different from the previous studies due to marked differences in the coefficient
of determination values between males and females (Male=0.596, female=0.186).
However, they did not justify with statistical tests, the statistical difference in values
of the strength of correlation between genders (Sakuma et al., 2013) (Table 5.5).
Another factor for such a low value of coefficient of determination values for
Univers
ity of
Mala
ya
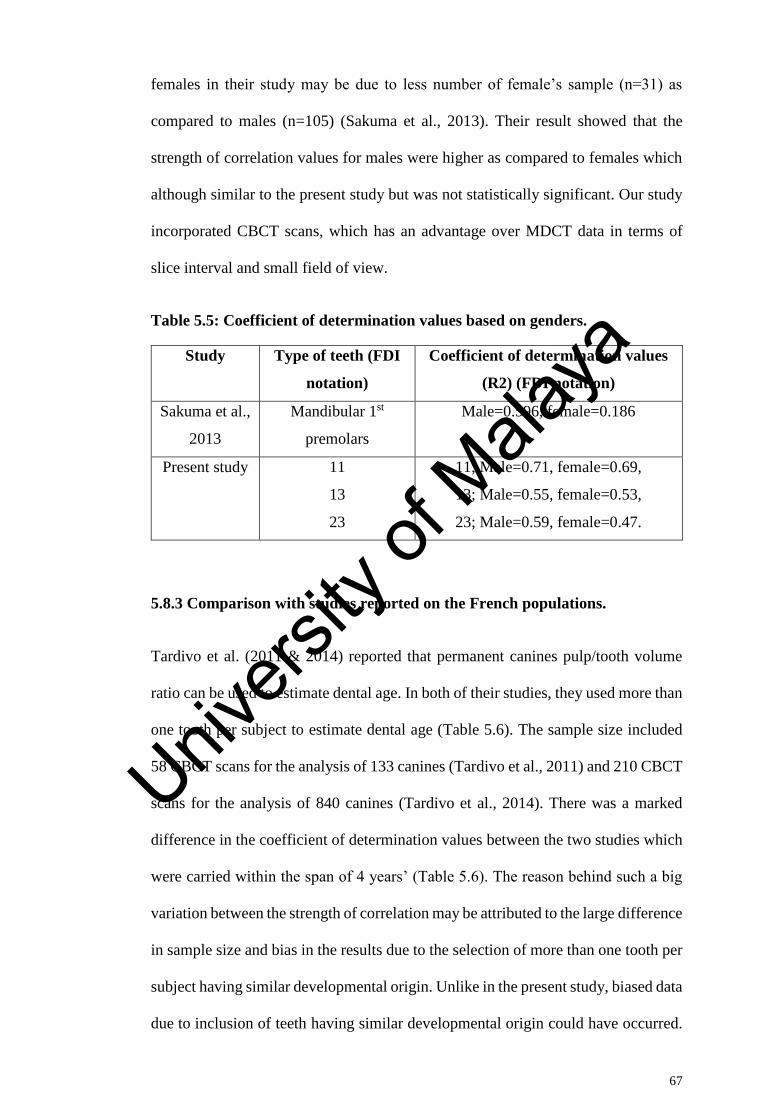
67
females in their study may be due to less number of female’s sample (n=31) as
compared to males (n=105) (Sakuma et al., 2013). Their result showed that the
strength of correlation values for males were higher as compared to females which
although similar to the present study but was not statistically significant. Our study
incorporated CBCT scans, which has an advantage over MDCT data in terms of
slice interval and small field of view.
Table 5.5: Coefficient of determination values based on genders.
Study Type of teeth (FDI
notation)
Coefficient of determination values
(R2) (FDI notation)
Sakuma et al.,
2013
Mandibular 1st
premolars
Male=0.596, female=0.186
Present study 11
13
23
11; Male=0.71, female=0.69,
13; Male=0.55, female=0.53,
23; Male=0.59, female=0.47.
5.8.3 Comparison with studies reported on the French populations.
Tardivo et al. (2011 & 2014) reported that permanent canines pulp/tooth volume
ratio can be used to estimate dental age. In both of their studies, they used more than
one tooth per subject to estimate dental age (Table 5.6). The sample size included
58 CBCT scans for the analysis of 133 canines (Tardivo et al., 2011) and 210 CBCT
scans for the analysis of 840 canines (Tardivo et al., 2014). There was a marked
difference in the coefficient of determination values between the two studies which
were carried within the span of 4 years’ (Table 5.6). The reason behind such a big
variation between the strength of correlation may be attributed to the large difference
in sample size and bias in the results due to the selection of more than one tooth per
subject having similar developmental origin. Unlike in the present study, biased data
due to inclusion of teeth having similar developmental origin could have occurred.
Univers
ity of
Mala
ya
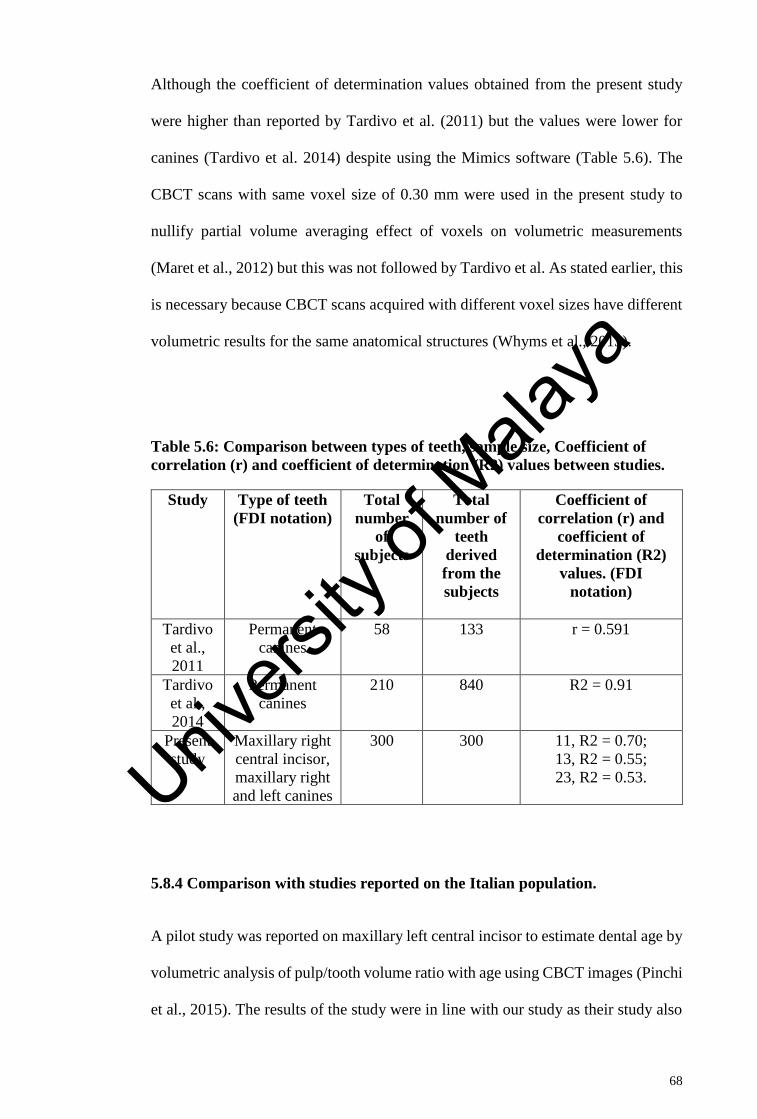
68
Although the coefficient of determination values obtained from the present study
were higher than reported by Tardivo et al. (2011) but the values were lower for
canines (Tardivo et al. 2014) despite using the Mimics software (Table 5.6). The
CBCT scans with same voxel size of 0.30 mm were used in the present study to
nullify partial volume averaging effect of voxels on volumetric measurements
(Maret et al., 2012) but this was not followed by Tardivo et al. As stated earlier, this
is necessary because CBCT scans acquired with different voxel sizes have different
volumetric results for the same anatomical structures (Whyms et al., 2013).
Table 5.6: Comparison between types of teeth, sample size, Coefficient of
correlation (r) and coefficient of determination (R2) values between studies.
Study Type of teeth
(FDI notation)
Total
number
of
subjects
Total
number of
teeth
derived
from the
subjects
Coefficient of
correlation (r) and
coefficient of
determination (R2)
values. (FDI
notation)
Tardivo
et al.,
2011
Permanent
canines
58 133 r = 0.591
Tardivo
et al.,
2014
Permanent
canines
210 840 R2 = 0.91
Present
study
Maxillary right
central incisor,
maxillary right
and left canines
300
300 11, R2 = 0.70;
13, R2 = 0.55;
23, R2 = 0.53.
5.8.4 Comparison with studies reported on the Italian population.
A pilot study was reported on maxillary left central incisor to estimate dental age by
volumetric analysis of pulp/tooth volume ratio with age using CBCT images (Pinchi
et al., 2015). The results of the study were in line with our study as their study also
Univers
ity of
Mala
ya
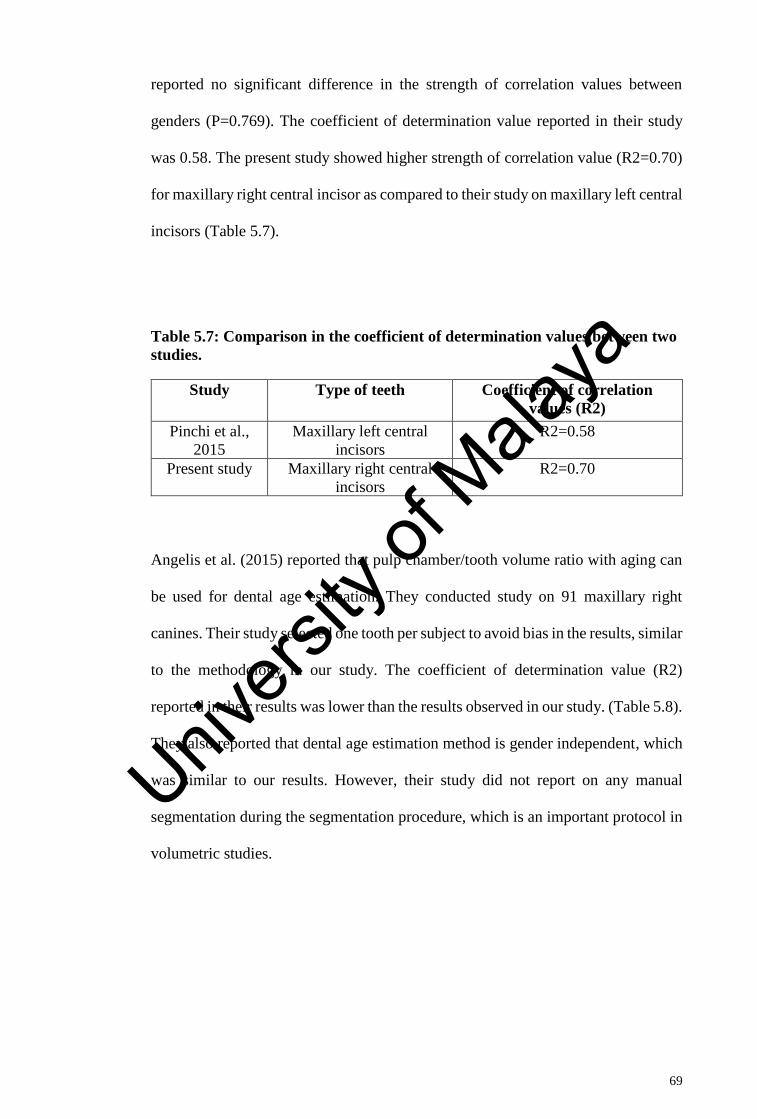
69
reported no significant difference in the strength of correlation values between
genders (P=0.769). The coefficient of determination value reported in their study
was 0.58. The present study showed higher strength of correlation value (R2=0.70)
for maxillary right central incisor as compared to their study on maxillary left central
incisors (Table 5.7).
Table 5.7: Comparison in the coefficient of determination values between two
studies.
Study Type of teeth Coefficient of correlation
values (R2)
Pinchi et al.,
2015
Maxillary left central
incisors
R2=0.58
Present study Maxillary right central
incisors
R2=0.70
Angelis et al. (2015) reported that pulp chamber/tooth volume ratio with aging can
be used for dental age estimation. They conducted study on 91 maxillary right
canines. Their study selected one tooth per subject to avoid bias in the results, similar
to the methodology in our study. The coefficient of determination value (R2)
reported in their results was lower than the results observed in our study. (Table 5.8).
They also reported that dental age estimation method is gender independent, which
was similar to our results. However, their study did not report on any manual
segmentation during the segmentation procedure, which is an important protocol in
volumetric studies.
Univers
ity of
Mala
ya
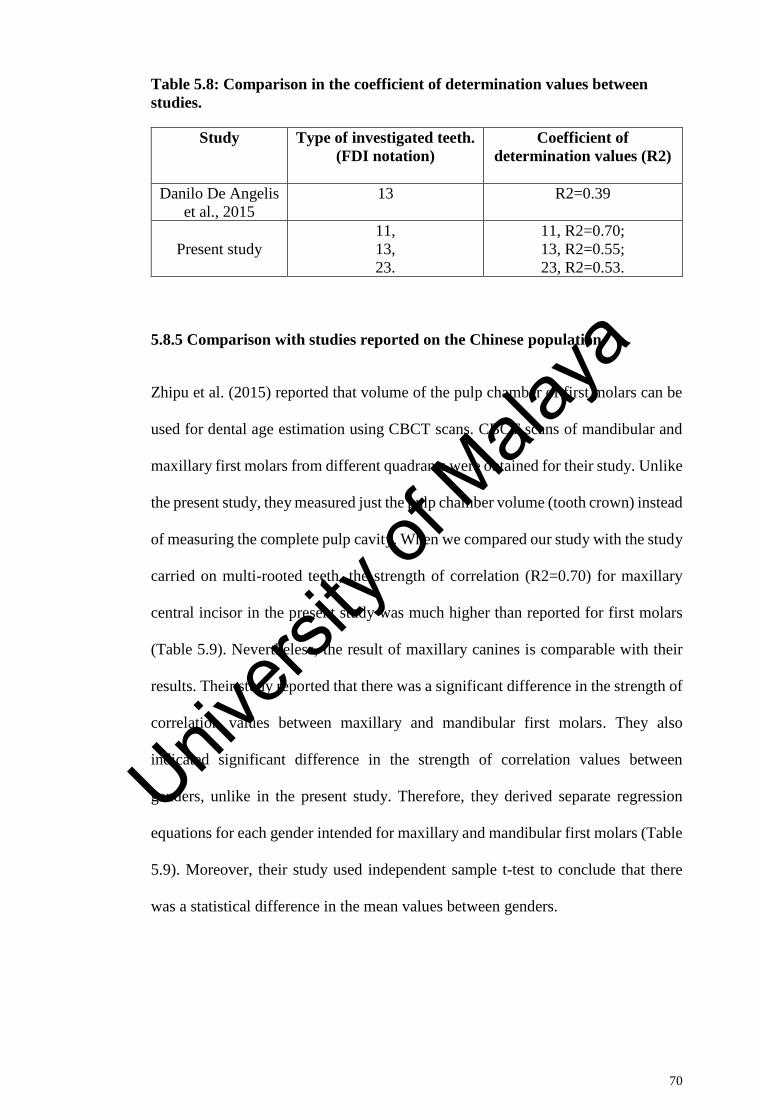
70
Table 5.8: Comparison in the coefficient of determination values between
studies.
Study Type of investigated teeth.
(FDI notation)
Coefficient of
determination values (R2)
Danilo De Angelis
et al., 2015
13 R2=0.39
Present study
11,
13,
23.
11, R2=0.70;
13, R2=0.55;
23, R2=0.53.
5.8.5 Comparison with studies reported on the Chinese population.
Zhipu et al. (2015) reported that volume of the pulp chamber of first molars can be
used for dental age estimation using CBCT scans. CBCT scans of mandibular and
maxillary first molars from different quadrants were obtained for their study. Unlike
the present study, they measured just the pulp chamber volume (tooth crown) instead
of measuring the complete pulp cavity. When we compared our study with the study
carried on multi-rooted teeth, the strength of correlation (R2=0.70) for maxillary
central incisor in the present study was much higher than reported for first molars
(Table 5.9). Nevertheless, the result of maxillary canines is comparable with their
results. Their study reported that there was a significant difference in the strength of
correlation values between maxillary and mandibular first molars. They also
indicated significant difference in the strength of correlation values between
genders, unlike in the present study. Therefore, they derived separate regression
equations for each gender intended for maxillary and mandibular first molars (Table
5.9). Moreover, their study used independent sample t-test to conclude that there
was a statistical difference in the mean values between genders.
Univers
ity of
Mala
ya
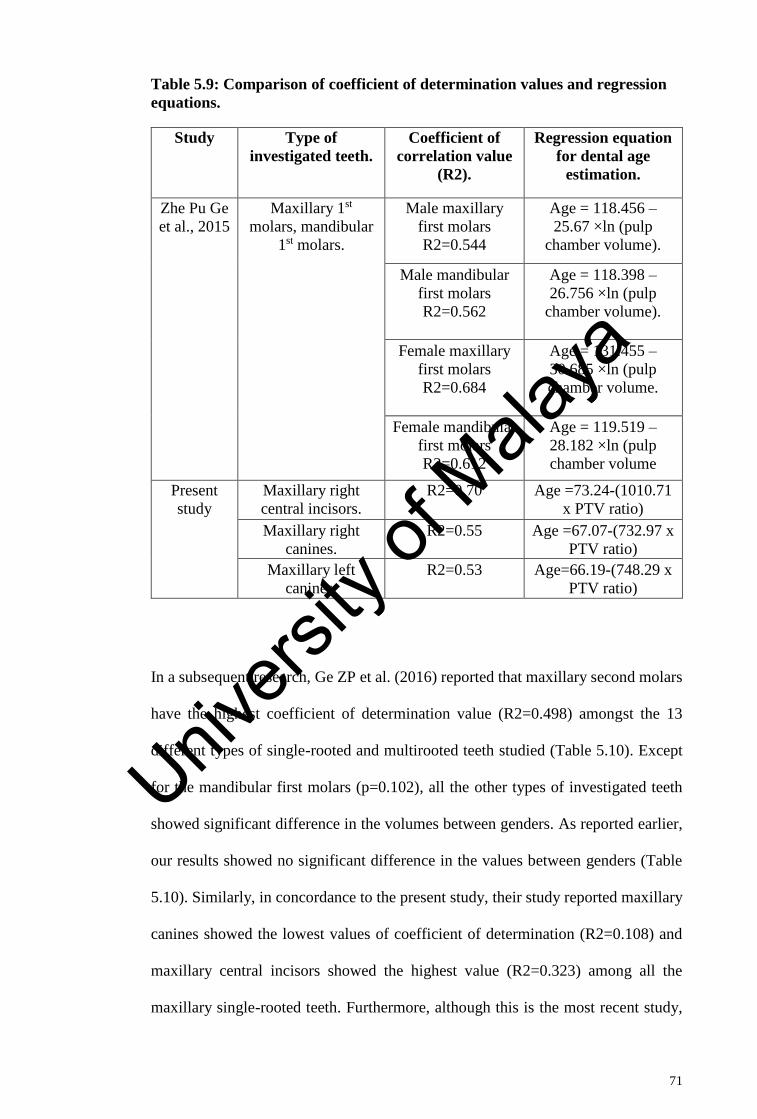
71
Table 5.9: Comparison of coefficient of determination values and regression
equations.
Study Type of
investigated teeth.
Coefficient of
correlation value
(R2).
Regression equation
for dental age
estimation.
Zhe Pu Ge
et al., 2015
Maxillary 1st
molars, mandibular
1st molars.
Male maxillary
first molars
R2=0.544
Age = 118.456 –
25.67 ×ln (pulp
chamber volume).
Male mandibular
first molars
R2=0.562
Age = 118.398 –
26.756 ×ln (pulp
chamber volume).
Female maxillary
first molars
R2=0.684
Age = 131.455 –
30.685 ×ln (pulp
chamber volume.
Female mandibular
first molars
R2=0.612
Age = 119.519 –
28.182 ×ln (pulp
chamber volume
Present
study
Maxillary right
central incisors.
R2=0.70 Age =73.24-(1010.71
x PTV ratio)
Maxillary right
canines.
R2=0.55 Age =67.07-(732.97 x
PTV ratio)
Maxillary left
canines.
R2=0.53 Age=66.19-(748.29 x
PTV ratio)
In a subsequent research, Ge ZP et al. (2016) reported that maxillary second molars
have the highest coefficient of determination value (R2=0.498) amongst the 13
different types of single-rooted and multirooted teeth studied (Table 5.10). Except
for the mandibular first molars (p=0.102), all the other types of investigated teeth
showed significant difference in the volumes between genders. As reported earlier,
our results showed no significant difference in the values between genders (Table
5.10). Similarly, in concordance to the present study, their study reported maxillary
canines showed the lowest values of coefficient of determination (R2=0.108) and
maxillary central incisors showed the highest value (R2=0.323) among all the
maxillary single-rooted teeth. Furthermore, although this is the most recent study,
Univers
ity of
Mala
ya
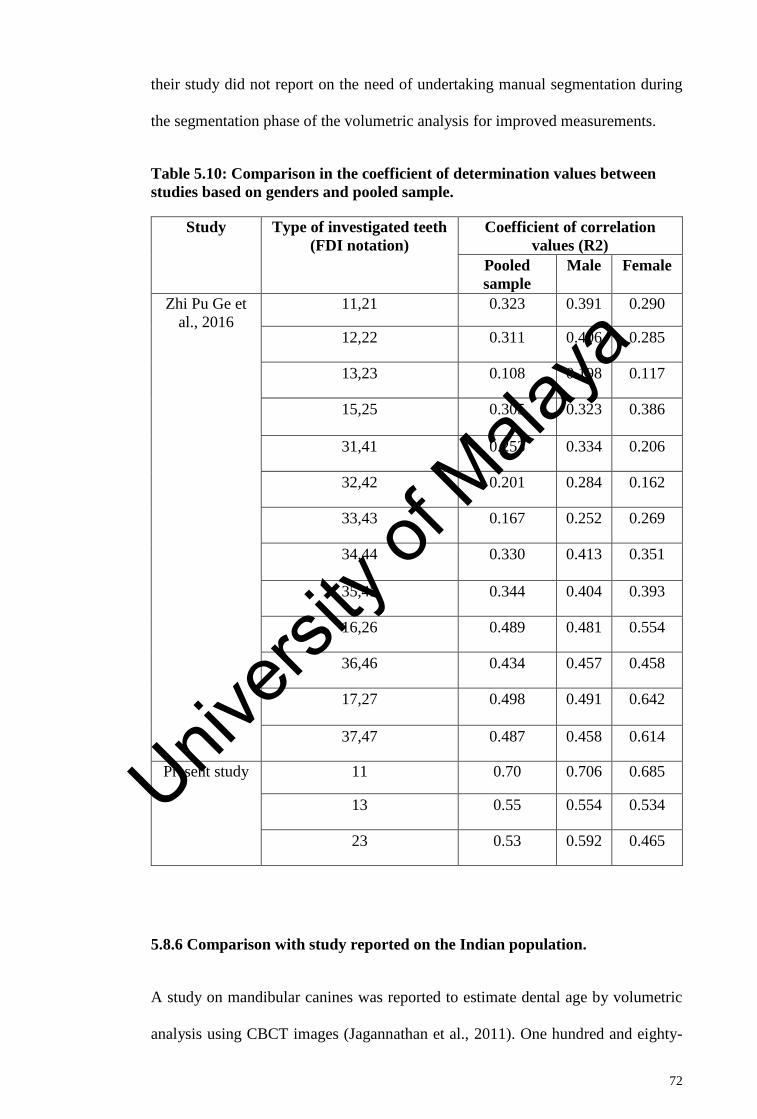
72
their study did not report on the need of undertaking manual segmentation during
the segmentation phase of the volumetric analysis for improved measurements.
Table 5.10: Comparison in the coefficient of determination values between
studies based on genders and pooled sample.
Study Type of investigated teeth
(FDI notation)
Coefficient of correlation
values (R2)
Pooled
sample
Male Female
Zhi Pu Ge et
al., 2016
11,21 0.323 0.391 0.290
12,22 0.311 0.406 0.285
13,23 0.108 0.198 0.117
15,25 0.305 0.323 0.386
31,41 0.253 0.334 0.206
32,42 0.201 0.284 0.162
33,43 0.167 0.252 0.269
34,44 0.330 0.413 0.351
35,45 0.344 0.404 0.393
16,26 0.489 0.481 0.554
36,46 0.434 0.457 0.458
17,27 0.498 0.491 0.642
37,47 0.487 0.458 0.614
Present study 11 0.70 0.706 0.685
13 0.55 0.554 0.534
23 0.53 0.592 0.465
5.8.6 Comparison with study reported on the Indian population.
A study on mandibular canines was reported to estimate dental age by volumetric
analysis using CBCT images (Jagannathan et al., 2011). One hundred and eighty-
Univers
ity of
Mala
ya
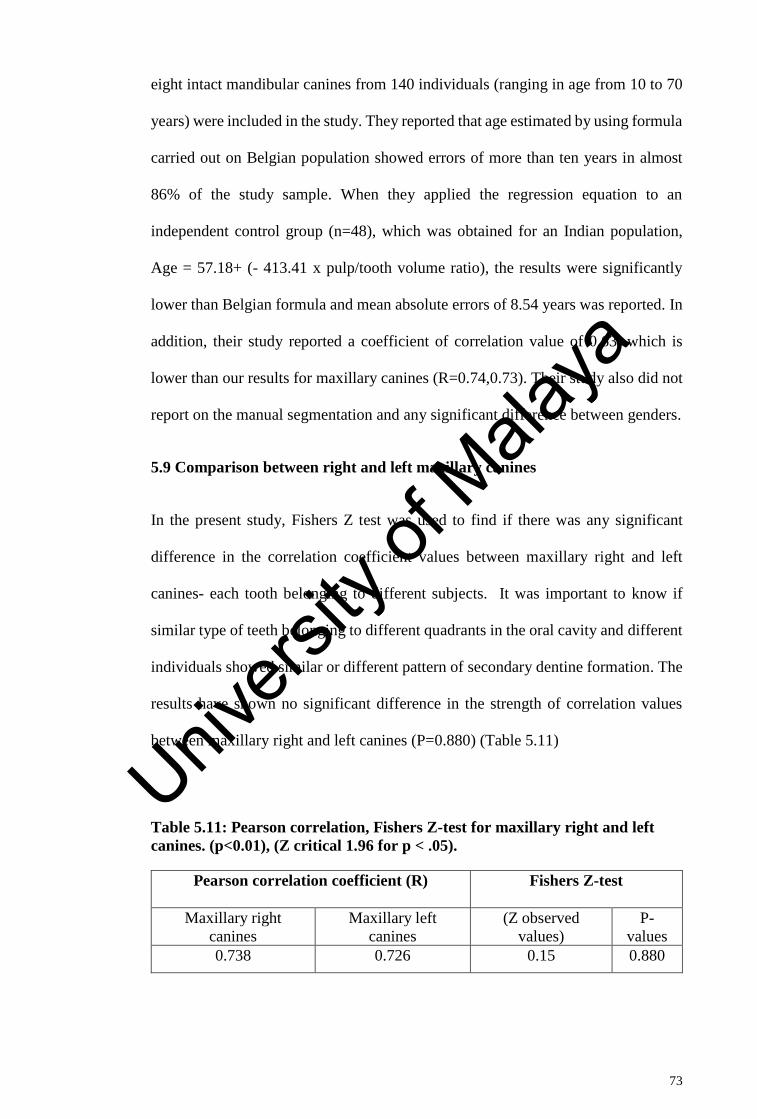
73
eight intact mandibular canines from 140 individuals (ranging in age from 10 to 70
years) were included in the study. They reported that age estimated by using formula
carried out on Belgian population showed errors of more than ten years in almost
86% of the study sample. When they applied the regression equation to an
independent control group (n=48), which was obtained for an Indian population,
Age = 57.18+ (- 413.41 x pulp/tooth volume ratio), the results were significantly
lower than Belgian formula and mean absolute errors of 8.54 years was reported. In
addition, their study reported a coefficient of correlation value of 0.63, which is
lower than our results for maxillary canines (R=0.74,0.73). Their study also did not
report on the manual segmentation and any significant difference between genders.
5.9 Comparison between right and left maxillary canines
In the present study, Fishers Z test was used to find if there was any significant
difference in the correlation coefficient values between maxillary right and left
canines- each tooth belonging to different subjects. It was important to know if
similar type of teeth belonging to different quadrants in the oral cavity and different
individuals showed similar or different pattern of secondary dentine formation. The
results have shown no significant difference in the strength of correlation values
between maxillary right and left canines (P=0.880) (Table 5.11)
Table 5.11: Pearson correlation, Fishers Z-test for maxillary right and left
canines. (p<0.01), (Z critical 1.96 for p < .05).
Pearson correlation coefficient (R) Fishers Z-test
Maxillary right
canines
Maxillary left
canines
(Z observed
values)
P-
values
0.738 0.726 0.15 0.880
Univers
ity of
Mala
ya
74
5.10 Limitations of the study
It must be borne in mind that following are some of the limitations involved in this
study. This study does not involve direct contact of the researcher with the patients
rather inclusion of the sample is from CBCT data stored in the Oral and
maxillofacial Imaging Division, Faculty of Dentistry University of Malaya. Thus,
the exclusion of any pathology associated with the investigated tooth is ruled out
merely by observing the CBCT scans. This process of sample selection may miss
some of the pathologies or previous traumatic history associated with the
investigated tooth, which cannot be detected on CBCT images alone.
The segmentation procedure in this study involved some minor manual
interventions. In the apical portion of the root and pulp tissue, the software was not
able to automatically detect the minute structural demarcations. Areas of the pulp
cavity and calcified tooth structures, which were not automatically selected by the
software were manually checked and edited in the required area in ‘multiple slice
editing phase’ of the software. In future with advancements in the CBCT technology
and improvement of image enhancing software’s, this phase of the ‘segmentation
and multiple slice editing’ can be improved which can lead to less manual
interventions and minimal chances of human error in the methodology.
Univers
ity of
Mala
ya
75
CHAPTER 6: CONCLUSION
6.1 Introduction
The study investigated the relationship between the secondary dentine formation
with age, to derive a regression equation for dental age estimation. Following are
the conclusions, clinical applications of the study and recommendations for future
studies.
6.2 Research outcomes
(1) The results indicated a strong relationship between chronological age and
pulp/tooth volume ratio for all the 3 types of investigated teeth in the study. Thus,
secondary dentine formation with age is the valuable indicator for dental age
estimation in Malaysian population.
(2) Among all the 3 types of investigated teeth maxillary right central incisor has
shown the strongest coefficient of determination value as compared to maxillary
canines.
(3) This method of dental age estimation is gender independent as there was no
statistically significant difference in the coefficient of correlation values between
genders.
(4) There was no statistically significant difference in strength of correlation
between chronological age and pulp/tooth volume ratio for maxillary canines
belonging to different subjects and quadrants.
Univers
ity of
Mala
ya
76
6.3 Clinical applications
(1) Results of the present study clearly showed the difference in the strength of
correlation values for Malaysian adults as compared to the previous studies carried
on other populations. Thus, the regression equation for dental age estimation derived
from this study can be used specifically for Malaysian adults with greater accuracy
and precision.
(2) This method of dental age estimation can be helpful in the implementation of
laws in the legal justice system in Malaysia. e.g. According to Criminal Procedure
Code 1976, corporal punishment by caning is lawful as a sentence for serious crimes
in Malaysia (“Laws of Malaysia”, 1976). However, caning is spared for convicted
females and also males above 50 years. Therefore, this method of age estimation
may become useful in future for those sentenced persons who are indeed above 50
years and their age cannot be verified with any legal documents.
(3) This method of dental age estimation can be used in mass disasters (earthquakes,
tsunami’s, aviation disasters) for dental age estimation and identification of
unidentified remains of the deceased. Dental identification is inexpensive, but this
technique of age estimation takes about 3 to 4 hours for the volumetric analysis of
each tooth.
(4) X-ray beam limitation, rapid scan time, dose reduction and accuracy of the
CBCT images are the features of the CBCT technology, which makes this method
of dental age estimation more favourable for clinical application as compared to
other invasive modalities (Patcas et al., 2012; Scarfe et al., 2008). The volume of
the CBCT data can be reoriented according to the patient’s anatomical features
because it is acquired with voxel resolutions that are isotropic. Images from CBCT
Univers
ity of
Mala
ya
77
data can also be further enhanced with MIMICS (Materialise Interactive Medical
Image Control System) software, as performed in this study.
6.4 Recommendations for further research
(1) Another pulp/tooth volume ratio study on a new set of samples should be
performed by applying the regression equation derived from the present study. This
will ascertain if the dental age estimation corresponds to the chronological age of
the individual or further modifications of the equation is necessary for the Malaysian
population. Furthermore, the results can be compared with the previous studies
carried out on other populations around the world to determine if the results are
similar or if the variations are large.
(2) Studies can also be carried out using the same pulp/tooth volume ratio technique
to determine juvenile verses adults dental age in legal circumstances (eighteen years
old being the threshold).
(3) Future studies can be performed using the same method involving different types
of single-rooted and multi-rooted teeth to analyse which tooth in the oral cavity is
showing the highest strength of correlation between chronological age and
pulp/tooth volume ratio among Malaysian population.
(4) With regards to the segmentation procedure in this study, it required some minor
manual interventions. At the apical portion of the root and pulp tissue, the software
was not able to detect minute structural demarcations. It took approximately 3 to 4
hours during ‘multiple slice editing phase’. This protocol may need to be improved
with further advancements in the MIMICS software technology.
(5) To overcome limitation of the present software not being able to detect the
minute structural details, future studies can be conducted to investigate only the pulp
Univers
ity of
Mala
ya

78
chamber volumes rather than including the root canal too. This can further improve
the accuracy in the measurements and results as manual interventions is not
necessary.
Univers
ity of
Mala
ya
79
REFERENCES
3D Medical Image Processing Software; Materialise Mimics. (2016). Retrieved
from http://materialise.com/en/medical/software/mimics.
Aboshi, H., Takahashi, T., & Komuro, T. (2010). Age estimation using microfocus
X-ray computed tomography of lower premolars. Forensic Science
International, 200: 35-40.
Abu Asab, S., Noor, S. N., & Khamis, M. F. (2011). The accuracy of demirjian
method in dental age estimation of malay children. Singapore Dental
Journal, 32: 19-27.
Agematsu, H., Someda, H., Hashimoto, M., Matsunaga, S., Abe, S., Kim, H. J., et
al. (2010). Three-dimensional observation of decrease in pulp cavity volume
using micro-CT: age-related change. The Bulletin of Tokyo Dental College,
51: 1-6.
Ahmad, M., Jenny, J., & Downie, M. (2012). Application of cone beam computed
tomography in oral and maxillofacial surgery. Australian Dental Journal,
57: 82-94.
Alqahtani, S. J., Hector, M. P., & Liversidge, H. M. (2010). Brief communication:
The London atlas of human tooth development and eruption. American
Journal of Physical Anthropology, 142: 481-490.
Amoedo, O. (1898). Dentistry in Forensic Medicine. Masson Co. Paris.
Arora, J., Talwar, I., Sahni, D., & Rattan, V. (2016). Secondary dentine as a sole
parameter for age estimation: Comparison and reliability of qualitative and
quantitative methods among North Western adult Indians. Egyptian Journal
of Forensic Sciences, 6: 170-178.
Bang, G., & Ramm, E. (1970). Determination of age in humans from root dentin
transparency. Acta Odontologica Scandinavica, 28: 3-35.
Blenkin, M. R., & Evans, W. (2010). Age estimation from the teeth using a modified
Demirjian system. Journal of Forensic Sciences, 55: 1504-1508.
Bolanos, M. V., Moussa, H., Manrique, M. C., & Bolanos, M. J. (2003).
Radiographic evaluation of third molar development in Spanish children and
young people. Forensic Science International, 133: 212-219.
Univers
ity of
Mala
ya
80
Bosmans, N., Ann, P., Aly, M., & Willems, G. (2005). The application of Kvaal's
dental age calculation technique on panoramic dental radiographs. Forensic
Science International, 153: 208-212.
Cameriere, R., Ferrante, L., Belcastro, M. G., Bonfiglioli, B., Rastelli, E., &
Cingolani, M. (2007). Age estimation by pulp/tooth ratio in canines by peri-
apical X-rays. Journal of Forensic Sciences, 52: 166-170.
Campbell, J. M. (1963). Dentistry then Now. Pickering and Inglis, Ltd. Glasgow.
Cesário C, S. R., Pestana D, Pereira CP. (2016). Medico-Legal Age Estimation in a
Sub-adult Portuguese Population: Validation of Atlas Schour and Massler
and London. Journal of Civil and Legal Sciences, 5: 196.
Chaillet, N., Willems, G., & Demirjian, A. (2004). Dental maturity in Belgian
children using Demirjian's method and polynomial functions: new standard
curves for forensic and clinical use. Journal of Forensic Odonto-
stomatology, 22: 18-27.
Charangowda, B. K. (2010). Dental records: An overview. Journal of Forensic
Dental Sciences, 2: 5-10.
Chun, K. J., Choi, H. H., & Lee, J. Y. (2014). Comparison of mechanical property
and role between enamel and dentin in the human teeth. Journal of Dental
Biomechanics, 5: 1758736014520809.
Churchill, J. M. (1905). The Late A. S. Taylor's Manuel;. F. J. Smith Ed. 5th ed.
London.
Cotton, T. P., Geisler, T. M., Holden, D. T., Schwartz, S. A., & Schindler, W. G.
(2007). Endodontic applications of cone-beam volumetric tomography.
Journal of endodontics, 33: 1121-1132.
Dalitz, G. D. (1963). Age determination of adult human remains by teeth
examination. Journal of Forensic Sciences, 3: 11-21.
Dawood, A., Patel, S., & Brown, J. (2009). Cone beam CT in dental practice. British
Dental Journal, 207: 23-28.
De Angelis, D., Gaudio, D., Guercini, N., Cipriani, F., Gibelli, D., Caputi, S., et al.
(2015). Age estimation from canine volumes. La Radiologia Medica, 120:
731-736.
Univers
ity of
Mala
ya
81
Demirjian, A., Goldstein, H., & Tanner, J. M. (1973). A new system of dental age
assessment. Human Biology, 45: 211-227.
Eshitha, E., Prasanna, K. R., Laxmikanth, C., Prashanth, S., Veena, K. M., Rachana,
V. P., et al. (2014). Dental Age Estimation Using Schour and Massler
Method in South Indian Children. Scholars Journal of Applied Medical
Sciences, 2: 1669-1674.
Faul, F., Erdfelder, E., Buchner, A., & Lang, A.-G. (2009). Statistical power
analyses using G*Power 3.1: Tests for correlation and regression analyses.
Behavior Research Methods, 41: 1149-1160.
Fereira, J. L., Fereira, A. E., & Ortega, A. I. (2008). Methods for the analysis of hard
dental tissues exposed to high temperatures. Forensic Science International,
178: 119-124.
Fisher, R. A. (1921). On the probable error of a coefficient of correlation deduced
from a small sample. Metron, 1: 3-32.
Ge, Z. P., Ma, R. H., Li, G., Zhang, J. Z., & Ma, X. C. (2015). Age estimation based
on pulp chamber volume of first molars from cone-beam computed
tomography images. Forensic Science International, 253: 133.e131-137.
Ge, Z. P., Yang, P., Li, G., Zhang, J. Z., & Ma, X. C. (2016). Age estimation based
on pulp cavity/chamber volume of 13 types of tooth from cone beam
computed tomography images. International Journal of Legal Medicine,
130: 1159-1167.
Gustafson, G. (1950). Age determination on teeth. Journal of the American Dental
Association, 41: 45-54.
Haney, E., Gansky, S. A., Lee, J. S., Johnson, E., Maki, K., Miller, A. J., et al.
(2010). Comparative analysis of traditional radiographs and cone-beam
computed tomography volumetric images in the diagnosis and treatment
planning of maxillary impacted canines. American Journal of Orthodontics
and Dentofacial Orthopedics, 137: 590-597.
Harris, E. F., & Buck, A. L. (2002). Tooth mineralisation: A technical note on the
Moorrees- Fanning-Hunt standards. Dental Anthropology, 16: 15-20.
IBM, C. (2011). IBM SPSS Statistics for Windows (Version 20.0). Armonk, NY:
IBM Corp.Retrieved om URL
Univers
ity of
Mala
ya
82
Jagannathan, N., Neelakantan, P., Thiruvengadam, C., Ramani, P., Premkumar, P.,
Natesan, A., et al. (2011). Age estimation in an Indian population using
pulp/tooth volume ratio of mandibular canines obtained from cone beam
computed tomography. The Journal of Forensic Odonto-stomatology, 29: 1-
6.
James, H. (2005). Thai tsunami victim identification overview to date. The Journal
of Forensic Odonto-stomatology, 23: 1-18.
Johan, N. A., Khamis, M. F., Abdul Jamal, N. S., Ahmad, B., & Mahanani, E. S.
(2012). The variability of lower third molar development in Northeast
Malaysian population with application to age estimation. The Journal of
Forensic Odonto-stomatology, 30: 45-54.
Johanson, G. (1971). Age determination from human teeth. Odontologisk Revy, 22:
1-126.
Kahl, B., & Schwarze, C. W. (1988). [Updating of the dentition tables of I. Schour
and M. Massler of 1941]. Fortschritte der Kieferorthopadie, 49: 432-443.
Kamburoglu, K., Ilker Cebeci, A. R., & Grondahl, H. G. (2009). Effectiveness of
limited cone-beam computed tomography in the detection of horizontal root
fracture. Dental traumatology, 25: 256-261.
Kim, Y. K., Kho, H. S., & Lee, K. H. (2000). Age estimation by occlusal tooth wear.
Journal of Forensic Sciences, 45: 303-309.
Koh, K. K., Tan, J. S., Nambiar, P., Ibrahim, N., Mutalik, S., & Khan Asif, M.
(2017). Age estimation from structural changes of teeth and buccal alveolar
bone level. Journal of Forensic and Legal Medicine, 48: 15-21.
Koshy, S., & Tandon, S. (1998). Dental age assessment: the applicability of
Demirjian's method in south Indian children. Forensic Science International,
94: 73-85.
Kraus, B. S., & Jordan, R. E. (1965). The Human Dentition before Birth. Lea and
Febiger. Philadelphia.
Kringsholm, B., Jakobsen, J., Sejrsen, B., & Gregersen, M. (2001). Unidentified
bodies/skulls found in Danish waters in the period 1992-1996. Forensic
Science International, 123: 150-158.
Univers
ity of
Mala
ya
83
Kumar, M., Shanavas, M., Sidappa, A., & Kiran, M. (2015). Cone beam computed
tomography - know its secrets. Journal of International Oral Health, 7: 64-
68.
Kvaal, S. I., Kolltveit, K. M., Thomsen, I. O., & Solheim, T. (1995). Age estimation
of adults from dental radiographs. Forensic Science International, 74: 175-
185.
Lain, R., Griffiths, C., & Hilton, J. M. (2003). Forensic dental and medical response
to the Bali bombing. A personal perspective. The Medical journal of
Australia, 179: 362-365.
Mallar, K. B., Girish, H. C., Murgod, S., & Kumar, B. N. Y. (2015). Age estimation
using annulations in root cementum of human teeth: A comparison between
longitudinal and cross sections. Journal of Oral and Maxillofacial
Pathology, 19: 396-404.
Mani, S. A., Naing, L., John, J., & Samsudin, A. R. (2008). Comparison of two
methods of dental age estimation in 7-15-year-old Malays. International
Journal of Paediatric Dentistry, 18: 380-388.
Maples, W. R. (1978). An improved technique using dental histology for estimation
of adult age. Journal of Forensic Sciences, 23: 764-770.
Maples, W. R., & Rice, P. M. (1979). Some difficulties in the Gustafson dental age
estimations. Journal of Forensic Sciences, 24: 168-172.
Maret, D., Telmon, N., Peters, O. A., Lepage, B., Treil, J., Inglèse, J. M., et al.
(2012). Effect of voxel size on the accuracy of 3D reconstructions with cone
beam CT. Dentomaxillofacial Radiology, 41: 649-655.
Marroquin Penaloza, T. Y., Karkhanis, S., Kvaal, S. I., Nurul, F., Kanagasingam,
S., Franklin, D., et al. (2016). Application of the Kvaal method for adult
dental age estimation using Cone Beam Computed Tomography (CBCT).
Journal of Forensic and Legal Medicine, 44: 178-182.
Meinl, A., Tangl, S., Pernicka, E., Fenes, C., & Watzek, G. (2007). On the
applicability of secondary dentin formation to radiological age estimation in
young adults. Journal of Forensic Sciences, 52: 438-441.
Merlati, G., Savlo, C., Danesino, P., Fassina, G., & Menghini, P. (2004). Further
study of restored and un-restored teeth subjected to high temperatures. J
Forensic Odontostomatol, 22: 34-39.
Univers
ity of
Mala
ya
84
Moody, G. H., & Busuttil, A. (1994). Identification in the Lockerbie air disaster.
American Journal of Forensic Medicine & Pathology, 15: 63-69.
Moorrees, C. F. A., Fanning, E. A., & Hunt, E. E. (1963). Age Variation of
Formation Stages for Ten Permanent Teeth. Journal of Dental Research, 42:
1490-1502.
Nambiar, P. (1995). Age estimation using third molar development. Malaysian
Journal of Pathology, 17: 31-34.
Nuzzolese, E., & Di Vella, G. (2008). Forensic dental investigations and age
assessment of asylum seekers. International Dental Journal, 58: 122-126.
Olze, A., Solheim, T., Schulz, R., Kupfer, M., Pfeiffer, H., & Schmeling, A. (2010).
Assessment of the radiographic visibility of the periodontal ligament in the
lower third molars for the purpose of forensic age estimation in living
individuals. International Journal of Legal Medicine, 124: 445-448.
Orhan, K., Ozer, L., Orhan, A. I., Dogan, S., & Paksoy, C. S. (2007). Radiographic
evaluation of third molar development in relation to chronological age
among Turkish children and youth. Forensic Science International, 165: 46-
51.
Paewinsky, E., Pfeiffer, H., & Brinkmann, B. (2005). Quantification of secondary
dentine formation from orthopantomograms--a contribution to forensic age
estimation methods in adults. International Journal of Legal Medicine, 119:
27-30.
Patcas, R., Muller, L., Ullrich, O., Peltomaki, T. (2012). Accuracy of cone-beam
computed tomography at different resolutions assessed on the bony covering
of the mandibular anterior teeth. American journal of orthodontics and
dentofacial orthopedics, 141:41-50.
Phillips, V. M., & van Wyk Kotze, T. J. (2009). Testing standard methods of dental
age estimation by Moorrees, Fanning and Hunt and Demirjian, Goldstein
and Tanner on three South African children samples. J Forensic
Odontostomatol, 27: 20-28.
Pinchi, V., Pradella, F., Buti, J., Baldinotti, C., Focardi, M., & Norelli, G. A. (2015).
A new age estimation procedure based on the 3D CBCT study of the pulp
cavity and hard tissues of the teeth for forensic purposes: A pilot study.
Journal of Forensic and Legal Medicine, 36: 150-157.
Sakuma, A., Saitoh, H., Suzuki, Y., Makino, Y., Inokuchi, G., Hayakawa, M., et al.
(2013). Age estimation based on pulp cavity to tooth volume ratio using
Univers
ity of
Mala
ya
85
postmortem computed tomography images. Journal of Forensic Sciences,
58: 1531-1535.
Sarode, S. C., Zarkar, G. A., Kulkarni, M. A., & Desai, R. (2009). Role of forensic
odontology in the world's major mass disasters: facts and figures. journal of
the South African Dental Association, 64: 388-390, 392-383.
Savio, C., Merlati, G., Danesino, P., Fassina, G., & Menghini, P. (2006).
Radiographic evaluation of teeth subjected to high temperatures:
experimental study to aid identification processes. Forensic Science
International, 158: 108-116.
Scarfe, W. C., Farman, A. G., & Sukovic, P. (2006). Clinical applications of cone-
beam computed tomography in dental practice. Journal (Canadian Dental
Association), 72: 75-80.
Schmeling, A., Olze, A., Reisinger, W., & Geserick, G. (2001). Age estimation of
living people undergoing criminal proceedings. Lancet, 358: 89-90.
Schour, I., & Massler, M. (1940). Studies In Tooth Development: The Growth
Pattern Of Human Teeth Part II. The Journal of the American Dental
Association, 27: 1918-1931.
Shamim, T., Varghese, V. I., Shameena, P. M., & Sudha, S. (2006). Age estimation:
A dental approach. Journal of Punjab Academy of Forensic Medicine &
Toxicology, 6:
Shekhawat, K. S., & Chauhan, A. (2016). Analysis of dental hard tissues exposed to
high temperatures for forensic applications: An in vitro study. Journal of
Forensic Dental Sciences, 8: 90-94.
Solheim, T., & Vonen, A. (2006). Dental age estimation, quality assurance and age
estimation of asylum seekers in Norway. Forensic Science International,
159 Suppl 1: S56-60.
Someda, H., Saka, H., Matsunaga, S., Ide, Y., Nakahara, K., Hirata, S., et al. (2009).
Age estimation based on three-dimensional measurement of mandibular
central incisors in Japanese. Forensic Science International, 185: 110-114.
Star, H., Thevissen, P., Jacobs, R., Fieuws, S., Solheim, T., & Willems, G. (2011).
Human dental age estimation by calculation of pulp-tooth volume ratios
yielded on clinically acquired cone beam computed tomography images of
monoradicular teeth. Journal of Forensic Sciences, 56 S77-82.
Univers
ity of
Mala
ya
86
Tardivo, D., Sastre, J., Catherine, J. H., Leonetti, G., Adalian, P., & Foti, B. (2014).
Age determination of adult individuals by three-dimensional modelling of
canines. International Journal of Legal Medicine, 128: 161-169.
Tardivo, D., Sastre, J., Ruquet, M., Thollon, L., Adalian, P., Leonetti, G., et al.
(2011). Three-dimensional modeling of the various volumes of canines to
determine age and sex: a preliminary study. Journal of Forensic Sciences,
56: 766-770.
Tunc, E. S., & Koyuturk, A. E. (2008). Dental age assessment using Demirjian's
method on northern Turkish children. Forensic Science International, 175:
23-26.
Ubelaker, D. H., & Grant, L. G. (1989). Human skeletal remains: Preservation or
reburial? American Journal of Physical Anthropology, 32: 249-287.
Valenzuela, A., Martin-de las Heras, S., Marques, T., Exposito, N., & Bohoyo, J.
M. (2000). The application of dental methods of identification to human burn
victims in a mass disaster. International Journal of Legal Medicine, 113:
236-239.
van Vlijmen, O. J., Berge, S. J., Swennen, G. R., Bronkhorst, E. M., Katsaros, C., &
Kuijpers-Jagtman, A. M. (2009). Comparison of cephalometric radiographs
obtained from cone-beam computed tomography scans and conventional
radiographs. Journal of Oral and Maxillofacial Surgery, 67: 92-97.
Vandevoort, F. M., Bergmans, L., Van Cleynenbreugel, J., Bielen, D. J.,
Lambrechts, P., Wevers, M., et al. (2004). Age calculation using X-ray
microfocus computed tomographical scanning of teeth: a pilot study.
Journal of Forensic Sciences, 49: 787-790.
Whyms, B. J., Vorperian, H. K., Gentry, L. R., Schimek, E. M., Bersu, E. T., &
Chung, M. K. (2013). The effect of computed tomographic scanner
parameters and 3-dimensional volume rendering techniques on the accuracy
of linear, angular, and volumetric measurements of the mandible. Oral
surgery, oral medicine, oral pathology and oral radiology, 115: 682-691.
Willems, G., Van Olmen, A., Spiessens, B., & Carels, C. (2001). Dental age
estimation in Belgian children: Demirjian's technique revisited. Journal of
Forensic Sciences, 46: 893-895.
Worthington, P., Rubenstein, J., & Hatcher, D. C. (2010). The role of cone-beam
computed tomography in the planning and placement of implants. Journal
of the American Dental Association, 141 Suppl 3: 19s-24s.
Univers
ity of
Mala
ya
87
Yang, F., Jacobs, R., & Willems, G. (2006). Dental age estimation through volume
matching of teeth imaged by cone-beam CT. Forensic Science International,
159 Suppl 1: S78-83.
Ziegler, C. M., Woertche, R., Brief, J., & Hassfeld, S. (2002). Clinical indications
for digital volume tomography in oral and maxillofacial surgery.
Dentomaxillofacial Radiology, 31: 126-130.
Univers
ity of
Mala
ya