malaysian study on cancer survival - moh.gov.my filenational cancer registry national cancer...
TRANSCRIPT

National Cancer RegistryNational Cancer Institute
Malaysian Study OnCANCER SURVIVAL MySCan
MINISTRY OF HEALTH
MOH/P/IKN/04.18 (RR)


National Cancer Registry, NCI Publication No. 4
NATIONAL CANCER REGISTRY DEPARTMENTNational Cancer Institute, Ministry Of Health
Director of National Cancer InstituteDr. Asmayani Khalib
Administrative Assistant Nor Hafizah Mohd Nor
Co-staff Azlina Abdul Aziz, Health Education Officer
Nur Alham Othman, Statistician
Published by:
Head of National Cancer Registry DepartmentDatin Dr. Azizah Ab Manan, Public Health Medicine Specialist
Medical Officers
MALAYSIAN STUDYON CANCER SURVIVAL
(MySCan)
Dr. Puteri Nureylia AmirDr. Nabihah Ali
Dr. Sukumaran RamanDr. Balqis Bahtiar
Dr. Renuga K. Raman (Sept. 2014 – Jan 2018)
National Cancer InstituteMinistry of Health
PutrajayaMALAYSIA
Health Education DivisionMinistry of Health
PutrajayaMALAYSIA
iMalaysian Study On Cancer Survival (MySCan), 2018
MINISTRY OF HEALTH

National Cancer Registry Department,National Cancer Institute,Ministry of Health, No 4, Jalan P7, Presint 7,62250 Putrajaya, MALAYSIATel: (603) 88925555Fax: (603) 88925625© National Cancer Registry
Copyright © Ministry of Health MalaysiaAll rights reserved. This report may not be reproduced,in whole or in part, in any form or means, electronic or mechanical, including photocopying,without written permission from publisher
ISBN: 978-967-16142-0-4
email: [email protected]
This book is also available in electronic format athttp://nci.moh.gov.my/index.php/ms/main-menu-2/laporan
Year of Publication: 2018
Disclaimer:
ii Malaysian Study On Cancer Survival (MySCan), 2018

National Cancer Registry Department,National Cancer Institute,Ministry of Health, No 4, Jalan P7, Presint 7,62250 Putrajaya, MALAYSIATel: (603) 88925555Fax: (603) 88925625© National Cancer Registry
Copyright © Ministry of Health MalaysiaAll rights reserved. This report may not be reproduced,in whole or in part, in any form or means, electronic or mechanical, including photocopying,without written permission from publisher
ISBN: 978-967-16142-0-4
email: [email protected]
This book is also available in electronic format athttp://nci.moh.gov.my/index.php/ms/main-menu-2/laporan
Year of Publication: 2018
Disclaimer:
ii Malaysian Study On Cancer Survival (MySCan), 2018 iii
EDITORIAL TEAM
EditorsDr. Noor Hashimah Abdullah, Public Health Medicine SpecialistDistrict Health Officer, Pasir Puteh District Health Office, Kelantan
Chief Editor Datin Dr. Azizah Ab Manan, Public Health Medicine SpecialistHead of National Cancer Registry Department, National Cancer Institute
Dr. Khalijah Mohd Yusof, Public Health Medicine Specialist State Epidemiologist (NCD), Negeri Sembilan State Health Department
Dr. Wan Abdul Rahim Wan Muhammad, Public Health Medicine SpecialistDistrict Health Officer, Pekan District Health Office, Pahang
Dr. Norma Sabtu, Public Health Medicine Specialist State Epidemiologist (NCD), Melaka State Health Department
Dr. Noriklil Bukhary Ismail Bukhary, Public Health Medicine Specialist State Epidemiologist (NCD), Federal Territory of Kuala Lumpur & Putrajaya Health Department
Dr. Farzaana Adam, Public Health Medicine Specialist State Epidemiologist (NCD), Penang State Health Department
Dr. Najib Majdi YaacobPublic Health Medicine Specialist & Lecturer, Unit of Biostatistics and Research Methodology,School of Medical Science, Universiti Sains Malaysia
Dr. Suhaily Mohd HaironPublic Health Medicine Specialist & Lecturer, Department of Community Medicine,School of Medical Sciences, Universiti Sains Malaysia
Dr. Gerard Lim Chin Chye Head Of Department Of Radiotherapy and Oncology, National Cancer Institute
Dr. Puteri Nureylia Amir, Medical Officer,National Cancer Registry Department
Dr. Balqis Bahtiar, Medical Officer,National Cancer Registry Department
Dr. Mohd Nasrullah Nik Ab. Kadir, Medical Officer,Kelantan State Health Department
Asmawati Aris, Information Technology Officer,National Cancer Institute
Dr. Nabihah Ali, Medical Officer,National Cancer Registry Department
Dr. Sukumaran Raman, Medical Officer,National Cancer Registry Department
Nur Alham Othman, StatisticianNational Cancer Institute
Fairuz Fadzilah Rahim, Statistician & LecturerPublic Health, RCSI & UCD, Malaysia Campus
Supporting Editors
Any enquiries about or comments on this report should be directed to: National Cancer Registry Department, National Cancer Institute, Ministry of Health
Suggested citation:National Cancer Registry, National Cancer Institute, Ministry of Health Malaysia (2018). Malaysian Study on Cancer Survival (MySCan).
iiiMalaysian Study On Cancer Survival (MySCan), 2018
Editorial Team
TABLE OF CONTENTS
EDITORIAL TEAMPREFACEFOREWORDMESSAGEACKNOWLEDGEMENTLIST OF TABLES, FIGURES & APPENDICESLIST OF ABBREVIATIONSEXECUTIVE SUMMARY
iiiv
viviiviiiixx
xi
REFERENCESAPPENDICES
4243
1.0 INTRODUCTION1.1 Geographical Background1.2 Health Status and Cancer Burden1.3 Malaysian Population
223
2.0 METHODOLOGY2.1 Method and Data Source2.2 Data Quality2.3 Statistical Analysis
3.2.1 Overall Cancer Survival3.2.2 Cancer Survival by Ethnic Groups3.2.3 Cancer Survival by Age Groups3.2.4 Cancer Survival by Stage at Diagnosis
3.4.1 Female Breast3.4.2 Colorectal 3.4.3 Lung, Trachea & Bronchus 3.4.4 Nasopharynx 3.4.5 Cervix Uteri 3.4.6 Lymphoma 3.4.7 Leukaemia
455
3.0 RESULTS
2
4
83.1 Sociodemographic Characteristic of Cases3.2 Cancer Survival in Malaysia
3.3 Kaplan- Meier (KM) Survival Curve3.4 Commentary on 7 Selected Cancers
9141618
31333537383941
89
2131
iv Malaysian Study On Cancer Survival (MySCan), 2018
Table of Contents
PREFACE
Malaysian Study on Cancer Survival or MySCan is the first population based cancer survival study done in the country using National Cancer Registry data. Increasingly, all related professionals and policy makers are keen to utilize the cancer survival information as one of the reference in managing various aspects of the cancer treatment and cancer control programme in the country.
Survival is a key factor for any cancer patient, cancer care practitioners and others who provide cancer treatment and programme. While survival information is intuitively a key factor in anticipating the consequences of a cancer diagnosis and treatment, they may or may not be a clear reflection of the quality of care provided by a physician or cancer programme. Many factors beyond treatment affect overall survival of a patient, including the biology of the cancer itself, the demographic characteristic of the patients and the overall health or comorbidity of the patient diagnosed with cancer.
This report will focus on the findings of 5-year relative survival for 15 of the commonest cancers in Malaysia and the factors that may influence them. Information on relative survival from cancer provides an indication of cancer prognosis and the effectiveness of the cancer screening programme. The findings would give some background on the current status of cancer survival in Malaysia and hopefully would significantly contribute to the improvement in the quality of care for cancer patients.
The registry collects and disseminates reliable population-based cancer data such as incidence and survival primarily to assist in the planning and formulating of the national cancer prevention and control strategy. In addition, timely, accurate, reliable and validated information on cancers statistics is crucial in the planning of effective preventive and management strategies for cancer. There will also be research opportunities for those who are interested to study more about cancer epidemiology and trend over the years.
Much time and effort has been put into accuracy, completeness and data quality, in the process of collecting the data and in preparing this report. We sincerely hope that the data in this report would be used as a reference material.
We wish to record our thanks to all participating hospitals, clinics, institutions, and laboratories from government and private sectors for their cooperation and regular notifications to the respective state cancer registries. We also wish to extend our appreciation to Health Informatics Centre (HIC), National Registration Department and Department of Statistics, Malaysia for supporting us with the relevant information and data to assist in the analysis of MySCan.
Thank you all.
vMalaysian Study On Cancer Survival (MySCan), 2018
Preface

FOREWORD
Cancer is the second leading cause of death globally and contributed to 8.8 million deaths in 2015. In Malaysia, cancer is the fourth leading cause of death which contributes to 12.6% of all deaths in government hospitals and 26.7% in private hospitals.
Survival data on cancer have long been recognised globally as crucial for monitoring the effectiveness of cancer control program at population level complementing the information on incidence.
Cancer incidence is an essential measure in the performance on cancer promotion and prevention while cancer survival reflects the effectiveness
of the population-based cancer screening programme for early detection and also an indicator to the quality of treatment and cancer care.
The Malaysian Study on Cancer Survival (MySCan) is the first population-based cancer survival report in Malaysia that would provide valuable information on population-based of survival to guide policymakers, public health professionals and clinicians to move forward in formulating better cancer control strategies. It aims to initiate Malaysian surveillance on cancer survival by regularly using the population-based cancer registry data.
One-third of deaths from cancers are due to five leading behavioural and dietary risks; high body mass index, low fruits and vegetable intake, lack of physical activities, tobacco use and alcohol use. Tobacco use is the most common risk factor for cancers and is responsible for approximately 22% of cancer deaths. The National Strategic Plan for Cancer Control Programme (NSPCCP) 2016-2020 was formulated to reduce the negative impact of cancer in Malaysia further. The activities outlined in this strategic plan are intended to operationalise the seven strategies outlined by the World Health Organisation (WHO) in cancer control. Availability of survival data from MySCan will undoubtedly contribute to evaluating the strategies that were implemented through NSPCCP.
I am pleased to present this first Malaysian Study on Cancer Survival report and would like to congratulate and acknowledge the excellent teamwork of MySCan editorial committee members, National Cancer Registry team, state cancer registries and all individuals and organisations that have directly or indirectly contributed to its publication.
We look forward to the continuation of the effort in providing Malaysia with population-based cancer survival surveillance system through MySCan. Thank you.
DATUK DR. NOOR HISHAM ABDULLAHDirector General of Health, MALAYSIA
vi Malaysian Study On Cancer Survival (MySCan), 2018
Foreword
MESSAGE
First of all, I would like to thank the National Cancer Registry Department and National Cancer Institute (NCI) in publishing this Malaysian Cancer Survival Report (MySCan). I was informed this is the first population-based cancer survival report in Malaysia and I am confident that it would be a stepping stone for the initiation of cancer survival surveillance system in the country.
Malaysia is approaching an epidemiologic transition, like most developed and advanced developing countries, where disease related to lifestyles particularly cardiovascular diseases and cancers have progressively become more prevalent.
In 2018, WHO reported 30-50% of cancer are currently be prevented by avoiding risk factors and implementing existing evidence based prevention strategies.
The Government recognises cancer as an important health concern among Malaysians. Ministry of Health are committed in cancer control and prevention strategies in reducing incidence, mortality and improving cancer survival. Prevention, control and management of cancers will be made accessible and affordable to the population through collaboration with various stakeholders and integrated into the social, economic and environmental system to establish a robust platform for effective control of cancer in Malaysia.
There is strong evidence to support cancer screening programme in improving cancer survival. In Malaysia, there were established and accessible cancer screening programme for breast, cervix uteri and colorectal cancers. MOH has also introduced Hepatitis B vaccination in prevention of liver cancer in 1989 followed by Human Papillomavirus (HPV) vaccination in 2013 to prevent cervical cancer. In addition to the screening programme, effective health promotion and education campaigns, which demystify cancer and results in early detection and diagnosis will contribute to a better survival.
Finally I would like to record my appreciation to the excellent teamwork of the director of the National Cancer Institute, National Cancer Registry Department and State Cancer Registries for this publication. Last and foremost a greatest gratitude and congratulate to the editorial team for their effort in producing this report. I am looking forward for the future publications on cancer statistic pertaining to cancer survival in this country.
Thank you
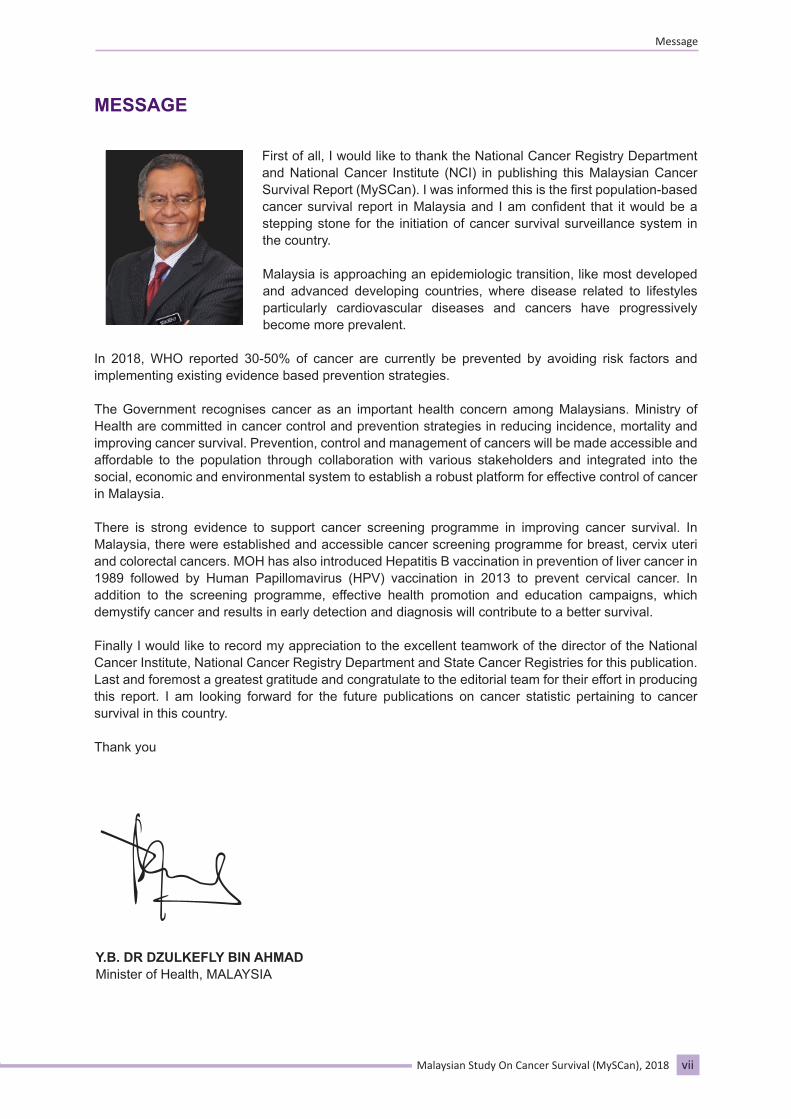
Y.B. DR DZULKEFLY BIN AHMADMinister of Health, MALAYSIA
viiMalaysian Study On Cancer Survival (MySCan), 2018
Message

ACKNOWLEDGEMENT
National Cancer Registry Department, National Cancer Institute wish to express our gratitude to individuals and organisations to the contributions to the Malaysian Study on Cancer Survival (MySCan) especially the following:
We would like to express our gratitude to MySCan team members for their commitment and assistance in preparation of MySCan dataset. (In alphabetical order); Medical Officers; Dr. Ayu Zeity Bistari Md Bukhori, Dr. Azhar Ibrahim Omar, Dr. Norazrul Nasri, Dr. Renuga K. Raman and Dr. Sharifah Saffinas Syed Soffian. Supporting staff; Noriezatulafida Mohd Ariffin, Mastulu Wahab, Noorshila Shuib and Maslinda Mat Said. Our appreciation also goes to all members of 15 state cancer registries for continuously coordinating data collections and quality control at state level and diligently contributing data to the National Cancer Registry.
We would like to extend our appreciation to Dr. Gerard Lim Chin Chye, Head of Radiotherapy and Oncology Department, National Cancer Institute; Dr. Tan Boon Seang, Head of Radiotherapy and Oncology Department, Penang Hospital; Dr. Irhan Ali Hyder Ali, Head of Respiratory Medical Department, Penang Hospital; Dr. Zahirudin Zakaria, Head of Otorhinolaryngology Department, Penang Hospital; and Dr. Hakimah Mahsin @ Ahmad Nasir, Head of Pathology Department, Penang Hospital for the support and valuable comments on the report.
Our gratitude also goes to Isabelle Soerjomataram and Adalberto Miranda from International Agency for Research on Cancer (IARC, Lyon) for providing and constructing the Malaysian population life tables for this study and Mr Les Mery, Global Programme Manager (IARC), for the valuable comments.
Lastly we wish to record our appreciation to all individuals and organisations that have directly or indirectly contributed to this report.Thank you all for the valuable contributions.
The Honourable Minister of Health Malaysia, Y.B. Dr. Dzulkefly AhmadDirector General of Health Malaysia, YBhg. Datuk Dr. Noor Hisham AbdullahDeputy Director General of Health Malaysia (Public Health), YBhg. Dato’ Dr. Chong Chee Kheong Deputy Director General of Health Malaysia (Medical),YBhg. Dato’ Dr. Azman Abu BakarDeputy Director General of Health Malaysia (Research & Tech. Support), YBhg. Datuk Dr. Shahnaz MuradDirector of National Cancer Institute, YBrs. Dr. Asmayani KhalibDirector of Health Education and Communication Division (HECC), Ministry of HealthAll States & Federal territories Health Directors and Deputy Health Directors. All specialists from government and private sectors especially the oncologists, pathologists, other disciplines specialists, palliative care professionals, and all other members of the medical profession from various health facilities, universities and non-government organisations.Deputy Director of Health Informatics Centre, Ministry Of Health Director of National Registration Department, Malaysia Chief Statistician of Department of Statistics, Malaysia All medical records team and other staff members of the government and private hospitals, institutions, health clinics and private pathology laboratories for continuously contributing data by cancer notifications to the state cancer registriesDean of School of Medical Sciences, Universiti Sains Malaysia (USM)Head, Department of Public Health, RCSI & UCD Malaysia Campus
viii Malaysian Study On Cancer Survival (MySCan), 2018
Acknowledgement
ixMalaysian Study On Cancer Survival (MySCan), 2018
LIST OF TABLES, FIGURES & APPENDICES
List of Tables:
Population by sex, ethnic groups and citizenship, Malaysia, 2016 3Table 1
List of Figures:
Population pyramid, all residents, Malaysia, 2016 3Figure 1Relative survival at 1-year and 5-year by cancer types, period of diagnosis 2007-2011 and followed up to 2016, Malaysia
10Figure 2
Comparison of 5-year relative survival by 3 major ethnic groups, period of diagnosis 2007-2011 and followed up to 2016, Malaysia
15Figure 4
Relative survival by cancer types and age groups (adults), period of diagnosis 2007-2011 and followed up to 2016, Malaysia
17Figure 5
Relative survival by age groups in childhood lymphoma & leukaemia, period of diagnosis 2007-2011 and followed up to 2016, Malaysia
17Figure 6
Stage I: Relative survival by cancer types, period of diagnosis 2007-2011 and followed up to 2016, Malaysia 19Figure 7
Stage II: Relative survival by cancer types, period of diagnosis 2007-2011 and followed up to 2016, Malaysia 19Figure 8
Stage III: Relative survival by cancer types, period of diagnosis 2007-2011 and followed up to 2016, Malaysia 20Figure 9
Stage IV: Relative survival by cancer types, period of diagnosis 2007-2011 and followed up to 2016, Malaysia 20Figure 10
Relative survival by cancer types and sex, period of diagnosis 2007-2011 and followed up to 2016, Malaysia 13Figure 3
Summary of data quality: Numbers and percentage of eligible, excluded and included cases by cancer types, period of diagnosis 2007-2011 and followed up to 2016, Malaysia
7Table 2
Characteristic of cases by sex and ethnic groups 8Table 3
Number and percentage of cancers by age groups in adults 8Table 4
Number and percentage of cancers by age groups in childhood 8Table 5
Overall cancer survival by cancer types, period of diagnosis 2007-2011 and followed up to 2016, Malaysia 9Table 6
Median survival time by cancer types, period of diagnosis 2007-2011 and followed up to 2016, Malaysia 11Table 7
Relative survival by cancer types and sex, period of diagnosis 2007-2011 and followed up to 2016, Malaysia 12Table 8Relative survival by major ethnic groups and cancer types, period of diagnosis 2007-2011 and followed up to 2016, Malaysia
14Table 9
Relative survival by cancer types and age groups (adults), period of diagnosis 2007-2011 and followed up to 2016, Malaysia
16Table 10
Relative survival by cancer types and age groups (children), period of diagnosis 2007-2011 and followed up to 2016, Malaysia
16Table 11
Relative survival by stage of diagnosis and cancer types, period of diagnosis 2007-2011 and followed up to 2016, Malaysia
18Table 12
Female Breast: Relative survival by year and selected variables, period of diagnosis 2007-2011 and followed up to 2016, Malaysia
31Table 13
Colorectal: Relative survival by year and selected variables, period of diagnosis 2007-2011 and followed up to 2016, Malaysia
33Table 14
Colon & Rectum: 5-year relative survival by selected variables, period of diagnosis 2007-2011 and followed up to 2016, Malaysia
33Table 15
Colon & Rectum: International comparison of 5-year relative survival 34Table 16Lung, Trachea & Bronchus: Relative survival by year and selected variables, period of diagnosis 2007-2011 and followed up to 2016, Malaysia
35Table 17
Nasopharynx: Relative survival by year and selected variables, period of diagnosis 2007-2011 and followed up to 2016, Malaysia
37Table 18
Cervix Uteri: Relative survival by year and selected variables, period of diagnosis 2007-2011 and followed up to 2016, Malaysia
38Table 19
39Table 20
Lymphoma (children): Relative survival by year and selected variables, period of diagnosis 2007-2011 and followed up to 2016, Malaysia
39Table 21
41Table 22
Leukaemia (children): Relative survival by year and selected variables, period of diagnosis 2007-2011 and followed up to 2016, Malaysia
Lymphoma (adults): Relative survival by year and selected variables, period of diagnosis 2007-2011 and followed up to 2016, Malaysia
Leukaemia (adults): Relative survival by year and selected variables, period of diagnosis 2007-2011 andfollowed up to 2016, Malaysia
41Table 23
List of Tables, Figures & Appendices
x Malaysian Study On Cancer Survival (MySCan), 2018
Female Breast: Relative survival by year and staging, period of diagnosis 2007-2011 and followed up to 2016, Malaysia
31Figure 11
Female Breast: Relative survival by year and ethnicity, period of diagnosis 2007-2011 and followed up to 2016, Malaysia
32Figure 12
Female Breast: International comparison of 5-year relative survival 32Figure 13
Colon & Rectum: International comparison of 5-year relative survival 34Figure 14
Lung, Trachea & Bronchus: International comparison of 5-year relative survival 36Figure 17Nasopharynx: Relative survival by year and staging, period of diagnosis 2007-2011 and followed up to 2016, Malaysia
37Figure 18
Cervix Uteri: International comparison of 5-year relative survival 38Figure 19
Lymphoma: Comparison of relative survival by year in adults and children, period of diagnosis 2007-2011 and followed up to 2016, Malaysia
40Figure 20
Childhood Lymphoma: International comparison of 5-year relative survival 40Figure 21Leukaemia: Comparison of relative survival by year in adults and children, period of diagnosis 2007-2011 and followed up to 2016, Malaysia
41Figure 22
Lung, Trachea & Bronchus: Relative survival by year and staging, period of diagnosis 2007-2011 and followed up to 2016, Malaysia
35Figure 15
Lung, Trachea & Bronchus: Relative survival by year and ethnicity, period of diagnosis 2007-2011 and followed up to 2016, Malaysia
36Figure 16
List of Appendices:
Appendix 1.
Appendix 2.
Appendix 3.
Actuarial life table by cancer types
Actuarial life table by staging for selected cancers
Description of cancer types by ICD-O3 and ICD-10 codes
43
48
57
Brain & NS CICRCDCOHRIARCIC ICD-10
Brain & Nervous systemconfidence intervalColorectal Cancerdeath certificate onlyhazard ratioInternational Agency for Research on Canceridentification cardInternational Statistical Classification of Diseases and Related Health Problems 10th Revision
ICD-O3KMLFULung, T & BMNCRMSTMySCanNCDNCINCRNPCNRDNSPCCPOSRSWHO
International Classification of Diseases for Oncology, 3rd editionKaplan-Meierloss to follow upLung, trachea and bronchusMalaysian National Cancer Registrymedian survival timeMalaysian Study on Cancer Survival Non-communicable diseaseNational Cancer Institute National Cancer RegistryNasopharynx CancerNational Registration DepartmentNational Strategic Plan for Cancer Control Programmeobserved survivalrelative survivalWorld Health Organization
LIST OF ABBREVIATIONS
List of Tables, Figures & Appendices
xiMalaysian Study On Cancer Survival (MySCan), 2018
MySCan
Malaysian Study on Cancer Survival (MySCan) aims to initiate Malaysian surveillance of cancer survival using population-based data from the National Cancer Registry. This is to ensure availability of evidence based information in monitoring and evaluation the progress of National Cancer Prevention and Control Programme and cancer management in the country. This is the first national cancer survival report using population-based data with wide coverage involving 15 state cancer registries in Malaysia.
This report applies only to Malaysian citizens and residents who were diagnosed from 1st January 2007 until 31st December 2011 with follow-up to 31st December 2016. Survival were analysed for 0-10 years after diagnosis for 15 selected cancers. Total of 72884 cases were included for analysis. Of these 29263 (40.2%) were males and 43621 (59.8%) were females. Majority were Chinese (43.2%) followed by Malays (40.7%), Bumiputera (8.6%), Indians (6.6%) and Other Ethnic groups (0.8%).
The five highest 5-year relative survivals (RS) were in thyroid (82.3%), prostate (73.0%), corpus uteri (70.6%), female breast (66.8%), and colon (56.8%) cancers. The survivals were predominantly higher in women and younger age group.
Survival by staging was done only for cases in which stage was recorded (58%). Out of these, 18% was in stage I, 26% was in stage II and 56% was in late stage (stage III and IV). The 5-year RS was higher at stage I and deteriorated as stage progressed. In comparison to stage I, the hazard ratio (HR) at stage IV was 7.52 (95% CI: 6.83, 8.28) in female breast, 5.45 (95% CI: 4.60, 6.46) in cervix uteri and 3.86 (95% CI: 3.44, 4.32) in colorectal cancer which were statistically significant.
In Malaysia, there were established and accessible cancer screening programmes for breast, cervix uteri and colorectal cancers. Despite of the availability of screening programmes for above cancers, the percentage of cases who presented at late stage (stage III & IV) were 41.3%, 38.5% and 63.8% respectively.
As this study reported diagnosis at late stage was a significant determinant for poor cancer survival, there is an urgent need to strengthen the promotion and awareness on cancer prevention and screening programme in the community. This can be done through collaboration with various stakeholders and integrated into the social, economic and environmental system to establish a robust platform for effective cancer screening programme in Malaysia. Effective programme can then be implemented at various level that include community engagement to address patient behaviour, improving diagnostic and referral capacity and ensuring access to timely, affordable and high-quality treatment. The findings in this report should spur the right impetus among policy makers and programme managers to facilitate timely diagnosis and improved access to cancer treatment for all.
The most worrying cancer with the lowest survival was cancer of the lung, trachea & bronchus with 5-year RS of 11.0% and a median survival time (MST) of 6.8 months. The focus for this rapidly fatal cancer should be driven to constructive preventive strategies rather than treatment. The great deal of policy and programmatic attention should be directed toward youth smoking prevention.
This study also revealed cancer survival estimates in Malaysia was comparable to other Asian country and the patterns are similar with other studies done for the same type of cancer. The survival was lower compared to Australia, New Zealand, USA and most of European countries.
Executive Summary
EXECUTIVESUMMARY


Ministry of Health has started its population-based cancer registry in 1993. It was started with six regional population-based cancer registries to ensure long term sustainability. Since 2007 all fifteen states in Malaysia had set up their own population-based registries which were headed by National Cancer Registry in the Ministry of Health under the Non-Communicable Disease Sector, Disease Control Division. The secretariat for the NCR has been transferred to the National Cancer Institute (NCI) since 1st January 2015. Along with cancer incidence and mortality data, population-based survival estimates provide further insight to assess the effectiveness of cancer control and prevention programme.
MySCan or Malaysian Study on Cancer Survival aims to initiate Malaysian surveillance on cancer survival using population based cancer registry. This is the first National cancer survival report using population-based data with coverage for all state cancer registries in Malaysia. Population-based cancer survival data is useful for health policy in evaluating the effectiveness of the overall cancer control strategy. Survival estimates of patients registered by population-based cancer registries reflect the average prognosis from a given cancer, since they are based on unselected patients with a variety of natural histories as well as treatment patterns.
1.0 INTRODUCTION
Malaysia covers an area of about 330,289 sq. km, consisting of Peninsular Malaysia and East Malaysia. It is separated by the South China Sea and has its frontier with Thailand, Singapore, Indonesia and Brunei. Peninsular Malaysia is located south of Thailand, north of Singapore and east of the Indonesian Island of Sumatera. East Malaysia comprises most of the northern part of Borneo and shares borders with Brunei and Indonesia. Located near the equator, Malaysia’s climate is categorised as equatorial, being hot and humid throughout the year.
Malaysia is divided into thirteen states and three Federal Territories. Eleven states and two Federal Territories are found in Peninsular Malaysia meanwhile, two states and one Federal Territory are found in East Malaysia. Peninsular Malaysia consists of the following states (from north to south): Perlis, Kedah, Pulau Pinang (Penang), Perak, Selangor, Federal Territory of Kuala Lumpur and Putrajaya (WPKL & Putrajaya), Negeri Sembilan, Melaka, Johor, Pahang, Terengganu and Kelantan. East Malaysia consists of Sabah, Sarawak and the Federal Territory of Labuan (W.P. Labuan).
1.1 Geographical Background
The health status of Malaysia has been enhanced by improvement in health infrastructure and health services. Since Independence in 1957, changes in disease patterns in relation to lifestyle related conditions have occurred. Life expectancy in Malaysia at birth for both sexes has increased over the years, rising from 56 years for males and 58 years for females in 1957 to 72.5 years for males and 77.2 years for females in 2016.
The cancer incidence in Malaysia, 2007-2011 in males was 86.9 and in females was 99.3 per 100,000 populations (MNCR, 2016). Cancer imposes a tremendous economic burden on patients, families and the society they live in. Apart from financial cost, cancer has an important psychosocial effect on patients and their families.
1.2 Health Status and Cancer Burden
2Malaysian Study On Cancer Survival (MySCan), 2018
Introduction

Table 1. Population by sex, ethnic groups and citizenship, Malaysia, 2016
Variables Characteristics NO.
Sex MaleFemale
14,371,90014,031,500
50.649.4
Citizenship MalaysianNon-MalaysianTotal
28,403,5003,230,000
31,633,500
89.810.2
100.0
Ethnic groups MalaysBumiputera ChineseIndiansOthersTotal
15,796,4003,688,9006,645,7001,991,600
280,90028,403,500
55.6 13.0 23.4 7.0 1.0
100.0
(%)
Source: Department of Statistics Malaysia
The Malaysian population in 2016 was 31.6 million including the non-citizens. The population pyramid and its distribution by sex and age group is shown in Figure 1. Among Malaysian citizens, there were 50.6% males and 49.4% females. Majority were Malays (55.6%), followed by Chinese (23.4%), Bumiputera (13.0%), Indians (7%) and Others (1%).
1.3 Malaysian Population
In Malaysia, cancer is the fourth leading cause of death which contributes to 12.6% of all deaths in government hospitals and 26.7% in private hospitals in 2016. There has been an increasing trend from 2007-2016 from 11.3% in 2007 to 12.6% in 2016 (Health Facts, 2017).
Figure 1. Population pyramid, all residents, Malaysia, 2016
287,700 328,100
387,600
503,400
638,200
736,900
812,900
839,800
930,800
1,164,600
1,248,300
1,299,000
1,271,000
1,246,100
1,179,600
1,198,300
376,500
503,500
652,900
758,900
791,500
855,900
969,600
1,170,000
1,255,200
1,336,400
1,333,200
1,312,800
1,253,700
1,282,700
2,000,000 2,000,0001,000,0001,500,000 0 1,000,000
231,700 247,100
Male
75+70 - 7465 - 6960 - 6455 - 5950 - 5445 - 4940 - 4435 - 3930 - 3425 - 2920 - 2415 - 1910 - 14
5 - 90 - 4
Female
500,000 500,000 1,500,000Population ('000) 28,403.5
Introduction
3 Malaysian Study On Cancer Survival (MySCan), 2018

2.0 METHODOLOGY
Data was extracted from the population-based National Cancer Registry (NCR) database. Survival was measured from the date of diagnosis until death, loss to follow-up, or censoring. Cancer survival was analysed for 0-10 year duration after diagnosis.
Data were selected for 15 commonest cancer diagnosed in 2007-2011 and follow-up to 31st December 2016. Data was extracted using Canreg5 software following the inclusion criteria as below:
Thirteen solid cancers or group of cancers were defined by anatomical site (topography) which were female breast, colorectal, lung, trachea & bronchus, nasopharynx, prostate, brain & nervous systems, stomach, liver, cervix uteri, ovary, corpus uteri, thyroid and pancreas. The haematological malignancies which were leukaemia and lymphoma were defined by morphology.
In addition to colorectal cancer, colon and rectal cancers were also analysed individually. Cases categorised under rectal cancer were defined with topography of recto-sigmoid, rectum (ICD-10: C19-C20), anorectal and anus with histology of adenocarcinoma only (ICD-10: C21).
Collectively, these 15 cancers accounted for about 75% of the estimated number of patients diagnosed with cancer in Malaysia for the period of 2007-2011.
Follow up on vital status of registered cancer cases was done by data linkage with national index of all death registrations provided by the Malaysian National Registration Department (NRD) for all causes of death for the period of 1st January 2007 until 31st December 2016.
Cancer data were matched using Malaysian identification card (IC) numbers to all death data and updated with the date and cause of death. Transcription errors can arise with IC numbers, so variables such as the name, sex, and date of birth were also used to improve the probability of an accurate match between a cancer record and a death registration. Data that could not be identify by NRD, was further matched with list of hospital discharges from the Health Informatics Centre.
Finally for those cases that could not be identified through both processes were recorded as lost to follow-up (LFU) due to unknown eventual death and censored from survival analysis on that date. We considered survival estimates as less reliable if 15% or more of patients were lost to follow-up (LFU) and in this report the percentages of LFU was 4.1%.
2.1 Method and Data Source
All confirmed cancer cases with incidence date within the period of 2007-2011Malaysian citizenship and residing in Malaysia at the time of diagnosis 13 solid cancers defined by topography 2 haematological malignancies defined by morphology
Methodology
4Malaysian Study On Cancer Survival (MySCan), 2018

Analysis was done using Statistical software Stata version 14 to estimate the survival for 0-10 years after diagnosis for each cancer type as defined earlier. RS was estimated by using life tables stratified by age, sex, and calendar year. Malaysian complete life tables and three major ethnic groups [Bumiputera (Malay & other bumiputera); Chinese, Indians and others] were constructed by IARC based on Malaysian population abridged life tables 2007-2016 (Department of Statistic Malaysia, 2007-2016).
Analysis by ethnicity was done for Malays, Chinese and Indians using respective life tables except for Malays, where Bumiputera life tables were used due to unavailability of life tables for Malay separately. However it’s appropriate to use this life table considering majority (82%) of the Bumiputera ethnicity were Malays.
Overall observed survival was estimated by actuarial life tables and Kaplan-Meier method (survival curve) to compare between groups by sex, ethnic and age. Estimation of relative survival (RS) were based on Ederer II estimator for overall survival and stratified by sex, ethnicity, age groups and stage at diagnosis by cancer types.
2.3 Statistical Analysis
Cases registered as death certificate only (DCO) or diagnosed at autopsy Solid cancers among childhood (0-14 years) Person aged more than 99 years due to population life tables for this age group is not available.Cases with invalid date of diagnosis - if death occurred within 2 weeks but the patients had treatment (chemotherapy, radiotherapy, hormonal treatment) and histology results recorded.
The methodology for data collections in NCR was stated clearly in MNCR, 2007-2011. Data quality in NCR has used the same common indices as indicated in the Cancer Incidence in Five Continents (CI5) report, provided by the International Agency for Research on Cancer, WHO (IARC, Lyon, France). Topography and morphology were coded to the International Classification of Diseases for Oncology (ICD-O-3) (WHO. 2013). The case definitions, classification, multiple primaries rules of the IARC guidelines were followed.
Cases were checked for eligibility by identifying the duplicates, consistencies check and morphology verification as stated below and will be removed from the data set if not eligible;
Consistencies Check: The logical inconsistencies between the variables in each cancer record were checked using IARC tools. The variables in each record were checked for eligibility (e.g. age and cancer behaviour), definite errors (e.g. sex site errors, invalid dates, impossible date sequence, and missing vital status), and possible errors, including a wide range of inconsistencies between age, cancer site, and morphology.
Morphology verification: The proportion of cancer records with morphological verification of the diagnosis were examined, whether from histology of a biopsy or surgical specimen, cytology of a smear or bone marrow aspirate, or from imaging or biomarkers, including tumours with a specific morphology code.
Finally all eligible cases were checked for exclusion criteria as below and excluded from the final data set for analysis;
2.2 Data Quality
Methodology
5 Malaysian Study On Cancer Survival (MySCan), 2018
Relative survival is the standard approach used by population-based cancer registries to produce population-level relative survival statistics as it does not require information on cause of death. Observed survival and expected survival are used to estimate relative survival.
2.3.1 Definition of Statistical Term Used
2.3.1.1 Estimation of Relative Survival
National Cancer Institute, USA defined median survival time as “The length of time from the date of diagnosis of cancer, that half of the patients in a group of patients diagnosed with the disease are still alive”. It is the time expressed in months or years that the chance of surviving beyond that time is 50%. Median survival cannot be estimated if the number of deaths from total number of cancer analysed is less than 50%.
2.3.1.2 Median Survival Time (MST)
A measure of chance of an event occurring in one group compared to chance of an event occurring in another group, over time. A hazard ratio of one means that there is no difference in survival between the two groups. A hazard ratio of greater than one or less than one means that survival was better in one of the groups (National Cancer Institute, 2018). In this report, simple Cox regression analysis was used to calculate crude hazard ratio. Hazard ratio of more than one indicate increase hazard (risk) to death in a group compared to the reference group.
2.3.1.3 Hazard Ratio (HR)
The proportion of people alive for a given amount of time after a diagnosis of cancer; it is calculated from population-based cancer data.
i. Observed survival (OS)
Expected survival is the proportion of people in the general population alive for a given amount of time. These are derived from life-tables for the Malaysian general population which includes deaths from all causes, including cancer.
ii. Expected survival (ES)
Relative survival refers to the probability of being alive for a given amount of time after diagnosis compared with all mortality in the general population. Relative survival is calculated by dividing observed survival by the expected survival for the general population. STATA packages (strs) developed by Paul W. Dickman were used to obtain the relative survival estimates (Dickman et al. 2009).
iii. Relative survival (RS)
Methodology
6Malaysian Study On Cancer Survival (MySCan), 2018

Cancer types
Female Breast
Colorectal
Lung, T & B
Nasopharynx
Lymphoma
Cervix Uteri
Leukaemia
Ovary
Prostate
Stomach
Liver
Thyroid
Corpus Uteri
Brain & NS
Pancreas
TOTAL
18206
13683
10606
5051
5374
4352
4573
3414
3132
3459
4085
2248
2181
1876
1829
84069
716
852
976
182
353
189
372
149
95
260
527
73
78
336
121
5279
3.9
6.2
9.2
3.6
6.6
4.3
8.1
4.4
3.0
7.5
12.9
3.2
3.6
17.9
6.6
6.3
17490
12831
9630
4869
5021
4163
4201
3265
3037
3199
3558
2175
2103
1540
1708
78790
481
738
1609
172
312
148
328
181
124
381
792
117
65
188
270
5906
2.8
5.8
16.7
3.5
6.2
3.6
7.8
5.5
4.1
11.9
22.3
5.4
3.1
12.2
15.8
7.5
17009
12093
8021
4697
4709
4015
3873
3084
2913
2818
2766
2058
2038
1352
1438
72884
7372
7630
7287
2896
2668
2247
2208
1631
1719
2267
2470
545
778
877
1263
43858
9077
4041
514
1621
1709
1579
1252
1351
1104
449
201
1440
1164
428
129
26059
560
422
220
180
332
189
413
102
90
102
95
73
96
47
46
2967
3.3
3.5
2.7
3.8
7.1
4.7
10.7
3.3
3.1
3.6
3.4
3.5
4.7
3.5
3.2
4.1
Extractedfrom NCR
NO. NO. % NO. NO. NO. Death Alive LFU % ofLFU%
Ineligible Eligible Excluded Included Present status of casesincluded
Table 2. Summary of data quality: Numbers and percentage of eligible, excluded and included cases by cancer types, period of diagnosis 2007-2011 and followed up to 2016, Malaysia
Methodology
7 Malaysian Study On Cancer Survival (MySCan), 2018
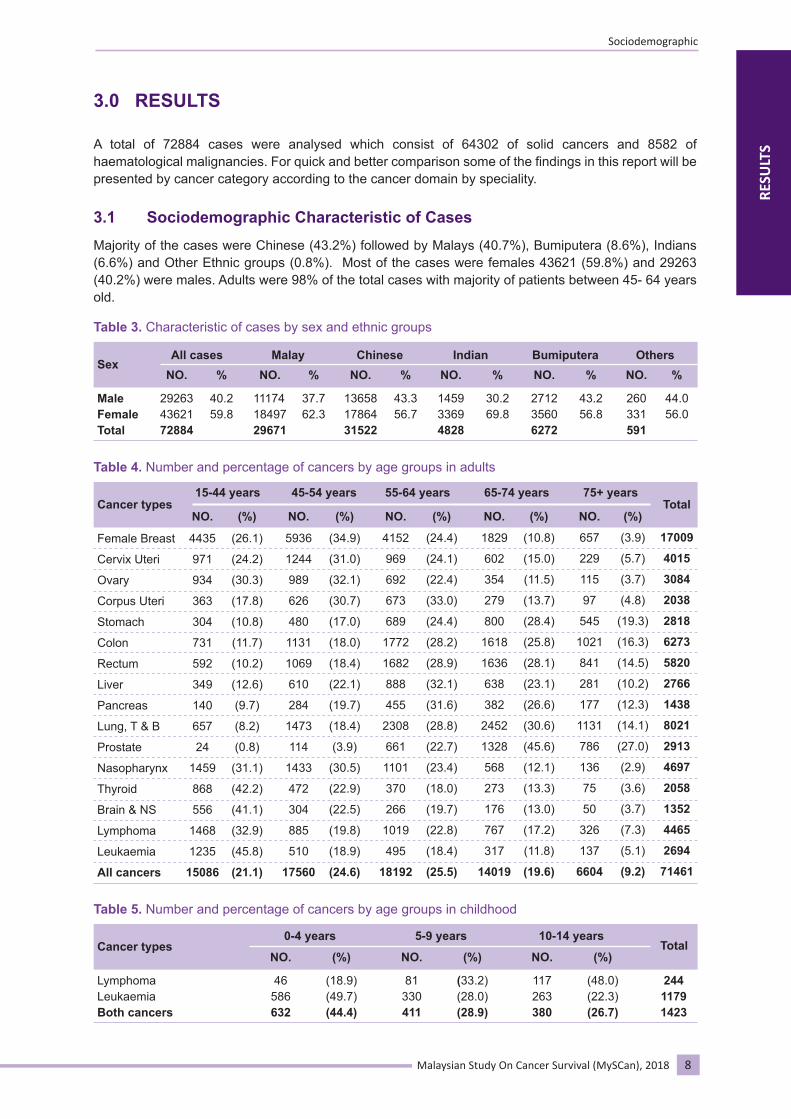
A total of 72884 cases were analysed which consist of 64302 of solid cancers and 8582 of haematological malignancies. For quick and better comparison some of the findings in this report will be presented by cancer category according to the cancer domain by speciality.
3.0 RESULTS
Majority of the cases were Chinese (43.2%) followed by Malays (40.7%), Bumiputera (8.6%), Indians (6.6%) and Other Ethnic groups (0.8%). Most of the cases were females 43621 (59.8%) and 29263 (40.2%) were males. Adults were 98% of the total cases with majority of patients between 45- 64 years old.
3.1 Sociodemographic Characteristic of Cases
Table 3. Characteristic of cases by sex and ethnic groups
Sex
MaleFemaleTotal
292634362172884
40.259.8
111741849729671
37.762.3
136581786431522
43.356.7
145933694828
30.269.8
271235606272
43.256.8
260331591
44.056.0
All casesNO. % NO. % NO. % NO. % NO. % NO. %
Malay Chinese Indian OthersBumiputera
Table 4. Number and percentage of cancers by age groups in adults
Female Breast
Cervix Uteri
Ovary
Corpus Uteri
Stomach
Colon
Rectum
Liver
Pancreas
Lung, T & B
Prostate
Nasopharynx
Thyroid
Brain & NS
Lymphoma
Leukaemia
All cancers
4435
971
934
363
304
731
592
349
140
657
24
1459
868
556
1468
1235
15086
(26.1)
(24.2)
(30.3)
(17.8)
(10.8)
(11.7)
(10.2)
(12.6)
(9.7)
(8.2)
(0.8)
(31.1)
(42.2)
(41.1)
(32.9)
(45.8)
(21.1)
5936
1244
989
626
480
1131
1069
610
284
1473
114
1433
472
304
885
510
17560
(34.9)
(31.0)
(32.1)
(30.7)
(17.0)
(18.0)
(18.4)
(22.1)
(19.7)
(18.4)
(3.9)
(30.5)
(22.9)
(22.5)
(19.8)
(18.9)
(24.6)
4152
969
692
673
689
1772
1682
888
455
2308
661
1101
370
266
1019
495
18192
(24.4)
(24.1)
(22.4)
(33.0)
(24.4)
(28.2)
(28.9)
(32.1)
(31.6)
(28.8)
(22.7)
(23.4)
(18.0)
(19.7)
(22.8)
(18.4)
(25.5)
1829
602
354
279
800
1618
1636
638
382
2452
1328
568
273
176
767
317
14019
(10.8)
(15.0)
(11.5)
(13.7)
(28.4)
(25.8)
(28.1)
(23.1)
(26.6)
(30.6)
(45.6)
(12.1)
(13.3)
(13.0)
(17.2)
(11.8)
(19.6)
657
229
115
97
545
1021
841
281
177
1131
786
136
75
50
326
137
6604
(3.9)
(5.7)
(3.7)
(4.8)
(19.3)
(16.3)
(14.5)
(10.2)
(12.3)
(14.1)
(27.0)
(2.9)
(3.6)
(3.7)
(7.3)
(5.1)
(9.2)
17009
4015
3084
2038
2818
6273
5820
2766
1438
8021
2913
4697
2058
1352
4465
2694
71461
Cancer types15-44 years
NO. (%) NO. (%) NO. (%) NO. (%) NO. (%)
45-54 years 55-64 years 65-74 years 75+ yearsTotal
Table 5. Number and percentage of cancers by age groups in childhood
Cancer types
LymphomaLeukaemiaBoth cancers
46586632
(18.9)(49.7)(44.4)
0-4 years
NO. (%)
81330411
(33.2)(28.0)(28.9)
5-9 years
NO. (%)
117263380
(48.0)(22.3)(26.7)
24411791423
10-14 yearsTotal
NO. (%)
8Malaysian Study On Cancer Survival (MySCan), 2018
RESU
LTS
Sociodemographic

The five highest for overall 5-year RS were in thyroid (82.3%), prostate (73.0%), corpus uteri (70.6%), female breast (66.8%), and colon (56.8%) cancers. The lowest cancer survival was in lung, trachea & bronchus (11.0%). Survivals in haematological malignancies were higher in childhood compared to adults.
3.2 Cancer Survival in Malaysia
3.2.1 Overall Cancer Survival
Table 6. Overall cancer survival by cancer types, period of diagnosis 2007-2011 and followed up to 2016, Malaysia
Women’s CancersFemale BreastCervix UteriOvaryCorpus Uteri
61.946.951.265.1
(61.1, 62.6)(45.4, 48.5)(49.3, 52.9)(62.9, 67.2)
66.851.654.570.6
(66.0, 67.6)(49.8, 53.3)(52.6, 56.4)(68.2, 72.8)
Gastrointestinal CancersStomachColorectal Colon RectumLiverPancreas
20.240.845.336.011.111.9
(18.7, 21.7)(40.0, 41.7)(44.1, 46.6)(34.7, 37.3)(9.9, 12.3)
(10.3, 13.7)
25.751.156.845.112.814.0
(23.8, 27.6)(50.0, 52.3)(55.2, 58.3)(43.5, 46.6)(11.5, 14.3)(12.1, 16.1)
Other CancersLung, T & BProstateNasopharynxThyroidBrain & NS
9.049.142.777.138.2
(8.4, 9.7)(47.2, 50.9)(41.3, 44.1)(75.2, 78.9)(35.5, 40.8)
11.073.046.082.340.8
(10.3, 11.9)(70.2, 75.7)(44.4, 47.5)(80.2, 84.2)(38.0, 43.6)
Haematological MalignanciesLymphoma overall Lymphoma (adults) Lymphoma (children)Leukaemia overall Leukaemia (adults) Leukaemia (children)
44.940.146.341.931.144.1
(43.4, 46.3)(38.7, 41.6)(40.0, 52.4)(40.3, 43.5)(29.4, 32.9)(41.3, 46.9)
49.348.563.344.036.562.3
(47.7, 50.9)(46.9, 50.2)(56.3, 69.4)(42.3, 45.7)(34.5, 38.5)(59.3, 65.3)
Cancer types5-year cancer survival (%)
OS 95% CI RS 95% CI
Note* OS: Observed survival, RS: Relative survival
Overall Survival
9 Malaysian Study On Cancer Survival (MySCan), 2018
RESU
LTS
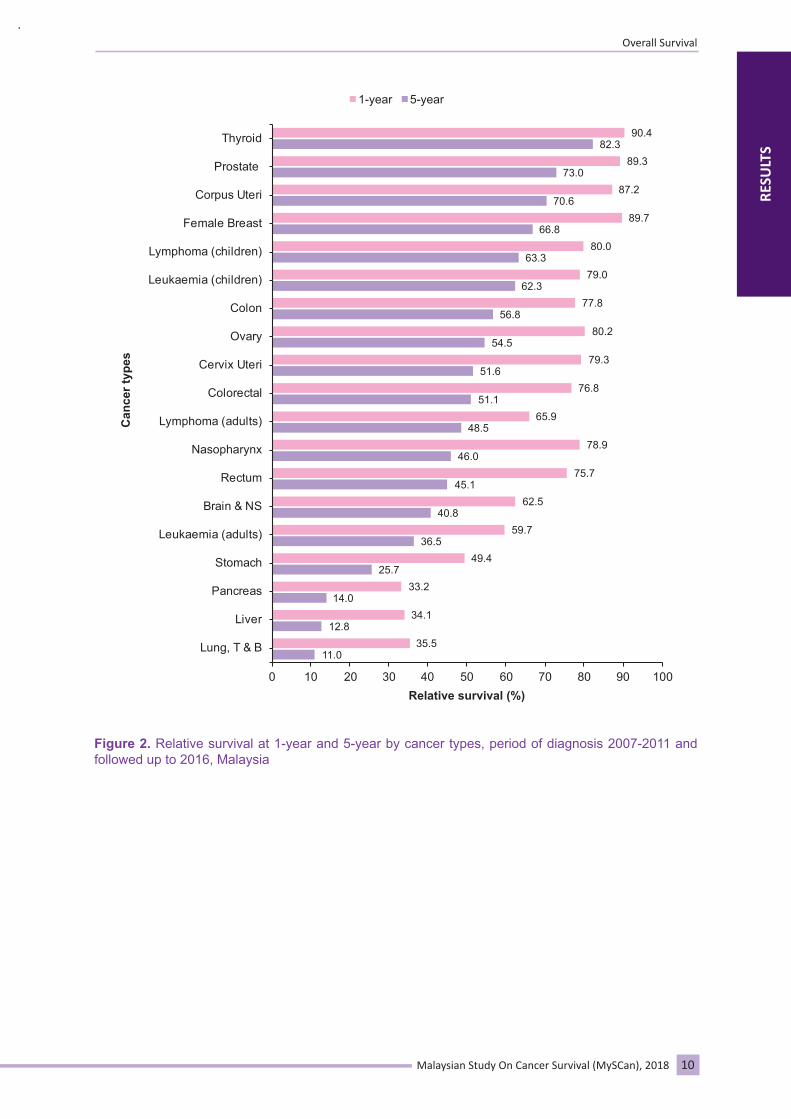
Figure 2. Relative survival at 1-year and 5-year by cancer types, period of diagnosis 2007-2011 and followed up to 2016, Malaysia
90.482.3
89.373.0
87.270.6
89.766.8
80.063.3
79.062.3
77.856.8
80.254.5
79.351.6
76.851.1
65.948.5
78.946.0
75.745.1
62.540.8
59.736.5
49.425.7
33.214.0
34.112.8
35.511.0
0 10 20 30 40 50 60 70 80 90 100Relative survival (%)
Can
cer t
ypes
1-year 5-year
Lung, T & B
Liver
Pancreas
Stomach
Leukaemia (adults)
Brain & NS
Rectum
Nasopharynx
Lymphoma (adults)
Colorectal
Cervix Uteri
Ovary
Colon
Leukaemia (children)
Lymphoma (children)
Female Breast
Corpus Uteri
Prostate
Thyroid
Overall Survival
10Malaysian Study On Cancer Survival (MySCan), 2018
RESU
LTS

3.2.1.1. Median Survival Time
Median survival time (MST) was estimated in all cancers except in cancer with total death of less than 50%, i.e. female breast (43.3%), thyroid (26.5%), corpus uteri (38.2%), childhood leukaemia (34.3%) and childhood lymphoma (34.0%). Median survival cannot be estimated if the number of deaths from total number of cancer analysed is less than 50%.
Table 7. Median survival time by cancer types, period of diagnosis 2007-2011 and followed up to 2016, Malaysia
Cancer types Totalcases
95% CI 95% CIMST(years)
MST(months)
Total death
NO. %
Women’s CancersFemale BreastCervix UteriOvaryCorpus Uteri
17009401530842038
Gastrointestinal CancersStomachColorectal Colon RectumLiverPancreas
2818120936273582027661438
Other CancersLung, T & BProstateNasopharynxThyroidBrain & NS
80212913469720581352
Haematological MalignanciesLymphoma overall Lymphoma (adults) Lymphoma (children)Leukaemia overall Leukaemia (adults) Leukaemia (children)
47094465244387326941179
737222471631778
226776303687394324701263
728717192896545877
2668258583
22081804404
43.356.052.938.2
80.463.158.867.789.387.8
90.859.061.726.564.9
56.757.934.057.067.034.3
-3.845.38
-
0.872.993.772.470.450.54
0.574.843.38
-1.97
3.052.79
-2.341.48
-
-(3.47, 4.37)(4.68, 6.14)
-
(0.80, 0.94)(2.84, 3.13)(3.50, 4.02)(2.37, 2.61)(0.42, 0.49)(0.50, 0.58)
(0.55, 0.59)(4.47, 5.14)(3.17, 3.68)
-(1.65, 2.56)
(2.71, 3.45)(2.48, 3.15)
-(2.03, 2.63)(1.35, 1.64)
-
-46.0964.56
-
10.3835.9145.2429.635.426.54
6.8358.0240.57
-23.69
36.5733.45
-28.0217.71
-
-(41.59, 52.44)(56.21, 73.63)
-
(9.63, 11.30)(34.14, 37.59)(42.05, 48.20)(28.42, 31.28)(5.06, 5.88)(6.01, 6.97)
(6.57, 7.10)(53.62, 61.73)(38.01, 44.16)
-(19.78, 30.75)
(32.56, 41.43)(29.86, 37.85)
-(24.34, 31.57)(16.23, 19.68)
-
Median Survival Time
11 Malaysian Study On Cancer Survival (MySCan), 2018
RESU
LTS

3.2.1.1. Median Survival Time
Median survival time (MST) was estimated in all cancers except in cancer with total death of less than 50%, i.e. female breast (43.3%), thyroid (26.5%), corpus uteri (38.2%), childhood leukaemia (34.3%) and childhood lymphoma (34.0%). Median survival cannot be estimated if the number of deaths from total number of cancer analysed is less than 50%.
Table 7. Median survival time by cancer types, period of diagnosis 2007-2011 and followed up to 2016, Malaysia
Cancer types Totalcases
95% CI 95% CIMST(years)
MST(months)
Total death
NO. %
Women’s CancersFemale BreastCervix UteriOvaryCorpus Uteri
17009401530842038
Gastrointestinal CancersStomachColorectal Colon RectumLiverPancreas
2818120936273582027661438
Other CancersLung, T & BProstateNasopharynxThyroidBrain & NS
80212913469720581352
Haematological MalignanciesLymphoma overall Lymphoma (adults) Lymphoma (children)Leukaemia overall Leukaemia (adults) Leukaemia (children)
47094465244
387326941179
737222471631778
226776303687394324701263
728717192896545877
2668258583
22081804404
43.356.052.938.2
80.463.158.867.789.387.8
90.859.061.726.564.9
56.757.934.057.067.034.3
-3.845.38
-
0.872.993.772.470.450.54
0.574.843.38
-1.97
3.052.79
-2.341.48
-
-(3.47, 4.37)(4.68, 6.14)
-
(0.80, 0.94)(2.84, 3.13)(3.50, 4.02)(2.37, 2.61)(0.42, 0.49)(0.50, 0.58)
(0.55, 0.59)(4.47, 5.14)(3.17, 3.68)
-(1.65, 2.56)
(2.71, 3.45)(2.48, 3.15)
-(2.03, 2.63)(1.35, 1.64)
-
-46.0964.56
-
10.3835.9145.2429.635.426.54
6.8358.0240.57
-23.69
36.5733.45
-28.0217.71
-
-(41.59, 52.44)(56.21, 73.63)
-
(9.63, 11.30)(34.14, 37.59)(42.05, 48.20)(28.42, 31.28)(5.06, 5.88)(6.01, 6.97)
(6.57, 7.10)(53.62, 61.73)(38.01, 44.16)
-(19.78, 30.75)
(32.56, 41.43)(29.86, 37.85)
-(24.34, 31.57)(16.23, 19.68)
-
Median Survival Time
11 Malaysian Study On Cancer Survival (MySCan), 2018
RESU
LTS
3.2.1.2. Cancer Survival by Sex
Females had higher 5-year RS compared to males. The five highest 5-year RS in females were thyroid (85.4%), corpus uteri (70.6%), female breast (66.8%), colon (58.3%), and ovarian (54.5%) cancers. Whereas in males were prostate (73.0%), thyroid (72.1%), colon (55.4%), lymphoma (47.3%) and nasopharynx (44.8%) cancers.
Table 8. Relative survival by cancer types and sex, period of diagnosis 2007-2011 and followed up to 2016, Malaysia
Women’s CancersFemale BreastCervix UteriOvaryCorpus Uteri
----
Gastrointestinal CancersStomachColorectal Colon RectumLiverPancreas
16446678329733812042799
Other CancersLung, T & BProstateNasopharynxThyroidBrain & NS
554329133486491748
Haematological MalignanciesLymphoma overall Lymphoma (adults) Lymphoma (children)Leukaemia overall Leukaemia (adults) Leukaemia (children)
2767260915821521484668
----
24.449.055.442.811.311.6
10.473.044.872.135.2
47.346.462.042.434.860.3
----
(22.0, 27.0)(47.5, 50.5)(53.2, 57.5)(40.8, 44.8)(9.8, 12.9)(9.3, 14.3)
(9.5, 11.3)(70.2, 75.7)(43.0, 46.6)(67.1, 76.6)(31.5, 38.9)
(45.2, 49.4)(44.2, 48.6)(53.2, 69.7)(40.1, 44.7)(32.2, 37.5)(56.2, 64.2)
Cancer typesMale Female
NO. 5-year RS (%) 95% CI
17009401530842038
1174541529762439724639
2478-
12111567604
1942185686
17211210511
66.851.654.570.6
27.453.858.348.217.317.1
12.5-
49.285.447.7
52.151.565.646.038.565.0
(66.0, 67.6)(49.8, 53.3)(52.6, 56.4)(68.2, 72.8)
(24.4, 30.5)(52.1, 55.4)(56.0, 60.5)(45.8, 50.7)(14.3, 20.5)(13.9, 20.5)
(11.1, 14.1)-
(46.2, 52.2)(83.2, 87.3)(43.4, 51.9)
(49.6, 54.6)(49.0, 54.0)(53.6, 75.2)(43.4, 48.5)(35.6, 41.4)(60.3, 69.3)
NO. 5-year RS (%) 95% CI
Survival by Sex
12Malaysian Study On Cancer Survival (MySCan), 2018
RESU
LTS

10.4
11.3
11.6
24.4
34.8
35.2
42.8
44.8
46.4
49.0
55.4
60.3
62.0
72.1
73.0
51.6
54.5
66.8
70.6
12.5
17.3
17.1
27.4
38.5
47.7
48.2
49.2
51.5
53.8
58.3
65.0
65.6
85.4
100 80 60 40 20 0 20 40 60 80 100
Cervix Uteri
Ovary
Female Breast
Corpus Uteri
Lung, T & B
Liver
Pancreas
Stomach
Leukaemia (adults)
Brain & NS
Rectum
Nasopharynx
Lymphoma (adults)
Colorectal
Colon
Leukaemia (children)
Lymphoma (children)
Thyroid
Prostate
Cancer types FemaleMale
5-year relative survival (%)
Figure 3. Relative survival by cancer types and sex, period of diagnosis 2007-2011 and followed up to 2016, Malaysia
Survival by Sex
13 Malaysian Study On Cancer Survival (MySCan), 2018
RESU
LTS
Table 9. Relative survival by major ethnic groups and cancer types, period of diagnosis 2007-2011 and followed up to 2016, Malaysia
Women’s CancersFemale BreastCervix UteriOvaryCorpus Uteri
57.944.854.864.5
Gastrointestinal CancersStomachColorectal Colon RectumLiverPancreas
27.644.951.439.211.617.7
Other CancersLung, T & BProstateNasopharynxThyroidBrain & NS
10.960.437.981.443.0
Haematological Malignancies Lymphoma overall Lymphoma (adults) Lymphoma (children)Leukaemia overall Leukaemia (adults) Leukaemia (children)
48.047.260.543.336.656.9
(56.7, 59.1)(41.9, 47.7)(52.1, 57.4)(60.9, 67.8)
(23.5, 31.9)(43.1, 46.6)(48.8, 54.0)(36.9, 41.6)(9.6, 13.8)(14.1, 21.7)
(9.7, 12.2)(55.7, 65.0)(35.0, 40.8)(78.8, 83.9)(39.0, 46.9)
(45.8, 50.1)(44.9, 49.4)(51.6, 68.3)(41.0, 45.5)(33.9, 39.3)(53.0, 60.6)
Cancer types5-year relative survival by major ethnic groups (%)
Malay 95% CI
76.557.751.475.5
26.955.560.149.812.910.7
10.081.952.286.237.9
52.752.463.944.236.872.3
(75.3, 77.6)(54.9, 60.4)(48.0, 54.6)(71.8, 79.0)
(24.2, 29.8)(53.9, 57.1)(57.9, 62.2)(47.4, 52.1)(11.0, 15.0)(8.4, 13.3)
(8.9, 11.1)(78.2, 85.4)(50.1, 54.2)(82.0, 89.8)(33.1, 42.6)
(49.7, 55.6)(49.4, 55.4)(42.9, 78.9)(40.9, 47.5)(33.2, 40.5)(65.5, 78.1)
Chinese 95% CI
70.547.052.979.5
23.558.360.456.217.419.8
19.373.937.087.639.1
57.956.876.951.643.475.6
(67.8, 73.1)(40.5, 53.5)(45.9, 59.6)(71.8, 85.9)
(18.0, 29.7)(53.4, 63.1)(53.5, 66.9)(49.1, 63.0)(9.7, 27.5)(11.9, 29.3)
(14.4, 24.8)(62.6, 84.5)(23.4, 51.2)(79.7, 93.3)(29.4, 48.7)
(51.2, 64.2)(49.9, 63.3)(43.2, 92.3)(45.1, 57.8)(36.0, 50.6)(63.1, 84.4)
Indian 95% CI
Indians had higher survivals for most of the cancers, followed by Chinese and Malays. Indians had the highest survival in thyroid (87.6%), corpus uteri (79.5%), colorectal (58.3%), pancreas (19.8%), lung, trachea & bronchus (19.3%) and both haematological malignancies.
Malays had the highest survival in ovarian cancers (54.8%), brain & nervous system (43.0%), and stomach (27.6%). Chinese had the highest survival in prostate (81.9%), female breast (76.5%), cervix uteri (57.7%) and nasopharynx (52.2%).
3.2.2 Cancer Survival by Ethnic Groups
Survival by Ethnic Groups
14Malaysian Study On Cancer Survival (MySCan), 2018
RESU
LTS

The five highest 5-year RS among Malays were thyroid, corpus uteri, prostate, female breast and ovary, among Chinese were thyroid, prostate, female breast, corpus uteri and colon cancers and among Indians were thyroid, corpus uteri, prostate, female breast and colon cancers.
In children, the 5-year RS was highest in Indians, followed by Chinese and Malays both in lymphoma and leukaemia.
Figure 4. Comparison of 5-year relative survival by 3 major ethnic groups, period of diagnosis 2007-2011 and followed up to 2016, Malaysia
0 10 20 30 40 50 60 70 80 90 100
Liver
Lung, T & B
Pancreas
Stomach
Nasopharynx
Brain & NS
Leukaemia (adults)
Cervix Uteri
Ovary
Rectum
Lymphoma (adults)
Colorectal
Colon
Female Breast
Prostate
Leukaemia (children)
Lymphoma (children)
Corpus Uteri
Thyroid
Can
cer t
ypes
Indian Chinese Malay
5-year relative survival (%)
Survival by Ethnic Groups
15 Malaysian Study On Cancer Survival (MySCan), 2018
RESU
LTS

The 5-year RS by age in adults were analysed in two age groups (15 to < 50 and ≥ 50 years old). In children the 5-year RS was analysed in three age groups (0-4, 5-9, 10-14 years old).
3.2.3 Cancer Survival by Age Groups
Table 10. Relative survival by cancer types and age groups (adults), period of diagnosis 2007-2011 and followed up to 2016, Malaysia
Cancer types5-year relative survival by age groups (%)
15 to < 50years old 95% CI
Women’s CancersFemale BreastCervix UteriOvaryCorpus Uteri
65.956.261.578.5
Gastrointestinal CancersStomachColorectal Colon RectumLiverPancreas
28.046.653.738.217.521.1
Other CancersLung, T & BProstateNasopharynxThyroidBrain & NS
15.443.651.694.847.5
Haematological MalignanciesLymphoma Leukaemia
58.443.8
(64.8, 67.0)(53.7, 58.7)(58.9, 64.1)(74.9 ,81.7)
(24.1, 32.1)( 44.5, 48.7)(50.7, 56.5)(35.1, 41.3)(14.5, 20.9)(16.2, 26.5)
(13.4, 17.5)(29.1, 57.3)(49.4, 53.8)(93.1, 96.1)(43.7, 51.3)
(56.0, 60.7)(41.2, 46.4)
≥ 50 years old 95% CI
67.648.348.366.8
25.252.457.746.811.512.4
10.273.640.867.033.6
41.327.1
(66.5, 68.8)(46.0, 50.6)(45.6, 51.0)(63.8, 69.7)
(23.0, 27.4)(51.1, 53.7)(55.9, 59.6)(45.0, 48.6)(10.0, 13.1)(10.3, 14.7)
(9.3, 11.0)(70.8, 76.4)(38.7, 43.0)(63.3, 70.6)(29.6, 37.7)
(39.0, 43.5)(24.3, 30.0)
Table 11. Relative survival by cancer types and age groups (children), period of diagnosis 2007-2011 and followed up to 2016, Malaysia
Cancertypes
5-year relative survival by age groups (%)
Lymphoma
Leukaemia
0-4years old
5-9years old95% CI 95% CI
10-14years old 95% CI
67.0
62.1
(53.5, 77.5)
(56.0, 67.6)
66.3
69.3
(50.3, 78.2)
(65.0, 73.1)
60.0
47.5
(50.0, 68.7)
(40.9, 53.9)
Survival by Age Groups
RESU
LTS
16Malaysian Study On Cancer Survival (MySCan), 2018
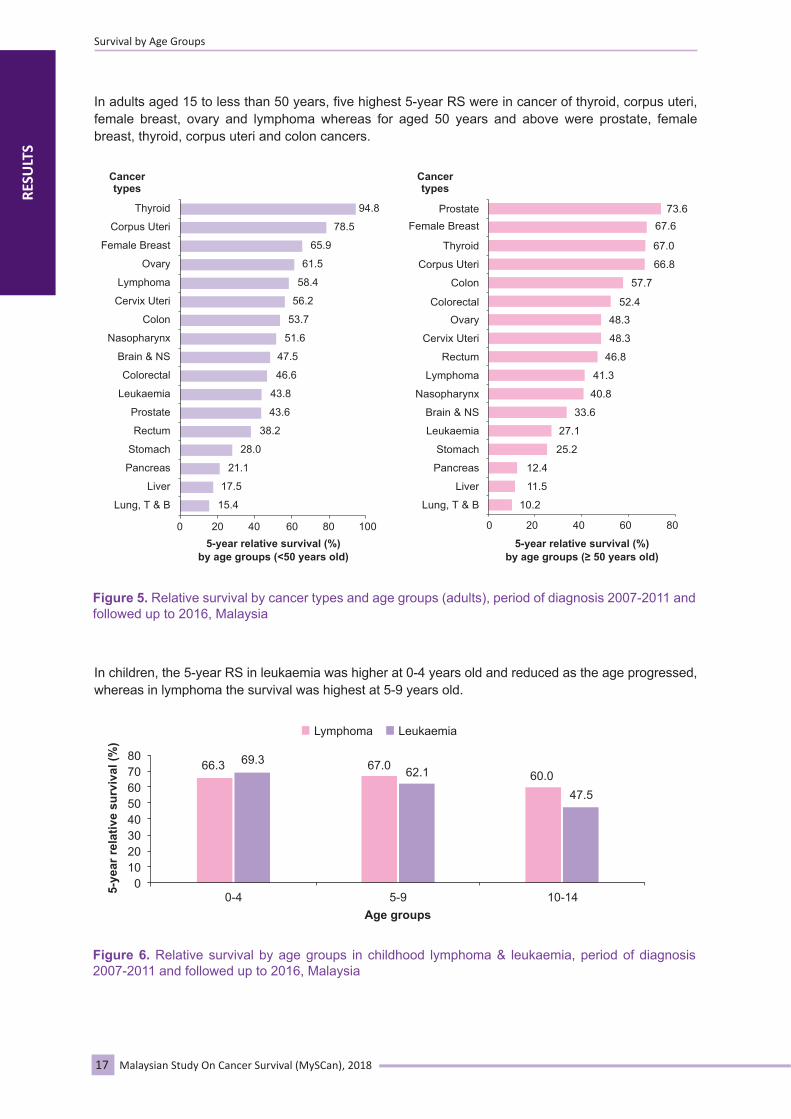
66.3 69.3 67.0 62.1 60.047.5
In adults aged 15 to less than 50 years, five highest 5-year RS were in cancer of thyroid, corpus uteri, female breast, ovary and lymphoma whereas for aged 50 years and above were prostate, female breast, thyroid, corpus uteri and colon cancers.
In children, the 5-year RS in leukaemia was higher at 0-4 years old and reduced as the age progressed, whereas in lymphoma the survival was highest at 5-9 years old.
Cancertypes
0 20 40 60 80 100
Lung, T & B
Liver
Pancreas
Stomach
Rectum
Prostate
Leukaemia
Colorectal
Brain & NS
Nasopharynx
Colon
Cervix Uteri
Lymphoma
Ovary
Female Breast
Corpus Uteri
Thyroid
15.4
17.5
21.1
28.0
38.2
43.6
43.8
46.6
47.5
51.6
53.7
56.2
58.4
61.5
65.9
78.5
94.8
5-year relative survival (%)by age groups (<50 years old)
Cancertypes
0 20 40 60 80
Lung, T & B
Liver
Pancreas
Stomach
Leukaemia
Brain & NS
Nasopharynx
Lymphoma
Rectum
Cervix Uteri
Ovary
Colorectal
Colon
Corpus Uteri
Thyroid
Female BreastProstate
10.2
11.5
12.4
25.2
27.1
33.6
40.8
41.3
46.8
48.3
48.3
52.4
57.7
66.8
67.0
67.673.6
5-year relative survival (%)by age groups (≥ 50 years old)
Figure 5. Relative survival by cancer types and age groups (adults), period of diagnosis 2007-2011 and followed up to 2016, Malaysia
Figure 6. Relative survival by age groups in childhood lymphoma & leukaemia, period of diagnosis 2007-2011 and followed up to 2016, Malaysia
5-ye
ar re
lativ
e su
rviv
al (%
)
80706050403020100
10-145-9Age groups
0-4
Lymphoma Leukaemia
Survival by Age Groups
17 Malaysian Study On Cancer Survival (MySCan), 2018
RESU
LTS

Survival analysis was done for all cancer types except for leukaemia (staging not applicable). Analysis was done only for cases with staging recorded which were 39,976 (58%) from total of 69,011 cases. Out of these, 18% was in stage I, 26% was in stage II and 56% was in late stage (stage III and IV).
3.2.4 Cancer Survival by Stage at Diagnosis
Table 12. Relative survival by stage of diagnosis and cancer types, period of diagnosis 2007-2011 and followed up to 2016, Malaysia
Cancer typesNO.
5-year relative survival (%)Totalnumbers of cases
Cases withstaging recorded
Women’s CancersFemale BreastCervix UteriOvaryCorpus Uteri
17009401530842038
Gastrointestinal CancersStomachColorectal Colon RectumLiverPancreas
2818120936273582027661438
Other CancersLung, T & BProstateNasopharynxThyroidBrain & NS
80212913469720581352
Haematological MalignanciesLymphoma overall Lymphoma (adults) Lymphoma (children)
47094465244
11444263121641374
12616962364133211178744
471514952563837528
2080198991
%
67.365.570.267.4
44.757.658.057.142.651.7
58.851.354.640.739.1
44.244.537.3
StageI
87.575.382.891.3
54.675.879.372.220.419.6
37.197.363.796.068.3
65.865.863.8
StageII
80.752.359.774.9
50.372.577.466.321.829.3
17.492.159.193.150.5
66.766.668.9
StageIII
59.732.137.150.2
28.255.662.547.912.810.0
7.593.050.281.232.8
50.049.461.0
StageIV
23.323.020.719.5
8.817.318.815.89.25.7
6.343.226.940.917.0
36.335.551.6
Survival by Stage at Diagnosis
18Malaysian Study On Cancer Survival (MySCan), 2018
RESU
LTS

RESU
LTS
At stage I: The highest 5-year RS was 97.3% and the lowest was 19.6%. The five highest 5-year RS were prostate, thyroid, corpus uteri, female breast, ovarian cancers and the lowest survival was in pancreas.
At stage II: The highest 5-year RS was 93.1% and the lowest was 17.4%. The five highest 5-year RS were thyroid, prostate, female breast, colon, corpus uteri cancers and the lowest survival was in lung, trachea & bronchus.
Figure 7. Stage I: Relative survival by cancer types, period of diagnosis 2007-2011 and followed up to 2016, Malaysia
Figure 8. Stage II: Relative survival by cancer types, period of diagnosis 2007-2011 and followed up to 2016, Malaysia
Can
cer t
ypes
19.620.4
37.154.6
63.763.8
65.868.3
72.275.3
79.382.8
87.591.3
96.097.3
0 20 40 60 80 100
PancreasLiver
Lung, T & BStomach
NasopharynxLymphoma (children)
Lymphoma (adults)Brain & NS
RectumCervix Uteri
ColonOvary
Female BreastCorpus Uteri
ThyroidProstate
5-year relative survival (%)
Can
cer t
ypes
17.421.8
29.350.350.5
52.359.159.7
66.366.6
68.974.9
77.480.7
92.193.1
0 20 40 60 80 100
PancreasLiver
Lung, T & B
Stomach
Nasopharynx
Lymphoma (children)Lymphoma (adults)
Brain & NS
Rectum
Cervix Uteri
Colon
Ovary
Female Breast
Corpus Uteri
Prostate
5-year relative survival (%)
Thyroid
Survival by Stage at Diagnosis
19 Malaysian Study On Cancer Survival (MySCan), 2018

At stage III: The highest 5-year RS was 93.0% and the lowest was 7.5%. The five highest 5-year RS were prostate, thyroid, colon, lymphoma (children), female breast and the lowest survival was in lung, trachea & bronchus.
Can
cer t
ypes
7.510.0
12.828.2
32.132.8
37.147.949.450.250.2
59.761.062.5
81.293.0
0 20 40 60 80 1005-year relative survival (%)
Figure 9. Stage III: Relative survival by cancer types, period of diagnosis 2007-2011 and followed up to 2016, Malaysia
At stage IV: The highest 5-year RS was 51.6% and the lowest was 5.7%. The five highest 5-year RS were lymphoma (children), prostate, thyroid, lymphoma (adults), nasopharynx and the lowest survival was in pancreas.
Can
cer t
ypes
5.76.3
8.89.2
15.817.0
18.819.5
20.723.023.3
26.935.5
40.943.2
51.6
0 10 20 30 40 50 605-year relative survival (%)
Figure 10. Stage IV: Relative survival by cancer types, period of diagnosis 2007-2011 and followed up to 2016, Malaysia
Lung, T & BPancreas
LiverStomach
Cervix UteriBrain & NS
OvaryRectum
Lymphoma (adults)Corpus Uteri
NasopharynxFemale Breast
Lymphoma (children)Colon
ThyroidProstate
PancreasLung, T & B
StomachLiver
RectumBrain & NS
ColonCorpus Uteri
OvaryCervix Uteri
Female BreastNasopharynx
Lymphoma (adults)Thyroid
ProstateLymphoma (children)
Survival by Stage at Diagnosis
20Malaysian Study On Cancer Survival (MySCan), 2018
RESU
LTS

3.3 Kaplan- Meier (KM) Survival Curve
KM graph up to 10 years after diagnosis: Period of diagnosis 2007-2011 and followed up to 2016, Malaysia
3.3.1 Gastrointestinal Cancers – Observed survival by ethnicity and age groups
Stomach (ICD-10: C16)
45-54
0.00
0 2 4 6 8 10Years Since Diagnosis (0-10)
15-44 45-54 55-64
65-74 75+
Stomach by Age Groups
0 2 4 6 8 10Years Since Diagnosis (0-10)
15-44 45-54 55-64
65-74 75+
Colorectal by Age Groups
025
5075
100
Surv
ival
Est
imat
es (%
)
0 2 4 6 8 10Years Since Diagnosis (0-10)
Male Female
Colorectal by Sex
025
5075
100
Sur
viva
l Est
imat
es (%
)
Sur
viva
l Est
imat
es (%
)0 2 4 6 8 10
Years Since Diagnosis (0-10)
Male Female
Stomach by Sex
0 2 4 6 8 10Years Since Diagnosis (0 - 10)
Malay Chinese Indian
Stomach by Ethnic Groups
0 2 4 6 8 10Years Since Diagnosis (0 - 10)
Malay Chinese Indian
Colorectal by Ethnic Groups
Sur
viva
l Est
imat
es (%
)
Sur
viva
l Est
imat
es (%
)
Sur
viva
l Est
imat
es (%
)
Sur
viva
l Est
imat
es (%
)0
2550
7510
0
025
5075
100
025
5075
100
025
5075
100
Colorectal (ICD-10: C18-21)
21 Malaysian Study On Cancer Survival (MySCan), 2018
KM G
RAPH
Gastrointestinal Cancers

KM graph up to 10 years after diagnosis: Period of diagnosis 2007-2011 and followed up to 2016, Malaysia
Colon (ICD-10: C18) Rectum (ICD-10: C19-21)
0 2 4 6 8 10Years Since Diagnosis (0-10)
15-44 45-54 55-64
65-74 75+
Colon by Age Groups
0 2 4 6 8 10Years Since Diagnosis (0-10)
15-44 45-54 55-64
65-74 75+
Rectum by Age Groups
0 2 4 6 8 10Years Since Diagnosis (0-10)
Male Female
Colon by Sex
0 2 4 6 8 10Years Since Diagnosis (0-10)
Male Female
Rectum by Sex
0 2 4 6 8 10Years Since Diagnosis (0 - 10)
Malay Chinese Indian
Colon by Ethnic Groups
0 2 4 6 8 10Years Since Diagnosis (0 - 10)
Malay Chinese Indian
Rectum by Ethnic Groups
Sur
viva
l Est
imat
es (%
)
Sur
viva
l Est
imat
es (%
)
Sur
viva
l Est
imat
es (%
)
Sur
viva
l Est
imat
es (%
)
Sur
viva
l Est
imat
es (%
)
Sur
viva
l Est
imat
es (%
)
22Malaysian Study On Cancer Survival (MySCan), 2018
KM G
RAPH
Gastrointestinal Cancers
025
5075
100
025
5075
100
025
5075
100
025
5075
100
025
5075
100
025
5075
100

KM graph up to 10 years after diagnosis: Period of diagnosis 2007-2011 and followed up to 2016, Malaysia
Liver (ICD-10: C22) Pancreas (ICD-10: C25)
0 2 4 6 8 10Years Since Diagnosis (0-10)
15-44 45-54 55-64
65-74 75+
Liver by Age Groups
0 2 4 6 8 10Years Since Diagnosis (0-10)
15-44 45-54 55-64
65-74 75+
Pancreas by Age Groups
0 2 4 6 8 10Years Since Diagnosis (0-10)
Male Female
Liver by Sex
0 2 4 6 8 10Years Since Diagnosis (0-10)
Male Female
Pancreas by Sex
0 2 4 6 8 10Years Since Diagnosis (0 - 10)
Malay Chinese Indian
Liver by Ethnic Groups
0 2 4 6 8 10Years Since Diagnosis (0 - 10)
Malay Chinese Indian
Pancreas by Ethnic Groups
Sur
viva
l Est
imat
es (%
)
Sur
viva
l Est
imat
es (%
)
Sur
viva
l Est
imat
es (%
)
Sur
viva
l Est
imat
es (%
)
Sur
viva
l Est
imat
es (%
)
Sur
viva
l Est
imat
es (%
)
23 Malaysian Study On Cancer Survival (MySCan), 2018
KM G
RAPH
Gastrointestinal Cancers
025
5075
100
025
5075
100
025
5075
100
025
5075
100
025
5075
100
025
5075
100
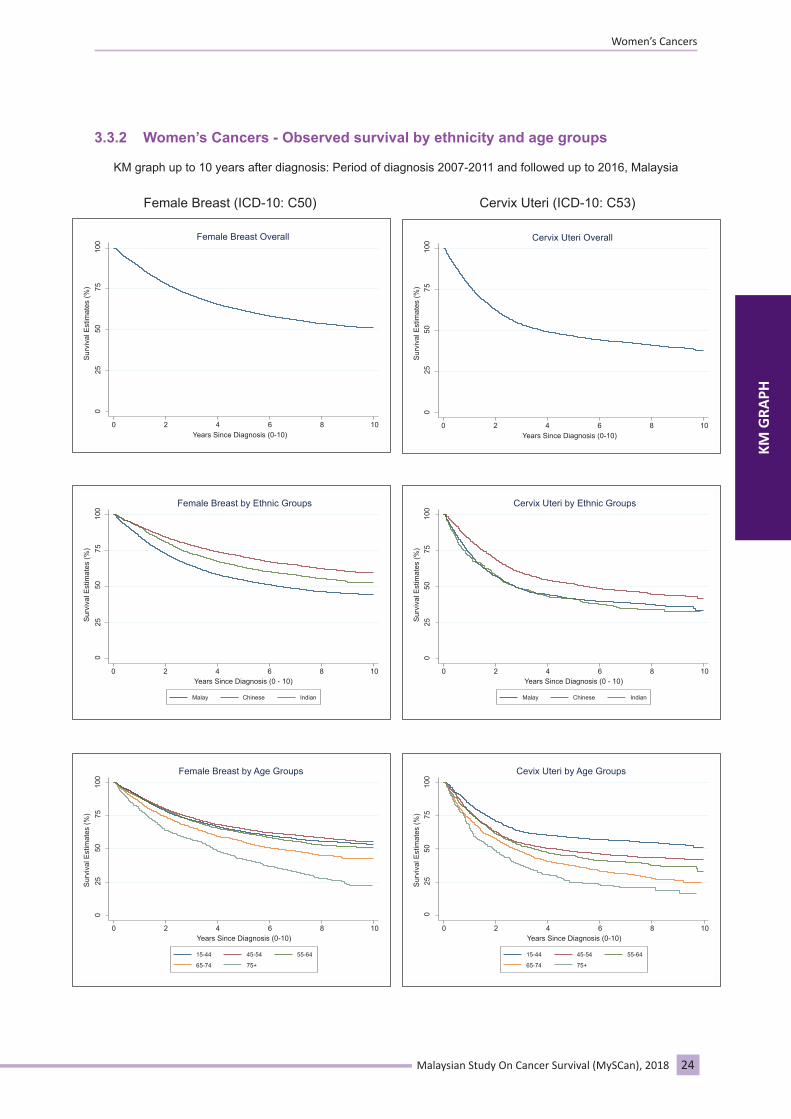
KM graph up to 10 years after diagnosis: Period of diagnosis 2007-2011 and followed up to 2016, Malaysia
3.3.2 Women’s Cancers - Observed survival by ethnicity and age groups
Female Breast (ICD-10: C50) Cervix Uteri (ICD-10: C53)
0 2 4 6 8 10Years Since Diagnosis (0-10)
15-44 45-54 55-64
65-74 75+
Female Breast by Age Groups
Surv
ival
Est
imat
es (%
)
0 2 4 6 8 10Years Since Diagnosis (0-10)
15-44 45-54 55-64
65-74 75+
Cevix Uteri by Age Groups
0 2 4 6 8 10Years Since Diagnosis (0-10)
Female Breast Overall
Surv
ival
Est
imat
es (%
)
0 2 4 6 8 10Years Since Diagnosis (0-10)
Cervix Uteri Overall
0 2 4 6 8 10Years Since Diagnosis (0 - 10)
Malay Chinese Indian
Female Breast by Ethnic Groups
Surv
ival
Est
imat
es (%
)
0 2 4 6 8 10Years Since Diagnosis (0 - 10)
Malay Chinese Indian
Cervix Uteri by Ethnic Groups
Sur
viva
l Est
imat
es (%
)
Sur
viva
l Est
imat
es (%
)
Sur
viva
l Est
imat
es (%
)
Sur
viva
l Est
imat
es (%
)
Sur
viva
l Est
imat
es (%
)
Sur
viva
l Est
imat
es (%
)
Women’s Cancers
24Malaysian Study On Cancer Survival (MySCan), 2018
KM G
RAPH
025
5075
100
025
5075
100
025
5075
100
025
5075
100
025
5075
100
025
5075
100

KM graph up to 10 years after diagnosis: Period of diagnosis 2007-2011 and followed up to 2016, Malaysia
Ovary (ICD-10: C56) Corpus Uteri (ICD-10: C54)
0 2 4 6 8 10Years Since Diagnosis (0-10)
15-44 45-54 55-64
65-74 75+
Ovary by Age Groups
Surv
ival
Est
imat
es (%
)
0 2 4 6 8 10Years Since Diagnosis (0-10)
15-44 45-54 55-64
65-74 75+
Corpus Uteri by Age Groups
0 2 4 6 8 10Years Since Diagnosis (0-10)
Ovary Overall
Surv
ival
Est
imat
es (%
)
0 2 4 6 8 10Years Since Diagnosis (0-10)
Corpus Uteri Overall
0 2 4 6 8 10Years Since Diagnosis (0 - 10)
Malay Chinese Indian
Ovary by Ethnic Groups
Surv
ival
Est
imat
es (%
)
0 2 4 6 8 10Years Since Diagnosis (0 - 10)
Malay Chinese Indian
Corpus Uteri by Ethnic Groups
Sur
viva
l Est
imat
es (%
)
Sur
viva
l Est
imat
es (%
)
Sur
viva
l Est
imat
es (%
)
Sur
viva
l Est
imat
es (%
)
Sur
viva
l Est
imat
es (%
)
Sur
viva
l Est
imat
es (%
)
25 Malaysian Study On Cancer Survival (MySCan), 2018
KM G
RAPH
Women’s Cancers
025
5075
100
025
5075
100
025
5075
100
025
5075
100
025
5075
100
025
5075
100

KM graph up to 10 years after diagnosis: Period of diagnosis 2007-2011 and followed up to 2016, Malaysia
3.3.3 Haematological Malignancies - Observed survival by ethnicity and age groups
Lymphoma (adults) (ICD-10: C81-85; C96) Leukaemia (adults) (ICD-10: C91-95)
025
5075
100
0 2 4 6 8 10Years Since Diagnosis (0 - 10)
15-44 45-54 55-64
65-74 75+
Lymphoma (adults) by Age Groups
025
5075
100
Surv
ival
Est
imat
es (%
)
0 2 4 6 8 10Years Since Diagnosis (0 - 10)
15-44 45-54 55-64
65-74 75+
Leukaemia (adults) by Age Groups
025
5075
100
0 2 4 6 8 10Years Since Diagnosis (0 - 10)
Male Female
Lymphoma (adults) by Sex
025
5075
100
Surv
ival
Est
imat
es (%
)
0 2 4 6 8 10Years Since Diagnosis (0 - 10)
Male Female
Leukaemia (adults) by Sex
025
5075
100
0 2 4 6 8 10Years Since Diagnosis (0 - 10)
Malay Chinese Indian
Lymphoma (adults) by Ethnic Groups
025
5075
100
Surv
ival
Est
imat
es (%
)
0 2 4 6 8 10Years Since Diagnosis (0 - 10)
Malay Chinese Indian
Leukaemia (adults) by Ethnic Groups
Sur
viva
l Est
imat
es (%
)
Sur
viva
l Est
imat
es (%
)
Sur
viva
l Est
imat
es (%
)
Sur
viva
l Est
imat
es (%
)
Sur
viva
l Est
imat
es (%
)
Sur
viva
l Est
imat
es (%
)
Haematological Malignancies
26Malaysian Study On Cancer Survival (MySCan), 2018
KM G
RAPH
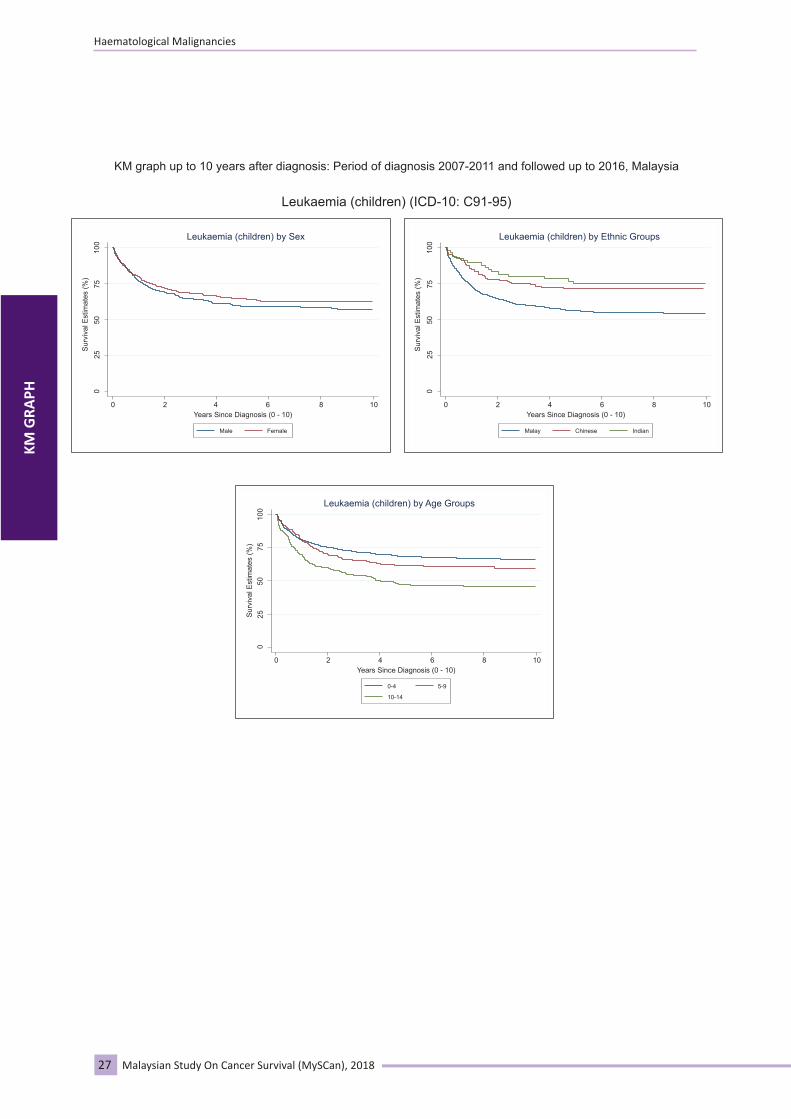
KM graph up to 10 years after diagnosis: Period of diagnosis 2007-2011 and followed up to 2016, Malaysia
Leukaemia (children) (ICD-10: C91-95)
025
5075
100
0 2 4 6 8 10Years Since Diagnosis (0 - 10)
0-4 5-9
10-14
Leukaemia (children) by Age Groups
025
5075
100
0 2 4 6 8 10Years Since Diagnosis (0 - 10)
Male Female
Leukaemia (children) by Sex
025
5075
100
0 2 4 6 8 10Years Since Diagnosis (0 - 10)
Malay Chinese Indian
Leukaemia (children) by Ethnic Groups
Sur
viva
l Est
imat
es (%
)
Sur
viva
l Est
imat
es (%
)
Sur
viva
l Est
imat
es (%
)
27 Malaysian Study On Cancer Survival (MySCan), 2018
KM G
RAPH
Haematological Malignancies
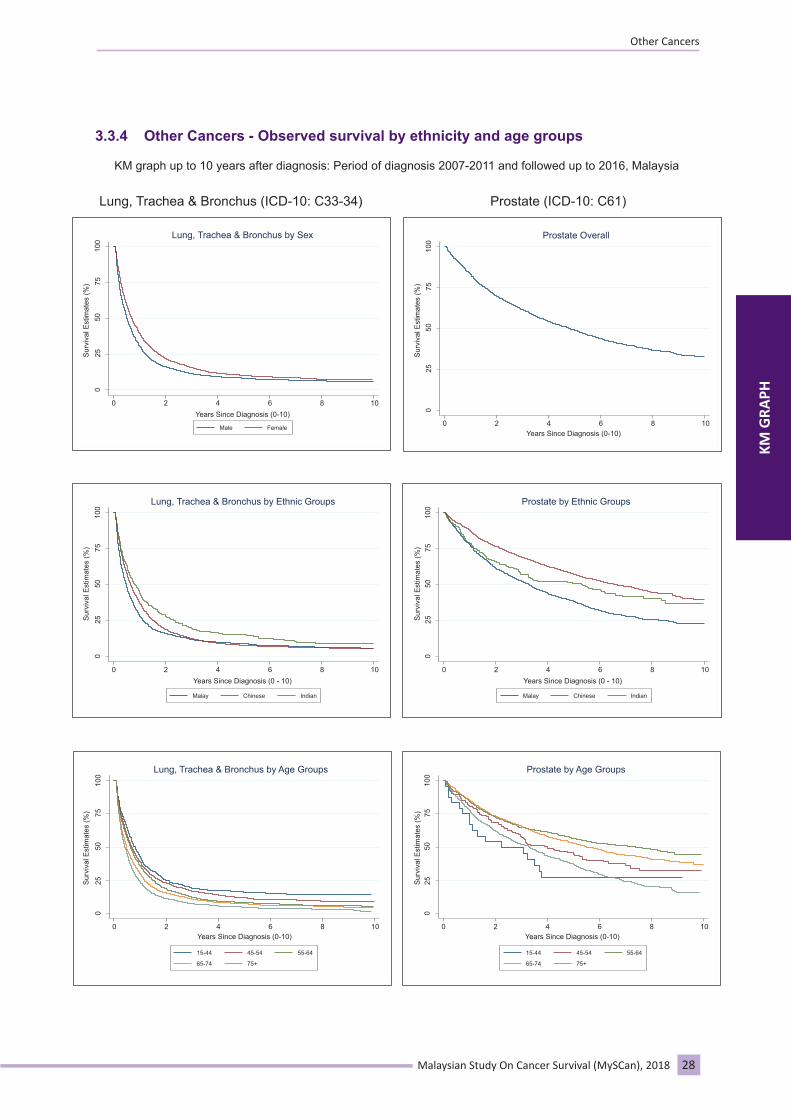
KM graph up to 10 years after diagnosis: Period of diagnosis 2007-2011 and followed up to 2016, Malaysia
3.3.4 Other Cancers - Observed survival by ethnicity and age groups
Lung, Trachea & Bronchus (ICD-10: C33-34) Prostate (ICD-10: C61)
025
5075
100
0 2 4 6 8 10Years Since Diagnosis (0-10)
15-44 45-54 55-64
65-74 75+
Lung, Trachea & Bronchus by Age Groups
025
5075
100
0 2 4 6 8 10Years Since Diagnosis (0-10)
15-44 45-54 55-64
65-74 75+
Prostate by Age Groups
025
5075
100
0 2 4 6 8 10Years Since Diagnosis (0-10)
Prostate Overall
025
5075
100
0 2 4 6 8 10Years Since Diagnosis (0-10)
Male Female
Lung, Trachea & Bronchus by Sex
025
5075
100
0 2 4 6 8 10Years Since Diagnosis (0 - 10)
Malay Chinese Indian
Lung, Trachea & Bronchus by Ethnic Groups
025
5075
100
0 2 4 6 8 10Years Since Diagnosis (0 - 10)
Malay Chinese Indian
Prostate by Ethnic Groups
Sur
viva
l Est
imat
es (%
)
Sur
viva
l Est
imat
es (%
)
Sur
viva
l Est
imat
es (%
)
Sur
viva
l Est
imat
es (%
)
Sur
viva
l Est
imat
es (%
)
Sur
viva
l Est
imat
es (%
)
28Malaysian Study On Cancer Survival (MySCan), 2018
KM G
RAPH
Other Cancers

KM graph up to 10 years after diagnosis: Period of diagnosis 2007-2011 and followed up to 2016, Malaysia
Nasopharynx (ICD-10: C11) Thyroid (ICD-10: C73)
025
5075
100
0 2 4 6 8 10Years Since Diagnosis (0-10)
15-44 45-54 55-64
65-74 75+
Nasopharynx by Age Groups
025
5075
100
0 2 4 6 8 10Years Since Diagnosis (0-10)
15-44 45-54 55-64
65-74 75+
Thyroid by Age Groups
025
5075
100
0 2 4 6 8 10Years Since Diagnosis (0-10)
Male Female
Nasopharynx by Sex
025
5075
100
Surv
ival
Est
imat
es (%
)
0 2 4 6 8 10Years Since Diagnosis (0-10)
Male Female
Thyroid by Sex
025
5075
100
0 2 4 6 8 10Years Since Diagnosis (0 - 10)
Malay Chinese Indian
Nasopharynx by Ethnic Groups0
2550
7510
0
0 2 4 6 8 10Years Since Diagnosis (0 - 10)
Malay Chinese Indian
Thyroid by Ethnic Groups
Sur
viva
l Est
imat
es (%
)
Sur
viva
l Est
imat
es (%
)
Sur
viva
l Est
imat
es (%
)
Sur
viva
l Est
imat
es (%
)
Sur
viva
l Est
imat
es (%
)
Sur
viva
l Est
imat
es (%
)
29 Malaysian Study On Cancer Survival (MySCan), 2018
KM G
RAPH
Other Cancers

KM graph up to 10 years after diagnosis: Period of diagnosis 2007-2011 and followed up to 2016, Malaysia
Brain & Nervous System (ICD-10: C71-72)
025
5075
100
0 2 4 6 8 10Years Since Diagnosis (0-10)
15-44 45-54 55-64
65-74 75+
Brain & Nervous System by Age Groups
025
5075
100
0 2 4 6 8 10Years Since Diagnosis (0-10)
Male Female
Brain & Nervous System by Sex
025
5075
100
0 2 4 6 8 10Years Since Diagnosis (0 - 10)
Malay Chinese Indian
Brain & Nervous System by Ethnic Groups
Kaplan-Meier survival curve ended
Sur
viva
l Est
imat
es (%
)
Sur
viva
l Est
imat
es (%
)
Sur
viva
l Est
imat
es (%
)
Other Cancers
30Malaysian Study On Cancer Survival (MySCan), 2018
KM G
RAPH
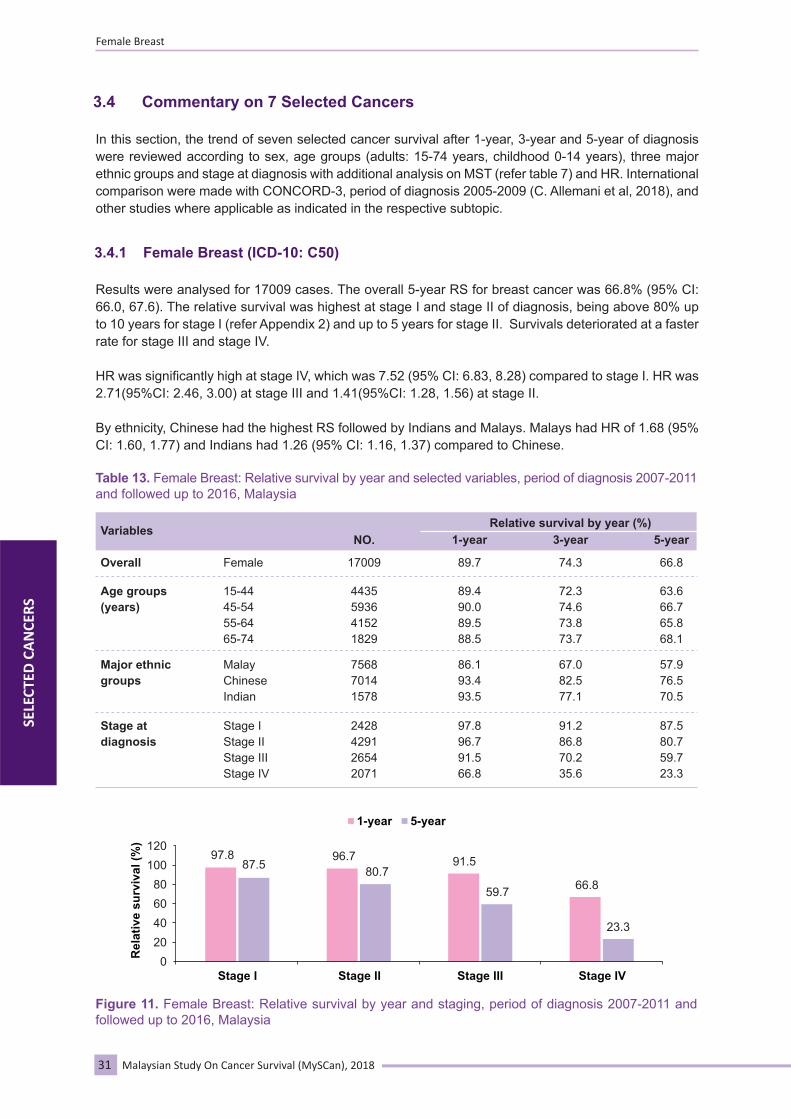
Figure 11. Female Breast: Relative survival by year and staging, period of diagnosis 2007-2011 and followed up to 2016, Malaysia
In this section, the trend of seven selected cancer survival after 1-year, 3-year and 5-year of diagnosis were reviewed according to sex, age groups (adults: 15-74 years, childhood 0-14 years), three major ethnic groups and stage at diagnosis with additional analysis on MST (refer table 7) and HR. International comparison were made with CONCORD-3, period of diagnosis 2005-2009 (C. Allemani et al, 2018), and other studies where applicable as indicated in the respective subtopic.
3.4 Commentary on 7 Selected Cancers
31 Malaysian Study On Cancer Survival (MySCan), 2018
3.4.1 Female Breast (ICD-10: C50)
Results were analysed for 17009 cases. The overall 5-year RS for breast cancer was 66.8% (95% CI: 66.0, 67.6). The relative survival was highest at stage I and stage II of diagnosis, being above 80% up to 10 years for stage I (refer Appendix 2) and up to 5 years for stage II. Survivals deteriorated at a faster rate for stage III and stage IV.
HR was significantly high at stage IV, which was 7.52 (95% CI: 6.83, 8.28) compared to stage I. HR was 2.71(95%CI: 2.46, 3.00) at stage III and 1.41(95%CI: 1.28, 1.56) at stage II.
By ethnicity, Chinese had the highest RS followed by Indians and Malays. Malays had HR of 1.68 (95% CI: 1.60, 1.77) and Indians had 1.26 (95% CI: 1.16, 1.37) compared to Chinese.
97.887.5
96.780.7
91.5
59.7 66.8
23.3
Rel
ativ
e su
rviv
al (%
) 120100806040200
Stage I
1-year
Stage II Stage III Stage IV
5-year
Table 13. Female Breast: Relative survival by year and selected variables, period of diagnosis 2007-2011 and followed up to 2016, Malaysia
VariablesNO.
Overall Female 17009 89.7 74.3 66.8
Age groups(years)
15-4445-5455-6465-74
4435593641521829
89.490.089.588.5
72.374.673.873.7
63.666.765.868.1
Major ethnic groups
MalayChineseIndian
756870141578
86.193.493.5
67.082.577.1
57.976.570.5
Stage atdiagnosis
Stage IStage IIStage IIIStage IV
2428429126542071
97.896.791.566.8
91.286.870.235.6
87.580.759.723.3
1-yearRelative survival by year (%)
3-year 5-year
SELE
CTED
CA
NCE
RSFemale Breast
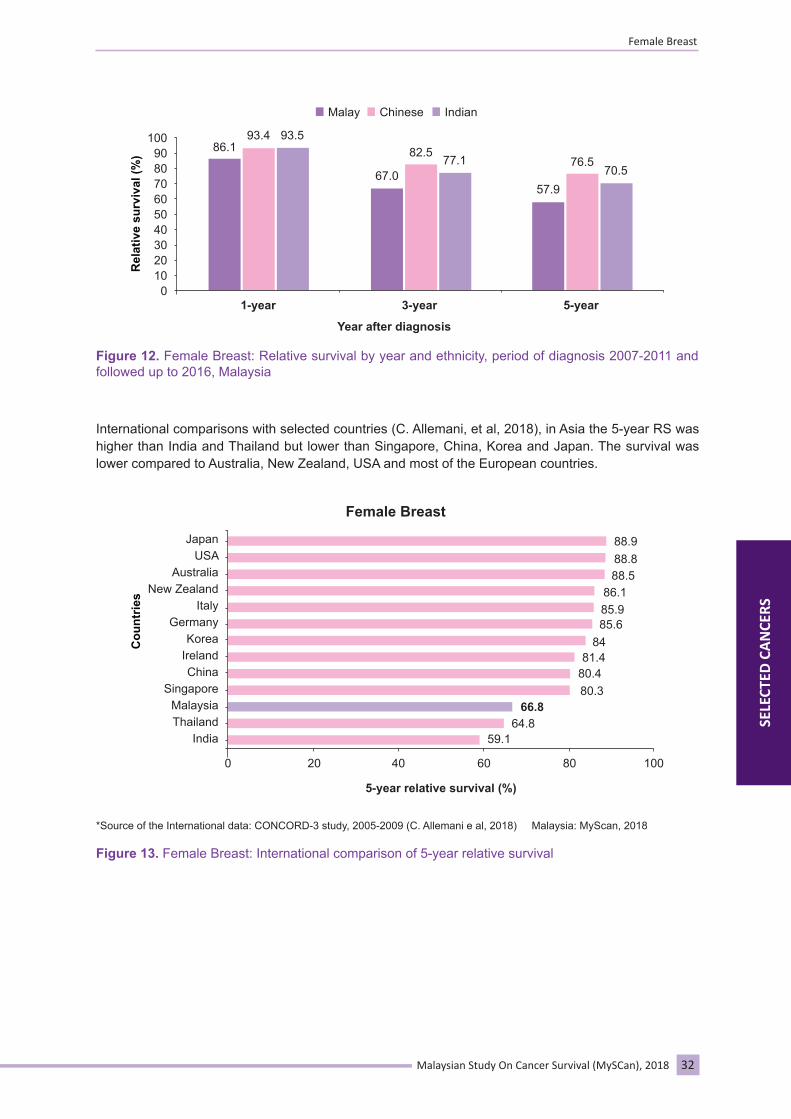
Figure 11. Female Breast: Relative survival by year and staging, period of diagnosis 2007-2011 and followed up to 2016, Malaysia
In this section, the trend of seven selected cancer survival after 1-year, 3-year and 5-year of diagnosis were reviewed according to sex, age groups (adults: 15-74 years, childhood 0-14 years), three major ethnic groups and stage at diagnosis with additional analysis on MST (refer table 7) and HR. International comparison were made with CONCORD-3, period of diagnosis 2005-2009 (C. Allemani et al, 2018), and other studies where applicable as indicated in the respective subtopic.
3.4 Commentary on 7 Selected Cancers
31 Malaysian Study On Cancer Survival (MySCan), 2018
3.4.1 Female Breast (ICD-10: C50)
Results were analysed for 17009 cases. The overall 5-year RS for breast cancer was 66.8% (95% CI: 66.0, 67.6). The relative survival was highest at stage I and stage II of diagnosis, being above 80% up to 10 years for stage I (refer Appendix 2) and up to 5 years for stage II. Survivals deteriorated at a faster rate for stage III and stage IV.
HR was significantly high at stage IV, which was 7.52 (95% CI: 6.83, 8.28) compared to stage I. HR was 2.71(95%CI: 2.46, 3.00) at stage III and 1.41(95%CI: 1.28, 1.56) at stage II.
By ethnicity, Chinese had the highest RS followed by Indians and Malays. Malays had HR of 1.68 (95% CI: 1.60, 1.77) and Indians had 1.26 (95% CI: 1.16, 1.37) compared to Chinese.
97.887.5
96.780.7
91.5
59.7 66.8
23.3
Rel
ativ
e su
rviv
al (%
) 120100806040200
Stage I
1-year
Stage II Stage III Stage IV
5-year
Table 13. Female Breast: Relative survival by year and selected variables, period of diagnosis 2007-2011 and followed up to 2016, Malaysia
VariablesNO.
Overall Female 17009 89.7 74.3 66.8
Age groups(years)
15-4445-5455-6465-74
4435593641521829
89.490.089.588.5
72.374.673.873.7
63.666.765.868.1
Major ethnic groups
MalayChineseIndian
756870141578
86.193.493.5
67.082.577.1
57.976.570.5
Stage atdiagnosis
Stage IStage IIStage IIIStage IV
2428429126542071
97.896.791.566.8
91.286.870.235.6
87.580.759.723.3
1-yearRelative survival by year (%)
3-year 5-year
SELE
CTED
CA
NCE
RS
Female Breast
International comparisons with selected countries (C. Allemani, et al, 2018), in Asia the 5-year RS was higher than India and Thailand but lower than Singapore, China, Korea and Japan. The survival was lower compared to Australia, New Zealand, USA and most of the European countries.
32Malaysian Study On Cancer Survival (MySCan), 2018
Figure 12. Female Breast: Relative survival by year and ethnicity, period of diagnosis 2007-2011 and followed up to 2016, Malaysia
IndianChineseMalay
86.193.4 93.5
67.0
82.577.1
57.9
76.570.5
Rel
ativ
e su
rviv
al (%
)1009080706050403020100
1-year 3-year 5-year
59.164.8
80.380.481.4
8485.685.986.1
88.588.888.9
66.8
Female Breast
Cou
ntrie
s
JapanUSA
AustraliaNew Zealand
ItalyGermany
KoreaIrelandChina
SingaporeMalaysiaThailand
India
0 20 40 60 80 100
5-year relative survival (%)
*Source of the International data: CONCORD-3 study, 2005-2009 (C. Allemani e al, 2018) Malaysia: MyScan, 2018
Figure 13. Female Breast: International comparison of 5-year relative survival
Female Breast
Year after diagnosis
SELE
CTED
CA
NCE
RS

33 Malaysian Study On Cancer Survival (MySCan), 2018
3.4.2 Colorectal (ICD-10: C18-21)
Results were analysed for 12093 cases of colorectal cancer, which consisted of 6273 patients with colon and 5820 patients with rectal cancers. The 5-year RS in colorectal was 51.1% with MST of 35.9 months. Indians and Chinese had higher survival than Malays. Simple cox regression shown Malays had HR of 1.19 (95% CI: 1.13, 1.25) compared to Chinese. Survival deteriorated at advanced stage with HR of 1.45 (95% CI: 1.29, 1.64) at stage III and 3.86 (95% CI: 3.44, 4.32) at stage IV compared to stage 1.
Table 15. Colon & Rectum: 5-year relative survival by selected variables, period of diagnosis 2007-2011 and followed up to 2016, Malaysia
Table 14. Colorectal: Relative survival by year and selected variables, period of diagnosis 2007-2011 and followed up to 2016, Malaysia
VariablesNO.
Overall 12093 76.8 56.9 51.1
Sex MaleFemale
76.477.3
66785415
1323220034543254
55.658.5
49.053.8
Age groups(years)
15-4445-5455-6465-74
77.078.976.375.0
55.555.754.655.0
47.447.447.349.4
43986204673
Major ethnicgroups
MalayChineseIndian
72.080.181.8
51.960.464.7
44.955.558.3
793172822252216
Stage at diagnosis
Stage IStage IIStage IIIStage IV
87.889.986.055.1
77.976.963.724.0
75.872.555.617.3
1-yearRelative survival by year (%)
3-year 5-year
VariablesNO.
Overall 6273 56.8 5820 45.1
Sex MaleFemale
55.458.3
32972976
731113117721618
33812439
42.848.2
Age groups(years)
15-4445-5455-6465-74
55.251.852.654.7
592106916821636
37.642.841.744.3
20133487339
Major ethnicgroups
MalayChineseIndian
51.460.160.4
23852717334
39.249.856.2
40296511711103
Stage atdiagnosis
Stage IStage IIStage IIIStage IV
79.377.462.518.8
391763
10541113
72.266.347.915.8
RS (%)Colon Rectum
NO. RS (%)
ColorectalSE
LECT
ED C
AN
CERS
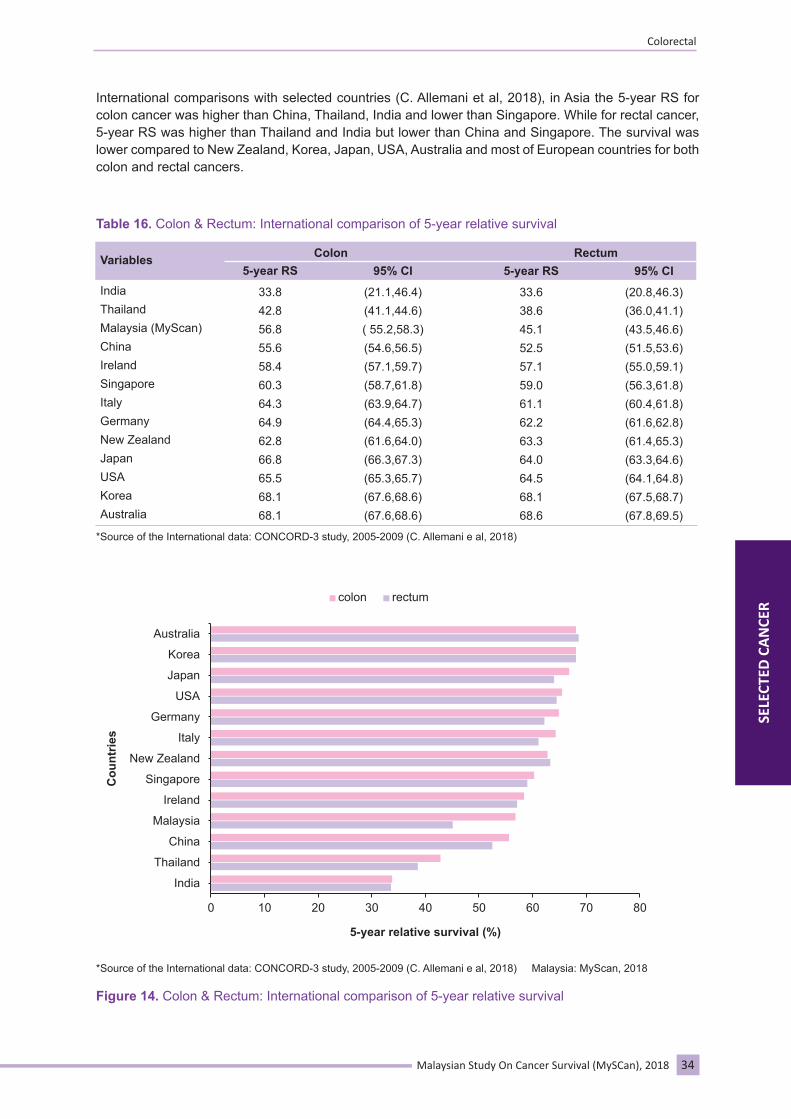
International comparisons with selected countries (C. Allemani et al, 2018), in Asia the 5-year RS for colon cancer was higher than China, Thailand, India and lower than Singapore. While for rectal cancer, 5-year RS was higher than Thailand and India but lower than China and Singapore. The survival was lower compared to New Zealand, Korea, Japan, USA, Australia and most of European countries for both colon and rectal cancers.
34Malaysian Study On Cancer Survival (MySCan), 2018
Table 16. Colon & Rectum: International comparison of 5-year relative survival
Variables5-year RS
IndiaThailandMalaysia (MyScan) ChinaIrelandSingaporeItaly GermanyNew ZealandJapanUSAKoreaAustralia
33.842.856.855.658.460.364.364.962.866.865.568.168.1
95% CI
(21.1,46.4)(41.1,44.6)( 55.2,58.3)(54.6,56.5)(57.1,59.7)(58.7,61.8)(63.9,64.7)(64.4,65.3)(61.6,64.0)(66.3,67.3)(65.3,65.7)(67.6,68.6)(67.6,68.6)
5-year RS
33.638.645.152.557.159.061.162.263.364.064.568.168.6
95% CI
(20.8,46.3)(36.0,41.1)(43.5,46.6)(51.5,53.6)(55.0,59.1)(56.3,61.8)(60.4,61.8)(61.6,62.8)(61.4,65.3)(63.3,64.6)(64.1,64.8)(67.5,68.7)(67.8,69.5)
Colon Rectum
*Source of the International data: CONCORD-3 study, 2005-2009 (C. Allemani e al, 2018)
*Source of the International data: CONCORD-3 study, 2005-2009 (C. Allemani e al, 2018) Malaysia: MyScan, 2018
Figure 14. Colon & Rectum: International comparison of 5-year relative survival
0 10 20 30 40 50 60 70 80
India
Thailand
China
Malaysia
Ireland
Singapore
New Zealand
Italy
Germany
USA
Japan
Korea
Australia
Cou
ntrie
s
colon rectum
5-year relative survival (%)
Colorectal
SELE
CTED
CA
NCE
R

35 Malaysian Study On Cancer Survival (MySCan), 2018
3.4.3 Lung, Trachea & Bronchus (ICD-10: C33-34)
Results were analysed for 8021 cases. 5-year RS for lung, trachea and bronchus was 11.0% with MST of 6.8 months. RS was low for all variables and deteriorated at late stage. HR at stage IV was 2.36 (95% CI: 2.01, 2.75), 1.97 (95% CI: 1.67, 2.31) at stage III and 1.41 (95% CI: 1.17, 1.70) at stage II compared to stage I. HR in Malays was 1.15 (95% CI: 1.09, 1.21) compared to Chinese.
Figure 15. Lung, Trachea & Bronchus: Relative survival by year and staging, period of diagnosis 2007-2011 and followed up to 2016, Malaysia
Table 17. Lung, Trachea & Bronchus: Relative survival by year and selected variables, period of diagnosis 2007-2011 and followed up to 2016, Malaysia
VariablesNO.
Overall 8021 35.5 14.3 11.0
Sex MaleFemale
32.641.7
55432478
657147323082452
12.917.4
10.412.5
Age groups(years)
15-4445-5455-6465-74
43.139.837.032.0
19.417.513.112.7
16.512.59.69.7
31163888304
Major ethnic groups
MalayChineseIndian
30.139.947.2
13.414.122.5
10.910.019.3
22335011353007
Stage at diagnosis
Stage IStage IIStage IIIStage IV
63.353.139.429.6
43.325.811.59.0
37.117.47.56.3
1-yearRelative survival by year (%)
3-year 5-year
63.3
37.1
53.1
17.4
39.4
7.5
29.6
6.3Rel
ativ
e su
rviv
al (%
)
70
60
50
40
30
20
10
0Stage I
1-year
Stage II Stage III Stage IV
5-year
Lung, Trachea & BronchusSE
LECT
ED C
AN
CERS

International comparisons with selected countries (C. Allemani et al, 2018), in Asia the 5-year RS for lung cancer was higher than Thailand and India but lower than Singapore. The survival was lower compared to China, Korea, Japan, Australia, USA and most of the European countries.
36Malaysian Study On Cancer Survival (MySCan), 2018
Figure 16. Lung, Trachea & Bronchus: Relative survival by year and ethnicity, period of diagnosis 2007-2011 and followed up to 2016, Malaysia
*Source of the International data: CONCORD-3 study, 2005-2009 (C. Allemani e al, 2018) Malaysia: MyScan, 2018
Figure 17. Lung, Trachea & Bronchus: International comparison of 5-year relative survival
30.1
13.4 10.9
39.9
14.1 10.0
47.2
22.5 19.3
05
101520253035404550
1-year 3-year 5-year
Rel
ativ
e su
rviv
al (%
)
3.5 10.3
11.0 12.4
13.0 13.5
15.5 16.9 17.1
17.7 19.4 19.9
29.3
0 5 10 15 20 25 30 35
IndiaThailandMalaysia
New ZealandSingapore
IrelandItaly
GermanyAustralia
ChinaUSA
KoreaJapan
Cou
ntrie
s
Lung, Trachea & Bronchus
5-year relative survival (%)
IndianChineseMalay
Lung, Trachea & Bronchus
Years after diagnosis
SELE
CTED
CA
NCE
RS

37 Malaysian Study On Cancer Survival (MySCan), 2018
3.4.4 Nasopharynx (ICD-10: C11)
Results were analysed for 4697 cases. 5-year RS was 46.0% with MST of 40.6 months. HR in Malays was 1.49 (95% CI: 1.36, 1.61) and in Indians was 1.77 (95% CI: 1.30, 2.41) compared to Chinese. Survivals deteriorated significantly after stage III onwards. HR at stage III was 1.45 (95% CI: 1.21, 1.75) and was 2.73 (95% CI: 2.29, 3.27) at stage IV compared to stage I.
International comparisons with other study (Zeng, H et. al., 2018); showed the 5-year RS was higher than China (43.8%, incidence 2009-2011). However the 5-year RS by sex was noted to be lower than Singapore (males: 58.5%, females 60.4%) for incidence 2008-2012. (Cancer Survival in Singapore, 2015).
Figure 18. Nasopharynx: Relative survival by year and staging, period of diagnosis 2007-2011 and followed up to 2016, Malaysia
Table 18. Nasopharynx: Relative survival by year and selected variables, period of diagnosis 2007-2011 and followed up to 2016, Malaysia
VariablesNO.
Overall 4697 78.9 55.2 46.0
Sex MaleFemale
79.078.7
34861211
145914331101568
54.258.0
44.849.2
Age groups(years)
15-4445-5455-6465-74
84.579.679.466.1
63.355.053.341.2
53.646.143.133.3
1223255558
Major ethnicgroups
MalayChineseIndian
72.684.063.3
45.462.641.2
37.952.237.0
316669750828
Stage at diagnosis
Stage IStage IIStage IIIStage IV
94.085.584.366.2
73.868.359.837.0
63.759.150.226.9
1-yearRelative survival by year (%)
3-year 5-year
94.0 85.5 84.3
66.2 63.7 59.1 50.2
26.9
0102030405060708090
100
Stage I Stage II Stage III Stage IV
Rel
ativ
e su
rviv
al (%
)
1-year 5-year
NasopharynxSE
LECT
ED C
AN
CERS

37 Malaysian Study On Cancer Survival (MySCan), 2018
3.4.4 Nasopharynx (ICD-10: C11)
Results were analysed for 4697 cases. 5-year RS was 46.0% with MST of 40.6 months. HR in Malays was 1.49 (95% CI: 1.36, 1.61) and in Indians was 1.77 (95% CI: 1.30, 2.41) compared to Chinese. Survivals deteriorated significantly after stage III onwards. HR at stage III was 1.45 (95% CI: 1.21, 1.75) and was 2.73 (95% CI: 2.29, 3.27) at stage IV compared to stage I.
International comparisons with other study (Zeng, H et. al., 2018); showed the 5-year RS was higher than China (43.8%, incidence 2009-2011). However the 5-year RS by sex was noted to be lower than Singapore (males: 58.5%, females 60.4%) for incidence 2008-2012. (Cancer Survival in Singapore, 2015).
Figure 18. Nasopharynx: Relative survival by year and staging, period of diagnosis 2007-2011 and followed up to 2016, Malaysia
Table 18. Nasopharynx: Relative survival by year and selected variables, period of diagnosis 2007-2011 and followed up to 2016, Malaysia
VariablesNO.
Overall 4697 78.9 55.2 46.0
Sex MaleFemale
79.078.7
34861211
145914331101568
54.258.0
44.849.2
Age groups(years)
15-4445-5455-6465-74
84.579.679.466.1
63.355.053.341.2
53.646.143.133.3
1223255558
Major ethnicgroups
MalayChineseIndian
72.684.063.3
45.462.641.2
37.952.237.0
316669750828
Stage at diagnosis
Stage IStage IIStage IIIStage IV
94.085.584.366.2
73.868.359.837.0
63.759.150.226.9
1-yearRelative survival by year (%)
3-year 5-year
94.0 85.5 84.3
66.2 63.7 59.1 50.2
26.9
0102030405060708090
100
Stage I Stage II Stage III Stage IV
Rel
ativ
e su
rviv
al (%
)
1-year 5-year
Nasopharynx
SELE
CTED
CA
NCE
RS
38Malaysian Study On Cancer Survival (MySCan), 2018
*Source of the International data: CONCORD-3 study, 2005-2009 (C. Allemani e al, 2018) Malaysia: MyScan, 2018
Figure 19. Cervix Uteri: International comparison of 5-year relative survival
3.4.5 Cervix Uteri (ICD-10: C53)
Results were analysed for 4015 cases. 5-year RS was 51.6% with MST of 46.1 months. HR in Malay was 1.33 (95% CI: 1.21, 1.46) and in Indians was 1.41 (95% CI: 1.20, 1.65) compared to Chinese. HR at stage II was 2.19 (95% CI: 1.88, 2.57), 3.61 (95% CI: 3.06, 4.25) at stage III, and 5.45 (95% CI: 4.60, 6.46) at stage IV compared to stage I.
International comparisons with selected countries (C. Allemani et al, 2018), in Asia the 5-year RS for cervix uteri cancer was similar to India. The survival was lower than Thailand, China, Singapore, Japan, Korea and most of the European countries.
Table 19. Cervix Uteri: Relative survival by year and selected variables, period of diagnosis 2007-2011 and followed up to 2016, Malaysia
VariablesNO.
Overall 4015Female 79.3 57.2 51.6
9711244969602
Age groups(years)
15-4445-5455-6465-74
83.777.879.275.8
63.455.454.154.3
59.249.547.546.6
13611630297
Major ethnicgroups
MalayChineseIndian
74.284.973.0
50.763.652.3
44.857.747.0
665954565447
Stage at diagnosis
Stage IStage IIStage IIIStage IV
94.385.469.153.0
80.560.138.426.5
75.352.332.123.0
1-yearRelative survival by year (%)
3-year 5-year
51.6 51.6
55.8 58.7
63.0 63.0 63.3 64.4 65.7
67.5 67.7 69.2
77.0
0 20 40 60 80 100
IndiaMalaysiaThailand
IrelandChinaUSA
SingaporeNew Zealand
GermanyAustralia
ItalyJapanKorea
Cou
ntrie
s
Cervix Uteri
5-year relative survival (%)
Cervix Uteri
SELE
CTED
CA
NCE
RS

39 Malaysian Study On Cancer Survival (MySCan), 2018
3.4.6 Lymphoma (ICD-10: C81-85, C96)
Results were analysed for 4709 cases (adults: 4465, childhood: 244). Overall 5-year RS in lymphoma was 49.3% with MST of 36.6 months. 5-year RS in childhood lymphoma was 63.3%, which was higher than in adults (48.5%). HR in adults were statistically significant at stage III and stage IV with HR of 1.44 (95% CI: 1.18, 1.75) and 2.17 (95% CI: 1.83, 2.89) respectively compared to stage I.
Table 20. Lymphoma (adults): Relative survival by year and selected variables, period of diagnosis 2007-2011 and followed up to 2016, Malaysia
VariablesNO.
All adults 4465 65.9 52.4 48.5
Sex MaleFemale
64.268.4
26091856
1468885
1019767
50.655.1
46.451.5
Age groups (years)
15-4445-5455-6465-74
78.565.561.555.2
66.251.144.242.5
61.346.240.938.5
22621361266
Major ethnicgroups
MalayChineseIndian
63.968.873.6
51.455.160.2
47.252.456.8
390508429662
Stage at diagnosis
Stage IStage IIStage IIIStage IV
79.680.369.256.3
68.570.754.640.0
65.866.649.435.5
1-yearRelative survival by year (%)
3-year 5-year
Table 21. Lymphoma (children): Relative survival by year and selected variables, period of diagnosis 2007-2011 and followed up to 2016, Malaysia
VariablesNO.
All children 244 80.0 70.2 63.3
Sex MaleFemale
80.080.0
15886
4681117
68.772.8
62.065.6
Age groups(years)
0-45-910-14
75.682.180.3
68.771.369.8
66.367.060.0
1413417
Major ethnicgroups
MalayChineseIndian
76.683.693.6
63.680.093.8
60.563.976.9
11212435
Stage at diagnosis
Stage IStage IIStage IIIStage IV
91.085.478.861.2
72.880.360.954.8
63.868.961.051.6
1-yearRelative survival by year (%)
3-year 5-year
LymphomaSE
LECT
ED C
AN
CERS

40Malaysian Study On Cancer Survival (MySCan), 2018
International comparisons in childhood lymphoma with selected countries (C. Allemani et al, 2018); in Asia the 5-year RS in childhood lymphoma was higher than China but lower than Thailand, Singapore, Korea and Japan. The survival was lower compared to Australia, New Zealand, USA and most of European countries.
Figure 20. Lymphoma: Comparison of relative survival by year in adults and children, period of diagnosis 2007-2011 and followed up to 2016, Malaysia
65.9 52.4 48.5
80.070.2
63.3
0
20
40
60
80
100
1-year 3-year 5-year
Rel
ativ
e su
rviv
al (%
)
Year after diagnosis
Adults Children
Lymphoma
SELE
CTED
CA
NCE
RS
*Source of the International data: CONCORD-3 study, 2005-2009 (C. Allemani e al, 2018) Malaysia: MyScan, 2018
Figure 21. Childhood Lymphoma: International comparison of 5-year relative survival
52.3 63.3 63.7
73.8 83.0 84.7
89.490.2
93.593.894.2
96.2
0 20 40 60 80 100 120
ChinaMalaysiaThailand
SingaporeKoreaJapan
ItalyUSA
New ZealandGermanyAustralia
Ireland
Cou
ntrie
s
Childhood Lymphoma
5-year relative survival (%)

41 Malaysian Study On Cancer Survival (MySCan), 2018
3.4.7 Leukaemia (ICD-10: C91-95)
Results were analysed for 3873 cases (adults: 2694, childhood: 1179). Overall 5-year RS was 44.0% with MST of 28.0 months. The 5-year RS was higher in childhood (62.3%) compared to adults (36.5%).
In childhood, HR was statistically significant for age 10-14 years old with 1.91 (95% CI: 1.51, 2.40) compared to age 0-4 years old. HR among Malays was 1.82 (95% CI: 1.37, 2.43) compared to Chinese.
Table 22. Leukaemia (adults): Relative survival by year and selected variables, period of diagnosis 2007-2011 and followed up to 2016, Malaysia
VariablesNO.
All adults 2694 59.7 41.4 36.5
Sex MaleFemale
60.658.7
14841210
1235510495317
40.242.8
34.838.5
Age groups (years)
15-4445-5455-6465-74
69.058.951.240.7
48.340.535.722.9
44.036.229.216.6
1411795205
Major ethnic groups
MalayChineseIndian
57.062.764.7
41.341.448.2
36.636.843.4
1-yearRelative survival by year (%)
3-year 5-year
Table 23. Leukaemia (children): Relative survival by year and selected variables, period of diagnosis 2007-2011 and followed up to 2016, Malaysia
VariablesNO.
All children 1179 79.0 66.9 62.3
Sex MaleFemale
77.880.5
668511
586330263
65.468.8
60.365.0
Age groups (years)
0-45-910-14
81.981.269.9
72.866.454.4
69.362.147.5
71622073
Major ethnic groups
MalayChineseIndian
74.085.690.0
60.975.680.6
56.972.375.6
1-yearRelative survival by year (%)
3-year 5-year
Leukaemia
Figure 22. Leukaemia: Comparison of relative survival by year in adults and children, period of diagnosis 2007-2011 and followed up to 2016, Malaysia
59.7
41.4 36.5
79.0 66.9 62.3
0
20
40
60
80
100
1-year 3-year 5-year
Rel
ativ
e su
rviv
al (%
)
Year after diagnosis
Adults Children
SELE
CTED
CA
NCE
RS
42Malaysian Study On Cancer Survival (MySCan), 2018
Allemani, C., Matsuda, T., Di Carlo, V., Harewood, R., Matz, M., Nikšić, M., Bonaventure, A., Valkov, M., Johnson, C.J., Estève, J. and Ogunbiyi, O.J., 2018. Global surveillance of trends in cancer survival 2000–14 (CONCORD-3): analysis of individual records for 37 513 025 patients diagnosed with one of 18 cancers from 322 population-based registries in 71 countries. The Lancet, 391(10125), pp.1023-1075.
Azizah Ab M, Nor Saleha I.T, Noor Hashimah A, Asmah Z.A, Mastulu W, Malaysian National Cancer Registry Report 2007-2011, 2016
Department of Statistics, Malaysia (2007-2016), Population Distribution and Basic Demographic Characteristics, Population and Housing Census of Malaysia, Malaysia, 2010. https://www.dosm.gov.my
Dickman, P.W., Coviello, E. and Hills, M., 2009. Estimating and modelling relative survival. Stata J.
Health Informatics Centre, Health Facts 2017, Ministry Of Health Malaysia
International Classification of Disease for Oncology, Third Edition, First Revision, Geneva: World Health Organization, 2013.
National Cancer Institute. (2018). NCI Dictionary of Cancer Terms. [Online] Available at: https://www.cancer.gov/publications/dictionaries/cancer-terms/def/hazard-ratio [Accessed 12 Jul. 2018].
National Registry of Disease Office: Cancer Survival in Singapore, 1973-2012. Singapore Cancer Registry, 2015
Zeng, H., Chen, W., Zheng, R., Zhang, S., Ji, J.S., Zou, X., Xia, C., Sun, K., Yang, Z., Li, H. and Wang, N., 2018. Changing cancer survival in China during 2003–15: a pooled analysis of 17 population-based cancer registries. The Lancet Global Health, 6(5), pp.e555-e567
REFERENCES
References

43 Malaysian Study On Cancer Survival (MySCan), 2018
APPENDIX 1. ACTUARIAL LIFE TABLE BY CANCER TYPES
Definition: start end n d w cp cr_e2 lo_cr_e2 hi_cr_e2
Start of life table interval (year) End of life table interval (year) Number alive at start Number of deaths during the interval Withdrawals (censorings) during the interval Cumulative observed survival - Observed Survival (OS) Cumulative relative survival (Ederer II) – Relative Survival (RS) Lower 95% CI for cr_e2 (Ederer II) Upper 95% CI for cr_e2 (Ederer II)
:::::::::
1-year interval for 10 years – period of diagnosis 2007-2011 and followed up to 2016
1. Female Breast (ICD-10: C50)
start end n d w cp cr_e2 lo_cr_e2 hi_cr_e2 0 1 17009 1932 399 0.8851 0.8974 0.8924 0.9022 1 2 14678 1679 52 0.7836 0.8060 0.7995 0.8124 2 3 12947 1186 47 0.7117 0.7431 0.7358 0.7502 3 4 11714 906 41 0.6566 0.6969 0.6891 0.7045 4 5 10767 623 14 0.6186 0.6681 0.6601 0.6761 5 6 10130 491 2084 0.5851 0.6441 0.6357 0.6524 6 7 7555 262 1929 0.5619 0.6312 0.6225 0.6399 7 8 5364 197 1707 0.5373 0.6170 0.6076 0.6264 8 9 3460 75 1737 0.5218 0.6131 0.6029 0.6232 9 10 1648 21 1627 0.5087 0.6119 0.5997 0.6239
2. Colorectal (ICD-10: C18-21)
Colon (ICD-10: C18)
start end n d w cp cr_e2 lo_cr_e2 hi_cr_e2 0 1 12093 3149 278 0.7366 0.7676 0.7593 0.7758 1 2 8666 1757 44 0.5869 0.6376 0.6280 0.6472 2 3 6865 1003 50 0.5008 0.5687 0.5584 0.5789 3 4 5812 658 33 0.4439 0.5284 0.5177 0.5390 4 5 5121 410 7 0.4084 0.5114 0.5002 0.5225 5 6 4704 300 931 0.3795 0.5022 0.4905 0.5139 6 7 3473 187 899 0.3560 0.4994 0.4869 0.5119 7 8 2387 99 818 0.3382 0.5045 0.4909 0.5182 8 9 1470 56 753 0.3209 0.5109 0.4954 0.5264 9 10 661 11 650 0.3104 0.5305 0.5114 0.5498
start end n d w cp cr_e2 lo_cr_e2 hi_cr_e2 0 1 6273 1576 138 0.7460 0.7778 0.7663 0.7889 1 2 4559 816 21 0.6121 0.6652 0.6518 0.6783 2 3 3722 436 25 0.5402 0.6135 0.5992 0.6275 3 4 3261 304 21 0.4897 0.5831 0.5681 0.5979 4 5 2936 219 4 0.4531 0.5675 0.5518 0.5831 5 6 2713 158 516 0.4240 0.5613 0.5447 0.5778 6 7 2039 95 545 0.4012 0.5628 0.5450 0.5805 7 8 1399 56 469 0.3819 0.5695 0.5501 0.5889 8 9 874 23 468 0.3681 0.5856 0.5638 0.6074 9 10 383 4 379 0.3605 0.6134 0.5874 0.6395
APP
END
ICES
Appendix 1
44Malaysian Study On Cancer Survival (MySCan), 2018
Rectum (ICD-10: C19-21)
start end n d w cp cr_e2 lo_cr_e2 hi_cr_e2 0 1 5820 1573 140 0.7264 0.7567 0.7445 0.7685 1 2 4107 941 23 0.5595 0.6079 0.5938 0.6218 2 3 3143 567 25 0.4582 0.5202 0.5054 0.5349 3 4 2551 354 12 0.3945 0.4692 0.4540 0.4844 4 5 2185 191 3 0.3599 0.4507 0.4350 0.4664 5 6 1991 142 415 0.3313 0.4382 0.4218 0.4546 6 7 1434 92 354 0.3070 0.4307 0.4133 0.4482 7 8 988 43 349 0.2908 0.4341 0.4152 0.4531 8 9 596 33 285 0.2697 0.4300 0.4084 0.4520 9 10 278 7 271 0.2564 0.4412 0.4137 0.4692
3. Lung, Trachea & Bronchus (ICD-10: C33-34)
start end n d w cp cr_e2 lo_cr_e2 hi_cr_e2 0 1 8021 5246 136 0.3404 0.3546 0.3437 0.3654 1 2 2639 1216 36 0.1825 0.1970 0.1879 0.2064 2 3 1387 414 22 0.1276 0.1430 0.1348 0.1515 3 4 951 186 21 0.1023 0.1196 0.1118 0.1277 4 5 744 87 3 0.0903 0.1104 0.1027 0.1185 5 6 654 71 95 0.0798 0.1022 0.0945 0.1103 6 7 488 33 116 0.0736 0.0989 0.0910 0.1071 7 8 339 23 100 0.0678 0.0957 0.0875 0.1044 8 9 216 7 97 0.0650 0.0964 0.0876 0.1057 9 10 112 4 108 0.0605 0.0946 0.0840 0.1062
4. Nasopharynx (ICD-10: C11)
5. Cervix Uteri (ICD-10: C53)
start end n d w cp cr_e2 lo_cr_e2 hi_cr_e2 0 1 4697 1035 113 0.7770 0.7889 0.7765 0.8008 1 2 3549 697 11 0.6241 0.6428 0.6282 0.6570 2 3 2841 433 30 0.5285 0.5522 0.5370 0.5672 3 4 2378 265 11 0.4695 0.4977 0.4823 0.5130 4 5 2102 190 7 0.4270 0.4595 0.4440 0.4749 5 6 1905 127 330 0.3958 0.4328 0.4171 0.4484 6 7 1448 60 321 0.3774 0.4198 0.4038 0.4358 7 8 1067 56 313 0.3541 0.4008 0.3841 0.4175 8 9 698 31 342 0.3333 0.3841 0.3662 0.4021 9 10 325 2 323 0.3292 0.3864 0.3673 0.4057
start end n d w cp cr_e2 lo_cr_e2 hi_cr_e2 0 1 4015 876 105 0.7789 0.7932 0.7797 0.8060 1 2 3034 568 34 0.6323 0.6555 0.6396 0.6709 2 3 2432 346 21 0.5419 0.5724 0.5557 0.5888 3 4 2065 179 19 0.4947 0.5329 0.5159 0.5498 4 5 1867 96 3 0.4693 0.5157 0.4983 0.5329 5 6 1768 82 333 0.4453 0.4995 0.4818 0.5172 6 7 1353 43 319 0.4292 0.4927 0.4744 0.5109 7 8 991 32 300 0.4129 0.4857 0.4665 0.5048 8 9 659 18 367 0.3973 0.4800 0.4592 0.5008 9 10 274 7 267 0.3775 0.4706 0.4435 0.4976
Appendix 1
APP
END
ICES

45 Malaysian Study On Cancer Survival (MySCan), 2018
6. Liver (ICD-10: C22)
7. Ovary (ICD-10: C56)
8. Stomach (ICD-10: C16)
9. Prostate (ICD-10: C61)
start end n d w cp cr_e2 lo_cr_e2 hi_cr_e2 0 1 2766 1833 63 0.3297 0.3405 0.3224 1 2 870 341 12 0.1996 0.2121 0.1963 2 3 517 127 14 0.1499 0.1638 0.1492 3 4 376 53 4 0.1286 0.1446 0.1306 4 5 319 45 1 0.1105 0.1283 0.1147 5 6 273 34 40 0.0956 0.1152 0.1019 6 7 199 22 43 0.0838 0.1048 0.0915 7 8 134 12 42 0.0749 0.0977 0.0841 8 9 80 3 43 0.0710 0.0965 0.0820 9 10 34 0 34 0.0710 0.1015 0.0863
start end n d w cp cr_e2 lo_cr_e2 hi_cr_e2 0 1 3084 635 70 0.7917 0.8023 0.7872 0.8165 1 2 2379 362 12 0.6710 0.6881 0.6706 0.7049 2 3 2005 225 10 0.5955 0.6181 0.5996 0.6360 3 4 1770 152 6 0.5443 0.5723 0.5534 0.5909 4 5 1612 97 1 0.5115 0.5451 0.5259 0.5640 5 6 1514 67 306 0.4863 0.5260 0.5064 0.5454 6 7 1141 46 273 0.4640 0.5101 0.4899 0.5301 7 8 822 27 276 0.4457 0.4983 0.4772 0.5192 8 9 519 16 226 0.4282 0.4879 0.4650 0.5105 9 10 277 4 273 0.4160 0.4830 0.4566 0.5092
start end n d w cp cr_e2 lo_cr_e2 hi_cr_e2 0 1 2818 1480 66 0.4686 0.4941 0.4744 0.5135 1 2 1272 415 9 0.3152 0.3483 0.3291 0.3675 2 3 848 164 18 0.2536 0.2941 0.2753 0.3132 3 4 666 82 9 0.2221 0.2698 0.2510 0.2890 4 5 575 53 0 0.2017 0.2566 0.2376 0.2761 5 6 522 28 97 0.1897 0.2544 0.2347 0.2746 6 7 397 28 99 0.1744 0.2481 0.2276 0.2695 7 8 270 8 87 0.1683 0.2552 0.2331 0.2781 8 9 175 7 83 0.1595 0.2612 0.2365 0.2870 9 10 85 2 83 0.1521 0.2726 0.2417 0.3052
start end n d w cp cr_e2 lo_cr_e2 hi_cr_e2 0 1 2913 485 49 0.8321 0.8929 0.8777 0.9070 1 2 2379 379 16 0.6991 0.8082 0.7884 0.8272 2 3 1984 235 10 0.6161 0.7707 0.7480 0.7926 3 4 1739 204 8 0.5436 0.7397 0.7145 0.7643 4 5 1527 149 3 0.4905 0.7300 0.7024 0.7572 5 6 1375 128 289 0.4395 0.7209 0.6904 0.7510 6 7 958 79 266 0.3974 0.7228 0.6883 0.7571 7 8 613 40 200 0.3664 0.7435 0.7036 0.7835 8 9 373 17 204 0.3434 0.7809 0.7326 0.8294 9 10 152 3 149 0.3302 0.8496 0.7850 0.9147
0.35870.22850.17900.15940.14270.12940.11910.11260.11250.1185
APP
END
ICES
Appendix 1

46Malaysian Study On Cancer Survival (MySCan), 2018
10. Thyroid (ICD-10: C73)
11. Corpus Uteri (ICD-10: C54)
12. Brain & Nervous System (ICD-10: C71-72)
13. Pancreas (ICD-10: C25)
start end n d w cp cr_e2 lo_cr_e2 hi_cr_e2 0 1 2058 222 42 0.8910 0.9042 0.8896 0.9171 1 2 1794 85 12 0.8487 0.8725 0.8557 0.8878 2 3 1697 62 9 0.8176 0.8512 0.8329 0.8680 3 4 1626 46 5 0.7944 0.8372 0.8179 0.8551 4 5 1575 46 3 0.7712 0.8226 0.8023 0.8415 5 6 1526 37 298 0.7505 0.8105 0.7892 0.8304 6 7 1191 19 300 0.7368 0.8060 0.7838 0.8269 7 8 872 14 267 0.7228 0.8019 0.7784 0.8241 8 9 591 8 290 0.7098 0.7986 0.7730 0.8227 9 10 293 6 287 0.6813 0.7755 0.7392 0.8093
start end n d w cp cr_e2 lo_cr_e2 hi_cr_e2 0 1 2038 285 67 0.8578 0.8722 0.8559 0.8870 1 2 1686 176 11 0.7680 0.7932 0.7734 0.8118 2 3 1499 114 12 0.7093 0.7442 0.7226 0.7646 3 4 1373 76 4 0.6700 0.7143 0.6916 0.7359 4 5 1293 37 0 0.6508 0.7055 0.6821 0.7278 5 6 1256 40 259 0.6277 0.6927 0.6684 0.7159 6 7 957 28 251 0.6066 0.6824 0.6570 0.7069 7 8 678 12 226 0.5937 0.6819 0.6552 0.7077 8 9 440 6 198 0.5833 0.6832 0.6546 0.7107 9 10 236 4 232 0.5638 0.6745 0.6382 0.7094
start end n d w cp cr_e2 lo_cr_e2 hi_cr_e2 0 1 1352 514 31 0.6154 0.6247 0.5977 0.6506 1 2 807 151 2 0.5001 0.5141 0.4861 0.5414 2 3 654 63 8 0.4516 0.4702 0.4421 0.4979 3 4 583 55 2 0.4090 0.4312 0.4031 0.4591 4 5 526 35 2 0.3817 0.4081 0.3800 0.4361 5 6 489 31 82 0.3553 0.3852 0.3570 0.4135 6 7 376 15 73 0.3396 0.3743 0.3457 0.4031 7 8 288 7 78 0.3300 0.3701 0.3407 0.3997 8 9 203 4 93 0.3216 0.3669 0.3364 0.3977 9 10 106 2 104 0.3097 0.3617 0.3263 0.3976
start end n d w cp cr_e2 lo_cr_e2 hi_cr_e2 0 1 1438 965 36 0.3204 0.3324 0.3074 0.3577 1 2 437 165 4 0.1989 0.2124 0.1905 0.2352 2 3 268 59 1 0.1550 0.1709 0.1505 0.1926 3 4 208 30 5 0.1324 0.1509 0.1311 0.1720 4 5 173 17 0 0.1194 0.1403 0.1208 0.1613 5 6 156 12 24 0.1094 0.1331 0.1137 0.1543 6 7 120 9 35 0.0998 0.1252 0.1057 0.1467 7 8 76 3 23 0.0952 0.1240 0.1037 0.1465 8 9 50 3 22 0.0879 0.1195 0.0976 0.1441 9 10 25 0 25 0.0879 0.1229 0.1003 0.1482
Appendix 1
APP
END
ICES

47 Malaysian Study On Cancer Survival (MySCan), 2018
14. Lymphoma (adults) (ICD-10: C81-85; C96)
15. Leukaemia (adults) (ICD-10: C91-95)
Lymphoma (children) (ICD-10: C81-85; C96)
Leukaemia (children) (ICD-10: C91-95)
start end n d w cp cr_e2 lo_cr_e2 hi_cr_e2 0 1 4465 1556 1 2 2730 403 2 3 2282 225 3 4 2035 127 4 5 1895 97 5 6 1791 84 6 7 1347 44 7 8 952 31 8 9 586 16 9 10 255 2
start end n d w cp cr_e2 lo_cr_e2 hi_cr_e2 0 1 244 46 0.7991 0.7995 0.7415 0.8459 1 2 168 12 0.7412 0.7418 0.6789 0.7944 2 3 151 8 0.7007 0.7017 0.6359 0.7579 3 4 134 12 0.6368 0.6380 0.5687 0.6992 4 5 117 1 0.6313 0.6328 0.5633 0.6944 5 6 113 1 0.6249 0.6268 0.5568 0.6890 6 7 85 1 0.6164 0.6187 0.5475 0.6821 7 8 61 2 0.5907 0.5933 0.5159 0.6626 8 9 33 0 0.5907 0.5937 0.5163 0.6630 9 10 16 0 0.5907 0.5942 0.5167 0.6636
start end n d w cp cr_e2 lo_cr_e2 hi_cr_e2 0 1 2694 1097 1 2 1519 364 2 3 1128 125 3 4 990 90 4 5 892 51 5 6 838 40 6 7 648 19 7 8 481 11 8 9 306 5 9 10 132 2
start end n d w cp cr_e2 lo_cr_e2 hi_cr_e2 0 1 1179 235 0.7893 0.7898 0.7646 0.8126 1 2 817 80 0.7099 0.7105 0.6823 0.7366 2 3 693 39 0.6680 0.6687 0.6392 0.6964 3 4 588 22 0.6425 0.6434 0.6132 0.67204 5 543 17 0.6222 0.6234 0.5926 0.6527 5 6 520 6 0.6143 0.6158 0.5847 0.6453 6 7 416 2 0.6109 0.6126 0.5813 0.6423 7 8 294 1 0.6083 0.6103 0.5787 0.6404 8 9 189 2 0.5995 0.6018 0.5682 0.6337 9 10 85 0 0.5995 0.6021 0.5685 0.6340
0.58680.44490.39530.35930.33870.32090.31030.30180.29490.2861
0.59710.45930.41380.38180.36500.35060.34360.33940.33720.3322
0.57780.43950.39410.36210.34530.33090.32360.31880.31570.3070
0.61590.47880.43350.40150.38470.37050.36380.36010.35880.3579
0.64440.54850.49410.46320.43940.41650.40090.38500.37070.3649
1794522137
360351335315253
305953
2723261716
78271383
150148164169130
1274466236
9812010410285
0.65920.57140.52440.50110.48530.46990.46260.45490.44870.4552
0.67350.58670.54020.51730.50170.48670.48000.47320.46860.4777
0.64450.55580.50840.48490.46870.45300.44520.43660.42880.4328
APP
END
ICES
Appendix 1
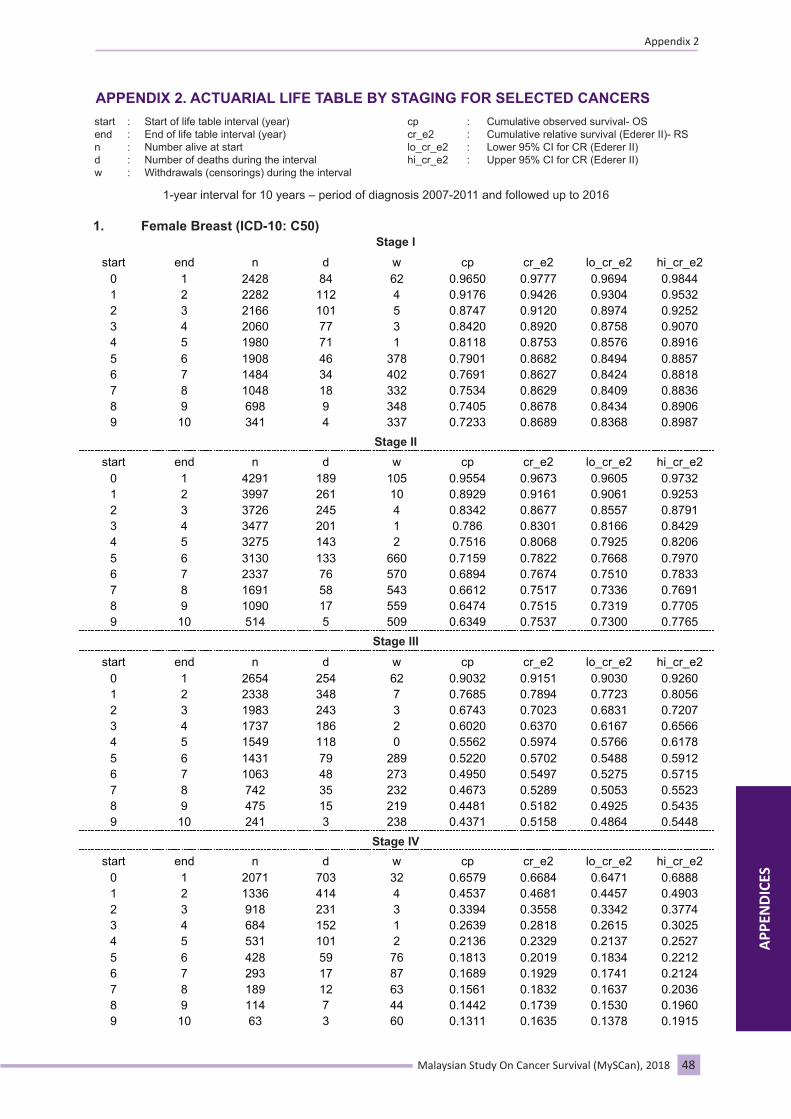
48Malaysian Study On Cancer Survival (MySCan), 2018
APPENDIX 2. ACTUARIAL LIFE TABLE BY STAGING FOR SELECTED CANCERS
1-year interval for 10 years – period of diagnosis 2007-2011 and followed up to 2016
start end nd w
:::::
Start of life table interval (year) End of life table interval (year) Number alive at start Number of deaths during the interval Withdrawals (censorings) during the interval
::::
cpcr_e2lo_cr_e2hi_cr_e2
Cumulative observed survival- OS Cumulative relative survival (Ederer II)- RSLower 95% CI for CR (Ederer II) Upper 95% CI for CR (Ederer II)
1. Female Breast (ICD-10: C50)Stage I
Stage II
Stage III
Stage IV
Appendix 2
APP
END
ICES
start end n d w cp cr_e2 lo_cr_e2 hi_cr_e2 0 1 2428 84 62 0.9650 0.9777 0.9694 0.9844 1 2 2282 112 4 0.9176 0.9426 0.9304 0.9532 2 3 2166 101 5 0.8747 0.9120 0.8974 0.9252 3 4 2060 77 3 0.8420 0.8920 0.8758 0.9070 4 5 1980 71 1 0.8118 0.8753 0.8576 0.8916 5 6 1908 46 378 0.7901 0.8682 0.8494 0.8857 6 7 1484 34 402 0.7691 0.8627 0.8424 0.8818 7 8 1048 18 332 0.7534 0.8629 0.8409 0.8836 8 9 698 9 348 0.7405 0.8678 0.8434 0.8906 9 10 341 4 337 0.7233 0.8689 0.8368 0.8987
start end n d w cp cr_e2 lo_cr_e2 hi_cr_e2 0 1 4291 189 105 0.9554 0.9673 0.9605 0.9732 1 2 3997 261 10 0.8929 0.9161 0.9061 0.9253 2 3 3726 245 4 0.8342 0.8677 0.8557 0.8791 3 4 3477 201 1 0.786 0.8301 0.8166 0.8429 4 5 3275 143 2 0.7516 0.8068 0.7925 0.8206 5 6 3130 133 660 0.7159 0.7822 0.7668 0.7970 6 7 2337 76 570 0.6894 0.7674 0.7510 0.7833 7 8 1691 58 543 0.6612 0.7517 0.7336 0.7691 8 9 1090 17 559 0.6474 0.7515 0.7319 0.7705 9 10 514 5 509 0.6349 0.7537 0.7300 0.7765
start end n d w cp cr_e2 lo_cr_e2 hi_cr_e2 0 1 2654 254 62 0.9032 0.9151 0.9030 0.9260 1 2 2338 348 7 0.7685 0.7894 0.7723 0.8056 2 3 1983 243 3 0.6743 0.7023 0.6831 0.7207 3 4 1737 186 2 0.6020 0.6370 0.6167 0.6566 4 5 1549 118 0 0.5562 0.5974 0.5766 0.6178 5 6 1431 79 289 0.5220 0.5702 0.5488 0.5912 6 7 1063 48 273 0.4950 0.5497 0.5275 0.5715 7 8 742 35 232 0.4673 0.5289 0.5053 0.5523 8 9 475 15 219 0.4481 0.5182 0.4925 0.5435 9 10 241 3 238 0.4371 0.5158 0.4864 0.5448
start end n d w cp cr_e2 lo_cr_e2 hi_cr_e2 0 1 2071 703 32 0.6579 0.6684 0.6471 0.6888 1 2 1336 414 4 0.4537 0.4681 0.4457 0.4903 2 3 918 231 3 0.3394 0.3558 0.3342 0.3774 3 4 684 152 1 0.2639 0.2818 0.2615 0.3025 4 5 531 101 2 0.2136 0.2329 0.2137 0.2527 5 6 428 59 76 0.1813 0.2019 0.1834 0.2212 6 7 293 17 87 0.1689 0.1929 0.1741 0.2124 7 8 189 12 63 0.1561 0.1832 0.1637 0.2036 8 9 114 7 44 0.1442 0.1739 0.1530 0.1960 9 10 63 3 60 0.1311 0.1635 0.1378 0.1915

49 Malaysian Study On Cancer Survival (MySCan), 2018
2. Colorectal (ICD-10: C18-21)
start end n d w cp cr_e2 lo_cr_e2 hi_cr_e2 0 1 793 120 30 0.8458 0.8784 0.8500 0.9028 1 2 643 71 2 0.7522 0.8133 0.7786 0.8447 2 3 570 48 0 0.6889 0.7790 0.7404 0.8146 3 4 522 41 2 0.6347 0.7521 0.7104 0.7912 4 5 479 21 1 0.6068 0.7581 0.7136 0.8001 5 6 457 23 100 0.5725 0.7581 0.7101 0.8039 6 7 334 16 94 0.5406 0.7646 0.7115 0.8154 7 8 224 10 80 0.5112 0.7720 0.7121 0.8297 8 9 134 2 79 0.5004 0.8095 0.7421 0.8744 9 10 53 1 52 0.4819 0.8584 0.7620 0.9509
Stage I
Stage II
Stage III
Stage IV
start end n d w cp cr_e2 lo_cr_e2 hi_cr_e2 0 1 1728 236 37 0.8619 0.8991 0.8811 0.9153 1 2 1455 191 2 0.7487 0.8155 0.7922 0.8372 2 3 1262 124 6 0.6750 0.7691 0.7430 0.7939 3 4 1132 98 3 0.6165 0.7370 0.7088 0.7642 4 5 1031 68 0 0.5758 0.7254 0.6952 0.7546 5 6 963 56 174 0.5390 0.7180 0.6857 0.7495 6 7 733 42 181 0.5038 0.7094 0.6743 0.7438 7 8 510 20 175 0.4799 0.7161 0.6776 0.7540 8 9 315 11 164 0.4573 0.7224 0.6784 0.7658 9 10 140 2 138 0.4444 0.7408 0.6868 0.7938
start end n d w cp cr_e2 lo_cr_e2 hi_cr_e2 0 1 2225 373 47 0.8306 0.8597 0.8428 0.8752 1 2 1805 334 4 0.6767 0.7251 0.7036 0.7456 2 3 1467 225 3 0.5728 0.6374 0.6139 0.6602 3 4 1239 155 3 0.5011 0.5811 0.5565 0.6053 4 5 1081 93 3 0.4579 0.5559 0.5303 0.5811 5 6 985 69 237 0.4214 0.5377 0.5108 0.5643 6 7 679 31 169 0.3995 0.5355 0.5069 0.5639 7 8 479 20 175 0.3791 0.5367 0.5056 0.5678 8 9 284 8 145 0.3647 0.5472 0.5123 0.5821 9 10 131 2 129 0.3537 0.5632 0.5202 0.6064
start end n d w cp cr_e2 lo_cr_e2 hi_cr_e2 0 1 2216 1031 42 0.5303 0.5508 0.5288 0.5722 1 2 1143 463 7 0.3148 0.3392 0.3182 0.3603 2 3 673 214 1 0.2146 0.2404 0.2212 0.2600 3 4 458 107 2 0.1644 0.1920 0.1741 0.2107 4 5 349 49 0 0.1413 0.1728 0.1552 0.1913 5 6 300 32 48 0.1249 0.1607 0.1431 0.1793 6 7 220 18 59 0.1131 0.1537 0.1356 0.1730 7 8 143 8 53 0.1054 0.1524 0.1331 0.1731 8 9 82 2 45 0.1018 0.1560 0.1351 0.1787 9 10 35 1 34 0.0962 0.1552 0.1288 0.1843
APP
END
ICES
Appendix 2

50Malaysian Study On Cancer Survival (MySCan), 2018
3. Colon (ICD-10: C18)
Stage I
Stage II
Stage III
Stage IV
start end n d w cp cr_e2 lo_cr_e2 hi_cr_e2 0 1 402 45 17 0.8856 0.9193 0.8822 0.94801 2 340 40 0 0.7814 0.8433 0.7953 0.8842 2 3 300 20 0 0.7294 0.8206 0.7675 0.8672 3 4 280 24 2 0.6666 0.7844 0.7262 0.8369 4 5 254 10 1 0.6403 0.7928 0.7308 0.8494 5 6 243 14 54 0.5988 0.7847 0.7174 0.8470 6 7 175 6 58 0.5742 0.8038 0.7296 0.8728 7 8 111 6 35 0.5374 0.8056 0.7196 0.8865 8 9 70 1 41 0.5265 0.8403 0.7442 0.9307 9 10 28 0 28 0.5265 0.9115 0.8072 1.0095
start end n d w cp cr_e2 lo_cr_e2 hi_cr_e2 0 1 965 118 20 0.8764 0.9145 0.8909 0.9346 1 2 827 99 0 0.7715 0.8397 0.8091 0.8673 2 3 728 56 2 0.7121 0.8102 0.7761 0.8418 3 4 670 51 1 0.6578 0.7853 0.7481 0.8202 4 5 618 39 0 0.6163 0.7742 0.7342 0.8121 5 6 579 27 108 0.5846 0.7767 0.7337 0.8177 6 7 444 20 115 0.5544 0.7780 0.7312 0.8228 7 8 309 12 108 0.5283 0.7875 0.7355 0.8376 8 9 189 7 97 0.5020 0.7948 0.7342 0.8535 9 10 85 0 85 0.5020 0.8356 0.7718 0.8973
start end n d w cp cr_e2 lo_cr_e2 hi_cr_e2 0 1 1171 191 25 0.8351 0.8653 0.8418 0.8861 1 2 955 146 0 0.7075 0.7584 0.7293 0.7856 2 3 809 99 2 0.6208 0.6919 0.6598 0.7224 3 4 708 77 3 0.5531 0.6425 0.6085 0.6754 4 5 628 45 2 0.5134 0.6247 0.5890 0.6595 5 6 581 44 127 0.4698 0.6016 0.5638 0.6386 6 7 410 16 106 0.4487 0.6044 0.5642 0.6441 7 8 288 11 102 0.4279 0.6096 0.5655 0.6531 8 9 175 3 92 0.4179 0.6332 0.5844 0.6814 9 10 80 1 79 0.4076 0.6588 0.5987 0.7184
start end n d w cp cr_e2 lo_cr_e2 hi_cr_e2 0 1 1103 526 23 0.5181 0.5382 0.5070 0.5685 1 2 554 219 2 0.3129 0.3376 0.3079 0.3676 2 3 333 93 0 0.2255 0.2538 0.2262 0.2824 3 4 240 50 1 0.1784 0.2103 0.1840 0.2381 4 5 189 28 0 0.1520 0.1881 0.1624 0.2156 5 6 161 13 25 0.1387 0.1821 0.1558 0.2104 6 7 123 7 36 0.1295 0.1811 0.1536 0.2110 7 8 80 4 31 0.1214 0.1829 0.1531 0.2154 8 9 45 0 27 0.1214 0.1951 0.1634 0.2299 9 10 18 0 18 0.1214 0.2037 0.1706 0.2400
Appendix 2
APP
END
ICES

51 Malaysian Study On Cancer Survival (MySCan), 2018
4. Rectum (ICD-10: C19-21)
Stage I
Stage II
Stage III
Stage IV
start end n d w cp cr_e2 lo_cr_e2 hi_cr_e2 0 1 391 75 13 0.8049 0.8364 0.7915 0.8741 1 2 303 31 2 0.7223 0.7826 0.7307 0.8282 2 3 270 28 0 0.6474 0.7362 0.6789 0.7883 3 4 242 17 0 0.6019 0.7190 0.6578 0.7755 4 5 225 11 0 0.5725 0.7224 0.6574 0.7832 5 6 214 9 46 0.5455 0.7309 0.6613 0.7965 6 7 159 10 36 0.5068 0.7252 0.6486 0.7981 7 8 113 4 45 0.4844 0.7379 0.6534 0.8188 8 9 64 1 38 0.4737 0.7781 0.6826 0.8699 9 10 25 1 24 0.4372 0.8046 0.6434 0.9596
start end n d w cp cr_e2 lo_cr_e2 hi_cr_e2 0 1 763 118 17 0.8436 0.8797 0.8505 0.9047 1 2 628 92 2 0.7198 0.7848 0.7481 0.8183 2 3 534 68 4 0.6278 0.7168 0.6759 0.7551 3 4 462 47 2 0.5638 0.6755 0.6318 0.7172 4 5 413 29 0 0.5242 0.6632 0.6169 0.7078 5 6 384 29 66 0.4809 0.6432 0.5941 0.6910 6 7 289 22 66 0.4396 0.6222 0.5694 0.6741 7 8 201 8 67 0.4186 0.6254 0.5683 0.6818 8 9 126 4 67 0.4005 0.6305 0.5669 0.6935 9 10 55 2 53 0.3724 0.6220 0.5336 0.7103
start end n d w cp cr_e2 lo_cr_e2 hi_cr_e2 0 1 1054 182 22 0.8255 0.8535 0.8282 0.8759 1 2 850 188 4 0.6425 0.6880 0.6558 0.7184 2 3 658 126 1 0.5194 0.5768 0.5424 0.6102 3 4 531 78 0 0.4431 0.5129 0.4775 0.5477 4 5 453 48 1 0.3961 0.4794 0.4431 0.5155 5 6 404 25 110 0.3677 0.4668 0.4291 0.5046 6 7 269 15 63 0.3445 0.4587 0.4188 0.4989 7 8 191 9 73 0.3244 0.4554 0.4121 0.4992 8 9 109 5 53 0.3048 0.4507 0.4015 0.5008 9 10 51 1 50 0.2930 0.4562 0.3957 0.5182
start end n d w cp cr_e2 lo_cr_e2 hi_cr_e2 0 1 1113 505 19 0.5424 0.5632 0.5321 0.5932 1 2 589 244 5 0.3167 0.3408 0.3113 0.3706 2 3 340 121 1 0.2038 0.2272 0.2011 0.2545 3 4 218 57 1 0.1504 0.1741 0.1503 0.1996 4 5 160 21 0 0.1307 0.1578 0.1344 0.1830 5 6 139 19 23 0.1112 0.1399 0.1171 0.1648 6 7 97 11 23 0.0969 0.1273 0.1046 0.1527 7 8 63 4 22 0.0894 0.1233 0.0996 0.1500 8 9 37 2 18 0.0831 0.1204 0.0947 0.1498 9 10 17 1 16 0.0738 0.1136 0.0804 0.1543
APP
END
ICES
Appendix 2

52Malaysian Study On Cancer Survival (MySCan), 2018
5. Lung, Trachea & Bronchus (ICD-10: C33-34)
start end n d w cp cr_e2 lo_cr_e2 hi_cr_e2 0 1 223 87 4 0.6063 0.6332 0.5626 0.6968 1 2 132 37 0 0.4364 0.4751 0.4029 0.5452 2 3 95 12 0 0.3813 0.4334 0.3605 0.5060 3 4 83 11 1 0.3304 0.3947 0.3213 0.4695 4 5 71 8 0 0.2932 0.3705 0.2960 0.4480 5 6 63 10 10 0.2426 0.3231 0.2495 0.4020 6 7 43 4 14 0.2157 0.2993 0.2244 0.3814 7 8 25 4 10 0.1725 0.2515 0.1722 0.3434 8 9 11 0 7 0.1725 0.2668 0.1827 0.3643 9 10 4 0 4 0.1725 0.2719 0.1862 0.3713
start end n d w cp cr_e2 lo_cr_e2 hi_cr_e2 0 1 350 171 7 0.5065 0.5309 0.4745 0.5846 1 2 172 68 3 0.3045 0.3329 0.2803 0.3868 2 3 101 26 0 0.2261 0.2576 0.2086 0.3099 3 4 75 19 0 0.1688 0.2009 0.1558 0.2508 4 5 56 10 0 0.1387 0.1735 0.1304 0.2227 5 6 46 5 4 0.1229 0.1620 0.1191 0.2119 6 7 37 1 10 0.1191 0.1637 0.1195 0.2154 7 8 26 1 4 0.1141 0.1639 0.1181 0.2179 8 9 21 2 7 0.1011 0.1526 0.1047 0.2109 9 10 12 1 11 0.0855 0.1368 0.0806 0.2113
start end n d w cp cr_e2 lo_cr_e2 hi_cr_e2 0 1 1135 699 26 0.3770 0.3938 0.3642 0.4233 1 2 410 215 2 0.1788 0.1941 0.1702 0.2193 2 3 193 83 0 0.1019 0.1151 0.0958 0.1363 3 4 110 27 0 0.0769 0.0903 0.0728 0.1100 4 5 83 17 1 0.0611 0.0749 0.0587 0.0936 5 6 65 5 8 0.0561 0.0714 0.0553 0.0903 6 7 52 3 14 0.0523 0.0691 0.0528 0.0884 7 8 35 2 7 0.0490 0.0665 0.0500 0.0864 8 9 26 0 11 0.0490 0.0682 0.0513 0.0885 9 10 15 0 15 0.0490 0.0701 0.0527 0.0910
start end n d w cp cr_e2 lo_cr_e2 hi_cr_e2 0 1 3007 2135 41 0.2851 0.2957 0.2790 0.3126 1 2 831 453 8 0.1289 0.1381 0.1254 0.1514 2 3 370 137 2 0.0811 0.0899 0.0793 0.1013 3 4 231 57 1 0.0610 0.0706 0.0609 0.0812 4 5 173 25 1 0.0522 0.0629 0.0536 0.0732 5 6 147 22 25 0.0436 0.0552 0.0463 0.0653 6 7 100 8 19 0.0398 0.0528 0.0437 0.0631 7 8 73 7 22 0.0353 0.0494 0.0400 0.0602 8 9 44 3 21 0.0321 0.0483 0.0381 0.0604 9 10 20 1 19 0.0291 0.0472 0.0344 0.0631
Stage I
Stage II
Stage III
Stage IV
Appendix 2
APP
END
ICES
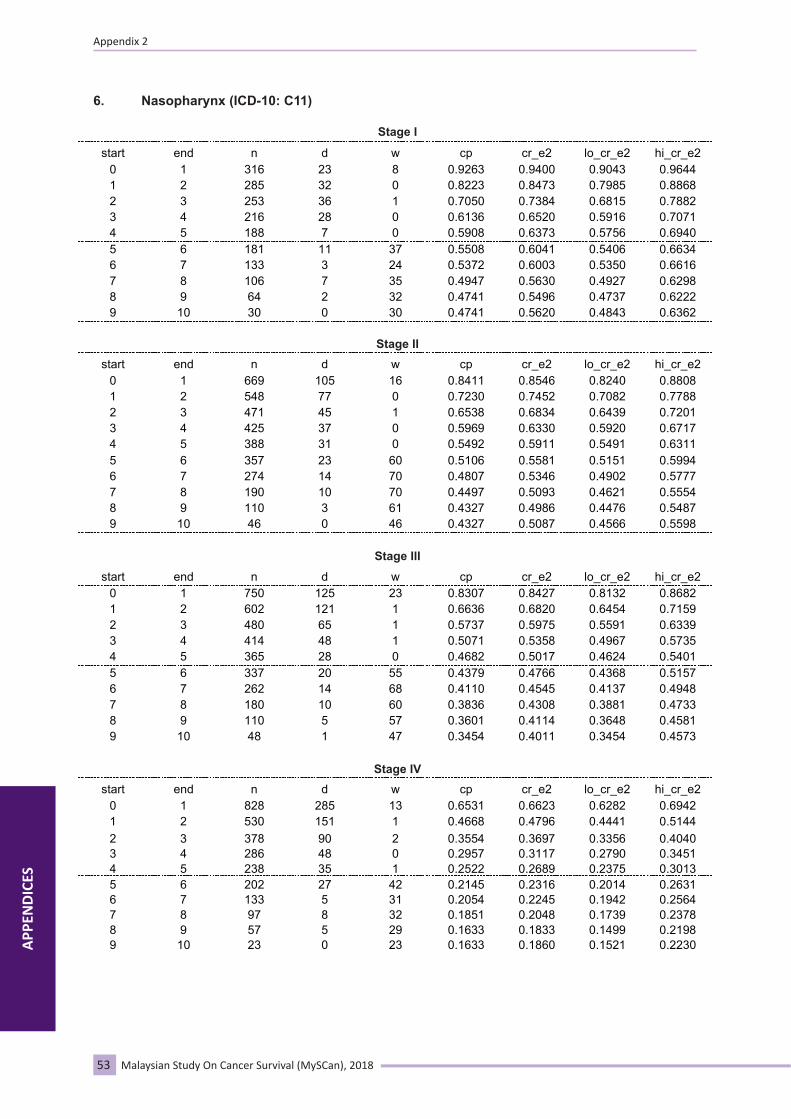
53 Malaysian Study On Cancer Survival (MySCan), 2018
6. Nasopharynx (ICD-10: C11)
start end n d w cp cr_e2 lo_cr_e2 hi_cr_e2 0 1 316 23 8 0.9263 0.9400 0.9043 0.9644 1 2 285 32 0 0.8223 0.8473 0.7985 0.8868 2 3 253 36 1 0.7050 0.7384 0.6815 0.7882 3 4 216 28 0 0.6136 0.6520 0.5916 0.7071 4 5 188 7 0 0.5908 0.6373 0.5756 0.6940 5 6 181 11 37 0.5508 0.6041 0.5406 0.6634 6 7 133 3 24 0.5372 0.6003 0.5350 0.6616 7 8 106 7 35 0.4947 0.5630 0.4927 0.6298 8 9 64 2 32 0.4741 0.5496 0.4737 0.6222 9 10 30 0 30 0.4741 0.5620 0.4843 0.6362
start end n d w cp cr_e2 lo_cr_e2 hi_cr_e2 0 1 669 105 16 0.8411 0.8546 0.8240 0.8808 1 2 548 77 0 0.7230 0.7452 0.7082 0.7788 2 3 471 45 1 0.6538 0.6834 0.6439 0.7201 3 4 425 37 0 0.5969 0.6330 0.5920 0.6717 4 5 388 31 0 0.5492 0.5911 0.5491 0.6311 5 6 357 23 60 0.5106 0.5581 0.5151 0.5994 6 7 274 14 70 0.4807 0.5346 0.4902 0.5777 7 8 190 10 70 0.4497 0.5093 0.4621 0.5554 8 9 110 3 61 0.4327 0.4986 0.4476 0.5487 9 10 46 0 46 0.4327 0.5087 0.4566 0.5598
start end n d w cp cr_e2 lo_cr_e2 hi_cr_e2 0 1 750 125 23 0.8307 0.8427 0.8132 0.8682 1 2 602 121 1 0.6636 0.6820 0.6454 0.7159 2 3 480 65 1 0.5737 0.5975 0.5591 0.6339 3 4 414 48 1 0.5071 0.5358 0.4967 0.5735 4 5 365 28 0 0.4682 0.5017 0.4624 0.5401 5 6 337 20 55 0.4379 0.4766 0.4368 0.5157 6 7 262 14 68 0.4110 0.4545 0.4137 0.4948 7 8 180 10 60 0.3836 0.4308 0.3881 0.4733 8 9 110 5 57 0.3601 0.4114 0.3648 0.4581 9 10 48 1 47 0.3454 0.4011 0.3454 0.4573
start end n d w cp cr_e2 lo_cr_e2 hi_cr_e2 0 1 828 285 13 0.6531 0.6623 0.6282 0.6942 1 2 530 151 1 0.4668 0.4796 0.4441 0.5144 2 3 378 90 2 0.3554 0.3697 0.3356 0.4040 3 4 286 48 0 0.2957 0.3117 0.2790 0.3451 4 5 238 35 1 0.2522 0.2689 0.2375 0.3013 5 6 202 27 42 0.2145 0.2316 0.2014 0.2631 6 7 133 5 31 0.2054 0.2245 0.1942 0.2564 7 8 97 8 32 0.1851 0.2048 0.1739 0.2378 8 9 57 5 29 0.1633 0.1833 0.1499 0.2198 9 10 23 0 23 0.1633 0.1860 0.1521 0.2230
Stage I
Stage II
Stage III
Stage IV
APP
END
ICES
Appendix 2
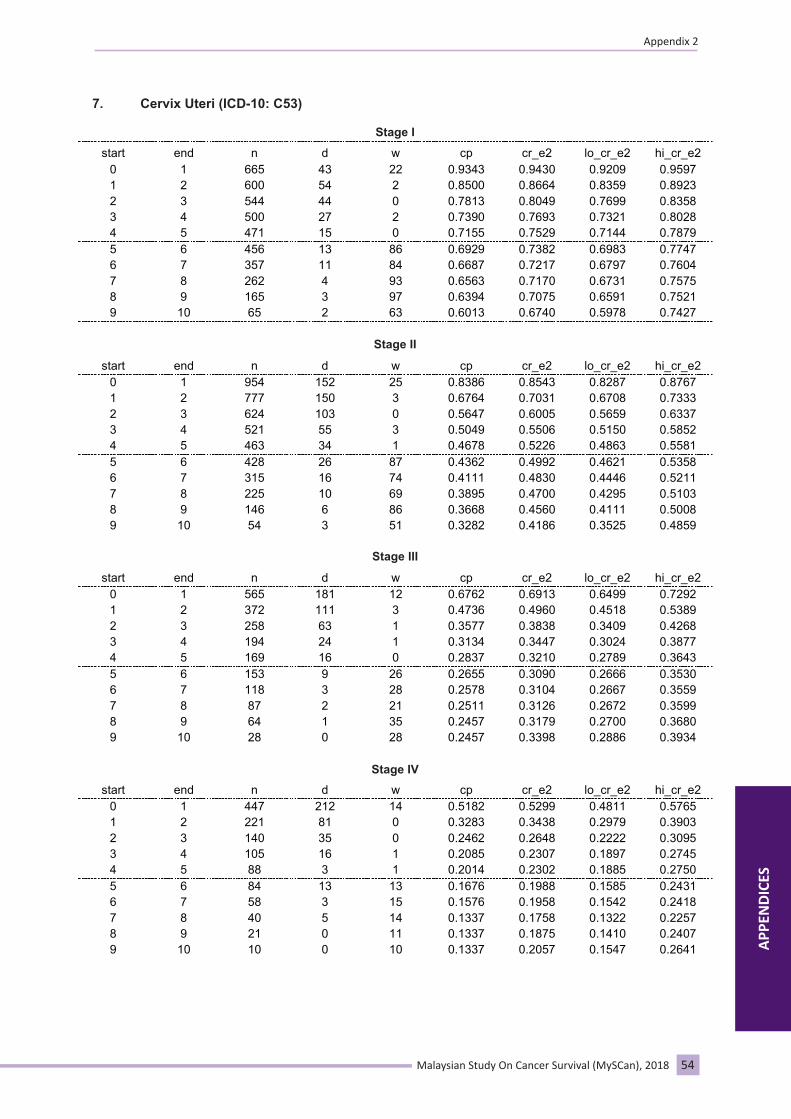
54Malaysian Study On Cancer Survival (MySCan), 2018
7. Cervix Uteri (ICD-10: C53)
Stage I
Stage II
Stage III
Stage IV
start end n d w cp cr_e2 lo_cr_e2 hi_cr_e2 0 1 665 43 22 0.9343 0.9430 0.9209 0.9597 1 2 600 54 2 0.8500 0.8664 0.8359 0.8923 2 3 544 44 0 0.7813 0.8049 0.7699 0.8358 3 4 500 27 2 0.7390 0.7693 0.7321 0.8028 4 5 471 15 0 0.7155 0.7529 0.7144 0.7879 5 6 456 13 86 0.6929 0.7382 0.6983 0.7747 6 7 357 11 84 0.6687 0.7217 0.6797 0.7604 7 8 262 4 93 0.6563 0.7170 0.6731 0.7575 8 9 165 3 97 0.6394 0.7075 0.6591 0.7521 9 10 65 2 63 0.6013 0.6740 0.5978 0.7427
start end n d w cp cr_e2 lo_cr_e2 hi_cr_e2 0 1 954 152 25 0.8386 0.8543 0.8287 0.8767 1 2 777 150 3 0.6764 0.7031 0.6708 0.7333 2 3 624 103 0 0.5647 0.6005 0.5659 0.6337 3 4 521 55 3 0.5049 0.5506 0.5150 0.5852 4 5 463 34 1 0.4678 0.5226 0.4863 0.5581 5 6 428 26 87 0.4362 0.4992 0.4621 0.5358 6 7 315 16 74 0.4111 0.4830 0.4446 0.5211 7 8 225 10 69 0.3895 0.4700 0.4295 0.5103 8 9 146 6 86 0.3668 0.4560 0.4111 0.5008 9 10 54 3 51 0.3282 0.4186 0.3525 0.4859
start end n d w cp cr_e2 lo_cr_e2 hi_cr_e2 0 1 565 181 12 0.6762 0.6913 0.6499 0.7292 1 2 372 111 3 0.4736 0.4960 0.4518 0.5389 2 3 258 63 1 0.3577 0.3838 0.3409 0.4268 3 4 194 24 1 0.3134 0.3447 0.3024 0.3877 4 5 169 16 0 0.2837 0.3210 0.2789 0.3643 5 6 153 9 26 0.2655 0.3090 0.2666 0.3530 6 7 118 3 28 0.2578 0.3104 0.2667 0.3559 7 8 87 2 21 0.2511 0.3126 0.2672 0.3599 8 9 64 1 35 0.2457 0.3179 0.2700 0.3680 9 10 28 0 28 0.2457 0.3398 0.2886 0.3934
start end n d w cp cr_e2 lo_cr_e2 hi_cr_e2 0 1 447 212 14 0.5182 0.5299 0.4811 0.5765 1 2 221 81 0 0.3283 0.3438 0.2979 0.3903 2 3 140 35 0 0.2462 0.2648 0.2222 0.3095 3 4 105 16 1 0.2085 0.2307 0.1897 0.2745 4 5 88 3 1 0.2014 0.2302 0.1885 0.2750 5 6 84 13 13 0.1676 0.1988 0.1585 0.2431 6 7 58 3 15 0.1576 0.1958 0.1542 0.2418 7 8 40 5 14 0.1337 0.1758 0.1322 0.2257 8 9 21 0 11 0.1337 0.1875 0.1410 0.2407 9 10 10 0 10 0.1337 0.2057 0.1547 0.2641
Appendix 2
APP
END
ICES

55 Malaysian Study On Cancer Survival (MySCan), 2018
8. Lymphoma (adults) (ICD-10: C81-85; C96)
Stage I
Stage II
Stage III
Stage IV
start end n d w cp cr_e2 lo_cr_e2 hi_cr_e2 0 1 390 84 15 0.7804 0.7962 0.7503 0.8352 1 2 291 32 0 0.6946 0.7220 0.6710 0.7674 2 3 259 18 0 0.6463 0.6853 0.6318 0.7340 3 4 241 8 2 0.6248 0.6759 0.6208 0.7264 4 5 231 11 0 0.5950 0.6583 0.6014 0.7110 5 6 220 7 38 0.5743 0.6512 0.5924 0.7061 6 7 175 5 51 0.5551 0.6457 0.5842 0.7033 7 8 119 7 38 0.5162 0.6166 0.5491 0.6805 8 9 74 2 43 0.4966 0.6075 0.5332 0.6781 9 10 29 0 29 0.4966 0.6280 0.5512 0.7010
start end n d w cp cr_e2 lo_cr_e2 hi_cr_e2 0 1 508 106 9 0.7895 0.8028 0.7639 0.8364 1 2 393 36 1 0.7171 0.7390 0.6961 0.7774 2 3 356 20 1 0.6767 0.7070 0.6622 0.7478 3 4 335 18 2 0.6403 0.6782 0.6318 0.7209 4 5 315 10 0 0.6199 0.6660 0.6186 0.7100 5 6 305 17 57 0.5818 0.6348 0.5857 0.6809 6 7 231 8 64 0.5584 0.6191 0.5681 0.6673 7 8 159 4 49 0.5418 0.6107 0.5571 0.6615 8 9 106 3 54 0.5212 0.5998 0.5408 0.6559 9 10 49 1 48 0.5004 0.5936 0.5176 0.6656
start end n d w cp cr_e2 lo_cr_e2 hi_cr_e2 0 1 429 136 9 0.6796 0.6922 0.6446 0.7351 1 2 284 37 1 0.5909 0.6117 0.5615 0.6585 2 3 246 30 1 0.5187 0.5456 0.4943 0.5946 3 4 215 16 0 0.4801 0.5137 0.4617 0.5638 4 5 199 11 1 0.4535 0.4939 0.4413 0.5449 5 6 187 5 32 0.4402 0.4884 0.4350 0.5405 6 7 150 5 45 0.4230 0.4789 0.4240 0.5328 7 8 100 5 36 0.3972 0.4578 0.3998 0.5153 8 9 59 0 31 0.3972 0.4655 0.4065 0.5239 9 10 28 1 27 0.3698 0.4397 0.3572 0.5222
start end n d w cp cr_e2 lo_cr_e2 hi_cr_e2 0 1 662 294 16 0.5505 0.5628 0.5230 0.6009 1 2 352 71 2 0.4391 0.4566 0.4166 0.4959 2 3 279 39 2 0.3775 0.3995 0.3599 0.4390 3 4 238 19 0 0.3474 0.3752 0.3356 0.4150 4 5 219 16 1 0.3219 0.3554 0.3158 0.3955 5 6 202 14 41 0.2971 0.3362 0.2964 0.3769 6 7 147 8 34 0.2788 0.3247 0.2839 0.3667 7 8 105 5 42 0.2622 0.3153 0.2724 0.3596 8 9 58 2 35 0.2493 0.3088 0.2620 0.3577 9 10 21 0 21 0.2493 0.3234 0.2744 0.3746
APP
END
ICES
Appendix 2

56Malaysian Study On Cancer Survival (MySCan), 2018
9. Lymphoma (children) (ICD-10: C81-85; C96)
Stage I
Stage II
Stage III
Stage IV
start end n d w cp cr_e2 lo_cr_e2 hi_cr_e2 0 1 11 1 0 0.9091 0.9095 0.5083 0.9871 1 2 10 1 0 0.8182 0.8190 0.4479 0.9521 2 3 9 1 0 0.7273 0.7284 0.3714 0.9043 3 4 8 1 0 0.6364 0.6378 0.2975 0.8470 4 5 7 0 0 0.6364 0.6382 0.2977 0.8475 5 6 7 0 2 0.6364 0.6386 0.2979 0.8481 6 7 5 0 3 0.6364 0.6391 0.2982 0.8488 7 8 2 0 1 0.6364 0.6398 0.2985 0.8497 8 9 1 0 0 0.6364 0.6405 0.2988 0.8506 9 10 1 0 1 0.6364 0.6411 0.2991 0.8515
start end n d w cp cr_e2 lo_cr_e2 hi_cr_e2 0 1 21 3 1 0.8537 0.8540 0.6122 0.9507 1 2 17 1 1 0.8019 0.8026 0.5546 0.9216 2 3 15 0 1 0.8019 0.8030 0.5549 0.9220 3 4 14 2 0 0.6874 0.6887 0.4303 0.8484 4 5 12 0 1 0.6874 0.6891 0.4306 0.8490 5 6 11 0 2 0.6874 0.6896 0.4308 0.8495 6 7 9 1 2 0.6014 0.6037 0.3273 0.7970 7 8 6 0 3 0.6014 0.6041 0.3275 0.7975 8 9 3 0 3 0.6014 0.6043 0.3276 0.7978
start end n d w cp cr_e2 lo_cr_e2 hi_cr_e2 0 1 24 5 1 0.7872 0.7875 0.5624 0.9057 1 2 18 1 0 0.7435 0.7441 0.5162 0.8765 2 3 17 3 1 0.6083 0.6092 0.3818 0.7750 3 4 13 0 0 0.6083 0.6095 0.3820 0.7755 4 5 13 0 0 0.6083 0.6099 0.3823 0.7760 5 6 13 0 2 0.6083 0.6103 0.3826 0.7765 6 7 11 0 2 0.6083 0.6108 0.3829 0.7771 7 8 9 0 7 0.6083 0.6114 0.3832 0.7778 8 9 2 0 0 0.6083 0.6119 0.3835 0.7785 9 10 2 0 2 0.6083 0.6124 0.3839 0.7792
start end n d w cp cr_e2 lo_cr_e2 hi_cr_e2 0 1 35 13 3 0.6119 0.6121 0.4274 0.7533 1 2 19 0 0 0.6119 0.6123 0.4275 0.7536 2 3 19 2 0 0.5475 0.5481 0.3650 0.6986 3 4 17 1 0 0.5153 0.5160 0.3350 0.6703 4 5 16 0 0 0.5153 0.5162 0.3352 0.6705 5 6 16 1 5 0.4771 0.4782 0.2982 0.6379 6 7 10 0 4 0.4771 0.4784 0.2983 0.6383 7 8 6 1 3 0.3711 0.3724 0.1590 0.5886 8 9 2 0 1 0.3711 0.3727 0.1592 0.5891 9 10 1 0 1 0.3711 0.3731 0.1594 0.5898
APP
END
ICES
Appendix 2
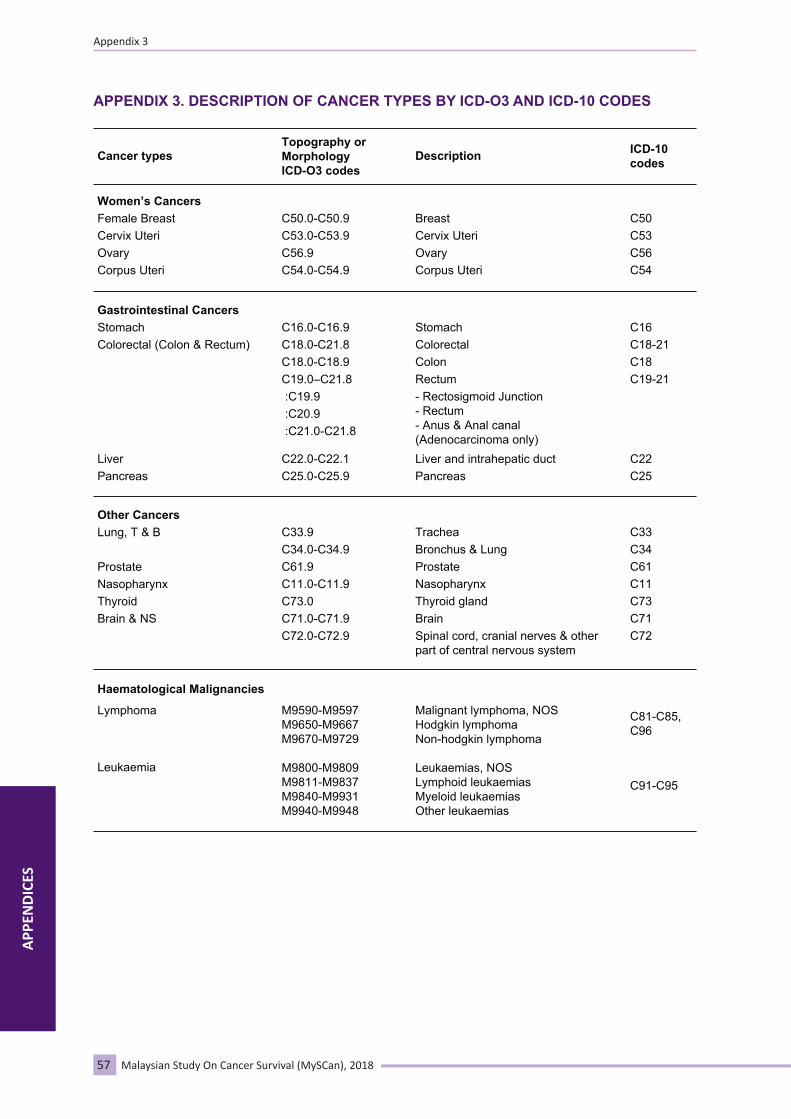
57 Malaysian Study On Cancer Survival (MySCan), 2018
APPENDIX 3. DESCRIPTION OF CANCER TYPES BY ICD-O3 AND ICD-10 CODES
Cancer typesTopography or MorphologyICD-O3 codes
Women’s CancersFemale BreastCervix UteriOvaryCorpus Uteri
C50.0-C50.9C53.0-C53.9C56.9C54.0-C54.9
BreastCervix UteriOvaryCorpus Uteri
Description
C50C53C56C54
Gastrointestinal CancersStomachColorectal (Colon & Rectum)
C16.0-C16.9C18.0-C21.8C18.0-C18.9C19.0–C21.8 :C19.9 :C20.9 :C21.0-C21.8
StomachColorectal ColonRectum- Rectosigmoid Junction- Rectum- Anus & Anal canal(Adenocarcinoma only)
C16C18-21C18C19-21
Other CancersLung, T & B
ProstateNasopharynxThyroidBrain & NS
C33.9C34.0-C34.9C61.9C11.0-C11.9C73.0C71.0-C71.9C72.0-C72.9
TracheaBronchus & LungProstateNasopharynxThyroid glandBrainSpinal cord, cranial nerves & otherpart of central nervous system
C33C34C61C11C73C71C72
Haematological Malignancies
Lymphoma
Leukaemia
M9590-M9597M9650-M9667M9670-M9729
M9800-M9809M9811-M9837M9840-M9931M9940-M9948
Malignant lymphoma, NOSHodgkin lymphomaNon-hodgkin lymphoma
Leukaemias, NOSLymphoid leukaemiasMyeloid leukaemiasOther leukaemias
LiverPancreas
C22.0-C22.1C25.0-C25.9
Liver and intrahepatic ductPancreas
C22C25
ICD-10codes
APP
END
ICES
Appendix 3
C81-C85, C96
C91-C95


Published and Distributed by:
National Cancer Registry DepartmentCollaboration with
Health Education UnitNational Cancer Institute
Ministry of HealthPutrajaya
http://[email protected]