malcolm baldrige national quality award -...
TRANSCRIPT

Malcolm Baldrige National Quality Award
2 0 1 6 A P P L I C AT I O N

Table of Contents

Glossary of Terms and Abbreviations ........................................................................................................................ G1
Preface: Organizational Profile .................................................................................................................................. P1
Responses Addressing All Criteria Items:
Category 1: Leadership ....................................................................................................................................... 1
Category 2: Strategy ............................................................................................................................................ 6
Category 3: Customers ........................................................................................................................................ 11
Category 4: Measurement, Analysis, and Knowledge Management ...................................................................16
Category 5: Workforce .........................................................................................................................................21
Category 6: Operations ........................................................................................................................................26
Category 7: Results .............................................................................................................................................31
Glossary of Terms and Abbreviations

GP – Gross Profit
GREENGUARD – GREENGUARD Indoor Air Quality certify that products do not emit harmful levels of indoor air contaminants.
HM – High mileage; refers to high mileage vehicles of >35mpg for Sales Reps’ automotive program.
HR – Human Resources; a support process dedicated to the hiring and administration of personnel.
IBA – Internal Baldrige Award
Inside Sales – A core process workgroup that supports the Sales Reps and perform customer service activities to facilitate the sales process.
Inventory Management – A core process workgroup dedicated to the purchasing and management of inventory and supplier management.
IT – Information Technology; a support process dedicated to tech support and processing of information.
LeTCI – Levels, trends, comparisons and integration
LoomSource – Product line for the Hospitality market.
Marketing – A support process dedicated to promoting the Momentum brand.
MBAR – Malcolm Baldrige Award Recipient
MDS – Marketing/Design/Sales monthly meetings
Memo Sample – A free 8 1/2 x 8 1/2 swatch of fabric labeled with product specifications that is sent to the customer in order to view the color, hand and pattern of a product before placing a fabric order.
Momentum Textiles – Product line that serves Office and Healthcare markets.
Momentum Way – Momentum’s employee handbook
Order Filling – A core process workgroup dedicated to receiving of product, filling and shipping customer orders.
OSHA – Occupational Safety and Health Administration; federal agency charged with the enforcement of safety and health legislation.
Piece-dyed rolls – A roll of fabric that has been dyed all at one time in large dye bath equipment after being woven. (In contrast to dyeing the yarns first and then weaving the fabric).Piece-dyed rolls require shade matching at time of receiving due to the variances in color shades that occur during the dying process.
Product Development – A core process workgroup that is dedicated to the development of high quality designs that grow sales, hit gross profit targets and meet REI goals.
ADLI – Approach, Deployment, Learning and Integration
2Clicks – Memo sample take-back program developed so customers can return memo samples at no charge with only two clicks on Momentum’s website.
5Clicks – Proprietary tool on Momentum’s website that links real time inventory levels with CFM price points and pre-approvals on furniture in five easy clicks.
A&D – Architects and Designers
Accounting – Support process that manages financial reporting, month end process and accounts payables.
ACT – Association of Contract Textiles; industry association that puts forth product performance standards for contract textiles.
AFC – Applied Fabric Claim; a customer claim once the fabric has been applied to furniture.
BIC – Best in Class
BIFMA – Trade association for Business and Institutional Furniture Manufactures that puts forth the quality standards for woven textiles.
Card Program – A partnership with a CFM whereby they agree to purchase a specific quantity or series of sample cards.
Coated Fabric – Comprised of non-woven textiles such as polyurethanes, and Silica to be applied to seating furniture.
Credit – Support process that manages accounts receivables and collections.
CFM – Commercial Furniture Manufacturer
CFM Programs – See card programs
CRM – Customer Relationship Management software
C&S – Core and Support processes. These are Momentum’s workgroups. Every employee belongs to either a Core or Support process.
Devel. – Development
DSO – Days Sales Outstanding; used as an indicator of the number of days it takes Momentum to collect its accounts receivable.
EBITDA – Earnings Before Interest, Taxes, Depreciation, and Amortization; indicator of a company’s financial performance.
ETA – Estimated Time of Arrival
Five Categories of Focus – Vision, Customer, People/Culture, Operations and Financial
Google Analytics – A web service that provides statistics and analytical tools for search engine optimization and marketing purposes.
G1
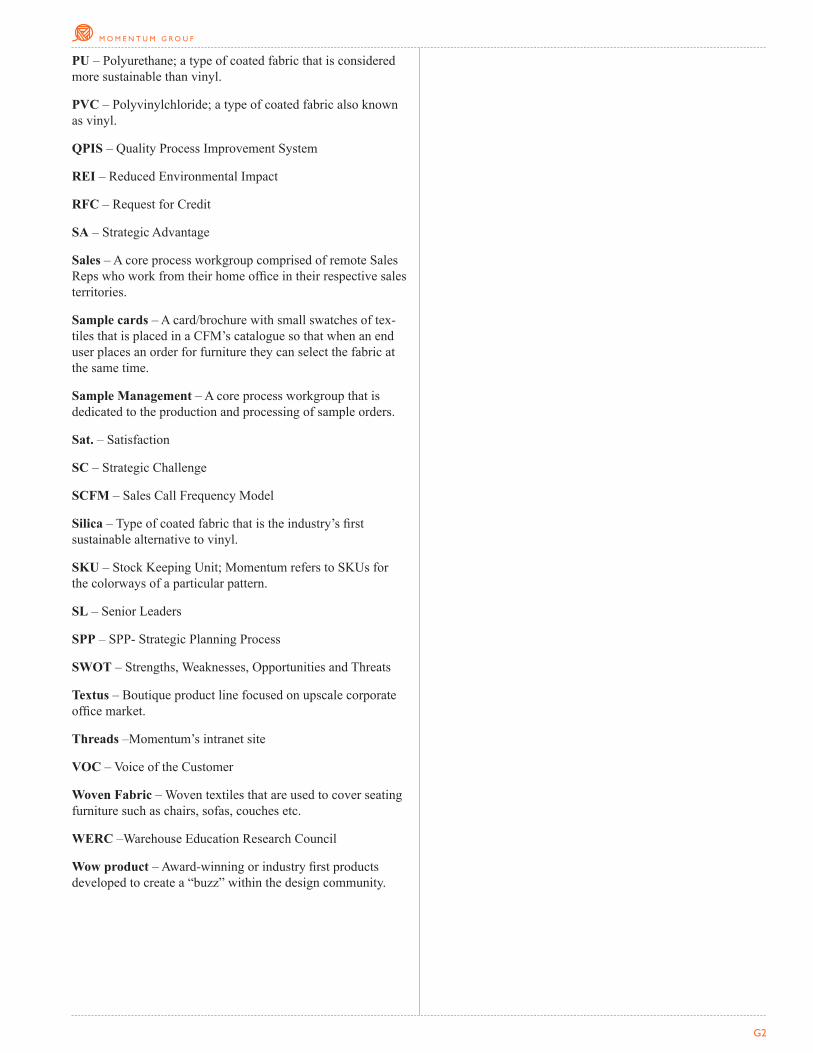
PU – Polyurethane; a type of coated fabric that is considered more sustainable than vinyl.
PVC – Polyvinylchloride; a type of coated fabric also known as vinyl.
QPIS – Quality Process Improvement System
REI – Reduced Environmental Impact
RFC – Request for Credit
SA – Strategic Advantage
Sales – A core process workgroup comprised of remote Sales Reps who work from their home office in their respective sales territories.
Sample cards – A card/brochure with small swatches of tex-tiles that is placed in a CFM’s catalogue so that when an end user places an order for furniture they can select the fabric at the same time.
Sample Management – A core process workgroup that is dedicated to the production and processing of sample orders.
Sat. – Satisfaction
SC – Strategic Challenge
SCFM – Sales Call Frequency Model
Silica – Type of coated fabric that is the industry’s first sustainable alternative to vinyl.
SKU – Stock Keeping Unit; Momentum refers to SKUs for the colorways of a particular pattern.
SL – Senior Leaders
SPP – SPP- Strategic Planning Process
SWOT – Strengths, Weaknesses, Opportunities and Threats
Textus – Boutique product line focused on upscale corporate office market.
Threads –Momentum’s intranet site
VOC – Voice of the Customer
Woven Fabric – Woven textiles that are used to cover seating furniture such as chairs, sofas, couches etc.
WERC –Warehouse Education Research Council
Wow product – Award-winning or industry first products developed to create a “buzz” within the design community.
G2

Preface: Organizational Profile

and Support (C&S) process’ applications that demonstrate performance on over 250 critical process measures compared to goal (Figure 1.1-3) This long-term dedication to process improvement was recognized when the company progressed from Bronze to Silver, and then received Gold in 2015 from the California Award for Performance Excellence (CAPE), the state Alliance member in California.
P.1a Organizational EnvironmentP.1a(1) Product OfferingsMomentum designs and sells fabrics that are exclusive designs developed by Momentum’s Product Development team. These fabrics are woven or manufactured by outsourced mills and sold to Momentum in full roll increments (average of 50-yard rolls). The value Momentum adds to its customers is exclusive product designs and cut-to-order quick ship service with only a one-yard minimum per order. Momentum’s two largest product offerings include upholstery seating woven fabrics and coated fabrics (such as polyurethanes, and Silica).
Momentum’s delivery mechanism is to use its Sales Reps and Inside Sales agents to sell the fabrics that are shipped to customers from its multiple stocking locations. Momentum is a business-to-business supplier selling to customers who are primarily Architects and Designers (A&D) or Commercial Furniture Manufacturers (CFM) who then provide the design service or the furniture to their customers such as Google, Marriott and Kaiser.
P.1a(2) Mission, Vision and Values MissionThe mission of Momentum Group is to create textiles that inspire and equip our customers to execute great work for their clients. We are individually and collectively committed to superior service and operational excellence.VisionMomentum Group’s vision is to be the undisputed leader in innovative and sustainable contract textiles.ValuesMomentum Group’s core values are:■ Fairness, honesty and respect in all interactions■ Advancing, developing and hiring employee excellence■ Bettering the world around us■ Reducing difficulties experienced by our customers■ Increasing shareholder value■ Continuous improvement of our products and services
Momentum’s core competencies (which will be italicized throughout the application) include an innovative product design team and a sophisticated selling process. These core competencies are essential in fulfilling Momentum’s mission. The innovative product development team inspires the customer to do great work and the sophisticated selling process provides superior service and operational excellence above what the competition offers. (Figure 7.2-1-7.2-6).
P.1a(3) Workforce ProfileMomentum is a small business whose family is in seven loca-
P.1 Organizational DescriptionMomentum Group (Momentum) is a true success story. Started more than 20 years ago as one of the smallest contract textile distributors, Momentum is now one of the largest in the nation and has grown sales by over 400% (Figure 7.5-5). The company is also honored to be consistently ranked as the industry leader by its customers (Figures 7.2-1-7.2-6), named a Top Workplace by its employees (Figure 7.3-13), and awarded Gold from the California for Performance Excellence (CAPE) in 2015 for op-erational excellence. This has been accomplished by diligent and continuous improvement in all aspects of the business, reinforced by a culture of core values, and sustained by employees sharing in Momentum’s financial success.
Today, Momentum is a leading value-added distributor that cre-ates exclusive, design-focused fabrics for the commercial interi- ors industry. Having won multiple industry awards for design and innovation in recent years, Momentum strives to create inno-vative and high visibility fabrics with environmentally sustain-able characteristics. Momentum distributes to customers in mul-tiple end markets including Office, Hospitality, and Healthcare.
The Baldrige JourneyMomentum has been invested in continuous improvement since 1991, by using the Baldrige Performance Excellence framework as the underpinning to its journey and progression (P.2c).
For more than 20 years of Momentum’s history, a culture of continuous improvement has thrived and is deployed to every employee within the organization through Momentum’s Quality Process Improvement System (QPIS), and specifically through its Internal Baldrige Application (IBA) process. The IBA is an annual review process where all 11 workgroups (six Core processes and five Support processes. See Figure 2.1-3) submit an internal Baldrige-based application to an outside reader. Momentum has hired a national Malcolm Baldrige examiner for the past 16 years to evaluate each of the Core
P1
Figure P.1-1 Baldrige Journey
Sustainable Performance (2015+)• Seek third-party performance feedback from California Awards for Performance Excellence program and from the Baldrige Perofmrance Excellence Program
Learning and Strategic Improvement (2008-2014)• Internal and external benchmarking of internal processes and measures• Development of handoff measures between C&S processes• ADLI and LeTCI criteria added to Internal Baldrige Award
Systematic Evaluation and Integration (1999-2008)• Development of Company Dashboard• Core and Support critical process measures• Inception of Internal Baldrige Award• Recogntion is tied to continual improvement
Building Blocks (1991-1999)• Strategic planning• Corrective action through Action Teams or C&S process workgroups• Recognition program• Momentum Way employee handbook• Employee training

engagement surveys. This strong company culture drives em-ployees to give the extra effort needed to accomplish Momen-tum’s mission and contribute to organizational success. Further, when the company does well, employees share in Momentum’s financial success (Figure 7.3-9).
P.1a(4) AssetsMost of Momentum’s assets are located at the corporate head-quarters in Irvine, California and the warehouses that are stra-tegically located near U.S. textile mill suppliers and large CFM customers. For a detailed list of assets see Figure P.1-5 and P.1-6.
Location FacilitiesIrvine, CA Office spaceArchdale, NC Holland, MI Anaheim, CA
Office and warehouse space
Chicago Showroom Dallas Showroom New York Showroom
Showrooms
Figure P.1-5 Momentum’s Locations
Technology EquipmentProprietary IT AssetsInventory TrackingOrder ProcessingWebsite5ClicksIntranetSales Rep Dashboard
Textile inventoryOffice equipmentCutting tablesProduct racks and shelvesForklifts
Figure P.1-6 Momentum’s Assets
P.1a(5) Regulatory RequirementsMomentum is a member of BIFMA, the trade association for Businesses and Institutional Furniture Manufacturers, and com-plies with the BIFMA standard for Woven Textile Characteristics. This standard is intended to define industry policies established for textile quality standards. Momentum is also a member of ACT, the Association of Contract Textiles, and complies with ACT standards for product performance for the contract market. In terms of workforce and operations, Momentum complies with all OSHA regulations in the states in which it operates.
P.1b Organizational RelationshipsP.1b(1) Organizational StructureRoger Arciniega holds the position of President/CEO. See orga-nizational chart for SLs’ (Vice Presidents’) areas of responsibil-ity. All SLs report to the President/CEO. Each manager leads or belongs to a Core or Support (C&S) process (see Figure 2.1-3 for a list of C&S processes).
P.1b(2) Customers and StakeholdersMomentum sells to three key market segments: Office, Hospitality, and Healthcare. In each of these market segments there are A&D customers who select and purchase fabric for commercial interiors and CFM customers who produce the furniture for these interiors.
tions and remote employees who work from their home office (see Figure P.1-4). There are no organized bargaining units. The educational requirement for all employees is a high school diploma or equivalent and for managers is a bachelor’s degree or equivalent. Additional requirements for technical expertise within a particular field are noted in the job description as applicable. Health and safety requirements, such as lifting for warehouse employees, are detailed in the specific job descriptions, and there is an active safety program and team that meets quarterly to address any safety issues as needed. Momentum’s workforce diversity matches that of the local communities and the company hires the most qualified candidate. Momentum has recently ex-perienced an increase in remote employees in response to the need to hire the most qualified Inside Sales agents. To support this organizational change, Momentum invested in an integrated communications management system that allows for customi-zation and operational flexibility at a multitude of locations. In order for Momentum to be successful it needs engaged employees who are committed to Momentum’s mission, vision and values. Momentum’s key driver for employee engagement is a strong core value-driven culture that fosters employee involvement and development.
A highly engaged family of employees has allowed the company to retain top talent, which is noted by the remarkable tenure at Momentum (Figure P.1-4), as well as Momentum consistently being named a Best Place to Work and most recently being hon-ored as one of the Top Places to Work based solely on employee
Function # of Employees % of Employees Average Tenure Full Time Part Time Management Non ManagementSales/Inside Sales 54% 7 yearsProduct Development/Marketing 6% 8 yearsOperations 30% 10 yearsSupport 11% 15 yearsTotal 100% 10 yearsFigure P.1-4 Momentum’s Workforce Profile
P2
• Every employee is involved in either a Core or Support process workgroup• Action team participation• Opportunity Knocks
• Learning Plans• Tuition Reimbursement• Talent Management• Promoting from within whenever possible
• Core values• Family-like culture• Share in financial success• Recognition program• Benefits
INVOLVE
DEVELOP
ENGAGECore Processes: Product Development; Sample Management; Sales, Inside Sales, Inventory Management; Order Filling.Support Processes: Marketing, Information Technology, Human Resources, Accounting, Credit
{
Figure P.1-3 Involve, Develop, Engage

can be wiped off ■ Recycled wool, the first recycled wool commercial textile■ Silica Prints (to be launched in 2016): All the performance
benefits of Silica with printed patterns that resemble a woven fabric
With textile suppliers all over the world it is important that Momentum maintains a high level of expectations and standards with which suppliers must comply in order to continue as a supplier. A well-established vendor evaluation program (section 6.2b) is conducted on a quarterly basis with key suppliers to ensure high levels of quality, timeliness and service. They are evaluated and ranked as either Preferred, Approved, or on Probation based on the supplier evaluation criteria detailed in Figure 6.2-3.
Collaborations Momentum collaborates with renowned designers from a variety of disciplines, which includes artists and graphic, industrial, and furniture designers who complement Momentum’s work system. These collabora-tions are conducted on a project-per-project basis and evaluat-ed throughout the project based on their contractual agreement. It is due to Momentum’s core value-driven business model that these renowned designers collaborate with Momentum. The shared vision between Momentum employee Designers and these outside designers of providing innovative and sustainable products to the market is what has made these design endeav-ors so successful. A recent example of a successful collabo-ration is the Crossing Colors collection with renowned artist Sheila Hicks as described in 3.2a(1).
Partnerships Partnerships with yarn suppliers have also been instrumental in the success of the company’s global supply chain in order to uphold Momentum’s high quality product standards. Communication with yarn suppliers is determined through high level Product Planning and Vendor meetings detailed in Figure 4.1-4.
P.2 Organizational SituationP.2a Competitive EnvironmentP.2a(1) Competitive PositionAlthough a small business, Momentum is the largest supplier of upholstery fabric and the largest independently-owned con-tract textile company in North America.
Momentum is not able to determine exact market share because competitors are privately owned. However Momentum has consistently grown faster than the industry in sales 19 out of 22 years (Figure 7.5-15). This indicates that despite the in-dustry not growing at a high rate, Momentum has been able to gain increasing market share in order to grow sales year after year.
P.2a(2) Competitiveness ChangesA key change that has affected Momentum’s competitive situation has been the emerging trend of increasing demand for sustainable and high performing commercial fabrics. Momentum is on the forefront among competitors in developing sustainable,
Through Momentum’s extensive customer segmentation by mar-ket and customer type for over 20 years, it has become clear that customers’ driving requirements are more similar than different among the A&D and CFM markets, with the few differences noted in Figure P.1-9 and P.1-10.
For Both A&D and CFM Primarily for A&D Primarily for CFMProduct Design Sales Rep Sustainable products and operations Innovation Customer service Easy to use website
Timeliness of samples
Value for design On-time and accurate delivery
Figure P.1-9 Customer Key Requirements
Market RequirementsOffice Breadth of product design at multiple price pointsHospitality Decorative patterns for hospitality applicationsHealthcare Performance and cleanable fabrics for high traffic areas
Figure P.1-10 Market Segment Requirements
Other stakeholder requirements are detailed in Figure P.1-11.
Stakeholders Requirements ResultEmployees Competitive compensation and benefits
Involvement and development7.3-12 7.3a(4)
Shareholders Profitability measured by EBITDA 7.5-6Suppliers Regular evaluations and feedback 7.1-29Community Community involvement 7.4-11
Figure P.1-11 Stakeholder Requirements
P.1b(3) Suppliers and PartnersMomentum’s key suppliers are textile mills in North America, Asia and Europe. Momentum collaborates with renowned outside designers in the industry who are hired to augment Momentum’s Product Development core process and bring new products to market. Partners include yarn suppliers that do not sell directly to Momentum but work with Momentum on yarn development and pigmentation.
Suppliers Textile mills contribute to Momentum’s work sys-tem by weaving or manufacturing the fabrics that are designed by Momentum employee Designers. This outsourced process of manufacturing is not a Momentum core competency, and all textile mill suppliers are selected and managed through the supply chain management process described in 6.2b. Momen-tum’s employee Designers (as part of the Product Develop-ment core process) are responsible for Momentum’s product development capabilities and work together with customers and suppliers to timely develop fabrics that meet customers’ requirements for design and functionality in a cost efficient manner. As detailed in Momentum’s product design process (Figure 6.1-1), Momentum’s experienced Designers control every step of pattern development and select the supplier based on their core competencies, ability to execute production, and enhance competitiveness. Through this design and selection process, innovative and award-winning designs that push the boundaries of what is possible have emerged. The most recent examples of Momentum’s “first to market” innovative, sustainable products are:■ Naked Nylon, the first recycled and recyclable nylon textile■ Silica, a revolutionary sustainable coated fabric alternative
to vinyl that performs so well that even a permanent marker
P3

process (Figure 2.2-1) and uniquely integrates the Baldrige criteria into its review process. Momentum hires a national Malcolm Baldrige examiner every year to perform a system-atic performance review of the 11 C&S process workgroups (Figure 1.1-3), which submit an internal Baldrige application. This review encompasses over 250 critical process measures compared to benchmarks and goals in three areas: 1) Handoffs: Measures that track how well another C&S process is meeting a workgroup’s requirements in order to accomplish its work.2) Process: Measures that track how well a C&S process workgroup is performing compared to benchmark or goal.3) Customer Satisfaction: Measures how well a C&S process workgroup is meeting its customers’ requirements.
Not only are these measures reviewed annually by the national examiner, but they are also the bases for monthly C&S process review meetings (4.1-4). (See Figure 6.1-3 for an example of three types of critical process measures).
Recognition: The key to Momentum’s successful implementa-tion of process improvement is the manner in which it incorpo-rates recognition at all levels of the organization. Momentum incorporates employee recognition at the company level (profit sharing), C&S process workgroup (IBA), and individual levels (Individual Performance Excellence Award) (see Figure 5.2-1 for full description of the recognition system).
This structured and fully-deployed QPIS (Figure 4.1-1) that integrates individual, C&S process workgroup, and company performance with employee recognition has been the key to aligning individual activities to Momentum’s strategic objectives and accomplishing its mission. The QPIS also provides a systematic framework for continual learning and innovation in processes and products.
As a Baldrige-based company, Momentum has learning built into its processes. As a guide throughout the application, points in the process where Momentum employees learn, are identified with a . Innovative products or processes are identified with a .
reduced environmental impact (REI) textiles (Figures 7.4-4 and 7.4-5) that also have high performance capabilities such as Sil-ica, the first sustainable alternative that has all the performance attributes as vinyl. Momentum is also recognized as the industry leader in sustainability by its customers (Figure 7.2-1-7.2-5).
P.2a(3) Comparative DataAs a continuous improvement-focused company, Momentum challenges its C&S processes to seek out learning opportuni-ties within and outside the industry. Although Momentum has limited access to competitive data, as a member of BIFMA and ACT, Momentum is privy to comparative industry data for three measures: sales growth, sales per employee, and sample expense as a percentage of sales. Figure P.2-1 provides a list of the type of comparative and competitive data that Momentum uses to learn from and to compare its measures and results. Industry sources are noted in parentheses.
P.2b Strategic ContextMomentum’s key strategic challenges in business, operations, and workforce are detailed in Figure P.2-2 with Momentum’s appropriate strategy. Momentum’s key strategic advantages are detailed in Figure P.2-3.
P.2c Performance Improvement SystemMomentum’s QPIS is based on over 20 years of learning and evolving using the Baldrige Performance Excellence Program (BPEP) framework (Figure P.1-1). The QPIS (Figure 4.1-1) uses accountability, performance review, and recognition with-in its six steps to integrate continuous improvement of products and processes into all aspects of the business and to every employee throughout Momentum.
Accountability: Once the strategic plan has been established using the Strategic Planning Process (SPP) (Figure 2.1-1), every strategic action plan is deployed through the Action Plan Implementation process (Figure 2.2-1) from the company level and C&S process workgroups to the individual employee level.
Performance Review: Momentum’s performance review is deployed through the Organizational Performance Review
P4
Area Company/Organization Benchmarked Measure ResultsProduct and Brand
No of patterns in CFM price pointREI introductions per yearGross margin and Gross profit for products Product development process
7.1-11 7.4-5 7.1-20-7.1-23 7.1-14
Operations
WebsiteWarehouse best in class metrics% of A product in-stock Product Return RateCustomer inquiry response timeClaims cycle time
7.1-6 7.1-4,7,9,10,16,18,19,28 7.1-8 7.2-10 7.1-5 7.2-9
Workforce
Training and developmentBenefits participation Employee satisfaction/engagementSafety and injury rateTurnover
7.3-16 7.3-10 7.3-12-7.3-13 7.3-8 7.3-11
Customer Customer satisfaction on key requirements 7.2-1-7.2-6Financial
Industry growthSales per employeeSample expense as a % of salesBad debt as a % of salesDSO
7.5-15 7.3-2 7.5-7 7.5-4 7.5-3
Figure P.2-1 Comparative Data Sources

1.1a(2) Promoting Legal and Ethical BehaviorOne of Momentum’s core values is fairness, honesty and respect in all interactions, which embeds ethical practices into Momentum’s culture. SLs model ethical principles in their behaviors and decision making. In order to ensure that ethics are integrated into Momentum’s business practices and deployed throughout the organization, SLs actively support and participate in all ethical business practices described in 1.2b(2). SLs hold themselves and all employees accountable for their actions, and everyone is expected to exercise good judg-ment as well as moral courage in matters of investigating and reporting any unethical occurrence. Employees at all levels including SL receive regular feedback during performance evaluations on how their behavior and decisions comply with ethic codes and Momentum’s code of conduct policies.
Violations to Momentum’s ethics policy as stated in the Momentum Way (employee handbook) result in disciplinary action up to and including termination. The SLs’ goal is to lead a company that is not only driven by its core values, but is easy to do business with and is trusted. This is realized in the man-ner in which they treat employees, customers, and suppliers.
CATEGORY ONE: LEADERSHIP
1.1 Senior Leadership1.1a Vision, Values and Mission1.1a(1) Vision and Values Momentum was formed over 20 years ago when Senior Leaders (SLs) set the vision and values for Momentum with a clear direction in mind. Thus, from that initial group of employees, many of whom are still with Momentum today, the birth of Momentum’s core value-driven culture emerged. The values as described in P1.a2 continue to permeate the culture as they are deployed and integrated throughout the organiza-tion. The vision, which evolves as the company evolves, is reviewed by the management team during annual strategic planning to ensure that it is consistent with the shared vision of the future, market conditions and Momentum’s capabilities. SLs deploy Momentum’s vision and values throughout the organization by their personal actions, strategic planning, talent management and communication to stakeholders (Figure 1.1-1).
1
Leadership System Approach Deployment Learning IntegrationStrategic Planning
Vision and core values are the foundation to the strategic planning process (Figure 2.1-1)
The strategic plan is presented to all employees and shareholders and is integrated into the company Dashboard and reviewed and updated throughout the year
All objectives and action plans are reviewed quarterly at the Dash-board meetings by all managers including SL. Changes or updates are reviewed to establish a decisive course of action
Momentum integrates individual goal setting, and C&S critical process measures with operational performance measures (Figure 2.2-1)
Talent Management
Core value behavioral competencies are the basis for Momentum’s recruiting, performance evaluations, promotions and recognition (5.1)
All managers are trained in using core values as the basis for talent management in their departments
All employee related measures are reviewed quarterly at the Dashboard meetings by all managers including SLs for areas of improvement
Core values are the basis for all employee relations as the behaviors are demonstrated, observed, documented and rewarded from top SLs to every level of the organization
Communication Vision and core values are communicated to all employees via communication channels in Figure 1.1-2
Management’s open door policy; Senior Leaders visit other loca-tions; Strategic Plan Presentation; President’s Award Dinner for recognition; Employee training, company Intranet; ADP, Wall art in corporate office, website
Employees are presented with the vision and values throughout the organization by the SLs and the man-agement team, these are all reinforced through Momentum’s recognition pro-gram and detailed in the Momentum Way (employee handbook)
Vision and core values are communicated to customers via website and contact with employees
All customers are able to visually see Momentum’s values on company website and experience them via interactions with Momentum’s SL and employees during in-person sales calls.
Customer Survey results and feedback from sales calls enable Momentum to learn where the company can improve in products and services to its customers
Momentum produces a video presentation for customers that describes the alignment of Momentum’s values and its milestones and accomplishments over time
Vision and core values are communicated to suppliers via vendor requirements binder
Suppliers are provided a vendor binder by SLs that explicitly states Momentum’s requirements and how suppliers are integral in Momentum being able to live its values and accomplish its vision
Quarterly supplier feedback provides a learning tool for Momentum to improve its relationships with its suppliers
Suppliers are rewarded with continual product placements based on their ability to meet customer requirements and support Momentum’s values and vision (6.2b)
Vision and core values are communicated to collaborators via product development projects and contracts
Design collaborations are selected based on commonality of Momentum mission and values
Collaborations provide the venue for benchmarking best practices among top designers in the industry that share Momentum’s vision and values
Future collaborations are selected based on the ability to meet customer requirements and support Momentum’s values and vision
Vision and core values are communicated to community via website and volunteer opportunities
Momentum strives to live its core value of bettering the world around us
A community involvement corporate team plans community events, fundraisers and volunteer opportunities for their surrounding community
Momentum’s product, operations and employees’ volunteerism reflect the spirit of giving to others andto the environment through specific, measurable actions
Figure 1.1-1 Leadership System
■ Sharing customer survey results with all employees via the intranet. This allows employees to learn from customer in-
put and to see the impact of their customer service interactions, which motivates them further.
■ Each of the 11 C&S processes has a critical process matrix whereby they identify their customers, the corresponding customer requirements, and measures for associated outcomes. (Figure 6.1-3) The process for meeting customer requirements and accomplishing results are part of the IBA (Figure 1.1-3) reviewed and scored by a national Baldrige examiner on an annual basis.
Innovation and Intelligent Risk Taking Momentum’s vision is to be the undisputed leader in innovative and sustainable contract fabrics. SLs fosters this environment of innovation by:■ Challenging the Product Development core process and
suppliers to provide breakthrough innovation. This freedom allows for Momentum to develop “industry first” type products (Figure 7.1-1 and 7.4-16) and be considered the industry leader in innovative products by our customer base compared to our competitors (Figure 7.2-1-7.2-5).
■ Rewarding suppliers that bring their innovative products to Momentum first.
■ Fostering learning and innovation by attributing a greater percentage of points for learning and innovation in the IBA applications (Figure 1.1-3) used by all C&S processes and scored by the national Baldrige examiner.
■ Leveraging financial strength for innovation and risk taking for the accomplishment of its strategic objectives. Momentum’s financial strength has allowed it to become highly agile and able to adapt to changing market conditions. Through the SPP described in 2.1a(1), Momentum assesses the feasibility and the risk factor of each strategic objective at the start of the year and continues these assessments during the quarterly Dashboard review process.
Succession Planning and Leadership Development Advancing and developing employees is one of Momentum’s core values and SLs foster succession planning and leadership development in a manner that is commensurate with a small company. Even though a rigid development structure is not feasible, the SLs’ approach to development is to build its own leaders through coaching and mentoring talent. This approach is effective and deployed throughout the entire organization. This structure allows SLs to foster leadership skills in their direct reports over time, leading to promotions from within (Figure 7.3-17) and a low turnover rate (Figure 7.3-11). The mentoring process by which this is done is a three-tiered process as follows:1. Identifying talent through recruiting, performance evaluations and recognition.2. Fostering personal and career development through learn-ing plan opportunities, tuition reimbursement for higher educa-tion, or through outside sources that provide technical training and development (Figure 7.3-16).3. Promoting from within whenever possible, with 73% of current managers promoted from a non-management position. (Figure 7.3-17)
A simple example of this impartial treatment to all customers is Momentum’s clear pricing policy that is transparent and fair to all customers.
1.1a(3) Creating a Successful OrganizationMomentum’s SLs are dedicated to ensuring the continued success of the company. They have successfully led the company with consistent revenue growth since inception (Figure 7.5-5). They are very cognizant of the indicators of organizational success and have developed methods to promote success now and for the future:Achievement of Vision and Mission■ Momentum’s SLs have created a company structure that is
designed with minimal layers and is replete with cross-func-tional work meetings (Figure 4.1-4) in order for quick decision making and the agility to respond to changing market condi-tions.
■ SLs participate in the deliberate strategic planning process (SPP Figure 2.1-1) and quarterly Dashboard review meeting of company performance on operational measures that support the achievement of Momentum’s vision and mission.
■ With Dashboard integration of the strategic plan and C&S process workgroup objectives, Momentum’s strategic objectives are aligned with employees’ individual perfor-mance (Figure 2.2-1).
Organizational Performance Improvement Through deployment of Momentum’s three-tiered Quality Process Improvement System (QPIS) (P.2c and Figure 4.1-1) any performance measure or action team progress that is not performing to goal is discussed by the management team so that a corrective action plan can be used by all managers as an opportunity to learn and prevent the same occurrence from happening in the future (see Step #6 of SPP (Figure 2.1-1)).
Organizational and Workforce Learning SLs create an en-vironment of organizational learning by encouraging employees with the time and resources for benchmarking processes and re-sults and for learning in their field. As described in 5.2b, all C&S processes (through the IBA process Figure 1.1-3) and employees (through their yearly learning plans) are called to continuously learn and improve the way they manage their processes. This magnifies as each C&S process workgroup is able to learn from each other and identify the next possible opportunity for improve-ment within their sphere of control. The SLs reward and recognize C&S process workgroups and employees publicly for achieve-ments which serves to reinforce the spirit of continuous improve-ment and learning (see recognition program Figure 5.2-1).
Customer-Focused Culture SLs are heavily involved in creating a workforce culture that delivers a consistently positive experience for the customer. One of Momentum’s core values is to reduce difficulties experienced by our customers. This core value is supported by:■ A talent management process that hires employees based
on Momentum’s core values; recognizes employees who go above and beyond their job description to benefit the customer; and rewards employees with company profit sharing when Momentum does well. This perpetuates the feeling of camara- derie among employees at all levels of the organization.
2
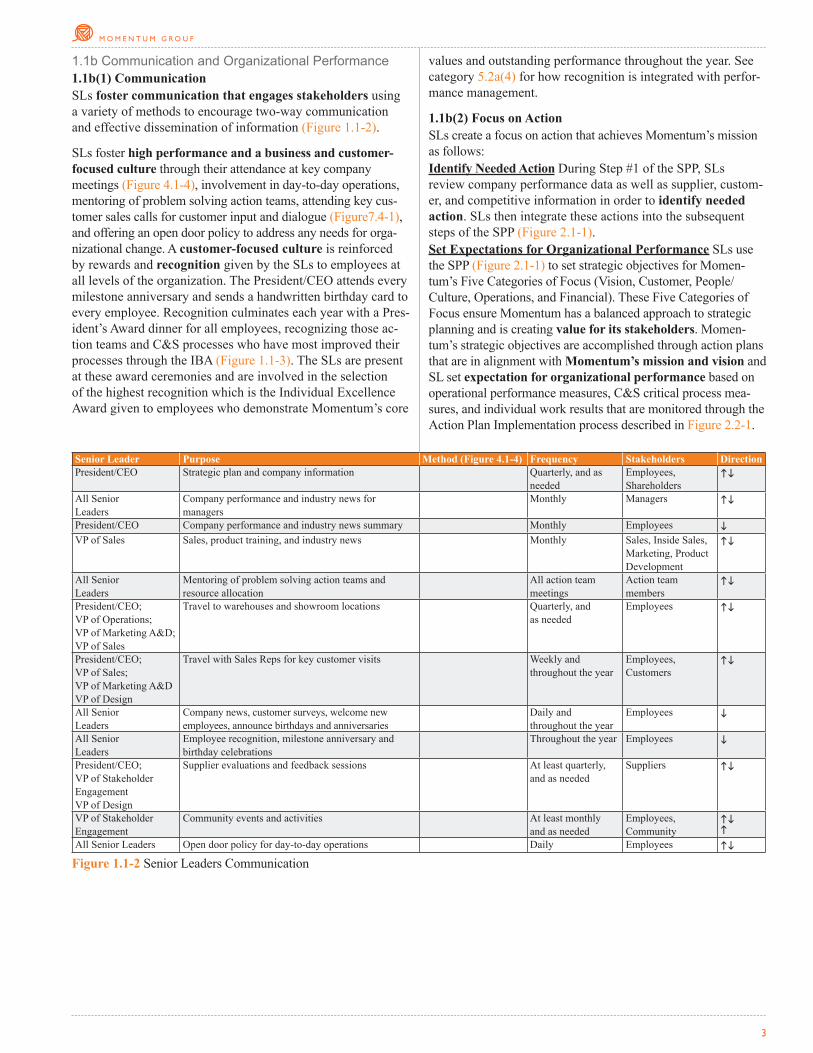
values and outstanding performance throughout the year. See category 5.2a(4) for how recognition is integrated with perfor-mance management.
1.1b(2) Focus on ActionSLs create a focus on action that achieves Momentum’s mission as follows: Identify Needed Action During Step #1 of the SPP, SLs review company performance data as well as supplier, custom-er, and competitive information in order to identify needed action. SLs then integrate these actions into the subsequent steps of the SPP (Figure 2.1-1).Set Expectations for Organizational Performance SLs use the SPP (Figure 2.1-1) to set strategic objectives for Momen-tum’s Five Categories of Focus (Vision, Customer, People/ Culture, Operations, and Financial). These Five Categories of Focus ensure Momentum has a balanced approach to strategic planning and is creating value for its stakeholders. Momen-tum’s strategic objectives are accomplished through action plans that are in alignment with Momentum’s mission and vision and SL set expectation for organizational performance based on operational performance measures, C&S critical process mea-sures, and individual work results that are monitored through the Action Plan Implementation process described in Figure 2.2-1.
1.1b Communication and Organizational Performance1.1b(1) CommunicationSLs foster communication that engages stakeholders using a variety of methods to encourage two-way communication and effective dissemination of information (Figure 1.1-2).
SLs foster high performance and a business and customer- focused culture through their attendance at key company meetings (Figure 4.1-4), involvement in day-to-day operations, mentoring of problem solving action teams, attending key cus-tomer sales calls for customer input and dialogue (Figure7.4-1), and offering an open door policy to address any needs for orga-nizational change. A customer-focused culture is reinforced by rewards and recognition given by the SLs to employees at all levels of the organization. The President/CEO attends every milestone anniversary and sends a handwritten birthday card to every employee. Recognition culminates each year with a Pres-ident’s Award dinner for all employees, recognizing those ac-tion teams and C&S processes who have most improved their processes through the IBA (Figure 1.1-3). The SLs are present at these award ceremonies and are involved in the selection of the highest recognition which is the Individual Excellence Award given to employees who demonstrate Momentum’s core
Senior Leader Purpose Method (Figure 4.1-4) Frequency Stakeholders DirectionPresident/CEO Strategic plan and company information Quarterly, and as
neededEmployees, Shareholders
i
All Senior Leaders
Company performance and industry news for managers
Monthly Managers i
President/CEO Company performance and industry news summary Monthly Employees iVP of Sales Sales, product training, and industry news Monthly Sales, Inside Sales,
Marketing, Product Development
i
All Senior Leaders
Mentoring of problem solving action teams and resource allocation
All action team meetings
Action team members
i
President/CEO; VP of Operations; VP of Marketing A&D; VP of Sales
Travel to warehouses and showroom locations Quarterly, and as needed
Employees i
President/CEO; VP of Sales;VP of Marketing A&DVP of Design
Travel with Sales Reps for key customer visits Weekly and throughout the year
Employees, Customers
i
All Senior Leaders
Company news, customer surveys, welcome new employees, announce birthdays and anniversaries
Daily and throughout the year
Employees i
All Senior Leaders
Employee recognition, milestone anniversary and birthday celebrations
Throughout the year Employees i
President/CEO; VP of Stakeholder EngagementVP of Design
Supplier evaluations and feedback sessions At least quarterly, and as needed
Suppliers i
VP of Stakeholder Engagement
Community events and activities At least monthly and as needed
Employees, Community
i
All Senior Leaders Open door policy for day-to-day operations Daily Employees i
Figure 1.1-2 Senior Leaders Communication
3

deployed throughout Momentum for all its employees. Ev-eryone, including SLs, is evaluated on the behaviors that reflect Momentum’s core values, ethics, performance on individual work results, and competencies described in their job descrip-tion. These performance evaluations are conducted twice a year and entail not only performance reviews but also opportunities for growth. The goal setting session is used for career or personal development, and areas for improvement or opportuni-ties for further learning. These goals are then evaluated during the following performance evaluation period.
The President/CEO conducts the performance evaluation for all SLs. The effectiveness of the Board of Directors and perfor-mance evaluation of the President/CEO is determined based on the accomplishment of the strategic plan and financial results that are reviewed quarterly during Board of Director meetings. Compensation for SLs is derived in the same manner as is deployed throughout Momentum.
1.2b Legal and Ethical Behavior1.2b(1) Legal and Regulatory ComplianceIn a marketplace that strives for design of responsibly-built environments, Momentum takes the impact of its prod-ucts and operations seriously and handles this proactively through its supply chain process. The greatest effect Mo-mentum can have on its product impact is to reduce the envi-ronmental impact (REI) of the product’s content. Bettering the world around us is one of Momentum’s core values and drives Momentum’s vision to be the undisputed leader in sustainable textiles. Momentum is at the forefront among competitors in proactively providing the most sustainable product options (Figure 7.4-5) and continually researching new innovative sus-tainable alternatives and thus creating “industry firsts” (Figure 7.4-16). This involves developing relationships with key suppliers and partners, learning and challenging their capabil-ities, and rewarding alternative solutions with further product placement.
A key measure is moving Momentum’s product line to “Reduced Environmental Impact” (REI) by 2016 (a year earlier than originally planned). All new introductions for the Momentum Textiles product line have been REI since 2014 (see Figure 3.2-1 for product line).
Create a Focus on Action That Will Improve Organiza-tional Performance SLs most effective way to create a focus on action that improves organizational performance, achieves innovation and intelligent risk is through the IBA process detailed in Figure 1.1-3 above. Through this unique program, Momentum aligns the efforts of the entire workforce as part of C&S processes to the accomplishment of Momentum strategic objectives and incentivizes each employee to perform at his or her highest level, continue to seek innovative solutions through intelligent risk taking, and ultimately accomplish Momentum’s mission and vision.
1.2 Governance and Societal Responsibilities1.2a Organizational Governance1.2a(1) Governance SystemAll SLs report to the President/CEO who holds them accountable for their actions as well as their strategic initiatives for the strategic plan (see Organizational Chart). Figure 1.2-1 highlights Momentum’s key methods for respon-sible governance that are fully deployed and integrated into Momentum’s work systems.
Method for Responsible GovernanceSenior Leader accountability
Performance evaluations Strategic plan achievement
Fiscal accountability
Third-party auditsThird-party tax preparationCovenant and compliance reporting to lender Internal checks and balancesIndependence of external audits with Momentum
Transparency in operations
Financial results on intranet and verbally shared at all levels of organizationMeeting minutes on intranet and available to all employees Living the core value of fairness, honesty and respect Internal checks and balances
Selection of Board Members
Determined by committee of current board members and based on expertise, background and business experience
Protection of stakeholders
Internal checks and balancesAdhering to Momentum’s code of conduct
Succession Planning for Senior Leaders
Performance evaluations Coaching and mentoring talent Leadership development (1.1a(3))
Figure 1.2-1 Governance System
1.2a(2) Performance EvaluationAs a small company, Momentum’s performance evaluation for SLs is the same as the performance evaluation that is fully
4
1: Each C&S process identifies critical process measures that are in alignment with company operational measures in areas of handoffs, process, and customer satisfaction (Figure 6.1-3)
2: Each C&S process reviews critical process measures during monthly meetings (Figure 2.2-1)
3: Each C&S process identifies opportunties for improvement, learning and innovation in processes and future strategic objectives based on performance review
4: Each C&S process writes an annual application on Learning and and Innovation; Process Improve-ments; and Results for all critical process measures and strategic objectives using LeTCI Baldrige criteria
5: Thrid-party nantional Baldrige examiner reviews all 11 applications and provides a feedback report based on Baldrige Criteria with strengths and opportunties for improvement
6: Each C&S process is given an award level and free days off (bronze-1 day; silver-2 days; gold-3 days; and platinum-4 days) based on level of performance and improvements from the previous year
7: Award levels and best practices from each C&S process are shared at the annual President’s Award dinner
8: Each C&S processes’ performance and feedback report from the national Baldrige examiner provides framework for continuous improvement and inputs to Step #2 of the SSP (Figure 2.1-2)
9: Process applications are available on Threads for companywide learning
Internal Baldrige Award Process
Figure 1.1-3 •=Approach; •= Deployment; •=Learning and •= Integration

Once an employee is hired, he or she learns about ethical expec-tations during Momentum Way training. This includes code of conduct, compliance with the law in all matters; prohibition of bribery; compliance with standard accounting practices; and ethical interactions with suppliers, customers, and employ-ees. All employees sign a statement affirming their knowledge and understanding of Momentum’s policy on ethics, and Momentum provides ethics training to reinforce this policy.
All employees are obligated to report to the company any inappropriate use of company assets; violations of law or this policy; or other similar improprieties; and they are encouraged to report any concerns they have regarding any possible improp-er conduct. An anonymous email address is provided in the Momentum Way. If an unethical behavior is reported, a pro-gressive disciplinary process starts with a verbal warning and then a series of more consequences that can lead to termination. Momentum measures the number of unethical occurrences reported (Figure 7.4-7).
In addition Momentum only selects suppliers who comply with requirements as stated in the vendor binder agreement indicating that the supplier complies with all laws and regulations in the countries in which they operate and provides safe working con-ditions for their employees. These requirements are confirmed through SL supplier visits throughout the year.
1.2c Societal Responsibilities1.2c(1) Societal Well-BeingAs described in 1.2b(1), Momentum takes seriously the environ-mental impact of its products and operations. With a vision to be the undisputed leader in innovative and sustainable contract textiles, Momentum’s sustainability strategies are developed during the SPP (Figure 2.1-1) and are integrated under the Vision Category of Focus and People/Culture Category, which includes how Momentum lives its core value of Bettering the world around us. Strategic objectives then follow the subsequent steps of the SPP.
In addition, by managing the selection process of material and supplier for production process, Momentum is the industry leader in developing sustainable alternatives in materials such as Silica, Naked Nylon, and recycled wool. It is also taking the lead in converting all products to REI, ensuring that all products are GREENGUARD certified for indoor air quality (Figure 7.4-4) and participating with the new ACT environmental standards.
Every year, Momentum has continuously increased its sustainability in daily operations:■ 2010: Momentum offsets its carbon footprint by planting trees
through the Conservation Fund (Figure 7.4-10),■ 2010: Installed solar panels in the corporate office to become
a net energy producer for that location (Figure 7.4-10).■ 2012: Developed a memo sample take back program (2Clicks
on Momentum’s website) for customers to return memo samples at no charge in order to reduce waste (Figure 7.4-9)
■ 2013: Implemented a Sales Rep green car policy to transition all Sales Reps to high gas mileage vehicles (Figure 7.4-10)
REI products contain one or more of the following attributes:■ Recycled content■ Rapidly renewable content■ PVC free■ GREENGUARD certified
As a means of proactively exceeding regulatory standards for indoor environments, Momentum’s portfolio of fabrics has been designated GREENGUARD Indoor Air Quality® as of January 2010. GREENGUARD certified products have low individual VOC levels, formaldehyde, respirable particles, ozone, and other pollutants. Certified products do not emit harmful levels of indoor air contaminants.
Figure 1.2-2 summarizes Momentum’s key processes, measures, and goals for surpassing regulatory requirements.
Key Process Measures Goal ResultDevelop-ment of sustainable products
% of Momentum Textiles new product introductions that are REI
100% 7.4-5
% of Momentum Textiles that is REI 100% by 2016 7.4-4% of all product that is GREENGUARD Certified
100% by end of 2015
7.4-4
Product performance
% of products that meet industry ACT standards for contract market
100% for all product categories
7.4-6
Figure 1.2-2 Regulatory
Momentum also continuously learns and acts proactively through its participation on the Board of Directors for the Associ-ation of Contract Textiles (ACT). Just as Momentum participated in the development and implementation of the ACT Performance Guidelines and ACT symbols that provide consistency in testing and labeling of product specifications to the industry, Momentum is now involved in the ACT committees that have established the sustainable standard for contract textiles. This will enable the industry to accurately compare products with respect to their environmental attributes; it is currently in the process of being introduced to the industry.
1.2b(2) Ethical BehaviorSLs have identified a systematic process to ensure Momentum is an ethical organization, beginning with the identification of the first value of fairness, honesty, and respect in all interactions. To support this value, SLs have developed several processes including: ■ Ethics as a basis for recruiting ■ Momentum Way employee handbook ■ Third-party auditors hired by the VP of Finance ■ Anonymous email hotline for employees ■ Personal participation on the internal Fraud and Risk
Assessment team ■ Ethical practices required of suppliers
To support these actions, Momentum screens potential employ-ees based on ethical behaviors. As described in section 5.2.a(4), ethics is a key behavioral competency that is used during inter-viewing, performance evaluation, and recognition. This ensures that the values of Momentum’s workforce are in close alignment with Momentum’s core values and code of conduct policy.
5

CATEGORY TWO: STRATEGY
2.1 Strategy Development2.1a Strategy Development Process2.1a(1) Strategic Planning ProcessMomentum has a systematic process for strategic planning. It is a balanced approach that involves objectives, action plans, measures, and goals for its Five Categories of Focus: Vision; Customer; People/Culture; Operations; and Financial. Long-term planning is based on three to five years and short-term planning is based on one to two years; both are based on a seven-step process:
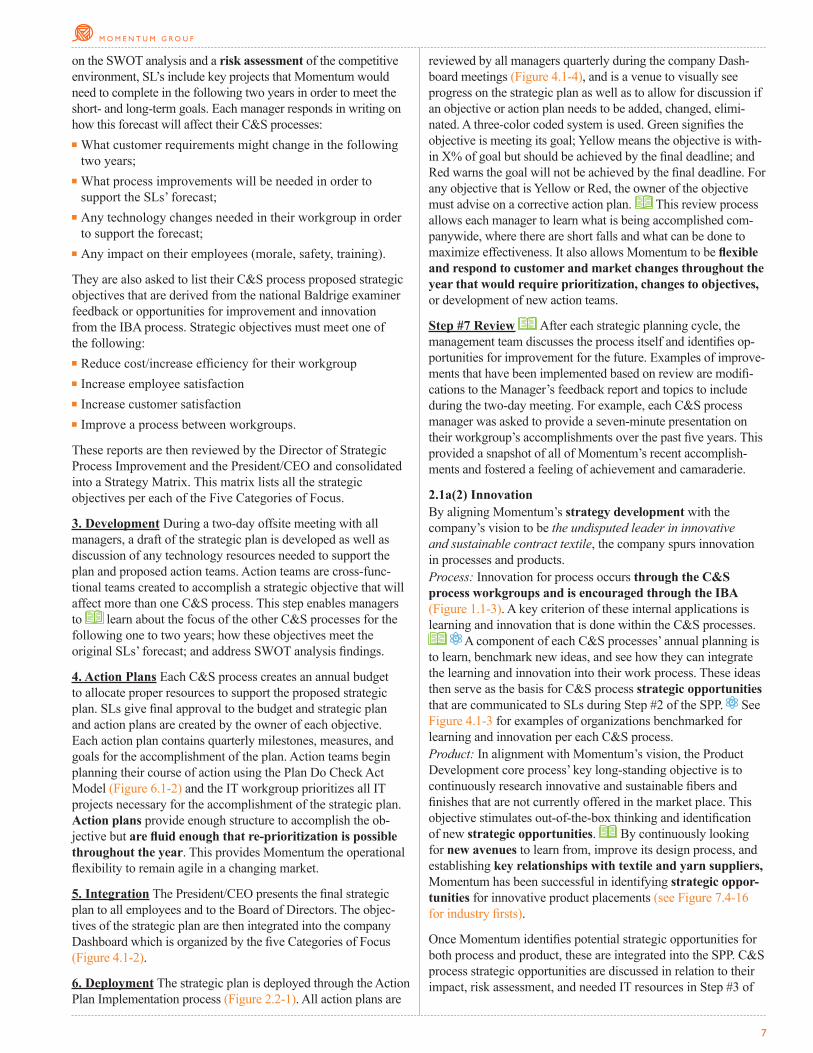
Step #1Inputs
Step #2Analysis
Step #7Review
Step #3Development
Step #6Deployment
Step #4Action Plans
Step #5Integration
STEP 1 OF Q
PIS
Year-round September
October
Nov. - Dec.January
Febr
uary
Octo
ber
STEP 2 OF QPIS
STEP
3, 4
& 5
OF
QPI
S
Figure 2.1-1 Strategic Planning Process. •=Approach; •= Deployment; •=Learning and •= Integration
1. Inputs SLs receive both internal and external inputs that are developed into an annual SWOT analysis (Figure 2.1-2).
Figure 2.1-2 Momentum’s strategic planning process incor-porates data and analyses from all facets of the business and competitive landscape.
2. Analysis SLs provide the managers with a two-year planning forecast that includes Momentum’s competitive environment, esti-mated industry growth, and a forecast for company growth. Based
6
■ 2014: Increases an incentive to all employees towards the purchase of high gas mileage vehicle.
■ 2015: Converted all Momentum Textiles products to REI (Figure 7.4-5)
1.2c(2) Community SupportMomentum’s SLs are heavily involved in integrating Momentum’s community involvement efforts, allocating resources and mentoring Community Involvement Action team (CIA). The CIA team organizes employee events for the benefit of local communities. Momentum’s key communities are found anywhere an employee resides. Every employee is encouraged to support their local communities and volunteer a minimum four hours per year that is reviewed as company key performance measure every quarter. Momentum employees have donated on average 1000 volunteer hours per year for the past 5 years (Figure 7.4-11). Momentum also donates to causes that support the industry and solicits its customers to help maximize donations such as Common Thread for the Cure by donating a percentage of profits from Silica and customer surveys where Momentum donates $1 for every customer sur-vey completed. Momentum also makes fabric donations to non profit organizations that redistribute goods to other non profits (Figure 7.4-12).
SWOT Analysis
Company Dashboard (Figure 4.1-2)Sales by customer, market and productCompany Performance vs BIFMALong and short term goals
Company Performance
Employee SurveysCustomer SurveysVoice of the customer (Figure 3.1-1)Supplier evaluations and visits
Stakeholder Inputs
Industry eventsCompetitive forcesACT and BIFMA associations
Industry/Competitors
reviewed by all managers quarterly during the company Dash-board meetings (Figure 4.1-4), and is a venue to visually see progress on the strategic plan as well as to allow for discussion if an objective or action plan needs to be added, changed, elimi-nated. A three-color coded system is used. Green signifies the objective is meeting its goal; Yellow means the objective is with-in X% of goal but should be achieved by the final deadline; and Red warns the goal will not be achieved by the final deadline. For any objective that is Yellow or Red, the owner of the objective must advise on a corrective action plan. This review process allows each manager to learn what is being accomplished com-panywide, where there are short falls and what can be done to maximize effectiveness. It also allows Momentum to be flexible and respond to customer and market changes throughout the year that would require prioritization, changes to objectives, or development of new action teams.
Step #7 Review After each strategic planning cycle, the management team discusses the process itself and identifies op-portunities for improvement for the future. Examples of improve-ments that have been implemented based on review are modifi-cations to the Manager’s feedback report and topics to include during the two-day meeting. For example, each C&S process manager was asked to provide a seven-minute presentation on their workgroup’s accomplishments over the past five years. This provided a snapshot of all of Momentum’s recent accomplish-ments and fostered a feeling of achievement and camaraderie.
2.1a(2) InnovationBy aligning Momentum’s strategy development with the company’s vision to be the undisputed leader in innovative and sustainable contract textile, the company spurs innovation in processes and products.Process: Innovation for process occurs through the C&S process workgroups and is encouraged through the IBA (Figure 1.1-3). A key criterion of these internal applications is learning and innovation that is done within the C&S processes.
A component of each C&S processes’ annual planning is to learn, benchmark new ideas, and see how they can integrate the learning and innovation into their work process. These ideas then serve as the basis for C&S process strategic opportunities that are communicated to SLs during Step #2 of the SPP. See Figure 4.1-3 for examples of organizations benchmarked for learning and innovation per each C&S process.Product: In alignment with Momentum’s vision, the Product Development core process’ key long-standing objective is to continuously research innovative and sustainable fibers and finishes that are not currently offered in the market place. This objective stimulates out-of-the-box thinking and identification of new strategic opportunities. By continuously looking for new avenues to learn from, improve its design process, and establishing key relationships with textile and yarn suppliers, Momentum has been successful in identifying strategic oppor-tunities for innovative product placements (see Figure 7.4-16 for industry firsts).
Once Momentum identifies potential strategic opportunities for both process and product, these are integrated into the SPP. C&S process strategic opportunities are discussed in relation to their impact, risk assessment, and needed IT resources in Step #3 of
on the SWOT analysis and a risk assessment of the competitive environment, SL’s include key projects that Momentum would need to complete in the following two years in order to meet the short- and long-term goals. Each manager responds in writing on how this forecast will affect their C&S processes:■ What customer requirements might change in the following
two years;■ What process improvements will be needed in order to
support the SLs’ forecast;■ Any technology changes needed in their workgroup in order
to support the forecast;■ Any impact on their employees (morale, safety, training).
They are also asked to list their C&S process proposed strategic objectives that are derived from the national Baldrige examiner feedback or opportunities for improvement and innovation from the IBA process. Strategic objectives must meet one of the following:■ Reduce cost/increase efficiency for their workgroup■ Increase employee satisfaction■ Increase customer satisfaction■ Improve a process between workgroups.
These reports are then reviewed by the Director of Strategic Process Improvement and the President/CEO and consolidated into a Strategy Matrix. This matrix lists all the strategic objectives per each of the Five Categories of Focus.
3. Development During a two-day offsite meeting with all managers, a draft of the strategic plan is developed as well as discussion of any technology resources needed to support the plan and proposed action teams. Action teams are cross-func-tional teams created to accomplish a strategic objective that will affect more than one C&S process. This step enables managers to learn about the focus of the other C&S processes for the following one to two years; how these objectives meet the original SLs’ forecast; and address SWOT analysis findings.
4. Action Plans Each C&S process creates an annual budget to allocate proper resources to support the proposed strategic plan. SLs give final approval to the budget and strategic plan and action plans are created by the owner of each objective. Each action plan contains quarterly milestones, measures, and goals for the accomplishment of the plan. Action teams begin planning their course of action using the Plan Do Check Act Model (Figure 6.1-2) and the IT workgroup prioritizes all IT projects necessary for the accomplishment of the strategic plan. Action plans provide enough structure to accomplish the ob-jective but are fluid enough that re-prioritization is possible throughout the year. This provides Momentum the operational flexibility to remain agile in a changing market.
5. Integration The President/CEO presents the final strategic plan to all employees and to the Board of Directors. The objec-tives of the strategic plan are then integrated into the company Dashboard which is organized by the five Categories of Focus (Figure 4.1-2).
6. Deployment The strategic plan is deployed through the Action Plan Implementation process (Figure 2.2-1). All action plans are
7

MarketingHuman Resources
Information TechnologyAccounting
Credit
1. ProductDevelopment
2. SampleManagement
3. InventoryManagement
4. Sales5. Inside Sales
6. OrderFilling
C&S processes are distributed among multiple strategic locations that enable Momentum to accomplish its work. Corporate Office: Seven of the 11 C&S processes work out of the corporate office in Irvine, California which facilitates daily discussions and quick decision making.Warehouse Locations: The Product Development core process is located at Momentum’s largest warehouse facility in Archdale, North Carolina, for proximity to product as well as to key textile suppliers. This location works to strengthen supplier relation-ships, increase access to the latest technology and innovative materials, and facilitate a speedy product development process. This organization of workforce supports and strengthens Momentum’s core competency of an innovative Product Development team. Showroom Locations: Momentum’s four showrooms are located in the Irvine corporate office, Chicago, New York, and Dallas. Remotes: The vast majority of remotes are Sales Reps and Inside Sales agents placed in sales territories across the country. This strong sales presence and proximity to key customers (along with knowledge management technologies described in section 4.2a(1)) serve to strengthen Momentum’s core competency of a sophisticated selling process.
The key work system not conducted by Momentum is textile manufacturing. The manufacturing is not a core competency of Momentum’s and is accomplished through outsourcing to its textile mills. Mills are Momentum’s largest supplier relation-ship and are managed through the supply chain management process described in 6.2b. Through this process, suppliers and design collaborators are selected based on their complement to Momentum’s core competencies and their ability to meet Momentum’s requirements as stated in a vendor requirements binder and contract. A list of Preferred Suppliers generated by the Product Development and Inventory Management core processes provides awareness of the level of service a supplier is providing before Momentum grants a new product placement. Therefore, Momentum is continuously evaluating suppliers’ core competencies in design and performance before a supplier is selected for new product placements (see 6.2b).
Future core competencies and work systems are deter-mined by continuous improvement and learning throughout the organization.
the SPP and, if accepted, become C&S process strategic objec-tives. Product strategic opportunities are discussed during the Product Planning meetings between the Product Development core process and the President (Figure 4.1-4) and also become strategic objectives through Step #3 of the SPP. Risk assessment for product development is incorporated into the Product Design process detailed in Figure 6.1-1 so that at crucial decision points, the Product Development core process makes the decision wheth-er a product is worth pursuing or not.
Momentum’s key strategic opportunities are detailed in Figure 2.1-4 under Category of Focus-Vision.
2.1a(3) Strategy ConsiderationsIn Step #1 of the SPP (Figure 2.1-1), Momentum collects relevant data through the inputs listed in Figure 2.1-2 to drive analysis during subsequent SPP steps. During Step #1 of SPP, Momentum conducts a SWOT analysis of the relevant inputs to identify Strategic Advantages (SAs) and Strategic Challenges (SCs), Strategic Opportunities, and risks to sustainability.
Potential changes in the regulatory environment are deter-mined through participation as board members of BIFMA and ACT, two of the largest industry associations. The SWOT anal-ysis then becomes the foundation of the SLs’ forecast and key projects detailed in Step #2 of the SPP. In Step #3 of the SPP, the management team holds a strategic offsite planning meeting to establish goals, objectives, and initial action plans. The evalu-ation of the ability to execute the strategic plan is embedded in Step #6 of the SPP and is continuously evaluated based on the color-coded system described in 2.1a(1).
Potential missed information and blind spots to the SPP are identified through outside parties as follows: 1) the Board of Directors’ quarterly review of the plan 2) the national Mal-colm Baldrige examiner who annually assesses and provides feedback on progress of each workgroup’s strategic objectives; 3) Most recently, the California for Performance Excellenceexaminer team in 2015. These are addressed in the quarterlyDashboard meetings during strategic plan review.
2.1a(4) Work Systems and Core CompetenciesMomentum’s key work systems are comprised of 11 C&S pro-cesses and their strategic locations around the country. Momen-tum’s six core processes need to be performing at world class levels in order for Momentum to be a world class organization. These six core processes are supported by five support process-es. Decisions for C&S processes are made in the context of the current strategic plan and all action plans that derive from these decisions are executed as described in Steps #4-6 of the SPP.
8
•= Core Processes •= Support ProcessesFigure 2.1-3 C& S Process

Cat
egor
y of
Foc
us
Lon
g Te
rm
Stra
tegi
c O
bjec
tives
Shor
t Ter
m
Stra
tegi
c O
bjec
tives
Add
ress
es S
C
or S
tren
gthe
ns/
Leve
rage
s SA
Stre
ngth
ens
or L
ever
ages
C
ore
Com
pete
ncy
Act
ion
Plan
sM
easu
res (
all r
esul
ts li
sted
in 7
.4-1
5)Pe
rfor
man
ce
Proj
ectio
nsC
ompa
rativ
e D
ata
Visio
n
Cus
tom
er
Peop
le/
Cul
ture
Ope
ra-
tions
Fina
ncia
l
Figu
re 2
.1-4
9

updated at the company Dashboard meeting and monthly at the Product Development core process meeting. Successful com-pletion of the action plan is evaluated annually through the IBA process and the individual employee designer performance eval-uations. Suppliers are evaluated through the supplier evaluation process detailed in 6.2b.
Strategic Plan Implementation & Organizational Performance Review
Reviewed quarterly at company Dashboard meetings
Reviewed monthly atC&S Processmeetings and annually through IBA
Reviewedsemi-annually during Performance Evaluations
Act
ion
Pla
n Im
plem
enta
tion
Measuring and Monitoring Step #3 of QPIS
Strategic Plan
Strategic Objectives
5 Categories of Focus• Vision• Customer• People/Culture• Operations• Financial
Action Team Formation
C&S Processes
Workgroup Strategic Objectives
Critical ProcessMeasures
Dashboard
Action Plans
Operational PerformanceMeasures
Action TeamUpdates
Employee
• PerformanceGoals
• Learning Plans
Work Results
Per
form
ance
Rev
iew
Figure 2.2-1
2.2a(3) Resource AllocationDuring Step #4 of the SPP, annual budgets are created by each C&S process and are approved by SLs in parallel to the proposed action plans to ensure financial support for the achievement of the action plans in relation to current obligations. Through this budgeting process, financial resources are allocated to each C&S process for the accomplishments of the action plans. During Step #3 & #4 of the SPP, action teams and IT resources are also allocated to appropriate action plans that involve more than one C&S process and/or require significant programming. All action teams and IT projects are prioritized with SLs and are reviewed during company Dashboard meetings and IT Project Review meetings (Figure 4.1-4). Each quarter during the company Dashboard meetings, the management team reviews all action plans, action teams, IT project prioritization and financial results to ensure adequate resources are distributed to accomplish the strategic plan , manage risks associated with each action plan and ensure financial viability.
2.2a(4) Workforce PlansMomentum integrates key workforce plans into the strategic objectives and short- and long-term action plans, as shown in (Figure 2.1-4). Workforce action plans are developed as a part of Step #4 of the SPP, and they reflect any potential chang-es to workforce capability and capacity as identified in Step# 2 of the SPP.
As a further measure, in Momentum’s corporate Dashboard, People/Culture is one of the Five Categories of Focus. Employee excellence is measured via employee satisfaction, engagement,
Through inputs into the SPP (Figure 2.1-2), as well as Momentum’s integrated IBA that challenges each employee to improve his/her process, new opportunities and core competen-cies are developed. For example, an emerging core competency for Momentum is sustainability in products and operations. This has resulted from aligning strategy development to accomplish the company vision through C&S processes.
2.1b Strategic Objectives2.1b(1) Key Strategic ObjectivesMomentum’s key strategic objectives are developed for the Five Categories of Focus: Vision; Customer; People/Culture; Operations; and Financial. See Figure 2.1-4 for Momentum’s key strategic objectives, goals, and timetable for achieving them, and Figure 2.1-5 for key changes per business area.
Area Key ChangesProductCustomers/ MarketsSuppliersPartnersOperations
Figure 2.1-5 Key Changes Per Business
2.1b(2) Strategic Objectives ConsiderationsBy developing strategic objectives for the Five Categories of Focus, (Vision, Customer, People/Culture, Operations, and Finan-cial); Momentum is able to strike a balance between different organizational needs and stakeholders. Each key element of Momentum’s business and all stakeholders are represented in at least one category (customers in Customer and Vision; employees and community in People/Culture; suppliers in Operations and shareholders in Financial) and progress is monitored for both short and long-term goals. Momentum’s strategic challenges are addressed as described in P.2-2 and Figure 2.1-4.
2.2 Strategy Implementation2.2a Action Plan Development and Deployment2.2a(1) Action PlansMomentum’s action plans for its strategic objectives are detailed in Figure 2.1-4. Action plans are developed during Step #3 and Step #4 of the SPP (Figure 2.1-1) and integrated into the Momentum’s Five Categories of Focus on the company Dashboard in Step #5.
2.2a(2) Action Plan ImplementationAction plan implementation and deployment to the work-force is demonstrated in Figure 2.2-1 and is conducted through the cascade of companywide objectives and operational per-formance measures to the C&S processes’ strategic objectives and critical process measures to the individual employee’s performance goals, learning plans and work results. Through Momentum’s organizational review process described in section 4.1b, strategic plan action plans are reviewed at each level of performance to ensure sustainability and corrective action when appropriate.
Action plan implementation and deployment to key suppliers and collaborators is conducted through the Product Develop-ment core process. Progress and success of this action plan is
10
also recyclable (for all three markets and both A&D and CFM)■ 5Clicks: the only website search in the industry to provide
fabric selections that are pre-approved by the CFM, by price point and inventory levels in 5 quick steps (available for all but primarily useful for Office market A&D)
■ Search by Cleaner: only website search in the industry to provide fabrics selections approved by cleaner (available to all but primarily useful for Healthcare market A&D and CFM).
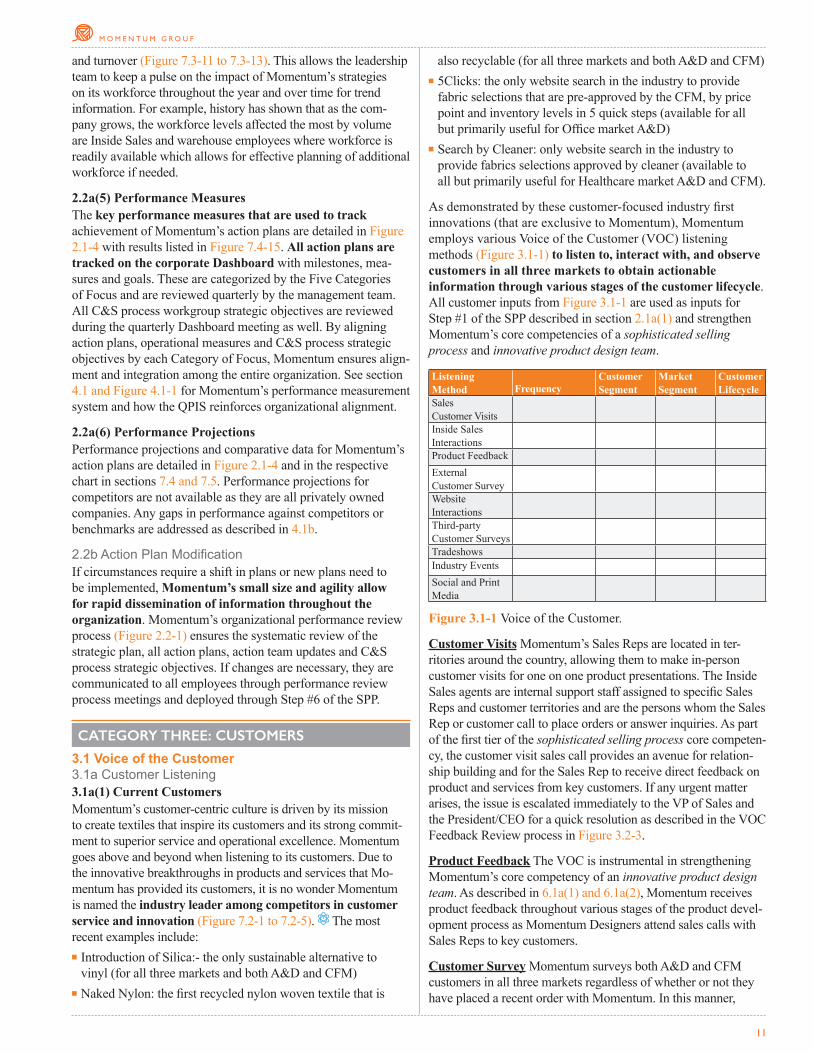
As demonstrated by these customer-focused industry first innovations (that are exclusive to Momentum), Momentum employs various Voice of the Customer (VOC) listening methods (Figure 3.1-1) to listen to, interact with, and observe customers in all three markets to obtain actionable information through various stages of the customer lifecycle. All customer inputs from Figure 3.1-1 are used as inputs for Step #1 of the SPP described in section 2.1a(1) and strengthen Momentum’s core competencies of a sophisticated selling process and innovative product design team.
Listening Method Frequency
Customer Segment
Market Segment
Customer Lifecycle
Sales Customer VisitsInside Sales InteractionsProduct FeedbackExternal Customer SurveyWebsite InteractionsThird-party Customer SurveysTradeshowsIndustry EventsSocial and Print Media
Figure 3.1-1 Voice of the Customer.
Customer Visits Momentum’s Sales Reps are located in ter-ritories around the country, allowing them to make in-person customer visits for one on one product presentations. The Inside Sales agents are internal support staff assigned to specific Sales Reps and customer territories and are the persons whom the Sales Rep or customer call to place orders or answer inquiries. As part of the first tier of the sophisticated selling process core competen-cy, the customer visit sales call provides an avenue for relation-ship building and for the Sales Rep to receive direct feedback on product and services from key customers. If any urgent matter arises, the issue is escalated immediately to the VP of Sales and the President/CEO for a quick resolution as described in the VOC Feedback Review process in Figure 3.2-3.
Product Feedback The VOC is instrumental in strengthening Momentum’s core competency of an innovative product design team. As described in 6.1a(1) and 6.1a(2), Momentum receives product feedback throughout various stages of the product devel-opment process as Momentum Designers attend sales calls with Sales Reps to key customers.
Customer Survey Momentum surveys both A&D and CFM customers in all three markets regardless of whether or not they have placed a recent order with Momentum. In this manner,
11
and turnover (Figure 7.3-11 to 7.3-13). This allows the leadership team to keep a pulse on the impact of Momentum’s strategies on its workforce throughout the year and over time for trend information. For example, history has shown that as the com-pany grows, the workforce levels affected the most by volume are Inside Sales and warehouse employees where workforce is readily available which allows for effective planning of additional workforce if needed.
2.2a(5) Performance MeasuresThe key performance measures that are used to track achievement of Momentum’s action plans are detailed in Figure 2.1-4 with results listed in Figure 7.4-15. All action plans are tracked on the corporate Dashboard with milestones, mea-sures and goals. These are categorized by the Five Categories of Focus and are reviewed quarterly by the management team. All C&S process workgroup strategic objectives are reviewed during the quarterly Dashboard meeting as well. By aligning action plans, operational measures and C&S process strategic objectives by each Category of Focus, Momentum ensures align-ment and integration among the entire organization. See section 4.1 and Figure 4.1-1 for Momentum’s performance measurement system and how the QPIS reinforces organizational alignment.
2.2a(6) Performance ProjectionsPerformance projections and comparative data for Momentum’s action plans are detailed in Figure 2.1-4 and in the respective chart in sections 7.4 and 7.5. Performance projections for competitors are not available as they are all privately owned companies. Any gaps in performance against competitors or benchmarks are addressed as described in 4.1b.
2.2b Action Plan ModificationIf circumstances require a shift in plans or new plans need to be implemented, Momentum’s small size and agility allow for rapid dissemination of information throughout the organization. Momentum’s organizational performance review process (Figure 2.2-1) ensures the systematic review of the strategic plan, all action plans, action team updates and C&S process strategic objectives. If changes are necessary, they are communicated to all employees through performance review process meetings and deployed through Step #6 of the SPP.
CATEGORY THREE: CUSTOMERS
3.1 Voice of the Customer 3.1a Customer Listening3.1a(1) Current CustomersMomentum’s customer-centric culture is driven by its mission to create textiles that inspire its customers and its strong commit-ment to superior service and operational excellence. Momentum goes above and beyond when listening to its customers. Due to the innovative breakthroughs in products and services that Mo-mentum has provided its customers, it is no wonder Momentum is named the industry leader among competitors in customer service and innovation (Figure 7.2-1 to 7.2-5). The most recent examples include: ■ Introduction of Silica:- the only sustainable alternative to
vinyl (for all three markets and both A&D and CFM)■ Naked Nylon: the first recycled nylon woven textile that is
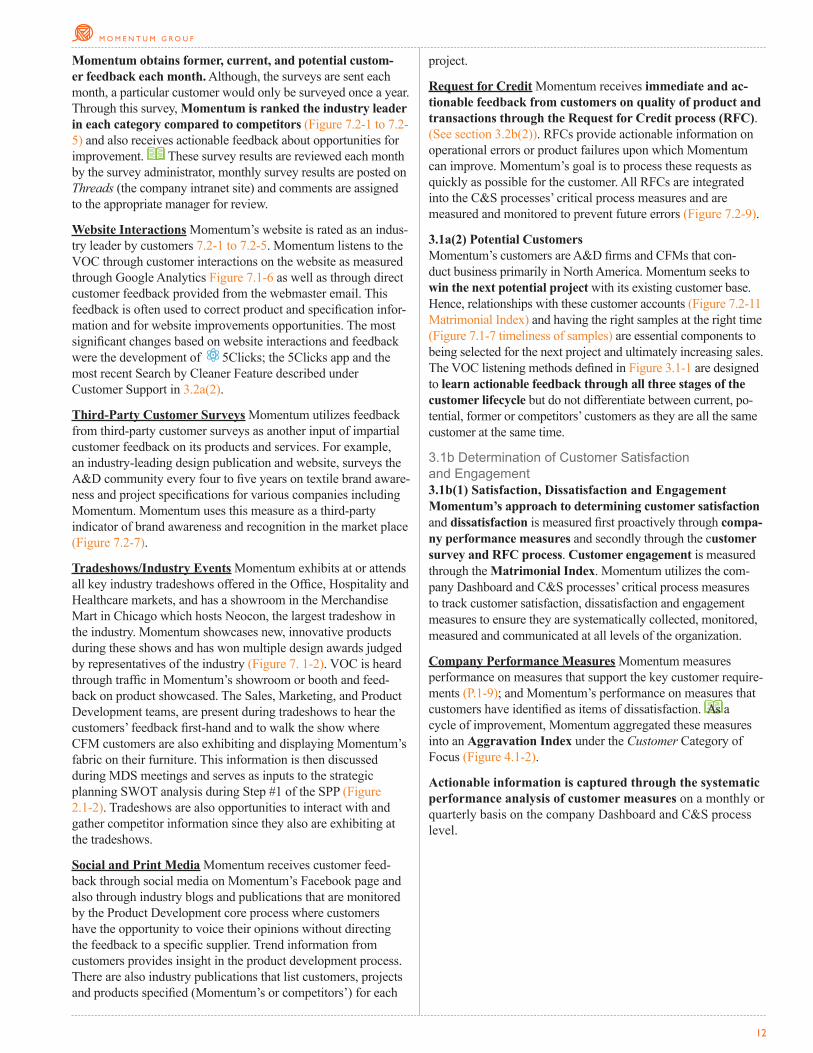
project.
Request for Credit Momentum receives immediate and ac-tionable feedback from customers on quality of product and transactions through the Request for Credit process (RFC). (See section 3.2b(2)). RFCs provide actionable information on operational errors or product failures upon which Momentum can improve. Momentum’s goal is to process these requests as quickly as possible for the customer. All RFCs are integrated into the C&S processes’ critical process measures and are measured and monitored to prevent future errors (Figure 7.2-9).
3.1a(2) Potential CustomersMomentum’s customers are A&D firms and CFMs that con-duct business primarily in North America. Momentum seeks to win the next potential project with its existing customer base. Hence, relationships with these customer accounts (Figure 7.2-11 Matrimonial Index) and having the right samples at the right time (Figure 7.1-7 timeliness of samples) are essential components to being selected for the next project and ultimately increasing sales. The VOC listening methods defined in Figure 3.1-1 are designed to learn actionable feedback through all three stages of the customer lifecycle but do not differentiate between current, po-tential, former or competitors’ customers as they are all the same customer at the same time.
3.1b Determination of Customer Satisfaction and Engagement3.1b(1) Satisfaction, Dissatisfaction and Engagement Momentum’s approach to determining customer satisfaction and dissatisfaction is measured first proactively through compa-ny performance measures and secondly through the customer survey and RFC process. Customer engagement is measured through the Matrimonial Index. Momentum utilizes the com-pany Dashboard and C&S processes’ critical process measures to track customer satisfaction, dissatisfaction and engagement measures to ensure they are systematically collected, monitored, measured and communicated at all levels of the organization.
Company Performance Measures Momentum measures performance on measures that support the key customer require-ments (P.1-9); and Momentum’s performance on measures that customers have identified as items of dissatisfaction. As a cycle of improvement, Momentum aggregated these measures into an Aggravation Index under the Customer Category of Focus (Figure 4.1-2).
Actionable information is captured through the systematic performance analysis of customer measures on a monthly or quarterly basis on the company Dashboard and C&S process level.
Momentum obtains former, current, and potential custom-er feedback each month. Although, the surveys are sent each month, a particular customer would only be surveyed once a year. Through this survey, Momentum is ranked the industry leader in each category compared to competitors (Figure 7.2-1 to 7.2-5) and also receives actionable feedback about opportunities for improvement. These survey results are reviewed each month by the survey administrator, monthly survey results are posted on Threads (the company intranet site) and comments are assigned to the appropriate manager for review.
Website Interactions Momentum’s website is rated as an indus-try leader by customers 7.2-1 to 7.2-5. Momentum listens to the VOC through customer interactions on the website as measured through Google Analytics Figure 7.1-6 as well as through direct customer feedback provided from the webmaster email. This feedback is often used to correct product and specification infor-mation and for website improvements opportunities. The most significant changes based on website interactions and feedback were the development of 5Clicks; the 5Clicks app and the most recent Search by Cleaner Feature described under Customer Support in 3.2a(2).
Third-Party Customer Surveys Momentum utilizes feedback from third-party customer surveys as another input of impartial customer feedback on its products and services. For example, an industry-leading design publication and website, surveys the A&D community every four to five years on textile brand aware-ness and project specifications for various companies including Momentum. Momentum uses this measure as a third-party indicator of brand awareness and recognition in the market place (Figure 7.2-7).
Tradeshows/Industry Events Momentum exhibits at or attends all key industry tradeshows offered in the Office, Hospitality and Healthcare markets, and has a showroom in the Merchandise Mart in Chicago which hosts Neocon, the largest tradeshow in the industry. Momentum showcases new, innovative products during these shows and has won multiple design awards judged by representatives of the industry (Figure 7. 1-2). VOC is heard through traffic in Momentum’s showroom or booth and feed-back on product showcased. The Sales, Marketing, and Product Development teams, are present during tradeshows to hear the customers’ feedback first-hand and to walk the show where CFM customers are also exhibiting and displaying Momentum’s fabric on their furniture. This information is then discussed during MDS meetings and serves as inputs to the strategic planning SWOT analysis during Step #1 of the SPP (Figure 2.1-2). Tradeshows are also opportunities to interact with and gather competitor information since they also are exhibiting at the tradeshows.
Social and Print Media Momentum receives customer feed-back through social media on Momentum’s Facebook page and also through industry blogs and publications that are monitored by the Product Development core process where customers have the opportunity to voice their opinions without directing the feedback to a specific supplier. Trend information from customers provides insight in the product development process. There are also industry publications that list customers, projects and products specified (Momentum’s or competitors’) for each
12

13
interiors of a hospital that would include patient rooms, and administrative offices. The customer’s Sales Rep would tailor their sales call presentations and show Momentum Textiles high performance textiles and coated fabrics for the patient rooms (Healthcare market), and Momentum Textiles and Textus for the administrative staff offices (Office market). And for a hotel proj-ect, LoomSource product line would be shown (Hospitality mar-ket). This provides Momentum a unique advantage in providing the customers a “one stop shop”, exceeding their expectations in tailored product offerings and thus expanding the relationship.
Momentum Textiles 87%
LoomSource 12%
Textus 1%
Market Product LineOffice and Healthcare Momentum TextilesHospitality LoomSourceHigh-end Office Textus
Figure 3.2-1 Product Lines
Identifies and Adapts Product Offering to Enter New Markets and Attract CustomersSupplier Capabilities: Momentum identifies opportunities to en-ter new markets, expand customer relationships, and attract new business by consistently evaluating supplier capabilities; and expanding into new markets only when value added is creat-ed. The VP of Design evaluates suppliers’ evolving capabilities, innovative technologies and new material availability; and seeks new suppliers for offerings not currently provided by existing suppliers (see category 6.2.b for supplier evaluation descrip-tions). The VP of Design’s systematic process of researching competitive product and supply chain avenues, ensures that Mo-mentum will enter a new market only when a new product can be introduced that improves upon what is currently available. Design Collaborations: In addition, Momentum leverages its design collaborations with design consultants in order to attract new business with customers and create opportunities to ex-pand relationships (Figure 7.1-31 collaborations per year). For example, Momentum collaborated with Sheila Hicks, a famous American fiber artist who is highly respected in the industry. Hicks chose to collaborate with Momentum due to the com-pany’s core value-driven culture, leadership in innovative and sustainable products and the Product Development team’s will-ingness to learn. The collaboration resulted in the award-winning Crossing Colors collection that received industry recognition (Figure 7.1-2) and was accepted into the Cooper Hewitt Smith-sonian Design Museum in New York City as a permanent textile collection.
3.2a(2) Customer SupportMomentum’s customers seek information and support from their Sales Reps, assigned Inside Sales agent, Momentum showroom, website and newly introduced 5Clicks app.
When a measure is not performing to goal during Dashboard meetings or monthly C&S process meetings, it follows the corrective action process described in 4.1b for performance analysis and review and 6.1b(3) for process improvements.
Customer Surveys Momentum’s customer surveys review process is described in 3.1a(1).
RFC Process Momentum’s RFC process is described in section 3.2b(2) and detailed in Figure 3.2-3 the Customer Complaint Process.
3.1b(2) Satisfaction Relative to CompetitorsMomentum obtains competitor or comparative bench-mark data for performance measures, customer satisfaction measures and engagement measures as described in category 4.1a(2) as appropriate. These are detailed in Figures 3.1-2 and 3.1-3 respectively. Due to the uniqueness of a variety of these process measures, it is difficult for Momentum to obtain competitive or comparative data.
3.2 Customer Engagement3.2a Product Offerings and Customer Support3.2a(1) Product OfferingsMomentum first determines customer and market needs and requirements for products and services through customer visits (VOC Figure 3.1-1) and the Product Design process (Figure 6.1-1). Second, Momentum adapts product offerings to meet the requirements and exceed the customer and market segments through its three product lines (Figure 3.2-1). Finally, Momentum identifies new markets to expand relationships with customers through evaluating supplier capabilities and leveraging renowned design collaborations (Figure 7.1-31).
Determines Customer and Market NeedsCustomer Visits: Through a Sales Call Frequency model de-scribed in 3.2b(1), Momentum ensures that Sales Reps, SLs and Designers are systematically meeting with the most important customers in all three market segments during their scheduled customer visits. These in-person customer interactions provide immediate feedback on how well Momentum’s current product and service offerings meet their requirements. Customer feed-back gathered is used to identify future needs of the customer and market segments and to identify opportunities for growth through current or new product categories. For example it was through customer visits that SLs understood the need for a more efficient process to specify fabric that was already approved by the CFM. This was solved by the development of 5Clicks on Momentum’s website as described in 3.2a(2).Product Design Process: SLs during the High Level Product Planning meeting and Product Lifecycle meetings (Figure 4.1-4)
study and evaluate current product offerings through a com-prehensive product lifecycle analysis.
Identifies and Adapts Product Offerings to Customer Groups and Market SegmentsThree Product Lines: Momentum leverages its three product lines (Figure 3.2-1) to target the three market segments and two customer groups. Moreover, Momentum adapts product offerings to each customer’s current project requirements. For example a large A&D firm could be working on designing the

Over 3,000 customers responded to an online survey requesting feedback on the feature with overwhelmingly positive reviews. Due to its popularity and to leverage Momentum’s unique ser-vice offering, the 5Clicks app was launched in 2014 to provide mobile access to all the same 5Clicks features. Search by Cleaner: Through customer visits, and inside sales in-teractions Momentum became aware of the industry’s inability to provide customers definitive answers to their question of whether or not a specific cleaning product could be used on a given woven or coated fabric. Although general cleaning instructions are provided, certain cleaners must be used at times in the Healthcare market. Momentum started an action team to solve this prob-lem with extensive product testing and research which resulted in the industry’s only Search by Cleaner in the market. Similar to 5Clicks, the customer is able to select a specific name brand cleaner and see which Momentum products can be cleaned with that agent. As mentioned in 3.1a(1), by listening to the custom-er, Momentum is able to provide support services unparalleled among competitors.
3.2a(3) Customer SegmentationDuring the SPP Step #1 and #2 Momentum analyzes product, customer, and market sales information as part of the strategic planning SWOT analysis and through participation on the boards of industry associations such as BIFMA and ACT to identify and validate current customer groups, and market segments.
Momentum customer segmentation is not only used at the strategic planning level but is also used as the basis for analysis for both company operational performance measures as well as critical process measures for the Sales core process.
3.2b Customer Relationships3.2b(1) Relationship ManagementStrengthen Customers’ Relationships and Build Market Share Momentum manages its customer relationships pri-marily through a Sales Call Frequency Model (SCFM) which is a systematic process for determining how often a Sales Rep should be visiting which customers. Through the SCFM, Momentum is guaranteed to visit the most important custom-ers and ensure that Sales Reps are dedicating the appropriate amount of time with customers who will have the greatest impact on business growth and market share. The SCFM system has gone through various cycles of refinement. When Momentum first began calling on customers in the 1990’s, the company formed an action team to gather customer data on how frequently the customer wanted to be called upon and compared this to the customers’ sales potential to determine the best number of visits per week for sales effectiveness. This number continues to be validated today as part of the Sales Reps’ customer visit, requiring them to ask the customer if they are seeing Momentum’s product enough when compared to competitors.
Retain Customers, Meet their Requirements and Exceed Expectations As described in 3.1a(1) Momentum utilizes VOC listening methods detailed in Figure 3.1-1 to learn of its customers’ changing requirements which has led to ground breaking product and service innovations that exceed customers’ expectations and increase sales. In addition, Momentum leverages its customer focused information
Customer requirements for customer support are identified primarily through VOC listening methods of customer visits and Inside Sales interactions described in 3.1a(1). Momentum deploys these requirements through the affected C&S processes as they measure and track customer support methods in their critical process measures that are reviewed during their monthly C&S process meetings (Figure 4.1-4).
Means of Customer Support
Customer Segment
Market Segment
Communication Mechanisms
C&S Process Involved
Customer Visits by Sales Rep
A&D; CFM OF; HP; HC In-person/phone/email
Sales
Inside Sales Interactions
A&D; CFM OF; HP; HC Phone/email Inside Sales
Showrooms A&D OF; HP; HC In-person/phone/email
Inside Sales
Website A&D; CFM OF; HP; HC Internet Marketing/IT5Clicks App A&D OF Internet Sales/Marketing/IT
Figure Figure 3.2-2 Customer Support
Sales Reps and Inside Sales Agents Sales Reps and Inside Sales agents are the primary contacts for customer support and information. Sales Reps are located in geographic proximity to customers for one-on-one sales calls and because all Sales Reps sell all three product lines, customers in any of the three market segments are serviced by the same Sales Rep in the region.
Showrooms Through VOC inputs (3.1-1) into Step #1 of the SPP, Momentum anticipated the advantage of having physical showrooms in large cities throughout the country and being more accessible to top A&D customers. A strategic objective was deployed through SPP and Momentum now has showrooms in Irvine, Chicago, New York, and Dallas which opened in 2015. These showrooms are used primarily by local A&D customers who like to have in-person access to Momentum’s product line without having to wait for a mailed sample.
Website/5Clicks App Momentum’s industry leading website (Figure 7.2-1-7.2-5) supports both A&D and CRMs customers.
By listening to customer requirement through the VOC (Figure 3-1-1) and integrated these into Step #1 in the SPP (Figure 2.1-1) continual process improvements are made to product information and product searches on the website with the two most significant being 5Clicks and Search by Cleaner. 5Clicks& 5Clicks App: Through focused customer visits and competitor research Momentum identified a time-consuming customer process to select a textile that was pre-approved on the CFM chair they wanted to use, in stock and in their client’s price point. Because Momentum’s website is unique in that no other textile supplier provides real time inventory levels per SKU, Momentum was able to leverage this feature with its exten-sive CFM relationships to develop 5Clicks. 5Clicks is a website feature that gives the customer the ability to match real time inventory with CFMs’ price point and pre-approved fabrics on given furniture piece in 5 easy steps: 1) identify a CFM 2) identi-fy the CFM’s chair that will be used 3) specify the price point needed 4) specify the number of chairs that will be made 5) choose a fabric from the selection provided. Nothing comparable exists in the industry and 5Clicks has been very well received.
14
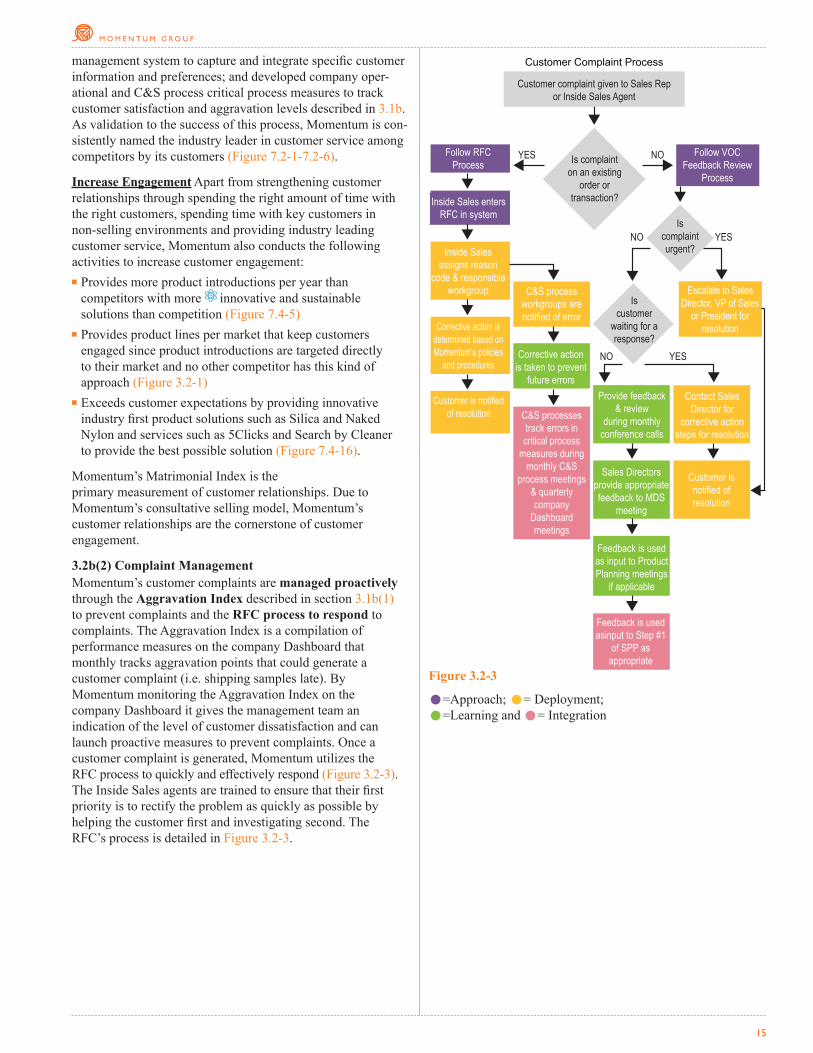
management system to capture and integrate specific customer information and preferences; and developed company oper-ational and C&S process critical process measures to track customer satisfaction and aggravation levels described in 3.1b.As validation to the success of this process, Momentum is con-sistently named the industry leader in customer service among competitors by its customers (Figure 7.2-1-7.2-6).
Increase Engagement Apart from strengthening customer relationships through spending the right amount of time with the right customers, spending time with key customers in non-selling environments and providing industry leading customer service, Momentum also conducts the following activities to increase customer engagement:■ Provides more product introductions per year than
competitors with more innovative and sustainable solutions than competition (Figure 7.4-5)
■ Provides product lines per market that keep customersengaged since product introductions are targeted directlyto their market and no other competitor has this kind ofapproach (Figure 3.2-1)
■ Exceeds customer expectations by providing innovativeindustry first product solutions such as Silica and NakedNylon and services such as 5Clicks and Search by Cleanerto provide the best possible solution (Figure 7.4-16).
Momentum’s Matrimonial Index is the primary measurement of customer relationships. Due to Momentum’s consultative selling model, Momentum’s customer relationships are the cornerstone of customer engagement.
3.2b(2) Complaint ManagementMomentum’s customer complaints are managed proactively through the Aggravation Index described in section 3.1b(1) to prevent complaints and the RFC process to respond to complaints. The Aggravation Index is a compilation of performance measures on the company Dashboard that monthly tracks aggravation points that could generate a customer complaint (i.e. shipping samples late). By Momentum monitoring the Aggravation Index on the company Dashboard it gives the management team an indication of the level of customer dissatisfaction and can launch proactive measures to prevent complaints. Once a customer complaint is generated, Momentum utilizes the RFC process to quickly and effectively respond (Figure 3.2-3). The Inside Sales agents are trained to ensure that their first priority is to rectify the problem as quickly as possible by helping the customer first and investigating second. The RFC’s process is detailed in Figure 3.2-3.
Customer Complaint Process
Is customer
waiting for a response?
Provide feedback & review
during monthly conference calls
Sales Directors provide appropriate feedback to MDS
meeting
Feedback is used as input to Product Planning meetings
if applicable
Feedback is used asinput to Step #1
of SPP as appropriate
Contact Sales Director for
corrective action steps for resolution
Customer is notified ofresolution
Escalate to Sales Director, VP of Sales
or President for resolution
Follow RFC Process
Inside Sales assigns reason
code & responsible workgroup C&S process
workgroups are notified of error
Corrective action is taken to prevent
future errors
C&S processes track errors in critical process
measures during monthly C&S
process meetings & quarterly company
Dashboard meetings
Corrective action is determined based on Momentum’s policies
and procedures
Customer is notified of resolution
Customer complaint given to Sales Rep or Inside Sales Agent
Is complaint on an existing
order or transaction?
Is complaint urgent?
YES
YES
NO
NO
YESNO
Follow VOC Feedback Review
Process
Inside Sales enters RFC in system
Figure 3.2-3
15
•=Approach; •= Deployment; •=Learning and •= Integration

CATEGORY FOUR: MEASUREMENT, ANALYSIS, AND KNOWLEDGE MANAGEMENT
4.1 Measurement, Analysis, and Improvement of Organizational PerformanceMomentum manages its performance via the Organizational Review Process (Figure 2.2-1) where all organizational performance measures, C&S processes’ critical process measures and individual work results are monitored and measured and opportunities for improvement are identified.
4.1a Performance Measurement4.1a(1) Performance MeasuresSelect Data Data is selected to support Momentum’s SPP (Figure 2.1-1); company operational measures (Figure 4.1-2) and C&S process critical process measures (Figure 6.1-4).
Collect Data Once the data is selected, the collection method and frequency are determined based on the requirements of the measuring and monitoring indicated in Step #3 of the QPIS. For example, any operational measure in the company Dashboard would be collected at least quarterly.
Align and Integrate Collected data is aligned within Momentum’s Five Categories of Focus as a measure for Vision, Customer, People/Culture, Operations, or Financial. Once alignment has occurred, measures are integrated into the QPIS and cascade from companywide operational performance measures (Figure 4.1-2) to the C&S processes critical processes (Figure 6.1-4) and to the individual work results.
For example, order accuracy is an organizational performance measure on the company Dashboard aligned under the Operations Category of Focus. This cascades down to the core process level where the Order Filling core process integrates order accuracy as a critical process measure and tracks order accuracy per shipping location. This is further cascaded to the individual level where order accuracy is measured per order filler and is discussed in performance evaluations and reviews.
Momentum utilizes the action plan implementation process described in 2.2a(2) and Figure 2.2-1 to track the process of achieving strategic objectives and action plans. The Red-Yellow-Green system described in section 2.1a(1) allows Momentum to track performance and quickly identify areas for improvement or for when modifications to action plans are needed.
Momentum’s key operational performance measures are shown in Figure 4.1-2 and key short-term and long-term measures are detailed in Figure 2.1-4.
4.1a(2) Comparative DataAs a continuous improvement focused company, Momentum challenges its C& S processes to select learning opportunities within and outside the industry. Comparative opportunities are two-fold: process comparisons and result comparisons or benchmarking.
Process By benchmarking processes, Momentum is able to make improvement within those processes. The Product Development core process benchmarked a renowned design firm and Momentum’s collaborator on its color work process, which
16
Conducted through theOrganizational Performance review process demonstrated in Figure 2.2-1 and detailed in performance review meetings in Figure 4.1-4. Most specifically: • Quarterly Dashboard meetings• Monthly C&S process meetings• Semi-annual individualperformance evaluations
• Annual national Baldrigeexaminer evaluation throughIBA process (Figure 1.1-3)Process improvements are conducted
through C&S processes or cross functional action teams as described in 6.1b(3) and Plan Do Check Act Model in Figure 6.1-2
Criteria for C&S process annual evaluation for the IBA application is benchmarking, learning and innovation as described in 2.1a(2); 4.1c; 4.2a(2); 6.1b(3) and 6.1c. Examples demonstrated in Figure P.2-1 and 4.1-3
Employees are rewarded for performance improvement and C&S process accomplishments. Employees are recognized at the individual and C&S process level as described in 5.2a(4) and Figure 5.2-1 and company level through company profit sharing Figure 7.3-9
Steps #1-4 of SPP described in 2.1a(1) where the strategic plan is developed in alignment with the Five Categories of Focus.
Step # 1Strategic Planning
Step # 2Strategic Planto Company Dashboard
Step # 3Measuring and Monitoring
Step # 4Corrective Action
Accountability
Performance Review
Recognition
Quality Process Improvement System
Step # 5ContinualImprovement
Step # 6Employee Recognition
Step #5 of SPP with integration of strategic plan with the company Dashboard and each objective and action plan is assigned an owner with measures and goals. Company operational measures cascade to the C&S processes and individual measures as described in Figure 2.2-1
Figure 4.1-1
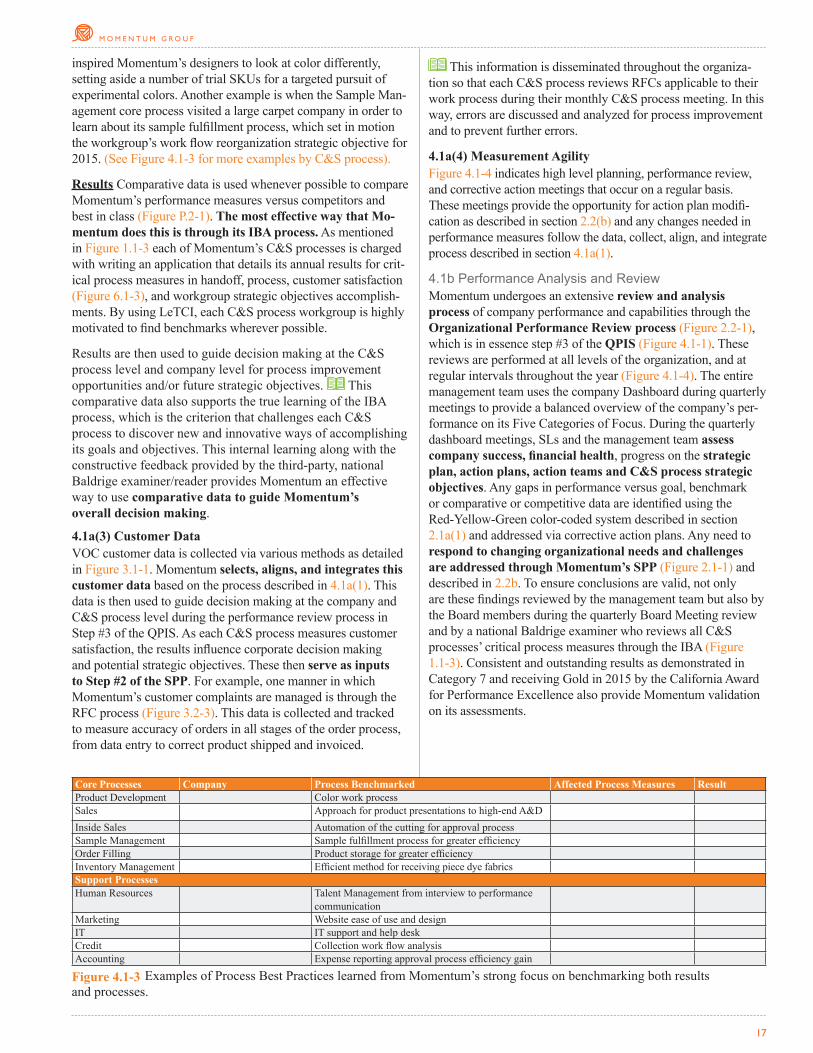
This information is disseminated throughout the organiza-tion so that each C&S process reviews RFCs applicable to their work process during their monthly C&S process meeting. In this way, errors are discussed and analyzed for process improvement and to prevent further errors.
4.1a(4) Measurement Agility Figure 4.1-4 indicates high level planning, performance review, and corrective action meetings that occur on a regular basis. These meetings provide the opportunity for action plan modifi-cation as described in section 2.2(b) and any changes needed in performance measures follow the data, collect, align, and integrate process described in section 4.1a(1).
4.1b Performance Analysis and ReviewMomentum undergoes an extensive review and analysis process of company performance and capabilities through the Organizational Performance Review process (Figure 2.2-1), which is in essence step #3 of the QPIS (Figure 4.1-1). These reviews are performed at all levels of the organization, and at regular intervals throughout the year (Figure 4.1-4). The entire management team uses the company Dashboard during quarterly meetings to provide a balanced overview of the company’s per-formance on its Five Categories of Focus. During the quarterly dashboard meetings, SLs and the management team assess company success, financial health, progress on the strategic plan, action plans, action teams and C&S process strategic objectives. Any gaps in performance versus goal, benchmark or comparative or competitive data are identified using the Red-Yellow-Green color-coded system described in section 2.1a(1) and addressed via corrective action plans. Any need to respond to changing organizational needs and challenges are addressed through Momentum’s SPP (Figure 2.1-1) and described in 2.2b. To ensure conclusions are valid, not only are these findings reviewed by the management team but also by the Board members during the quarterly Board Meeting review and by a national Baldrige examiner who reviews all C&S processes’ critical process measures through the IBA (Figure 1.1-3). Consistent and outstanding results as demonstrated in Category 7 and receiving Gold in 2015 by the California Award for Performance Excellence also provide Momentum validation on its assessments.
inspired Momentum’s designers to look at color differently, setting aside a number of trial SKUs for a targeted pursuit of experimental colors. Another example is when the Sample Man-agement core process visited a large carpet company in order to learn about its sample fulfillment process, which set in motion the workgroup’s work flow reorganization strategic objective for 2015. (See Figure 4.1-3 for more examples by C&S process).
Results Comparative data is used whenever possible to compare Momentum’s performance measures versus competitors and best in class (Figure P.2-1). The most effective way that Mo-mentum does this is through its IBA process. As mentioned in Figure 1.1-3 each of Momentum’s C&S processes is charged with writing an application that details its annual results for crit-ical process measures in handoff, process, customer satisfaction (Figure 6.1-3), and workgroup strategic objectives accomplish-ments. By using LeTCI, each C&S process workgroup is highly motivated to find benchmarks wherever possible.
Results are then used to guide decision making at the C&S process level and company level for process improvement opportunities and/or future strategic objectives. This comparative data also supports the true learning of the IBA process, which is the criterion that challenges each C&S process to discover new and innovative ways of accomplishing its goals and objectives. This internal learning along with the constructive feedback provided by the third-party, national Baldrige examiner/reader provides Momentum an effective way to use comparative data to guide Momentum’s overall decision making.
4.1a(3) Customer DataVOC customer data is collected via various methods as detailed in Figure 3.1-1. Momentum selects, aligns, and integrates this customer data based on the process described in 4.1a(1). This data is then used to guide decision making at the company and C&S process level during the performance review process in Step #3 of the QPIS. As each C&S process measures customer satisfaction, the results influence corporate decision making and potential strategic objectives. These then serve as inputs to Step #2 of the SPP. For example, one manner in which Momentum’s customer complaints are managed is through the RFC process (Figure 3.2-3). This data is collected and tracked to measure accuracy of orders in all stages of the order process, from data entry to correct product shipped and invoiced.
17
Core Processes Company Process Benchmarked Affected Process Measures ResultProduct Development Color work processSales Approach for product presentations to high-end A&DInside Sales Automation of the cutting for approval processSample Management Sample fulfillment process for greater efficiencyOrder Filling Product storage for greater efficiencyInventory Management Efficient method for receiving piece dye fabricsSupport ProcessesHuman Resources Talent Management from interview to performance
communicationMarketing Website ease of use and designIT IT support and help deskCredit Collection work flow analysisAccounting Expense reporting approval process efficiency gain
Figure 4.1-3 Examples of Process Best Practices learned from Momentum’s strong focus on benchmarking both results and processes.

most recently benchmarked the Sample core process on their picking- document and packing list process due to increased aesthetics for the external customers and internal efficiencies gained within the workgroup.
4.1c(2) Future PerformanceThrough multiple performance review meetings (Figure 4.1-4), but most importantly through the quarterly Dashboard meet-ings, Momentum receives feedback on its performance versus goals, benchmarks, competitors, and industry performance de-pending on the specific measure. Momentum evaluates and analyzes these inputs of past performance compared to project-ed industry performance and its long-term and short-term goals and updates its projections and forecasts accordingly.
4.1c(3) Continuous Improvement and InnovationMomentum’s fully deployed QPIS integrates all of Momen-tum’s operational performance measures (Figure 4.1-2) and C&S process critical measures (Figure 6.1-4) at every level of the organization. The QPIS comes alive through its ability to focus Momentum’s continuous improvement efforts through fact-based data analysis of performance and results. Each C&S process reviews its critical process measures during its monthly C&S process meetings (Figure 4.1-4) and companywide through quarterly Dashboard meetings. Opportunities for improve-ment and innovation are identified based on performance compared to goal, benchmarks, or competitor comparisons. These opportunities are then prioritized using the strategic objec-tive criteria and serve as inputs to Step#1 of the SPP as described in 2.1a(1). Any opportunity for improvement or innovation that
4.1c Performance Improvement4.1c(1) Best PracticesA distinctive characteristic of Momentum’s history and culture is to share best practices through the IBA. After winning two state level awards, Momentum adapted the spirit of competition in-ternally using the Baldrige Performance Excellence Program to develop criteria for performance evaluation. A key criterion (worth the most points) is Learning and Innovation for which C&S processes are asked to describe learning from bench-marks, research, and best practices, and how they integrated this learning into their work processes. It is also a requirement of the C&S processes to identify what results are improved due to their benchmarking efforts. This process has spurred processes to go beyond their usual industry networks to develop outside-the-box thinking with regard to their critical processes and goals. For a select list of benchmarks and best practices for Results see Figure P.2-1 and for Best Practices for Process see Figure 4.1-3.
Best practices are documented in the 11 process applica-tions that are saved on Momentum’s intranet and are available for all employees to read. But most importantly these best practices are described in detail during the annual President’s Award dinner where highlights from each of the 11 applica-tions are shared along with their award placement that identi-fies and recognizes high performing workgroups. This dinner is held annually in Irvine, California and in Archdale, NC. Remote employees are invited to attend a webinar during a First Friday meeting (Figure 4.1-4). This further promotes the spirit of learning within the workgroups and opportunities for internal benchmarking. The Order Filling core process
18
High Level Planning Meetings Attendance Frequency PurposeStrategic PlanningMDS MeetingsProduct PlanningVendor MeetingsSenior Leader MeetingsPerformance Review MeetingsDashboardResults MeetingProduct LifecycleIT Projects ReviewC&S Process MeetingsSales/Inside Sales Conference CallsFirst FridaysSafety TeamIndividual Performance EvaluationsCorrective Action Problem SolvingAction TeamsC&S Process MeetingsEmployee Engagement MeetingsLunch and LearnsPresident’s Award DinnerCommunity Involvement TeamForget Me NotsWellnessFun in the Workplace Team
Figure 4.1-4 Internal Meeting and Communication System

19
involves Momentum’s suppliers or partners is communicated to them with specific milestone measures. Depending on the significance of the opportunity, these are then tracked through the appropriate C&S processes’ monthly review meeting or company Dashboard meeting to ensure visibility, progress and alignment within the entire organization. Further supplier performance measures are described in section 6.2b.
4.2 Knowledge Management, Information, and Information Technology4.2a Organizational Knowledge4.2a(1) Knowledge ManagementThe availability and transfer of workforce and organizational knowledge are essential to strengthening Momentum’s core competencies of an innovative product design team, and a sophis-ticated selling process. Momentum’s method to collect, transfer, and manage workforce knowledge is two-fold: a systematic organizational review system and effective use of technology that enable the C&S processes to manage day-to-day operations.
1) The organizational performance review system (Figure 2.2-1)where all operational measures, critical process measures, and individual work results are tracked, reviewed, and analyzed through effective communication meetings is detailed in Figure 4.1-4.
The cascade from operational measures to critical process measures to work results provides employees visibility into current operations in addition to establishing accountability at the employee level for company performance.
2) Significant technology investments that blend and cor-relate data to build new knowledge sharing and managementwithin Momentum and with customers and suppliers areA) the integration between a proprietary Rep Dashboard withMomentum’s CRM system; B) investment in a communica-tion platform that integrates Momentum custom EnterpriseResource Planning (ERP) system, CRM, and phone system;C) real-time data available on Momentum’s website; and; D)proprietary software that enables product tracking and designdata management. These enable sales, product, and customerinformation to be updated daily, are accessible toemployees, and serve as inputs for Step #1 of the SPP described in 2.1a(1).
Through the integration of Momentum’s CRM with the Rep Dashboard, Sales Reps are provided visibility through web and smart- phones/tablets into their core process critical measures.
This powerful sales and analysis tool provides the founda-tion for learning and improvement for Momentum’s sophisti-cated selling process that is second to none in the industry, as evidenced by Figures 7.2-1 to 7.2-6.
Momentum’s industry leading website is also an important transfer of knowledge to customers, suppliers, collaborators and the community. Communication of product news, recent awards, the company’s core values, and sustainability goals just to name a few can be easily found through the user- friendly navigation tools. Sales and Inside Sales are trained to walk customers through the product library on a laptop or iPad in order to provide them with instant access to all products,
specifications, stock availability, and 5Clicks, which no other competitor can provide.
Momentum’s IT capabilities and detailed product tracking place real-time fabric and design data at Sales Reps’ fingertips, and this data is regularly utilized in sales presentations to both A&D and CFM customers.
4.2a(2) Organizational LearningAs described in 4.1c(1), Momentum is continuously looking for learning opportunities within and outside the industry.
Best practices and information gained from this learning is integrated into Momentum’s QPIS through the IBA so that other C&S processes or individuals can systematically learn from the knowledge gained. Momentum’s communication system (Figure 4.1-4) and intranet serve as a platform for knowledge sharing and learning. Learning is specifically the topic for many of Momentum’s planning and review meeting and the intranet is where employees can search for and access organizational information.
4.2b Data, Information, and Information Technology4.2b(1) Data and Information QualityMomentum ensures the quality of organizational data and information based on the following:
Accuracy and Validity Momentum employs the Single Version of Truth data management concept, with all operational data housed in a centralized database in non-redundant form. Data is entered into the database via data entry screens where Momen-tum utilizes limited choice and validation rules to ensure data is complete and correct. For numeric data there are validations via cross-checking calculations and reports to ensure accuracy.
Integrity and Reliability Momentum’s database employs so-phisticated built-in methods to assure data reliability, including a hash-file data management system. Intra-record integrity is assured by non-fragmented storage of logical documents. Momentum runs this database on two high-availability servers with real-time data replication. The database is backed up before and after nightly batch processing and biweekly for the entire server.
Momentum’s 30+virtual servers with fully redundant storage and controllers, and run on a 3-server high-availability cluster. Any single server can be lost with no impact to operations. The virtual servers are backed up via snapshot and disk-to-disk ap-pliance. All components are monitored 24x7 by infrastructure monitoring servers; administrators are alerted of hardware or software issues in real-time.
Timeliness and Currency Momentum’s high volume process-ing allows complex transactions to be updated almost instantly with appropriate locking to prevent simultaneous access. Data is updated and displayed in real-time.
4.2b(2) Data and Information SecurityConfidentiality Momentum’s data and information confidenti-ality is achieved through corporate agreements with employees and limited access to outsiders. Employee terminations follow a strict process to ensure system access is removed beforehand. Voluntary terminations trigger a review of prior data transmis-
majority of servers are virtual. Momentum has a high security Enterprise-class firewall and has never had a security breach of critical network systems (Figure 7.1-24).
Software Security and reliability of software is described in 4.2b(1). Software modifications are designed by teams that include the end users so that input is provided and ensures user-friendly systems. Momentum has tenured in-house employ-ee developers who are intimately familiar with Momentum’s database and programs. This allows modifications to programs and development of new ones quickly with minimal code errors. For software not developed in-house, Momentum utilizes a defined process to select software and vet suppliers as mentioned in 4.2b(3).
4.2b(5) Emergency AvailabilityAs noted in 4.2b(4), all critical network components are locat-ed a few miles from Momentum’s corporate office. In the event of a disaster at Momentum’s corporate office in Irvine, users outside of that office would not be affected. Momentum’s re-mote Inside Sales agents located throughout the country would continue to access customer emails and faxes. Momentum’s ERP system, website, intranet, CRM, email, and other critical systems would continue to operate.
sions and modifications. Confidentiality agreements are appropriately utilized when outsiders are granted access to Momentum’s system. The cyber security of Momentum’s information systems is reviewed annually and as its infrastructure changes and new threats become apparent.
Security Organizational data is protected in a number of ways. Internally, each user has a single network login. Momentum utilizes Active Directory to control access to data throughout the systems based on the user’s profile. Users are required to change their strong passwords regularly. Programs that display or update sensitive data have additional access control records or passwords. External security is described in 4.2.b(4).
Momentum utilizes a proactive multi-layer approach recommended by the National Information Security Group, which includes numerous best practices such as: ■ Hardened perimeter, servers, and desktops■ Single-point Enterprise-class fire-walled and content
filtered outside access■ Centralized intrusion detection
4.2b(3) Data and Information AvailabilityMomentum makes needed data and information available in a user-friendly format and timely manner to the workforce, suppliers/collaborators, and customers. All IT solutions are systematically reviewed as a critical process measure for the IT support process for any updates, modifications, or new solution options.
Workforce Momentum’s ERP system is customized, devel-oped, and refined in-house to assure systems follow the best possible workflow. The ERP system is regularly reviewed and modified to improve efficiency and systematize new processes. Specific non in-house software are evaluated prior to purchase with accessibility of data and user-friendly formats as key criteria. In addition to programs utilized in the course of business, on-demand and frequency driven reports to electronic repositories are available with one-click access. Momentum’s corporate intranet is available to all employees for company news and C&S process information as described in section 5.2a(1).
Suppliers and Partners All purchase orders to suppliers and partners are generated and transmitted electronically. Updates between design collaborators and the Product Develop-ment core process are done via Microsoft Office Project.
Customers The customer’s primary interface with Momentum’s organizational data and information is through the website. Momentum’s website is consistently rated as the industry leader compared to competitors every month (Figure 7.2-1 to 7.2-5) due to ease of use. This is a key customer requirement for both A&D and CFMs (Figure P.1-9), and therefore, Momentum continually reviews and benchmarks the customer experience to ensure continual satisfaction (Figure 7.1-6).
4.2b(4) Hardware and Software PropertiesHardware Momentum ensures that it utilizes high availability principles when designing hardware infrastructure. The vast
20
their ability to meet performance standards that are described in 6.1(b). If a performance gap exists where critical process mea-sures are not being met, and it is not due to capability, then either efficiency gains must be addressed or additional staff is needed.
5.1a(2) New Workforce MembersRecruit Momentum’s goal is to promote from within whenever possible. To do so, Momentum posts new job opportunities on the company intranet and in all office and warehouse locations. If it is not possible, then Momentum posts jobs in the local com-munity, on social media, and in industry publications. Through the recruiting process, Momentum evaluates candidates for their capability and competencies compared to the job description requirements as well as for a cultural fit with Momentum’s core values. Behavioral based competency interviewing and multiple interviews with various employees throughout the company provide Momentum with the best possible recruiting outcome. Technology has also aided Momentum in being able to secure the best talent possible.
Hire and Place Once the candidate is hired, the hiring manager schedules individualized training for the new employee based on the job description requirements and Momentum Way which covers topics such as: 1) company vision, mission, and core values; 2) QPIS; 3) customer and product; 4) company policies (including Ethics and Code of Conduct); 5) safety program; 6) recognition; and 7) benefits. As a cycle of improvementthe HR support process has instituted a survey of the hiring manager regarding the quality of the new employee (Figure7.3-3) ninety days after the hiring date. This measure is oneof the critical process measures for HR support workgroup; is reviewed during HR support process meetings (Figure 4.1-4);and used as a learning tool regarding hiring decisions to identifychanges needed for the future.
All new employees (regardless of their location) are required to attend Momentum Quality Concepts training. This is a two-day training held in the corporate office every year for 12 new employees per class. The content of the training includes:■ Momentum’s customer focused company culture■ The inner workings of Momentum’s QPIS■ Paradigms and group think versus innovative thinking■ Teambuilding, team dynamics, and decision making■ Plan Do Check Act model for process improvement and
process design (Figure 6.1-2).
Retention of New Hires As seen through Momentum’s tenure in Figure P.1-4 and turnover rate in Figure 7.3-11, Momentum has a strong retention rate of employees. This can be attributed to 1) Momentum’s ability to recruit based on competencies need-ed for the job; 2) cultural fit with Momentum’s core values; 3) clear expectations and measures regarding job performance and; 4) Momentum’s comprehensive benefits package thatincludes employee profit sharing that incentivizes successful behaviors to help Momentum succeed as a team.
5.1a(3) Work AccomplishmentMomentum’s ability to accomplish its work is managed through all six steps of the QPIS in Figure 4.1-1, action plan implementation strategy described in section 2.2a(2) and
CATEGORY FIVE: WORKFORCE
5.1 Workforce Environment5.1a Workforce Capability and Capacity5.1a(1) Capability and CapacityMomentum assesses its full-time and part-time workforce capability and capacity needs through Step #2 of the SPP Figure 2.1-1. All managers are asked to review the SLs’ forecast and its impact on their workgroup and workforce. This includes any additional staffing with a particular skill, competencies, and/or training needed in order to support the C&S processes that fuel Momentum’s core competencies and short and long-term goals. Assessment of current employees’ skills, compe-tencies and training is conducted through Momentum’s Talent Management program described in 5.2a(4).
The company measures its capacity and capability to support these Sales Reps and additional sales growth. This is done by calculating two ratios and evaluating workforce performance through the monthly C&S Process Meetings (Figure 4.1-4).
Sales Rep to Inside Sales Ratio Through experience and continuous learning, Momentum understands that a X to X ratio is the optimal capacity ratio between Sales and Inside Sales for balancing the needs of each territory with the additional labor costs (Figure 7.3-5).
Sales Rep to Non-Sales Ratio In a similar fashion, Momentum understands that the optimal capacity ratio for Sales Reps to non-sales staff is a X to X ratio. As new Sales Reps are hired, the company strives to increase efficiencies before adding additional staff in operations or administration whenever possible. Momentum has steadily kept this ratio and is reflected in the increasing sales per employee in Figure 7.3-2.
Workforce Performance Capability and capacity are integrated into Organizational Performance Reviews of the QPIS. It is through its performance review of company operational measures, C&S critical process measures, and individual performance evaluations that opportunities for improvement in capability and capacity are identified. This is demonstrated as follows:Capability: Workforce capability is measured throughout the year through:■ The employee’s ability to meet performance standards that
are required per his or her C&S critical process measures described in section 6.1(b). The frequencies of these measures vary per metric but are reviewed as frequently as daily and at least monthly during C&S process meetings.
■ Semi-annual performance evaluations that measure the employ-ees’ ability to perform the competencies that are described in the job description. Any shortcomings in performance are addressed through learning plans or corrective action plans,as described in 5.2b.
■ Periodic job description reviews where managers and the HR manager review each position to identify any changes in capabilities needed.
Capacity: Workforce capacity is measured in much the same way as capability. During Step #3 of the QPIS, C&S processes track
21
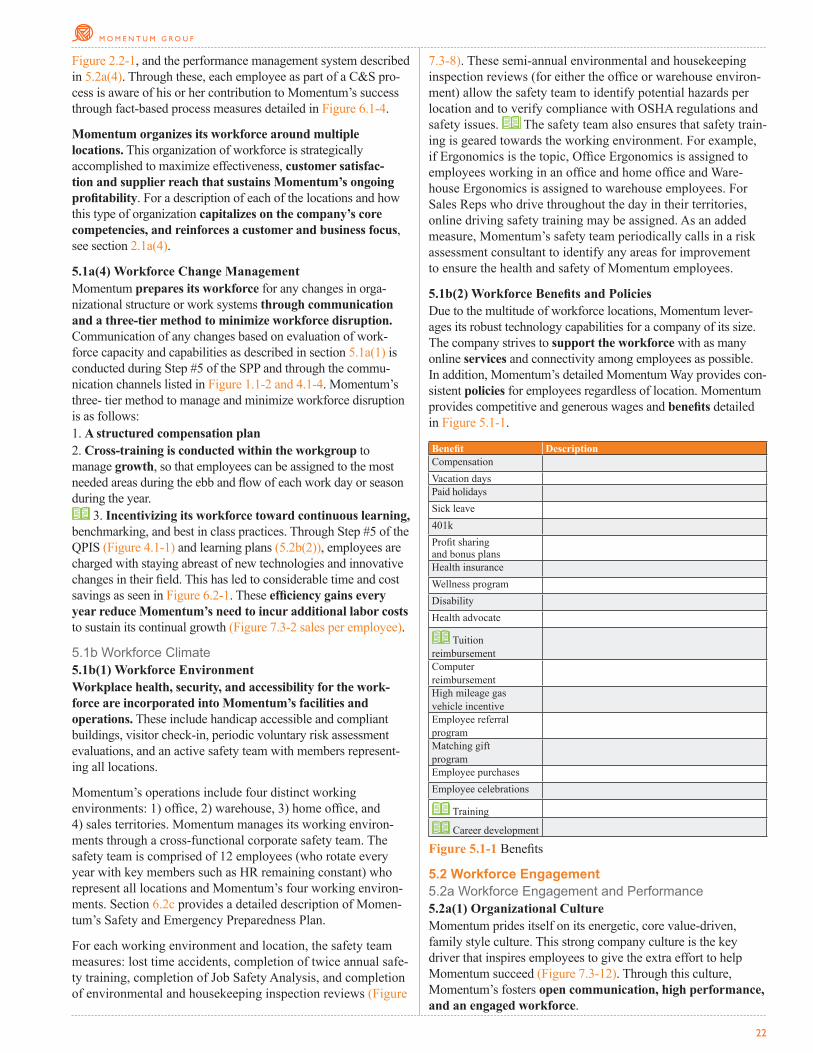
7.3-8). These semi-annual environmental and housekeeping inspection reviews (for either the office or warehouse environ-ment) allow the safety team to identify potential hazards per location and to verify compliance with OSHA regulations and safety issues. The safety team also ensures that safety train-ing is geared towards the working environment. For example, if Ergonomics is the topic, Office Ergonomics is assigned to employees working in an office and home office and Ware-house Ergonomics is assigned to warehouse employees. For Sales Reps who drive throughout the day in their territories, online driving safety training may be assigned. As an added measure, Momentum’s safety team periodically calls in a risk assessment consultant to identify any areas for improvement to ensure the health and safety of Momentum employees.
5.1b(2) Workforce Benefits and PoliciesDue to the multitude of workforce locations, Momentum lever-ages its robust technology capabilities for a company of its size. The company strives to support the workforce with as many online services and connectivity among employees as possible. In addition, Momentum’s detailed Momentum Way provides con-sistent policies for employees regardless of location. Momentum provides competitive and generous wages and benefits detailed in Figure 5.1-1.
Benefit DescriptionCompensationVacation daysPaid holidaysSick leave401kProfit sharing and bonus plansHealth insuranceWellness programDisabilityHealth advocate
Tuition reimbursementComputer reimbursementHigh mileage gas vehicle incentiveEmployee referral programMatching gift programEmployee purchasesEmployee celebrations
Training
Career development
Figure 5.1-1 Benefits
5.2 Workforce Engagement5.2a Workforce Engagement and Performance5.2a(1) Organizational CultureMomentum prides itself on its energetic, core value-driven, family style culture. This strong company culture is the key driver that inspires employees to give the extra effort to help Momentum succeed (Figure 7.3-12). Through this culture, Momentum’s fosters open communication, high performance, and an engaged workforce.
Figure 2.2-1, and the performance management system described in 5.2a(4). Through these, each employee as part of a C&S pro-cess is aware of his or her contribution to Momentum’s success through fact-based process measures detailed in Figure 6.1-4.
Momentum organizes its workforce around multiple locations. This organization of workforce is strategically accomplished to maximize effectiveness, customer satisfac-tion and supplier reach that sustains Momentum’s ongoing profitability. For a description of each of the locations and how this type of organization capitalizes on the company’s core competencies, and reinforces a customer and business focus, see section 2.1a(4).
5.1a(4) Workforce Change ManagementMomentum prepares its workforce for any changes in orga-nizational structure or work systems through communication and a three-tier method to minimize workforce disruption. Communication of any changes based on evaluation of work-force capacity and capabilities as described in section 5.1a(1) is conducted during Step #5 of the SPP and through the commu-nication channels listed in Figure 1.1-2 and 4.1-4. Momentum’s three- tier method to manage and minimize workforce disruption is as follows:1. A structured compensation plan2. Cross-training is conducted within the workgroup tomanage growth, so that employees can be assigned to the most needed areas during the ebb and flow of each work day or season during the year.
3. Incentivizing its workforce toward continuous learning,benchmarking, and best in class practices. Through Step #5 of the QPIS (Figure 4.1-1) and learning plans (5.2b(2)), employees are charged with staying abreast of new technologies and innovative changes in their field. This has led to considerable time and cost savings as seen in Figure 6.2-1. These efficiency gains every year reduce Momentum’s need to incur additional labor costs to sustain its continual growth (Figure 7.3-2 sales per employee).
5.1b Workforce Climate5.1b(1) Workforce EnvironmentWorkplace health, security, and accessibility for the work-force are incorporated into Momentum’s facilities and operations. These include handicap accessible and compliant buildings, visitor check-in, periodic voluntary risk assessment evaluations, and an active safety team with members represent-ing all locations.
Momentum’s operations include four distinct working environments: 1) office, 2) warehouse, 3) home office, and 4) sales territories. Momentum manages its working environ-ments through a cross-functional corporate safety team. Thesafety team is comprised of 12 employees (who rotate every year with key members such as HR remaining constant) whorepresent all locations and Momentum’s four working environ-ments. Section 6.2c provides a detailed description of Momen-tum’s Safety and Emergency Preparedness Plan.
For each working environment and location, the safety team measures: lost time accidents, completion of twice annual safe-ty training, completion of Job Safety Analysis, and completion of environmental and housekeeping inspection reviews (Figure
22
5.2a(2) Drivers of EngagementKey drivers of engagement and employee requirements are accomplished through engagement research conducted by rec-ognized organizations such as Best Places to Work and Modern Survey. In 2015, Momentum was named a Top Workplace by the Orange County Register, a designation that is based solely on employee engagement surveys. Survey results are presented in Figure 7.3-12 and 7.3-13. Due to Momentum’s small size and number of employees per location and workgroups, segmenta-tion is not available in order to maintain the confidentiality of the employees. In addition to employee surveys, Momentum’s HR support process also tracks exit interviews and performance evaluations for additional data that may impact engagement. All of this data combined is analyzed by HR as part of their HR support critical process measures. This information, supported by measures is analyzed during the quarterly Dashboard meetings during the People/Culture Category of Focus discussion.
5.2a(3) Assessment of EngagementFormal assessment of Momentum’s workforce engagement and satisfaction is reviewed quarterly at the company Dash-board meeting through its People/Culture Category of Focus and serve as inputs in Step #1 of the SPP (Figure 2.1-2). Measures include Engagement and Satisfaction scores from third-par-ty employee surveys (Figure 7.3-12 and 7.3-13), employee turnover (Figure 7.3-11), number of recognition touch points conducted each year, and employee exit interview results. Recognition touch-points capture moments when employees rec-ognize each other for going above and beyond their jobs and/or exhibiting one of Momentum’s core values (Figure 7.3-15). Mo-mentum studies exit interview results from employees leaving the company to gain insight into employees’ level of engagement and satisfaction with Momentum (Figure 7.3-14). Specifically for the Sales Reps, Momentum utilizes two additional engage-ment measures. A Harvard Business Review report indicates that engaged employees are linked to engaged customers at a correla-tion coefficient of .85; and engaged customers to an extent drive revenue and profits. Therefore, the Sales Rep engagement level can be assessed by monitoring customer engagement (via the Matrimonial Index, see Figure 7.2-11) and the level of territory development per Sales Rep (Figure 7.3-6).
Other informal indicators of employee engagement by location are the participation level at Momentum’s corporate fun events hosted throughout the year. Examples include Momentum’s summer picnic, Halloween event, holiday parties, participation in community involvement activities that are hosted on and off Momentum’s premises, and participation in wellness program activities and safety celebrations that are adapted to each location.
5.2a(4) Performance ManagementPerformance management of Momentum’s workforce is conducted during Step #3 of the QPIS (Figure 4.1-1) through the IBA program (Figure 1.1-3) and employees’ performance evaluations in the Talent Management program. Both these pro-grams support high performance and employee engagement as follows:Performance Management through Talent Management Momentum’s talent management program integrates company
Open Communication Momentum’s SLs set the example of open communication and transparency within the organization (1.1b(1)). Managers who are not SLs promote this same open door philosophy policy and transparent communication through semi-annual performance evaluations as well as monthly C&S process meetings, as indicated in Figure 4.1-4. With these frequent touch-point with employees (onsite and offsite), employees are informed first-hand on happenings within the company. Momentum also uses these touch-points as a learning tool to adjust communication as needed.
Another communication platform utilized to disseminate information and learn about Momentum’s culture is the company’s intranet, Threads, which is available to all employees.
High Performance Momentum promotes a culture of high performance through its IBA (Figure 1.1-3) that generates a spark of friendly competition between the 11 C&S processes. The IBA promotes a culture of continuous improvement, teamwork and high performance that rewards employees for their achievements. Award levels and free additional days off are determined based on the C& S processes’ score of Bronze (one day off for all employees in the workgroup), Silver (two days off), Gold (three days off) and Platinum (four days off). The correlation made between continuous improvements and high performance with Momentum’s profitabil-ity is reinforced during the President’s Award dinner ceremonies where Momentum’s profit sharing dollar amount is announced immediately following each C&S processes’ award level. It makes for quite an exciting night! The IBA itself is reviewed annually for opportunities for improvement to ensure that it continues to work effectively for Momentum. For example in 2014 all 11 C&S processes scored at either Gold or Platinum level by the Baldrige examiner. In order to foster continuous improvement and high performance, the level of complexity of the criteria was increased and learning and innovation became their own category with more points associated to it than in prior years (Figure 7.3-1).
Engaged Workforce Momentum’s strong core value-driven culture fosters employee involvement and development for engagement (Figure P.1-3) and rewards employees for individual, workgroup, and company successes (Step #6 of the QPIS and described in section 5.2a(4)).
A component of employee involvement is Momentum’s Opportunity Knocks (OK) program-an employee suggestion program where any employee can submit any idea for improve-ment at the individual, C&S process workgroup or company level. All ideas are entered into a drawing to win a monetary reward. For any idea that saves Momentum more than $2,500, the employee only needs to track the cost savings for one year and he or she is eligible to receive 4% of the total annual savings. These cost saving “OKs” are recognized at the annual President’s Award dinners.
Momentum’s culture where employees are family is that intangible something that motivates employees to stay with Momentum (see employee tenure in Figure P.1-4) and give the extra effort for Momentum to succeed (Figure 7.3-12). Because of this culture, Momentum is proud to be consistently named a Top Workplace and a Best Place to Work in Orange County and North Carolina.
23

that reinforce Momentum’s customer and business focus. Momentum recognizes its employees based on a tiered system that was benchmarked twenty years ago. Momentum prides itself on a highly accessible recognition program that allows any employee to nominate another for demonstration of core values including, for the highest individual award, the Presi-dent’s Individual Excellence Award. Momentum also features a team-oriented recognition program where action teams and C&S processes succeed as a team and receive rewards and profit shar-ing for succeeding together as a company. See results in Figure 5.2-1 for both individual and group recognition awards.
5.2b Workforce and Leader Development5.2b(1) and 5.2b(2) Learning and Development System and EffectivenessMomentum’s learning and development plan takes a holistic approach as it includes not only individual employees but also learning at the C&S process and company level.
Individual Learning Momentum’s learning and develop-ment system begins with new hire training on the Momentum Way and QPIS as described in 5.1a(2). Once the employee is onboard, learning and development are integrated in the perfor-mance management system described in 5.2.a(4) through talent management performance evaluations. Employees are evaluated on their ability to meet the competency level described in their job descriptions and on their work results performance measures that feed into their C or S process critical process measures that are reviewed during Step # 3 of the QPIS. Opportunities for learning and development are decided upon between the em-ployee and his/her direct supervisor for the employee’s required learning plan of at least 12 hours per year. These can be per-formed as a self-study (which includes attendance at industry events, seminars, or outside training courses), in-house class room course, webinar, or online course. See Figure 5.2-2 for a selection of topics available for individual learning plans and how each supports Momentum’s needs and personal development of the workforce.
Due to Momentum’s workforce distribution around the coun-try, online courses are the most effective method for individual learning. As a cycle of refinement, Momentum increased its online offerings in 2014 with online courses strategically selected because of its action plan approach. Each online video is only one
level behavioral competencies that all employees must exhibit (such as Momentum’s core values), with C&S process specific behavioral competencies (such as creativity for the Product Development core process) and individual behavioral competen-cies (based on the job description) into all aspects of the talent management process. This includes job descriptions, interview questions, and performance evaluations. Candidates are hired based on their ability to demonstrate the competencies and competency levels delineated in the job descriptions during the interview process and then evaluated through semi-annual per-formance evaluations on their ability to perform these behaviors on the job. This facilitates transparent, clear, and actionable feedback for opportunities for improvement, learning plan initia-tives, and goal setting. Momentum’s company-level behavioral competencies (which all employees are evaluated on) are: Core Values, Teamwork, Continuous Improvement, and Work Results; these competencies inherently have a customer and business result focus.
Momentum’s compensation program (detailed in 5.1a(4)) incorporates individual performance evaluated through the Talent Management program detailed above with Momentum’s overall performance through the profit sharing bonus structure.
Performance Management through IBA A key behavioral competency on every employee’s job description and perfor-mance evaluation is the ability to meet work results. This means the employee is able to meet C&S process performance standards on his or her critical process measures that include customer and business focus measures. C&S process critical process measures are discussed during monthly C&S process meetings (Figure 4.1-4) and evaluated annually through the IBA program (Figure 1.1-3) on their ability to: 1) demonstrate intelligent risk taking to achieve innovation, 2) meet or surpass process and customer satisfaction measures, 3) implement cost savings and efficiency process improvements to their processes, and 4) accomplish their strategic objectives. This integrated system ensures that each employee knows the importance of his/her job and how it is reflected in their C or S process critical measures and company operational measures. Recognition: Momentum’s recognition program is Step #6 of the QPIS (Figure 4.1-1) and rewards employees who demonstrate Momentum’s core values and exceptional work performance
24
Recognition Who Gives to Whom DescriptionIndividualsYARD: You Are Really Deserving
Any employee to another
You Measure Up HR to YARD winnerA Cut Above Manager awards employee for significant contributionYou’re on a Roll Manager awards employee for significant salesService Awards President and Manager present to employee for years
of serviceOpportunity Knocks Cost Savings Idea
Cost savings idea generated by employee and presented at the President’s Award dinner
President’s Award Individual Excellence
Any employee can nominate any other employee and award is presented at President’s Award dinner by the President
Group RecognitionAction Team Recognition
Team Leader recognizes its members at the President’s Award dinner
Internal Baldrige Award
Award level achieved by C&S process and presented at the President’s Award
Figure 5.2-1 Recognition Program

Learning and Development Method Topics ImpactTopics for Self Study Projects
Quality/ Business
CC#1; CC#2; SC#1; SC#2; SC#3; SP; PI; OC; CV
Customer Service CC#1; CC#2; SC#1; SP; PI; CF; OC; CVInnovation CC#1; CC#2; SC#1; SC#2; SP; PI; IN; CF;
OG; CVIndustry CC#1; CC#2; SC#1; SP; PI; IN;
CF; OGCross Training CC#1; CC#2; SC#2; PI; CF; OC; CV; TKJob Specific CC#1; CC#2; PI; IN; CF; OC; CV; TK
Topics for Online Enrichment(over 300 courses)
Career Development
EE; CV; PI
Communication EE; CV; PICustomer Service CC#1; CC#2; SC#1; SP; PI; CF;
OC; CVDeveloping Talent CC#1; CC#2; SC#3; EE;CV; SP; PIInnovation CC#1; CC#2; SC#1; SC#2; SP; PI; IN; CF;
OG; CVEngagement EE; CV; PIIntegrity and Trust EE; CV; PI; EBPLeadership EE; CV; PIConflict and Problem Solving
CC#1; CC#2; SP; PI; IN; CF; OC, CV
Performance Management
CC#1; CC#2; SP; PI; IN; CF; OC; CV
Recognition/ Giving feedback
SC#3; EE; CV; PI
Selling Techniques CC#2; SC#1; SP; PI; CF; OC; EEWork Life Balance SC#3; EE
Mandatory (all employees)
Safety Training EE; CVSH Prevention EE; CVEthics EE; CV; EBPMomentum Quality Concepts
SP; PI; CF; OC; EE; CV
Legend: CC#1 = Core Competency Innovative Product Development Team, CC#2 = Core Competency Sophisticated Selling Process, SC#1 = Strategic Challenge Operating in a slow growth industry, SC#2 = Strategic Challenge Sustaining Momentum’s growth without incur- ring overhead, SC#3 = Strategic Challenge Finding and hiring talented Sales and Inside Sales agents, SP = Strategic Plan, PI = Performance Improvement, IN = Innovation, EBP = Ethical Business Practices, CF = Customer Focus, OC = Organizational Change, EE = Employee Engagement, CV = Core Values, TK = Transfer of Knowledge.
Figure 5.2-2 Selection of Learning and Development Programs
to three minutes in length, and the rest of the learning is based on the implementation of a prescribed action plan and practice of the new skill in the everyday job performance. Effectiveness of the learning plans is measured based on the improved perfor-mance of the process measure or competency level set out to improve and are discussed during performance evaluations. This ensures that the knowledge or skill was indeed learned and will continue to be reinforced as the new skill is practiced.
C&S Process Workgroup Learning Momentum’s unique IBA process (Figure 1.1-3) is the primary vehicle for workgroup learning for the C&S processes. A key criterion in the applica-tions is learning and innovation. C&S processes are required to identify areas of learning and innovation and how these op-portunities are identified and prioritized using process measure results. They are also asked to identify what process measures or customer satisfaction measures this learning and innovation will impact. Through this process Momentum improves its cus-tomer focus, keeps the organization dedicated to innovation, and embraces organizational change. The IBA also serve as a formal documentation process of C&S process measures and im-provements that are used to transfer knowledge from leaving or retiring employees. Momentum’s C&S process workgroup learning has a strong impact on organizational performance improvement, customer satisfaction, and business results. Through fact-based company performance measures, it is able to identify performance gaps and opportunities for improvement in process, learning and development, and workforce engagement.
Company-wide Learning There are critical topics on which Momentum believes all employees should be trained, such as Momentum quality concepts, workplace ethics, prevention of sexual harassment, and safety. These courses, as well as Mo-mentum’s entire training program, are evaluated annually during Step #2 of the SPP (Figure 2.1-1). This ensures that Momentum is continually improving its offerings and that employees are equipped to accomplish the company’s mission, vision, and short and long-term goals.
5.2b(3) Career ProgressionMomentum utilizes its performance management system de-scribed in 5.2a(4) to also manage career development within the workforce. This involves utilizing the Talent Management program to identify key behavioral competencies needed for a new position and to identify key behavioral competencies of top performers who qualify to meet the job requirements; Momentum’s goal is to hire and promote from within whenev-er possible. In order to facilitate this match, Momentum’s learning and development program described in 5.2b(1) and (2) is augmented at the generous tuition reimbursement program, extensive training courses offered, and robust training and development investment per employee (Figure 7.3-16).
Succession planning for management and leaders is followed as described in 1.1a(3) and has resulted in 73% of current managers having been promoted from non-manager to manager positions during their tenure with Momentum.
25

products that align new technologies and innovative materials with industry and customer requirements. Using Silica as an example, Momentum combines environmental sustainability and innovation with specific market demand. Silica, a revolutionary industry first, is an environmentally-friendly, silicone-based product that successfully meets customers’ aesthetic and cleanability requirements and exceeds industry performance standards. Silica is inherently anti-microbial and anti-bacterial and even a permanent marker can be wiped off with water.
The Product Development core process’s additional responsibili-ties include consistently meeting with yarn suppliers P.1b(3) and textile suppliers as well as researching new technologies and innovative ideas in the industry. An example of this is Momen-tum’s Silica Prints project (same characteristics of Silica but with a printed pattern) scheduled to launch in 2016. The project meets both Momentum’s and customers’ requirements of quality and aesthetics while also serving the core value of bettering the world around us. These examples serve as evidence of Momentum’s commitment to design and product innovation. This strong commitment is reinforced by Momentum’s ability to manage innovation opportunities, conduct risk assessments and know when an opportunity is not viable. Due to the nature of using innovative materials or new technologies, Momentum’s Product Development core process allows a longer development timeline and has incorporated risk assessment checks into the process before and after the testing phase (Figure 6.1-1). When it is determined a project will not meet industry or customer requirements, it is declared not viable and design resources are allocated elsewhere. Momentum has calculated into its design capabilities the ability to continuously develop more product
CATEGORY SIX: OPERATIONS
6.1 Work Processes6.1a Product and Process Design6.1a(1) Product and Process RequirementsProduct Requirements Momentum’s product requirements are determined by a combination of both industry stan-dards and customer requirements. Two industry associations provide industry standards for quality and product perfor-mance. BIFMA provides the quality standard that is intended to define industry policies established for textile flaws; and ACT puts forth contract textile standards for flammability and durability. Momentum’s employee Designers as part of the Product Development core process are highly trained in industry standards and has a systematic testing phase during the development process to ensure that the end product meets industry standards and customer requirements. Customer requirements are determined through the VOC (Figure 3.1-1) and validated throughout the development process during product testing and customer feedback stages (Figure 6.1-1).
Work Process Requirements Momentum’s key work process requirements (Momentum calls these Core processes) are determined by the needs to support Momentum’s core competencies and strategic plan. See Figure 6.1-4 for the list of the six core processes and their requirements.
6.1a(2) Design ConceptsMomentum designs its product in the manner demonstrated in Figure 6.1-1. The Product Development core process works continuously and systematically to develop fresh new
26
Inputs for Color Work Development; Pattern Review/Validation Design team feedback Customer feedback (VOC) Sales Rep feedback
Performance Review and Product Planning% of line that is WOW product (award winning or industry first)Average gross profit per patternProduct lifecycle reviewCustomer survey results for product design vs. competitors
InputsMomentum’s short term and long term goals TechnologyInnovative materials Voice of the Customer (Figure 3.1-1)Product need based on product lifecyclePast sales performance for comparable product Likely price point, profitability and likely sales volume Tenured design staffDepartmental knowledge Departmental capabilities Supplier capabilities Market trendsCompetitors
Inputs for Performance Testing BIFMA standards for quality ACT standards for performance CFM testing requirements
Product Design
Learning and improvements
are made ateach stage
Final Revisions and Pattern
Designed
Pattern integrated into Inventory
Risk Assessment
Risk Assessment
Color Work DevelopmentPattern
Review/Validation
Concept & Pattern Develop-
ment
Product launched through entire
Sales Force
Learning & Evaluation
PerformanceTesting
Figure 6.1-1. •=Approach; •= Deployment; •=Learning and •= Integration

into their process matrix.2) Process Matrix: This includes process measures that measure how well the C&S processes are performing their work compared to goal/benchmark.3) Customer Matrix: This includes customer satisfaction mea-sures that measure how well each C&S process is meeting the requirements of its customers. These are outputs from their process matrix. The six core processes combined review more than 150 critical process measures. Figure 6.1-3.
Each C&S process workgroup systematically reviews their three matrices during their monthly C&S process meetings (4.1-4) that roll up to the quarterly company Dashboard meeting. This ensures that company performance is consistently measured and compared to goal in order to meet each C&S processes’ requirements and ultimately meet and exceed the external customers’ requirements detailed in Figure 3.1-2. See Figure 6.1-4 for a list of Momentum’s core processes with corresponding key in-process measures (Momentum calls these critical process measures). Over 150 critical process measures are available onsite.
6.1b(2) Support ProcessesSupport processes are determined by the need to support the core processes that support Momentum’s core competencies, and the strategic plan. In the same manner as the core processes, the support process workgroups also utilize handoff, process and customer (Figure 6.1-3) matrices for daily operations and are integrated into Step #3 of the QPIS for measuring, monitor-ing and evaluation. Support processes review over 120 measures between the five support processes to evaluate how well they support the core processes and meet key business support requirements (Figure 6.1-5).
than needed so that in these situations another product is substituted, the opportunity for a product launch is not lost and the risk is minimized.
Momentum designs its work processes in the manner demon-strated below (Figure 6.1-2). Momentum’s work processes are designed during Corrective Action meetings (Figure 4.1-4) using the Plan Do Check Act Model (PDCA) for process improve-ment. Employees are trained in this process during initial Qual-ity Concepts training described in 5.1a(2). In most cases new processes are designed via an action team so as to leverage the expertise of key employees who are affected by the process change. As described in Figure 6.1-2, a variety of possible inputs trigger a need for process changes or for an entirely new process. Process requirements are established during the Planning phase to ensure that during the Check phase the team’s problem was solved and the mission was accomplished.
If further process improvements or changes are needed, Momentum’s small size, established action team process and highly skilled and knowledgeable IT staff afford Momentum the agility needed to execute changes quickly before full deployment and integration into the QPIS.
6.1b Process Management6.1b(1) Process ImplementationThe day-to-day operation of C&S processes are managed, measured and monitored through its critical processes. Critical processes are documented on three matrices that are developed per C&S process and serve as the basis for the IBA. The three matrices include:1) Handoff Matrix: This includes handoff measures that trackhow well other workgroups meet their handoff requirements inorder for the C&S process to do their job well. These are inputs
27
PlanIdentify Need for Process Change
Do Implement the Process (Limited)
CheckEvaluate the Process
Validate missionhas been achieved and key requirementsare met
Develop process manuals; conduct employee training and integrate process into C&S processes for continual performance review
InputsChange in customer requirements heard through VOC (Figure 3.1-1) Changes in competitive environmentTechnology changeStrategic direction from SLsFeedback from Baldrige consultantEmployee generated process improvement (Opportunity Knocks program)
Identify action team problem and mission statement and requirements such as the quantifiable impact in savings in time cost, error reduction, improved customer oremployee satisfaction or brand image enhancement
Analyze the current process using quality tools; flowcharting, brainstorming, root cause analysis, solution selection
Identify solution options that provide best use of technology, ease of use, cost effectiveness and overall internal or external customer satisfaction and value
Implement a solution as a trial and perform testing
Work Process Design
ActFinal Revisions and Full Implementation
Figure 6.1-2. •=Approach; •= Deployment; •=Learning and •= Integration
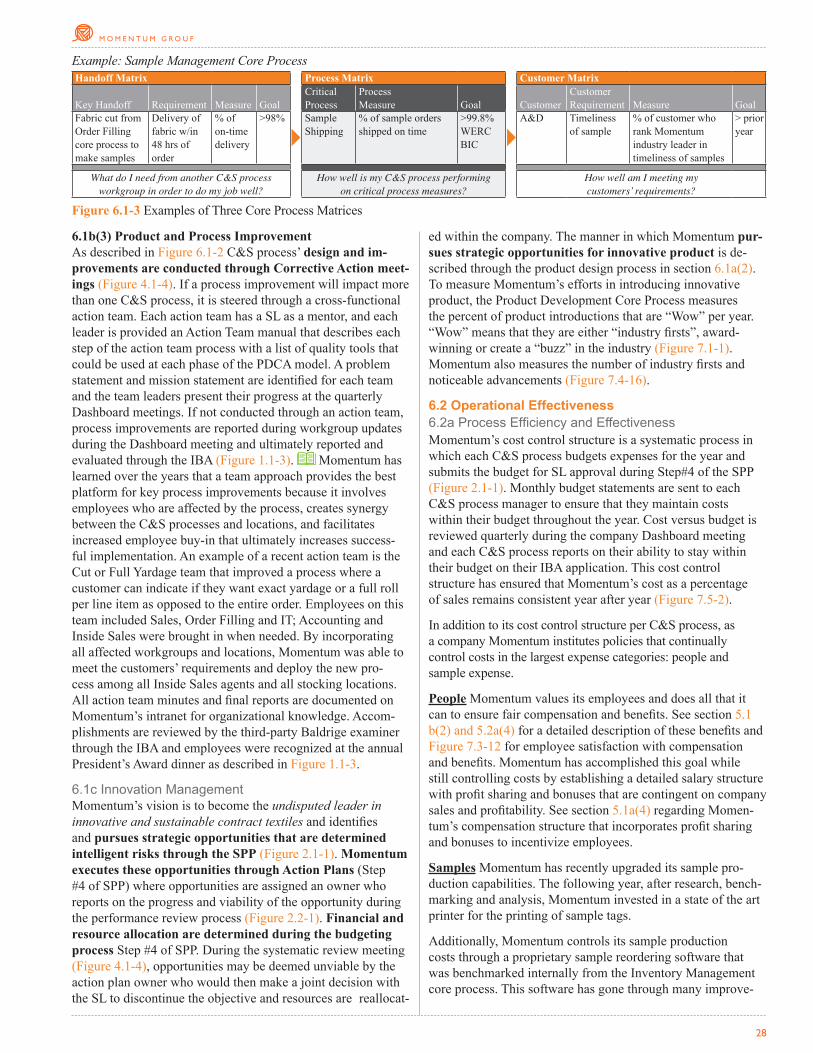
ed within the company. The manner in which Momentum pur-sues strategic opportunities for innovative product is de-scribed through the product design process in section 6.1a(2). To measure Momentum’s efforts in introducing innovative product, the Product Development Core Process measures the percent of product introductions that are “Wow” per year. “Wow” means that they are either “industry firsts”, award- winning or create a “buzz” in the industry (Figure 7.1-1). Momentum also measures the number of industry firsts and noticeable advancements (Figure 7.4-16).
6.2 Operational Effectiveness6.2a Process Efficiency and EffectivenessMomentum’s cost control structure is a systematic process in which each C&S process budgets expenses for the year and submits the budget for SL approval during Step#4 of the SPP (Figure 2.1-1). Monthly budget statements are sent to each C&S process manager to ensure that they maintain costs within their budget throughout the year. Cost versus budget is reviewed quarterly during the company Dashboard meeting and each C&S process reports on their ability to stay within their budget on their IBA application. This cost control structure has ensured that Momentum’s cost as a percentage of sales remains consistent year after year (Figure 7.5-2).
In addition to its cost control structure per C&S process, as a company Momentum institutes policies that continually control costs in the largest expense categories: people and sample expense.
People Momentum values its employees and does all that it can to ensure fair compensation and benefits. See section 5.1 b(2) and 5.2a(4) for a detailed description of these benefits and Figure 7.3-12 for employee satisfaction with compensation and benefits. Momentum has accomplished this goal while still controlling costs by establishing a detailed salary structure with profit sharing and bonuses that are contingent on company sales and profitability. See section 5.1a(4) regarding Momen-tum’s compensation structure that incorporates profit sharing and bonuses to incentivize employees.
Samples Momentum has recently upgraded its sample pro- duction capabilities. The following year, after research, bench-marking and analysis, Momentum invested in a state of the art printer for the printing of sample tags.
Additionally, Momentum controls its sample production costs through a proprietary sample reordering software that was benchmarked internally from the Inventory Management core process. This software has gone through many improve-
28
Handoff Matrix
Key Handoff Requirement Measure GoalFabric cut from Order Filling core process to make samples
Delivery of fabric w/in 48 hrs of order
% of on-time delivery
>98%
What do I need from another C&S process workgroup in order to do my job well?
Process Matrix Critical Process
Process Measure Goal
Sample Shipping
% of sample orders shipped on time
>99.8%WERC BIC
How well is my C&S process performing on critical process measures?
Customer Matrix
CustomerCustomer Requirement Measure Goal
A&D Timeliness of sample
% of customer who rank Momentum industry leader in timeliness of samples
> prior year
How well am I meeting my customers’ requirements?
Example: Sample Management Core Process
Figure 6.1-3 Examples of Three Core Process Matrices
6.1b(3) Product and Process ImprovementAs described in Figure 6.1-2 C&S process’ design and im-provements are conducted through Corrective Action meet-ings (Figure 4.1-4). If a process improvement will impact more than one C&S process, it is steered through a cross-functional action team. Each action team has a SL as a mentor, and each leader is provided an Action Team manual that describes each step of the action team process with a list of quality tools that could be used at each phase of the PDCA model. A problem statement and mission statement are identified for each team and the team leaders present their progress at the quarterly Dashboard meetings. If not conducted through an action team, process improvements are reported during workgroup updates during the Dashboard meeting and ultimately reported and evaluated through the IBA (Figure 1.1-3). Momentum has learned over the years that a team approach provides the best platform for key process improvements because it involves employees who are affected by the process, creates synergy between the C&S processes and locations, and facilitates increased employee buy-in that ultimately increases success-ful implementation. An example of a recent action team is the Cut or Full Yardage team that improved a process where a customer can indicate if they want exact yardage or a full roll per line item as opposed to the entire order. Employees on this team included Sales, Order Filling and IT; Accounting and Inside Sales were brought in when needed. By incorporating all affected workgroups and locations, Momentum was able to meet the customers’ requirements and deploy the new pro-cess among all Inside Sales agents and all stocking locations. All action team minutes and final reports are documented on Momentum’s intranet for organizational knowledge. Accom-plishments are reviewed by the third-party Baldrige examiner through the IBA and employees were recognized at the annual President’s Award dinner as described in Figure 1.1-3.
6.1c Innovation ManagementMomentum’s vision is to become the undisputed leader in innovative and sustainable contract textiles and identifies and pursues strategic opportunities that are determined intelligent risks through the SPP (Figure 2.1-1). Momentum executes these opportunities through Action Plans (Step #4 of SPP) where opportunities are assigned an owner who reports on the progress and viability of the opportunity during the performance review process (Figure 2.2-1). Financial and resource allocation are determined during the budgeting process Step #4 of SPP. During the systematic review meeting (Figure 4.1-4), opportunities may be deemed unviable by the action plan owner who would then make a joint decision with the SL to discontinue the objective and resources are reallocat-

Time SavingsImprovements Implemented in 2013-2015 Annual Impact (Labor Time)Accounting software 48 hoursAdvanced ship notifications from int’l mills 150 hoursApplicant tracking system 225 hoursCredit cash posting improvement 156 hoursCredit improvement efficiency gains 287 hoursElectronic access to packing slips 192 hoursExpense reporting software 144 hoursImplementing of e-invoicing 156 hoursOnline performance evaluations 160 hoursRemoving limit on sample lines per order 130 hoursRFC improvement efficiency gains 260 hoursSample order filling workflow 780 hoursSample shipping label improvement 1040 hoursWarehouse scanners used during inventory 14 hoursTotal (90% of TWO full time employees) 3742 hoursCost SavingsImprovements Implemented in 2013-2015 Annual Impact (Cost Savings)American Express corporate card program $10,000Commission report improvements $13,700 Implementation of e-invoicing $5,800Migrated to Office 365 $31,000 Online interviewing process $10,000 Short ends of fabric utilization $58,000 Total $128,500
Figure 6.2-1 Time and Cost Saving
6.2b Supply-Chain ManagementSelection of Suppliers Over Momentum’s 20 years in business it has developed key supplier relationships with leading textile mills around the world. The Product Development core process performs supplier selection management and evaluation for new development. They have established criteria to evaluate potential textile suppliers that include quality of the fabrics, suppliers’ management team, facility, quality controls, financial stability, and internal supply chain processes. Suppliers are provided a vendor binder that clearly states Momentum’s core values, requirements for product development, standards for quality delivery and service for product purchases and adher-ence to laws, regulations and ethical labor practices. A section is also dedicated to vendor ranking based on performance evaluations and how suppliers will be selected and prioritized for future product placements. Suppliers are required to sign an acceptance of all Momentum’s requirements and adhere to Momentum’s core values before product development begins.
Evaluation of Suppliers Both Product Development and the Inventory Management core process evaluate suppliers. Every quarter, the Inventory Management core process evaluates the top suppliers on quality, delivery and service. In 2015, the Inven-tory Management core process revised the vendor rating criteria to make it more rigorous for suppliers. Based on these evalua-tions, suppliers are categorized into four categories: Preferred, Approved, Probation, and New.
ment phases to maintain the balance of having the correct samples available for the customer with the cost of having too much inventory on the shelf. The process has been refined so well that if a memo sample happens to go on backorder, the sample is produced the same day more than 99.6% of the time, and the order is shipped complete- meaning that the customer was not even aware that the sample went on back-order (Figure 7.1-7).
Apart from controlling cost in its highest expense categories, Momentum has implemented strict quality controls across all appropriate workgroups to reduce errors, rework, and loss of customers’ productivity before product is received into the warehouse. Some examples include:■ All suppliers employ internal quality control representatives
in their production processes■ All piece-dyed products are inspected under high intensity
lighting and are matched to a specific shade before beingentered into inventory
■ All yardage is inspected for flaws during the cutting process■ All warehouse employees are trained and certified on
BIFMA quality standards and how to identify flaws in a roll■ Cutting tables are calibrated quarterly■ RFCs (errors) are reviewed in the Order Filling work
group meetings■ Replacement yardage orders are highlighted in color on the
picking document to prevent a duplication of error
Automated Control Measures■ Piece-dyed rolls cannot be received without a shade match■ System does not allow an incorrect product or color to be
scanned for shipment■ System alerts when a roll needs to be measured.■ All customer information is populated in the shipping
department to avoid data entry errors
In addition, each C&S process systematically controls costs in operation through Steps #4, #5 and #6 of the QPIS, Measuring and Monitoring, Corrective Action and Continual Improve-ment. A key component of the system is identifying quantifi-able results in terms of cost savings, time savings, increased productivity, reduced cycle time, and employee or customer satisfaction prior to a process change implementation (Figure 6.1-2). This enables proper prioritization of organizational resources and provides a measure of the successfulness of the process change. Through the use of the QPIS and specifically the IBA process, multitudes of cost saving ideas have been implemented every year (see Figure 6.2-1).
29

ee recognition and celebrations are conducted at each location when safety goals are met. See Figure 7.3-8 for loss time acci-dent results.
6.2.c(2) Emergency PreparednessMomentum ensures that the organization is prepared for disasters or emergencies through its Emergency Action Plan. The plan is in place to protect the lives, property and other assets of the company, and to ensure the orderly and efficient transi-tion from normal to emergency operations and back. The Safety Team steers Momentum’s Emergency Preparedness plan which can also be found in the Momentum Way. Responsibilities of the Safety Team, Emergency Coordinator and Managers are detailed in the plan. For its Emergency Preparedness and Prevention Plan, Momentum measures: 1) Completion of Emergency Pre-paredness Checklist (Figure 7.1-25), 2) Number of CPR trained employees per location (Figure 7.1-26) and 3) Emergency drills per location (Figure 7.1-27).
Emergency drills that simulate evacuation of employees or movement of employees to shelter areas are conducted in each facility. Employees are also trained on the following:1) individual roles and responsibilities; 2) information about threats, hazards, and protective actions; 3) notification, warn-ing and communications procedures; 4) emergency responseprocedures; 5) evacuation, shelter and accountability procedures;6) location and use of fire extinguishers and 7) emergencyshutdown procedures. Procedures for the following potential emergencies are detailed in the plan: bomb threat, civil unrest, and disruptive intruder, power failure, earthquake, fire, medical emergency or severe weather; along with a full recovery planled by SLs on how to resume operations. Because Momen-tum carries inventory for several weeks and no more than one supplier constitutes more than X% of total purchases, Momen-tum’s diversification reduces risks associated with emergenciesoccurring at a supplier location.
Pref
erre
dScore is above X points for two consecutive quarters for ongoing quality, delivery and service and for the past two projects in product development. Continuous improvement is demonstrated through corrective action plan and partnership with Momentum to satisfy quality, delivery and service requirements. Supplier will receive maximum opportunities for new business and will be rewarded for the partnership with the most appropriate new placements
App
rove
d
Score is below X points and the average score for the past two quarters is between X points for ongoing quality, delivery and service and for the past two projects in product development. Suppliers show a commitment to attaining Preferred status by demonstrating a strong corrective action plan for improvements in areas that do not satisfy Momentum’s requirements. Approved vendors will be eligible for new placements, are welcome to submit examples of new products, and will be considered on a secondary basis to Preferred vendors.
Prob
atio
n Score is below X points and the average score for the past two quarters is below X points. Suppliers are not considered for new placements and corrective action plans must be submitted. Action to convert existing product to a new supplier will be considered.
New
New vendors must bring some benefit that is new and significant to Momentum that Preferred and Approved vendors do not already offer. This can be done in the form of product, service or technology.
Figure 6.2-3 Supplier Evaluation Criteria
Quarterly review meetings with Inventory Management, project review with Product Development and high level Vendor Planning meetings with SLs (Figure 4.1-4) allow suppliers to provide valuable feedback to Momentum regard-ing their needs, their changing capabilities, industry news, and emerging technologies.
6.2c Safety and Emergency Preparedness6.2.c(1) SafetyIt is Momentum’s policy to maintain a comprehensive occu-pational, health and safety program for preventing injuries and providing a safe operating environment. This policy is detailed in the Momentum Way and is provided to all new employees and available on the intranet. Practical steps are taken to maintain a workplace that complies with all applicable regulations for safety and health. To assist in providing a safe and healthful work environment for employees, customers and visitors, Momentum has an established workplace safety pro-gram that is managed by a cross functional safety action team. This team meets quarterly and represents employees from all segments of the organization. The goals of the safety team for accident prevention are to: 1) Conduct Environmental Inspection Reviews and Employee and Housekeeping Reviews, 2) Conduct Job Safety Analysis and 3) Conduct employee safety training. Momentum provides information to employees about workplace safety and health issues through regular internal communication channels such as Lunch and Learn or written communications. Employees are trained to perform their jobs safely with the appropriate equipment for the job. When a safety incident does occur that involves property loss or injury/illness requiring medi-cal attention, the immediate manager, leader of the safety team, and Human Resources support process are notified to provide the employee with appropriate care and to investigate the cause of incident within 24 hours of notification. This investiga-tion involves root cause analysis, learning, and methods of prevention of further accidents. Detailed instruction on how to correct an unsafe location, practices or procedures are detailed in the safety program in the Momentum Way. An annual review of safety measures is conducted by the action team and employ-
30

CATEGORY SEVEN: RESULTS
7.1 Product and Process Results7.1a Customer-Focused Product and Service ResultsMomentum’s results for product and customer service processes are organized by A&D and CFM requirements listed in P.1-9 and Figure 3.1-2 which are underlined below. Results for both A&D and CFM are listed in Figure 7.1-1 to 7.1-6. The measure that primarily addresses the A&D requirement is listed in Figure 7.1-7 and CFM requirements are listed in Figure 7.1-8 to 7.1-12.
Product Design and Innovation Momentum’s added value to both A&D and CFMs are award-winning, innovative and sustainable designs. The Product Development core process measures its success in product design and innovation by the percent of new product that is “Wow” or “First to Market” (Figure 7.1-1), the number of design awards received (Figure 7.1-2), and the number of industry firsts (Figure 7.4-16).
31
Selection of Momentum Product Design Awards from 2010-2015Product AwardFast Track Interior Design Best of Year FinalistSilica Prints Interior Design Best of YearShantell Martin Metropolis Likes AwardSnapshot Best of NeoCon Award Silver
Good Design AwardBlueprint Interior Design Hip Award
Interior Design Best of Year HonoreeViewpoints Collection Interior Design Best of YearCrossing Colors Best of NeoCon Silver Award
Cooper Hewitt: permanent textile collection Magnusson Collection GOOD DESIGN™ AwardBotanica Collection Interior Design Best of Year (Healthcare)
Best of NeoCon Silver Molto Collection Interior Design Best of Year Naked Nylon Industry First, recycled nylon content
Green GOOD DESIGN™ Award Interior Design Best of Year IIDEX Innovation Gold Award
In Motion Best of NeoCon SilverSilica Industry First- first sustainable alternative to vinyl
Best of NeoCon Gold Nightingale Award IIDEX Innovation Silver Award
Through Light and Shadow
ADEX Gold for Design ExcellenceInterior Design Best of Year
Reveal Interior Design Best of Year ADEX Platinum for Design Excellence
Black and White Collection
Bloom AwardInterior Design Best of Year
Figure 7.1-2 Momentum’s products have won multiple industry awards for design and innovation.
Percent of New Product that is “Wow” or “First to Market”
0%
10%
20%
2012 2013 2014 Goal = >10%
Per
cent
Figure 7.1-1 Wow products are either innovative, award-winning or create a buzz within the design community.
11%
13%
13%
2015
13%
2016
11%
Figure 7.1-3 Momentum has achieved its goal to have Sales Reps participating in their market.
0% 20% 40% 60% 80%
100%
2011 2012 2013 2015
Percent of Sales Reps with Industry Involvement
Per
cent
2014
75%
100%
100%
100%
100%
2016
100%
Goal = 100%
Bet
ter
Sales Reps A&D and CFM relationships with their Sales Reps are measured by Sales Rep turnover (Figure 7.3-11); the percent-age of Sales Reps who are involved in industry events (Figure 7.1-3); and the Matrimonial Index (Figure 7.2-11).
Sustainable Products and Operations Momentum measures sustainability in products by the percent of new products that are REI (Figure 7.4-5) and the percent of the product line that is GreenGuard and REI (Figure 7.4-4). Sustainable operations is measured on Environmental Initiatives listed in Figure 7.4-10.
Customer Service Inside Sales’ responsiveness and customer relationships are measured through order accuracy (Figure 7.1-4); inquiry response time (Figure 7.1-5); and Inside Sales turnover (Figure 7.3-11).
99.7
2%
99.7
6%
99.6
6%
99.6
1%
99.6
9%
99.5
0%
99.5
0%
99.5
0%
99.5
0%
99.7
8%
60%
70%
80%
90%
100%
2011 2012 2013 2014 2015
Percent of Quality and Accuracy of Orders
Order Accuracy WERC Advantage
Per
cent
Figure 7.1-4 The Inside Sales core process measures order quality and accuracy for emails, faxes, and calls for Inside Sales agents to ensure that service requirements for its customers are being met. All incorrect orders follow the RFC process (Figure 3.2-3) to prevent future errors. Momentum’s total accuracy rate is above WERC advantage since 2011.
Bet
ter
0
100
200
300
2011 2012 2013 2014 2015
Min
utes
Response Time to Customers Inquiries
Response Time
Better
Figure 7.1-5 Momentum evaluates the response time for Inside Sales agents to respond to customers’ inquiries. Momentum has consistently met this goal since 2011 and performs better than the BIC benchmark.
45 49 52 52 52
2016
46
Best in Class BenchmarkGoal

32
Website Ease of use of the website data is gathered through Google Analytics and compared to benchmark:
On-time Complete
Figure 7.1-7 A&D customers require timeliness of memo samples in order for Momentum to be specified for a project. Momentum surpassed WERC Best in Class (BIC) bench-marks. As noted in Figure 7.2-1, A&D customers rate Momen-tum as the industry leader compared to competitors in timeli-ness of samples.
50%
60%
70%
80%
90%
100%
2011 2012 2013 2014 2015 WERC BIC
Percent of Sample Orders Shipped On Time and Complete
Per
cent
Bet
ter
99.8
%
99.4
%
98.5
%
99.4
%
99.8
%
99.6
%
99.9
%
99.6
%
99.7
%
99.6
%
99.8
%
99.5
%
Timeliness of Samples The Sample Management core process measures the ability to meet this A&D requirement by percent of sample orders shipped on time and complete:
0%
20%
40%
60%
80%
100%
Percent of Orders Shipped On Time by Location
2011 2012 2015 NC CA MI WERC Best in Class
Figure 7.1-9
Per
cent
99.4
%
99.8
%
99.8
%
99.9
%
100.
0%
99.9
%
2013
98.3
%
99.6
%
99.7
%
2014
92.6
%
98.5
%
99.8
%
99.8
%
98.3
%
99.9
%
2016
98.2
%
99.7
%
99.8
%
99.8
%B
ette
r
70% 75% 80% 85% 90% 95%
100%
99.8
%
99.8
%
99.6
%
2011
99.9
%
99.9
%
99.6
%
2012
100.
0%
99.9
%
99.8
%
2013
99.9
%
99.8
%
99.8
%
2014 2015
99.9
%
99.8
%
99.8
%
99.9
%
2016
Percent of Orders Filled Accurately by Location
NC CA MI WERC Best in Class
Per
cent
Figure 7.1-10
99.9
%
99.9
%
99.9
%
Bet
ter
0:00
1:12
2:24
3:36
4:48
6:00
7:12
0 100 200 300 400 500 600 700
2011 2012 2013 2014 2015
Min
utes
Num
ber i
n Th
ousa
nds
Momentum Website
Total Visits Momentum Total Visits Benchmark Time on Site Momentum Time on Site Momentum Time on Site Benchmark
Figure 7.1-6 Momentum consistently performs better than benchmark and is rated the industry leader in website by its customers, as seen in Figure 7.2-1 to 7.2-5.
Bet
ter
Figure 7.1-9-7.1-10 In line with having product in stock for CFMs is Momentum’s ability to ship the fabric accurately and when promised. Momentum has surpassed the WERC Best in Class (BIC) benchmark for accuracy since 2011 for all locations (Figure 7.1-10). For on-time shipping, CFMs rank Momentum as the industry leader in delivery compared to competitors (Figure 7.2-2).
7.1b Work Process Effectiveness Results7.1b(1) Process Effectiveness and EfficiencyMomentum’s six core processes’ critical process measures are listed by core process in Figure 6.1-4. Charts for customer fo-cused results are listed in 7.1(a) and process effectiveness charts are presented here in 7.1b(1). A smaller selection of Momentum’s five support processes’ critical process measures are presented throughout Category 7 as follows:Marketing: 7.1-6Human Resources: 7.3-3,8,10,11,17; 7.4-7 and 7.4-11Credit: 7.2-9,10; 7.5-3,4 Accounting: 7.4-2 and 7.4-3 IT: 7.1-24
The total of 150 core process measures and 120 support process measures are available onsite.
0 1 2 3 4 5
2010 2011 2012 2013 2014
Inventory Turns
All Product A Product
Bet
ter
Turn
s
Figure 7.1-15 Momentum measures its inventory turns for all products and for “A” products. Momentum’s goal is to increase inventory turns over the prior year.
2015
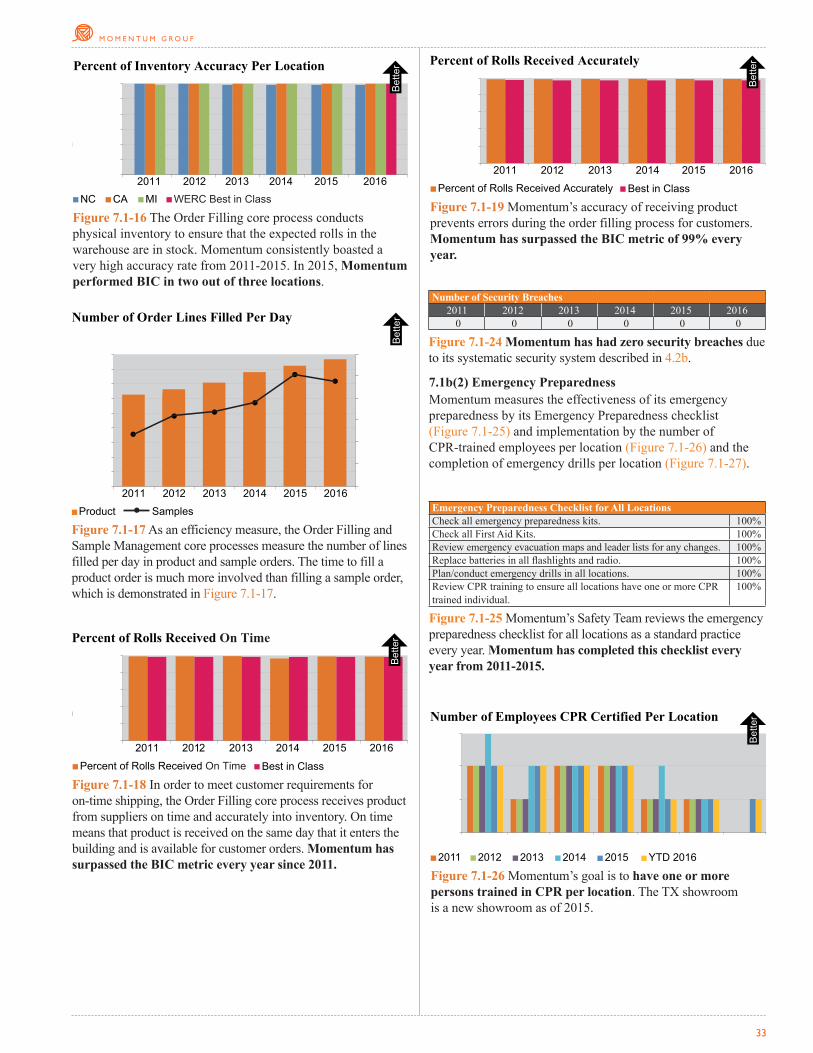
33
99.9
%
2011 2012 2013 2015 2016
Percent of Inventory Accuracy Per Location P
erce
nt
NC CA MI WERC Best in Class
Figure 7.1-16 The Order Filling core process conducts physical inventory to ensure that the expected rolls in the warehouse are in stock. Momentum consistently boasted a very high accuracy rate from 2011-2015. In 2015, Momentum performed BIC in two out of three locations.
70% 75% 80% 85% 90% 95%
100%
100.
0%
100.
0%
99.8
%
99.9
%
100.
0%
99.9
%
99.8
%
100.
0%
99.9
%
99.8
%
99.9
%
99.9
%
2014
99.8
%
99.9
%
99.9
%
99.8
%
100%
10
0%
99.9
0%
Bet
ter
0% 20% 40% 60% 80%
100%
2011 2012 2013 2014 2015
Percent of Rolls Received On Time
Percent of Rolls Received On Time Best in Class
Per
cent
Figure 7.1-18 In order to meet customer requirements for on-time shipping, the Order Filling core process receives product from suppliers on time and accurately into inventory. On time means that product is received on the same day that it enters the building and is available for customer orders. Momentum has surpassed the BIC metric every year since 2011.
99.5
%
99.0
%
99.3
%
99.0
%
99.7
%
99.0
%
98.4
%
99.0
%
99.3
%
99.0
%
2016
99.1
5%
99.0
%B
ette
r
0% 20% 40% 60% 80%
100%
2011 2012 2013 2014 2015
Percent of Rolls Received Accurately
Percent of Rolls Received Accurately Best in Class
Per
cent
Figure 7.1-19 Momentum’s accuracy of receiving product prevents errors during the order filling process for customers. Momentum has surpassed the BIC metric of 99% every year.
2016
99.9
5%
99.0
0%
99.9
7%
99.0
0%
99.9
6%
99.0
0%
99.9
2%
99.0
0%
99.9
1%
99.0
0%
99.9
5%
99.0
0%
Bet
ter
0 100 200 300 400 500 600 700 800 900
Number of Order Lines Filled Per Day
# of
Pro
duct
Lin
es
# of
Sam
ples
Lin
es
2011 2012 2013 2014 2015
Product Samples
Figure 7.1-17 As an efficiency measure, the Order Filling and Sample Management core processes measure the number of lines filled per day in product and sample orders. The time to fill a product order is much more involved than filling a sample order, which is demonstrated in Figure 7.1-17.
Bet
ter
0
1,000
2,000
3,000
4,000
5,000
6,000
2016
635
663
707
831
775
875
Number of Security Breaches2011 2012 2013 2014 2015 2016
0 0 0 0 0 0
Figure 7.1-24 Momentum has had zero security breaches due to its systematic security system described in 4.2b.
7.1b(2) Emergency PreparednessMomentum measures the effectiveness of its emergency preparedness by its Emergency Preparedness checklist (Figure 7.1-25) and implementation by the number of CPR-trained employees per location (Figure 7.1-26) and the completion of emergency drills per location (Figure 7.1-27).
Emergency Preparedness Checklist for All LocationsCheck all emergency preparedness kits. 100%Check all First Aid Kits. 100%Review emergency evacuation maps and leader lists for any changes. 100%Replace batteries in all flashlights and radio. 100%Plan/conduct emergency drills in all locations. 100%Review CPR training to ensure all locations have one or more CPR trained individual.
100%
Figure 7.1-25 Momentum’s Safety Team reviews the emergency preparedness checklist for all locations as a standard practice every year. Momentum has completed this checklist every year from 2011-2015.
Figure 7.1-26 Momentum’s goal is to have one or more persons trained in CPR per location. The TX showroom is a new showroom as of 2015.
0
1
2
3
CA Office CA NC MI NY IL TX
Number of Employees CPR Certified Per Location
2015 YTD 2016 2011 2012 2013 2014
Num
ber
Bet
ter
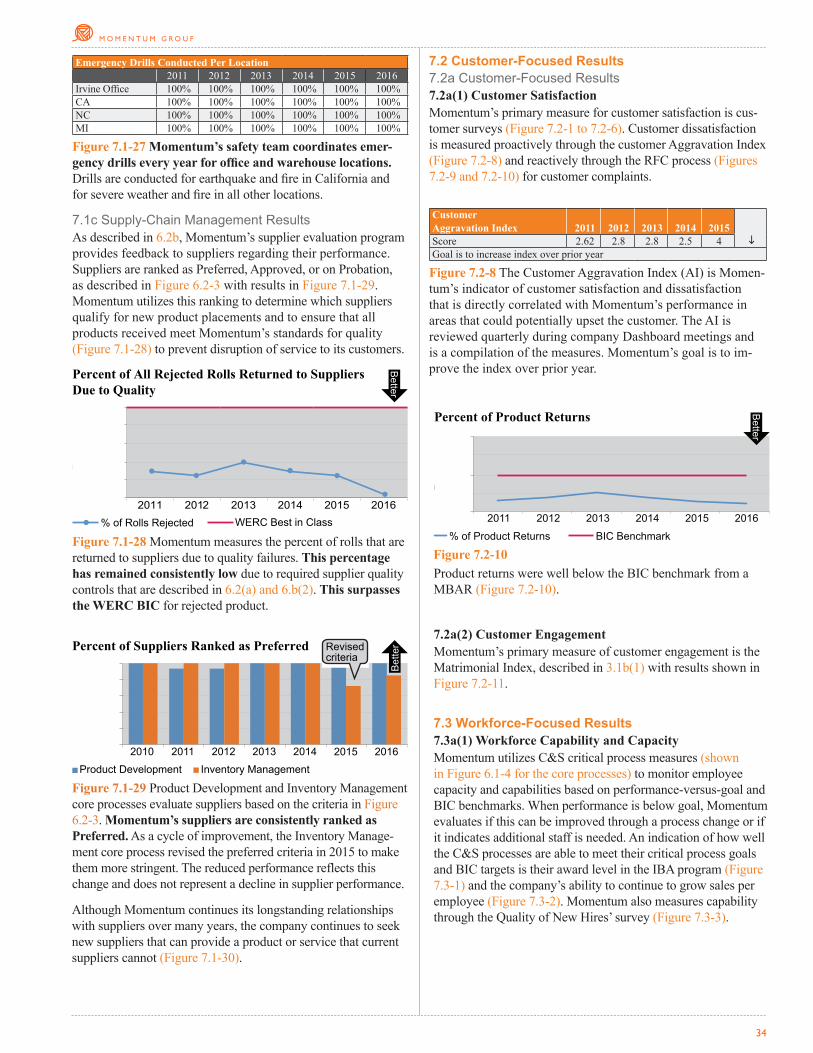
34
0.00%
0.20%
0.40%
0.60%
0.80%
1.00%
Percent of All Rejected Rolls Returned to Suppliers Due to Quality
% of Rolls Rejected
Per
cent
Better
Figure 7.1-28 Momentum measures the percent of rolls that are returned to suppliers due to quality failures. This percentage has remained consistently low due to required supplier quality controls that are described in 6.2(a) and 6.b(2). This surpasses the WERC BIC for rejected product.
WERC Best in Class is Below 1%2011 2012 2013 2014 2015 2016
100%
10
0%
100%
82
%
92%
10
0%
93%
10
0%
100%
10
0%
100%
10
0%
0% 20% 40% 60% 80%
100%
2010 2011 2012 2013 2014
Percent of Suppliers Ranked as Preferred
Product Development Inventory Management
Per
cent
Figure 7.1-29 Product Development and Inventory Management core processes evaluate suppliers based on the criteria in Figure 6.2-3. Momentum’s suppliers are consistently ranked as Preferred. As a cycle of improvement, the Inventory Manage-ment core process revised the preferred criteria in 2015 to make them more stringent. The reduced performance reflects this change and does not represent a decline in supplier performance.
100%
73
%
2015 2016
Bet
ter
Revised criteria
Revised criteria
Emergency Drills Conducted Per Location 2011 2012 2013 2014 2015 2016
Irvine Office 100% 100% 100% 100% 100% 100%CA 100% 100% 100% 100% 100% 100%NC 100% 100% 100% 100% 100% 100%MI 100% 100% 100% 100% 100% 100%
Figure 7.1-27 Momentum’s safety team coordinates emer-gency drills every year for office and warehouse locations. Drills are conducted for earthquake and fire in California and for severe weather and fire in all other locations.
7.1c Supply-Chain Management ResultsAs described in 6.2b, Momentum’s supplier evaluation program provides feedback to suppliers regarding their performance. Suppliers are ranked as Preferred, Approved, or on Probation, as described in Figure 6.2-3 with results in Figure 7.1-29. Momentum utilizes this ranking to determine which suppliers qualify for new product placements and to ensure that all products received meet Momentum’s standards for quality (Figure 7.1-28) to prevent disruption of service to its customers.
7.2 Customer-Focused Results7.2a Customer-Focused Results 7.2a(1) Customer SatisfactionMomentum’s primary measure for customer satisfaction is cus-tomer surveys (Figure 7.2-1 to 7.2-6). Customer dissatisfaction is measured proactively through the customer Aggravation Index (Figure 7.2-8) and reactively through the RFC process (Figures 7.2-9 and 7.2-10) for customer complaints.
Although Momentum continues its longstanding relationships with suppliers over many years, the company continues to seek new suppliers that can provide a product or service that current suppliers cannot (Figure 7.1-30).
Customer Aggravation Index
2011
2012
2013
2014
2015
i Score 2.62 2.8 2.8 2.5 4Goal is to increase index over prior year
Figure 7.2-8 The Customer Aggravation Index (AI) is Momen-tum’s indicator of customer satisfaction and dissatisfaction that is directly correlated with Momentum’s performance in areas that could potentially upset the customer. The AI is reviewed quarterly during company Dashboard meetings and is a compilation of the measures. Momentum’s goal is to im-prove the index over prior year.
0%
1%
2%
2011 2012 2013 2014 2015 2016
Percent of Product Returns
% of Product Returns BIC Benchmark 1.00%
Better
Per
cent
Figure 7.2-10Product returns were well below the BIC benchmark from a MBAR (Figure 7.2-10).
7.2a(2) Customer Engagement Momentum’s primary measure of customer engagement is the Matrimonial Index, described in 3.1b(1) with results shown in Figure 7.2-11.
7.3 Workforce-Focused Results 7.3a(1) Workforce Capability and Capacity Momentum utilizes C&S critical process measures (shown in Figure 6.1-4 for the core processes) to monitor employee capacity and capabilities based on performance-versus-goal and BIC benchmarks. When performance is below goal, Momentum evaluates if this can be improved through a process change or if it indicates additional staff is needed. An indication of how well the C&S processes are able to meet their critical process goals and BIC targets is their award level in the IBA program (Figure 7.3-1) and the company’s ability to continue to grow sales per employee (Figure 7.3-2). Momentum also measures capability through the Quality of New Hires’ survey (Figure 7.3-3).

35
2.87
2.
72
2.59
2.
86
2.4
2.88
2.33
2.
88
2.71
2.
54
0
1
2
3
4
2010 2011 2012 2013 2014
# of
Em
ploy
ees
Capacity Ratios
Ratio of Sales Reps per Inside Sales Agent Ratio of Non Sales Employees to Sales Reps
Figure 7.3-5 A capacity measure for Momentum is the number of Inside Sales agents available to support the Sales Reps. Through learning and measuring, Momentum has accomplished this goal since 2010. An additional measure is the number of non-sales staff to support the increase in sales and Sales Reps. This is also reflected in the Sales per Employee measure in Figure 7.3-2 where sales growth is supported without additional headcount.
2.44
2.
82
2015
2.35
2.
85
2016
$1.0
$1.1
$1.1
$1.2
$1.3
$1.4
$1.5$0.4
$0.8
$1.2
$1.6
2010 2011 2012 2013 2014 2015 2016
Average Sales Per Sales Rep
Sales Per Sales Rep Goal
Mill
ions
Figure 7.3-7 The Sales core process has successfully increased its average sales per Sales Rep. This is an indication of increased effectiveness and capabilities of the Sales force.
$0.0
Bet
ter
7.3a(2) Workforce ClimateMomentum’s measures for workforce climate include safety measures (Figure 7.3-8); profit sharing (Figure 7.3-9); and benefit participation (Figure 7.3-10).
$0 $1,000 $2,000 $3,000 $4,000 $5,000 $6,000 $7,000 $8,000
Cash Profit Sharing by Year
Dol
lars
Figure 7.3-9 Momentum’s strong company culture believes insharing in Momentum’s success. Employees have received a profit sharing check every year except for 2001 and 2009 since Momentum’s inception.
2010 2011 2012 2013 2014 2015
Bet
ter
$1.0
$1.1
$1.1
$1.2
$1.3
$1.4
$1.5$0.4
$0.8
$1.2
$1.6
2010 2011 2012 2013 2014 2015 2016
Average Sales Per Sales Rep
Sales Per Sales Rep Goal
Mill
ions
Figure 7.3-7 The Sales core process has successfully increased its average sales per Sales Rep. This is an indication of increased effectiveness and capabilities of the Sales force.
$0.0
Bet
ter
7.3a(3) Workforce EngagementMomentum is characterized by an engaged workforce. This is demonstrated by performing better than BIC in employee turn-over (Figure 7.3-11) and in a third-party employee engagement
0%
50%
100%
2010 2011 2012 2013 2014 2015 2015 Wellness on-site
Percent of Employee Benefit Participation
% of 401K Participation 401K Benchmark % of Wellness Participation Wellness Benchmark
Per
cent
Figure 7.3-10 Momentum offers generous benefits as detailedin Figure 5.1-1, and measures participation in 401(k) retirement savings plans and in Momentum’s Wellness program. Momen-tum surpasses BIC benchmarks of 67% 401(k) participation. In 2015 Momentum began measuring Wellness participation on-site versus remote employees working from home. For on-site employees participation was 63% and overall was 50%; compared to BIC benchmark of 50% Momentum offers 401(k) training to all employees through site visits and webinars and has a wellness action team to promote wellness activities for all locations.
2016
Bet
ter
Safety GoalsMeasure 2011 2012 2013 2014 2015 2016# of Lost-time Accidents 0 0 0 0 0 0Frequency Measure 2011 2012 2013 2014 2015 2016Semi-annual Safety Training Y Y Y Y Y YSemi-annual Environmental Reviews Y Y Y Y Y YSemi-annual Housekeeping Reviews Y Y Y Y Y YSemi-annual Job Safety Analysis Y Y Y Y Y Y
Figure 7.3-8 Momentum has not incurred any lost time accidents at any location and has accomplished its safety goals every year since 2011.
Number of Workgroups in Each Award Level Per YearAward Level 2010 2011 2012 2013 2014 2015Bronze 0 0 0 0 0 0Silver 5 0 0 0 5 2Gold 5 9 8 3 6 8Platinum 1 2 3 8 0 1
Figure 7.3-1 Momentum’s C&S processes demonstrate con-tinuous improvement in their processes and ability to meet critical process measures goals and BIC targets as reflected in the progression of awards from Bronze to Silver. Due to the number of Platinum and Gold winners in 2013, Momentum raised the level of difficulty of the IBA criteria, giving more emphasis to learning and innovation and the ability to quantify results. The lower scores in 2014 and 2015 reflect this change and are not a reflection of lesser performance.
All Hires Rating 2011 2012 2013 2014 2015 2016Customer Fit High High High High High HighCultural Fit High High High High High HighSuccess Rate High High High High High HighSales Rep Rating 2011 2012 2013 2014 2015 2016SR Customer Fit High High High High Very High HighSR Cultural Fit High High High High High HighSR Success Rate High High High High High High
Figure 7.3-3 Quality of Hire is a critical process measure for the HR support process. The goal is for new hires to be ranked “high” or “very high” in the categories listed by the hiring man-ager 90 days after new employee placement. Due to the volume of new Sales Reps, new hires have been segmented since 2012. Since 2011, Momentum’s new hire placements have met the goal overall, as well as for Sales Reps specifically.
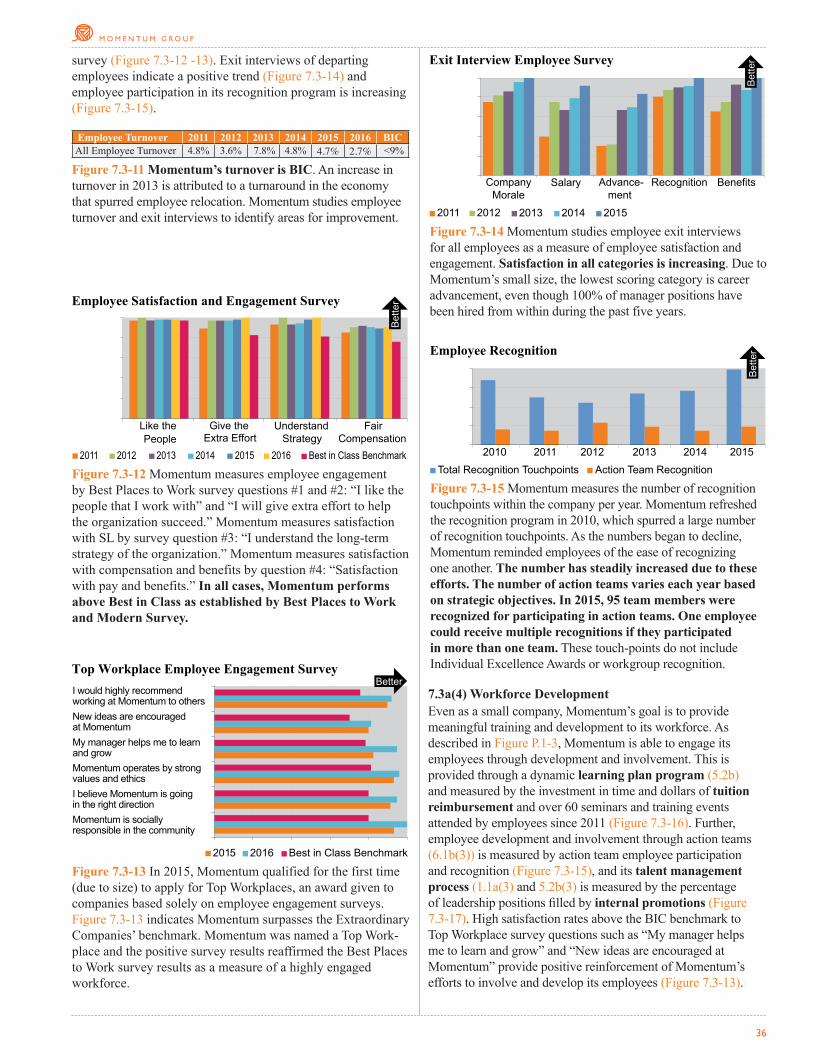
36
Employee Turnover 2011 2012 2013 2014 2015 2016 BICAll Employee Turnover 4.8% 3.6% 7.8% 4.8% 4.7% 2.7% <9%
Figure 7.3-11 Momentum’s turnover is BIC. An increase in turnover in 2013 is attributed to a turnaround in the economy that spurred employee relocation. Momentum studies employee turnover and exit interviews to identify areas for improvement. 20152011 2012 2013 2014
100%
92%
83%
100%
100%
75%
40%
30%
80%
65%
81%
75%
31%
88%
75%
86%
67%
67%
89%
93%
96%
79%
70%
92%
88%
0%
20%
40%
60%
80%
100%
CompanyMorale
Salary Advance-ment
Recognition Benefits
Sat
isfa
ctio
n Le
vel
Exit Interview Employee Survey
Figure 7.3-14 Momentum studies employee exit interviewsfor all employees as a measure of employee satisfaction and engagement. Satisfaction in all categories is increasing. Due to Momentum’s small size, the lowest scoring category is career advancement, even though 100% of manager positions have been hired from within during the past five years.
Bet
tersurvey (Figure 7.3-12 -13). Exit interviews of departing
employees indicate a positive trend (Figure 7.3-14) and employee participation in its recognition program is increasing (Figure 7.3-15).
0
100
200
300
400
2010 2011 2012 2013 2014
# G
iven
Employee Recognition
Total Recognition Touchpoints Action Team Recognition
Bet
ter
Figure 7.3-15 Momentum measures the number of recognitiontouchpoints within the company per year. Momentum refreshed the recognition program in 2010, which spurred a large numberof recognition touchpoints. As the numbers began to decline, Momentum reminded employees of the ease of recognizing one another. The number has steadily increased due to these efforts. The number of action teams varies each year based on strategic objectives. In 2015, 95 team members were recognized for participating in action teams. One employee could receive multiple recognitions if they participated in more than one team. These touch-points do not include Individual Excellence Awards or workgroup recognition.
332
80 243
71 221
115
265
95 277
72
2015
395
95
7.3a(4) Workforce DevelopmentEven as a small company, Momentum’s goal is to provide meaningful training and development to its workforce. As described in Figure P.1-3, Momentum is able to engage its employees through development and involvement. This is provided through a dynamic learning plan program (5.2b) and measured by the investment in time and dollars of tuition reimbursement and over 60 seminars and training events attended by employees since 2011 (Figure 7.3-16). Further, employee development and involvement through action teams (6.1b(3)) is measured by action team employee participation and recognition (Figure 7.3-15), and its talent management process (1.1a(3) and 5.2b(3) is measured by the percentage of leadership positions filled by internal promotions (Figure 7.3-17). High satisfaction rates above the BIC benchmark to Top Workplace survey questions such as “My manager helps me to learn and grow” and “New ideas are encouraged at Momentum” provide positive reinforcement of Momentum’s efforts to involve and develop its employees (Figure 7.3-13).
0%
20%
40%
60%
80%
100%
Extra Effort Like thePeople
Give the Understand Strategy
Fair Compensation
Sat
isfa
ctio
n Le
vel
Employee Satisfaction and Engagement Survey
2015 2016 2011 2012 2013 2014 Best in Class Benchmark
Figure 7.3-12 Momentum measures employee engagementby Best Places to Work survey questions #1 and #2: “I like the people that I work with” and “I will give extra effort to help the organization succeed.” Momentum measures satisfaction with SL by survey question #3: “I understand the long-term strategy of the organization.” Momentum measures satisfaction with compensation and benefits by question #4: “Satisfaction with pay and benefits.” In all cases, Momentum performs above Best in Class as established by Best Places to Work and Modern Survey.
Bet
ter
I would highly recommend working at Momentum to othersNew ideas are encouraged at MomentumMy manager helps me to learn and growMomentum operates by strong values and ethicsI believe Momentum is going in the right directionMomentum is socially responsible in the community
Top Workplace Employee Engagement Survey
Best in Class Benchmark
Figure 7.3-13 In 2015, Momentum qualified for the first time (due to size) to apply for Top Workplaces, an award given to companies based solely on employee engagement surveys. Figure 7.3-13 indicates Momentum surpasses the Extraordinary Companies’ benchmark. Momentum was named a Top Work-place and the positive survey results reaffirmed the Best Places to Work survey results as a measure of a highly engaged workforce.
Better
2015 2016

37
7.4 Leadership and Governance Results 7.4a(1) LeadershipMomentum measures SLs’ communication and engagement with the workforce through the employee survey questions as stated in Figure 7.3-12: “I understand the long-term strategy of the organization.” By effective communication of Momentum’s vision, strategic plan, and action plans, employees are able to understand where Momentum is headed and how their work contributes to Momentum’s success. In 2015, Momentum received a Top Workplace award based on employee surveys. Employees confirmed trust in SLs’ leadership with a 91% agreement to the question: “I believe Momentum is going in the right direction” and 93% agreement with Momentum operates by strong values and ethics (Figure 7.3-13).
Figure 7.3-17 Although Momentum is a small company, the leadership team encourages promoting from within whenever possible. 73% of current managers were promoted from within during their tenure at Momentum.
1500
1550
1600
1650
1700
$0
$500
$1,000
$1,500
$2,000
$2,500
$3,000
2012 2013 2014 2015
Hou
rs
Total Training Hours and Training $ Per Employee
Total Training Hours Training $ Per Employee ATD $ Per Employee Benchmark
Dol
lars
Figure 7.3-16 represents the investment in training dollars and hours provided to employees from 2012 through 2015 through employee learning plans and tuition reimbursement. Momen-tum easily surpasses the Association for Training and Development training dollars benchmark. The 2015 ATD benchmark is not yet available.
Bet
ter
Governance AccountabilityRequirement Organization Frequency Major FindingsIncome Tax IRS Annual NoneSales Tax Various States Varies NonePayroll Taxes IRS/Various States Monthly NoneProperty Taxes CA, MI, NC Annual NoneCompliance Reporting
Lenders Quarterly None
Financial Results Board of Directors, Lenders
Monthly None
401(k) US Depart. of Labor Annual None
Figure 7.4-2 Momentum ensures fiscal accountability through a variety of external entities, with no major findings. Momentum undergoes a third-party audit every year of its financial results and of its 401(k) program. There have been no major findings during these annual audits.
7.4a(2) Governance
0 1 2 3 4 5
2012 2013 2014 Sco
re (o
ut o
f 5)
Satisfaction of External Auditors
Promptness of Returning Requests Accuracy of Information Completeness of Client Prepared Schedules
Figure 7.4-3 External Auditors conduct Momentum’s financial audits every year. After the audits, Momentum surveys their satisfaction regarding the audit process. Momentum has been conducting these surveys since 2012 and has received the highest score in every category. There have been zero recom-mendations issued to Momentum based on these audits.
2015 2016
Bet
ter
7.4a(3) Law and Regulation
Ethics2011 2012 2013 2014 2015 2016
Incidents of Unethical Behavior 0 0 0 0 0 0
Figure 7.4-7 Momentum lives its core value of honesty and fairness in all interactions. This is demonstrated by Momentum’s adherence to its ethical practices detailed in 1.2b(2), including an annual fraud and risk assessment by SLs and key manag-ers, and its history of zero recordable incidents of unethical behavior. Momentum’s employees also indicated in the Top Workplace employee survey that they believe Momentum operates by strong values and ethics (Figure 7.3-13).
7.4a(4) Ethics
ACT Performance Standards 2012 2013 2014 2015 2016Flammability 100% 100% 100% 100% 100%Wet&Dry Crocking 100% 100% 100% 100% 100%Colorfastness to Light 100% 100% 100% 100% 100%Physical Properties 100% 100% 100% 100% 100%Abrasion 100% 100% 100% 100% 100%
Figure 7.4-6 All Momentum products consistently meet all ACT performance standards for commercial fabrics. These standards are integrated into the performance testing step of product design as demonstrated in Figure 6.1-1.
20%
40%
60%
80%
100%
2011 2012 2013 2014 2015 2016
Per
cent
Percent of all Momentum Textiles’ New Products that are REI
Momentum Textiles Competitor A Competitor C
Bet
ter
Figure 7.4-5 Momentum Textiles’ product line covers all markets except for Hospitality and the very high-end Office market. Since 2010, Momentum established the goal of having 100% of all introductions in this product line be REI from 2014 and beyond. Momentum has met this goal and has surpassed the competition for the past four years. Through this strategic objective, Momentum converted the entire product line to 100% REI products and accomplished this a year earlier than planned.
2017P 2018P Competitor B

38
7.4a(5) SocietyOne of Momentum’s dearest core values is bettering the world around us. It has become what Momentum is known for and what it strives for in its vision to become the undisputed leader in sustainable and innovative contract textiles. In the 2015 Top Workplace survey, 93% of employees agreed with the statements “My employer is socially responsible in the community” and “Momentum operates by strong values and ethics” (Figure 7.3-13). It has also become a strategic advantage as Momentum continually strives to look for alternatives that help the customer and the environment.
0% 20% 40% 60% 80%
100%
2010 2011 2012 2013 2014 2015 2016 2017P
Environmental Initiatives
% of Carbon Footprint Offset % of Solar Energy used in Irvine Office % of Reps Driving High Mileage Vehicles
Per
cent
Bet
ter
Figure 7.4-10 Since 2010, Momentum has offset its carbonfootprint through the Conservation Fund Go Zero program and has planted 4,254 trees to offset 3,560 tons of carbon. And in an effort to reduce carbon emissions, in 2013 Momentum initiated a Green automotive plan for Sales Reps. As they reach the end of the retention cycle for their vehicles, they are required to drive a high mileage vehicle (>35 mpg highway). In 2010, Momentum installed solar panels on the roof of its corporate office, a new HVAC system and energy efficient windows.
0
20000
40000
60000
80000
100000
120000
$0 $10 $20 $30 $40 $50 $60 $70 $80 $90
$100
2012 2013 2014 2015 2016 2017P 2018P
Num
ber o
f Mem
os
Dol
lars
in T
hous
ands
Memo Sample Returns and Cost Savings
Bet
ter
# of Memos Samples Returned Cost Savings
Figure 7.4-9 Since 2012 Momentum has given its customerthe ability to return unneeded memo samples to Momentum’s warehouse at no charge. Since its inception over 232,000 memo samples have been returned and diverted from landfills.
2011
2012
2013
2014
2015
2016
Donations Per Year
$ Donated Fabric Donated Y
ear
Figure 7.4-12 Momentum donates to various charitable organizations throughout the year. Most noteworthy are Feeding America where Momentum provides meals to those in need every holiday season; and Common Thread for the Cure where Momentum donates product proceeds from Silica and also donates a $1 donation for every online external customer survey received. In addition, Momentum offers a matching gift program that encourages employees to support education. Fabric donations are made to non-profit organizations that distribute the fabric to other non-profits in need.
Volunteer Hours 2011 2012 2013 2014 2015 2016Total Hours 986 1,073 1,231 970 1,386 1,440Hours/Employee 7.4 7.5 8.8 6.6 9.0 9.2
Figure 7.4-11 Momentum maintains a Community Involvement Action Team (CIA) that participates in regular charitable events with a focus on improving the local community. Volunteer hours average 1,100 hours per year and 7.9 hours per em-ployee from 2011-2015. The dip in 2014 was due to renovations in the Irvine office that prevented hosting CIA activities such as making sandwiches for the homeless in the office café.
7.4b Strategy Implementation Results Momentum’ results for building and strengthening its core competencies are detailed in Figures 7.4-13 and 7.4-14.
Momentum’s organizational strategy and action plans areestablished during the SPP described in 2.1a(1) and aredemonstrated in Figure 2.1-4. These are linked to key measuresper Category of Focus as described in Figure 7.4-15.
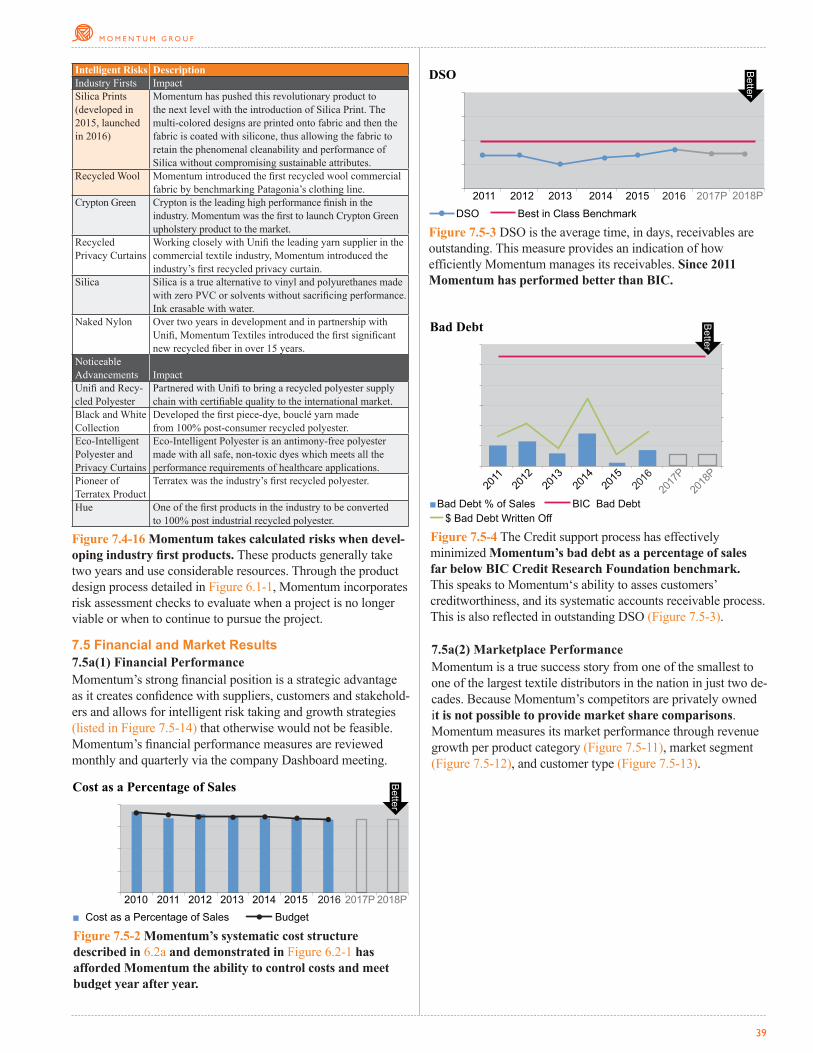
0%
10%
20%
30%
40%
2010 2011 2012 2013 2014 2015 2016 2017P 2018P
Cost as a Percentage of Sales
Cost as a Percentage of Sales Budget
Better
% o
f Sal
es
Figure 7.5-2 Momentum’s systematic cost structure described in 6.2a and demonstrated in Figure 6.2-1 has afforded Momentum the ability to control costs and meet budget year after year.
39
7.5 Financial and Market Results7.5a(1) Financial PerformanceMomentum’s strong financial position is a strategic advantage as it creates confidence with suppliers, customers and stakehold-ers and allows for intelligent risk taking and growth strategies (listed in Figure 7.5-14) that otherwise would not be feasible. Momentum’s financial performance measures are reviewed monthly and quarterly via the company Dashboard meeting.
Intelligent Risks DescriptionIndustry Firsts ImpactSilica Prints (developed in 2015, launched in 2016)
Momentum has pushed this revolutionary product to the next level with the introduction of Silica Print. The multi-colored designs are printed onto fabric and then the fabric is coated with silicone, thus allowing the fabric to retain the phenomenal cleanability and performance of Silica without compromising sustainable attributes.
Recycled Wool Momentum introduced the first recycled wool commercial fabric by benchmarking Patagonia’s clothing line.
Crypton Green Crypton is the leading high performance finish in the industry. Momentum was the first to launch Crypton Green upholstery product to the market.
Recycled Privacy Curtains
Working closely with Unifi the leading yarn supplier in the commercial textile industry, Momentum introduced the industry’s first recycled privacy curtain.
Silica Silica is a true alternative to vinyl and polyurethanes made with zero PVC or solvents without sacrificing performance. Ink erasable with water.
Naked Nylon Over two years in development and in partnership with Unifi, Momentum Textiles introduced the first significant new recycled fiber in over 15 years.
Noticeable Advancements
Impact
Unifi and Recy-cled Polyester
Partnered with Unifi to bring a recycled polyester supply chain with certifiable quality to the international market.
Black and White Collection
Developed the first piece-dye, bouclé yarn made from 100% post-consumer recycled polyester.
Eco-Intelligent Polyester and Privacy Curtains
Eco-Intelligent Polyester is an antimony-free polyester made with all safe, non-toxic dyes which meets all the performance requirements of healthcare applications.
Pioneer of Terratex Product
Terratex was the industry’s first recycled polyester.
Hue One of the first products in the industry to be converted to 100% post industrial recycled polyester.
Figure 7.4-16 Momentum takes calculated risks when devel-oping industry first products. These products generally take two years and use considerable resources. Through the product design process detailed in Figure 6.1-1, Momentum incorporates risk assessment checks to evaluate when a project is no longer viable or when to continue to pursue the project.
30
32
34
36
38
2011 2012 2013 2014
# of
Day
s
DSO
DSO Best in Class Benchmark
Figure 7.5-3 DSO is the average time, in days, receivables are outstanding. This measure provides an indication of how efficiently Momentum manages its receivables. Since 2011 Momentum has performed better than BIC.
Better
2015 2016 2017P 2018P
$0
$20
$40
$60
$80
$100
0.00%
0.05%
0.10%
0.15%
0.20%
0.25%
0.30%
2011
20
12
2013
20
14
2015
201
6
2017
P
2018
P
Bad Debt Better
Per
cent
Dol
lars
in T
hous
ands
Bad Debt % of Sales BIC Bad Debt$ Bad Debt Written Off
Figure 7.5-4 The Credit support process has effectively minimized Momentum’s bad debt as a percentage of sales far below BIC Credit Research Foundation benchmark. This speaks to Momentum‘s ability to asses customers’ creditworthiness, and its systematic accounts receivable process. This is also reflected in outstanding DSO (Figure 7.5-3).
7.5a(2) Marketplace Performance Momentum is a true success story from one of the smallest to one of the largest textile distributors in the nation in just two de-cades. Because Momentum’s competitors are privately owned it is not possible to provide market share comparisons. Momentum measures its market performance through revenue growth per product category (Figure 7.5-11), market segment (Figure 7.5-12), and customer type (Figure 7.5-13).

40
$0
$20
$40
$60
$80
$100
$120
1993
19
94
1995
19
96
1997
19
98
1999
20
00
2001
20
02
2003
20
04
2005
20
06
2007
20
08
2009
20
10
2011
20
12
2013
20
14
2015
201
6
$ in
Millio
ns
Track Record of Consistent Revenue Growth
Figure 7.5-5 Momentum has increased sales every year since its inception except for 2001 due to 9/11 terrorist attack and 2009 due to the global recession, with both of these factors larger than the commercial fabric industry and out of Momentum’s control. Momentum’s consistent growth is an indication of Momentum’s systematic process of strategic plan execution and continuous improvement of products and services year after year.