male and female ethiopian and kenyan runners are the … et al... · of east african runners by...
TRANSCRIPT
Knechtle et al. SpringerPlus (2016) 5:223 DOI 10.1186/s40064-016-1915-0
RESEARCH
Male and female Ethiopian and Kenyan runners are the fastest and the youngest in both half and full marathonBeat Knechtle1,2*, Pantelis T. Nikolaidis3, Vincent O. Onywera4, Matthias A. Zingg2, Thomas Rosemann2 and Christoph A. Rüst2
Abstract
In major marathon races such as the ‘World Marathon Majors’, female and male East African runners particularly from Ethiopia and Kenya are the fastest. However, whether this trend appears for female and male Ethiopians and Kenyans at recreational level runners (i.e. races at national level) and in shorter road races (e.g. in half-marathon races) has not been studied yet. Thus, the aim of the present study was to examine differences in the performance and the age of female and male runners from East Africa (i.e. Ethiopians and Kenyans) between half- and full marathons. Data from 508,108 athletes (125,894 female and 328,430 male half-marathoners and 10,205 female and 43,489 male maratho-ners) originating from 126 countries and competing between 1999 and 2014 in all road-based half-marathons and marathons held in one country (Switzerland) were analysed using Chi square (χ2) tests, mixed-effects regression analyses and one-way analyses of variance. In half-marathons, 48 women (0.038 %) and 63 men (0.019 %) were from Ethiopia and 80 women (0.063 %) and 134 men (0.040 %) from Kenya. In marathons, three women (0.029 %) and 15 men (0.034 %) were from Ethiopia and two women (0.019 %) and 33 men (0.075 %) from Kenya. There was no statistically significant association between the nationality of East Africans and the format of a race. In both women and men, the fastest race times in half-marathons and marathons were achieved by East African runners (p < 0.001). Ethiopian and Kenyan runners were the youngest in both sexes and formats of race (p < 0.001). In summary, women and men from Ethiopia and Kenya, despite they accounted for <0.1 % in half-marathons and marathons, achieved the fastest race times and were the youngest in both half-marathons and marathons. These findings confirmed in the case of half-marathon the trend previously observed in marathon races for a better performance and a younger age in East African runners from Ethiopia and Kenya.
Keywords: Age, Athletes, Endurance, Sex, Long-distance, Nationality, Running
© 2016 Knechtle et al. This article is distributed under the terms of the Creative Commons Attribution 4.0 International License (http://creativecommons.org/licenses/by/4.0/), which permits unrestricted use, distribution, and reproduction in any medium, provided you give appropriate credit to the original author(s) and the source, provide a link to the Creative Commons license, and indicate if changes were made.
BackgroundMarathon and half-marathon races are very popular running events held all over the world with an increas-ing number of both races and participants during the last decades. For instance, in the USA, there were more than 1200 marathons held in 2014 compared to about 300 marathons held in 2000 (www.runningusa.org/2015-national-runner-survey). The number of successful
marathon finishers increased from 25,000 in 1976 to the all-time high of 550,637 in 2014. Compared to mara-thons, however, most of the runners competed in the USA in half-marathons. The number of successful half-marathoners increased from 303,000 in 1990 to the all-time high of 2,046,600 in 2014 (www.runningusa.org/half-marathon-report-2015). In fact, 3.7 times more half-marathoners than marathoners competed in the USA in 2014. In smaller countries such as Switzerland in Europe, a total of 226,754 half-marathoners and 86,419 maratho-ners competed between 2000 and 2010 (Anthony et al. 2014). In other terms, 2.6 times more half-marathoners competed than marathoners. In 2010, 8690 women and
Open Access
*Correspondence: [email protected] 1 Facharzt FMH für Allgemeinmedizin, Gesundheitszentrum St. Gallen, Vadianstrasse 26, St. Gallen 9001, SwitzerlandFull list of author information is available at the end of the article
Page 2 of 33Knechtle et al. SpringerPlus (2016) 5:223
21,583 men finished a half-marathon in comparison to 2904 female and 9333 male finishers in 2000, respectively, corresponding to an increase of 299 % for women and of 231 % for men over 10 years. In contrast, the number of male and female full marathoners increased until 2005 only and decreased thereafter (Anthony et al. 2014).
The dominance of East-African women and men in marathon running is well known (Hamilton 2000; Ony-wera et al. 2006; Tucker et al. 2015; Wilber and Pitsi-ladis 2012). Athletes from both Ethiopia and Kenya dominate marathon running for a long time (www.iaaf.org). In the top list of the International Association of Athletics Federations (IAAF) for male marathoners, the first best 37 marathon race times were achieved by ath-letes from Ethiopia and Kenya (www.iaaf.org/records/toplists/road-running/marathon/outdoor/men/senior). In women, however, the three fastest marathon race times were achieved by an athlete from Great Britain fol-lowed by two female marathoners from Kenya (www.iaaf.org/records/toplists/road-running/marathon/outdoor/women/senior). In the ‘World Marathon Majors’ with the largest city marathons worldwide, female and male champions are exclusively from East African particularly from Ethiopia and Kenya (www.worldmarathonmajors.com/champions/current-champions).
The reasons for the dominance of East-African run-ners in long and middle distance running events such as marathons included environmental conditions such as a specific geographic background (Onywera et al. 2006; Scott et al. 2003; Tucker et al. 2015). The dominance of East-African distance runners is primarily a Kenyan phe-nomenon, with majority of the Kenyan runners origi-nating from the Kalenjin tribe in general and the Nandi sub-tribe in particular (Onywera et al. 2006; Tucker et al. 2015). Similar to Kenyan runners, elite Ethiopian runners are also of a distinct environmental background where marathoners mainly originate from the altitudinous regions of Arsi and Shewa (Scott et al. 2003).
However, there is paucity of information with regards to basic characteristics such as age and trends in per-formance of East-African half-marathoners (Aschmann et al. 2013; Cribari et al. 2013). These studies investigated all African half- and full marathoners competing in one country (Switzerland) together without a separation of East-African runners in their nationalities (Aschmann et al. 2013) or investigated a limited sample of the best athletes (Cribari et al. 2013). Indeed, East African run-ners particularly those from Ethiopia and Kenya account for the largest percentage of African runners in half-marathon and marathon (Aschmann et al. 2013). A recent study showed different barriers across both sex and distance (Wegner et al. 2015); hence, these trends might vary between half-marathon and marathon. The
knowledge of East African’s basic characteristics such as age, participation and performance trends might help coaches, fitness trainers and sports scientists to improve their understanding of half-marathon’s demands.
Therefore, the aim of this study was to investigate per-formance and age of Ethiopian and Kenyan half- and full marathoners who competed between 1999 and 2014 in races held within one country (Switzerland) in a sample of more than 500,000 successful finishers. We hypoth-esized that female and male runners from Ethiopia and Kenya would also be the fastest in half-marathon races.
MethodsEthicsThe study was approved by the Institutional Review Board of St. Gallen, Switzerland, with waiver of the requirement for informed consent given that the study involved the analysis of publicly available data.
Data collection and data analysisAll half-marathons and marathons held in Switzerland from 1999 to 2014 were identified by using ‘Laufkalender Schweiz’ (www.laufkalender.ch). Since 1999, all running races in Switzerland started with an electronic chip sys-tem and full race results (i.e. name, age, sex, nationality and race time of the finishers) were available since then on the website of the specific races. Of all races, only those half-marathons and marathons were considered which were held on a road, not on a trail. No mountain marathons were included; start and finish of the race had to be on the same altitude. Athletes with missing age and/or missing nationality were excluded from data analysis. In order to avoid a selection bias due to a limitation to top runners, we considered all finishers from all coun-tries. To investigate a trend in participation and perfor-mance, athletes from countries where at least one women and/or one man competed in at least 8 years (i.e. half of the investigated period of time) were considered.
Statistical analysisEach set of data was tested for normal distribution (D’Agostino and Pearson omnibus normality test) and for homogeneity of variances (Levine’s test) prior to sta-tistical analyses. Trends in participation across calendar years were analysed using regression analysis with linear growth equation models. Differences in the participation of East African runners by nationality and sex to half-marathons and marathon were examined by using Chi square (χ2) test. To investigate changes in performance across calendar years, we used a mixed-effects regression model with running speed as the dependent variable. We analysed women and men separately for each country for both half-marathon and marathon and included calendar
Page 3 of 33Knechtle et al. SpringerPlus (2016) 5:223
year, sex, centered age, and squared centered age as fixed variables. To investigate changes in age across calendar years, we used a mixed-effects regression model with age as the dependent variable. For the change in age over time, we combined women and men for each country and included sex and calendar year as fixed variables. Differences in age and performance between athletes from multiple countries were compared using one-way analysis of variance (ANOVA) with subsequent Tukey’s multiple comparison tests with a single pooled variance. Statistical analyses were performed using IBM SPSS Sta-tistics (Version 22, IBM SPSS, Chicago, IL, USA) and GraphPad Prism (Version 6.01, GraphPad Software, La Jolla, CA, USA). Significance was accepted at p < 0.05 (two-sided for t tests). Data in the text and tables are given as mean ± standard deviation (SD).
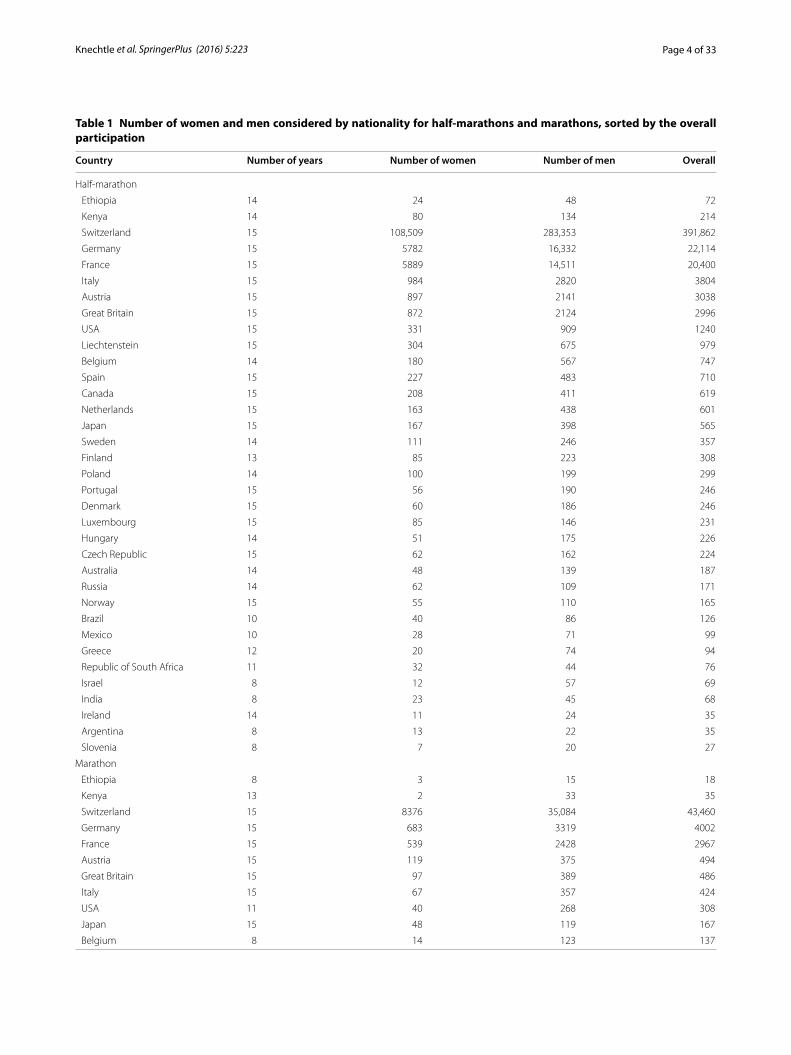
ResultsParticipationData from a total of 508,108 (125,894 female and 328,430 male half-marathoners and 10,205 female and 43,489 male marathoners) athletes was considered. These run-ners originated from a total of 126 countries spread around the globe. Table 1 summarizes the athletes from the considered countries for data analysis across calendar years in half-marathons (35 countries) and marathons (15 countries).
In half-marathons, 48 women (0.038 %) and 63 men (0.019 %) originated from Ethiopia and 80 women (0.063 %) and 134 men (0.040 %) from Kenya. In mara-thons, three women (0.029 %) and 15 men (0.034 %) were from Ethiopia and two women (0.019 %) and 33 men (0.075 %) from Kenya. There was no statistically signifi-cant association between the nationality of East Africans and the format of the race [χ2(1) = 0.001, p = 0.978]; that was, both Ethiopians and Kenyans equally participated to half-marathons versus marathons. Also, there was no association between male East Africans and the format of the race [χ2(1) = 0.001, p = 0.922]; i.e. both male Ethio-pians and Kenyans accounted equally to the two formats.
Most of the successful finishers originated from Switzerland, Germany and France in both half-mara-thons and marathons. In half-marathons, the number of women (r2 = 0.98, p < 0.0001) and men (r2 = 0.98, p < 0.0001) increased significantly. Similarly, the num-ber of women (r2 = 0.46, p = 0.0041) and men (r2 = 0.51, p = 0.0019) increased significantly in marathons. Regard-ing the considered countries, the number of female half-marathoners from Canada (r2 = 0.81, p = 0.002), Germany (r2 = 0.97, p = 0.005), Switzerland (r2 = 0.97, p = 0.005) and Belgium (r2 = 0.72, p < 0.0001) increased significantly. For male half-marathoners, the num-ber of participants from France (r2 = 0.97, p = 0.018),
Great Britain (r2 = 0.88, p = 0.036), Principality of Liechtenstein (r2 = 0.87, p < 0.0001), Poland (r2 = 0.65, p < 0.0001), South Africa (r2 = 0.63, p = 0.006) and Argentina (r2 = 0.70, p < 0.0001) increased significantly. In marathoners, there was no significant increase in the number of men regarding the country. In women, how-ever, participants from France (r2 = 0.46, p = 0.0275) and Japan (r2 = 0.47, p = 0.0039) increased significantly their numbers.
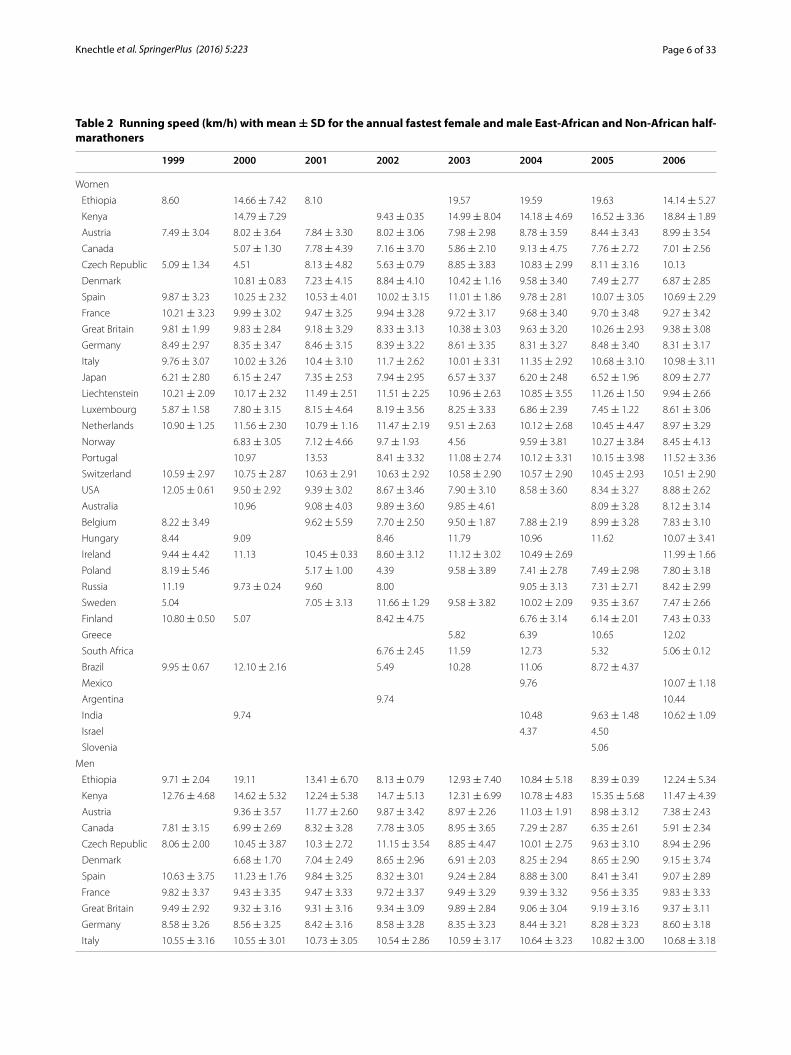
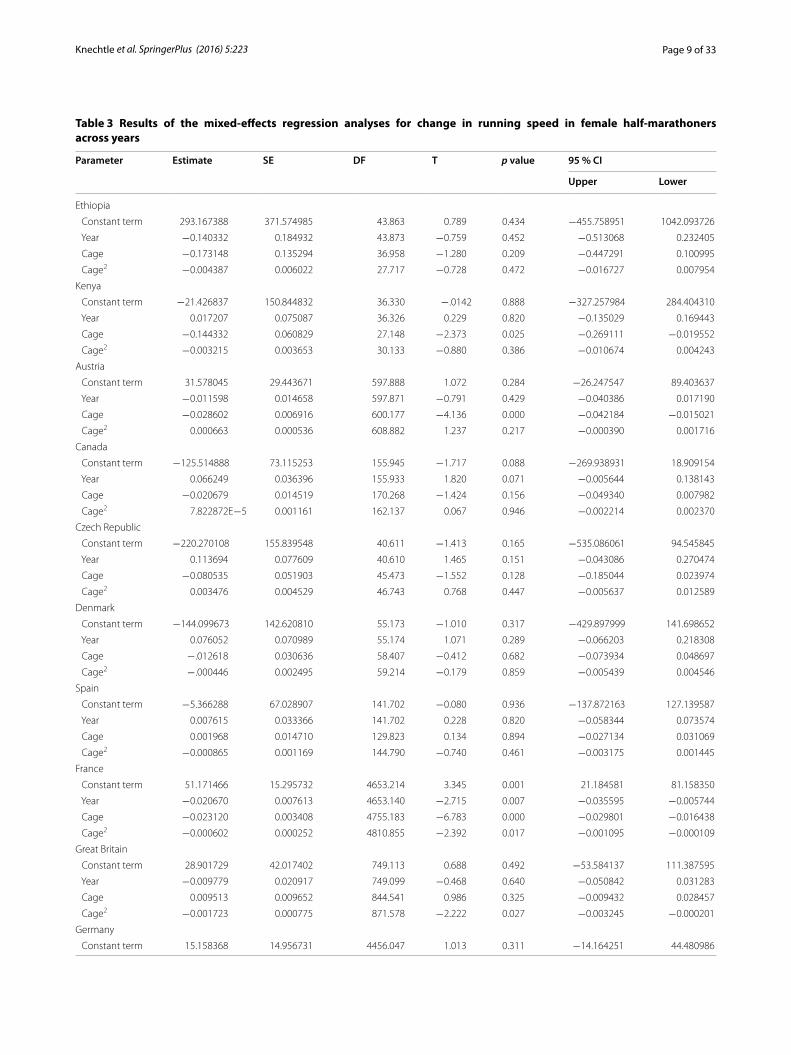
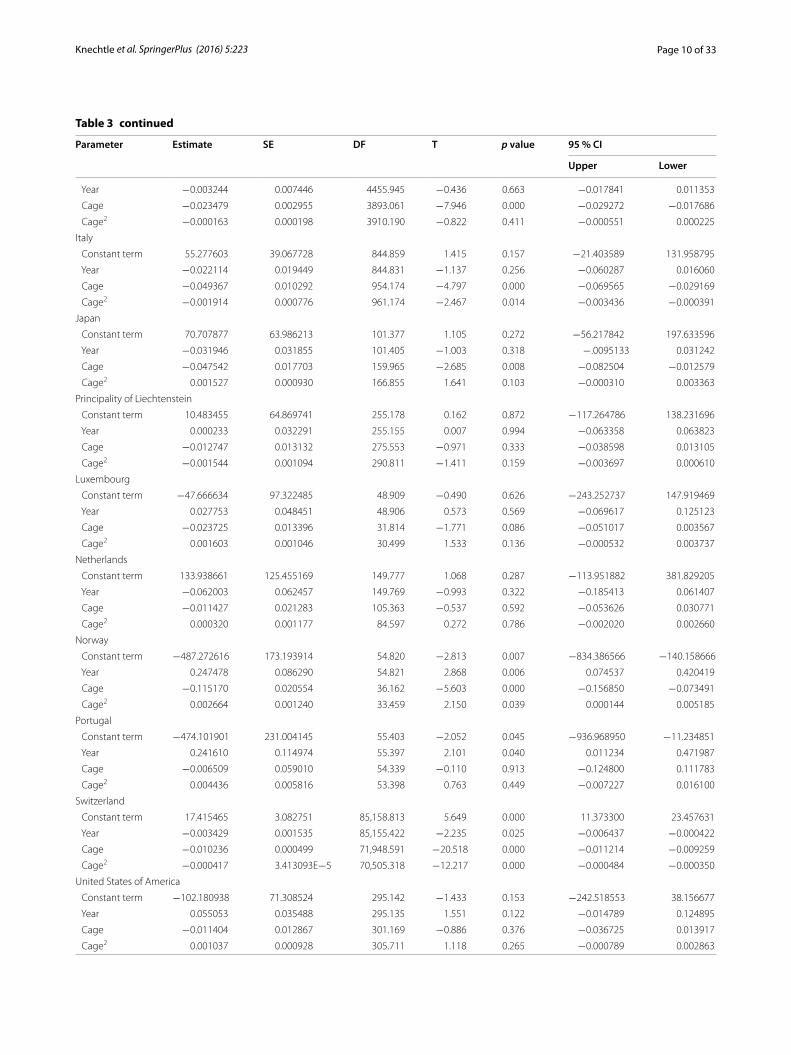
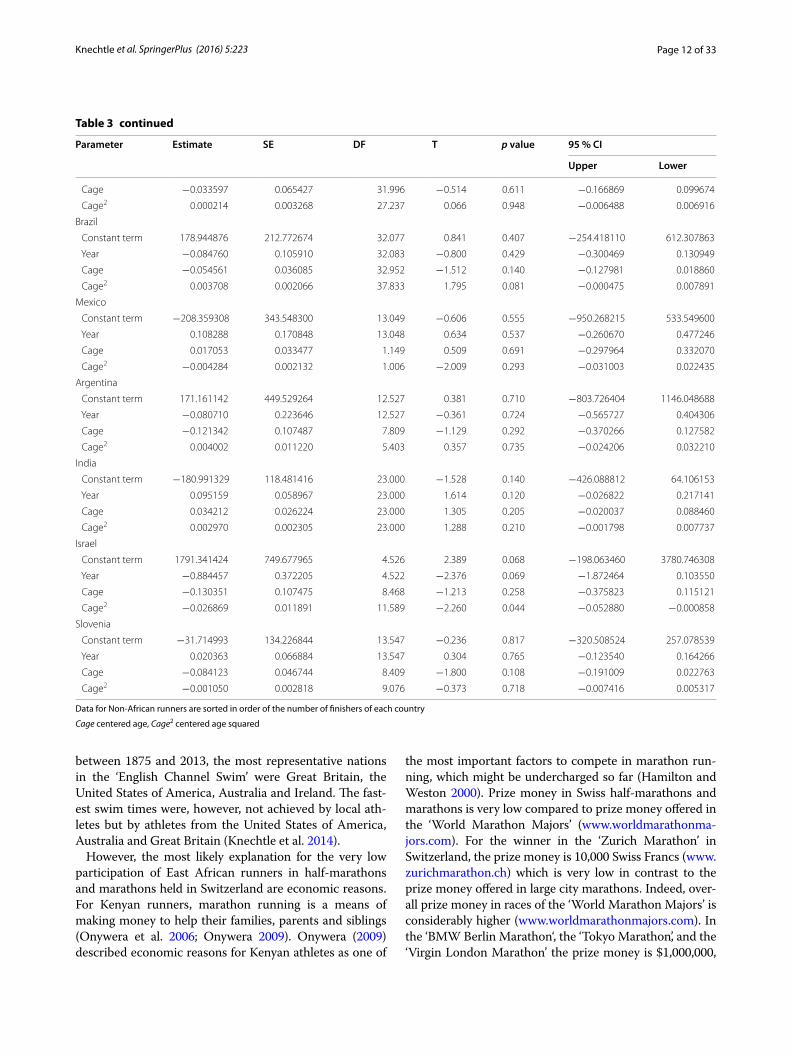
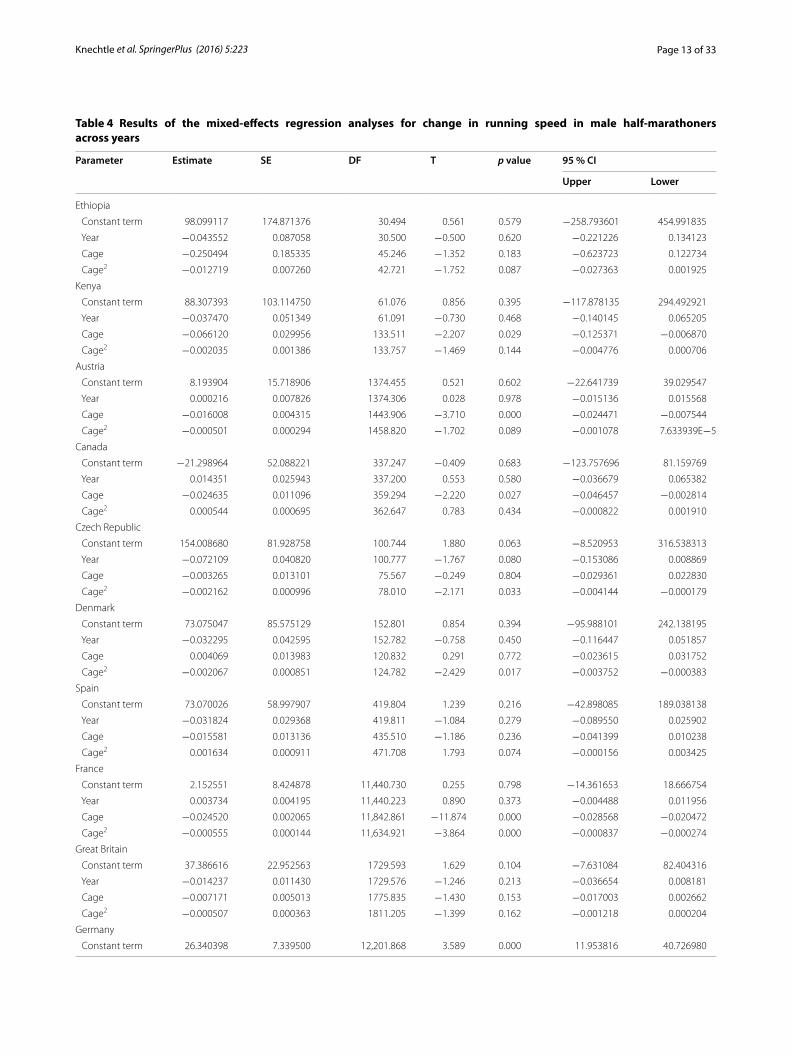
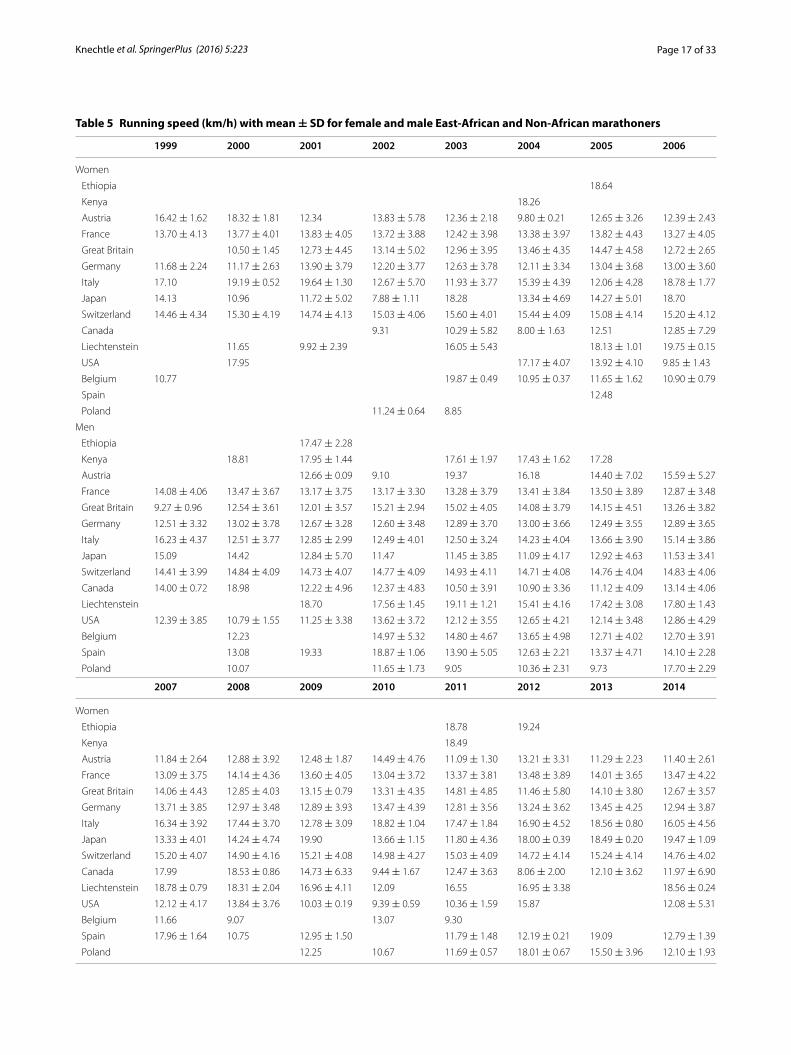
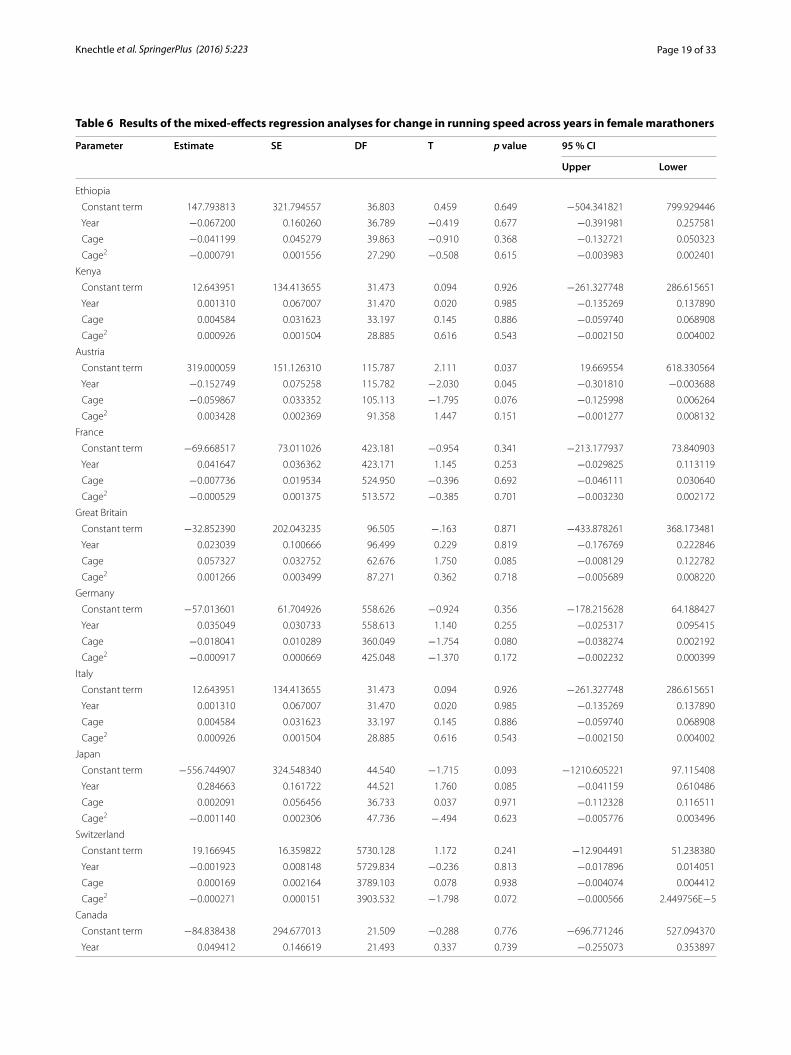
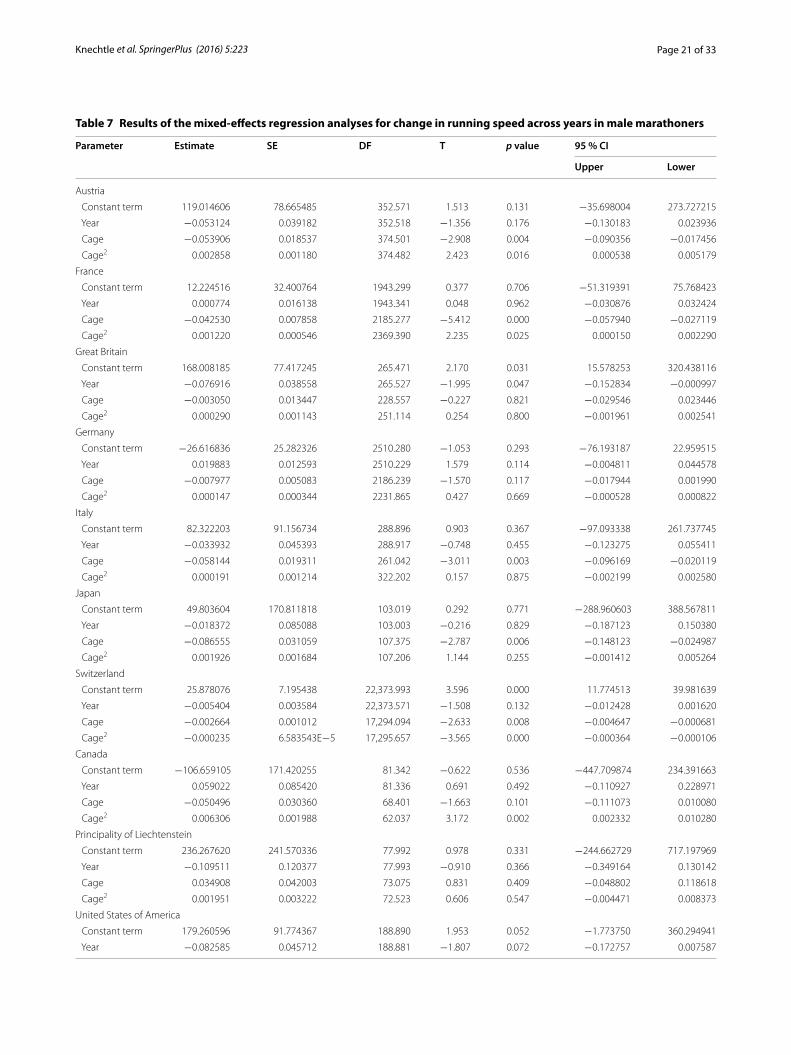
Trends in performance and age across calendar yearsTable 2 shows the running speed of the female and male half-marathoners. Running speed decreased significantly in women from France, Switzerland, and Australia, but increased in women from Norway and Portugal (Table 3). In men, running speed decreased in athletes from Ger-many (Table 4). Table 5 presents running speed of female and male marathoners. Running speed remained unchanged in female marathoners (Table 6) but increased in British men (Table 7). Table 8 presents the age of the female and male half-marathoners. Age increased signifi-cantly across calendar years in women from Austria and Norway and in men from Japan and Norway (Table 9). In marathoners (Table 10), age decreased significantly in men from Italy and Principality of Liechtenstein, but increased significantly in men from Poland (Table 11).
Performance of the fastest and age of the youngestTable 12 presents running speed and age of female and male half-marathoners and marathoners sorted from the fastest to the slowest and from the youngest to the oldest. In absolute values, women from Kenya and Ethiopia were running the fastest. Kenyan women were not faster than Ethiopian women (p > 0.05) but they were significantly faster than all other women (p < 0.001 to p < 0.0001). Ethiopian women were not faster than women from Kenya, Portugal, Principality of Liechtenstein and Hun-gary (p > 0.05), but significantly faster than all other women (p < 0.001 to p < 0.0001). For men, Kenyans and Ethiopians were running the fastest regarding in abso-lute terms. Kenyan men were not faster than Ethiopian men (p > 0.05), but significantly faster than all other men (p < 0.001 to p < 0.0001). Ethiopian men were not faster than men from Portugal, Principality of Liechtenstein, Italy, Switzerland and Hungary (p > 0.05), but signifi-cantly faster than all other men (p < 0.001 to p < 0.0001).
Considering age, women from Ethiopia and Kenya were the youngest in absolute terms. However, Ethio-pian women were not younger than women from Russia, Czech Republic, Argentina, India, Slovenia, Ireland, USA, Great Britain, Poland, Canada, Greece, Denmark and Spain (p > 0.05). Considering athletes from the other countries, women from Ethiopia were
Page 4 of 33Knechtle et al. SpringerPlus (2016) 5:223
Table 1 Number of women and men considered by nationality for half-marathons and marathons, sorted by the overall participation
Country Number of years Number of women Number of men Overall
Half-marathon
Ethiopia 14 24 48 72
Kenya 14 80 134 214
Switzerland 15 108,509 283,353 391,862
Germany 15 5782 16,332 22,114
France 15 5889 14,511 20,400
Italy 15 984 2820 3804
Austria 15 897 2141 3038
Great Britain 15 872 2124 2996
USA 15 331 909 1240
Liechtenstein 15 304 675 979
Belgium 14 180 567 747
Spain 15 227 483 710
Canada 15 208 411 619
Netherlands 15 163 438 601
Japan 15 167 398 565
Sweden 14 111 246 357
Finland 13 85 223 308
Poland 14 100 199 299
Portugal 15 56 190 246
Denmark 15 60 186 246
Luxembourg 15 85 146 231
Hungary 14 51 175 226
Czech Republic 15 62 162 224
Australia 14 48 139 187
Russia 14 62 109 171
Norway 15 55 110 165
Brazil 10 40 86 126
Mexico 10 28 71 99
Greece 12 20 74 94
Republic of South Africa 11 32 44 76
Israel 8 12 57 69
India 8 23 45 68
Ireland 14 11 24 35
Argentina 8 13 22 35
Slovenia 8 7 20 27
Marathon
Ethiopia 8 3 15 18
Kenya 13 2 33 35
Switzerland 15 8376 35,084 43,460
Germany 15 683 3319 4002
France 15 539 2428 2967
Austria 15 119 375 494
Great Britain 15 97 389 486
Italy 15 67 357 424
USA 11 40 268 308
Japan 15 48 119 167
Belgium 8 14 123 137
Page 5 of 33Knechtle et al. SpringerPlus (2016) 5:223
significantly younger (p < 0.001 to p < 0.0001). For men, runners from Kenya and Ethiopia were the youngest in absolute values. However, they were not younger than athletes from Russia, Czech Republic, Poland, South Africa, Canada, Australia, Argentina, India, Portugal, USA and Greece (p > 0.05) but significantly younger than men from all other countries (p < 0.001 to p < 0.0001).
In marathon, women from Ethiopia and Kenya were faster than women from all other countries (p < 0.001 to p < 0.0001). However, Ethiopian women were not faster than Kenyan women (p > 0.05). For men, the fastest running speeds were achieved by athletes from Kenya, Ethiopia and Principality of Liechtenstein. Ken-yan men were faster than men from all other countries (p < 0.001 to p < 0.0001) with the exception of Ethiopian men (p > 0.05). Ethiopian men were, however, not faster than men from Liechtenstein, Switzerland, Belgium, Spain, Italy, France, Great Britain, Germany and USA (p > 0.05).
Women from Ethiopia and Kenya were the youngest in absolute terms. However, only women from Japan were significantly older than women from Ethiopia (p = 0.001) but not all other women (p > 0.05). Consider-ing Kenyan women, no statistical significant differences were found between the countries (p > 0.05). For men, Ethiopians and Kenyans were the youngest in absolute terms. Ethiopian men were not younger than Kenyan men (p > 0.05), but significantly younger than men from all other countries (p < 0.001 to p < 0.0001). Men from Kenya were not younger than men from Liechtenstein, Great Britain, Poland and the USA, but significantly younger than men from all other countries (p < 0.001 to p < 0.0001).
DiscussionThis study intended to investigate performance and age of female and male Ethiopian and Kenyan half-maratho-ners and marathoners competing in races held in one country. The most important findings for female and male half-marathons and marathoners from Ethiopia and Kenya were that, (1) they accounted for less than 0.1 %, (2) they were running the fastest and, (3) they were the youngest.
Low participation of East African runnersA first important finding was that runners from Kenya and Ethiopia accounted for less than 0.1 % in both half-marathons and marathons. The small percentage of participants from these countries should be attributed partially to the distance between these countries and the place of race. Considering the nationality of participants, one might observe a very large number of local partici-pants followed by participants from the neighbouring countries.
Although athletes from neighbouring countries such as Germany, France, Italy and Austria were very numer-ous, also athletes from very remote countries such as the United States, Japan and Australia competed more numerous than athletes from Ethiopia and Kenya. A very likely explanation could be the income of persons living in these countries since they need to spend money for the travel to and the stay in Switzerland. Costs of living are very high in Switzerland compared to other coun-tries (www.numbeo.com/cost-of-living/country_result.jsp?country=Switzerland). When we compare the gross domestic product (GDP) per capita for persons liv-ing in East African countries such as Ethiopia (www.indexmundi.com/ethiopia/gdp_per_capita_%28ppp%29.html) and in Kenya (http://www.indexmundi.com/kenya/gdp_per_capita_%28ppp%29.html) with $1300 and $1800, respectively, persons from the other coun-tries such as the United States of America (www.index-mundi.com/united_states/gdp_per_capita_%28ppp%29.html), Japan (www.indexmundi.com/japan/gdp_per_capita_%28ppp%29.html) and Australia (www.index-mundi.com/australia/gdp_per_capita_%28ppp%29.html) have a GDP of $52,800, $ 37,100, and $43,000, respec-tively. With these higher GDP, persons from the United States of America, Japan and Australia might easier travel to Switzerland for competing in a marathon than persons from Ethiopia and Kenya.
The finding that mainly local athletes compete in races followed by athletes from surrounding countries con-firms recent findings for other races. For example, in long-distance triathletes competing in the ‘Ironman Hawaii’, women and men from the United States of America dom-inated both participation and performance (Dähler et al. 2014). In solo swimmers crossing the ‘English Channel’
Table 1 continued
Country Number of years Number of women Number of men Overall
Canada 12 30 103 133
Liechtenstein 11 25 78 103
Spain 8 18 57 75
Poland 8 14 52 66
Page 6 of 33Knechtle et al. SpringerPlus (2016) 5:223
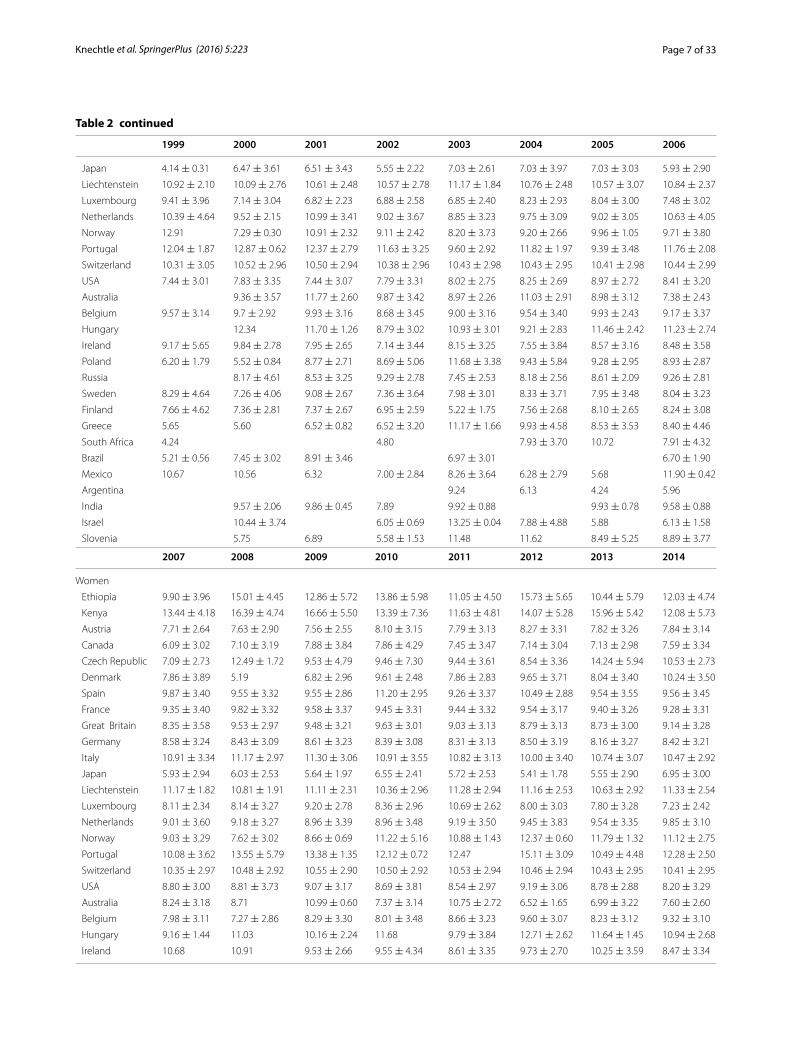
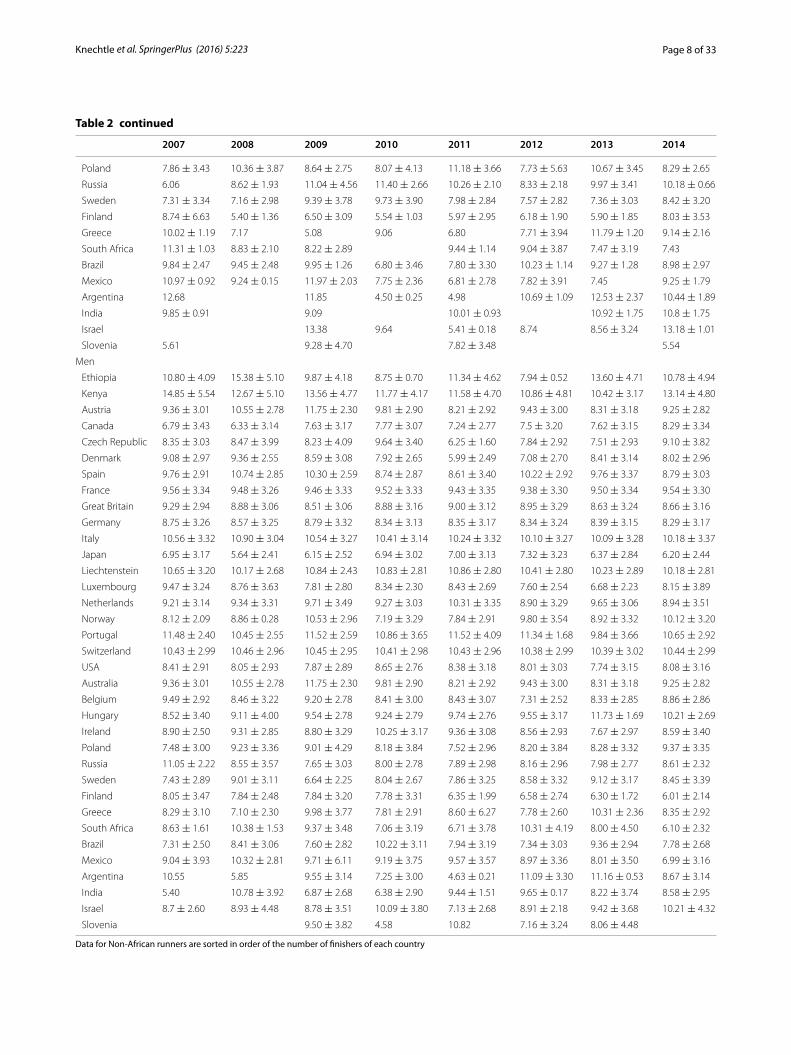
Table 2 Running speed (km/h) with mean ± SD for the annual fastest female and male East-African and Non-African half-marathoners
1999 2000 2001 2002 2003 2004 2005 2006
Women
Ethiopia 8.60 14.66 ± 7.42 8.10 19.57 19.59 19.63 14.14 ± 5.27
Kenya 14.79 ± 7.29 9.43 ± 0.35 14.99 ± 8.04 14.18 ± 4.69 16.52 ± 3.36 18.84 ± 1.89
Austria 7.49 ± 3.04 8.02 ± 3.64 7.84 ± 3.30 8.02 ± 3.06 7.98 ± 2.98 8.78 ± 3.59 8.44 ± 3.43 8.99 ± 3.54
Canada 5.07 ± 1.30 7.78 ± 4.39 7.16 ± 3.70 5.86 ± 2.10 9.13 ± 4.75 7.76 ± 2.72 7.01 ± 2.56
Czech Republic 5.09 ± 1.34 4.51 8.13 ± 4.82 5.63 ± 0.79 8.85 ± 3.83 10.83 ± 2.99 8.11 ± 3.16 10.13
Denmark 10.81 ± 0.83 7.23 ± 4.15 8.84 ± 4.10 10.42 ± 1.16 9.58 ± 3.40 7.49 ± 2.77 6.87 ± 2.85
Spain 9.87 ± 3.23 10.25 ± 2.32 10.53 ± 4.01 10.02 ± 3.15 11.01 ± 1.86 9.78 ± 2.81 10.07 ± 3.05 10.69 ± 2.29
France 10.21 ± 3.23 9.99 ± 3.02 9.47 ± 3.25 9.94 ± 3.28 9.72 ± 3.17 9.68 ± 3.40 9.70 ± 3.48 9.27 ± 3.42
Great Britain 9.81 ± 1.99 9.83 ± 2.84 9.18 ± 3.29 8.33 ± 3.13 10.38 ± 3.03 9.63 ± 3.20 10.26 ± 2.93 9.38 ± 3.08
Germany 8.49 ± 2.97 8.35 ± 3.47 8.46 ± 3.15 8.39 ± 3.22 8.61 ± 3.35 8.31 ± 3.27 8.48 ± 3.40 8.31 ± 3.17
Italy 9.76 ± 3.07 10.02 ± 3.26 10.4 ± 3.10 11.7 ± 2.62 10.01 ± 3.31 11.35 ± 2.92 10.68 ± 3.10 10.98 ± 3.11
Japan 6.21 ± 2.80 6.15 ± 2.47 7.35 ± 2.53 7.94 ± 2.95 6.57 ± 3.37 6.20 ± 2.48 6.52 ± 1.96 8.09 ± 2.77
Liechtenstein 10.21 ± 2.09 10.17 ± 2.32 11.49 ± 2.51 11.51 ± 2.25 10.96 ± 2.63 10.85 ± 3.55 11.26 ± 1.50 9.94 ± 2.66
Luxembourg 5.87 ± 1.58 7.80 ± 3.15 8.15 ± 4.64 8.19 ± 3.56 8.25 ± 3.33 6.86 ± 2.39 7.45 ± 1.22 8.61 ± 3.06
Netherlands 10.90 ± 1.25 11.56 ± 2.30 10.79 ± 1.16 11.47 ± 2.19 9.51 ± 2.63 10.12 ± 2.68 10.45 ± 4.47 8.97 ± 3.29
Norway 6.83 ± 3.05 7.12 ± 4.66 9.7 ± 1.93 4.56 9.59 ± 3.81 10.27 ± 3.84 8.45 ± 4.13
Portugal 10.97 13.53 8.41 ± 3.32 11.08 ± 2.74 10.12 ± 3.31 10.15 ± 3.98 11.52 ± 3.36
Switzerland 10.59 ± 2.97 10.75 ± 2.87 10.63 ± 2.91 10.63 ± 2.92 10.58 ± 2.90 10.57 ± 2.90 10.45 ± 2.93 10.51 ± 2.90
USA 12.05 ± 0.61 9.50 ± 2.92 9.39 ± 3.02 8.67 ± 3.46 7.90 ± 3.10 8.58 ± 3.60 8.34 ± 3.27 8.88 ± 2.62
Australia 10.96 9.08 ± 4.03 9.89 ± 3.60 9.85 ± 4.61 8.09 ± 3.28 8.12 ± 3.14
Belgium 8.22 ± 3.49 9.62 ± 5.59 7.70 ± 2.50 9.50 ± 1.87 7.88 ± 2.19 8.99 ± 3.28 7.83 ± 3.10
Hungary 8.44 9.09 8.46 11.79 10.96 11.62 10.07 ± 3.41
Ireland 9.44 ± 4.42 11.13 10.45 ± 0.33 8.60 ± 3.12 11.12 ± 3.02 10.49 ± 2.69 11.99 ± 1.66
Poland 8.19 ± 5.46 5.17 ± 1.00 4.39 9.58 ± 3.89 7.41 ± 2.78 7.49 ± 2.98 7.80 ± 3.18
Russia 11.19 9.73 ± 0.24 9.60 8.00 9.05 ± 3.13 7.31 ± 2.71 8.42 ± 2.99
Sweden 5.04 7.05 ± 3.13 11.66 ± 1.29 9.58 ± 3.82 10.02 ± 2.09 9.35 ± 3.67 7.47 ± 2.66
Finland 10.80 ± 0.50 5.07 8.42 ± 4.75 6.76 ± 3.14 6.14 ± 2.01 7.43 ± 0.33
Greece 5.82 6.39 10.65 12.02
South Africa 6.76 ± 2.45 11.59 12.73 5.32 5.06 ± 0.12
Brazil 9.95 ± 0.67 12.10 ± 2.16 5.49 10.28 11.06 8.72 ± 4.37
Mexico 9.76 10.07 ± 1.18
Argentina 9.74 10.44
India 9.74 10.48 9.63 ± 1.48 10.62 ± 1.09
Israel 4.37 4.50
Slovenia 5.06
Men
Ethiopia 9.71 ± 2.04 19.11 13.41 ± 6.70 8.13 ± 0.79 12.93 ± 7.40 10.84 ± 5.18 8.39 ± 0.39 12.24 ± 5.34
Kenya 12.76 ± 4.68 14.62 ± 5.32 12.24 ± 5.38 14.7 ± 5.13 12.31 ± 6.99 10.78 ± 4.83 15.35 ± 5.68 11.47 ± 4.39
Austria 9.36 ± 3.57 11.77 ± 2.60 9.87 ± 3.42 8.97 ± 2.26 11.03 ± 1.91 8.98 ± 3.12 7.38 ± 2.43
Canada 7.81 ± 3.15 6.99 ± 2.69 8.32 ± 3.28 7.78 ± 3.05 8.95 ± 3.65 7.29 ± 2.87 6.35 ± 2.61 5.91 ± 2.34
Czech Republic 8.06 ± 2.00 10.45 ± 3.87 10.3 ± 2.72 11.15 ± 3.54 8.85 ± 4.47 10.01 ± 2.75 9.63 ± 3.10 8.94 ± 2.96
Denmark 6.68 ± 1.70 7.04 ± 2.49 8.65 ± 2.96 6.91 ± 2.03 8.25 ± 2.94 8.65 ± 2.90 9.15 ± 3.74
Spain 10.63 ± 3.75 11.23 ± 1.76 9.84 ± 3.25 8.32 ± 3.01 9.24 ± 2.84 8.88 ± 3.00 8.41 ± 3.41 9.07 ± 2.89
France 9.82 ± 3.37 9.43 ± 3.35 9.47 ± 3.33 9.72 ± 3.37 9.49 ± 3.29 9.39 ± 3.32 9.56 ± 3.35 9.83 ± 3.33
Great Britain 9.49 ± 2.92 9.32 ± 3.16 9.31 ± 3.16 9.34 ± 3.09 9.89 ± 2.84 9.06 ± 3.04 9.19 ± 3.16 9.37 ± 3.11
Germany 8.58 ± 3.26 8.56 ± 3.25 8.42 ± 3.16 8.58 ± 3.28 8.35 ± 3.23 8.44 ± 3.21 8.28 ± 3.23 8.60 ± 3.18
Italy 10.55 ± 3.16 10.55 ± 3.01 10.73 ± 3.05 10.54 ± 2.86 10.59 ± 3.17 10.64 ± 3.23 10.82 ± 3.00 10.68 ± 3.18
Page 7 of 33Knechtle et al. SpringerPlus (2016) 5:223
Table 2 continued
1999 2000 2001 2002 2003 2004 2005 2006
Japan 4.14 ± 0.31 6.47 ± 3.61 6.51 ± 3.43 5.55 ± 2.22 7.03 ± 2.61 7.03 ± 3.97 7.03 ± 3.03 5.93 ± 2.90
Liechtenstein 10.92 ± 2.10 10.09 ± 2.76 10.61 ± 2.48 10.57 ± 2.78 11.17 ± 1.84 10.76 ± 2.48 10.57 ± 3.07 10.84 ± 2.37
Luxembourg 9.41 ± 3.96 7.14 ± 3.04 6.82 ± 2.23 6.88 ± 2.58 6.85 ± 2.40 8.23 ± 2.93 8.04 ± 3.00 7.48 ± 3.02
Netherlands 10.39 ± 4.64 9.52 ± 2.15 10.99 ± 3.41 9.02 ± 3.67 8.85 ± 3.23 9.75 ± 3.09 9.02 ± 3.05 10.63 ± 4.05
Norway 12.91 7.29 ± 0.30 10.91 ± 2.32 9.11 ± 2.42 8.20 ± 3.73 9.20 ± 2.66 9.96 ± 1.05 9.71 ± 3.80
Portugal 12.04 ± 1.87 12.87 ± 0.62 12.37 ± 2.79 11.63 ± 3.25 9.60 ± 2.92 11.82 ± 1.97 9.39 ± 3.48 11.76 ± 2.08
Switzerland 10.31 ± 3.05 10.52 ± 2.96 10.50 ± 2.94 10.38 ± 2.96 10.43 ± 2.98 10.43 ± 2.95 10.41 ± 2.98 10.44 ± 2.99
USA 7.44 ± 3.01 7.83 ± 3.35 7.44 ± 3.07 7.79 ± 3.31 8.02 ± 2.75 8.25 ± 2.69 8.97 ± 2.72 8.41 ± 3.20
Australia 9.36 ± 3.57 11.77 ± 2.60 9.87 ± 3.42 8.97 ± 2.26 11.03 ± 2.91 8.98 ± 3.12 7.38 ± 2.43
Belgium 9.57 ± 3.14 9.7 ± 2.92 9.93 ± 3.16 8.68 ± 3.45 9.00 ± 3.16 9.54 ± 3.40 9.93 ± 2.43 9.17 ± 3.37
Hungary 12.34 11.70 ± 1.26 8.79 ± 3.02 10.93 ± 3.01 9.21 ± 2.83 11.46 ± 2.42 11.23 ± 2.74
Ireland 9.17 ± 5.65 9.84 ± 2.78 7.95 ± 2.65 7.14 ± 3.44 8.15 ± 3.25 7.55 ± 3.84 8.57 ± 3.16 8.48 ± 3.58
Poland 6.20 ± 1.79 5.52 ± 0.84 8.77 ± 2.71 8.69 ± 5.06 11.68 ± 3.38 9.43 ± 5.84 9.28 ± 2.95 8.93 ± 2.87
Russia 8.17 ± 4.61 8.53 ± 3.25 9.29 ± 2.78 7.45 ± 2.53 8.18 ± 2.56 8.61 ± 2.09 9.26 ± 2.81
Sweden 8.29 ± 4.64 7.26 ± 4.06 9.08 ± 2.67 7.36 ± 3.64 7.98 ± 3.01 8.33 ± 3.71 7.95 ± 3.48 8.04 ± 3.23
Finland 7.66 ± 4.62 7.36 ± 2.81 7.37 ± 2.67 6.95 ± 2.59 5.22 ± 1.75 7.56 ± 2.68 8.10 ± 2.65 8.24 ± 3.08
Greece 5.65 5.60 6.52 ± 0.82 6.52 ± 3.20 11.17 ± 1.66 9.93 ± 4.58 8.53 ± 3.53 8.40 ± 4.46
South Africa 4.24 4.80 7.93 ± 3.70 10.72 7.91 ± 4.32
Brazil 5.21 ± 0.56 7.45 ± 3.02 8.91 ± 3.46 6.97 ± 3.01 6.70 ± 1.90
Mexico 10.67 10.56 6.32 7.00 ± 2.84 8.26 ± 3.64 6.28 ± 2.79 5.68 11.90 ± 0.42
Argentina 9.24 6.13 4.24 5.96
India 9.57 ± 2.06 9.86 ± 0.45 7.89 9.92 ± 0.88 9.93 ± 0.78 9.58 ± 0.88
Israel 10.44 ± 3.74 6.05 ± 0.69 13.25 ± 0.04 7.88 ± 4.88 5.88 6.13 ± 1.58
Slovenia 5.75 6.89 5.58 ± 1.53 11.48 11.62 8.49 ± 5.25 8.89 ± 3.77
2007 2008 2009 2010 2011 2012 2013 2014
Women
Ethiopia 9.90 ± 3.96 15.01 ± 4.45 12.86 ± 5.72 13.86 ± 5.98 11.05 ± 4.50 15.73 ± 5.65 10.44 ± 5.79 12.03 ± 4.74
Kenya 13.44 ± 4.18 16.39 ± 4.74 16.66 ± 5.50 13.39 ± 7.36 11.63 ± 4.81 14.07 ± 5.28 15.96 ± 5.42 12.08 ± 5.73
Austria 7.71 ± 2.64 7.63 ± 2.90 7.56 ± 2.55 8.10 ± 3.15 7.79 ± 3.13 8.27 ± 3.31 7.82 ± 3.26 7.84 ± 3.14
Canada 6.09 ± 3.02 7.10 ± 3.19 7.88 ± 3.84 7.86 ± 4.29 7.45 ± 3.47 7.14 ± 3.04 7.13 ± 2.98 7.59 ± 3.34
Czech Republic 7.09 ± 2.73 12.49 ± 1.72 9.53 ± 4.79 9.46 ± 7.30 9.44 ± 3.61 8.54 ± 3.36 14.24 ± 5.94 10.53 ± 2.73
Denmark 7.86 ± 3.89 5.19 6.82 ± 2.96 9.61 ± 2.48 7.86 ± 2.83 9.65 ± 3.71 8.04 ± 3.40 10.24 ± 3.50
Spain 9.87 ± 3.40 9.55 ± 3.32 9.55 ± 2.86 11.20 ± 2.95 9.26 ± 3.37 10.49 ± 2.88 9.54 ± 3.55 9.56 ± 3.45
France 9.35 ± 3.40 9.82 ± 3.32 9.58 ± 3.37 9.45 ± 3.31 9.44 ± 3.32 9.54 ± 3.17 9.40 ± 3.26 9.28 ± 3.31
Great Britain 8.35 ± 3.58 9.53 ± 2.97 9.48 ± 3.21 9.63 ± 3.01 9.03 ± 3.13 8.79 ± 3.13 8.73 ± 3.00 9.14 ± 3.28
Germany 8.58 ± 3.24 8.43 ± 3.09 8.61 ± 3.23 8.39 ± 3.08 8.31 ± 3.13 8.50 ± 3.19 8.16 ± 3.27 8.42 ± 3.21
Italy 10.91 ± 3.34 11.17 ± 2.97 11.30 ± 3.06 10.91 ± 3.55 10.82 ± 3.13 10.00 ± 3.40 10.74 ± 3.07 10.47 ± 2.92
Japan 5.93 ± 2.94 6.03 ± 2.53 5.64 ± 1.97 6.55 ± 2.41 5.72 ± 2.53 5.41 ± 1.78 5.55 ± 2.90 6.95 ± 3.00
Liechtenstein 11.17 ± 1.82 10.81 ± 1.91 11.11 ± 2.31 10.36 ± 2.96 11.28 ± 2.94 11.16 ± 2.53 10.63 ± 2.92 11.33 ± 2.54
Luxembourg 8.11 ± 2.34 8.14 ± 3.27 9.20 ± 2.78 8.36 ± 2.96 10.69 ± 2.62 8.00 ± 3.03 7.80 ± 3.28 7.23 ± 2.42
Netherlands 9.01 ± 3.60 9.18 ± 3.27 8.96 ± 3.39 8.96 ± 3.48 9.19 ± 3.50 9.45 ± 3.83 9.54 ± 3.35 9.85 ± 3.10
Norway 9.03 ± 3.29 7.62 ± 3.02 8.66 ± 0.69 11.22 ± 5.16 10.88 ± 1.43 12.37 ± 0.60 11.79 ± 1.32 11.12 ± 2.75
Portugal 10.08 ± 3.62 13.55 ± 5.79 13.38 ± 1.35 12.12 ± 0.72 12.47 15.11 ± 3.09 10.49 ± 4.48 12.28 ± 2.50
Switzerland 10.35 ± 2.97 10.48 ± 2.92 10.55 ± 2.90 10.50 ± 2.92 10.53 ± 2.94 10.46 ± 2.94 10.43 ± 2.95 10.41 ± 2.95
USA 8.80 ± 3.00 8.81 ± 3.73 9.07 ± 3.17 8.69 ± 3.81 8.54 ± 2.97 9.19 ± 3.06 8.78 ± 2.88 8.20 ± 3.29
Australia 8.24 ± 3.18 8.71 10.99 ± 0.60 7.37 ± 3.14 10.75 ± 2.72 6.52 ± 1.65 6.99 ± 3.22 7.60 ± 2.60
Belgium 7.98 ± 3.11 7.27 ± 2.86 8.29 ± 3.30 8.01 ± 3.48 8.66 ± 3.23 9.60 ± 3.07 8.23 ± 3.12 9.32 ± 3.10
Hungary 9.16 ± 1.44 11.03 10.16 ± 2.24 11.68 9.79 ± 3.84 12.71 ± 2.62 11.64 ± 1.45 10.94 ± 2.68
Ireland 10.68 10.91 9.53 ± 2.66 9.55 ± 4.34 8.61 ± 3.35 9.73 ± 2.70 10.25 ± 3.59 8.47 ± 3.34
Page 8 of 33Knechtle et al. SpringerPlus (2016) 5:223
Table 2 continued
2007 2008 2009 2010 2011 2012 2013 2014
Poland 7.86 ± 3.43 10.36 ± 3.87 8.64 ± 2.75 8.07 ± 4.13 11.18 ± 3.66 7.73 ± 5.63 10.67 ± 3.45 8.29 ± 2.65
Russia 6.06 8.62 ± 1.93 11.04 ± 4.56 11.40 ± 2.66 10.26 ± 2.10 8.33 ± 2.18 9.97 ± 3.41 10.18 ± 0.66
Sweden 7.31 ± 3.34 7.16 ± 2.98 9.39 ± 3.78 9.73 ± 3.90 7.98 ± 2.84 7.57 ± 2.82 7.36 ± 3.03 8.42 ± 3.20
Finland 8.74 ± 6.63 5.40 ± 1.36 6.50 ± 3.09 5.54 ± 1.03 5.97 ± 2.95 6.18 ± 1.90 5.90 ± 1.85 8.03 ± 3.53
Greece 10.02 ± 1.19 7.17 5.08 9.06 6.80 7.71 ± 3.94 11.79 ± 1.20 9.14 ± 2.16
South Africa 11.31 ± 1.03 8.83 ± 2.10 8.22 ± 2.89 9.44 ± 1.14 9.04 ± 3.87 7.47 ± 3.19 7.43
Brazil 9.84 ± 2.47 9.45 ± 2.48 9.95 ± 1.26 6.80 ± 3.46 7.80 ± 3.30 10.23 ± 1.14 9.27 ± 1.28 8.98 ± 2.97
Mexico 10.97 ± 0.92 9.24 ± 0.15 11.97 ± 2.03 7.75 ± 2.36 6.81 ± 2.78 7.82 ± 3.91 7.45 9.25 ± 1.79
Argentina 12.68 11.85 4.50 ± 0.25 4.98 10.69 ± 1.09 12.53 ± 2.37 10.44 ± 1.89
India 9.85 ± 0.91 9.09 10.01 ± 0.93 10.92 ± 1.75 10.8 ± 1.75
Israel 13.38 9.64 5.41 ± 0.18 8.74 8.56 ± 3.24 13.18 ± 1.01
Slovenia 5.61 9.28 ± 4.70 7.82 ± 3.48 5.54
Men
Ethiopia 10.80 ± 4.09 15.38 ± 5.10 9.87 ± 4.18 8.75 ± 0.70 11.34 ± 4.62 7.94 ± 0.52 13.60 ± 4.71 10.78 ± 4.94
Kenya 14.85 ± 5.54 12.67 ± 5.10 13.56 ± 4.77 11.77 ± 4.17 11.58 ± 4.70 10.86 ± 4.81 10.42 ± 3.17 13.14 ± 4.80
Austria 9.36 ± 3.01 10.55 ± 2.78 11.75 ± 2.30 9.81 ± 2.90 8.21 ± 2.92 9.43 ± 3.00 8.31 ± 3.18 9.25 ± 2.82
Canada 6.79 ± 3.43 6.33 ± 3.14 7.63 ± 3.17 7.77 ± 3.07 7.24 ± 2.77 7.5 ± 3.20 7.62 ± 3.15 8.29 ± 3.34
Czech Republic 8.35 ± 3.03 8.47 ± 3.99 8.23 ± 4.09 9.64 ± 3.40 6.25 ± 1.60 7.84 ± 2.92 7.51 ± 2.93 9.10 ± 3.82
Denmark 9.08 ± 2.97 9.36 ± 2.55 8.59 ± 3.08 7.92 ± 2.65 5.99 ± 2.49 7.08 ± 2.70 8.41 ± 3.14 8.02 ± 2.96
Spain 9.76 ± 2.91 10.74 ± 2.85 10.30 ± 2.59 8.74 ± 2.87 8.61 ± 3.40 10.22 ± 2.92 9.76 ± 3.37 8.79 ± 3.03
France 9.56 ± 3.34 9.48 ± 3.26 9.46 ± 3.33 9.52 ± 3.33 9.43 ± 3.35 9.38 ± 3.30 9.50 ± 3.34 9.54 ± 3.30
Great Britain 9.29 ± 2.94 8.88 ± 3.06 8.51 ± 3.06 8.88 ± 3.16 9.00 ± 3.12 8.95 ± 3.29 8.63 ± 3.24 8.66 ± 3.16
Germany 8.75 ± 3.26 8.57 ± 3.25 8.79 ± 3.32 8.34 ± 3.13 8.35 ± 3.17 8.34 ± 3.24 8.39 ± 3.15 8.29 ± 3.17
Italy 10.56 ± 3.32 10.90 ± 3.04 10.54 ± 3.27 10.41 ± 3.14 10.24 ± 3.32 10.10 ± 3.27 10.09 ± 3.28 10.18 ± 3.37
Japan 6.95 ± 3.17 5.64 ± 2.41 6.15 ± 2.52 6.94 ± 3.02 7.00 ± 3.13 7.32 ± 3.23 6.37 ± 2.84 6.20 ± 2.44
Liechtenstein 10.65 ± 3.20 10.17 ± 2.68 10.84 ± 2.43 10.83 ± 2.81 10.86 ± 2.80 10.41 ± 2.80 10.23 ± 2.89 10.18 ± 2.81
Luxembourg 9.47 ± 3.24 8.76 ± 3.63 7.81 ± 2.80 8.34 ± 2.30 8.43 ± 2.69 7.60 ± 2.54 6.68 ± 2.23 8.15 ± 3.89
Netherlands 9.21 ± 3.14 9.34 ± 3.31 9.71 ± 3.49 9.27 ± 3.03 10.31 ± 3.35 8.90 ± 3.29 9.65 ± 3.06 8.94 ± 3.51
Norway 8.12 ± 2.09 8.86 ± 0.28 10.53 ± 2.96 7.19 ± 3.29 7.84 ± 2.91 9.80 ± 3.54 8.92 ± 3.32 10.12 ± 3.20
Portugal 11.48 ± 2.40 10.45 ± 2.55 11.52 ± 2.59 10.86 ± 3.65 11.52 ± 4.09 11.34 ± 1.68 9.84 ± 3.66 10.65 ± 2.92
Switzerland 10.43 ± 2.99 10.46 ± 2.96 10.45 ± 2.95 10.41 ± 2.98 10.43 ± 2.96 10.38 ± 2.99 10.39 ± 3.02 10.44 ± 2.99
USA 8.41 ± 2.91 8.05 ± 2.93 7.87 ± 2.89 8.65 ± 2.76 8.38 ± 3.18 8.01 ± 3.03 7.74 ± 3.15 8.08 ± 3.16
Australia 9.36 ± 3.01 10.55 ± 2.78 11.75 ± 2.30 9.81 ± 2.90 8.21 ± 2.92 9.43 ± 3.00 8.31 ± 3.18 9.25 ± 2.82
Belgium 9.49 ± 2.92 8.46 ± 3.22 9.20 ± 2.78 8.41 ± 3.00 8.43 ± 3.07 7.31 ± 2.52 8.33 ± 2.85 8.86 ± 2.86
Hungary 8.52 ± 3.40 9.11 ± 4.00 9.54 ± 2.78 9.24 ± 2.79 9.74 ± 2.76 9.55 ± 3.17 11.73 ± 1.69 10.21 ± 2.69
Ireland 8.90 ± 2.50 9.31 ± 2.85 8.80 ± 3.29 10.25 ± 3.17 9.36 ± 3.08 8.56 ± 2.93 7.67 ± 2.97 8.59 ± 3.40
Poland 7.48 ± 3.00 9.23 ± 3.36 9.01 ± 4.29 8.18 ± 3.84 7.52 ± 2.96 8.20 ± 3.84 8.28 ± 3.32 9.37 ± 3.35
Russia 11.05 ± 2.22 8.55 ± 3.57 7.65 ± 3.03 8.00 ± 2.78 7.89 ± 2.98 8.16 ± 2.96 7.98 ± 2.77 8.61 ± 2.32
Sweden 7.43 ± 2.89 9.01 ± 3.11 6.64 ± 2.25 8.04 ± 2.67 7.86 ± 3.25 8.58 ± 3.32 9.12 ± 3.17 8.45 ± 3.39
Finland 8.05 ± 3.47 7.84 ± 2.48 7.84 ± 3.20 7.78 ± 3.31 6.35 ± 1.99 6.58 ± 2.74 6.30 ± 1.72 6.01 ± 2.14
Greece 8.29 ± 3.10 7.10 ± 2.30 9.98 ± 3.77 7.81 ± 2.91 8.60 ± 6.27 7.78 ± 2.60 10.31 ± 2.36 8.35 ± 2.92
South Africa 8.63 ± 1.61 10.38 ± 1.53 9.37 ± 3.48 7.06 ± 3.19 6.71 ± 3.78 10.31 ± 4.19 8.00 ± 4.50 6.10 ± 2.32
Brazil 7.31 ± 2.50 8.41 ± 3.06 7.60 ± 2.82 10.22 ± 3.11 7.94 ± 3.19 7.34 ± 3.03 9.36 ± 2.94 7.78 ± 2.68
Mexico 9.04 ± 3.93 10.32 ± 2.81 9.71 ± 6.11 9.19 ± 3.75 9.57 ± 3.57 8.97 ± 3.36 8.01 ± 3.50 6.99 ± 3.16
Argentina 10.55 5.85 9.55 ± 3.14 7.25 ± 3.00 4.63 ± 0.21 11.09 ± 3.30 11.16 ± 0.53 8.67 ± 3.14
India 5.40 10.78 ± 3.92 6.87 ± 2.68 6.38 ± 2.90 9.44 ± 1.51 9.65 ± 0.17 8.22 ± 3.74 8.58 ± 2.95
Israel 8.7 ± 2.60 8.93 ± 4.48 8.78 ± 3.51 10.09 ± 3.80 7.13 ± 2.68 8.91 ± 2.18 9.42 ± 3.68 10.21 ± 4.32
Slovenia 9.50 ± 3.82 4.58 10.82 7.16 ± 3.24 8.06 ± 4.48
Data for Non-African runners are sorted in order of the number of finishers of each country
Page 9 of 33Knechtle et al. SpringerPlus (2016) 5:223
Table 3 Results of the mixed-effects regression analyses for change in running speed in female half-marathoners across years
Parameter Estimate SE DF T p value 95 % CI
Upper Lower
Ethiopia
Constant term 293.167388 371.574985 43.863 0.789 0.434 −455.758951 1042.093726
Year −0.140332 0.184932 43.873 −0.759 0.452 −0.513068 0.232405
Cage −0.173148 0.135294 36.958 −1.280 0.209 −0.447291 0.100995
Cage2 −0.004387 0.006022 27.717 −0.728 0.472 −0.016727 0.007954
Kenya
Constant term −21.426837 150.844832 36.330 −.0142 0.888 −327.257984 284.404310
Year 0.017207 0.075087 36.326 0.229 0.820 −0.135029 0.169443
Cage −0.144332 0.060829 27.148 −2.373 0.025 −0.269111 −0.019552
Cage2 −0.003215 0.003653 30.133 −0.880 0.386 −0.010674 0.004243
Austria
Constant term 31.578045 29.443671 597.888 1.072 0.284 −26.247547 89.403637
Year −0.011598 0.014658 597.871 −0.791 0.429 −0.040386 0.017190
Cage −0.028602 0.006916 600.177 −4.136 0.000 −0.042184 −0.015021
Cage2 0.000663 0.000536 608.882 1.237 0.217 −0.000390 0.001716
Canada
Constant term −125.514888 73.115253 155.945 −1.717 0.088 −269.938931 18.909154
Year 0.066249 0.036396 155.933 1.820 0.071 −0.005644 0.138143
Cage −0.020679 0.014519 170.268 −1.424 0.156 −0.049340 0.007982
Cage2 7.822872E−5 0.001161 162.137 0.067 0.946 −0.002214 0.002370
Czech Republic
Constant term −220.270108 155.839548 40.611 −1.413 0.165 −535.086061 94.545845
Year 0.113694 0.077609 40.610 1.465 0.151 −0.043086 0.270474
Cage −0.080535 0.051903 45.473 −1.552 0.128 −0.185044 0.023974
Cage2 0.003476 0.004529 46.743 0.768 0.447 −0.005637 0.012589
Denmark
Constant term −144.099673 142.620810 55.173 −1.010 0.317 −429.897999 141.698652
Year 0.076052 0.070989 55.174 1.071 0.289 −0.066203 0.218308
Cage −.012618 0.030636 58.407 −0.412 0.682 −0.073934 0.048697
Cage2 −.000446 0.002495 59.214 −0.179 0.859 −0.005439 0.004546
Spain
Constant term −5.366288 67.028907 141.702 −0.080 0.936 −137.872163 127.139587
Year 0.007615 0.033366 141.702 0.228 0.820 −0.058344 0.073574
Cage 0.001968 0.014710 129.823 0.134 0.894 −0.027134 0.031069
Cage2 −0.000865 0.001169 144.790 −0.740 0.461 −0.003175 0.001445
France
Constant term 51.171466 15.295732 4653.214 3.345 0.001 21.184581 81.158350
Year −0.020670 0.007613 4653.140 −2.715 0.007 −0.035595 −0.005744
Cage −0.023120 0.003408 4755.183 −6.783 0.000 −0.029801 −0.016438
Cage2 −0.000602 0.000252 4810.855 −2.392 0.017 −0.001095 −0.000109
Great Britain
Constant term 28.901729 42.017402 749.113 0.688 0.492 −53.584137 111.387595
Year −0.009779 0.020917 749.099 −0.468 0.640 −0.050842 0.031283
Cage 0.009513 0.009652 844.541 0.986 0.325 −0.009432 0.028457
Cage2 −0.001723 0.000775 871.578 −2.222 0.027 −0.003245 −0.000201
Germany
Constant term 15.158368 14.956731 4456.047 1.013 0.311 −14.164251 44.480986
Page 10 of 33Knechtle et al. SpringerPlus (2016) 5:223
Table 3 continued
Parameter Estimate SE DF T p value 95 % CI
Upper Lower
Year −0.003244 0.007446 4455.945 −0.436 0.663 −0.017841 0.011353
Cage −0.023479 0.002955 3893.061 −7.946 0.000 −0.029272 −0.017686
Cage2 −0.000163 0.000198 3910.190 −0.822 0.411 −0.000551 0.000225
Italy
Constant term 55.277603 39.067728 844.859 1.415 0.157 −21.403589 131.958795
Year −0.022114 0.019449 844.831 −1.137 0.256 −0.060287 0.016060
Cage −0.049367 0.010292 954.174 −4.797 0.000 −0.069565 −0.029169
Cage2 −0.001914 0.000776 961.174 −2.467 0.014 −0.003436 −0.000391
Japan
Constant term 70.707877 63.986213 101.377 1.105 0.272 −56.217842 197.633596
Year −0.031946 0.031855 101.405 −1.003 0.318 −.0095133 0.031242
Cage −0.047542 0.017703 159.965 −2.685 0.008 −0.082504 −0.012579
Cage2 0.001527 0.000930 166.855 1.641 0.103 −0.000310 0.003363
Principality of Liechtenstein
Constant term 10.483455 64.869741 255.178 0.162 0.872 −117.264786 138.231696
Year 0.000233 0.032291 255.155 0.007 0.994 −0.063358 0.063823
Cage −0.012747 0.013132 275.553 −0.971 0.333 −0.038598 0.013105
Cage2 −0.001544 0.001094 290.811 −1.411 0.159 −0.003697 0.000610
Luxembourg
Constant term −47.666634 97.322485 48.909 −0.490 0.626 −243.252737 147.919469
Year 0.027753 0.048451 48.906 0.573 0.569 −0.069617 0.125123
Cage −0.023725 0.013396 31.814 −1.771 0.086 −0.051017 0.003567
Cage2 0.001603 0.001046 30.499 1.533 0.136 −0.000532 0.003737
Netherlands
Constant term 133.938661 125.455169 149.777 1.068 0.287 −113.951882 381.829205
Year −0.062003 0.062457 149.769 −0.993 0.322 −0.185413 0.061407
Cage −0.011427 0.021283 105.363 −0.537 0.592 −0.053626 0.030771
Cage2 0.000320 0.001177 84.597 0.272 0.786 −0.002020 0.002660
Norway
Constant term −487.272616 173.193914 54.820 −2.813 0.007 −834.386566 −140.158666
Year 0.247478 0.086290 54.821 2.868 0.006 0.074537 0.420419
Cage −0.115170 0.020554 36.162 −5.603 0.000 −0.156850 −0.073491
Cage2 0.002664 0.001240 33.459 2.150 0.039 0.000144 0.005185
Portugal
Constant term −474.101901 231.004145 55.403 −2.052 0.045 −936.968950 −11.234851
Year 0.241610 0.114974 55.397 2.101 0.040 0.011234 0.471987
Cage −0.006509 0.059010 54.339 −0.110 0.913 −0.124800 0.111783
Cage2 0.004436 0.005816 53.398 0.763 0.449 −0.007227 0.016100
Switzerland
Constant term 17.415465 3.082751 85,158.813 5.649 0.000 11.373300 23.457631
Year −0.003429 0.001535 85,155.422 −2.235 0.025 −0.006437 −0.000422
Cage −0.010236 0.000499 71,948.591 −20.518 0.000 −0.011214 −0.009259
Cage2 −0.000417 3.413093E−5 70,505.318 −12.217 0.000 −0.000484 −0.000350
United States of America
Constant term −102.180938 71.308524 295.142 −1.433 0.153 −242.518553 38.156677
Year 0.055053 0.035488 295.135 1.551 0.122 −0.014789 0.124895
Cage −0.011404 0.012867 301.169 −0.886 0.376 −0.036725 0.013917
Cage2 0.001037 0.000928 305.711 1.118 0.265 −0.000789 0.002863

Page 11 of 33Knechtle et al. SpringerPlus (2016) 5:223
Table 3 continued
Parameter Estimate SE DF T p value 95 % CI
Upper Lower
Australia
Constant term 535.990276 98.301322 13.686 5.453 0.000 324.700562 747.279990
Year −0.262740 0.048925 13.688 −5.370 0.000 −0.367899 −0.157580
Cage 0.063641 0.055873 47.462 1.139 0.260 −0.048733 0.176014
Cage2 −0.002360 0.002842 46.702 −0.830 0.411 −0.008078 0.003358
Belgium
Constant term 7.038611 107.628613 165.205 0.065 0.948 −205.466290 219.543511
Year 0.000697 0.053552 165.225 0.013 0.990 −0.105038 0.106433
Cage 0.000626 0.015637 117.693 0.040 0.968 −0.030341 0.031593
Cage2 0.000700 0.001032 108.364 0.678 0.499 −0.001345 0.002745
Hungary
Constant term −275.257629 154.694094 51.000 −1.779 0.081 −585.818982 35.303724
Year 0.142544 0.076947 51.000 1.853 0.070 −0.011933 0.297021
Cage −0.083478 0.047940 51.000 −1.741 0.088 −0.179721 0.012765
Cage2 0.000717 0.002086 51.000 0.344 0.732 −0.003470 0.004904
Ireland
Constant term −33.859940 165.743508 57.989 −0.204 0.839 −365.633001 297.913121
Year 0.021718 0.082524 57.993 0.263 0.793 −0.143473 0.186909
Cage −0.036636 0.037101 37.244 −0.987 0.330 −0.111793 0.038521
Cage2 −0.000562 0.003459 32.491 −0.162 0.872 −0.007603 0.006480
Poland
Constant term −72.726997 104.051935 60.961 −0.699 0.487 −280.794379 135.340384
Year 0.040347 0.051798 60.974 0.779 0.439 −0.063230 0.143924
Cage −0.053476 0.023476 65.801 −2.278 0.026 −0.100351 −0.006601
Cage2 −0.001860 0.001865 69.955 −0.997 0.322 −0.005579 0.001859
Russia
Constant term −106.441127 155.565229 42.567 −0.684 0.498 −420.260572 207.378318
Year 0.057206 0.077443 42.538 0.739 0.464 −0.099022 0.213434
Cage −0.072584 0.042398 55.257 −1.712 0.093 −0.157542 0.012374
Cage2 0.004846 0.003169 47.538 1.529 0.133 −0.001528 0.011219
Sweden
Constant term 75.820147 143.966277 104.839 0.527 0.600 −209.643494 361.283787
Year −0.033856 0.071641 104.838 −0.473 0.637 −0.175909 0.108197
Cage −0.016537 0.020415 67.482 −0.810 0.421 −0.057279 0.024206
Cage2 0.001067 0.001713 108.162 0.623 0.535 −0.002328 0.004462
Finland
Constant term −46.926724 100.378904 55.066 −0.467 0.642 −248.085146 154.231697
Year 0.027006 0.049943 55.068 0.541 0.591 −0.073079 0.127091
Cage −0.053711 0.015750 46.121 −3.410 0.001 −0.085411 −0.022011
Cage2 0.001208 0.001076 44.445 1.123 0.268 −0.000960 0.003376
Greece
Constant term −105.607974 339.956176 18.425 −0.311 0.760 −818.651669 607.435721
Year 0.056703 0.169175 18.428 0.335 0.741 −0.298130 0.411535
Cage 0.011301 0.080214 18.335 0.141 0.889 −0.157002 0.179604
Cage2 0.005226 0.004315 20.000 1.211 0.240 −0.003776 0.014227
Republic of South Africa
Constant term 195.281269 261.100120 30.776 0.748 0.460 −337.393318 727.955856
Year −0.093079 0.130031 30.771 −0.716 0.479 −0.358359 0.172201
Page 12 of 33Knechtle et al. SpringerPlus (2016) 5:223
between 1875 and 2013, the most representative nations in the ‘English Channel Swim’ were Great Britain, the United States of America, Australia and Ireland. The fast-est swim times were, however, not achieved by local ath-letes but by athletes from the United States of America, Australia and Great Britain (Knechtle et al. 2014).
However, the most likely explanation for the very low participation of East African runners in half-marathons and marathons held in Switzerland are economic reasons. For Kenyan runners, marathon running is a means of making money to help their families, parents and siblings (Onywera et al. 2006; Onywera 2009). Onywera (2009) described economic reasons for Kenyan athletes as one of
the most important factors to compete in marathon run-ning, which might be undercharged so far (Hamilton and Weston 2000). Prize money in Swiss half-marathons and marathons is very low compared to prize money offered in the ‘World Marathon Majors’ (www.worldmarathonma-jors.com). For the winner in the ‘Zurich Marathon’ in Switzerland, the prize money is 10,000 Swiss Francs (www.zurichmarathon.ch) which is very low in contrast to the prize money offered in large city marathons. Indeed, over-all prize money in races of the ‘World Marathon Majors’ is considerably higher (www.worldmarathonmajors.com). In the ‘BMW Berlin Marathon‘, the ‘Tokyo Marathon’, and the ‘Virgin London Marathon’ the prize money is $1,000,000,
Table 3 continued
Parameter Estimate SE DF T p value 95 % CI
Upper Lower
Cage −0.033597 0.065427 31.996 −0.514 0.611 −0.166869 0.099674
Cage2 0.000214 0.003268 27.237 0.066 0.948 −0.006488 0.006916
Brazil
Constant term 178.944876 212.772674 32.077 0.841 0.407 −254.418110 612.307863
Year −0.084760 0.105910 32.083 −0.800 0.429 −0.300469 0.130949
Cage −0.054561 0.036085 32.952 −1.512 0.140 −0.127981 0.018860
Cage2 0.003708 0.002066 37.833 1.795 0.081 −0.000475 0.007891
Mexico
Constant term −208.359308 343.548300 13.049 −0.606 0.555 −950.268215 533.549600
Year 0.108288 0.170848 13.048 0.634 0.537 −0.260670 0.477246
Cage 0.017053 0.033477 1.149 0.509 0.691 −0.297964 0.332070
Cage2 −0.004284 0.002132 1.006 −2.009 0.293 −0.031003 0.022435
Argentina
Constant term 171.161142 449.529264 12.527 0.381 0.710 −803.726404 1146.048688
Year −0.080710 0.223646 12.527 −0.361 0.724 −0.565727 0.404306
Cage −0.121342 0.107487 7.809 −1.129 0.292 −0.370266 0.127582
Cage2 0.004002 0.011220 5.403 0.357 0.735 −0.024206 0.032210
India
Constant term −180.991329 118.481416 23.000 −1.528 0.140 −426.088812 64.106153
Year 0.095159 0.058967 23.000 1.614 0.120 −0.026822 0.217141
Cage 0.034212 0.026224 23.000 1.305 0.205 −0.020037 0.088460
Cage2 0.002970 0.002305 23.000 1.288 0.210 −0.001798 0.007737
Israel
Constant term 1791.341424 749.677965 4.526 2.389 0.068 −198.063460 3780.746308
Year −0.884457 0.372205 4.522 −2.376 0.069 −1.872464 0.103550
Cage −0.130351 0.107475 8.468 −1.213 0.258 −0.375823 0.115121
Cage2 −0.026869 0.011891 11.589 −2.260 0.044 −0.052880 −0.000858
Slovenia
Constant term −31.714993 134.226844 13.547 −0.236 0.817 −320.508524 257.078539
Year 0.020363 0.066884 13.547 0.304 0.765 −0.123540 0.164266
Cage −0.084123 0.046744 8.409 −1.800 0.108 −0.191009 0.022763
Cage2 −0.001050 0.002818 9.076 −0.373 0.718 −0.007416 0.005317
Data for Non-African runners are sorted in order of the number of finishers of each country
Cage centered age, Cage2 centered age squared
Page 13 of 33Knechtle et al. SpringerPlus (2016) 5:223
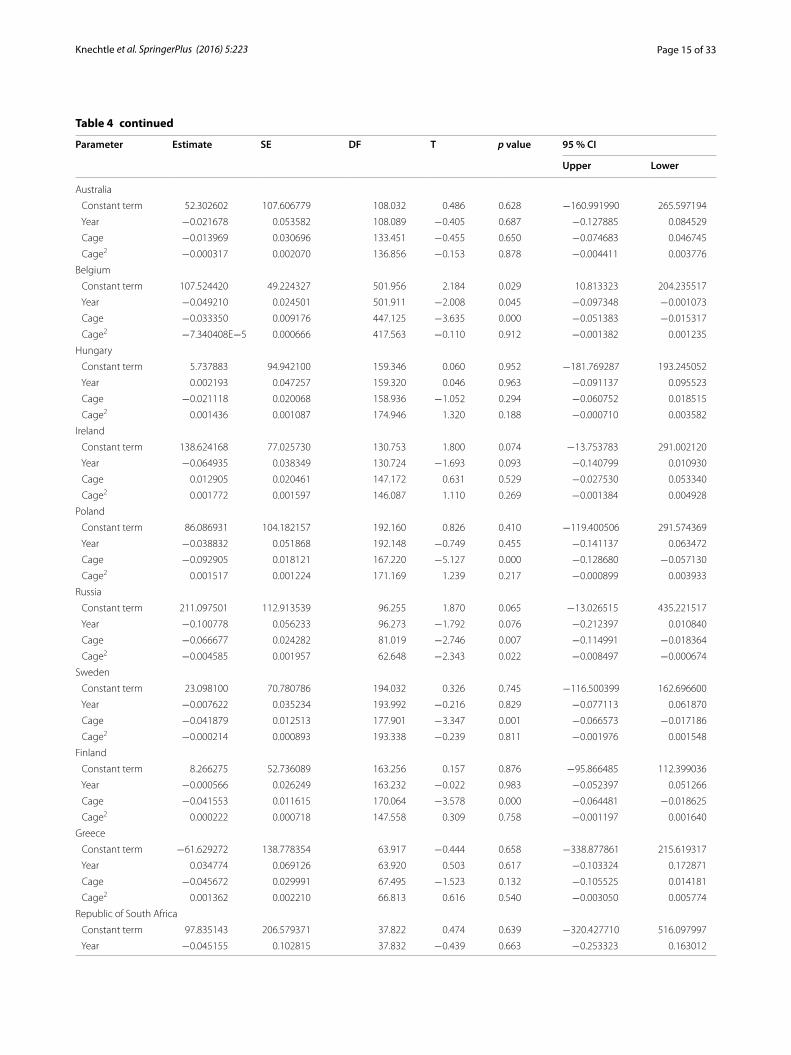
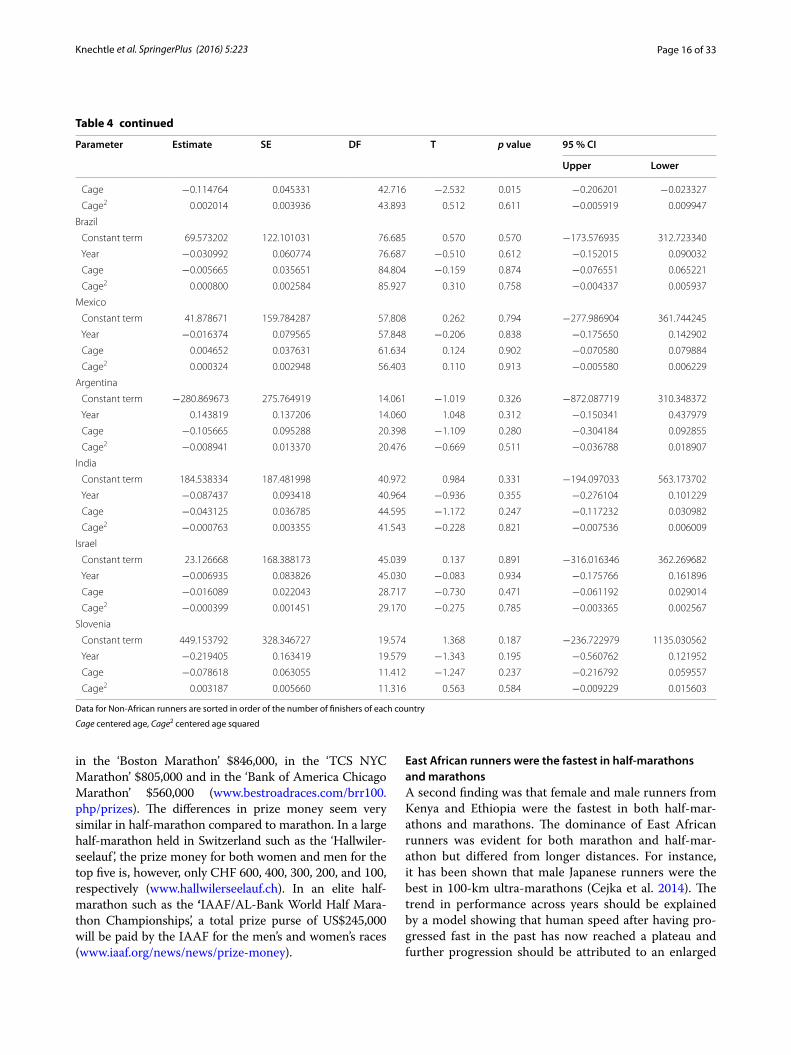
Table 4 Results of the mixed-effects regression analyses for change in running speed in male half-marathoners across years
Parameter Estimate SE DF T p value 95 % CI
Upper Lower
Ethiopia
Constant term 98.099117 174.871376 30.494 0.561 0.579 −258.793601 454.991835
Year −0.043552 0.087058 30.500 −0.500 0.620 −0.221226 0.134123
Cage −0.250494 0.185335 45.246 −1.352 0.183 −0.623723 0.122734
Cage2 −0.012719 0.007260 42.721 −1.752 0.087 −0.027363 0.001925
Kenya
Constant term 88.307393 103.114750 61.076 0.856 0.395 −117.878135 294.492921
Year −0.037470 0.051349 61.091 −0.730 0.468 −0.140145 0.065205
Cage −0.066120 0.029956 133.511 −2.207 0.029 −0.125371 −0.006870
Cage2 −0.002035 0.001386 133.757 −1.469 0.144 −0.004776 0.000706
Austria
Constant term 8.193904 15.718906 1374.455 0.521 0.602 −22.641739 39.029547
Year 0.000216 0.007826 1374.306 0.028 0.978 −0.015136 0.015568
Cage −0.016008 0.004315 1443.906 −3.710 0.000 −0.024471 −0.007544
Cage2 −0.000501 0.000294 1458.820 −1.702 0.089 −0.001078 7.633939E−5
Canada
Constant term −21.298964 52.088221 337.247 −0.409 0.683 −123.757696 81.159769
Year 0.014351 0.025943 337.200 0.553 0.580 −0.036679 0.065382
Cage −0.024635 0.011096 359.294 −2.220 0.027 −0.046457 −0.002814
Cage2 0.000544 0.000695 362.647 0.783 0.434 −0.000822 0.001910
Czech Republic
Constant term 154.008680 81.928758 100.744 1.880 0.063 −8.520953 316.538313
Year −0.072109 0.040820 100.777 −1.767 0.080 −0.153086 0.008869
Cage −0.003265 0.013101 75.567 −0.249 0.804 −0.029361 0.022830
Cage2 −0.002162 0.000996 78.010 −2.171 0.033 −0.004144 −0.000179
Denmark
Constant term 73.075047 85.575129 152.801 0.854 0.394 −95.988101 242.138195
Year −0.032295 0.042595 152.782 −0.758 0.450 −0.116447 0.051857
Cage 0.004069 0.013983 120.832 0.291 0.772 −0.023615 0.031752
Cage2 −0.002067 0.000851 124.782 −2.429 0.017 −0.003752 −0.000383
Spain
Constant term 73.070026 58.997907 419.804 1.239 0.216 −42.898085 189.038138
Year −0.031824 0.029368 419.811 −1.084 0.279 −0.089550 0.025902
Cage −0.015581 0.013136 435.510 −1.186 0.236 −0.041399 0.010238
Cage2 0.001634 0.000911 471.708 1.793 0.074 −0.000156 0.003425
France
Constant term 2.152551 8.424878 11,440.730 0.255 0.798 −14.361653 18.666754
Year 0.003734 0.004195 11,440.223 0.890 0.373 −0.004488 0.011956
Cage −0.024520 0.002065 11,842.861 −11.874 0.000 −0.028568 −0.020472
Cage2 −0.000555 0.000144 11,634.921 −3.864 0.000 −0.000837 −0.000274
Great Britain
Constant term 37.386616 22.952563 1729.593 1.629 0.104 −7.631084 82.404316
Year −0.014237 0.011430 1729.576 −1.246 0.213 −0.036654 0.008181
Cage −0.007171 0.005013 1775.835 −1.430 0.153 −0.017003 0.002662
Cage2 −0.000507 0.000363 1811.205 −1.399 0.162 −0.001218 0.000204
Germany
Constant term 26.340398 7.339500 12,201.868 3.589 0.000 11.953816 40.726980

Page 14 of 33Knechtle et al. SpringerPlus (2016) 5:223
Table 4 continued
Parameter Estimate SE DF T p value 95 % CI
Upper Lower
Year −0.008802 0.003654 12,201.252 −2.409 0.016 −0.015965 −0.001639
Cage −0.015672 0.001614 11,817.685 −9.708 0.000 −0.018836 −0.012508
Cage2 −0.000337 0.000106 11,885.807 −3.164 0.002 −0.000545 −0.000128
Italy
Constant term 32.563297 20.328196 2372.545 1.602 0.109 −7.299571 72.426164
Year −0.010999 0.010122 2372.366 −1.087 0.277 −0.030847 0.008850
Cage −0.045951 0.005681 2514.295 −8.089 0.000 −0.057090 −0.034812
Cage2 −0.000765 0.000380 2470.087 −2.015 0.044 −0.001510 −2.039314E−5
Japan
Constant term 14.867692 48.121533 316.697 0.309 0.758 −79.810599 109.545984
Year −.003770 0.023954 316.650 −.157 0.875 −.050900 0.043360
Cage −.058721 0.010081 397.745 −5.825 0.000 −.078540 −.038902
Cage2 4.080624E−5 0.000449 341.270 0.091 0.928 −.000843 0.000924
Fürstentum Liechtenstein
Constant term 36.488409 42.462409 604.502 0.859 0.391 −46.903349 119.880168
Year −0.012766 0.021142 604.548 −0.604 0.546 −0.054287 0.028756
Cage −0.001820 0.009507 565.166 −0.191 0.848 −0.020492 0.016853
Cage2 −0.001896 0.000777 592.741 −2.438 0.015 −0.003422 −0.000369
Luxembourg
Constant term −15.253456 80.615224 92.293 −0.189 0.850 −175.355473 144.848561
Year 0.011431 0.040137 92.287 0.285 0.776 −0.068280 0.091143
Cage −0.065466 0.021046 112.887 −3.111 0.002 −0.107162 −0.023770
Cage2 0.002067 0.001460 76.329 1.415 0.161 −0.000842 0.004975
Netherlands
Constant term 43.412228 54.590318 317.931 0.795 0.427 −63.991689 150.816144
Year −0.016855 0.027175 317.960 −0.620 0.536 −0.070321 0.036612
Cage −0.029740 0.011819 303.713 −2.516 0.012 −0.052998 −0.006482
Cage2 −0.001104 0.000799 294.009 −1.382 0.168 −0.002675 0.000468
Norway
Constant term −108.473099 87.956547 66.260 −1.233 0.222 −284.071127 67.124929
Year 0.058583 0.043794 66.285 1.338 0.186 −0.028848 0.146014
Cage 0.003335 0.021397 98.282 0.156 0.876 −0.039125 0.045796
Cage2 −0.001692 0.001159 78.629 −1.460 0.148 −0.004000 0.000615
Portugal
Constant term 67.632099 92.672293 171.225 0.730 0.467 −115.295174 250.559373
Year −0.028137 0.046162 171.263 −0.610 0.543 −0.119256 0.062982
Cage 0.009515 0.023055 186.876 0.413 0.680 −0.035968 0.054997
Cage2 −0.001022 0.001966 185.843 −0.520 0.604 −0.004900 0.002855
Switzerland
Constant term 8.817285 1.667403 223,427.050 5.288 0.000 5.549219 12.085351
Year 0.000791 0.000830 223,414.735 0.953 0.340 −0.000836 0.002418
Cage −0.010964 0.000294 204,230.290 −37.270 0.000 −0.011540 −0.010387
Cage2 −0.000368 2.032780E−5 202,092.789 −18.089 0.000 −0.000408 −0.000328
United States of America
Constant term 54.392263 32.424867 708.442 1.677 0.094 −9.268067 118.052594
Year −0.023017 0.016143 708.387 −1.426 0.154 −0.054711 0.008677
Cage −0.009382 0.006245 705.174 −1.502 0.133 −0.021643 0.002878
Cage2 −0.000283 0.000441 689.741 −0.641 0.521 −0.001149 0.000583
Page 15 of 33Knechtle et al. SpringerPlus (2016) 5:223
Table 4 continued
Parameter Estimate SE DF T p value 95 % CI
Upper Lower
Australia
Constant term 52.302602 107.606779 108.032 0.486 0.628 −160.991990 265.597194
Year −0.021678 0.053582 108.089 −0.405 0.687 −0.127885 0.084529
Cage −0.013969 0.030696 133.451 −0.455 0.650 −0.074683 0.046745
Cage2 −0.000317 0.002070 136.856 −0.153 0.878 −0.004411 0.003776
Belgium
Constant term 107.524420 49.224327 501.956 2.184 0.029 10.813323 204.235517
Year −0.049210 0.024501 501.911 −2.008 0.045 −0.097348 −0.001073
Cage −0.033350 0.009176 447.125 −3.635 0.000 −0.051383 −0.015317
Cage2 −7.340408E−5 0.000666 417.563 −0.110 0.912 −0.001382 0.001235
Hungary
Constant term 5.737883 94.942100 159.346 0.060 0.952 −181.769287 193.245052
Year 0.002193 0.047257 159.320 0.046 0.963 −0.091137 0.095523
Cage −0.021118 0.020068 158.936 −1.052 0.294 −0.060752 0.018515
Cage2 0.001436 0.001087 174.946 1.320 0.188 −0.000710 0.003582
Ireland
Constant term 138.624168 77.025730 130.753 1.800 0.074 −13.753783 291.002120
Year −0.064935 0.038349 130.724 −1.693 0.093 −0.140799 0.010930
Cage 0.012905 0.020461 147.172 0.631 0.529 −0.027530 0.053340
Cage2 0.001772 0.001597 146.087 1.110 0.269 −0.001384 0.004928
Poland
Constant term 86.086931 104.182157 192.160 0.826 0.410 −119.400506 291.574369
Year −0.038832 0.051868 192.148 −0.749 0.455 −0.141137 0.063472
Cage −0.092905 0.018121 167.220 −5.127 0.000 −0.128680 −0.057130
Cage2 0.001517 0.001224 171.169 1.239 0.217 −0.000899 0.003933
Russia
Constant term 211.097501 112.913539 96.255 1.870 0.065 −13.026515 435.221517
Year −0.100778 0.056233 96.273 −1.792 0.076 −0.212397 0.010840
Cage −0.066677 0.024282 81.019 −2.746 0.007 −0.114991 −0.018364
Cage2 −0.004585 0.001957 62.648 −2.343 0.022 −0.008497 −0.000674
Sweden
Constant term 23.098100 70.780786 194.032 0.326 0.745 −116.500399 162.696600
Year −0.007622 0.035234 193.992 −0.216 0.829 −0.077113 0.061870
Cage −0.041879 0.012513 177.901 −3.347 0.001 −0.066573 −0.017186
Cage2 −0.000214 0.000893 193.338 −0.239 0.811 −0.001976 0.001548
Finland
Constant term 8.266275 52.736089 163.256 0.157 0.876 −95.866485 112.399036
Year −0.000566 0.026249 163.232 −0.022 0.983 −0.052397 0.051266
Cage −0.041553 0.011615 170.064 −3.578 0.000 −0.064481 −0.018625
Cage2 0.000222 0.000718 147.558 0.309 0.758 −0.001197 0.001640
Greece
Constant term −61.629272 138.778354 63.917 −0.444 0.658 −338.877861 215.619317
Year 0.034774 0.069126 63.920 0.503 0.617 −0.103324 0.172871
Cage −0.045672 0.029991 67.495 −1.523 0.132 −0.105525 0.014181
Cage2 0.001362 0.002210 66.813 0.616 0.540 −0.003050 0.005774
Republic of South Africa
Constant term 97.835143 206.579371 37.822 0.474 0.639 −320.427710 516.097997
Year −0.045155 0.102815 37.832 −0.439 0.663 −0.253323 0.163012
Page 16 of 33Knechtle et al. SpringerPlus (2016) 5:223
in the ‘Boston Marathon’ $846,000, in the ‘TCS NYC Marathon’ $805,000 and in the ‘Bank of America Chicago Marathon’ $560,000 (www.bestroadraces.com/brr100.php/prizes). The differences in prize money seem very similar in half-marathon compared to marathon. In a large half-marathon held in Switzerland such as the ‘Hallwiler-seelauf ’, the prize money for both women and men for the top five is, however, only CHF 600, 400, 300, 200, and 100, respectively (www.hallwilerseelauf.ch). In an elite half-marathon such as the ‘IAAF/AL-Bank World Half Mara-thon Championships’, a total prize purse of US$245,000 will be paid by the IAAF for the men’s and women’s races (www.iaaf.org/news/news/prize-money).
East African runners were the fastest in half‑marathons and marathonsA second finding was that female and male runners from Kenya and Ethiopia were the fastest in both half-mar-athons and marathons. The dominance of East African runners was evident for both marathon and half-mar-athon but differed from longer distances. For instance, it has been shown that male Japanese runners were the best in 100-km ultra-marathons (Cejka et al. 2014). The trend in performance across years should be explained by a model showing that human speed after having pro-gressed fast in the past has now reached a plateau and further progression should be attributed to an enlarged
Table 4 continued
Parameter Estimate SE DF T p value 95 % CI
Upper Lower
Cage −0.114764 0.045331 42.716 −2.532 0.015 −0.206201 −0.023327
Cage2 0.002014 0.003936 43.893 0.512 0.611 −0.005919 0.009947
Brazil
Constant term 69.573202 122.101031 76.685 0.570 0.570 −173.576935 312.723340
Year −0.030992 0.060774 76.687 −0.510 0.612 −0.152015 0.090032
Cage −0.005665 0.035651 84.804 −0.159 0.874 −0.076551 0.065221
Cage2 0.000800 0.002584 85.927 0.310 0.758 −0.004337 0.005937
Mexico
Constant term 41.878671 159.784287 57.808 0.262 0.794 −277.986904 361.744245
Year −0.016374 0.079565 57.848 −0.206 0.838 −0.175650 0.142902
Cage 0.004652 0.037631 61.634 0.124 0.902 −0.070580 0.079884
Cage2 0.000324 0.002948 56.403 0.110 0.913 −0.005580 0.006229
Argentina
Constant term −280.869673 275.764919 14.061 −1.019 0.326 −872.087719 310.348372
Year 0.143819 0.137206 14.060 1.048 0.312 −0.150341 0.437979
Cage −0.105665 0.095288 20.398 −1.109 0.280 −0.304184 0.092855
Cage2 −0.008941 0.013370 20.476 −0.669 0.511 −0.036788 0.018907
India
Constant term 184.538334 187.481998 40.972 0.984 0.331 −194.097033 563.173702
Year −0.087437 0.093418 40.964 −0.936 0.355 −0.276104 0.101229
Cage −0.043125 0.036785 44.595 −1.172 0.247 −0.117232 0.030982
Cage2 −0.000763 0.003355 41.543 −0.228 0.821 −0.007536 0.006009
Israel
Constant term 23.126668 168.388173 45.039 0.137 0.891 −316.016346 362.269682
Year −0.006935 0.083826 45.030 −0.083 0.934 −0.175766 0.161896
Cage −0.016089 0.022043 28.717 −0.730 0.471 −0.061192 0.029014
Cage2 −0.000399 0.001451 29.170 −0.275 0.785 −0.003365 0.002567
Slovenia
Constant term 449.153792 328.346727 19.574 1.368 0.187 −236.722979 1135.030562
Year −0.219405 0.163419 19.579 −1.343 0.195 −0.560762 0.121952
Cage −0.078618 0.063055 11.412 −1.247 0.237 −0.216792 0.059557
Cage2 0.003187 0.005660 11.316 0.563 0.584 −0.009229 0.015603
Data for Non-African runners are sorted in order of the number of finishers of each country
Cage centered age, Cage2 centered age squared
Page 17 of 33Knechtle et al. SpringerPlus (2016) 5:223
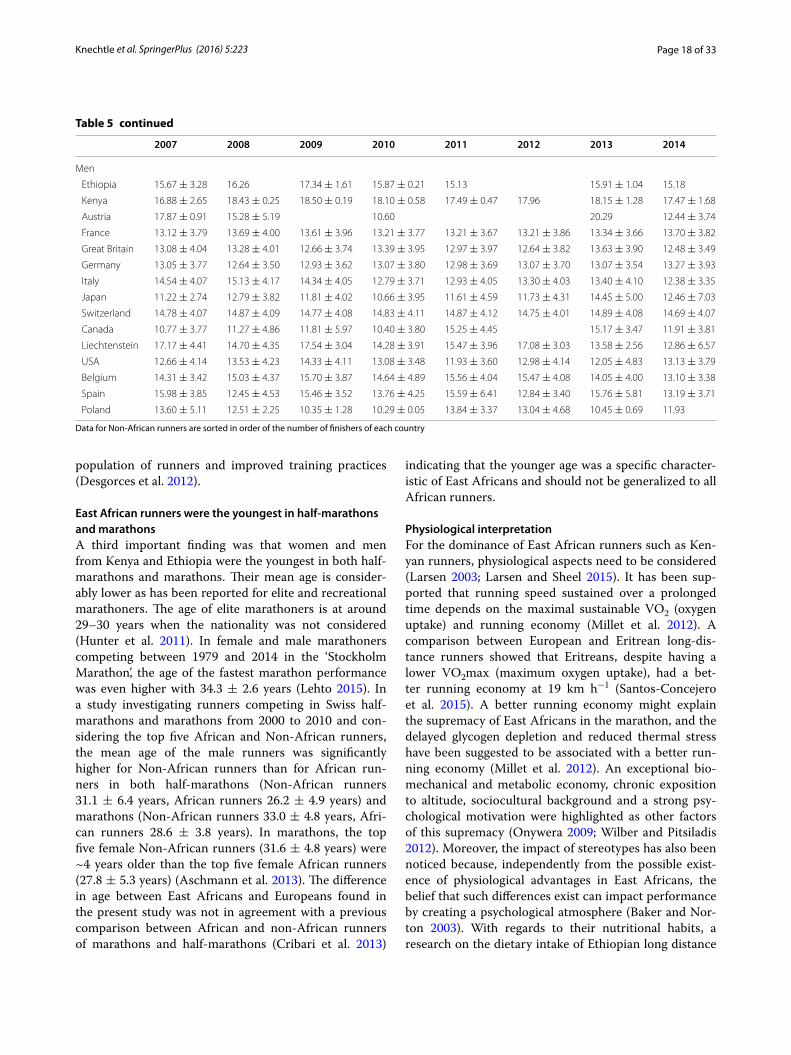
Table 5 Running speed (km/h) with mean ± SD for female and male East-African and Non-African marathoners
1999 2000 2001 2002 2003 2004 2005 2006
Women
Ethiopia 18.64
Kenya 18.26
Austria 16.42 ± 1.62 18.32 ± 1.81 12.34 13.83 ± 5.78 12.36 ± 2.18 9.80 ± 0.21 12.65 ± 3.26 12.39 ± 2.43
France 13.70 ± 4.13 13.77 ± 4.01 13.83 ± 4.05 13.72 ± 3.88 12.42 ± 3.98 13.38 ± 3.97 13.82 ± 4.43 13.27 ± 4.05
Great Britain 10.50 ± 1.45 12.73 ± 4.45 13.14 ± 5.02 12.96 ± 3.95 13.46 ± 4.35 14.47 ± 4.58 12.72 ± 2.65
Germany 11.68 ± 2.24 11.17 ± 2.63 13.90 ± 3.79 12.20 ± 3.77 12.63 ± 3.78 12.11 ± 3.34 13.04 ± 3.68 13.00 ± 3.60
Italy 17.10 19.19 ± 0.52 19.64 ± 1.30 12.67 ± 5.70 11.93 ± 3.77 15.39 ± 4.39 12.06 ± 4.28 18.78 ± 1.77
Japan 14.13 10.96 11.72 ± 5.02 7.88 ± 1.11 18.28 13.34 ± 4.69 14.27 ± 5.01 18.70
Switzerland 14.46 ± 4.34 15.30 ± 4.19 14.74 ± 4.13 15.03 ± 4.06 15.60 ± 4.01 15.44 ± 4.09 15.08 ± 4.14 15.20 ± 4.12
Canada 9.31 10.29 ± 5.82 8.00 ± 1.63 12.51 12.85 ± 7.29
Liechtenstein 11.65 9.92 ± 2.39 16.05 ± 5.43 18.13 ± 1.01 19.75 ± 0.15
USA 17.95 17.17 ± 4.07 13.92 ± 4.10 9.85 ± 1.43
Belgium 10.77 19.87 ± 0.49 10.95 ± 0.37 11.65 ± 1.62 10.90 ± 0.79
Spain 12.48
Poland 11.24 ± 0.64 8.85
Men
Ethiopia 17.47 ± 2.28
Kenya 18.81 17.95 ± 1.44 17.61 ± 1.97 17.43 ± 1.62 17.28
Austria 12.66 ± 0.09 9.10 19.37 16.18 14.40 ± 7.02 15.59 ± 5.27
France 14.08 ± 4.06 13.47 ± 3.67 13.17 ± 3.75 13.17 ± 3.30 13.28 ± 3.79 13.41 ± 3.84 13.50 ± 3.89 12.87 ± 3.48
Great Britain 9.27 ± 0.96 12.54 ± 3.61 12.01 ± 3.57 15.21 ± 2.94 15.02 ± 4.05 14.08 ± 3.79 14.15 ± 4.51 13.26 ± 3.82
Germany 12.51 ± 3.32 13.02 ± 3.78 12.67 ± 3.28 12.60 ± 3.48 12.89 ± 3.70 13.00 ± 3.66 12.49 ± 3.55 12.89 ± 3.65
Italy 16.23 ± 4.37 12.51 ± 3.77 12.85 ± 2.99 12.49 ± 4.01 12.50 ± 3.24 14.23 ± 4.04 13.66 ± 3.90 15.14 ± 3.86
Japan 15.09 14.42 12.84 ± 5.70 11.47 11.45 ± 3.85 11.09 ± 4.17 12.92 ± 4.63 11.53 ± 3.41
Switzerland 14.41 ± 3.99 14.84 ± 4.09 14.73 ± 4.07 14.77 ± 4.09 14.93 ± 4.11 14.71 ± 4.08 14.76 ± 4.04 14.83 ± 4.06
Canada 14.00 ± 0.72 18.98 12.22 ± 4.96 12.37 ± 4.83 10.50 ± 3.91 10.90 ± 3.36 11.12 ± 4.09 13.14 ± 4.06
Liechtenstein 18.70 17.56 ± 1.45 19.11 ± 1.21 15.41 ± 4.16 17.42 ± 3.08 17.80 ± 1.43
USA 12.39 ± 3.85 10.79 ± 1.55 11.25 ± 3.38 13.62 ± 3.72 12.12 ± 3.55 12.65 ± 4.21 12.14 ± 3.48 12.86 ± 4.29
Belgium 12.23 14.97 ± 5.32 14.80 ± 4.67 13.65 ± 4.98 12.71 ± 4.02 12.70 ± 3.91
Spain 13.08 19.33 18.87 ± 1.06 13.90 ± 5.05 12.63 ± 2.21 13.37 ± 4.71 14.10 ± 2.28
Poland 10.07 11.65 ± 1.73 9.05 10.36 ± 2.31 9.73 17.70 ± 2.29
2007 2008 2009 2010 2011 2012 2013 2014
Women
Ethiopia 18.78 19.24
Kenya 18.49
Austria 11.84 ± 2.64 12.88 ± 3.92 12.48 ± 1.87 14.49 ± 4.76 11.09 ± 1.30 13.21 ± 3.31 11.29 ± 2.23 11.40 ± 2.61
France 13.09 ± 3.75 14.14 ± 4.36 13.60 ± 4.05 13.04 ± 3.72 13.37 ± 3.81 13.48 ± 3.89 14.01 ± 3.65 13.47 ± 4.22
Great Britain 14.06 ± 4.43 12.85 ± 4.03 13.15 ± 0.79 13.31 ± 4.35 14.81 ± 4.85 11.46 ± 5.80 14.10 ± 3.80 12.67 ± 3.57
Germany 13.71 ± 3.85 12.97 ± 3.48 12.89 ± 3.93 13.47 ± 4.39 12.81 ± 3.56 13.24 ± 3.62 13.45 ± 4.25 12.94 ± 3.87
Italy 16.34 ± 3.92 17.44 ± 3.70 12.78 ± 3.09 18.82 ± 1.04 17.47 ± 1.84 16.90 ± 4.52 18.56 ± 0.80 16.05 ± 4.56
Japan 13.33 ± 4.01 14.24 ± 4.74 19.90 13.66 ± 1.15 11.80 ± 4.36 18.00 ± 0.39 18.49 ± 0.20 19.47 ± 1.09
Switzerland 15.20 ± 4.07 14.90 ± 4.16 15.21 ± 4.08 14.98 ± 4.27 15.03 ± 4.09 14.72 ± 4.14 15.24 ± 4.14 14.76 ± 4.02
Canada 17.99 18.53 ± 0.86 14.73 ± 6.33 9.44 ± 1.67 12.47 ± 3.63 8.06 ± 2.00 12.10 ± 3.62 11.97 ± 6.90
Liechtenstein 18.78 ± 0.79 18.31 ± 2.04 16.96 ± 4.11 12.09 16.55 16.95 ± 3.38 18.56 ± 0.24
USA 12.12 ± 4.17 13.84 ± 3.76 10.03 ± 0.19 9.39 ± 0.59 10.36 ± 1.59 15.87 12.08 ± 5.31
Belgium 11.66 9.07 13.07 9.30
Spain 17.96 ± 1.64 10.75 12.95 ± 1.50 11.79 ± 1.48 12.19 ± 0.21 19.09 12.79 ± 1.39
Poland 12.25 10.67 11.69 ± 0.57 18.01 ± 0.67 15.50 ± 3.96 12.10 ± 1.93
Page 18 of 33Knechtle et al. SpringerPlus (2016) 5:223
population of runners and improved training practices (Desgorces et al. 2012).
East African runners were the youngest in half‑marathons and marathonsA third important finding was that women and men from Kenya and Ethiopia were the youngest in both half-marathons and marathons. Their mean age is consider-ably lower as has been reported for elite and recreational marathoners. The age of elite marathoners is at around 29–30 years when the nationality was not considered (Hunter et al. 2011). In female and male marathoners competing between 1979 and 2014 in the ‘Stockholm Marathon’, the age of the fastest marathon performance was even higher with 34.3 ± 2.6 years (Lehto 2015). In a study investigating runners competing in Swiss half-marathons and marathons from 2000 to 2010 and con-sidering the top five African and Non-African runners, the mean age of the male runners was significantly higher for Non-African runners than for African run-ners in both half-marathons (Non-African runners 31.1 ± 6.4 years, African runners 26.2 ± 4.9 years) and marathons (Non-African runners 33.0 ± 4.8 years, Afri-can runners 28.6 ± 3.8 years). In marathons, the top five female Non-African runners (31.6 ± 4.8 years) were ~4 years older than the top five female African runners (27.8 ± 5.3 years) (Aschmann et al. 2013). The difference in age between East Africans and Europeans found in the present study was not in agreement with a previous comparison between African and non-African runners of marathons and half-marathons (Cribari et al. 2013)
indicating that the younger age was a specific character-istic of East Africans and should not be generalized to all African runners.
Physiological interpretationFor the dominance of East African runners such as Ken-yan runners, physiological aspects need to be considered (Larsen 2003; Larsen and Sheel 2015). It has been sup-ported that running speed sustained over a prolonged time depends on the maximal sustainable VO2 (oxygen uptake) and running economy (Millet et al. 2012). A comparison between European and Eritrean long-dis-tance runners showed that Eritreans, despite having a lower VO2max (maximum oxygen uptake), had a bet-ter running economy at 19 km h−1 (Santos-Concejero et al. 2015). A better running economy might explain the supremacy of East Africans in the marathon, and the delayed glycogen depletion and reduced thermal stress have been suggested to be associated with a better run-ning economy (Millet et al. 2012). An exceptional bio-mechanical and metabolic economy, chronic exposition to altitude, sociocultural background and a strong psy-chological motivation were highlighted as other factors of this supremacy (Onywera 2009; Wilber and Pitsiladis 2012). Moreover, the impact of stereotypes has also been noticed because, independently from the possible exist-ence of physiological advantages in East Africans, the belief that such differences exist can impact performance by creating a psychological atmosphere (Baker and Nor-ton 2003). With regards to their nutritional habits, a research on the dietary intake of Ethiopian long distance
Data for Non-African runners are sorted in order of the number of finishers of each country
Table 5 continued
2007 2008 2009 2010 2011 2012 2013 2014
Men
Ethiopia 15.67 ± 3.28 16.26 17.34 ± 1.61 15.87 ± 0.21 15.13 15.91 ± 1.04 15.18
Kenya 16.88 ± 2.65 18.43 ± 0.25 18.50 ± 0.19 18.10 ± 0.58 17.49 ± 0.47 17.96 18.15 ± 1.28 17.47 ± 1.68
Austria 17.87 ± 0.91 15.28 ± 5.19 10.60 20.29 12.44 ± 3.74
France 13.12 ± 3.79 13.69 ± 4.00 13.61 ± 3.96 13.21 ± 3.77 13.21 ± 3.67 13.21 ± 3.86 13.34 ± 3.66 13.70 ± 3.82
Great Britain 13.08 ± 4.04 13.28 ± 4.01 12.66 ± 3.74 13.39 ± 3.95 12.97 ± 3.97 12.64 ± 3.82 13.63 ± 3.90 12.48 ± 3.49
Germany 13.05 ± 3.77 12.64 ± 3.50 12.93 ± 3.62 13.07 ± 3.80 12.98 ± 3.69 13.07 ± 3.70 13.07 ± 3.54 13.27 ± 3.93
Italy 14.54 ± 4.07 15.13 ± 4.17 14.34 ± 4.05 12.79 ± 3.71 12.93 ± 4.05 13.30 ± 4.03 13.40 ± 4.10 12.38 ± 3.35
Japan 11.22 ± 2.74 12.79 ± 3.82 11.81 ± 4.02 10.66 ± 3.95 11.61 ± 4.59 11.73 ± 4.31 14.45 ± 5.00 12.46 ± 7.03
Switzerland 14.78 ± 4.07 14.87 ± 4.09 14.77 ± 4.08 14.83 ± 4.11 14.87 ± 4.12 14.75 ± 4.01 14.89 ± 4.08 14.69 ± 4.07
Canada 10.77 ± 3.77 11.27 ± 4.86 11.81 ± 5.97 10.40 ± 3.80 15.25 ± 4.45 15.17 ± 3.47 11.91 ± 3.81
Liechtenstein 17.17 ± 4.41 14.70 ± 4.35 17.54 ± 3.04 14.28 ± 3.91 15.47 ± 3.96 17.08 ± 3.03 13.58 ± 2.56 12.86 ± 6.57
USA 12.66 ± 4.14 13.53 ± 4.23 14.33 ± 4.11 13.08 ± 3.48 11.93 ± 3.60 12.98 ± 4.14 12.05 ± 4.83 13.13 ± 3.79
Belgium 14.31 ± 3.42 15.03 ± 4.37 15.70 ± 3.87 14.64 ± 4.89 15.56 ± 4.04 15.47 ± 4.08 14.05 ± 4.00 13.10 ± 3.38
Spain 15.98 ± 3.85 12.45 ± 4.53 15.46 ± 3.52 13.76 ± 4.25 15.59 ± 6.41 12.84 ± 3.40 15.76 ± 5.81 13.19 ± 3.71
Poland 13.60 ± 5.11 12.51 ± 2.25 10.35 ± 1.28 10.29 ± 0.05 13.84 ± 3.37 13.04 ± 4.68 10.45 ± 0.69 11.93
Page 19 of 33Knechtle et al. SpringerPlus (2016) 5:223
Table 6 Results of the mixed-effects regression analyses for change in running speed across years in female marathoners
Parameter Estimate SE DF T p value 95 % CI
Upper Lower
Ethiopia
Constant term 147.793813 321.794557 36.803 0.459 0.649 −504.341821 799.929446
Year −0.067200 0.160260 36.789 −0.419 0.677 −0.391981 0.257581
Cage −0.041199 0.045279 39.863 −0.910 0.368 −0.132721 0.050323
Cage2 −0.000791 0.001556 27.290 −0.508 0.615 −0.003983 0.002401
Kenya
Constant term 12.643951 134.413655 31.473 0.094 0.926 −261.327748 286.615651
Year 0.001310 0.067007 31.470 0.020 0.985 −0.135269 0.137890
Cage 0.004584 0.031623 33.197 0.145 0.886 −0.059740 0.068908
Cage2 0.000926 0.001504 28.885 0.616 0.543 −0.002150 0.004002
Austria
Constant term 319.000059 151.126310 115.787 2.111 0.037 19.669554 618.330564
Year −0.152749 0.075258 115.782 −2.030 0.045 −0.301810 −0.003688
Cage −0.059867 0.033352 105.113 −1.795 0.076 −0.125998 0.006264
Cage2 0.003428 0.002369 91.358 1.447 0.151 −0.001277 0.008132
France
Constant term −69.668517 73.011026 423.181 −0.954 0.341 −213.177937 73.840903
Year 0.041647 0.036362 423.171 1.145 0.253 −0.029825 0.113119
Cage −0.007736 0.019534 524.950 −0.396 0.692 −0.046111 0.030640
Cage2 −0.000529 0.001375 513.572 −0.385 0.701 −0.003230 0.002172
Great Britain
Constant term −32.852390 202.043235 96.505 −.163 0.871 −433.878261 368.173481
Year 0.023039 0.100666 96.499 0.229 0.819 −0.176769 0.222846
Cage 0.057327 0.032752 62.676 1.750 0.085 −0.008129 0.122782
Cage2 0.001266 0.003499 87.271 0.362 0.718 −0.005689 0.008220
Germany
Constant term −57.013601 61.704926 558.626 −0.924 0.356 −178.215628 64.188427
Year 0.035049 0.030733 558.613 1.140 0.255 −0.025317 0.095415
Cage −0.018041 0.010289 360.049 −1.754 0.080 −0.038274 0.002192
Cage2 −0.000917 0.000669 425.048 −1.370 0.172 −0.002232 0.000399
Italy
Constant term 12.643951 134.413655 31.473 0.094 0.926 −261.327748 286.615651
Year 0.001310 0.067007 31.470 0.020 0.985 −0.135269 0.137890
Cage 0.004584 0.031623 33.197 0.145 0.886 −0.059740 0.068908
Cage2 0.000926 0.001504 28.885 0.616 0.543 −0.002150 0.004002
Japan
Constant term −556.744907 324.548340 44.540 −1.715 0.093 −1210.605221 97.115408
Year 0.284663 0.161722 44.521 1.760 0.085 −0.041159 0.610486
Cage 0.002091 0.056456 36.733 0.037 0.971 −0.112328 0.116511
Cage2 −0.001140 0.002306 47.736 −.494 0.623 −0.005776 0.003496
Switzerland
Constant term 19.166945 16.359822 5730.128 1.172 0.241 −12.904491 51.238380
Year −0.001923 0.008148 5729.834 −0.236 0.813 −0.017896 0.014051
Cage 0.000169 0.002164 3789.103 0.078 0.938 −0.004074 0.004412
Cage2 −0.000271 0.000151 3903.532 −1.798 0.072 −0.000566 2.449756E−5
Canada
Constant term −84.838438 294.677013 21.509 −0.288 0.776 −696.771246 527.094370
Year 0.049412 0.146619 21.493 0.337 0.739 −0.255073 0.353897

Page 20 of 33Knechtle et al. SpringerPlus (2016) 5:223
runners has shown that they met most recommendations for endurance athletes (Beis et al. 2011). A study on the diet of Kenyan endurance runners revealed that it com-posed mostly by carbohydrates (~67 %) and less by pro-tein (~15 %) or fat (~17 %) (Fudge et al. 2006).
In addition to the abovementioned physiological fac-tors, Eastern African runners might differ from runners of other origin with regards to other specific anthropo-metric characteristics (Kohn et al. 2007; Lucia et al. 2006; Prommer et al. 2010; Vernillo et al. 2013). For instance, compared to elite German 10-km runners, elite Kenyan runners had a similar VO2max (ml min−1 kg−1) but were lighter by more than 9 kg (Prommer et al. 2010). Xhosa 10-km runners had also similar VO2max (ml min−1 kg−1) as their Caucasian counterparts, but they were lighter and shorter (Kohn et al. 2007). Eritrean distance run-ners had a lower body mass index and a better running
economy at 21 km h−1 than Spanish runners, whereas their VO2max was similar (Lucia et al. 2006). In top class Kenyan marathoners, ectomorphy is dominant, but endomorphy and mesomorphy is more than one-half unit lower (Vernillo et al. 2013).
A review of genetic and lifestyle factors of the perfor-mance of the East Africans distance runners concluded that the findings on candidate genes linked to perfor-mance of Caucasian populations were not confirmed in East Africans showing research methods’ limitations and the polygenic nature of performance (Tucker et al. 2013). This was in agreement with another review showing that distance running success of East Africans was not based on a unique genetic profile (Wilber and Pitsiladis 2012). Another parameter that has not been studied previously as much as the abovementioned parameters might be the physical activity and inactivity levels when athletes did
Data for Non-African runners are sorted in order of the number of finishers of each country
Cage centered age, Cage2 centered age squared
Table 6 continued
Parameter Estimate SE DF T p value 95 % CI
Upper Lower
Cage −0.016467 0.105620 20.899 −0.156 0.878 −0.236180 0.203247
Cage2 −0.005069 0.008542 26.178 −0.593 0.558 −0.022621 0.012484
Principality of Liechtenstein
Constant term 134.396574 114.930718 8.628 1.169 0.274 −127.312878 396.106027
Year −0.058934 0.057365 8.641 −1.027 0.332 −0.189530 0.071661
Cage 0.000824 0.052738 11.742 0.016 0.988 −0.114363 0.116012
Cage2 −0.000182 0.005460 13.149 −0.033 0.974 −0.011963 0.011599
United States of America
Constant term 147.793813 321.794557 36.803 0.459 0.649 −504.341821 799.929446
Year −0.067200 0.160260 36.789 −0.419 0.677 −0.391981 0.257581
Cage −0.041199 0.045279 39.863 −0.910 0.368 −0.132721 0.050323
Cage2 −0.000791 0.001556 27.290 −0.508 0.615 −0.003983 0.002401
Belgium
Constant term 832.877872 481.304102 14.000 1.730 0.106 −199.416758 1865.172502
Year −0.409025 0.239884 14.000 −1.705 0.110 −0.923525 0.105475
Cage 0.113307 0.073728 14.000 1.537 0.147 −0.044823 0.271437
Cage2 −0.008065 0.005950 14.000 −1.356 0.197 −0.020826 0.004695
Spain
Constant term 578.599477 459.378710 18.000 1.260 0.224 −386.519821 1543.718775
Year −0.280844 0.228570 18.000 −1.229 0.235 −0.761053 0.199365
Cage 0.085302 0.054009 9.306 1.579 0.148 −0.036264 0.206868
Cage2 −0.006105 0.004734 8.582 −1.290 0.231 −0.016894 0.004684
Poland
Constant term −1007.316625 429.834844 14.000 −2.343 0.034 −1929.220678 −85.412573
Year 0.507475 0.213730 14.000 2.374 0.032 0.049069 0.965881
Cage −0.022253 0.077353 14.000 −0.288 0.778 −0.188158 0.143652
Cage2 0.001802 0.005561 14.000 0.324 0.751 −0.010126 0.013730
Page 21 of 33Knechtle et al. SpringerPlus (2016) 5:223
Table 7 Results of the mixed-effects regression analyses for change in running speed across years in male marathoners
Parameter Estimate SE DF T p value 95 % CI
Upper Lower
Austria
Constant term 119.014606 78.665485 352.571 1.513 0.131 −35.698004 273.727215
Year −0.053124 0.039182 352.518 −1.356 0.176 −0.130183 0.023936
Cage −0.053906 0.018537 374.501 −2.908 0.004 −0.090356 −0.017456
Cage2 0.002858 0.001180 374.482 2.423 0.016 0.000538 0.005179
France
Constant term 12.224516 32.400764 1943.299 0.377 0.706 −51.319391 75.768423
Year 0.000774 0.016138 1943.341 0.048 0.962 −0.030876 0.032424
Cage −0.042530 0.007858 2185.277 −5.412 0.000 −0.057940 −0.027119
Cage2 0.001220 0.000546 2369.390 2.235 0.025 0.000150 0.002290
Great Britain
Constant term 168.008185 77.417245 265.471 2.170 0.031 15.578253 320.438116
Year −0.076916 0.038558 265.527 −1.995 0.047 −0.152834 −0.000997
Cage −0.003050 0.013447 228.557 −0.227 0.821 −0.029546 0.023446
Cage2 0.000290 0.001143 251.114 0.254 0.800 −0.001961 0.002541
Germany
Constant term −26.616836 25.282326 2510.280 −1.053 0.293 −76.193187 22.959515
Year 0.019883 0.012593 2510.229 1.579 0.114 −0.004811 0.044578
Cage −0.007977 0.005083 2186.239 −1.570 0.117 −0.017944 0.001990
Cage2 0.000147 0.000344 2231.865 0.427 0.669 −0.000528 0.000822
Italy
Constant term 82.322203 91.156734 288.896 0.903 0.367 −97.093338 261.737745
Year −0.033932 0.045393 288.917 −0.748 0.455 −0.123275 0.055411
Cage −0.058144 0.019311 261.042 −3.011 0.003 −0.096169 −0.020119
Cage2 0.000191 0.001214 322.202 0.157 0.875 −0.002199 0.002580
Japan
Constant term 49.803604 170.811818 103.019 0.292 0.771 −288.960603 388.567811
Year −0.018372 0.085088 103.003 −0.216 0.829 −0.187123 0.150380
Cage −0.086555 0.031059 107.375 −2.787 0.006 −0.148123 −0.024987
Cage2 0.001926 0.001684 107.206 1.144 0.255 −0.001412 0.005264
Switzerland
Constant term 25.878076 7.195438 22,373.993 3.596 0.000 11.774513 39.981639
Year −0.005404 0.003584 22,373.571 −1.508 0.132 −0.012428 0.001620
Cage −0.002664 0.001012 17,294.094 −2.633 0.008 −0.004647 −0.000681
Cage2 −0.000235 6.583543E−5 17,295.657 −3.565 0.000 −0.000364 −0.000106
Canada
Constant term −106.659105 171.420255 81.342 −0.622 0.536 −447.709874 234.391663
Year 0.059022 0.085420 81.336 0.691 0.492 −0.110927 0.228971
Cage −0.050496 0.030360 68.401 −1.663 0.101 −0.111073 0.010080
Cage2 0.006306 0.001988 62.037 3.172 0.002 0.002332 0.010280
Principality of Liechtenstein
Constant term 236.267620 241.570336 77.992 0.978 0.331 −244.662729 717.197969
Year −0.109511 0.120377 77.993 −0.910 0.366 −0.349164 0.130142
Cage 0.034908 0.042003 73.075 0.831 0.409 −0.048802 0.118618
Cage2 0.001951 0.003222 72.523 0.606 0.547 −0.004471 0.008373
United States of America
Constant term 179.260596 91.774367 188.890 1.953 0.052 −1.773750 360.294941
Year −0.082585 0.045712 188.881 −1.807 0.072 −0.172757 0.007587
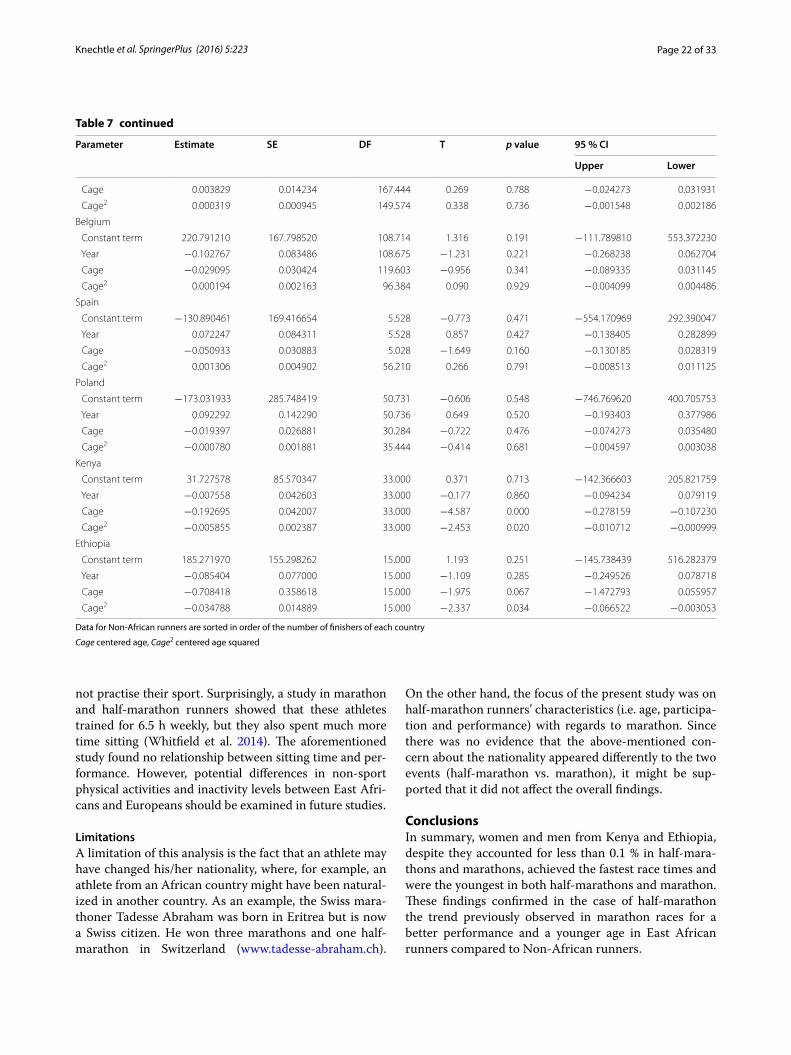
Page 22 of 33Knechtle et al. SpringerPlus (2016) 5:223
not practise their sport. Surprisingly, a study in marathon and half-marathon runners showed that these athletes trained for 6.5 h weekly, but they also spent much more time sitting (Whitfield et al. 2014). The aforementioned study found no relationship between sitting time and per-formance. However, potential differences in non-sport physical activities and inactivity levels between East Afri-cans and Europeans should be examined in future studies.
LimitationsA limitation of this analysis is the fact that an athlete may have changed his/her nationality, where, for example, an athlete from an African country might have been natural-ized in another country. As an example, the Swiss mara-thoner Tadesse Abraham was born in Eritrea but is now a Swiss citizen. He won three marathons and one half-marathon in Switzerland (www.tadesse-abraham.ch).
On the other hand, the focus of the present study was on half-marathon runners’ characteristics (i.e. age, participa-tion and performance) with regards to marathon. Since there was no evidence that the above-mentioned con-cern about the nationality appeared differently to the two events (half-marathon vs. marathon), it might be sup-ported that it did not affect the overall findings.
ConclusionsIn summary, women and men from Kenya and Ethiopia, despite they accounted for less than 0.1 % in half-mara-thons and marathons, achieved the fastest race times and were the youngest in both half-marathons and marathon. These findings confirmed in the case of half-marathon the trend previously observed in marathon races for a better performance and a younger age in East African runners compared to Non-African runners.
Data for Non-African runners are sorted in order of the number of finishers of each country
Cage centered age, Cage2 centered age squared
Table 7 continued
Parameter Estimate SE DF T p value 95 % CI
Upper Lower
Cage 0.003829 0.014234 167.444 0.269 0.788 −0.024273 0.031931
Cage2 0.000319 0.000945 149.574 0.338 0.736 −0.001548 0.002186
Belgium
Constant term 220.791210 167.798520 108.714 1.316 0.191 −111.789810 553.372230
Year −0.102767 0.083486 108.675 −1.231 0.221 −0.268238 0.062704
Cage −0.029095 0.030424 119.603 −0.956 0.341 −0.089335 0.031145
Cage2 0.000194 0.002163 96.384 0.090 0.929 −0.004099 0.004486
Spain
Constant term −130.890461 169.416654 5.528 −0.773 0.471 −554.170969 292.390047
Year 0.072247 0.084311 5.528 0.857 0.427 −0.138405 0.282899
Cage −0.050933 0.030883 5.028 −1.649 0.160 −0.130185 0.028319
Cage2 0.001306 0.004902 56.210 0.266 0.791 −0.008513 0.011125
Poland
Constant term −173.031933 285.748419 50.731 −0.606 0.548 −746.769620 400.705753
Year 0.092292 0.142290 50.736 0.649 0.520 −0.193403 0.377986
Cage −0.019397 0.026881 30.284 −0.722 0.476 −0.074273 0.035480
Cage2 −0.000780 0.001881 35.444 −0.414 0.681 −0.004597 0.003038
Kenya
Constant term 31.727578 85.570347 33.000 0.371 0.713 −142.366603 205.821759
Year −0.007558 0.042603 33.000 −0.177 0.860 −0.094234 0.079119
Cage −0.192695 0.042007 33.000 −4.587 0.000 −0.278159 −0.107230
Cage2 −0.005855 0.002387 33.000 −2.453 0.020 −0.010712 −0.000999
Ethiopia
Constant term 185.271970 155.298262 15.000 1.193 0.251 −145.738439 516.282379
Year −0.085404 0.077000 15.000 −1.109 0.285 −0.249526 0.078718
Cage −0.708418 0.358618 15.000 −1.975 0.067 −1.472793 0.055957
Cage2 −0.034788 0.014889 15.000 −2.337 0.034 −0.066522 −0.003053
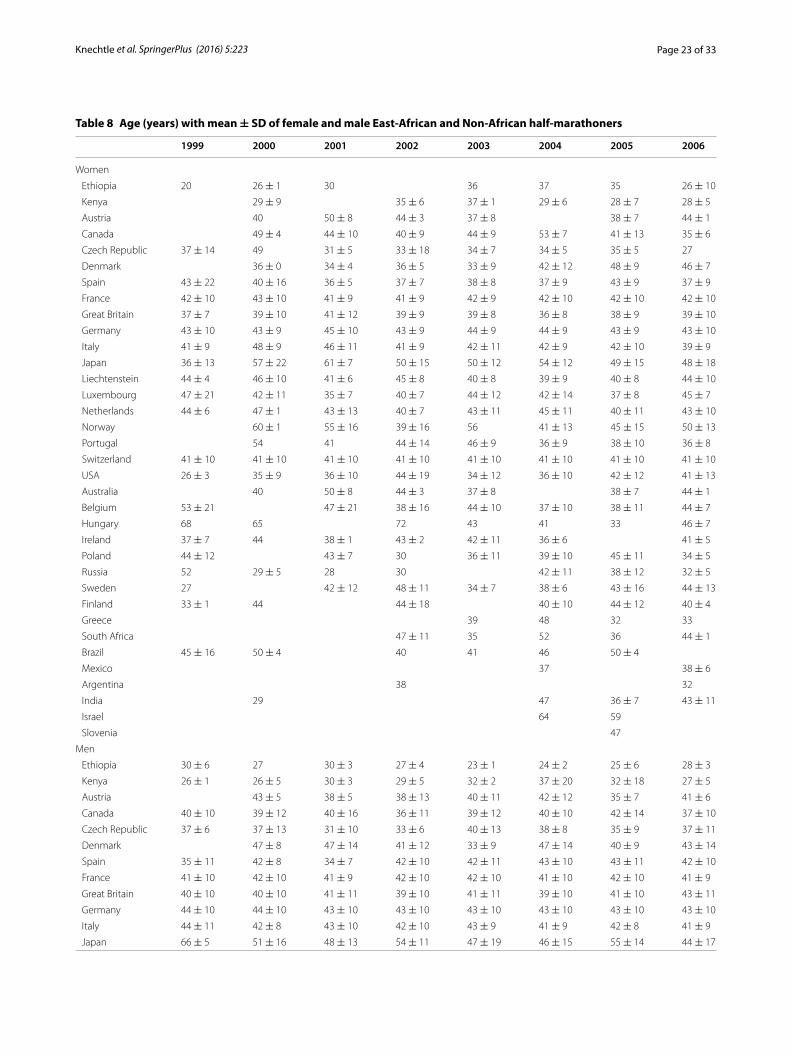
Page 23 of 33Knechtle et al. SpringerPlus (2016) 5:223
Table 8 Age (years) with mean ± SD of female and male East-African and Non-African half-marathoners
1999 2000 2001 2002 2003 2004 2005 2006
Women
Ethiopia 20 26 ± 1 30 36 37 35 26 ± 10
Kenya 29 ± 9 35 ± 6 37 ± 1 29 ± 6 28 ± 7 28 ± 5
Austria 40 50 ± 8 44 ± 3 37 ± 8 38 ± 7 44 ± 1
Canada 49 ± 4 44 ± 10 40 ± 9 44 ± 9 53 ± 7 41 ± 13 35 ± 6
Czech Republic 37 ± 14 49 31 ± 5 33 ± 18 34 ± 7 34 ± 5 35 ± 5 27
Denmark 36 ± 0 34 ± 4 36 ± 5 33 ± 9 42 ± 12 48 ± 9 46 ± 7
Spain 43 ± 22 40 ± 16 36 ± 5 37 ± 7 38 ± 8 37 ± 9 43 ± 9 37 ± 9
France 42 ± 10 43 ± 10 41 ± 9 41 ± 9 42 ± 9 42 ± 10 42 ± 10 42 ± 10
Great Britain 37 ± 7 39 ± 10 41 ± 12 39 ± 9 39 ± 8 36 ± 8 38 ± 9 39 ± 10
Germany 43 ± 10 43 ± 9 45 ± 10 43 ± 9 44 ± 9 44 ± 9 43 ± 9 43 ± 10
Italy 41 ± 9 48 ± 9 46 ± 11 41 ± 9 42 ± 11 42 ± 9 42 ± 10 39 ± 9
Japan 36 ± 13 57 ± 22 61 ± 7 50 ± 15 50 ± 12 54 ± 12 49 ± 15 48 ± 18
Liechtenstein 44 ± 4 46 ± 10 41 ± 6 45 ± 8 40 ± 8 39 ± 9 40 ± 8 44 ± 10
Luxembourg 47 ± 21 42 ± 11 35 ± 7 40 ± 7 44 ± 12 42 ± 14 37 ± 8 45 ± 7
Netherlands 44 ± 6 47 ± 1 43 ± 13 40 ± 7 43 ± 11 45 ± 11 40 ± 11 43 ± 10
Norway 60 ± 1 55 ± 16 39 ± 16 56 41 ± 13 45 ± 15 50 ± 13
Portugal 54 41 44 ± 14 46 ± 9 36 ± 9 38 ± 10 36 ± 8
Switzerland 41 ± 10 41 ± 10 41 ± 10 41 ± 10 41 ± 10 41 ± 10 41 ± 10 41 ± 10
USA 26 ± 3 35 ± 9 36 ± 10 44 ± 19 34 ± 12 36 ± 10 42 ± 12 41 ± 13
Australia 40 50 ± 8 44 ± 3 37 ± 8 38 ± 7 44 ± 1
Belgium 53 ± 21 47 ± 21 38 ± 16 44 ± 10 37 ± 10 38 ± 11 44 ± 7
Hungary 68 65 72 43 41 33 46 ± 7
Ireland 37 ± 7 44 38 ± 1 43 ± 2 42 ± 11 36 ± 6 41 ± 5
Poland 44 ± 12 43 ± 7 30 36 ± 11 39 ± 10 45 ± 11 34 ± 5
Russia 52 29 ± 5 28 30 42 ± 11 38 ± 12 32 ± 5
Sweden 27 42 ± 12 48 ± 11 34 ± 7 38 ± 6 43 ± 16 44 ± 13
Finland 33 ± 1 44 44 ± 18 40 ± 10 44 ± 12 40 ± 4
Greece 39 48 32 33
South Africa 47 ± 11 35 52 36 44 ± 1
Brazil 45 ± 16 50 ± 4 40 41 46 50 ± 4
Mexico 37 38 ± 6
Argentina 38 32
India 29 47 36 ± 7 43 ± 11
Israel 64 59
Slovenia 47
Men
Ethiopia 30 ± 6 27 30 ± 3 27 ± 4 23 ± 1 24 ± 2 25 ± 6 28 ± 3
Kenya 26 ± 1 26 ± 5 30 ± 3 29 ± 5 32 ± 2 37 ± 20 32 ± 18 27 ± 5
Austria 43 ± 5 38 ± 5 38 ± 13 40 ± 11 42 ± 12 35 ± 7 41 ± 6
Canada 40 ± 10 39 ± 12 40 ± 16 36 ± 11 39 ± 12 40 ± 10 42 ± 14 37 ± 10
Czech Republic 37 ± 6 37 ± 13 31 ± 10 33 ± 6 40 ± 13 38 ± 8 35 ± 9 37 ± 11
Denmark 47 ± 8 47 ± 14 41 ± 12 33 ± 9 47 ± 14 40 ± 9 43 ± 14
Spain 35 ± 11 42 ± 8 34 ± 7 42 ± 10 42 ± 11 43 ± 10 43 ± 11 42 ± 10
France 41 ± 10 42 ± 10 41 ± 9 42 ± 10 42 ± 10 41 ± 10 42 ± 10 41 ± 9
Great Britain 40 ± 10 40 ± 10 41 ± 11 39 ± 10 41 ± 11 39 ± 10 41 ± 10 43 ± 11
Germany 44 ± 10 44 ± 10 43 ± 10 43 ± 10 43 ± 10 43 ± 10 43 ± 10 43 ± 10
Italy 44 ± 11 42 ± 8 43 ± 10 42 ± 10 43 ± 9 41 ± 9 42 ± 8 41 ± 9
Japan 66 ± 5 51 ± 16 48 ± 13 54 ± 11 47 ± 19 46 ± 15 55 ± 14 44 ± 17
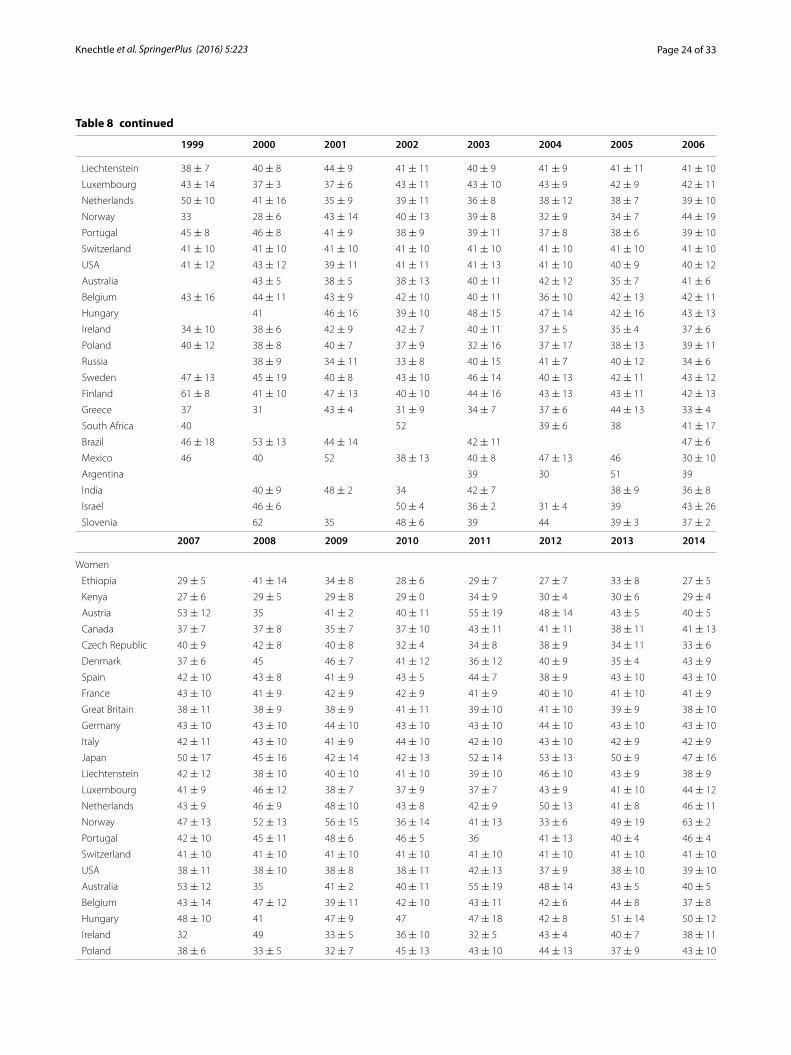
Page 24 of 33Knechtle et al. SpringerPlus (2016) 5:223
Table 8 continued
1999 2000 2001 2002 2003 2004 2005 2006
Liechtenstein 38 ± 7 40 ± 8 44 ± 9 41 ± 11 40 ± 9 41 ± 9 41 ± 11 41 ± 10
Luxembourg 43 ± 14 37 ± 3 37 ± 6 43 ± 11 43 ± 10 43 ± 9 42 ± 9 42 ± 11
Netherlands 50 ± 10 41 ± 16 35 ± 9 39 ± 11 36 ± 8 38 ± 12 38 ± 7 39 ± 10
Norway 33 28 ± 6 43 ± 14 40 ± 13 39 ± 8 32 ± 9 34 ± 7 44 ± 19
Portugal 45 ± 8 46 ± 8 41 ± 9 38 ± 9 39 ± 11 37 ± 8 38 ± 6 39 ± 10
Switzerland 41 ± 10 41 ± 10 41 ± 10 41 ± 10 41 ± 10 41 ± 10 41 ± 10 41 ± 10
USA 41 ± 12 43 ± 12 39 ± 11 41 ± 11 41 ± 13 41 ± 10 40 ± 9 40 ± 12
Australia 43 ± 5 38 ± 5 38 ± 13 40 ± 11 42 ± 12 35 ± 7 41 ± 6
Belgium 43 ± 16 44 ± 11 43 ± 9 42 ± 10 40 ± 11 36 ± 10 42 ± 13 42 ± 11
Hungary 41 46 ± 16 39 ± 10 48 ± 15 47 ± 14 42 ± 16 43 ± 13
Ireland 34 ± 10 38 ± 6 42 ± 9 42 ± 7 40 ± 11 37 ± 5 35 ± 4 37 ± 6
Poland 40 ± 12 38 ± 8 40 ± 7 37 ± 9 32 ± 16 37 ± 17 38 ± 13 39 ± 11
Russia 38 ± 9 34 ± 11 33 ± 8 40 ± 15 41 ± 7 40 ± 12 34 ± 6
Sweden 47 ± 13 45 ± 19 40 ± 8 43 ± 10 46 ± 14 40 ± 13 42 ± 11 43 ± 12
Finland 61 ± 8 41 ± 10 47 ± 13 40 ± 10 44 ± 16 43 ± 13 43 ± 11 42 ± 13
Greece 37 31 43 ± 4 31 ± 9 34 ± 7 37 ± 6 44 ± 13 33 ± 4
South Africa 40 52 39 ± 6 38 41 ± 17
Brazil 46 ± 18 53 ± 13 44 ± 14 42 ± 11 47 ± 6
Mexico 46 40 52 38 ± 13 40 ± 8 47 ± 13 46 30 ± 10
Argentina 39 30 51 39
India 40 ± 9 48 ± 2 34 42 ± 7 38 ± 9 36 ± 8
Israel 46 ± 6 50 ± 4 36 ± 2 31 ± 4 39 43 ± 26
Slovenia 62 35 48 ± 6 39 44 39 ± 3 37 ± 2
2007 2008 2009 2010 2011 2012 2013 2014
Women
Ethiopia 29 ± 5 41 ± 14 34 ± 8 28 ± 6 29 ± 7 27 ± 7 33 ± 8 27 ± 5
Kenya 27 ± 6 29 ± 5 29 ± 8 29 ± 0 34 ± 9 30 ± 4 30 ± 6 29 ± 4
Austria 53 ± 12 35 41 ± 2 40 ± 11 55 ± 19 48 ± 14 43 ± 5 40 ± 5
Canada 37 ± 7 37 ± 8 35 ± 7 37 ± 10 43 ± 11 41 ± 11 38 ± 11 41 ± 13
Czech Republic 40 ± 9 42 ± 8 40 ± 8 32 ± 4 34 ± 8 38 ± 9 34 ± 11 33 ± 6
Denmark 37 ± 6 45 46 ± 7 41 ± 12 36 ± 12 40 ± 9 35 ± 4 43 ± 9
Spain 42 ± 10 43 ± 8 41 ± 9 43 ± 5 44 ± 7 38 ± 9 43 ± 10 43 ± 10
France 43 ± 10 41 ± 9 42 ± 9 42 ± 9 41 ± 9 40 ± 10 41 ± 10 41 ± 9
Great Britain 38 ± 11 38 ± 9 38 ± 9 41 ± 11 39 ± 10 41 ± 10 39 ± 9 38 ± 10
Germany 43 ± 10 43 ± 10 44 ± 10 43 ± 10 43 ± 10 44 ± 10 43 ± 10 43 ± 10
Italy 42 ± 11 43 ± 10 41 ± 9 44 ± 10 42 ± 10 43 ± 10 42 ± 9 42 ± 9
Japan 50 ± 17 45 ± 16 42 ± 14 42 ± 13 52 ± 14 53 ± 13 50 ± 9 47 ± 16
Liechtenstein 42 ± 12 38 ± 10 40 ± 10 41 ± 10 39 ± 10 46 ± 10 43 ± 9 38 ± 9
Luxembourg 41 ± 9 46 ± 12 38 ± 7 37 ± 9 37 ± 7 43 ± 9 41 ± 10 44 ± 12
Netherlands 43 ± 9 46 ± 9 48 ± 10 43 ± 8 42 ± 9 50 ± 13 41 ± 8 46 ± 11
Norway 47 ± 13 52 ± 13 56 ± 15 36 ± 14 41 ± 13 33 ± 6 49 ± 19 63 ± 2
Portugal 42 ± 10 45 ± 11 48 ± 6 46 ± 5 36 41 ± 13 40 ± 4 46 ± 4
Switzerland 41 ± 10 41 ± 10 41 ± 10 41 ± 10 41 ± 10 41 ± 10 41 ± 10 41 ± 10
USA 38 ± 11 38 ± 10 38 ± 8 38 ± 11 42 ± 13 37 ± 9 38 ± 10 39 ± 10
Australia 53 ± 12 35 41 ± 2 40 ± 11 55 ± 19 48 ± 14 43 ± 5 40 ± 5
Belgium 43 ± 14 47 ± 12 39 ± 11 42 ± 10 43 ± 11 42 ± 6 44 ± 8 37 ± 8
Hungary 48 ± 10 41 47 ± 9 47 47 ± 18 42 ± 8 51 ± 14 50 ± 12
Ireland 32 49 33 ± 5 36 ± 10 32 ± 5 43 ± 4 40 ± 7 38 ± 11
Poland 38 ± 6 33 ± 5 32 ± 7 45 ± 13 43 ± 10 44 ± 13 37 ± 9 43 ± 10
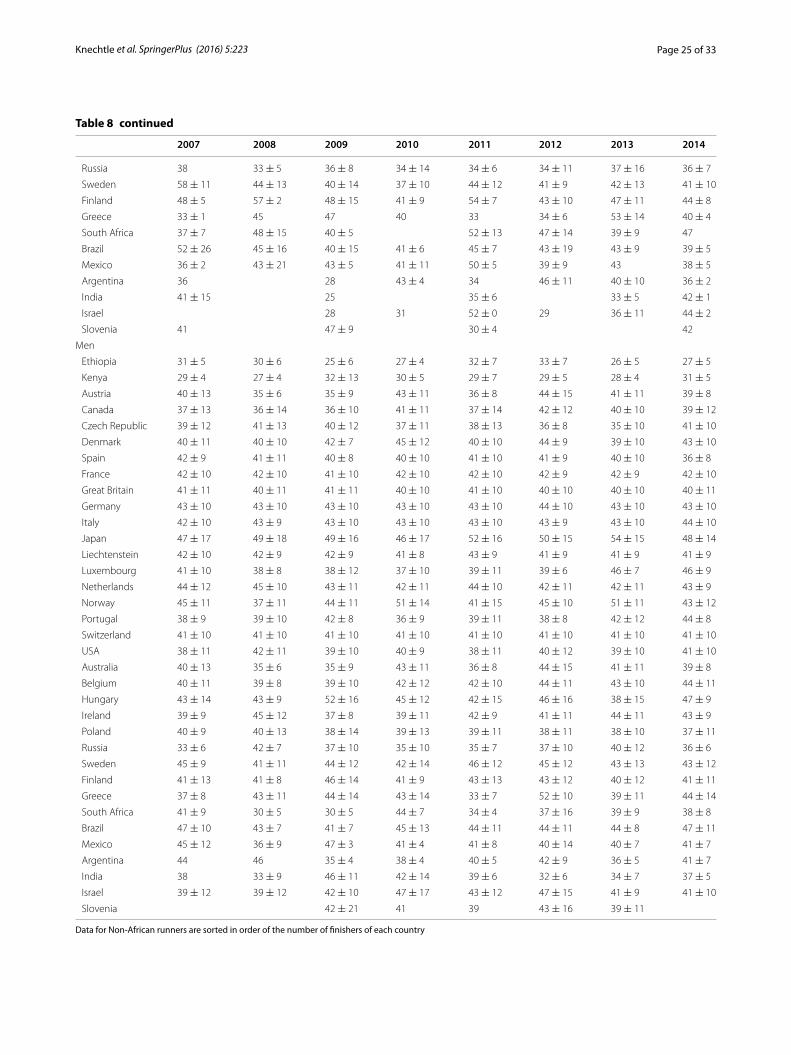
Page 25 of 33Knechtle et al. SpringerPlus (2016) 5:223
Table 8 continued
2007 2008 2009 2010 2011 2012 2013 2014
Russia 38 33 ± 5 36 ± 8 34 ± 14 34 ± 6 34 ± 11 37 ± 16 36 ± 7
Sweden 58 ± 11 44 ± 13 40 ± 14 37 ± 10 44 ± 12 41 ± 9 42 ± 13 41 ± 10
Finland 48 ± 5 57 ± 2 48 ± 15 41 ± 9 54 ± 7 43 ± 10 47 ± 11 44 ± 8
Greece 33 ± 1 45 47 40 33 34 ± 6 53 ± 14 40 ± 4
South Africa 37 ± 7 48 ± 15 40 ± 5 52 ± 13 47 ± 14 39 ± 9 47
Brazil 52 ± 26 45 ± 16 40 ± 15 41 ± 6 45 ± 7 43 ± 19 43 ± 9 39 ± 5
Mexico 36 ± 2 43 ± 21 43 ± 5 41 ± 11 50 ± 5 39 ± 9 43 38 ± 5
Argentina 36 28 43 ± 4 34 46 ± 11 40 ± 10 36 ± 2
India 41 ± 15 25 35 ± 6 33 ± 5 42 ± 1
Israel 28 31 52 ± 0 29 36 ± 11 44 ± 2
Slovenia 41 47 ± 9 30 ± 4 42
Men
Ethiopia 31 ± 5 30 ± 6 25 ± 6 27 ± 4 32 ± 7 33 ± 7 26 ± 5 27 ± 5
Kenya 29 ± 4 27 ± 4 32 ± 13 30 ± 5 29 ± 7 29 ± 5 28 ± 4 31 ± 5
Austria 40 ± 13 35 ± 6 35 ± 9 43 ± 11 36 ± 8 44 ± 15 41 ± 11 39 ± 8
Canada 37 ± 13 36 ± 14 36 ± 10 41 ± 11 37 ± 14 42 ± 12 40 ± 10 39 ± 12
Czech Republic 39 ± 12 41 ± 13 40 ± 12 37 ± 11 38 ± 13 36 ± 8 35 ± 10 41 ± 10
Denmark 40 ± 11 40 ± 10 42 ± 7 45 ± 12 40 ± 10 44 ± 9 39 ± 10 43 ± 10
Spain 42 ± 9 41 ± 11 40 ± 8 40 ± 10 41 ± 10 41 ± 9 40 ± 10 36 ± 8
France 42 ± 10 42 ± 10 41 ± 10 42 ± 10 42 ± 10 42 ± 9 42 ± 9 42 ± 10
Great Britain 41 ± 11 40 ± 11 41 ± 11 40 ± 10 41 ± 10 40 ± 10 40 ± 10 40 ± 11
Germany 43 ± 10 43 ± 10 43 ± 10 43 ± 10 43 ± 10 44 ± 10 43 ± 10 43 ± 10
Italy 42 ± 10 43 ± 9 43 ± 10 43 ± 10 43 ± 10 43 ± 9 43 ± 10 44 ± 10
Japan 47 ± 17 49 ± 18 49 ± 16 46 ± 17 52 ± 16 50 ± 15 54 ± 15 48 ± 14
Liechtenstein 42 ± 10 42 ± 9 42 ± 9 41 ± 8 43 ± 9 41 ± 9 41 ± 9 41 ± 9
Luxembourg 41 ± 10 38 ± 8 38 ± 12 37 ± 10 39 ± 11 39 ± 6 46 ± 7 46 ± 9
Netherlands 44 ± 12 45 ± 10 43 ± 11 42 ± 11 44 ± 10 42 ± 11 42 ± 11 43 ± 9
Norway 45 ± 11 37 ± 11 44 ± 11 51 ± 14 41 ± 15 45 ± 10 51 ± 11 43 ± 12
Portugal 38 ± 9 39 ± 10 42 ± 8 36 ± 9 39 ± 11 38 ± 8 42 ± 12 44 ± 8
Switzerland 41 ± 10 41 ± 10 41 ± 10 41 ± 10 41 ± 10 41 ± 10 41 ± 10 41 ± 10
USA 38 ± 11 42 ± 11 39 ± 10 40 ± 9 38 ± 11 40 ± 12 39 ± 10 41 ± 10
Australia 40 ± 13 35 ± 6 35 ± 9 43 ± 11 36 ± 8 44 ± 15 41 ± 11 39 ± 8
Belgium 40 ± 11 39 ± 8 39 ± 10 42 ± 12 42 ± 10 44 ± 11 43 ± 10 44 ± 11
Hungary 43 ± 14 43 ± 9 52 ± 16 45 ± 12 42 ± 15 46 ± 16 38 ± 15 47 ± 9
Ireland 39 ± 9 45 ± 12 37 ± 8 39 ± 11 42 ± 9 41 ± 11 44 ± 11 43 ± 9
Poland 40 ± 9 40 ± 13 38 ± 14 39 ± 13 39 ± 11 38 ± 11 38 ± 10 37 ± 11
Russia 33 ± 6 42 ± 7 37 ± 10 35 ± 10 35 ± 7 37 ± 10 40 ± 12 36 ± 6
Sweden 45 ± 9 41 ± 11 44 ± 12 42 ± 14 46 ± 12 45 ± 12 43 ± 13 43 ± 12
Finland 41 ± 13 41 ± 8 46 ± 14 41 ± 9 43 ± 13 43 ± 12 40 ± 12 41 ± 11
Greece 37 ± 8 43 ± 11 44 ± 14 43 ± 14 33 ± 7 52 ± 10 39 ± 11 44 ± 14
South Africa 41 ± 9 30 ± 5 30 ± 5 44 ± 7 34 ± 4 37 ± 16 39 ± 9 38 ± 8
Brazil 47 ± 10 43 ± 7 41 ± 7 45 ± 13 44 ± 11 44 ± 11 44 ± 8 47 ± 11
Mexico 45 ± 12 36 ± 9 47 ± 3 41 ± 4 41 ± 8 40 ± 14 40 ± 7 41 ± 7
Argentina 44 46 35 ± 4 38 ± 4 40 ± 5 42 ± 9 36 ± 5 41 ± 7
India 38 33 ± 9 46 ± 11 42 ± 14 39 ± 6 32 ± 6 34 ± 7 37 ± 5
Israel 39 ± 12 39 ± 12 42 ± 10 47 ± 17 43 ± 12 47 ± 15 41 ± 9 41 ± 10
Slovenia 42 ± 21 41 39 43 ± 16 39 ± 11
Data for Non-African runners are sorted in order of the number of finishers of each country
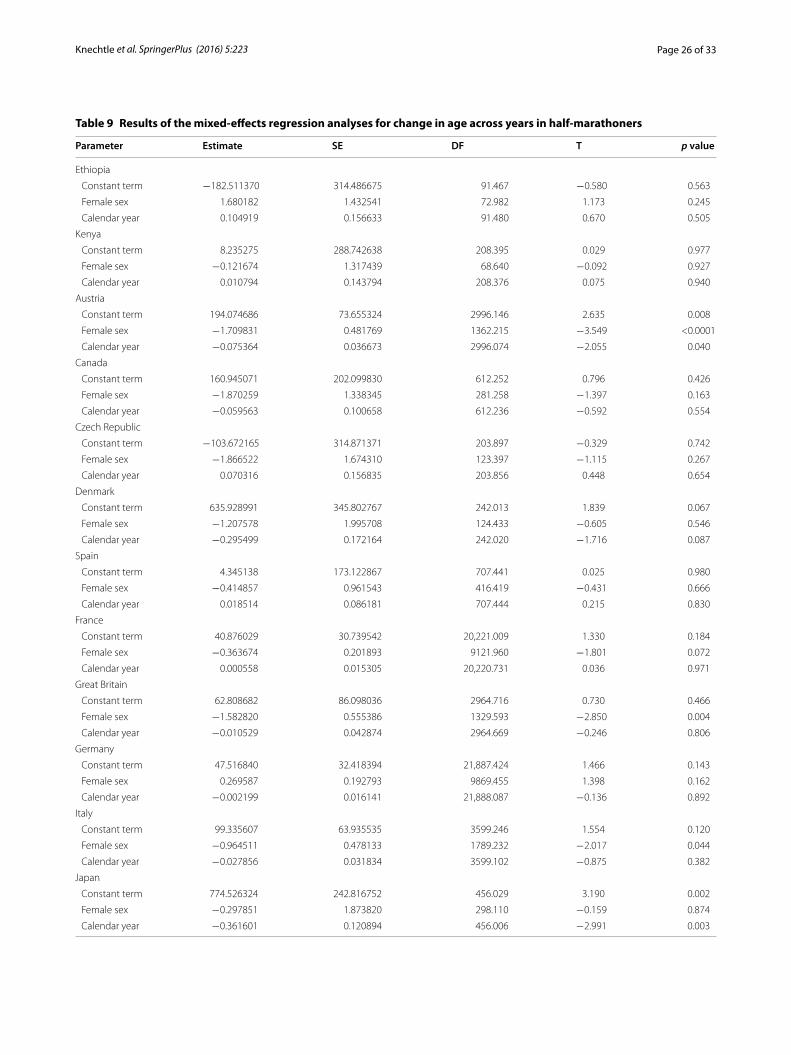
Page 26 of 33Knechtle et al. SpringerPlus (2016) 5:223
Table 9 Results of the mixed-effects regression analyses for change in age across years in half-marathoners
Parameter Estimate SE DF T p value
Ethiopia
Constant term −182.511370 314.486675 91.467 −0.580 0.563
Female sex 1.680182 1.432541 72.982 1.173 0.245
Calendar year 0.104919 0.156633 91.480 0.670 0.505
Kenya
Constant term 8.235275 288.742638 208.395 0.029 0.977
Female sex −0.121674 1.317439 68.640 −0.092 0.927
Calendar year 0.010794 0.143794 208.376 0.075 0.940
Austria
Constant term 194.074686 73.655324 2996.146 2.635 0.008
Female sex −1.709831 0.481769 1362.215 −3.549 <0.0001
Calendar year −0.075364 0.036673 2996.074 −2.055 0.040
Canada
Constant term 160.945071 202.099830 612.252 0.796 0.426
Female sex −1.870259 1.338345 281.258 −1.397 0.163
Calendar year −0.059563 0.100658 612.236 −0.592 0.554
Czech Republic
Constant term −103.672165 314.871371 203.897 −0.329 0.742
Female sex −1.866522 1.674310 123.397 −1.115 0.267
Calendar year 0.070316 0.156835 203.856 0.448 0.654
Denmark
Constant term 635.928991 345.802767 242.013 1.839 0.067
Female sex −1.207578 1.995708 124.433 −0.605 0.546
Calendar year −0.295499 0.172164 242.020 −1.716 0.087
Spain
Constant term 4.345138 173.122867 707.441 0.025 0.980
Female sex −0.414857 0.961543 416.419 −0.431 0.666
Calendar year 0.018514 0.086181 707.444 0.215 0.830
France
Constant term 40.876029 30.739542 20,221.009 1.330 0.184
Female sex −0.363674 0.201893 9121.960 −1.801 0.072
Calendar year 0.000558 0.015305 20,220.731 0.036 0.971
Great Britain
Constant term 62.808682 86.098036 2964.716 0.730 0.466
Female sex −1.582820 0.555386 1329.593 −2.850 0.004
Calendar year −0.010529 0.042874 2964.669 −0.246 0.806
Germany
Constant term 47.516840 32.418394 21,887.424 1.466 0.143
Female sex 0.269587 0.192793 9869.455 1.398 0.162
Calendar year −0.002199 0.016141 21,888.087 −0.136 0.892
Italy
Constant term 99.335607 63.935535 3599.246 1.554 0.120
Female sex −0.964511 0.478133 1789.232 −2.017 0.044
Calendar year −0.027856 0.031834 3599.102 −0.875 0.382
Japan
Constant term 774.526324 242.816752 456.029 3.190 0.002
Female sex −0.297851 1.873820 298.110 −0.159 0.874
Calendar year −0.361601 0.120894 456.006 −2.991 0.003
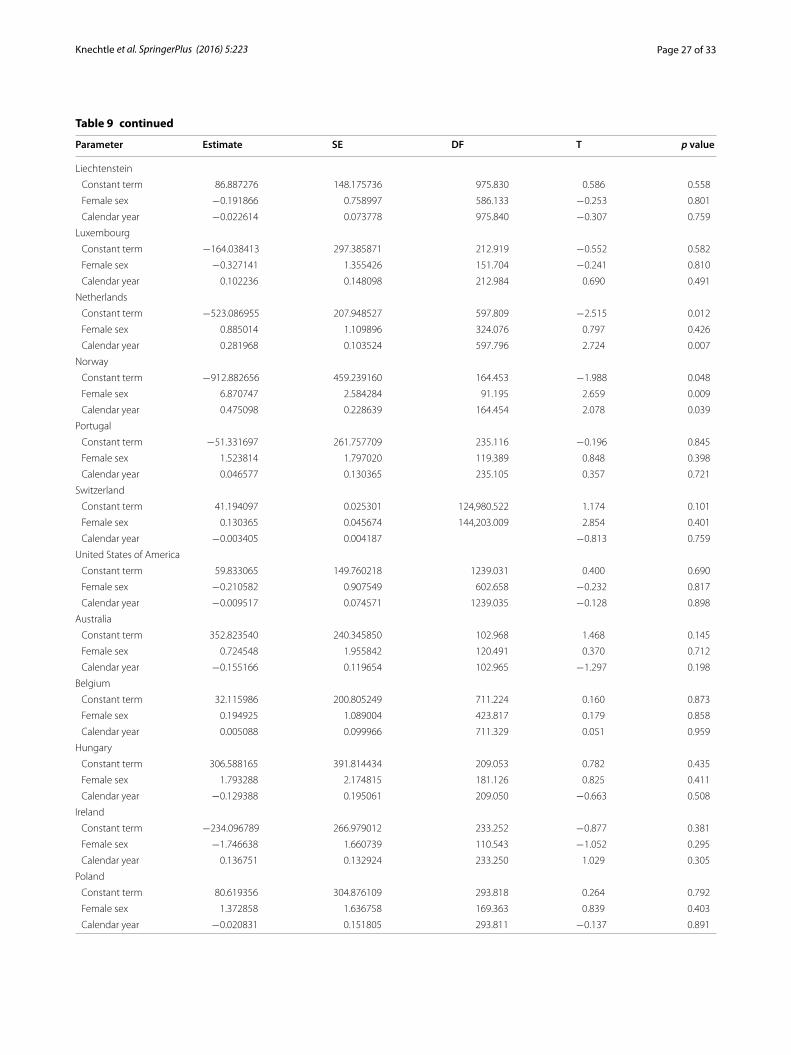
Page 27 of 33Knechtle et al. SpringerPlus (2016) 5:223
Table 9 continued
Parameter Estimate SE DF T p value
Liechtenstein
Constant term 86.887276 148.175736 975.830 0.586 0.558
Female sex −0.191866 0.758997 586.133 −0.253 0.801
Calendar year −0.022614 0.073778 975.840 −0.307 0.759
Luxembourg
Constant term −164.038413 297.385871 212.919 −0.552 0.582
Female sex −0.327141 1.355426 151.704 −0.241 0.810
Calendar year 0.102236 0.148098 212.984 0.690 0.491
Netherlands
Constant term −523.086955 207.948527 597.809 −2.515 0.012
Female sex 0.885014 1.109896 324.076 0.797 0.426
Calendar year 0.281968 0.103524 597.796 2.724 0.007
Norway
Constant term −912.882656 459.239160 164.453 −1.988 0.048
Female sex 6.870747 2.584284 91.195 2.659 0.009
Calendar year 0.475098 0.228639 164.454 2.078 0.039
Portugal
Constant term −51.331697 261.757709 235.116 −0.196 0.845
Female sex 1.523814 1.797020 119.389 0.848 0.398
Calendar year 0.046577 0.130365 235.105 0.357 0.721
Switzerland
Constant term 41.194097 0.025301 124,980.522 1.174 0.101
Female sex 0.130365 0.045674 144,203.009 2.854 0.401
Calendar year −0.003405 0.004187 −0.813 0.759
United States of America
Constant term 59.833065 149.760218 1239.031 0.400 0.690
Female sex −0.210582 0.907549 602.658 −0.232 0.817
Calendar year −0.009517 0.074571 1239.035 −0.128 0.898
Australia
Constant term 352.823540 240.345850 102.968 1.468 0.145
Female sex 0.724548 1.955842 120.491 0.370 0.712
Calendar year −0.155166 0.119654 102.965 −1.297 0.198
Belgium
Constant term 32.115986 200.805249 711.224 0.160 0.873
Female sex 0.194925 1.089004 423.817 0.179 0.858
Calendar year 0.005088 0.099966 711.329 0.051 0.959
Hungary
Constant term 306.588165 391.814434 209.053 0.782 0.435
Female sex 1.793288 2.174815 181.126 0.825 0.411
Calendar year −0.129388 0.195061 209.050 −0.663 0.508
Ireland
Constant term −234.096789 266.979012 233.252 −0.877 0.381
Female sex −1.746638 1.660739 110.543 −1.052 0.295
Calendar year 0.136751 0.132924 233.250 1.029 0.305
Poland
Constant term 80.619356 304.876109 293.818 0.264 0.792
Female sex 1.372858 1.636758 169.363 0.839 0.403
Calendar year −0.020831 0.151805 293.811 −0.137 0.891

Page 28 of 33Knechtle et al. SpringerPlus (2016) 5:223
Table 9 continued
Parameter Estimate SE DF T p value
Russia
Constant term 172.423406 334.325523 166.780 0.516 0.607
Female sex −1.652883 1.736428 115.009 −0.952 0.343
Calendar year −0.067115 0.166487 166.786 −0.403 0.687
Sweden
Constant term 289.316852 335.082052 353.960 0.863 0.388
Female sex −0.592306 1.563797 209.865 −0.379 0.705
Calendar year −0.122190 0.166817 353.950 −0.732 0.464
Finland
Constant term −59.142933 311.996766 307.703 −0.190 0.850
Female sex 3.608451 1.778953 155.630 2.028 0.044
Calendar year 0.049886 0.155324 307.703 0.321 0.748
Greece
Constant term −892.527239 519.331793 93.956 −1.719 0.089
Female sex −0.405076 2.897113 68.342 −0.140 0.889
Calendar year 0.464430 0.258636 93.954 1.796 0.076
Republic of South Africa
Constant term 636.290049 640.320419 75.353 0.994 0.324
Female sex 2.142126 2.784791 44.423 0.769 0.446
Calendar year −0.296861 0.318625 75.353 −0.932 0.354
Brazil
Constant term 390.737458 494.198576 122.510 0.791 0.431
Female sex −1.389051 2.469821 73.141 −0.562 0.576
Calendar year −0.171769 0.245978 122.514 −0.698 0.486
Mexico
Constant term 342.919947 496.145544 92.343 0.691 0.491
Female sex −0.070202 2.152566 68.580 −0.033 0.974
Calendar year −0.150281 0.246976 92.326 −0.608 0.544
Argentina
Constant term −133.127127 591.831333 31.764 −0.225 0.823
Female sex −2.442123 2.570733 24.433 −0.950 0.351
Calendar year 0.086027 0.294531 31.768 0.292 0.772
India
Constant term 647.670352 567.767634 57.387 1.141 0.259
Female sex −0.840896 2.566219 39.798 −0.328 0.745
Calendar year −0.302860 0.282792 57.372 −1.071 0.289
Israel
Constant term 369.720687 818.353267 61.363 0.452 0.653
Female sex 2.219258 4.361460 43.335 0.509 0.613
Calendar year −0.162596 0.407397 61.348 −0.399 0.691
Slovenia
Constant term −780.162274 551.609835 27.991 −1.414 0.168
Female sex −7.106008 2.764787 23.422 −2.570 0.017
Calendar year 0.409617 0.274536 27.999 1.492 0.147
Data for Non-African runners are sorted in order of the number of finishers of each country
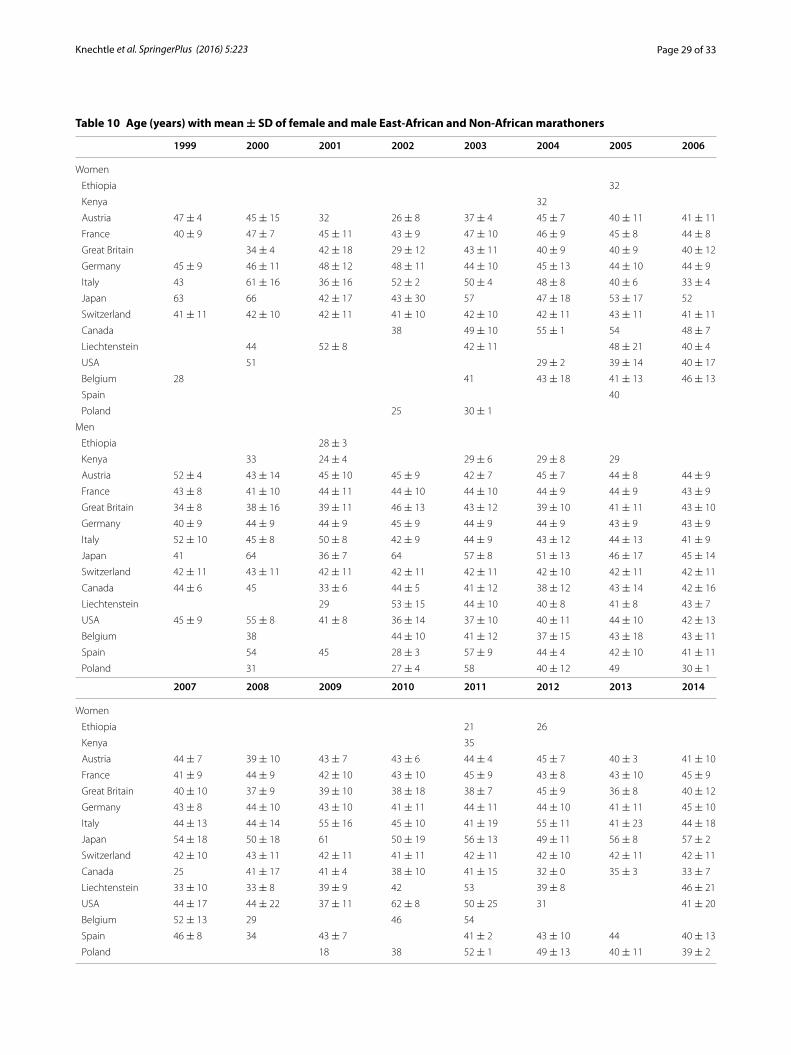
Page 29 of 33Knechtle et al. SpringerPlus (2016) 5:223
Table 10 Age (years) with mean ± SD of female and male East-African and Non-African marathoners
1999 2000 2001 2002 2003 2004 2005 2006
Women
Ethiopia 32
Kenya 32
Austria 47 ± 4 45 ± 15 32 26 ± 8 37 ± 4 45 ± 7 40 ± 11 41 ± 11
France 40 ± 9 47 ± 7 45 ± 11 43 ± 9 47 ± 10 46 ± 9 45 ± 8 44 ± 8
Great Britain 34 ± 4 42 ± 18 29 ± 12 43 ± 11 40 ± 9 40 ± 9 40 ± 12
Germany 45 ± 9 46 ± 11 48 ± 12 48 ± 11 44 ± 10 45 ± 13 44 ± 10 44 ± 9
Italy 43 61 ± 16 36 ± 16 52 ± 2 50 ± 4 48 ± 8 40 ± 6 33 ± 4
Japan 63 66 42 ± 17 43 ± 30 57 47 ± 18 53 ± 17 52
Switzerland 41 ± 11 42 ± 10 42 ± 11 41 ± 10 42 ± 10 42 ± 11 43 ± 11 41 ± 11
Canada 38 49 ± 10 55 ± 1 54 48 ± 7
Liechtenstein 44 52 ± 8 42 ± 11 48 ± 21 40 ± 4
USA 51 29 ± 2 39 ± 14 40 ± 17
Belgium 28 41 43 ± 18 41 ± 13 46 ± 13
Spain 40
Poland 25 30 ± 1
Men
Ethiopia 28 ± 3
Kenya 33 24 ± 4 29 ± 6 29 ± 8 29
Austria 52 ± 4 43 ± 14 45 ± 10 45 ± 9 42 ± 7 45 ± 7 44 ± 8 44 ± 9
France 43 ± 8 41 ± 10 44 ± 11 44 ± 10 44 ± 10 44 ± 9 44 ± 9 43 ± 9
Great Britain 34 ± 8 38 ± 16 39 ± 11 46 ± 13 43 ± 12 39 ± 10 41 ± 11 43 ± 10
Germany 40 ± 9 44 ± 9 44 ± 9 45 ± 9 44 ± 9 44 ± 9 43 ± 9 43 ± 9
Italy 52 ± 10 45 ± 8 50 ± 8 42 ± 9 44 ± 9 43 ± 12 44 ± 13 41 ± 9
Japan 41 64 36 ± 7 64 57 ± 8 51 ± 13 46 ± 17 45 ± 14
Switzerland 42 ± 11 43 ± 11 42 ± 11 42 ± 11 42 ± 11 42 ± 10 42 ± 11 42 ± 11
Canada 44 ± 6 45 33 ± 6 44 ± 5 41 ± 12 38 ± 12 43 ± 14 42 ± 16
Liechtenstein 29 53 ± 15 44 ± 10 40 ± 8 41 ± 8 43 ± 7
USA 45 ± 9 55 ± 8 41 ± 8 36 ± 14 37 ± 10 40 ± 11 44 ± 10 42 ± 13
Belgium 38 44 ± 10 41 ± 12 37 ± 15 43 ± 18 43 ± 11
Spain 54 45 28 ± 3 57 ± 9 44 ± 4 42 ± 10 41 ± 11
Poland 31 27 ± 4 58 40 ± 12 49 30 ± 1
2007 2008 2009 2010 2011 2012 2013 2014
Women
Ethiopia 21 26
Kenya 35
Austria 44 ± 7 39 ± 10 43 ± 7 43 ± 6 44 ± 4 45 ± 7 40 ± 3 41 ± 10
France 41 ± 9 44 ± 9 42 ± 10 43 ± 10 45 ± 9 43 ± 8 43 ± 10 45 ± 9
Great Britain 40 ± 10 37 ± 9 39 ± 10 38 ± 18 38 ± 7 45 ± 9 36 ± 8 40 ± 12
Germany 43 ± 8 44 ± 10 43 ± 10 41 ± 11 44 ± 11 44 ± 10 41 ± 11 45 ± 10
Italy 44 ± 13 44 ± 14 55 ± 16 45 ± 10 41 ± 19 55 ± 11 41 ± 23 44 ± 18
Japan 54 ± 18 50 ± 18 61 50 ± 19 56 ± 13 49 ± 11 56 ± 8 57 ± 2
Switzerland 42 ± 10 43 ± 11 42 ± 11 41 ± 11 42 ± 11 42 ± 10 42 ± 11 42 ± 11
Canada 25 41 ± 17 41 ± 4 38 ± 10 41 ± 15 32 ± 0 35 ± 3 33 ± 7
Liechtenstein 33 ± 10 33 ± 8 39 ± 9 42 53 39 ± 8 46 ± 21
USA 44 ± 17 44 ± 22 37 ± 11 62 ± 8 50 ± 25 31 41 ± 20
Belgium 52 ± 13 29 46 54
Spain 46 ± 8 34 43 ± 7 41 ± 2 43 ± 10 44 40 ± 13
Poland 18 38 52 ± 1 49 ± 13 40 ± 11 39 ± 2
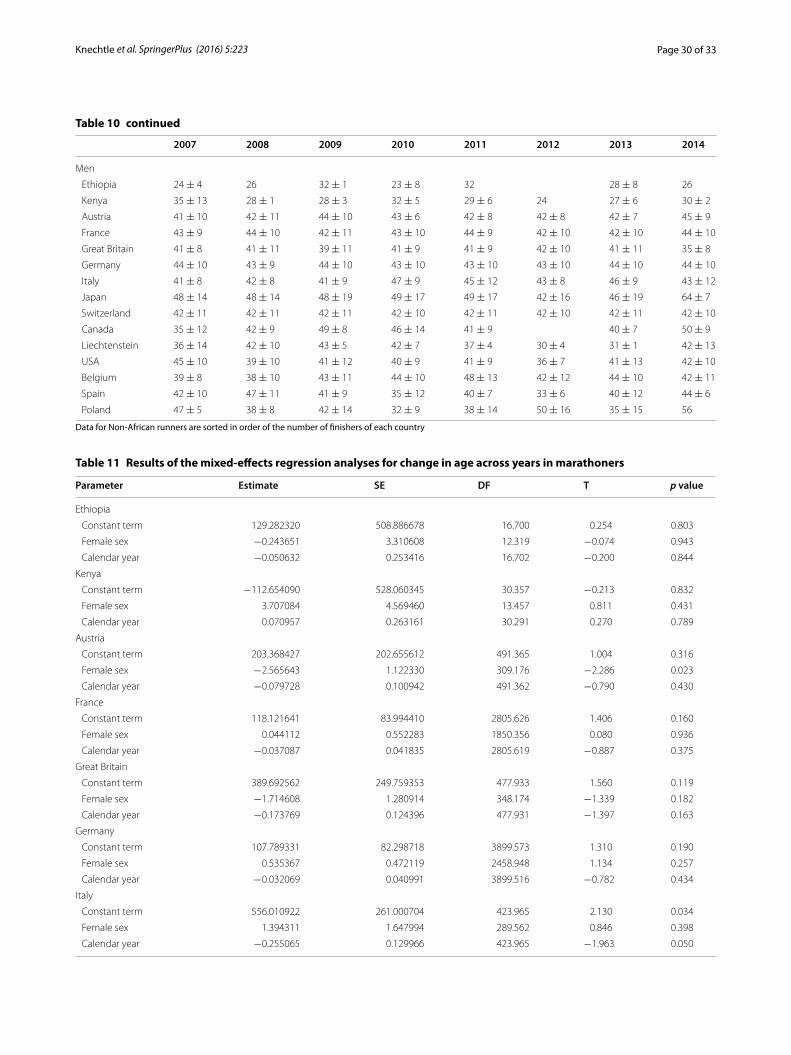
Page 30 of 33Knechtle et al. SpringerPlus (2016) 5:223
Data for Non-African runners are sorted in order of the number of finishers of each country
Table 10 continued
2007 2008 2009 2010 2011 2012 2013 2014
Men
Ethiopia 24 ± 4 26 32 ± 1 23 ± 8 32 28 ± 8 26
Kenya 35 ± 13 28 ± 1 28 ± 3 32 ± 5 29 ± 6 24 27 ± 6 30 ± 2
Austria 41 ± 10 42 ± 11 44 ± 10 43 ± 6 42 ± 8 42 ± 8 42 ± 7 45 ± 9
France 43 ± 9 44 ± 10 42 ± 11 43 ± 10 44 ± 9 42 ± 10 42 ± 10 44 ± 10
Great Britain 41 ± 8 41 ± 11 39 ± 11 41 ± 9 41 ± 9 42 ± 10 41 ± 11 35 ± 8
Germany 44 ± 10 43 ± 9 44 ± 10 43 ± 10 43 ± 10 43 ± 10 44 ± 10 44 ± 10
Italy 41 ± 8 42 ± 8 41 ± 9 47 ± 9 45 ± 12 43 ± 8 46 ± 9 43 ± 12
Japan 48 ± 14 48 ± 14 48 ± 19 49 ± 17 49 ± 17 42 ± 16 46 ± 19 64 ± 7
Switzerland 42 ± 11 42 ± 11 42 ± 11 42 ± 10 42 ± 11 42 ± 10 42 ± 11 42 ± 10
Canada 35 ± 12 42 ± 9 49 ± 8 46 ± 14 41 ± 9 40 ± 7 50 ± 9
Liechtenstein 36 ± 14 42 ± 10 43 ± 5 42 ± 7 37 ± 4 30 ± 4 31 ± 1 42 ± 13
USA 45 ± 10 39 ± 10 41 ± 12 40 ± 9 41 ± 9 36 ± 7 41 ± 13 42 ± 10
Belgium 39 ± 8 38 ± 10 43 ± 11 44 ± 10 48 ± 13 42 ± 12 44 ± 10 42 ± 11
Spain 42 ± 10 47 ± 11 41 ± 9 35 ± 12 40 ± 7 33 ± 6 40 ± 12 44 ± 6
Poland 47 ± 5 38 ± 8 42 ± 14 32 ± 9 38 ± 14 50 ± 16 35 ± 15 56
Table 11 Results of the mixed-effects regression analyses for change in age across years in marathoners
Parameter Estimate SE DF T p value
Ethiopia
Constant term 129.282320 508.886678 16.700 0.254 0.803
Female sex −0.243651 3.310608 12.319 −0.074 0.943
Calendar year −0.050632 0.253416 16.702 −0.200 0.844
Kenya
Constant term −112.654090 528.060345 30.357 −0.213 0.832
Female sex 3.707084 4.569460 13.457 0.811 0.431
Calendar year 0.070957 0.263161 30.291 0.270 0.789
Austria
Constant term 203.368427 202.655612 491.365 1.004 0.316
Female sex −2.565643 1.122330 309.176 −2.286 0.023
Calendar year −0.079728 0.100942 491.362 −0.790 0.430
France
Constant term 118.121641 83.994410 2805.626 1.406 0.160
Female sex 0.044112 0.552283 1850.356 0.080 0.936
Calendar year −0.037087 0.041835 2805.619 −0.887 0.375
Great Britain
Constant term 389.692562 249.759353 477.933 1.560 0.119
Female sex −1.714608 1.280914 348.174 −1.339 0.182
Calendar year −0.173769 0.124396 477.931 −1.397 0.163
Germany
Constant term 107.789331 82.298718 3899.573 1.310 0.190
Female sex 0.535367 0.472119 2458.948 1.134 0.257
Calendar year −0.032069 0.040991 3899.516 −0.782 0.434
Italy
Constant term 556.010922 261.000704 423.965 2.130 0.034
Female sex 1.394311 1.647994 289.562 0.846 0.398
Calendar year −0.255065 0.129966 423.965 −1.963 0.050
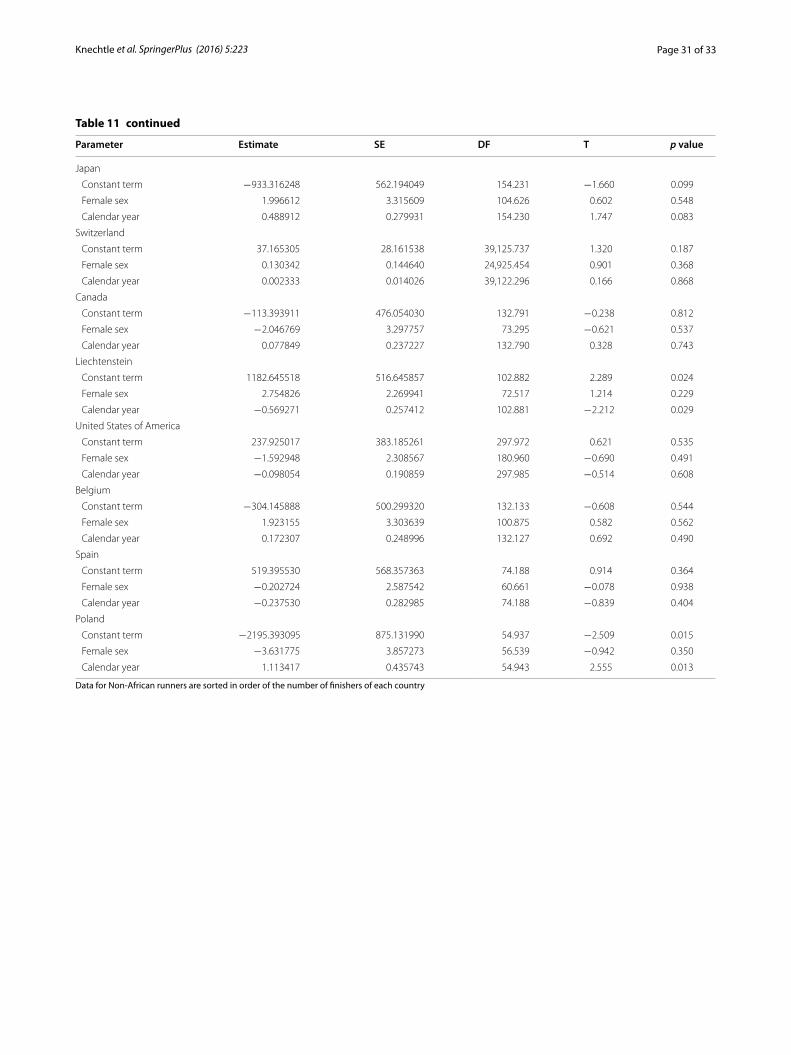
Page 31 of 33Knechtle et al. SpringerPlus (2016) 5:223
Data for Non-African runners are sorted in order of the number of finishers of each country
Table 11 continued
Parameter Estimate SE DF T p value
Japan
Constant term −933.316248 562.194049 154.231 −1.660 0.099
Female sex 1.996612 3.315609 104.626 0.602 0.548
Calendar year 0.488912 0.279931 154.230 1.747 0.083
Switzerland
Constant term 37.165305 28.161538 39,125.737 1.320 0.187
Female sex 0.130342 0.144640 24,925.454 0.901 0.368
Calendar year 0.002333 0.014026 39,122.296 0.166 0.868
Canada
Constant term −113.393911 476.054030 132.791 −0.238 0.812
Female sex −2.046769 3.297757 73.295 −0.621 0.537
Calendar year 0.077849 0.237227 132.790 0.328 0.743
Liechtenstein
Constant term 1182.645518 516.645857 102.882 2.289 0.024
Female sex 2.754826 2.269941 72.517 1.214 0.229
Calendar year −0.569271 0.257412 102.881 −2.212 0.029
United States of America
Constant term 237.925017 383.185261 297.972 0.621 0.535
Female sex −1.592948 2.308567 180.960 −0.690 0.491
Calendar year −0.098054 0.190859 297.985 −0.514 0.608
Belgium
Constant term −304.145888 500.299320 132.133 −0.608 0.544
Female sex 1.923155 3.303639 100.875 0.582 0.562
Calendar year 0.172307 0.248996 132.127 0.692 0.490
Spain
Constant term 519.395530 568.357363 74.188 0.914 0.364
Female sex −0.202724 2.587542 60.661 −0.078 0.938
Calendar year −0.237530 0.282985 74.188 −0.839 0.404
Poland
Constant term −2195.393095 875.131990 54.937 −2.509 0.015
Female sex −3.631775 3.857273 56.539 −0.942 0.350
Calendar year 1.113417 0.435743 54.943 2.555 0.013
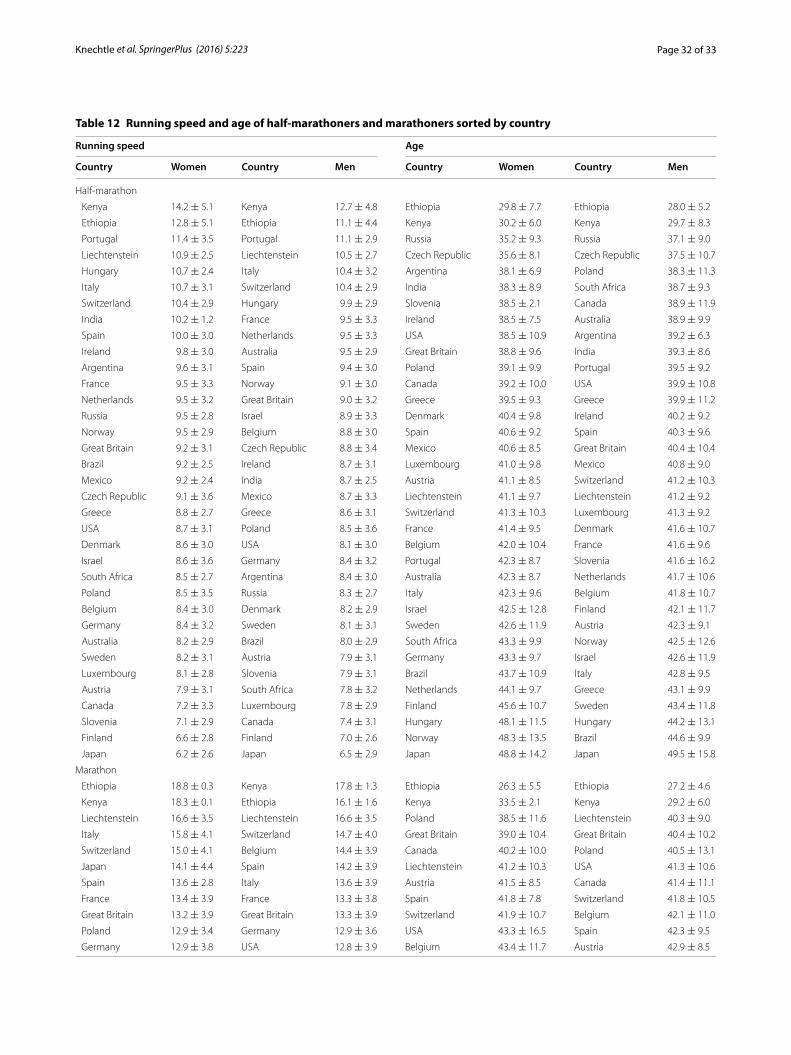
Page 32 of 33Knechtle et al. SpringerPlus (2016) 5:223
Table 12 Running speed and age of half-marathoners and marathoners sorted by country
Running speed Age
Country Women Country Men Country Women Country Men
Half-marathon
Kenya 14.2 ± 5.1 Kenya 12.7 ± 4.8 Ethiopia 29.8 ± 7.7 Ethiopia 28.0 ± 5.2
Ethiopia 12.8 ± 5.1 Ethiopia 11.1 ± 4.4 Kenya 30.2 ± 6.0 Kenya 29.7 ± 8.3
Portugal 11.4 ± 3.5 Portugal 11.1 ± 2.9 Russia 35.2 ± 9.3 Russia 37.1 ± 9.0
Liechtenstein 10.9 ± 2.5 Liechtenstein 10.5 ± 2.7 Czech Republic 35.6 ± 8.1 Czech Republic 37.5 ± 10.7
Hungary 10.7 ± 2.4 Italy 10.4 ± 3.2 Argentina 38.1 ± 6.9 Poland 38.3 ± 11.3
Italy 10.7 ± 3.1 Switzerland 10.4 ± 2.9 India 38.3 ± 8.9 South Africa 38.7 ± 9.3
Switzerland 10.4 ± 2.9 Hungary 9.9 ± 2.9 Slovenia 38.5 ± 2.1 Canada 38.9 ± 11.9
India 10.2 ± 1.2 France 9.5 ± 3.3 Ireland 38.5 ± 7.5 Australia 38.9 ± 9.9
Spain 10.0 ± 3.0 Netherlands 9.5 ± 3.3 USA 38.5 ± 10.9 Argentina 39.2 ± 6.3
Ireland 9.8 ± 3.0 Australia 9.5 ± 2.9 Great Britain 38.8 ± 9.6 India 39.3 ± 8.6
Argentina 9.6 ± 3.1 Spain 9.4 ± 3.0 Poland 39.1 ± 9.9 Portugal 39.5 ± 9.2
France 9.5 ± 3.3 Norway 9.1 ± 3.0 Canada 39.2 ± 10.0 USA 39.9 ± 10.8
Netherlands 9.5 ± 3.2 Great Britain 9.0 ± 3.2 Greece 39.5 ± 9.3 Greece 39.9 ± 11.2
Russia 9.5 ± 2.8 Israel 8.9 ± 3.3 Denmark 40.4 ± 9.8 Ireland 40.2 ± 9.2
Norway 9.5 ± 2.9 Belgium 8.8 ± 3.0 Spain 40.6 ± 9.2 Spain 40.3 ± 9.6
Great Britain 9.2 ± 3.1 Czech Republic 8.8 ± 3.4 Mexico 40.6 ± 8.5 Great Britain 40.4 ± 10.4
Brazil 9.2 ± 2.5 Ireland 8.7 ± 3.1 Luxembourg 41.0 ± 9.8 Mexico 40.8 ± 9.0
Mexico 9.2 ± 2.4 India 8.7 ± 2.5 Austria 41.1 ± 8.5 Switzerland 41.2 ± 10.3
Czech Republic 9.1 ± 3.6 Mexico 8.7 ± 3.3 Liechtenstein 41.1 ± 9.7 Liechtenstein 41.2 ± 9.2
Greece 8.8 ± 2.7 Greece 8.6 ± 3.1 Switzerland 41.3 ± 10.3 Luxembourg 41.3 ± 9.2
USA 8.7 ± 3.1 Poland 8.5 ± 3.6 France 41.4 ± 9.5 Denmark 41.6 ± 10.7
Denmark 8.6 ± 3.0 USA 8.1 ± 3.0 Belgium 42.0 ± 10.4 France 41.6 ± 9.6
Israel 8.6 ± 3.6 Germany 8.4 ± 3.2 Portugal 42.3 ± 8.7 Slovenia 41.6 ± 16.2
South Africa 8.5 ± 2.7 Argentina 8.4 ± 3.0 Australia 42.3 ± 8.7 Netherlands 41.7 ± 10.6
Poland 8.5 ± 3.5 Russia 8.3 ± 2.7 Italy 42.3 ± 9.6 Belgium 41.8 ± 10.7
Belgium 8.4 ± 3.0 Denmark 8.2 ± 2.9 Israel 42.5 ± 12.8 Finland 42.1 ± 11.7
Germany 8.4 ± 3.2 Sweden 8.1 ± 3.1 Sweden 42.6 ± 11.9 Austria 42.3 ± 9.1
Australia 8.2 ± 2.9 Brazil 8.0 ± 2.9 South Africa 43.3 ± 9.9 Norway 42.5 ± 12.6
Sweden 8.2 ± 3.1 Austria 7.9 ± 3.1 Germany 43.3 ± 9.7 Israel 42.6 ± 11.9
Luxembourg 8.1 ± 2.8 Slovenia 7.9 ± 3.1 Brazil 43.7 ± 10.9 Italy 42.8 ± 9.5
Austria 7.9 ± 3.1 South Africa 7.8 ± 3.2 Netherlands 44.1 ± 9.7 Greece 43.1 ± 9.9
Canada 7.2 ± 3.3 Luxembourg 7.8 ± 2.9 Finland 45.6 ± 10.7 Sweden 43.4 ± 11.8
Slovenia 7.1 ± 2.9 Canada 7.4 ± 3.1 Hungary 48.1 ± 11.5 Hungary 44.2 ± 13.1
Finland 6.6 ± 2.8 Finland 7.0 ± 2.6 Norway 48.3 ± 13.5 Brazil 44.6 ± 9.9
Japan 6.2 ± 2.6 Japan 6.5 ± 2.9 Japan 48.8 ± 14.2 Japan 49.5 ± 15.8
Marathon
Ethiopia 18.8 ± 0.3 Kenya 17.8 ± 1.3 Ethiopia 26.3 ± 5.5 Ethiopia 27.2 ± 4.6
Kenya 18.3 ± 0.1 Ethiopia 16.1 ± 1.6 Kenya 33.5 ± 2.1 Kenya 29.2 ± 6.0
Liechtenstein 16.6 ± 3.5 Liechtenstein 16.6 ± 3.5 Poland 38.5 ± 11.6 Liechtenstein 40.3 ± 9.0
Italy 15.8 ± 4.1 Switzerland 14.7 ± 4.0 Great Britain 39.0 ± 10.4 Great Britain 40.4 ± 10.2
Switzerland 15.0 ± 4.1 Belgium 14.4 ± 3.9 Canada 40.2 ± 10.0 Poland 40.5 ± 13.1
Japan 14.1 ± 4.4 Spain 14.2 ± 3.9 Liechtenstein 41.2 ± 10.3 USA 41.3 ± 10.6
Spain 13.6 ± 2.8 Italy 13.6 ± 3.9 Austria 41.5 ± 8.5 Canada 41.4 ± 11.1
France 13.4 ± 3.9 France 13.3 ± 3.8 Spain 41.8 ± 7.8 Switzerland 41.8 ± 10.5
Great Britain 13.2 ± 3.9 Great Britain 13.3 ± 3.9 Switzerland 41.9 ± 10.7 Belgium 42.1 ± 11.0
Poland 12.9 ± 3.4 Germany 12.9 ± 3.6 USA 43.3 ± 16.5 Spain 42.3 ± 9.5
Germany 12.9 ± 3.8 USA 12.8 ± 3.9 Belgium 43.4 ± 11.7 Austria 42.9 ± 8.5
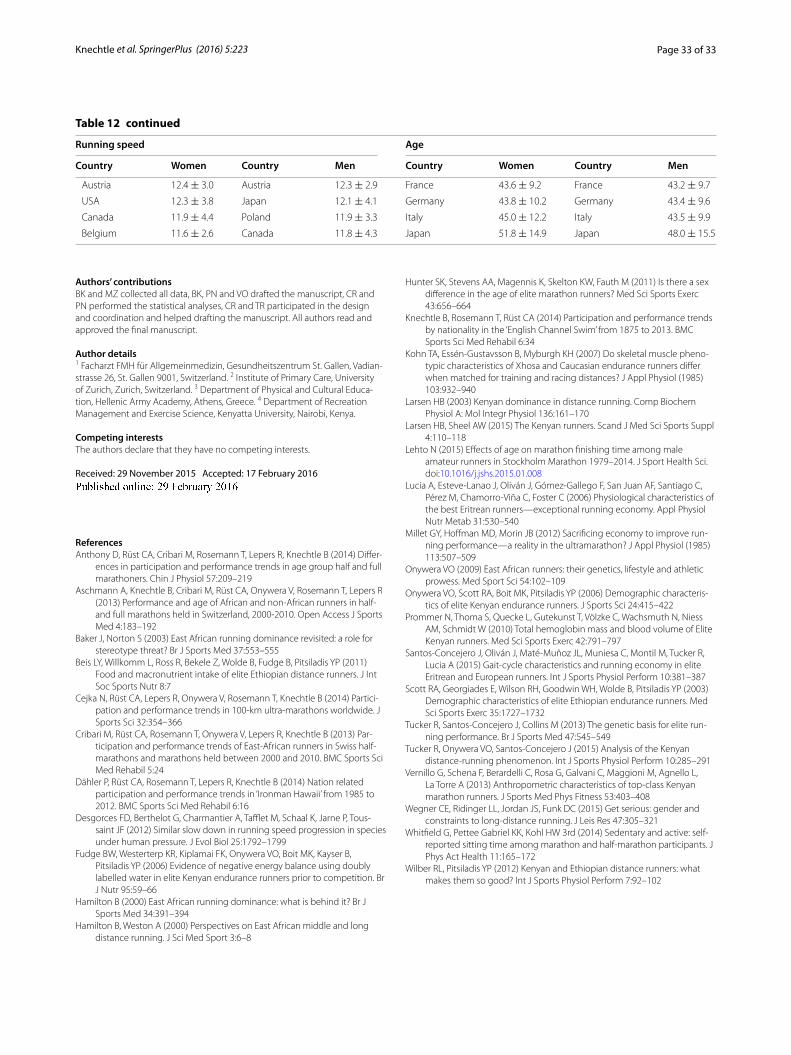
Page 33 of 33Knechtle et al. SpringerPlus (2016) 5:223
Authors’ contributionsBK and MZ collected all data, BK, PN and VO drafted the manuscript, CR and PN performed the statistical analyses, CR and TR participated in the design and coordination and helped drafting the manuscript. All authors read and approved the final manuscript.
Author details1 Facharzt FMH für Allgemeinmedizin, Gesundheitszentrum St. Gallen, Vadian-strasse 26, St. Gallen 9001, Switzerland. 2 Institute of Primary Care, University of Zurich, Zurich, Switzerland. 3 Department of Physical and Cultural Educa-tion, Hellenic Army Academy, Athens, Greece. 4 Department of Recreation Management and Exercise Science, Kenyatta University, Nairobi, Kenya.
Competing interestsThe authors declare that they have no competing interests.
Received: 29 November 2015 Accepted: 17 February 2016
ReferencesAnthony D, Rüst CA, Cribari M, Rosemann T, Lepers R, Knechtle B (2014) Differ-
ences in participation and performance trends in age group half and full marathoners. Chin J Physiol 57:209–219
Aschmann A, Knechtle B, Cribari M, Rüst CA, Onywera V, Rosemann T, Lepers R (2013) Performance and age of African and non-African runners in half- and full marathons held in Switzerland, 2000-2010. Open Access J Sports Med 4:183–192
Baker J, Norton S (2003) East African running dominance revisited: a role for stereotype threat? Br J Sports Med 37:553–555
Beis LY, Willkomm L, Ross R, Bekele Z, Wolde B, Fudge B, Pitsiladis YP (2011) Food and macronutrient intake of elite Ethiopian distance runners. J Int Soc Sports Nutr 8:7
Cejka N, Rüst CA, Lepers R, Onywera V, Rosemann T, Knechtle B (2014) Partici-pation and performance trends in 100-km ultra-marathons worldwide. J Sports Sci 32:354–366
Cribari M, Rüst CA, Rosemann T, Onywera V, Lepers R, Knechtle B (2013) Par-ticipation and performance trends of East-African runners in Swiss half-marathons and marathons held between 2000 and 2010. BMC Sports Sci Med Rehabil 5:24
Dähler P, Rüst CA, Rosemann T, Lepers R, Knechtle B (2014) Nation related participation and performance trends in ‘Ironman Hawaii’ from 1985 to 2012. BMC Sports Sci Med Rehabil 6:16
Desgorces FD, Berthelot G, Charmantier A, Tafflet M, Schaal K, Jarne P, Tous-saint JF (2012) Similar slow down in running speed progression in species under human pressure. J Evol Biol 25:1792–1799
Fudge BW, Westerterp KR, Kiplamai FK, Onywera VO, Boit MK, Kayser B, Pitsiladis YP (2006) Evidence of negative energy balance using doubly labelled water in elite Kenyan endurance runners prior to competition. Br J Nutr 95:59–66
Hamilton B (2000) East African running dominance: what is behind it? Br J Sports Med 34:391–394
Hamilton B, Weston A (2000) Perspectives on East African middle and long distance running. J Sci Med Sport 3:6–8
Hunter SK, Stevens AA, Magennis K, Skelton KW, Fauth M (2011) Is there a sex difference in the age of elite marathon runners? Med Sci Sports Exerc 43:656–664
Knechtle B, Rosemann T, Rüst CA (2014) Participation and performance trends by nationality in the ‘English Channel Swim’ from 1875 to 2013. BMC Sports Sci Med Rehabil 6:34
Kohn TA, Essén-Gustavsson B, Myburgh KH (2007) Do skeletal muscle pheno-typic characteristics of Xhosa and Caucasian endurance runners differ when matched for training and racing distances? J Appl Physiol (1985) 103:932–940
Larsen HB (2003) Kenyan dominance in distance running. Comp Biochem Physiol A: Mol Integr Physiol 136:161–170
Larsen HB, Sheel AW (2015) The Kenyan runners. Scand J Med Sci Sports Suppl 4:110–118
Lehto N (2015) Effects of age on marathon finishing time among male amateur runners in Stockholm Marathon 1979–2014. J Sport Health Sci. doi:10.1016/j.jshs.2015.01.008
Lucia A, Esteve-Lanao J, Oliván J, Gómez-Gallego F, San Juan AF, Santiago C, Pérez M, Chamorro-Viña C, Foster C (2006) Physiological characteristics of the best Eritrean runners—exceptional running economy. Appl Physiol Nutr Metab 31:530–540
Millet GY, Hoffman MD, Morin JB (2012) Sacrificing economy to improve run-ning performance—a reality in the ultramarathon? J Appl Physiol (1985) 113:507–509
Onywera VO (2009) East African runners: their genetics, lifestyle and athletic prowess. Med Sport Sci 54:102–109
Onywera VO, Scott RA, Boit MK, Pitsiladis YP (2006) Demographic characteris-tics of elite Kenyan endurance runners. J Sports Sci 24:415–422
Prommer N, Thoma S, Quecke L, Gutekunst T, Völzke C, Wachsmuth N, Niess AM, Schmidt W (2010) Total hemoglobin mass and blood volume of Elite Kenyan runners. Med Sci Sports Exerc 42:791–797
Santos-Concejero J, Oliván J, Maté-Muñoz JL, Muniesa C, Montil M, Tucker R, Lucia A (2015) Gait-cycle characteristics and running economy in elite Eritrean and European runners. Int J Sports Physiol Perform 10:381–387
Scott RA, Georgiades E, Wilson RH, Goodwin WH, Wolde B, Pitsiladis YP (2003) Demographic characteristics of elite Ethiopian endurance runners. Med Sci Sports Exerc 35:1727–1732
Tucker R, Santos-Concejero J, Collins M (2013) The genetic basis for elite run-ning performance. Br J Sports Med 47:545–549
Tucker R, Onywera VO, Santos-Concejero J (2015) Analysis of the Kenyan distance-running phenomenon. Int J Sports Physiol Perform 10:285–291
Vernillo G, Schena F, Berardelli C, Rosa G, Galvani C, Maggioni M, Agnello L, La Torre A (2013) Anthropometric characteristics of top-class Kenyan marathon runners. J Sports Med Phys Fitness 53:403–408
Wegner CE, Ridinger LL, Jordan JS, Funk DC (2015) Get serious: gender and constraints to long-distance running. J Leis Res 47:305–321
Whitfield G, Pettee Gabriel KK, Kohl HW 3rd (2014) Sedentary and active: self-reported sitting time among marathon and half-marathon participants. J Phys Act Health 11:165–172
Wilber RL, Pitsiladis YP (2012) Kenyan and Ethiopian distance runners: what makes them so good? Int J Sports Physiol Perform 7:92–102
Table 12 continued
Running speed Age
Country Women Country Men Country Women Country Men
Austria 12.4 ± 3.0 Austria 12.3 ± 2.9 France 43.6 ± 9.2 France 43.2 ± 9.7
USA 12.3 ± 3.8 Japan 12.1 ± 4.1 Germany 43.8 ± 10.2 Germany 43.4 ± 9.6
Canada 11.9 ± 4.4 Poland 11.9 ± 3.3 Italy 45.0 ± 12.2 Italy 43.5 ± 9.9
Belgium 11.6 ± 2.6 Canada 11.8 ± 4.3 Japan 51.8 ± 14.9 Japan 48.0 ± 15.5