malignanttransformation ofbloomsyndrome b-lymphoblastoid
TRANSCRIPT

Proc. Natl. Acad. Sci. USAVol. 82, pp. 5102-5106, August 1985Genetics
Malignant transformation of Bloom syndrome B-lymphoblastoid celllines by carcinogens
(carcinogenesis/nude mice/colony formation/sister chromatid exchange/immunoglobulin)
YUKIMASA SHIRAISHI*, TosIHIDE H. YOSIDAt, AND AVERY A. SANDBERGt*Laboratory of Human Cytogenetics, Department of Anatomy, Kochi Medical School, Nankoku-City 781-51, Kochi, Japan; tNational Institute of Genetics,Misima 411, Japan; and tDepartment of Genetics and Endocrinology, Roswell Park Memorial Institute, Buffalo, NY 14263
Communicated by David Harker, April 19, 1985
ABSTRACT Three types of Bloom syndrome B-lymph-oblastoid cell lines, as well as one derived from a normalperson, treated with 4-nitroquinoline-N-oxide and N-methyl-N'-nitro-N-nitrosoguanidine (0.3 ,jg/ml for 24 hr), were stud-ied for tumorigenicity in nude mice, colony formation in softagar, cytogenetic changes, and immunoglobulin markers.When normal and Bloom syndrome cells with normal sisterchromatid exchange (SCE) levels and karyotypes (type I) weretreated with carcinogens, no significant changes occurred in theimmunoglobulin proffle and karyotype, only rare colony for-mation was seen, and no tumors were produced. In contrast,when Bloom syndrome cells with high SCE levels (type II withnormal karyotype and type III with an abnormal karyotype)were treated with carcinogens, tumors were produced in 22 of53 nude mice injected; a high rate of colony formation in softagar was seen; the cells exhibited virtual loss of immunoglob-ulin markers; and structural changes in chromosomes 1, 2, 3,4, 5, 7, 11, 14, and 15 were found in the tumors in addition tothe original chromosome abnormalities present in the injectedcells. It appears that Bloom syndrome B-lymphoblastoid celllines with high levels ofSCE are highly susceptible to the actionof carcinogens, as evidenced by tumor formation in nude miceand colony formation in agar. Apparently, the carcinogenswere capable of transforming only those cells that had a criticallevel of SCE (=140 per cell) and not those with only mildlyincreased levels (=13 per cell).
Epstein-Barr virus (EBV) has been widely used to transformB lymphocytes from healthy donors and patients with avariety of diseases (1-3). Parallel cytogenetic and nudemouse inoculation studies (4-6) have recently dispelled theearlier notion that all EBV-immortalized human cell lines aretumorigenic, irrespective of their origin. EBV-immortalizednormal human B lymphocytes remained purely diploid duringseveral months of cultivation in vitro, failed to grow subcu-taneously in nude mice, and had a low cloning efficiency inagarose (6). We have previously reported the establishmentof several EBV-transformed B-lymphoblastoid cell linesfrom Bloom syndrome patients (7, 8), a genetic disease thatis characterized by predisposition to cancer and increasedsister chromatid exchanges (SCEs) in cells labeled withbromodeoxyuridine (BrdUrd) for two cell cycles (9, 10).More recently, these cell lines have been grouped into threetypes: type I, with normal SCE and normal karyotype; typeII, with high SCE and normal karyotype; and type III, withhigh SCE and abnormal karyotype. Since previous studies(11, 12) have shown that Bloom syndrome cells are verysensitive to carcinogens and since Bloom syndrome patientsare highly predisposed to malignant disease, we have treatedBloom syndrome B-lymphoblastoid cell lines with chemicalcarcinogens and inoculated the transformed cells into the
subcutaneous tissue of nude mice and found that carcinogen-treated Bloom syndrome types II and III cells are highlytumorigenic. The carcinogen-treated Bloom syndrome cellswere plated on soft agar to determine the colony formationrate. Carcinogens are known to cause a significant increasein SCE (doubling over baseline) in normal cells and dramat-ically increase the levels in Bloom syndrome cells (11, 13).Even though the exact biological significance ofSCE changesin carcinogenesis and Bloom syndrome is unknown, it seemsvaluable to study the tumorigenicity in nude mice, colonyformation in soft agar, and changes in immunoglobulin asrelated to the SCE levels in carcinogen-treated Bloom syn-drome B-lymphoblastoid cell lines.
MATERIALS AND METHODSCell Lines and Cell Culture. Permanent Bloom syndrome
B-lymphoblastoid cell lines (BS2-1, BS2-2, BS-SY1, and BS-SY2) and a normal B-lymphoblastoid cell line (KS86) wereestablished from patients with Bloom syndrome and from anormal subject, respectively, by using EBV (7, 8). Aspreviously described, Bloom syndrome type III (Table 1)cells were found to characteristically have increased SCElevels (average SCE value, 71.3 ± 2.31 in BS22) in cellslabeled with BrdUrd for two cell cycles. These cells also havechromosome instability and abnormal karyotypes; BS22,47,XY,2p+ ,t(3 ;15)(p25 ;q15), t(7 ;11)(q11 ;p15),+m/46,XY,2p+ ,t(3;15)(q11;p15), t(7;11)(qll;p15). In con-trast, BS2-1 cells (Bloom syndrome type I) had a normal levelofSCE (5.2 ± 0.05), no chromosome instability, and a normalkaryotype. BS-SY1 and BS-SY2 cell lines (Bloom syndrometype II) were newly established and retained high SCE levelsin 100% of the cells; the average SCE value was 70.8 ± 2.86in BS-SY1 and 72.1 ± 2.79 in BS-SY2.The establishment of these two new cell lines was accom-
plished by a method previously described (7, 8). Even thoughchromosome instability, including breaks (6-8%) andquadriradials (0.01-0.02%), was detected at relatively lowfrequency, the karyotype of these cells was basically normal(46,XY in BS-SY1 and 46,XX in BS-SY2), differing from thatof line BS2-2. The karyotype of KS86 was normal and thebaseline level of SCEs per cell was 5.2 ± 0.18. The cells weremaintained in RPM1 1640 medium supplemented with 15%fetal calf serum at 37°C in a 5% C02/95% air humidifiedincubator. In all cell lines established with EBV, tests of cellsurface markers, such as clumping of lymphoid cells, nega-tive spontaneous rosette formation, and positive surfaceimmunoglobulins, revealed the lymphocytes to be of B-cellorigin (14, 15).Malignant Transformation with Carcinogens. Bloom syn-
drome and normal cells (2 x 10⁶) were exposed to 4-nitro-quinoline-N-oxide (4NQO) and N-methyl-N'-nitrosoguani-
Abbreviations: 4NQO, 4-nitroquinoline-N-oxide; MNNG, N-meth-yl-N'-nitro-N-nitrosoguanidine; SCE, sister chromatid exchange;EBV, Epstein-Barr virus; EBNA, EBV nuclear antigen.
5102
The publication costs of this article were defrayed in part by page chargepayment. This article must therefore be hereby marked "advertisement"in accordance with 18 U.S.C. §1734 solely to indicate this fact.
Dow
nloa
ded
by g
uest
on
Oct
ober
25,
202
1

Proc. Natl. Acad. Sci. USA 82 (1985) 5103
Table 1. Establishment and characterization of B-lymphoblastoid cell lines from normal (KS86, KS72) and Bloom syndromeblood samples
CytoplasmicSurface immunoglobulin, % immunoglobulin, % SCE level,
Cell line A& y a 8 K A ,u y a 8 K X mean ± SEM KaryotypeNormalKS86 0 44* 0 0 0 0 0 53 0 0 0 2 4.9 ± 0.03 46,XXKS72 0 51 0 0 0 0 0 59 0 0 0 0 4.8 ± 0.02 46,XY
BloomsyndromeType IBS21 0 0 31 0 13 12 0 0 37 0 11 10 5.2 ± 0.05 46,XY
Type IIBS-SY1 61 0 0 1 4 0 68 0 0 0 2 0 70.8 ± 2.86 46,XXBS-SY2 52 0 0 2 6 0 71 0 0 1 3 0 72.1 ± 2.79 46,XY
Type IIIBS22 0 43 0 0 0 0 0 47 0 0 0 0 70.5 ± 2.77 46,XY,2p+,t(3;15)(p25;ql5), t(7;11)-
(qll;pl5), + ml/46,XY,2p+,t(3;15)(qll;pl5), t(7;11)(qll;qlS)
*Average values of >500 cells in each entry.
dine (MNNG) at 0.3 ,ug/ml for 24 hr, washed with fresh RPMI1640 medium, and then reincubated in RPMI 1640 mediumsupplemented with 15% fetal calf serum at 37°C in a 5%C02/95% air incubator for 5-7 days. To examine thetumorigenicity, the carcinogen treate4 Bloom syndromeB-lymphoblastoid cell lines (5 x 10⁶) were inoculated into thesubcutaneous tissue of 6-week-old nude mice, BALB/c(nu/nu) strain in their genetic background. After inoculation(3-4 weeks), tumors were detected and their size wasestimated by calculating length x width x height of eachgroup, as described (16) (Table 2). To assess colony-formingability and plating efficiency, cells obtained from culturestreated with each chemical (1 x 10⁴ and/or 2 x 10⁴) wereplated in 0.3% soft agar containing RPMI 1640 medium with20% fetal calf serum (17, 18). Colonies were counted after 3weeks of culture. In this assay, anchorage-dependent cellshave a negligible efficiency of plating-i.e., only transformedqells give rise to colonies in soft agar at the critical agarconcentration of 0.3%. Seven days after carcinogen treat-ment, surface and cytoplasmic immunoglobulin were ana-
lyzed (14). For SCE observations, the cells were labeled withBrdUrd while exposed to it at a concentration of 5.0 ,ug/mlfor 48 hr. Chromosome preparations were made according toa routine air-drying method (10). Differential staining of sisterchromatids and karyotype analysis were performed by usingthe FPG technique (19) and Q-banding, respectively.
Detection of Immunoglobulin and EBV-Related Antigens(EBNA). Lymphoblastoid cells and tumor cells that wereexcised and suspended by pipetting were washed three timesin phosphate-buffered saline. Surface immunoglobulin wastested with fresh cell samples. Cytoplasmic immunoglobulinand EBNA tests were carried out using fixed cell prepara-tions. Surface and cytoplasmic immunoglobulin were testedby direct immunofluorescence with fluorescein isothiocya-nate-conjugated goat antisera monospecific for human IgM,IgD, IgG, IgA, and K and X light chains. All these assays wereperformed as described (14, 15). The anticomplement im-munofluorescence test (20) was performed for the detectionof EBNA. In all experiments, EBV-negative serum andknown EBNA-negative and EBNA-positive cell lines were
Table 2. Tumorigenicity in nude mice and EBV expression of tumors in nude mice subcutaneously inoculated with carcinogen-treatedB-lymphoid cells
No. of nude micewith tumors/no. Average size of Surface and
Treatment of inoculated tumors 6 wk EBV cytoplasmicCell origin (0.3 ttg/ml, 24 hr) nude mice after inoculation EBNA genome immunoglobulins
Normal KS86 None 0/6 NT NT NTMNNG 0/7 NT NT NT4NQO 0/5 NT NT NT
Bloom syndromeType I BS21 None 0/7 NT NT NT
MNNG 0/6 NT NT NT4NQO 0/7 NT NT NT
Type II BS-SY, None 0/7 NT NT NTMNNG 2/6 0.81 + + Negative4NQO 2/7 1.74 + + Negative
Type II BS-SY2 None 0/5 NT NT NTMNNG 3/8 0.92 + + Negative4NQO 2/9 1.93 + + Negative
Type III BS22 None 0/8 NT NT NTMNNG 7/11 1.26 + + Negative4NQO 6/12 2.54 + + Negative
All mice were inoculated with 5 x 10⁶ viable cells. Average size of tumors in cm3 = X(length x width x height). NT, not tested; -, no tumorsobserved.
Genetics: Shiraishi et al.
Dow
nloa
ded
by g
uest
on
Oct
ober
25,
202
1

Proc. Natl. Acad. Sci. USA 82 (1985)
used as controls. Detection of EBV genome was carried outby cytological hybridization and Southern blot hybridizationusing recombinant DNA probes (21, 22).
RESULTSImmunoglobulin and cytogenetic characterizations of theB-lymphoblastoid cell lines established from normal (KS86)and Bloom syndrome (BS2-1, BS-SY1, flS-SY2, and BS2-2)blood samples are shown in Table 1. The cell lines usedshowed different immunoglobulin production and were clas-sified into three groups: KS86 and BS22 cells were IgGpositive, whereas BS2-1 was IgA positive in both surface andcytoplasm. Of the five cell lines, BS-SY1 and BS-SY2 wereIgM producers with cytoplasmic and surface , and lightchains. Normal and Bloom syndrome type I cells treated with4NQO and MNNG showed no changes in the cell surface orcytoplasmic immunoglobulins or in the karyotypes. Thesecells did not produce tumors in nude mice and showedextremely low colony formation rates in soft agar.When the carcinogen-treated Bloom syndrome type II and
III cells were cultured in vitro for 5 days and inoculatedsubcutaneously into nude mice, type II produced tumors atan average rate of 30% and type III produced tumors at a rateof 56% (Table 2). Histological examination indicated that alltumors presented histopathological features of undifferenti-ated blastic tumors (lymphoma type). (Details will be pub-lished elsewhere.) When tumors that originated from 4NQO-treated Bloom syndrome type II and III cells were retrans-planted, they grew well and were carried successfully for twoto three passages from one nude mouse to the next untildiscontinued. This strongly supports the notion that theBloom syndrome tUmors are malignant. Surface and cyto-plasmic immunoglobulin markers were not detectable in anyof the tumors, but they were EBNA positive. EBV genomewas detected in chromosomes using an EBV DNA probe andin situ hybridization and in DNA extracts from Bloomsyndrome tumor cells that had been digested with restrictionendonucleases. All of the tumors derived from carcinogen-treated Bloom syndrome type II and III cells retained highSCE levels (Table 3).
In other experiments in which carcinogen-treated Bloomsyndrome cell lines with a small subpopulation of immuno-globulin positive cells were inoculated into nude mice, notumors were produced even after several months. Thesefindings suggest that Bloom syndrome B-lymphoblastoid celllines produce tumors in nude mice only when the cells
contain abnormal karyotypes involving certain chromosomesand concomitantly show a virtual loss of Ig.karyotype analyses revealed frequent involvement of
chromosonmes 1, 2, 3, and 15, and occasional involvement ofchromosomes 4, 7, 11, and 14 in both type II and III tumors(Table 3). In both types of tumors, no normal (diploid) humancells were encountered-i.e., all the karyotypes observedhad chromosomal changes of the nature shown in Table 3.Excess chromosomes as well as additional morphologicchanges were observed in MNNG- and 4NQO-treated Bloomsyndrome type III cells (Figs; 1 and 2). All tumors resultingfrom Bloom syndrome type II cells showed karyotype ab-normalities involving certain chromosomes, even though theuntreated cell line had basically a normal karyotype. Thedevelopment ofthe abnormal karyotypes was associated withthe process of malignant transformation caused by exposureto carcinogens. A possible carcinogen effect in type III cellsmay be reflected in the appearance of additional karyotypeabnormalities. Of special interest is the finding that thebreakpoints in chromosome 1 ofBloom syndrome type II andIII tumors clustered in the same regions as those reported forabnormalities of 218 human neoplasms (23); data on otherchromosomes were not available for comparison. In Bloomsyndrome type II and III tumors, =60% of the aberrationswere concentrated in the centromeric regions, 20%o in q31-q32, and 20o in p22-p32.Colony formation tests were performed to measure the
plating efficiency in soft agar in 1 x 10⁴ and 2 x 10⁴ cells perdish after treatment with 4NQO and MNNG at concentra-tions of 0.3 ,g/ml (Table 4). No colony formation was notedwith nontreated Bloom syndrome types I, II, and III cells or
with normal cells. In the normal cell line (KS86) used as a
control, MNNG led to the occurrence of only one colonyformation in 10 dishes (0.1 colony formation per dish) and4NQO caused no colony formation at the concentrationsused. Bloom syndrome type I cells also showed rare colonyformation with only one colony (resulting from 4NQO treat-ment) in 10 dishes (0.1 colony formation per dish). Bloomsyndrome type II and III cells exhibited frequent occurrenceof colony formation after carcinogen treatment. At 1 x 10⁴cells per dish, the average colony formation frequency perdish in Bloom syndrome type II and III cells was 7.7 for4NQO and 6.9 for MNNG (Table 3). When Bloom syndrometype II and III cells were plated in soft agar at 2 x 10⁴ cellsper dish, the colony formation rate was not remarkablydifferent. Karyotype analyses of colonies isolated from soft
Table 3. Characterization of tumor cells in nude mice subcutaneously inoculated with carcinogen-treated Bloom syndromeB-lymphoid cells
Cell Treatment Tumor SCE per cell,origin (0.3 ,ug/ml, 24 hr) no. Karyotype mean ± SEM
BS22 MNNG 1 47,XY,lq21-,2p+,t(3;15)(p25;ql5), t(7;11)(qll;pl5) 72.1 ± 2.842 47,XY,t(1;13)(p21;q32), 2p+,t(3;15)(p25;ql5), t(7;11)(qll;pl5),-8 73.6 ± 2.493 47,XY,1q21-,t(3;15)(p25;ql5),14q+m 69.6 ± 2.66
4NQO 4 48,XY,2p+,+3,t(3;15)(p25;ql5), t(7;11)(qll;pl5),-8,+11,+m 75.2 ± 2.665 48,XY,lq+,2p+,+3,t(3;15)(p25;ql5), t(7;11)(qll;pl5),+11 72.6 ± 2.416 48,XY,2p+,+3,t(3;15)(p25;ql5), t(7;11)(qll;pl5),+7 70.6 ± 2.387 47,XY,lq21-,2p+,t(3;15)(p25;ql5),+7, t(7;11)(qll;pl5) 71.9 ± 2.498 47,XY,lq+,t(3;15)(p25;ql5), +t(3;15)(p25;ql5) 73.7 ± 2.429 48,XY,2p+,t(3;15)(p25;q15), +t(3;15)(p25;ql5), t(7;11)(qll;pl5),+11 72.3 ± 2.06
BS-SY1 MNNG 10 47,XY,t(1;2)(pll;qll),7p+,+11 75.1 ± 2.644NQO 11 46,XY,t(1;4)(q21;qll),+7 70.4 ± 2.44
12 47,XY,lq21-,2p+,9q+,+17 69.4 ± 2.4013 47,XY,1q+,t(12;14)(q22;q32),+17 71.3 ± 2.19
BS-SY2 MNNG 14 47,XX,t(1;2)(q21;qll),+7 68.4 ± 2.614NQO 15 47,XX,t(1;2)(pll;ql3),+14 76.1 ± 3.01
16 47,XX,2p+,+7,t(7;11)(qll;pl5) 74.6 ± 2.6517 48,XX,+7,t(12;14)(q22;q32),+11 72.1 ± 2.82
5104 Genetics: Shiraishi et al.
Dow
nloa
ded
by g
uest
on
Oct
ober
25,
202
1

Proc. Natl. Acad. Sci. USA 82 (1985) 5105
i._1 vw i
,-a v i ! ^ r I r I q v._
S s_] FIG. 1. Karyotype observed in tumor no. 4 ofTable 3 showing 48,XY,2p+ ,+3,t(3;15)(p25;ql5),t(7;11)(qll;pl5),-8,+11,+m. Note that the originalBS2-2 cells did not have an excess of chromosomes 3and 11.
agar of the carcinogen-treated Bloom syndrome type II andIII cells revealed abnormalities that correspond to thoseobserved in the tumors of nude mice in 14 of 20 colonies.SCE levels in type II and type III cell lines were dramat-
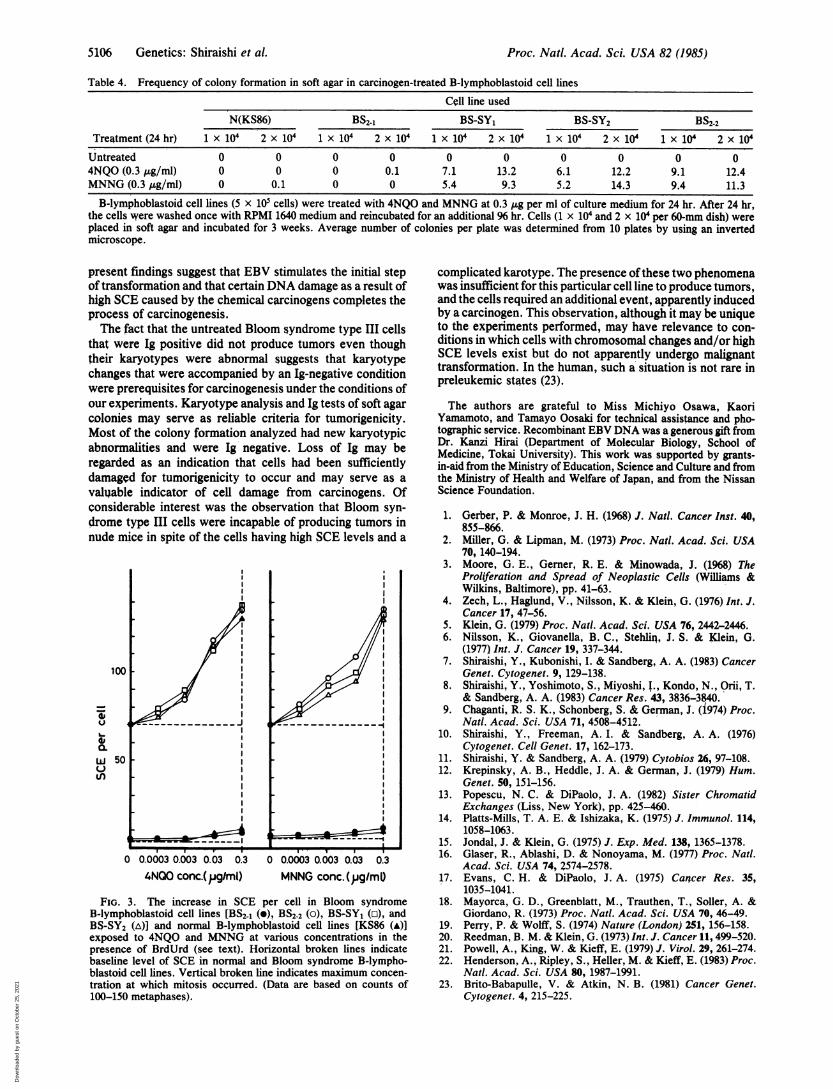
ically increased to 140-150 per cell over the baseline level(71.3 per cell) at the highest concentrations at which Bloomsyndrome cells were able to survive, whereas similarlytreated normal (KS86) and Bloom syndrome type I cells hadonly a small increase in SCE of 11 and 13 per cell, respec-tively (doubling over baseline rates of 4.9 and 5.2 per cell).Fig. 3 shows the effects of 4NQO and MNNG on the SCElevels of normal and Bloom syndrome cell lines. After 4NQOtreatment, the SCE frequency in Bloom syndrome type II andIII cells began to increase at 0.0003 tkg/ml and was dramat-ically increased at 0.03 gg/ml, reaching 140-150 SCE per cellat 0.3 gg/ml, whereas the SCE frequency of normal andBloom syndrome type I reached a maximum level of -13SCE per cell at 0.3 gg/ml. After MNNG treatment, the SCEfrequency in Bloom syndrome type II and III cells began toincrease at 0.0003 ,tg/ml, was increased with dose, andreached the highest value at 0.3 ,g/ml, whereas in similarlytreated normal and Bloom syndrome type I cells, the SCEfrequency curve remained flat until the concentrationreached 0.03 ,g/ml and was maximum at 0.3 ,xg/ml at a levelof 15 SCE per cell. These findings indicate that a net increaseof -70 SCE per cell (over baseline with BrdUrd labeling only)
6;-tooh.
aE,.
I x
'a
lq. lq.
em s!
l1:ant(1 ;13)(p21;q32)
t(l2; 14)(q22; q32)
tW ; 2)(p11 ;qll)
FIG. 2. Examples of marker chromosomes observed in a Bloomsyndrome tumor (Table 3).
seemed to be necessary to produce carcinogenesis in Bloomsyndrome type II and type III cells.
DISCUSSIONThe results indicate that cell lines with high SCE levelsoriginating from the B lymphocytes of Bloom syndromepatients are highly susceptible to malignant transformationwhen their SCE rate is raised above a certain critical level, asevidenced by tumor production in nude mice and high colonyformation rates in agar. In contrast, in normal and Bloomsyndrome type I cells in which such a critical level was notreached, no tumor formation and only very rare colonyformation were seen, even though the SCE rate doubled overthat of the baseline. On the other hand, when SCE increasesexceeded 70 SCE per cell over the baseline, malignanttransformation readily occurred. The malignant transforma-tion of Bloom syndrome type II cells with a normal karyotypeindicates that a high level of SCE was a most critical factorin Bloom syndrome carcinogenesis and that karyotypicabnormalities were not a prerequisite for malignant transfor-mation to occur, although it is possible that their presencemay have enhanced the rate of transformation, as seen in theresults with Bloom syndrome type III cells.The appearance of karyotypic changes in tumors originat-
ing from Bloom syndrome type II cells and the additionalcytogenetic abnormalities seen in the tumors from Bloomsyndrome type III cells may reflect phenomena secondary tomalignant transformation or may have played a key role in theinitiation and maintenance of the transformation by leading tosuch events as oncogene activation.
Patients with Bloom syndrome have a greatly increasedincidence of malignancy. In fact, the bulk of the patientsdevelop leukemia, lymphoma, or cancer at an early age. It ispossible that the high SCE levels seen in the cells of thesepatients may not only reflect a high susceptibility to malig-nant transformation, but may also be related to the readinessof the cells to undergo such a transformation. An interestingobservation in the present study was the disappearance ofsurface and cytoplasmic Ig in the transformed cells. This lossof Ig appeared to be a prerequisite for tumor formation, evenin the Bloom syndrome type III cells that already containeda rare abnormal karyotype prior to exposure to the carcino-gens. The absence of Ig in the Bloom syndrome tumor wouldseem to cast doubt on their B-lymphoid-cell origin; however,the presence of EBNA and EBV genome in the tumor cellsis strong evidence that the malignancy originated from Bloomsyndrome B-lymphoblastoid cell lines that had been trans-formed with carcinogens. Since only cells containing EBVgenome can be transformed by chemical carcinogens, the
Genetics: Shiraishi et al.
Dow
nloa
ded
by g
uest
on
Oct
ober
25,
202
1
Proc. Natl. Acad. Sci. USA 82 (198S)
Table 4. Frequency of colony formation in soft agar in carcinogen-treated B-lymphoblastoid cell lines
Cell line usedN(KS86) BS2 1 BS-SY1 BS-SY2 BS2-2
Treatment (24 hr) 1 X 10⁴ 2 x 10⁴ 1 x 10⁴ 2 x 10⁴ 1 x 10⁴ 2 x 10⁴ 1 x 10⁴ 2 x 10⁴ 1 x 10⁴ 2 x 10⁴Untreated 0 0 0 0 0 0 0 0 0 04NQO (0.3 gg/ml) 0 0 0 0.1 7.1 13.2 6.1 12.2 9.1 12.4MNNG (0.3 ,ug/ml) 0 0.1 0 0 5.4 9.3 5.2 14.3 9.4 11.3
B-lymphoblastoid cell lines (5 x 10⁵ cells) were treated with 4NQO and MNNG at 0.3 Iug per ml of culture medium for 24 hr. After 24 hr,the cells were washed once with RPMI 1640 medium and reincubated for an additional 96 hr. Cells (1 x 10⁴ and 2 x 10⁴ per 60-mm dish) wereplaced in soft agar and incubated for 3 weeks. Average number of colonies per plate was determined from 10 plates by using an invertedmicroscope.
present findings suggest that EBV stimulates the initial stepof transformation and that certain DNA damage as a result ofhigh SCE caused by the chemical carcinogens completes theprocess of carcinogenesis.The fact that the untreated Bloom syndrome type III cells
that were Ig positive did not produce tumors even thoughtheir karyotypes were abnormal suggests that karyotypechanges that were accompanied by an Ig-negative conditionwere prerequisites for carcinogenesis under the conditions ofour experiments. Karyotype analysis and Ig tests of soft agarcolonies may serve as reliable criteria for tumorigenicity.Most of the colony formation analyzed had new karyotypicabnormalities and were Ig negative. Loss of Ig may beregarded as an indication that cells had been sufficientlydamaged for tumorigenicity to occur and may serve as avalvable indicator of cell damage from carcinogens. Ofconsiderable interest was the observation that Bloom syn-drome type III cells were incapable of producing tumors innude mice in spite of the cells having high SCE levels and a
100
U-J~~~~--------0:
W 50
*----1
,,,. . g~~1 I.0 0.0003 0.003 0.03 0.3 0 0.0003 0.003 0.03 0.3
4NQO conc.(jPgIml) MNNG conc.(jglm0)FIG. 3. The increase in SCE per cell in Bloom syndrome
B-lymphoblastoid cell lines [BS2-1 (9), BS2-2 (o), BS-SY1 (o), andBS-SY2 (A)] and normal B-lymphoblastoid cell lines [KS86 (A)]exposed to 4NQQ and MNNG at various concentrations in thepresence of BrdUrd (see text). Horizontal broken lines indicatebaseline level of SCE in normal and Bloom syndrome B-lympho-blastoid cell lines. Vertical broken line indicates maximum concen-tration at which mitosis occurred. (Data are based on counts of100-150 metaphases).
complicated karotype. The presence ofthese two phenomenawas insufficient for this particular cell line to produce tumors,and the cells required an additional event, apparently inducedby a carcinogen. This observation, although it may be uniqueto the experiments performed, may have relevance to con-ditions in which cells with chromosomal changes and/or highSCE levels exist but do not apparently undergo malignanttransformation. In the human, such a situation is not rare inpreleukemic states (23).
The authors are grateful to Miss Michiyo Osawa, KaoriYamamoto, and Tamayo Oosaki for technical assistance and pho-tographic service. Recombinant EBV DNA was a generous gift fromDr. Kanzi Hirai (Department of Molecular Biology, School ofMedicine, Tokai University). This work was supported by grants-in-aid from the Ministry of Education, Science and Culture and fromthe Ministry of Health and Welfare of Japan, and from the NissanScience Foundation.
1. Gerber, P. & Monroe, J. H. (1968) J. Natl. Cancer Inst. 40,855-866.
2. Miller, G. & Lipman, M. (1973) Proc. Natl. Acad. Sci. USA70, 140-194.
3. Moore, G. E., Gerner, R. E. & Minowada, J. (1968) TheProliferation and Spread of Neoplastic Cells (Williams &Wilkins, Baltimore), pp. 41-63.
4. Zech, L., Haglund, V., Nilsson, K. & Klein, G. (1976) Int. J.Cancer 17, 47-56.
5. Klein, G. (1979) Proc. Nail. Acad. Sci. USA 76, 2442-2446.6. Nilsson, K., Giovanella, B. C., Stehliri, J. S. & Klein, G.
(1977) Int. J. Cancer 19, 337-344.7. Shiraishi, Y., Kubonishi, I. & Sandberg, A. A. (1983) Cancer
Genet. Cytogenet. 9, 129-138.8. Shiraishi, Y., Yoshimoto, S., Miyoshi, T., Kondo, N., Orii, T.
& Sandberg, A. A. (1983) Cancer Res. 43, 3836-3840.9. Chaganti, R. S. K., Schonberg, S. & German, J. (i974) Proc.
Natl. Acad. Sci. USA 71, 4508-4512.10. Shiraishi, Y., Freeman, A. I. & Sandberg, A. A. (1976)
Cytogenet. Cell Genet. 17, 162-173.11. Shiraishi, Y. & Sandberg, A. A. (1979) Cytobios 26, 97-108.12. Krepinsky, A. B., Heddle, J. A. & German, J. (1979) Hum.
Genet. 50, 151-156.13. Popescu, N. C. & DiPaolo, J. A. (1982) Sister Chromatid
Exchanges (Liss, New York), pp. 425-460.14. Platts-Mills, T. A. E. & Ishizaka, K. (1975) J. Immunol. 114,
1058-1063.15. Jondal, J. & Klein, G. (1975) J. Exp. Med. 138, 1365-1378.16. Glaser, R., Ablashi, D. & Nonoyama, M. (1977) Proc. Natl.
Acad. Sci. USA 74, 2574-2578.17. Evans, C. H. & DiPaolo, J. A. (1975) Cancer Res. 35,
1035-1041.18. Mayorca, G. D., Greenblatt, M., Trauthen, T., Soller, A. &
Giordano, R. (1973) Proc. Natl. Acad. Sci. USA 70, 46-49.19. Perry, P. & Wolff, S. (1974) Nature (London) 251, 156-158.20. Reedman, B. M. & Klein, G. (1973) Int. J. Cancer 11, 499-520.21. Powell, A., King, W. & Kieff, E. (1979) J. Virol. 29, 261-274.22. Henderson, A., Ripley, S., Heller, M. & Kieff, E. (1983) Proc.
Nail. Acad. Sci. USA 80, 1987-1991.23. Brito-Babapulle, V. & Atkin, N. B. (1981) Cancer Genet.
Cytogenet. 4, 215-225.
5106 Genetics: Shiraishi et al.
Dow
nloa
ded
by g
uest
on
Oct
ober
25,
202
1