manageengine opstor :: help documentation · manageengine opstor :: help documentation ... fault...
TRANSCRIPT
ManageEngine OpStor :: Help Documentation
Zoho Corporation Pvt. Ltd.
1
Table of Contents
INTRODUCTION ........................................................................................................ 3
System Requirements ........................................................................................................ 5
GETTING STARTED ................................................................................................. 6
Starting OpStor Server ....................................................................................................... 7
Starting OpStor Client ........................................................................................................ 9
Shutting Down OpStor Server .......................................................................................... 10
UNDERSTANDING THE GUI .................................................................................. 11
Home Tab ........................................................................................................................ 12
Device Properties Page ................................................................................................... 13
Search ............................................................................................................................. 23
Skins ................................................................................................................................ 24
Auto Refresh .................................................................................................................... 25
DISCOVERING STORAGE DEVICES ..................................................................... 26
Auto Discovery ................................................................................................................. 27
Prerequisites For Device Discovery ................................................................................. 28
Adding a Device ............................................................................................................... 29
Editing Device Details ...................................................................................................... 30
VISUALIZATION ...................................................................................................... 31
Map View ......................................................................................................................... 32
Map Icons ........................................................................................................................ 33
Drilling Down The Map ..................................................................................................... 34
FAULT MONITORING AND ESCALATION ............................................................ 35
Viewing Alarms ................................................................................................................ 36
Viewing Alarm Details ...................................................................................................... 37
Email Alarm Reports ........................................................................................................ 38
Alarm Operations ............................................................................................................. 39
Schedule Alarm Actions ................................................................................................... 40
ManageEngine OpStor :: Help Documentation
Zoho Corporation Pvt. Ltd.
2
Escalate Unattended Alarms ............................................................................................ 41
REPORTS ................................................................................................................ 42
Summary Reports ............................................................................................................ 43
Capacity Reports ............................................................................................................. 44
Availability Reports .......................................................................................................... 45
Performance Reports ....................................................................................................... 46
Forecasting Reports......................................................................................................... 47
Scheduling Reports ......................................................................................................... 48
GRAPHS .................................................................................................................. 49
Plotting Graphs ................................................................................................................ 50
CONFIGURATION ................................................................................................... 51
Launching WebApp ......................................................................................................... 52
Telnet .............................................................................................................................. 53
SNMP .............................................................................................................................. 54
OPSTOR ADMINISTRATION .................................................................................. 55
Manage Storage Devices ................................................................................................. 56
Schedule Alarm Actions ................................................................................................... 57
Escalate Unattended Alarms ............................................................................................ 58
Email Alarm Reports ........................................................................................................ 59
Manage Report Schedulers ............................................................................................. 60
Manage OpStor Users ..................................................................................................... 61
Clear Old Data ................................................................................................................. 63
Configure Mail Server ...................................................................................................... 64
Configure Threshold Rules .............................................................................................. 65
Configure Performance Polling ........................................................................................ 66
REGISTERING THE LICENSE ................................................................................ 67
FAQ .......................................................................................................................... 68
TROUBLESHOOTING TIPS .................................................................................... 71
KNOWN ISSUES ..................................................................................................... 73
ManageEngine OpStor :: Help Documentation
Zoho Corporation Pvt. Ltd.
3
Introduction
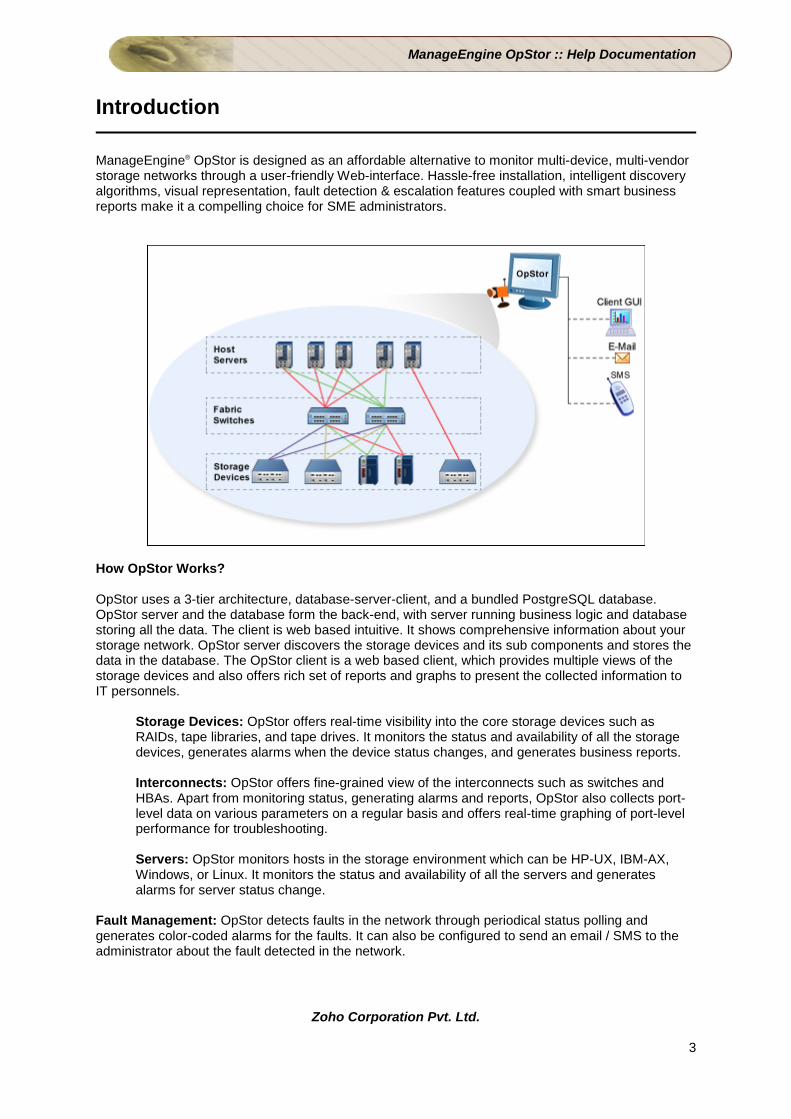
ManageEngine® OpStor is designed as an affordable alternative to monitor multi-device, multi-vendor storage networks through a user-friendly Web-interface. Hassle-free installation, intelligent discovery algorithms, visual representation, fault detection & escalation features coupled with smart business reports make it a compelling choice for SME administrators.
How OpStor Works? OpStor uses a 3-tier architecture, database-server-client, and a bundled PostgreSQL database. OpStor server and the database form the back-end, with server running business logic and database storing all the data. The client is web based intuitive. It shows comprehensive information about your storage network. OpStor server discovers the storage devices and its sub components and stores the data in the database. The OpStor client is a web based client, which provides multiple views of the storage devices and also offers rich set of reports and graphs to present the collected information to IT personnels.
Storage Devices: OpStor offers real-time visibility into the core storage devices such as RAIDs, tape libraries, and tape drives. It monitors the status and availability of all the storage devices, generates alarms when the device status changes, and generates business reports. Interconnects: OpStor offers fine-grained view of the interconnects such as switches and HBAs. Apart from monitoring status, generating alarms and reports, OpStor also collects port-level data on various parameters on a regular basis and offers real-time graphing of port-level performance for troubleshooting. Servers: OpStor monitors hosts in the storage environment which can be HP-UX, IBM-AX, Windows, or Linux. It monitors the status and availability of all the servers and generates alarms for server status change.
Fault Management: OpStor detects faults in the network through periodical status polling and generates color-coded alarms for the faults. It can also be configured to send an email / SMS to the administrator about the fault detected in the network.
ManageEngine OpStor :: Help Documentation
Zoho Corporation Pvt. Ltd.
4
Performance Management: OpStor measures the performance of the storage hardware, such as the utilization, traffic, errors, etc. by collecting data at regular intervals. These data are provided in the form of reports and graphs to the administrators. Inventory Management: OpStor maintains an accurate inventory of storage resources, such as RAIDs, tape libraries, tape drives, switches, HBAs, and host servers. It provides options to add support information, location, and trouble tickets against each of the devices and provides meaningful reports to administrators to track the assets. Web based client: OpStor has a web client that enables access to the OpStor server using a standard web browser, such as internet explorer and Mozilla. This provides administrators with the convenience of anywhere access at anytime. Using the remote client, OpStor can support multiple concurrent users. This document covers the help topics for all the functions in the product. The topics covered in this document are
• System Requirements
• Getting Started
• Understanding the GUI
• Discovering Storage Devices
• Visualization
• Fault Monitoring And Escalation
• Reports
• Graphs
• Configuration
• OpStor Administration
• FAQ
• Troubleshooting
• Known Issues
ManageEngine OpStor :: Help Documentation
Zoho Corporation Pvt. Ltd.
5
System Requirements
• Hardware Requirements
• Software Requirements
Hardware Requirements
Hardware Recommended Processor 2 GHz RAM 4 GB Disk Space 40 GB
Software Requirements
Supported Platforms
• Windows XP • Windows 2000 • Windows 2003 Server • Windows 2008 Server • Windows Vista • Windows 7 • Red Hat Enterprise Linux Server release 5.4 • Ubunutu 11.04 Natty • CentOS release 5.4 (Final)

ManageEngine OpStor :: Help Documentation
Zoho Corporation Pvt. Ltd.
6
Getting Started
The topics covered under this section are:
• Starting OpStor Server • Starting OpStor Client • Shutting down OpStor server
ManageEngine OpStor :: Help Documentation
Zoho Corporation Pvt. Ltd.
7
Starting OpStor Server
Where to Install OpStor :
• Install OpStor in a Host present in the Storage Area Network. • Ensure that all the devices you are planning to monitor are IP reachable from the
OpStor installed host.
To start OpStor server in Windows :
• Click Start --> Programs --> ManageEngine OpStor --> Start OpStor (or) Double-click "OpStor" icon in the desktop.
• The server will be started in port 80 (default port) or the one you had specified during installation.
To start OpStor server in Linux :
Note: To receive the traps in 162 port, you must start the server as a 'root' user.
• Execute startOpStorServer.sh under <OpStor Home>/bin directory. Where, <OpStor Home>
is the directory where OpStor is installed. • The server will be started in port 80 (default port) or the one you had specified during
installation.
Note: Incase the port 162 is pre-occupied, you will see a message "Traps cannot be received on port 162" on the console. You can ignore the message and connect to OpStor client.
Note: For changing the port at which OpStor server is started, please refer to FAQs section.
To start OpStor Server as a service in Windows, follow these steps (Incase you have not opted to install OpStor as a service during the installation of product):
• Run "OpStorService.bat" present under <OpStor Home>\bin directory. This will install OpStor as a service.
• To ensure the service installation, go to Control Panel --> Administrative Tools --> Services and check whether the following service is listed.
• ManageEngineOpStor
• Now select ManageEngineOpStor and start the service. (or) From the command prompt navigate to <OpStor Home>\bin and run the command "OpStorService.bat -t". This will start OpStor server as a service.

ManageEngine OpStor :: Help Documentation
Zoho Corporation Pvt. Ltd.
8
Note:
1. If you want to stop OpStor server, select the ManageEngineOpStor and stop the service (or) run the command "OpStorService.bat -p" under <OpStor Home>\bin.
2. To remove the service, run the command "OpStorService.bat -r"
ManageEngine OpStor :: Help Documentation
Zoho Corporation Pvt. Ltd.
9
Starting OpStor Client
To start OpStor client :
• Open a web browser. • Type http://<Server name>:<Port no.> in the address bar and hit Enter.
Where, <Server name> is the name of the machine where the OpStor server is running. <Port no.> is the port which you had specified during OpStor installation. The port number is shown in the command prompt where the server is started. (By default, OpStor starts in port 80)
• Enter the username and password to login into web client. First time users use "admin / admin" as "username / password".
• The startup wizard is shown. It has two steps namely, 'Configure Mail Server' and 'Email Alarm Report'.
o Configure Mail Server : In this step, enter the mail server details. These settings will be used by OpStor to send out daily alarm reports or escalation reports to administrators.
o Email Alarm Report : Select the required reports and enter the mail ids.
• Finish the wizard
Note: You can finish or cancel the wizard at any point of time. All the options in the wizard are also available in the Admin tab in the client GUI.
This starts the client and the home page is shown. The above mentioned wizard is shown only during the first time login into the client. From the second time, you can simply open a browser and connect to http://<Server name>:<Port no.> and see the home page.
ManageEngine OpStor :: Help Documentation
Zoho Corporation Pvt. Ltd.
10
Shutting Down OpStor Server
To shut down the OpStor server, follow these steps: In Windows :
• Go to Start Menu --> Programs --> ManageEngine OpStor --> Shutdown OpStor (or)
• Go to <OpStor Home>\bin directory • Run ShutdownOpStor.bat
(or)
• If the server is running as a service, stop the service.
In Linux :
• Go to <OpStor Home>/bin directory • Execute ShutdownOpStor.sh under <OpStor Home>/bin
ManageEngine OpStor :: Help Documentation
Zoho Corporation Pvt. Ltd.
11
Understanding the GUI
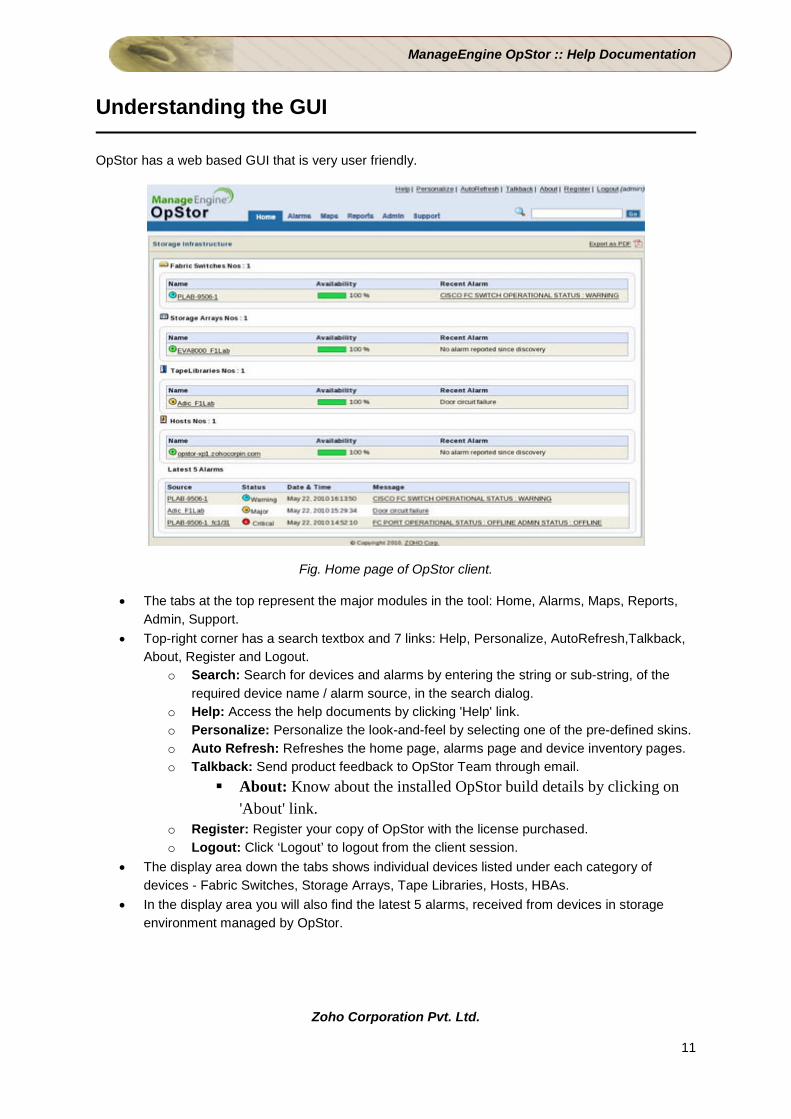
OpStor has a web based GUI that is very user friendly.
Fig. Home page of OpStor client.
• The tabs at the top represent the major modules in the tool: Home, Alarms, Maps, Reports, Admin, Support.
• Top-right corner has a search textbox and 7 links: Help, Personalize, AutoRefresh,Talkback, About, Register and Logout.
o Search: Search for devices and alarms by entering the string or sub-string, of the required device name / alarm source, in the search dialog.
o Help: Access the help documents by clicking 'Help' link. o Personalize: Personalize the look-and-feel by selecting one of the pre-defined skins. o Auto Refresh: Refreshes the home page, alarms page and device inventory pages. o Talkback: Send product feedback to OpStor Team through email.
About: Know about the installed OpStor build details by clicking on 'About' link.
o Register: Register your copy of OpStor with the license purchased. o Logout: Click ‘Logout’ to logout from the client session.
• The display area down the tabs shows individual devices listed under each category of devices - Fabric Switches, Storage Arrays, Tape Libraries, Hosts, HBAs.
• In the display area you will also find the latest 5 alarms, received from devices in storage environment managed by OpStor.
ManageEngine OpStor :: Help Documentation
Zoho Corporation Pvt. Ltd.
12
Home Tab
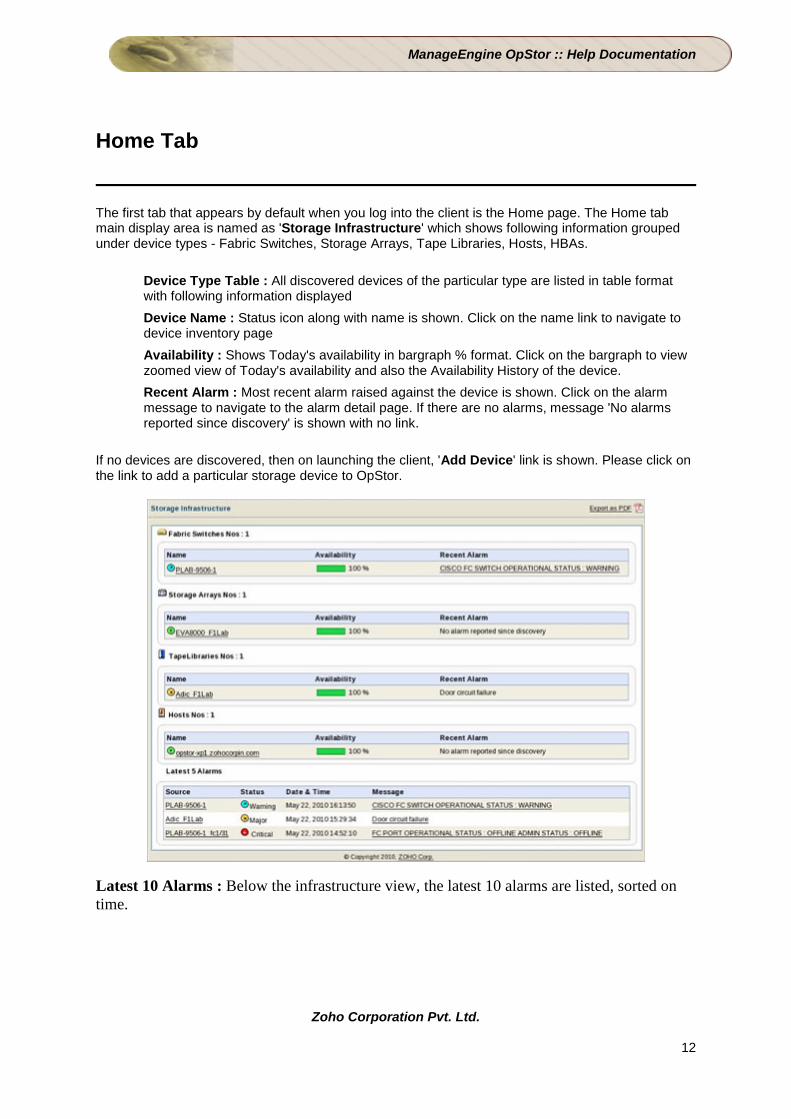
The first tab that appears by default when you log into the client is the Home page. The Home tab main display area is named as 'Storage Infrastructure' which shows following information grouped under device types - Fabric Switches, Storage Arrays, Tape Libraries, Hosts, HBAs.
Device Type Table : All discovered devices of the particular type are listed in table format with following information displayed Device Name : Status icon along with name is shown. Click on the name link to navigate to device inventory page Availability : Shows Today's availability in bargraph % format. Click on the bargraph to view zoomed view of Today's availability and also the Availability History of the device. Recent Alarm : Most recent alarm raised against the device is shown. Click on the alarm message to navigate to the alarm detail page. If there are no alarms, message 'No alarms reported since discovery' is shown with no link.
If no devices are discovered, then on launching the client, 'Add Device' link is shown. Please click on the link to add a particular storage device to OpStor.
Latest 10 Alarms : Below the infrastructure view, the latest 10 alarms are listed, sorted on time.
ManageEngine OpStor :: Help Documentation
Zoho Corporation Pvt. Ltd.
13
Device Properties Page
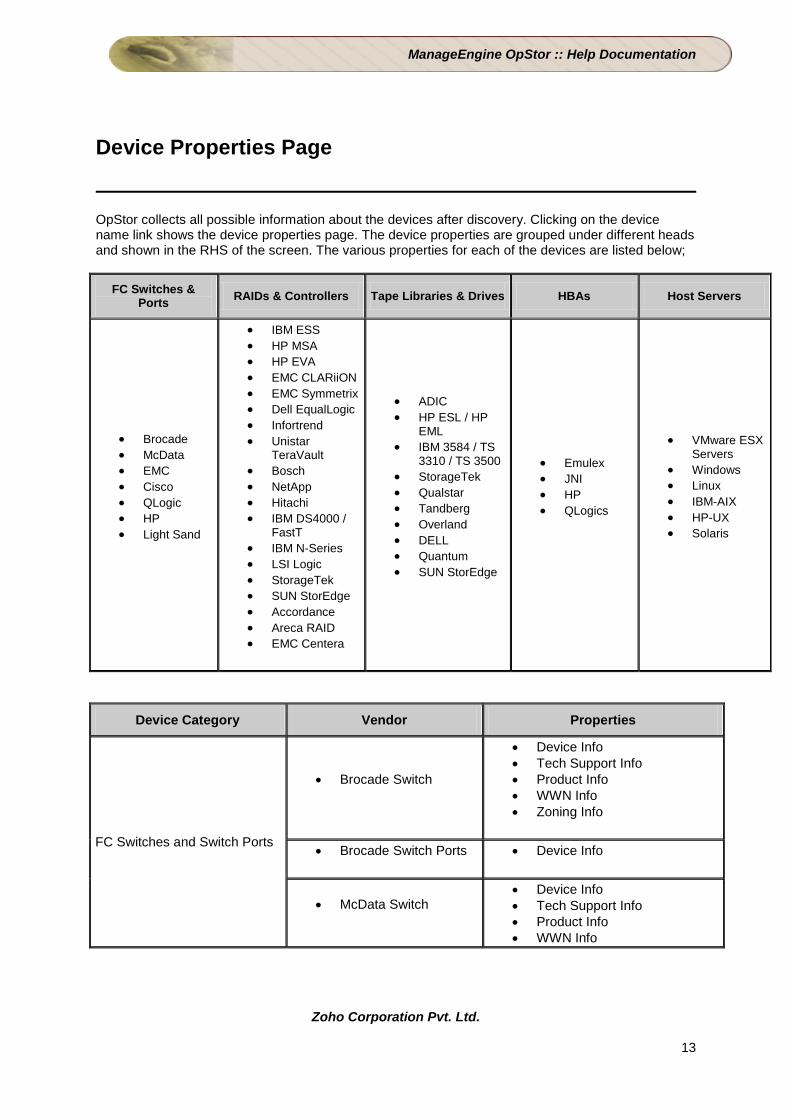
OpStor collects all possible information about the devices after discovery. Clicking on the device name link shows the device properties page. The device properties are grouped under different heads and shown in the RHS of the screen. The various properties for each of the devices are listed below;
FC Switches & Ports RAIDs & Controllers Tape Libraries & Drives HBAs Host Servers
• Brocade • McData • EMC • Cisco • QLogic • HP • Light Sand
• IBM ESS • HP MSA • HP EVA • EMC CLARiiON • EMC Symmetrix • Dell EqualLogic • Infortrend • Unistar
TeraVault • Bosch • NetApp • Hitachi • IBM DS4000 /
FastT • IBM N-Series • LSI Logic • StorageTek • SUN StorEdge • Accordance • Areca RAID • EMC Centera
• ADIC • HP ESL / HP
EML • IBM 3584 / TS
3310 / TS 3500 • StorageTek • Qualstar • Tandberg • Overland • DELL • Quantum • SUN StorEdge
• Emulex • JNI • HP • QLogics
• VMware ESX Servers
• Windows • Linux • IBM-AIX • HP-UX • Solaris
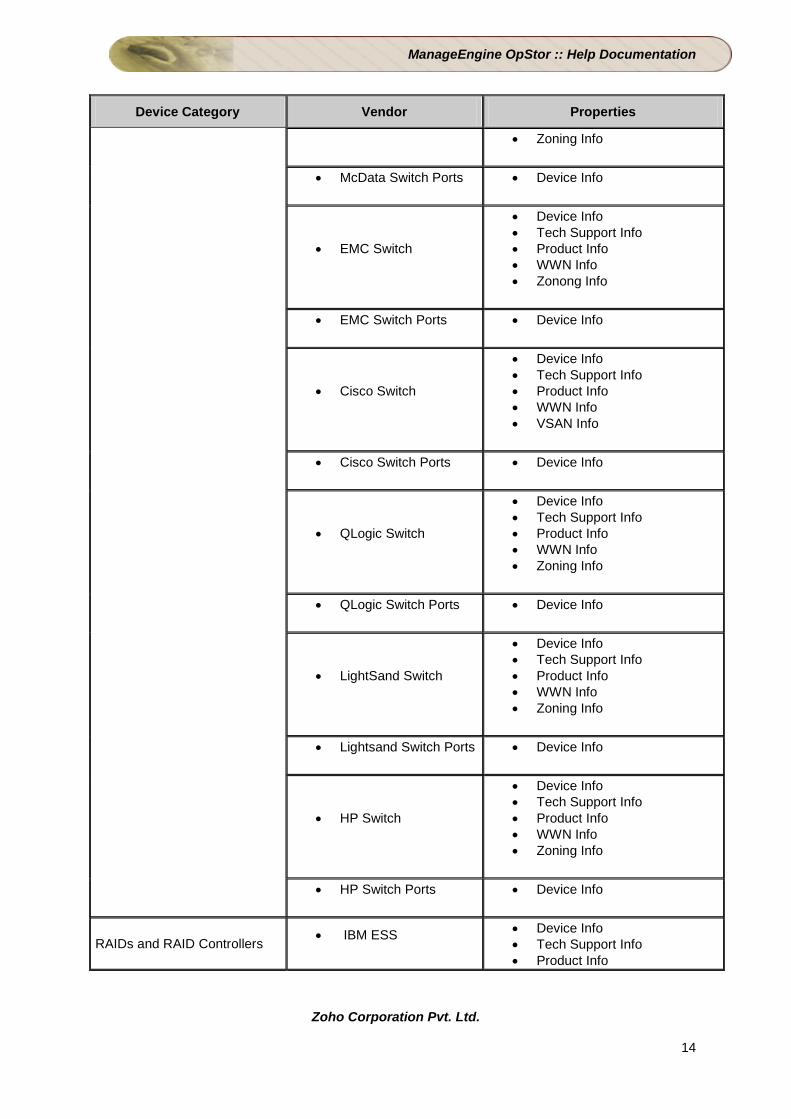
Device Category Vendor Properties
FC Switches and Switch Ports
• Brocade Switch
• Device Info • Tech Support Info • Product Info • WWN Info • Zoning Info
• Brocade Switch Ports • Device Info
• McData Switch • Device Info • Tech Support Info • Product Info • WWN Info
ManageEngine OpStor :: Help Documentation
Zoho Corporation Pvt. Ltd.
14
Device Category Vendor Properties
• Zoning Info
• McData Switch Ports • Device Info
• EMC Switch
• Device Info • Tech Support Info • Product Info • WWN Info • Zonong Info
• EMC Switch Ports • Device Info
• Cisco Switch
• Device Info • Tech Support Info • Product Info • WWN Info • VSAN Info
• Cisco Switch Ports • Device Info
• QLogic Switch
• Device Info • Tech Support Info • Product Info • WWN Info • Zoning Info
• QLogic Switch Ports • Device Info
• LightSand Switch
• Device Info • Tech Support Info • Product Info • WWN Info • Zoning Info
• Lightsand Switch Ports • Device Info
• HP Switch
• Device Info • Tech Support Info • Product Info • WWN Info • Zoning Info
• HP Switch Ports • Device Info
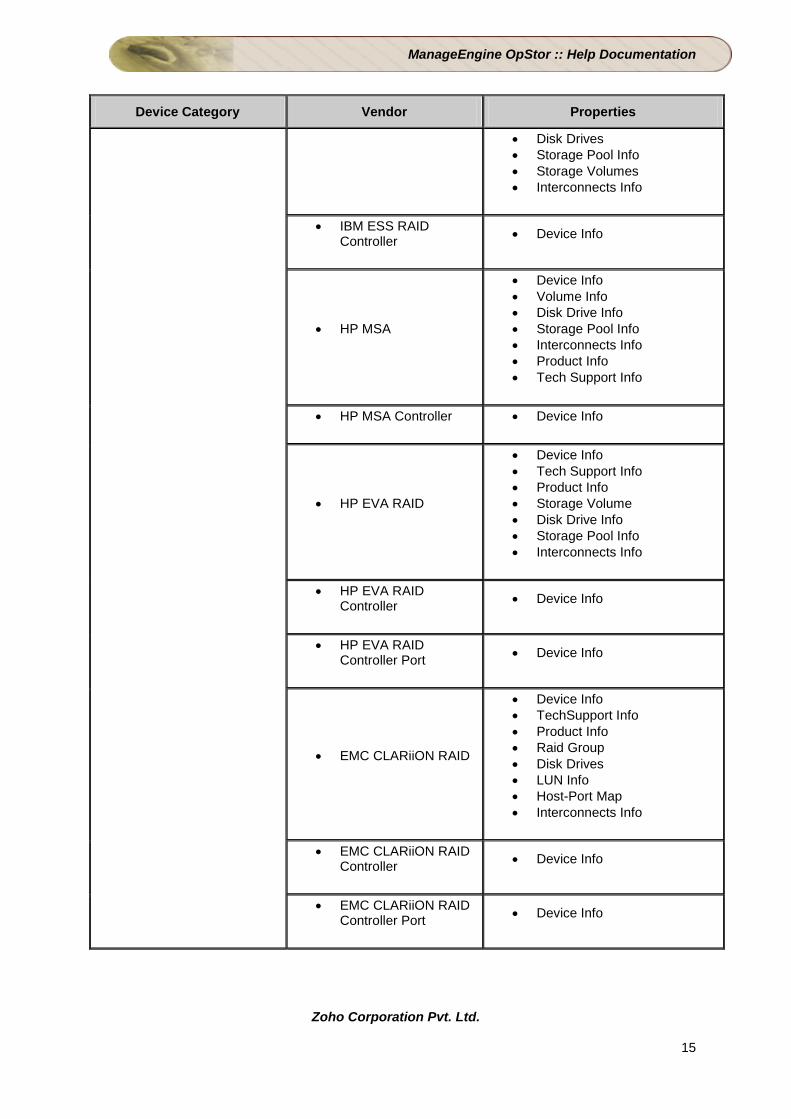
RAIDs and RAID Controllers • IBM ESS • Device Info • Tech Support Info • Product Info
ManageEngine OpStor :: Help Documentation
Zoho Corporation Pvt. Ltd.
15
Device Category Vendor Properties
• Disk Drives • Storage Pool Info • Storage Volumes • Interconnects Info
• IBM ESS RAID Controller • Device Info
• HP MSA
• Device Info • Volume Info • Disk Drive Info • Storage Pool Info • Interconnects Info • Product Info • Tech Support Info
• HP MSA Controller • Device Info
• HP EVA RAID
• Device Info • Tech Support Info • Product Info • Storage Volume • Disk Drive Info • Storage Pool Info • Interconnects Info
• HP EVA RAID Controller • Device Info
• HP EVA RAID Controller Port • Device Info
• EMC CLARiiON RAID
• Device Info • TechSupport Info • Product Info • Raid Group • Disk Drives • LUN Info • Host-Port Map • Interconnects Info
• EMC CLARiiON RAID Controller • Device Info
• EMC CLARiiON RAID Controller Port • Device Info

ManageEngine OpStor :: Help Documentation
Zoho Corporation Pvt. Ltd.
16
Device Category Vendor Properties
• EMC Symmetrix RAID • Device Info • TechSupport Info • Product Info • Disk Drives • Storage Volume • Storage Pool • Storage Extent • Interconneccts Info
• EMC Symmetrix RAID Controller
• Device Info
• EMC Symmetrix RAID Controller Port
• Device Info
• Dell EqualLogic RAID • Device Info • TechSupport Info • Product Info • Disk Drives
• Infortrend RAID
• Device Info • Tech Support Info • Product Info • Disk Drives • Logical Drives • Logical Volumes • RAID Partitions • Channels • LUN Info • Power Supply Info • Fan Info
• Infortrend RAID Controller
• Device Info • Product Info • Cache Info • Disk Array Info • Host Side Info • Drive Side Info • Redundant Controller Info
• Unistar TeraVault RAID
• Device Info • Tech Support Info • Product Info • Disk Drives • Logical Drives • Logical Volumes • RAID Partitions • Channels • LUN Info
ManageEngine OpStor :: Help Documentation
Zoho Corporation Pvt. Ltd.
17
Device Category Vendor Properties
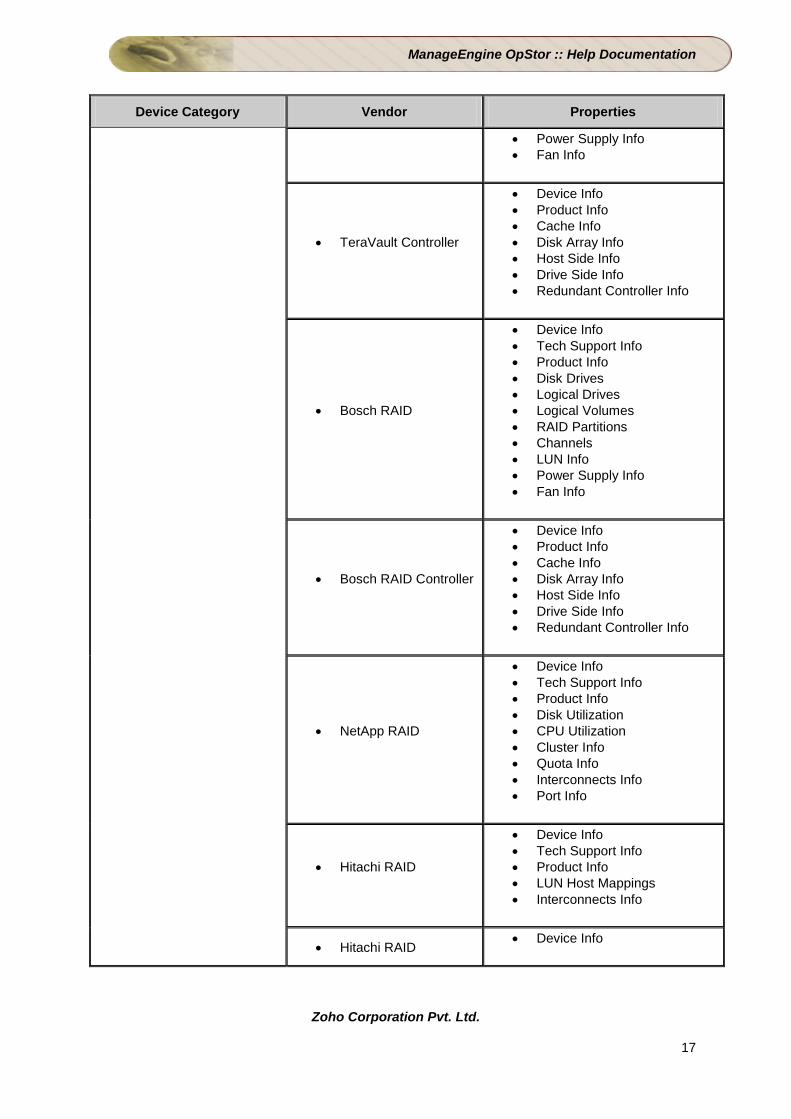
• Power Supply Info • Fan Info
• TeraVault Controller
• Device Info • Product Info • Cache Info • Disk Array Info • Host Side Info • Drive Side Info • Redundant Controller Info
• Bosch RAID
• Device Info • Tech Support Info • Product Info • Disk Drives • Logical Drives • Logical Volumes • RAID Partitions • Channels • LUN Info • Power Supply Info • Fan Info
• Bosch RAID Controller
• Device Info • Product Info • Cache Info • Disk Array Info • Host Side Info • Drive Side Info • Redundant Controller Info
• NetApp RAID
• Device Info • Tech Support Info • Product Info • Disk Utilization • CPU Utilization • Cluster Info • Quota Info • Interconnects Info • Port Info
• Hitachi RAID
• Device Info • Tech Support Info • Product Info • LUN Host Mappings • Interconnects Info
• Hitachi RAID • Device Info
ManageEngine OpStor :: Help Documentation
Zoho Corporation Pvt. Ltd.
18
Device Category Vendor Properties
Controller
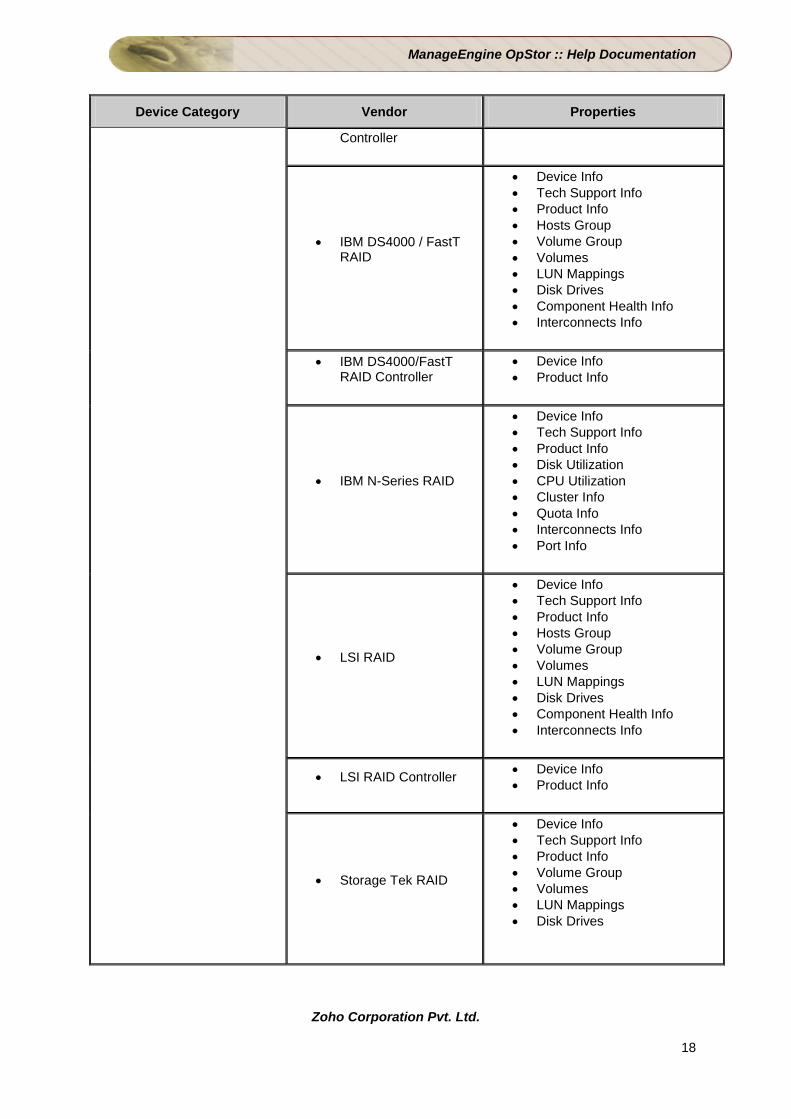
• IBM DS4000 / FastT RAID
• Device Info • Tech Support Info • Product Info • Hosts Group • Volume Group • Volumes • LUN Mappings • Disk Drives • Component Health Info • Interconnects Info
• IBM DS4000/FastT RAID Controller
• Device Info • Product Info
• IBM N-Series RAID
• Device Info • Tech Support Info • Product Info • Disk Utilization • CPU Utilization • Cluster Info • Quota Info • Interconnects Info • Port Info
• LSI RAID
• Device Info • Tech Support Info • Product Info • Hosts Group • Volume Group • Volumes • LUN Mappings • Disk Drives • Component Health Info • Interconnects Info
• LSI RAID Controller • Device Info • Product Info
• Storage Tek RAID
• Device Info • Tech Support Info • Product Info • Volume Group • Volumes • LUN Mappings • Disk Drives
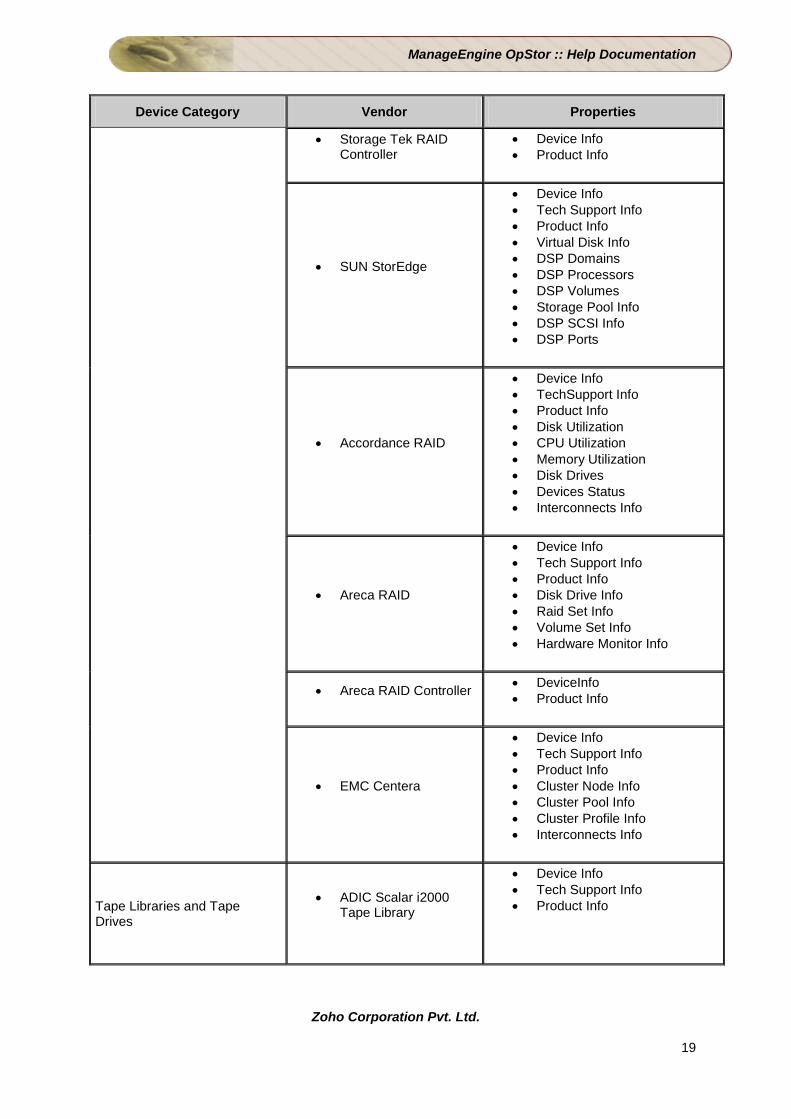
ManageEngine OpStor :: Help Documentation
Zoho Corporation Pvt. Ltd.
19
Device Category Vendor Properties
• Storage Tek RAID Controller
• Device Info • Product Info
• SUN StorEdge
• Device Info • Tech Support Info • Product Info • Virtual Disk Info • DSP Domains • DSP Processors • DSP Volumes • Storage Pool Info • DSP SCSI Info • DSP Ports
• Accordance RAID
• Device Info • TechSupport Info • Product Info • Disk Utilization • CPU Utilization • Memory Utilization • Disk Drives • Devices Status • Interconnects Info
• Areca RAID
• Device Info • Tech Support Info • Product Info • Disk Drive Info • Raid Set Info • Volume Set Info • Hardware Monitor Info
• Areca RAID Controller • DeviceInfo • Product Info
• EMC Centera
• Device Info • Tech Support Info • Product Info • Cluster Node Info • Cluster Pool Info • Cluster Profile Info • Interconnects Info
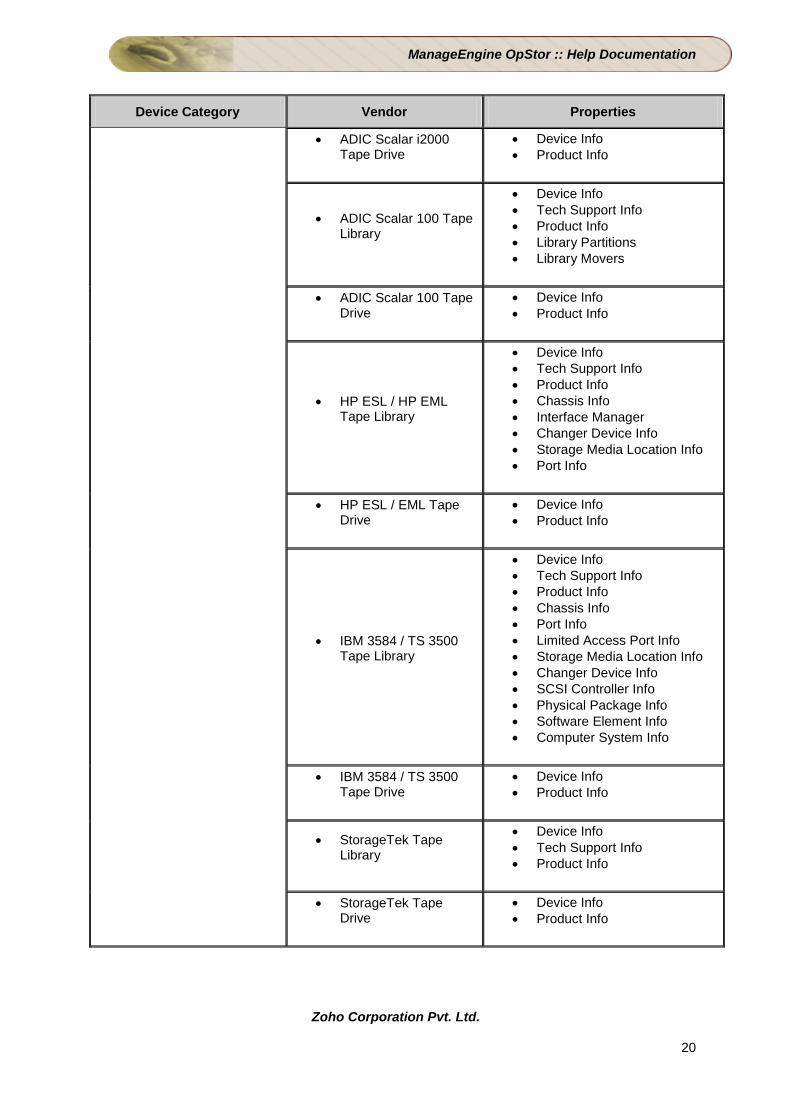
Tape Libraries and Tape Drives
• ADIC Scalar i2000 Tape Library
• Device Info • Tech Support Info • Product Info
ManageEngine OpStor :: Help Documentation
Zoho Corporation Pvt. Ltd.
20
Device Category Vendor Properties
• ADIC Scalar i2000 Tape Drive
• Device Info • Product Info
• ADIC Scalar 100 Tape Library
• Device Info • Tech Support Info • Product Info • Library Partitions • Library Movers
• ADIC Scalar 100 Tape Drive
• Device Info • Product Info
• HP ESL / HP EML Tape Library
• Device Info • Tech Support Info • Product Info • Chassis Info • Interface Manager • Changer Device Info • Storage Media Location Info • Port Info
• HP ESL / EML Tape Drive
• Device Info • Product Info
• IBM 3584 / TS 3500 Tape Library
• Device Info • Tech Support Info • Product Info • Chassis Info • Port Info • Limited Access Port Info • Storage Media Location Info • Changer Device Info • SCSI Controller Info • Physical Package Info • Software Element Info • Computer System Info
• IBM 3584 / TS 3500 Tape Drive
• Device Info • Product Info
• StorageTek Tape Library
• Device Info • Tech Support Info • Product Info
• StorageTek Tape Drive
• Device Info • Product Info
ManageEngine OpStor :: Help Documentation
Zoho Corporation Pvt. Ltd.
21
Device Category Vendor Properties
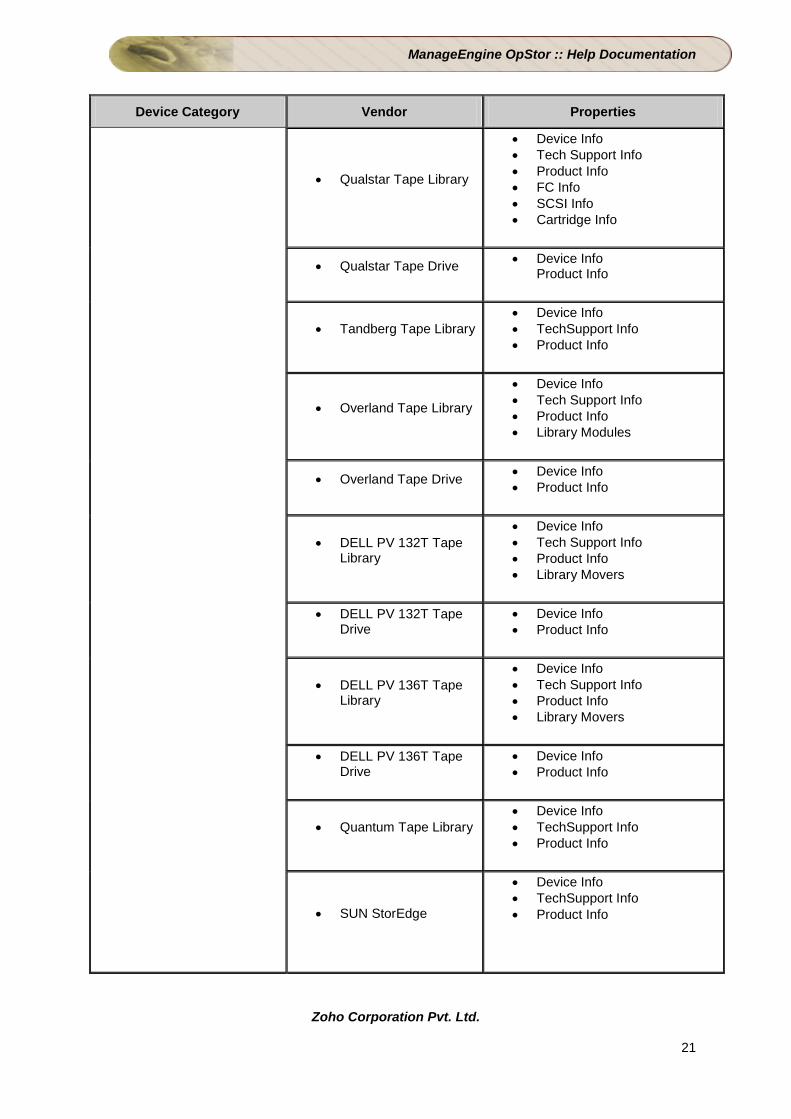
• Qualstar Tape Library
• Device Info • Tech Support Info • Product Info • FC Info • SCSI Info • Cartridge Info
• Qualstar Tape Drive • Device Info Product Info
• Tandberg Tape Library • Device Info • TechSupport Info • Product Info
• Overland Tape Library
• Device Info • Tech Support Info • Product Info • Library Modules
• Overland Tape Drive • Device Info • Product Info
• DELL PV 132T Tape Library
• Device Info • Tech Support Info • Product Info • Library Movers
• DELL PV 132T Tape Drive
• Device Info • Product Info
• DELL PV 136T Tape Library
• Device Info • Tech Support Info • Product Info • Library Movers
• DELL PV 136T Tape Drive
• Device Info • Product Info
• Quantum Tape Library • Device Info • TechSupport Info • Product Info
• SUN StorEdge
• Device Info • TechSupport Info • Product Info
ManageEngine OpStor :: Help Documentation
Zoho Corporation Pvt. Ltd.
22
Device Category Vendor Properties
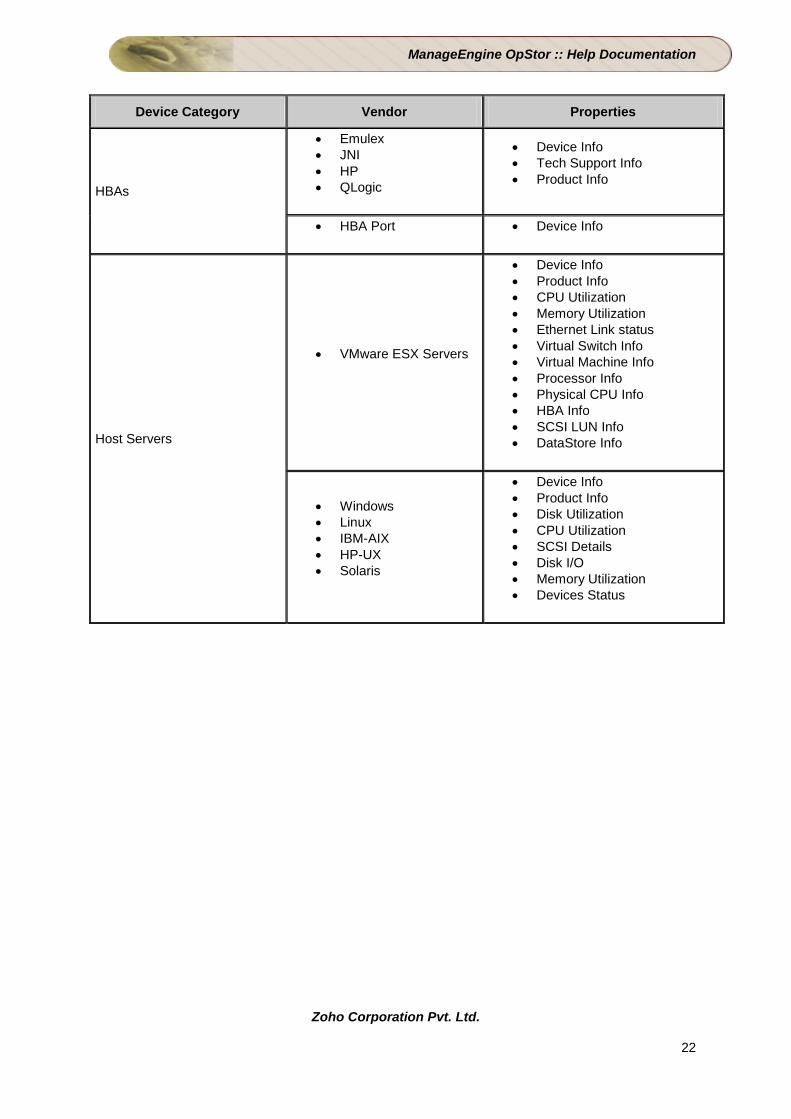
HBAs
• Emulex • JNI • HP • QLogic
• Device Info • Tech Support Info • Product Info
• HBA Port • Device Info
Host Servers
• VMware ESX Servers
• Device Info • Product Info • CPU Utilization • Memory Utilization • Ethernet Link status • Virtual Switch Info • Virtual Machine Info • Processor Info • Physical CPU Info • HBA Info • SCSI LUN Info • DataStore Info
• Windows • Linux • IBM-AIX • HP-UX • Solaris
• Device Info • Product Info • Disk Utilization • CPU Utilization • SCSI Details • Disk I/O • Memory Utilization • Devices Status

ManageEngine OpStor :: Help Documentation
Zoho Corporation Pvt. Ltd.
23
Search
The search dialog in the top-right corner helps in searching for devices and alarms in the systems. Type a device name or alarm source or any of its sub-string and click 'Search' to get the list of matching devices and alarms in tabular form. The device names and alarm sources have links to the corresponding device details. The search helps you to reach any device directly without going through inventory tables. This will be helpful when you know the device name and want to look at its properties or alarms.
ManageEngine OpStor :: Help Documentation
Zoho Corporation Pvt. Ltd.
24
Skins
The 'Personalize' option is used to change the skin of the client GUI. You can change the look and feel of the client by applying one of the pre-defined skins. The settings will be retained for a particular user. To change the skin :
1. Click 'Personalize'. 2. Select the radio button corresponding to the skin that you want to apply. 3. Click 'Submit'.
The new skin will get applied immediately.
ManageEngine OpStor :: Help Documentation
Zoho Corporation Pvt. Ltd.
25
Auto Refresh
Auto refresh option allows user to view latest inventory and alarm information from database without having to manually refresh web pages. Auto refresh link is available on the top-right corner of the each opstor web page. Clicking on the link, pops up a window showing Auto Refresh options. Users can specify the refresh time period directly. After specifying the refresh period, click 'Save' to save the changes. This information will be persisted in database for the user who configured refresh option. Whenever user logsin, auto refresh, will be enabled. To disable auto refresh, provide -1 as the interval.
ManageEngine OpStor :: Help Documentation
Zoho Corporation Pvt. Ltd.
26
Discovering Storage Devices
The topics covered under this section are:
• Autodiscovery • Prerequisites For Device Discovery • Adding A Device • Adding Device Details

ManageEngine OpStor :: Help Documentation
Zoho Corporation Pvt. Ltd.
27
Auto Discovery
OpStor scans the storage network and automatically discovers Fibre Channel Switches, RAIDs, Tape Libraries, and HBAs, when the server is started. OpStor discovery is primarily Out-of-band using SNMP. OpStor, when it discovers Fibre Channel Switches, also discovers its immediate neighbourhood i.e. connected devices. This is termed as discovery-via-switch. OpStor discovery runs variety of vendor specific algorithms to completely model the discovered device. Modelling includes identifying sub components, logical interconnections and also gathering asset information. For example, when a RAID is identified, the RAID controllers in the RAID, and the ports in the controller are also discovered. Thus a complete inventory of all the storage devices and its sub-components is discovered and maintained. OpStor also provides SNMP agents for popular HBAs based on SNIA HBA API. Using these HBA agents, In-band discovery is enabled. However, agents are not packaged along with the product. You need to download these OpStor HBA agents separately. .
ManageEngine OpStor :: Help Documentation
Zoho Corporation Pvt. Ltd.
28
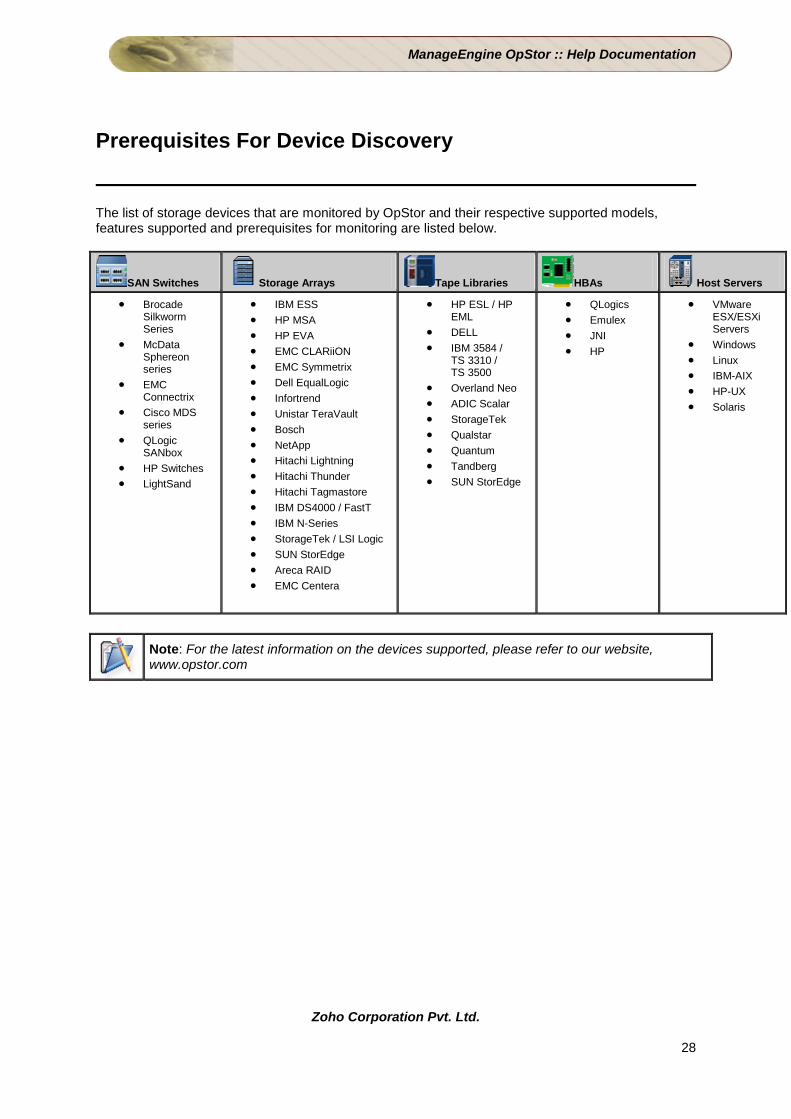
Prerequisites For Device Discovery
The list of storage devices that are monitored by OpStor and their respective supported models, features supported and prerequisites for monitoring are listed below.
SAN Switches Storage Arrays Tape Libraries HBAs Host Servers
• Brocade Silkworm Series
• McData Sphereon series
• EMC Connectrix
• Cisco MDS series
• QLogic SANbox
• HP Switches • LightSand
• IBM ESS • HP MSA • HP EVA • EMC CLARiiON • EMC Symmetrix • Dell EqualLogic • Infortrend • Unistar TeraVault • Bosch • NetApp • Hitachi Lightning • Hitachi Thunder • Hitachi Tagmastore • IBM DS4000 / FastT • IBM N-Series • StorageTek / LSI Logic • SUN StorEdge • Areca RAID • EMC Centera
• HP ESL / HP EML
• DELL • IBM 3584 /
TS 3310 / TS 3500
• Overland Neo • ADIC Scalar • StorageTek • Qualstar • Quantum • Tandberg • SUN StorEdge
• QLogics • Emulex • JNI • HP
• VMware ESX/ESXi Servers
• Windows • Linux • IBM-AIX • HP-UX • Solaris
Note: For the latest information on the devices supported, please refer to our website, www.opstor.com
ManageEngine OpStor :: Help Documentation
Zoho Corporation Pvt. Ltd.
29
Adding a Device
After the initial discovery, you can use 'Add Device' option under Admin Tab --> Discovery, to add a new device.
Note : Only ‘Admin’ users can add device(s).
Steps for adding a Device :
1.
• Click the ‘Admin’ tab in the OpStor client. • Select ‘Discovery tab'. (by default, Discovery Tab will be selected) • Enter the IP address of the new device. • Choose the Device Type whether it is a Raid, FC Switch, Tape Library or a Host • Depending on the Device Type selected, other required fields given below appear.
o Choose Vendor : Displays the Vendor list o Choose Model : Displays all the supported device models for the selected vendor. o Provider : This is a non editable field, where the Management Interface used for
fetching the data from the device is displayed o Depending on the provider the other options like Username, Password, Port, SSL,
Community, Namespace and Timeout will be displayed.
• The option for 'Ping the given IP' can either be checked or unchecked depending on the ping facility available for the device.
• Click 'Add Device' button.
Note : You can select the parameter Unknown/Others for the fields, if you are not sure of the option.
The device is added and a confirmation message is shown. Table below shows the discovered device. You can click on the device link to navigate to device properties page. In case of non discovery of the device, you can follow the troubleshooting tips displayed in the webclient and try readding the device.

ManageEngine OpStor :: Help Documentation
Zoho Corporation Pvt. Ltd.
30
Editing Device Details
Clicking on any device name link takes you to the device details page. The device properties are classified under various heads namely Device Info, Product Info, Tech Support Info, WWN info, Zoning info, etc. These groups are shown as links in the Right Hand Side of the device details page. Clicking on a link shows the properties under that heading. You can edit a few details like 'Device Location', 'Tech support info', etc. To edit the device details
1. Click ‘Edit’ link at the top-right corner of a property group. 2. The editable values are shown in textboxes. 3. You can change the required values and click ‘Submit’ to save the entries in the database.
Note : Only ‘Admin’ users can edit device details.

ManageEngine OpStor :: Help Documentation
Zoho Corporation Pvt. Ltd.
31
Visualization
The topological map shows a graphical representation of devices and their interconnections in the network. The table shows the link details (source and destination devices).
• Sub maps: Click on any device icon to see the device map (sub map). It shows sub components of the device and the connections to other devices. Details of links in this map are listed in a table below.
• Device details link: Call-out beside each device links to the corresponding device details page.
The topics covered under this section are :
• Map View
• Map Icons
• Drilling Down the Map

ManageEngine OpStor :: Help Documentation
Zoho Corporation Pvt. Ltd.
32
Map View
Clicking the ‘Map’ tab shows the topological map of the discovered SAN devices. The map shows the device icons and the interconnections in the form of links. Map legends are shown in LHS panel. Map can be seen in Grid, Circle, Tree, or Radial Tree layouts. Link details are shown in a table below the map. The links table shows the link name, source device, and destination device. Clicking on the source or destination link takes you to the corresponding device details page.

ManageEngine OpStor :: Help Documentation
Zoho Corporation Pvt. Ltd.
33
Map Icons
Each device in the map is represented by a map icon corresponding to the particular device type. The name of the device appears at the bottom of the icon. A colored circle (with an arrow inside), beside the device icon, represents the status of the device. Red for critical, orange for major, yellow for minor, blue for warning, and green for clear.

ManageEngine OpStor :: Help Documentation
Zoho Corporation Pvt. Ltd.
34
Drilling Down The Map
The map icons and the call-outs are click-able.
• To see the sub-map of a particular device, click the map icon. To see the port details, click the port in the sub-map.
• To go to the device details, click the call-out near the particular device.
ManageEngine OpStor :: Help Documentation
Zoho Corporation Pvt. Ltd.
35
Fault Monitoring and Escalation The traps and other notifications from the devices are received by the software and are converted into events and alarms. Depending of the criticality of the fault condition, each event and alarm is assigned a severity ranging from critical to clear. Each severity is given a specific color for easy visual identification. OpStor actively monitors the faulty events and reports or escalates the faults to the user, administrator, or any other person via email or SMS. Alarms Tab Alarms from the devices and its sub components are listed in the Alarms tab. The alarms table shows alarm source, severity, last changed time, and message.
• Tables: Clicking on the ‘Message’ takes you to the alarm details page that lists the events that affected the alarm and alarm notes (annotations and action logs)
• Operations: You can perform some operations on the alarms as part of management. Acknowledge / unacknowledge to assign owner to an alarm. Clear or delete an alarm based on requirements. Annotate a text to the alarm that can be referred later.
The topics covered under this section are :
• Viewing Alarms
• Viewing Alarm Details
• Email Alarm Report
• Alarm Operations
• Scheduling Alarm Actions
• Escalate Unattended Alarms
ManageEngine OpStor :: Help Documentation
Zoho Corporation Pvt. Ltd.
36
Viewing Alarms
You can view all the alarms in a single console under ‘Alarms’ tab. This tab displays all the alarms with their source, status, date & time, and message. It shows a maximum of 5 alarms and the others are listed when you click the next link present on top of the table heading. Each column heading is a link, which when clicked sorts the alarms based on that column. You can go to the device details page or the alarm details page with a single click. To see the details of the device that caused an alarm, click on the source link of the alarm. To see the details of the alarm, click the message of the alarm. Just above the table on the top right corner there are options to acknowledge, clear, or delete alarms. To do any of these operations, select the specific alarms (by checking the checkbox), and clicking on the corresponding link. These options are also available for individual alarms in the alarm details page. It is advisable to do these operations from the details page. You can even view the alarms depending on the criteria like Severity, Category or alarms generated between a specific time period. For this, you can choose the relevant options present under the heading 'Choose Criteria' and click on 'Show' button. If needed, you can export the same to html, pdf, excel sheet and csv formats.
ManageEngine OpStor :: Help Documentation
Zoho Corporation Pvt. Ltd.
37
Viewing Alarm Details
Clicking on the message link in an alarm brings you to the alarm details page. Alarm details page shows :
• Source - the device from which the alarm was generated.
• Entity - the parameter in the device that has faulted.
• Status - criticality of the fault (alarm).
• Last updated - the time when the last event, which affected the alarm, occurred.
• Message - description of the alarm.
• Owner name - the user who acknowledged the alarm.
• Alarm history - list of events (from the same entity) that affected the alarm.
• Alarm notes - annotations and logs are recorded here for reference.
To see details of the device that caused the alarm, click on the source link. Just above the table there are options to acknowledge, clear, delete, and annotate alarms.
• To take ownership of the alarm, click 'Acknowledge'.
• To change the severity of the alarm to clear, click 'Clear'. This is done after the fault condition is physically fixed.
• To delete the alarm from the records, click 'Delete'. This is done when the device is replaced or restarted.
• To add some comments to the alarm, click 'Annotate' and type the content in the textbox. This helps in future reference, to understand the fault condition.
ManageEngine OpStor :: Help Documentation
Zoho Corporation Pvt. Ltd.
38
Email Alarm Reports
You can configure OpStor to send reports on, daily and weekly alarms in your network. You can get reports on only, the critical alarms and/or all alarms. These reports help in understanding what happened in the network in the day or week. You can configure the time at which, these reports needs to be sent. To configure weekly critical alarms' report :
• In the web client, go to 'Admin' tab --> 'Alarm Reporting' tab --> 'Email Alarm Reports' option • Check the option "Send weekly critical alarm report to" in the page • Edit the Subject field, if needed • Enter the email ids to which the weekly critical alarms list must be sent. • Click 'Submit'
The weekly critical alarms report is sent on every Monday at the specified time. To configure weekly all alarms' report :
• In the web client, go to 'Admin' tab --> 'Alarm' Reporting --> 'Email Alarm Reports' option • Check the option "Send weekly all alarm report to" in the page • Edit the Subject field, if needed • Enter the email ids to which the weekly all alarms list must be sent. • Click 'Submit' •
The weekly all alarms report is sent on every Monday at the specified time. To configure daily critical alarms' report :
• In the web client, go to 'Admin' tab --> 'Alarm Reporting' tab --> 'Email Alarm Reports' option • Check the option "Send daily critical alarm report to" in the page • Edit the Subject field, if needed • Enter the email ids to which the daily critical alarms list must be sent. • Click 'Submit' •
The daily critical alarms report is sent everyday at the specified time. To configure daily all alarms' report :
• In the web client, go to 'Admin' tab --> 'Alarm Reporting' tab --> 'Email Alarm Reports' option • Check the option "Send daily all alarm report to" in the page • Edit the Subject field, if needed • Enter the email ids to which the daily all alarms list must be sent. • Click 'Submit'
The daily all alarms report is sent everyday at the specified time.
ManageEngine OpStor :: Help Documentation
Zoho Corporation Pvt. Ltd.
39
Alarm Operations
• Acknowledging Alarms
• Annotating Alarms
• Clearing Alarms
• Deleting Alarms
Acknowledging Alarms : OpStor provides an option for the users to pick and own alarms that they work on. This helps in avoiding multiple users working on a single alarm. Alarms can be acknowledged in two ways.
1. In the 'Alarms' tab, select the checkbox before the specific alarm and click ‘Acknowledge’. This option is available only for admin users.
2. In the alarm details page click ‘Acknowledge’.
By doing one of the two actions above, the user becomes the owner of the particular alarm. To unacknowledge an alarm, click ‘Unacknowledge’ in the specific alarm details page. The alarm ownership gets removed. Annotating Alarms : In case of a user wants to add more details on a particular alarm, he can annotate the same in the alarm. This will be useful for later reference. To annotate an alarm, click ‘annotate’ link in the specific alarm details page and add the content in the text-box. The annotation will get added in the alarm notes table. Clearing alarms : After fixing the fault condition in the device, the particular alarm can be cleared by the user, so that its status becomes clear. To clear an alarm, click ‘Clear’ link in the specific alarm details page. The severity of the alarm will change to clear. Deleting alarms : After fixing the fault condition in the device, the particular alarm can be deleted by the user, if he feels that the record need not be maintained. To delete an alarm, click ‘Delete’ link in the specific alarm details page. The alarm and its related events will get deleted permanently.
ManageEngine OpStor :: Help Documentation
Zoho Corporation Pvt. Ltd.
40
Schedule Alarm Actions
You might want to get an email or perform some action when a particular type of alarm is generated. In such a condition, you can configure an alarm action. This is checked whenever an alarm is generated or modified, and if the condition matched, an email is sent.
Note : You need to configure the mail server before adding an alarm action.
To schedule a new alarm action :
• In webclient go to Admin tab --> Alarm Reporting tab --> Schedule Alarm Actions
• Enter an action name.
• Set the conditions o Select the device type (RAID, Host, TapeLibrary, etc. or any) o Select the notification severity (Critical, major, minor, warning, or any) o Select the devices and move it to the RHS box
• Select 'Send E-mail or SMS' and/or 'Run Program' based on your requirements
• If you select ‘Send E-mail or SMS’, enter the from address, to address, subject, and message for the email / SMS to be sent.
• If you select ‘Run Program’, enter the command to execute and select the options below if required.
• Click ‘Add Action’.
To enable / disable an alarm action :
• Click on the green icon against the particular action name in the view or actions table. To view / modify an alarm action :
• Click the name link of the action that needs modification.
• The selected values will be shown in the form below.
• You can change the required values and click ‘Modify Action’.
To delete an alarm action :
• Click the trash-can icon against the particular action, in the actions table.
ManageEngine OpStor :: Help Documentation
Zoho Corporation Pvt. Ltd.
41
Escalate Unattended Alarms
When some alarms are not attended for a particular time-period, it needs to be escalated to the administrator or the IT manager (based on need). For example, you get a critical alarm for a tape library and the fault condition is not resolved within 6 hours, it might cause a major problem in the operation of the storage infrastructure. Such alarms can be escalated and quick action can be taken to avoid any major problem.
Note : You need to configure the mail server before adding an alarm escalation.
To add an alarm escalation rule :
• From web client go to 'Admin’ tab --> 'Alarm Reporting' tab --> 'Escalate Unattended Alarms' option.
• Enter a name for the new rule. • Set the conditions
o Select the severity (Critical, Major, Warning, Minor, or Any). o Select the device category (RAID, TapeLibrary, etc. or Any). o Enter the period in hours or minutes. i.e., if the alarm matching the above two
condition is unaffected for the specified time period, the rule will be executed. • Enter from address, to address, subject, and message of the mail to be sent, for escalation. • Enter the time duration in which the above rule has to be checked. • Click ‘Add Rule’.
The rule gets added in the table in the page. You can disable the rule by clicking on the green icon corresponding to the rule. To modify an alarm escalation rule :
• Click the name link of the rule that needs to be modified. • The configured values are shown in the form below. • You can edit the required values and click ‘Modify Rule’ •
To delete an alarm escalation rule :
• Click the trash-can icon against the particular rule, in the escalation rules table.
ManageEngine OpStor :: Help Documentation
Zoho Corporation Pvt. Ltd.
42
Reports
OpStor regularly gathers the performance data of monitored storage devices and generates Capacity, Availability and Performance reports. In OpStor client, reports are available under the 'Reports' tab. Topics covered under this section are :
• Summary Reports : These reports show the latest inventory or capacity summary information for the Storage Devices.
• Capacity Reports : These reports fetch the latest capacity information for the Storage devices.
• Availability Reports : These reports fetch the latest availability information for the Storage devices.
• Performance Reports : These reports fetch the latest performance information for the Storage devices.
• Forecasting Reports : These reports predict the future trends of the usage in terms of traffic and Storage capacity.
• Scheduling Reports : You can configure OpStor to send scheduled reports on Alarms, Storage Capacity, Availability and Performance.
ManageEngine OpStor :: Help Documentation
Zoho Corporation Pvt. Ltd.
43
Summary Reports
These reports show the latest inventory or capacity summary information for all the Storage devices discovered, depending on device category . To fetch the Summary reports :
• In webclient, go to 'Reports' Tab --> 'Summary Reports' tab
Here you can view the consolidated reports shown category wise. You can even export this report to HTML, PDF, EXCEL sheet and CVS formats.

ManageEngine OpStor :: Help Documentation
Zoho Corporation Pvt. Ltd.
44
Capacity Reports
These reports fetch the latest capacity information for the Storage devices and generates a report depending on your requirement. To plot the Capacity reports :
• In webclient, go to 'Reports' Tab --> 'Capacity Reports' tab • Choose the Device Name • Select the Time Period • Incase you want to generate the report for a specific time, select 'custom' in the Time Period
field and fill the From and To fields. • Click on Show Report.
You can even export this report to HTML, PDF, EXCEL sheet and CVS formats.
ManageEngine OpStor :: Help Documentation
Zoho Corporation Pvt. Ltd.
45
Availability Reports
Availability reports are generated based on calculated uptime of each device or its subcomponents. Users can see the uptime in bargraph % and total downtime in Hours-Minutes along with Mean Time To Repair [MTTR] and Mean Time Between Failure [MTBF] for top n devices in the tabular form. By default, table is sorted on descending order of uptime for FcSwitches. To view the details of each device, click on the device name link. To plot the Availability Reports :
• In webclient, go to 'Reports' tab --> 'Availability Reports' tab • Select the Device Type for which you want the report • Select the Criteria. • Choose the Top/Bottom n devices you want to view. • Select the Time Period • Incase you want to generate the report for a specific time, select 'custom' in the Time Period
field and fill the 'From' and 'To' fields. • Click on Show Report.
You can even export this report to HTML, PDF, EXCEL sheet and CVS formats.
ManageEngine OpStor :: Help Documentation
Zoho Corporation Pvt. Ltd.
46
Performance Reports
These reports fetch the latest performance information for the Storage devices and generates a report depending on your requirement. To plot the Performance Reports :
• In webclient, go to 'Reports' Tab --> 'Performance Reports' tab • Click on the performance icon available against each device name. This takes you to the
Performance Statistical Reports page. • Choose the Report Type • Select the Characteristics for which you want to generate report. • Select the Time Period • Incase you want to generate the report for a specific time, select 'custom' in the Time Period
field and fill the From and To fields. • Click on Show Report.
You can even export this report to HTML, PDF, EXCEL sheet and CVS formats. To plot the Performance Comparison Reports :
• In the webclient, go to 'Reports' Tab --> 'Performance Reports' tab • Click on the Comparison icon available against each device name. This takes you to the
Performance Comparison Reports page. • Choose the devices to be compared. • Choose the Reports Type. • Dependig on the Reports Type selected, other fields appear. • Select the appropriate Characteristics to be compared • Select the Time Period • Incase you want to generate the report for a specific time, select 'custom' in the Time Period
field and fill the From and To fields. • Click on Show Reports
You can even export this report to HTML, PDF, EXCEL sheet and CVS formats.
ManageEngine OpStor :: Help Documentation
Zoho Corporation Pvt. Ltd.
47
Forecasting Reports
Storage Forecasting is the estimation of the amount of storage that will be needed by the organization over some future period of time. These reports can even be referred as Trend Analysis Reports. To generate the Forecasting Report for Storage Capacity:
• In webclient, go to 'Reports' Tab --> 'Capacity Reports' tab • Choose the Device Name • Select the Time Period • Click on Show Report. • The report will be generated. • Below the generated report, you will have a 'Forecast' button • Click on the button to view the trend report
You can even export this report to HTML, PDF, EXCEL sheet and CVS formats. To generate the Forecasting Report for performance parameters :
• In webclient, go to 'Reports' Tab --> 'Performance Reports' tab • Click on the performance icon available against each device name. This takes you to the
Performance Statistical Reports page. • Choose the Report Type • Select the Characteristics for which you want to generate report. • Select the Time Period • Incase you want to generate the report for a specific time, select 'custom' in the Time Period
field and fill the From and To fields. • Click on Show Report. • Below the generated report, you will have a 'Forecast' button • Click on the button to view the trend report
You can even export this report to HTML, PDF, EXCEL sheet and CVS formats.
ManageEngine OpStor :: Help Documentation
Zoho Corporation Pvt. Ltd.
48
Scheduling Reports
You can configure OpStor to send scheduled reports on Alarms, Storage Capacity, Availability or Performance to your mail box Steps for scheduling Reports :
• Click on the Schedule Reports icon present in the window. • Provide the Schedule Name • Select the Schedule Duration and Schedule Time • Select the File Format in which you want to receive the report i.e., in PDF, CSV or EXCEL
format • Provide the From and To email addresses. • Provide the Subject and Mail content. • Click on Schedule button.
You would receive a message "Scheduler created successfully" and the Report Scheduler is created. To enable, disable or delete the Report Schedulers, go through the Manage Report Schedulers section.

ManageEngine OpStor :: Help Documentation
Zoho Corporation Pvt. Ltd.
49
Graphs
OpStor provides an option to troubleshoot devices, by watching live data collected from the device ports. The data collected is SNMP based and does not interrupt the regular functioning of the devices. All the switch ports that are connected to other storage devices are listed here. This section describes how to plot real time graphs.

ManageEngine OpStor :: Help Documentation
Zoho Corporation Pvt. Ltd.
50
Plotting Graphs
To plot the real time graphs :
• Go to 'Device Info' page of the switch.
• Under 'Switch Ports', you can find the 'Live Monitor' icon beside each of the port that is connected to other device.
• Click on the Live Monitor icon. The variables for which you can collect data are shown.
• Select the variables for which you want to collect data and plot the graph. For selecting all the variables, you can choose Select All check box present below the variables.
• Set the polling interval, i.e. time interval between two consecutive polls.
• Set the page refresh interval, i.e. time interval between two consecutive page refresh.
• Set the poll duration, i.e. the maximum time for which the data collection must happen. Maximum time is 60 minutes.
• Click 'Start' to start the plotting. The graphs appear in a new window which will automatically refresh in the specified time interval.
• Click 'Stop' to stop the plotting. If needed, you can even export this report to pdf format by clicking on the 'Export as PDF' link present in the top-right corner of the screen
Note : Real time graphs can be plotted only for FC switch ports.

ManageEngine OpStor :: Help Documentation
Zoho Corporation Pvt. Ltd.
51
Configuration
OpStor provides options to launch the WebApp (Web Application / Device Management System) and/or Telnet session, to connect to the devices, for device configuration. In addition, OpStor also packages MIB Browser application to carry out SNMP based configurations.
ManageEngine OpStor :: Help Documentation
Zoho Corporation Pvt. Ltd.
52
Launching WebApp
Most of the storage devices such as tape libraries and RAIDs have their own web-based Device Management System (DMS) bundled in the box. OpStor identifies DMS applications running in the devices and marks application URLs against the devices in the GUI. Thus OpStor provides a single point of access whereby you can launch DMS / Web application with a single click, from the OpStor client. To launch a Web Application :
• Connect to OpStor client
• In the Home page, click on the device for which you want to launch web application. This will open device specific inventory page
• On the right hand side menu under the 'Actions', you will find 'Launch WebApp' link. If device does not support web app, link will not be present.
• Click 'Launch WebApp' . The Web Application / DMS will be opened in a new window/browser.
• Make the required configuration changes
• Close the browser to exit the configuration This option is available only for 'Admin' users.
ManageEngine OpStor :: Help Documentation
Zoho Corporation Pvt. Ltd.
53
Telnet
Storage devices support Telnet for menu based configurations. OpStor provides an option to launch a remote Telnet session with the device from within the OpStor client. To launch a Telnet :
• Click the device name link from the "Home" tab. The device properties page is shown • Click 'Telnet' link under 'Actions' in the RHS of the screen • Enter a valid username and password. • Default telnet port number and prompts are shown. Change them if necessary • Click 'Connect'. New Telnet page is launched. • Type the commands to query and/or to make configurations (press 'Enter' after typing in the
command) • To close Telnet page, type device telnet termination command (say 'exit') and press 'Enter' • Close the telnet browser window
Note : Do not close Telnet browser window without terminating the Telnet session.
ManageEngine OpStor :: Help Documentation
Zoho Corporation Pvt. Ltd.
54
SNMP
To facilitate configuration in SNMP enabled devices, OpStor packages the MIB Browser along with the product. You can load the device MIB files in the MIB Browser and configure SNMP parameters in the devices. To launch MIB Browser : In Windows:
• Go to <OpStor Home>\bin directory • Run MibBrowser.bat
In Linux:
• Go to <OpStor Home>/bin directory • Execute MibBrowser.sh
ManageEngine OpStor :: Help Documentation
Zoho Corporation Pvt. Ltd.
55
OpStor Administration
OpStor administration provides options to configure the users, devices, database, alarm actions and escalations, from the Admin tab in the client GUI. This tab is shown only to 'admin' users and hidden for normal users. The admin options are :
• Discovery o Manage Storage Devices: To add a new device that is not already discovered and to
delete devices from the list.
• Alarm Reporting o Schedule Alarm Actions: To run a program or send email/SMS, when a particular
type of alarm occurs in the system. You can add multiple rules to capture different sets of alarms.
o Escalate Unattended Alarms: To configure OpStor to send email/SMS when an alarm is not resolved within a specified time. This helps in escalating important alarms that are not resolved in time. You can add multiple rules to escalate different sets of alarms to different people with different messages.
o Email Alarm Reports: To send daily or weekly alarm reports to administrators. o Manage Report Schedulers: To Enable/Disable or Delete any report scheduler.
• Global Settings o Manage OpStor Users: To add, modify, or delete users and their privileges with this
option. o Configure Performance Polling: To manage the performance pollers and to generate
threshold events. o Clear Old Data: To specify the time for which data (related to alarms, events, and
performance) needs to be maintained in the database. o Configure Mail Server: To configure the mail server settings that will be used to send
an email. o Configure Threshold Rules: To configure the threshold limits for different parameters
for the storage devices, at which OpStor should raise an alarm.
ManageEngine OpStor :: Help Documentation
Zoho Corporation Pvt. Ltd.
56
Manage Storage Devices
OpStor provides options to add new devices or delete devices that are already discovered. It also provides the option to modify the device credentials(access details) post discovery. To add devices, refer to 'Adding a device' page under 'Discovering Storage Devices' section. To delete a device :
• In webclient, go to 'Admin' tab --> 'Discovery' tab • Click the delete icon (trash can) against the particular device, in the table below the 'Add
Device(s)' form. • Click OK in the confirmation dialog. • A message confirming the deletion is displayed and the device disappears from the table.
When you delete a device, all its sub-components (such as ports), its alarms, and its events are also deleted permanently from the database. Editing / Modifying the device credentials : Using this option, you can change/edit the existing device access details in OpStor. Suppose a device is added in OpStor and during its scheduled maintenance the password is changed. Since the device access details are changed, OpStor would not be able to collect the status or performance information. In this case, you can use the 'Edit' option and edit/modify the password in OpStor, so that it would be able to collect the information from the device. To modify the device credentials :
• In webclient, go to 'Admin' tab --> 'Discovery' tab. • Click the 'Edit' icon against the particular device, in the table below the 'Add Device(s)'
form. • Overwrite the old values with the new credentials to be used for accessing the device. • Click on 'Submit' to save the credentials.

ManageEngine OpStor :: Help Documentation
Zoho Corporation Pvt. Ltd.
57
Schedule Alarm Actions
Refer 'Schedule Alarm Actions' page under 'Fault Monitoring And Escalation' section.

ManageEngine OpStor :: Help Documentation
Zoho Corporation Pvt. Ltd.
58
Escalate Unattended Alarms
Refer 'Escalate Unattended Alarms' page under 'Fault Monitoring And Escalation' section.

ManageEngine OpStor :: Help Documentation
Zoho Corporation Pvt. Ltd.
59
Email Alarm Reports
Refer 'Email Alarm Reports' page under 'Fault Monitoring And Escalation' section.
ManageEngine OpStor :: Help Documentation
Zoho Corporation Pvt. Ltd.
60
Manage Report Schedulers
This option is used for either Enabling/Disabling or Deleting the existing Report Schedulers. For this, navigate to 'Admin' Tab --> 'Alarm Reporting' tab --> 'Manage Report Schedulers' option To enable / disable a scheduler :
• Click on the green/grey icon against the particular scheduler name in the schedulers table.
o Green - Enabled o Grey - Disabled
To delete a scheduler :
• Click the trash-can icon against the particular scheduler name in the schedulers table.
Note : For information on how to schedule Reports go through the Scheduling Reports section.
ManageEngine OpStor :: Help Documentation
Zoho Corporation Pvt. Ltd.
61
Manage OpStor Users
OpStor supports two levels of user authentication namely Admin and user. The Admin get all the privileges while the user is restricted from admin functions such as the options in this section and other device configuration options. You can add, delete, change password, or change privilege for a user. To add a new user :
• Select 'Admin' tab.
• Click 'Manage OpStor Users' under 'Global Settings' tab.
• In the 'Add User' form, specify the new user name, password, and select the type of privilege (Admin or User).
• Click 'Add User' button.
• A message confirming the addition is shown and the user name is listed in the table above.
To delete a user :
• Select 'Admin' tab.
• Click 'Manage OpStor Users' under 'Global Settings' tab.
• Click the delete icon (trash can) against the particular user.
• A message confirming the user deletion is shown and the user name is deleted from the table.
To change the password for a user :
• Select 'Admin' tab.
• Click 'Manage OpStor Users' under 'Global Settings' tab.
• Click on the 'User name' for whom you need to change the password.
• Enter the new password and confirm the same.
• Click 'Modify User'
• A message confirms the change in password. To change the privilege for a user (from user to admin or vice versa) :
• Select 'Admin' tab.
• Click 'Manage OpStor Users' under 'Global Settings' tab.
• Click on the 'User name' for whom you need to change the privilege.

ManageEngine OpStor :: Help Documentation
Zoho Corporation Pvt. Ltd.
62
• Select the other option in the 'Group'
• Click 'Modify User'
• A message confirms the change in user privilege.

ManageEngine OpStor :: Help Documentation
Zoho Corporation Pvt. Ltd.
63
Clear Old Data
OpStor provides an option to delete old data from the database. This makes sure that the database does not grow out of limit. To delete old events :
• Select 'Admin' tab.
• Click 'Clear Old Data' under 'Global Settings' tab.
• Under 'Events Database', specify the number of days after which the events can be deleted.
• Click 'Submit'.
To delete old performance data :
• Select 'Admin' tab.
• Click 'Clear Old Data' under 'Global Settings' tab.
• Under 'Performance Database', specify the number of days after which the daily and weekly statistics data can be deleted.
• Click 'Submit'.
ManageEngine OpStor :: Help Documentation
Zoho Corporation Pvt. Ltd.
64
Configure Mail Server
The mail server is used for sending mails to IT personnel as part of alarm action or escalation. The configurations are centrally maintained here. To configure/modify the mail server :
• Select 'Admin' tab.
• Click 'Configure Mail Server' under 'Global Settings' tab.
• Enter the mail server name, port, user name and password for sending the mail.
• Click Save/Modify button.
Note : To test the mail server configuration, click on 'Test' button.
ManageEngine OpStor :: Help Documentation
Zoho Corporation Pvt. Ltd.
65
Configure Threshold Rules
You might want to get alerted whenever the device usage reaches/exceeds the threshold limit. In such a condition, you can create an Threshold rule. To create a Threshold Rule :
• In webclient go to 'Admin' tab --> 'Global Settings' tab --> 'Configure Threshold Rules' option • Provide the Threshold Name • Select the Threshold Type • Specify the Threshold Value • Specify the Rearm Value • Select the Threshold Severity(this severity will be assigned to the generated alert). • Incase you want to receive a clear alarm tick mark the 'Send Clear Alarm' check box. • Provide the Threshold Message and Clear Message. • Click on 'Add Profile' button.
Note: Threshold Value - The value to be compared with the current usage and if exceeded generates alarm Rearm Value - The value at which clear alarm will be generated
To apply the Threshold Rule :
• From the Threshold Rule table, click on the 'Apply' link present for the Threshold Rule • A pop-up box appears • Select the Polling Attribute • Select the corresponding Polled Data Characteristics • Click on Apply.
This Threshold Rule is applied to the selected Polled Data Characteristics of the selected Polling Attribute. To view / modify a Threshold Rule :
1. Click the name link of the Rule that needs modification. 2. The selected values will be shown in the form below. 3. You can change the required values and click ‘Modify Profile’.
Note: For information on configuring the Threshold Events, go through the Configure Performance Polling section.
To Delete a Threshold Rule :
• Click the trash-can icon against the particular action, in the actions table.
ManageEngine OpStor :: Help Documentation
Zoho Corporation Pvt. Ltd.
66
Configure Performance Polling
This option is used for Managing the performance pollers and to generate threshold events. In this page you can find the available Pollers for an device. To view the available pollers :
• In webclient, go to 'Admin' tab --> 'Global Settings' tab --> 'Configure Performance Polling' option
• Choose the Device Type
• Available Devices for the selected Device Type are listed
• Choose any device
• Available Pollers for the selected device are listed along with the Applied Threshold Rules, if any.
For Configuring the Performance Pollers :
• Click on the Poller name. This will take you to the 'Edit Poller' page.
• Change the Polling Interval
• Click on Modify button.
For Configuring the Threshold Events : • Click on the Poller name. This will take you to the Edit Poller page.
• Change the 'Failure Threshold' value. (Depending on the value present in this field, OpStor will generate the alert. For example, if the value present is 2, OpStor will check for two consecutive status polls for Threshold value to be exceeded and then generate the alert).
• Incase there is no Threshold Rule associated to the Poller, you can select it from the list of rules present under 'Associate Threshold'.
• Click on Modify button.
Note : For information on creating the Threshold Rules, go through the Configure Threshold Rules section.
ManageEngine OpStor :: Help Documentation
Zoho Corporation Pvt. Ltd.
67
Registering the License
OpStor has a file based license system. You must get a registered license file to register your copy of OpStor. When you want to move from evaluation to registered license, you must follow the steps below to apply OpStor Registered License. Before the expiry of your trial / evaluation license
• Start OpStor server by executing StartOpStorServer.sh/bat present in <OpStor Home>/bin directory.
• Connect OpStor Web Client at appropriate port. For instance, if the web server port is 9010, you need to connect as http://<hostname>:9010 and login into the client
• Click the "Register" link present in the top right corner of the client
• Browse and pick the registered license file
• Click "Register"
• The license is applied
• To check the license details, click the "About" link in the right corner of the client to see the licensing details
After the expiry of the trial / evaluation license
• Start OpStor server by executing StartOpStorServer.sh/bat present in <OpStor Home>/bin directory
• Click "OK" in 'Trial period expired' dialog
• Browse through the registered license you have and click "Next"
• Click "Finish"
• The License file is applied
• You can start the server and see the license details by clicking the "About" link in the right corner of the client
ManageEngine OpStor :: Help Documentation
Zoho Corporation Pvt. Ltd.
68
FAQ
1. What is a device in terms of OpStor? 2. Can I configure the port in which OpStor server starts? 3. If port 80 (or the user specified port) is used by other application. Will the OpStor server start? 4. I have a supported device in my environment. It is not showing up in client. What is the problem? 5. How does OpStor collect data? 6. How is data stored in OpStor? 7. Does OpStor server listen for SNMP Traps? 8. Does OpStor have the capability of forwarding the SNMP Traps to a specific host?
Note : For more FAQ's, please refer to our website, www.opstor.com
1. What is a device in terms of OpStor? A device, in OpStor terms, is a Fabric Switch or a Storage Array or a Tape Library or a Host Server including the HBAs. For example, if you have 2 Brocade Switches, 3 HP EVA arrays(along with Controllers), 2 IBM Tape Libraries and 6 Windows / Linux / ESX servers(with irrespective of number of HBAs installed in it), then your total device count is 13.
2. Can I configure the port in which OpStor server starts? Yes. During installation, OpStor prompts the user to specify a port in which the server must start. By default it shows 80. If you want to change the port, you can specify a different port number and proceed with the installation. If you want to change the port after installation, please follow the procedure given below :
• Open a command prompt and navigate to <OpStor Home>\bin • Now execute the batch file as follows
ChangeWebServerPort.bat <port number> (In Windows) sh ChangeWebServerPort.sh <port number> (In Linux) Example : ChangeWebServerPort.bat 9070 sh ChangeWebServerPort.bat 9070
• Now start the OpStor server and it would be starting at the port 9070.
3. If port 80 (or the port that I specified) is used by other application, will the OpStor server start? No, when ever the specified port is used by other application, OpStor server fails with the following message : OpStor as a Standalone Application :
ManageEngine OpStor :: Help Documentation
Zoho Corporation Pvt. Ltd.
69
"Failed to establish connection with web server, Gracefully shutting down Web NMS Trying to Shutdown OpStor Server" OpStor as a Service : A message box appears.. "Could not start the ManageEngine OpStor service on Local Computer. Error 1068: The dependency service or group failed to start." In this case you need to either free the corresponding port or configure OpStor server to start in another port.(For the procedure refer FAQ 1)
4. I have a supported device in my environment. It is not showing up in client. What is the problem? OpStor is by default configured to discover supported devices on their default port and community. SNMP enabled devices, default port is 161 and the community is 'public'. Check if your device SNMP agent runs on different port or the community string is other than 'public'. Re-configure device discovery via Admin UI.
5. How does OpStor collect data? OpStor uses different Management Interfaces like SMI-S Provider, SNMP MIB and CLI for monitoring the devices and for collecting the data.
6. How is data stored in OpStor? Data is stored in PostgreSQL database that is installed as part of OpStor Server.
7. Does OpStor server listen for SNMP Traps? Yes. OpStor server receives SNMP Traps on Port 162. Ensure that OpStor is configured as manager for your device SNMP agents. Refer Prerequisites For Device Discovery under 'Discovering Storage Devices' section for more information.
8. Does OpStor have the capability of forwarding the SNMP traps to a specific host? Yes. OpStor does have the capability of forwarding the SNMP traps to a specific host. This is configurable. Steps for configuring :
• Shutdown OpStor server, if it is running • Go to <OpStor_Home>\conf directory • Open the file trap.forwarder and make the corresponding entries as follows
<TRAP_REDIRECTION Dest_Addr="192.168.1.49" Dest_Port="162"/>

ManageEngine OpStor :: Help Documentation
Zoho Corporation Pvt. Ltd.
70
Where <192.168.1.49> is the address to which the trap has to be forwarded. <162> is the Port to which trap has to be forwarded.
Note : Uncomment the above lines(in step 3) of code in the file.
If you want to forward the traps to more than one system then please include multiple entries with the corresponding addresses.
• Save the entries • Start OpStor server.
This will enable OpStor to forward the traps to a specific host.
ManageEngine OpStor :: Help Documentation
Zoho Corporation Pvt. Ltd.
71
Troubleshooting Tips
The various troubles that can occur in OpStor are listed below, classified as
• Server • Client • Discovery
Symptom Problem Solution
Server
OpStor server not starting in Port 80.
Either Port 80 is already in use by other application or In Linux platform OpStor is started with 'user' permissions which does not allow usage of wellknown ports.
• If Port 80 is already in use, please free the port and try restarting OpStor server.
• If 'user' permissions is the problem, please start OpStor with 'superuser' privileges.
Product does not come up and CPU utilization shoots up to 100%.
Windows XP and 2000 base versions have compatibility issue with jdk 1.5.
Install service pack 1 for Windows XP and service pack 4 for Windows 2000.
Forbidden error when accessing server started under root login.
The installation directory might not have the execute permission for others.
Lets assume that the product is installed under /root directory. To solve the problem provide execute permission for others to root directory.
Client
Sometimes the map image does not get updated when I add/delete a device.
Sometimes the browser would maintain a cache of the map image and might not get the new image.
• Do a ctrl+refresh of the map page.
• Add '?reload=true' to the map page url and reload the page.
Client shows "Page cannot be displayed".
Server is not running in the specified port or not running at all.
• If the server is not running, restart the server.
• If the port in which the server is started is different, reconnect your client to the new port. (http://<server name>:<port>)
I see 'not available' in some columns in Device Details
Particular fields are not accessible or not available in the device to query by OpStor.
Use 'Edit' option under 'Admin' login to populate such fields manually.
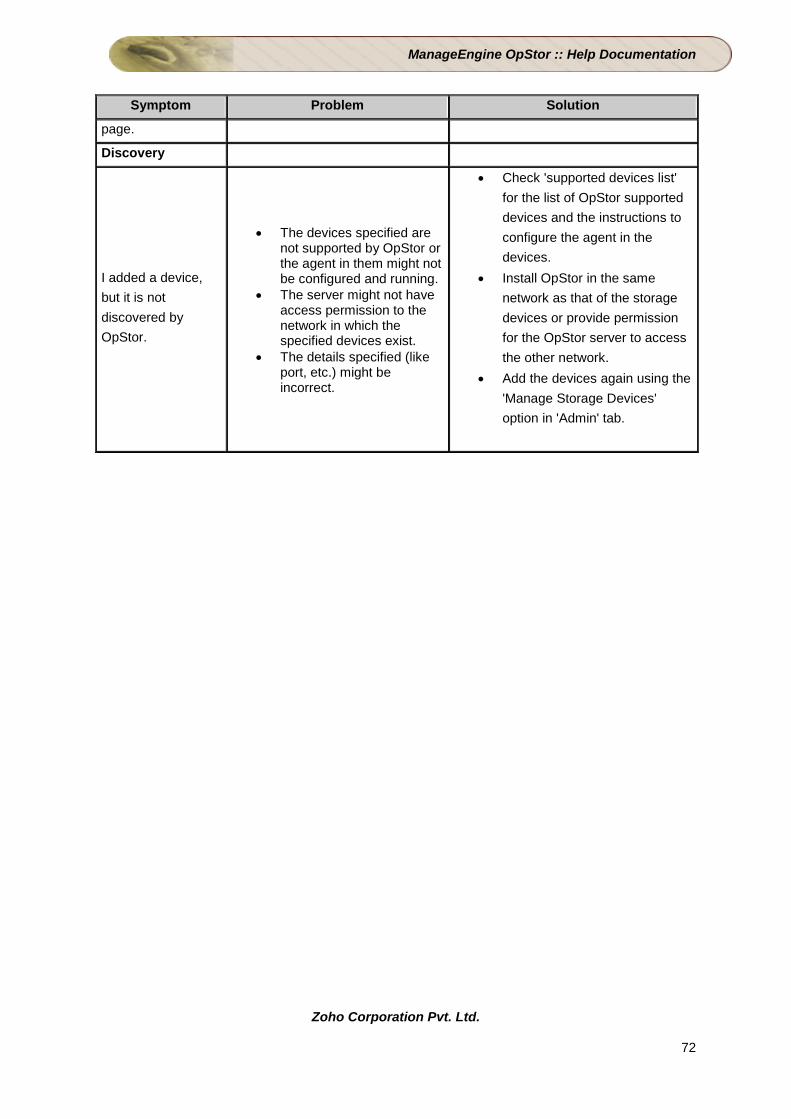
ManageEngine OpStor :: Help Documentation
Zoho Corporation Pvt. Ltd.
72
Symptom Problem Solution
page.
Discovery
I added a device, but it is not discovered by OpStor.
• The devices specified are not supported by OpStor or the agent in them might not be configured and running.
• The server might not have access permission to the network in which the specified devices exist.
• The details specified (like port, etc.) might be incorrect.
• Check 'supported devices list' for the list of OpStor supported devices and the instructions to configure the agent in the devices.
• Install OpStor in the same network as that of the storage devices or provide permission for the OpStor server to access the other network.
• Add the devices again using the 'Manage Storage Devices' option in 'Admin' tab.

ManageEngine OpStor :: Help Documentation
Zoho Corporation Pvt. Ltd.
73
Known Issues
The list of known Issues in OpStor 8 are:
There are currently no known issues.