management and energy efficiency in a chinese manufacturing
TRANSCRIPT

Management and energy efficiency in a Chinese manufacturing cluster
Valerie J. Karplus† and Da Zhang†
Submission to the 9th Annual ARCS Research ConferenceThis version: April 15, 2017
Abstract
We investigate the relationship between general and specialized management practices and energy useoutcomes in a machine components manufacturing cluster in Shandong Province, China. We conductan on-site survey of 100 firms that combines the core questions from a survey of general managementpractices with a new questionnaire on energy management practices, and separately collect three years offirm energy use data. Moving from the 25th to 75th percentile on management score is associated with areduction in electricity intensity of 17% in value terms (electricity expenditure divided by output value) butonly an 8% reduction in physical terms (electricity use in kilowatt-hours divided by output value). Energymanagement score is found to increase with general management score, and large firms tend to score highlyon both measures. Interest in adopting an energy management tool increases with energy managementscore, while overall management score only weakly predicts interest. Modern management practices mayenable organizations: 1) to identify and deploy interventions (such as load shifting) that translate into costsavings and 2) to develop specialized management practices (in this case, for energy), which in turn mayincrease capacity to absorb information that is of potential but uncertain value to the firm.
1. INTRODUCTION
Just as productivity of firms varies widely even within narrowly defined industries (Syverson,2004), large spreads in energy intensity (Boyd, 2017) present an empirical puzzle. Bringing allfirms closer to an industry’s so-called energy intensity frontier is widely thought to deliver largeenergy savings and associated environmental benefits. Energy intensity benchmarks at the indus-try level are widely used in the design of environmental policy. The benefits of energy savingsare estimated to be especially large in China, which has a vast and energy-intensive industrial sec-tor responsible for approximately 55% of the nation’s energy use (National Bureau of Statistics,2013), equivalent to more than 10% of the global total (International Energy Agency, 2014).
Energy efficiency investments are widely thought to offer returns that far outweigh the costs of im-plementing them. Empirical evidence that many of these allegedly low-hanging fruit are not har-vested is referred to as the energy efficiency gap (Jaffe and Stavins, 1994; Allcott and Greenstone,2012; Gerarden et al., 2015), prompting a rich inquiry into the potential existence of difficult-to-measure costs associated with adoption (DeCanio and Watkins, 1998) as well as behavioralexplanations (Allcott and Wozny, 2014). Efforts to accelerate the uptake of energy efficiency in-vestments have revealed that firm characteristics are important predictors of adoption (DeCanio,1998). For example, firm performance, location, and industry were found to correlate with par-ticipation in a generic and voluntary energy-saving program for lighting (DeCanio and Watkins,1998). A study by Anderson and Newell (2004) of firm responses to a government energy auditfound that adoption decisions implied hurdle rates of 50-100%. A randomized control trial in India
† Sloan School of Management, Massachusetts Institute of Technology, MA, U.S.

Submission to the 9th Annual ARCS Research Conference (April 15, 2017)
showed that plants provided with an energy audit invested far less in energy efficiency than was es-timated to be profitable (Ryan, 2015). Despite abundant evidence of an energy efficiency gap, ourunderstanding of what explains adoption and impact of energy saving technologies and practicesin firms remains limited.
A growing body of evidence has suggested that management may be at least partially responsiblefor firm-level differences in energy efficiency. In a sample of firms in the United Kingdom, Bloomet al. (2010) found that a higher management score was associated with a reduction in energyintensity (energy expenditure per value of output) of 17.4% when moving from the 25th to the 75thpercentile on management score. A study for the U.S. suggested a more complex relationship,with most management techniques associated with lower energy intensity, but an emphasis ongeneric targets, conditional on other management practices, was found to be correlated with higherenergy intensity (Boyd and Curtis, 2014). Martin et al. (2012) studied the relationship between“climate friendly” management practices, organizational structure, and energy efficiency in U.K.firms, and found adoption of “climate friendly” management practices is higher if the firm has anenvironmental manager with direct links to the CEO. Here, we take the inquiry into managementpractices and the energy paradox to mainland China, and extend it to consider the relationshipamong general and specialized management practices and energy use outcomes in both physicaland financial terms. We further consider how these practices affect a firm’s interest in adopting anenergy-saving technology.
The setting for our study is a machine components manufacturing cluster in Shandong province,China, in which electricity is the dominant energy input to production. It is the first study, to ourknowledge, to evaluate general management (based on the World Management Survey question-naire), energy management (based on best practice domestic industry standards), and energy usein both physical and value terms at the firm level. While our sample size, at 100 firms, is on thesmaller side for statistical inference, we control for location (by selecting firms within a single pre-fectural city), industry, and a firm’s energy-intensive industrial process (either metal machining,casting, and forging). Most of the firms in our sample are small and medium-sized enterprises,however, we did not screen for size as our objective was to survey the entire population, resultingin the inclusion of several larger firms. When possible, we display the underlying data to allow fora richer understanding of heterogeneity and patterns in the sample. We supplement our statisticalanalysis of the cross-section and interpretation of the results with observations and discussion fromthe on-site interviews.
Our study yields three main findings. First, consistent with prior studies, we find evidence thatmanagement, both general and energy specific, is correlated with lower electricity use intensity infirms. We further show that management is associated with a lower imputed electricity cost, andprovide evidence that firms adjusted equipment utilization rates and shifted load temporally to takeadvantage of time-varying electricity prices. Second, energy management practices are alwaysaccompanied by strong general management practices. None of the firms receive a high energymanagement score but low general management score, while the reverse occurs frequently, and
2

Submission to the 9th Annual ARCS Research Conference (April 15, 2017)
both sets of practices tend to be stronger in larger firms. Third, a high energy management scoreis positively associated with a firm’s interest in adopting an energy management tool, suggestingthat specialized management practices may enhance a firm’s cognition of potential cost-savingopportunities.
2. BACKGROUND AND EMPIRICAL SETTING
2.1 Background
There is great interest in reducing the energy intensity of manufacturing, both to limit waste andmitigate energy-related environmental damages. The manufacturing sector accounts for over two-thirds of global end-use energy demand (International Energy Agency, 2014). While much of thisenergy use is concentrated in industries with high energy intensity (iron and steel, cement, refinedoil, chemical products, and mining and metals production), high value-added manufacturing activi-ties account for substantial shares. Energy used in high value-added manufacturing primarily takesthe form of electricity, an energy carrier that is generated from primary fuels, and accounts for over10% of China’s total energy use (National Bureau of Statistics, 2013). Globally and especially inChina, primary fuels used to generate electricity remain dominated by fossil fuels, especially coal,which when combusted generate local air pollutants and carbon dioxide, a major greenhouse gasresponsible for global climate change.
There is abundant evidence that well-managed firms show superior performance on a wide rangeof measures. A number of studies have established the relationship between management andproductivity in manufacturing firms (Mefford, 1986; Ichniowski et al., 1997; White et al., 1999;Bloom and Van Reenen, 2007). Studies by the World Management Survey based on interviewswith firms across many countries have consistently found a positive correlation between manage-ment practices and productivity (Bloom and Van Reenen, 2007; Bloom et al., 2012). The causaleffect of management practices on productivity in firms has been established in randomized con-trolled trials in India (Bloom et al., 2013) and in Mexico (Bruhn et al., 2017). Well-managed firmsare also found to comply with labor standards (Distelhorst et al., 2016), use energy efficiently (De-Canio and Watkins, 1998; Bloom et al., 2010), and clean up the pollution they generate (Boyd andCurtis, 2014), relative to poorly-managed firms.
The main contribution of our study is to consider the relationship between general managementpractices, specialized energy management practices, patterns of firm-level energy use, and interestin the adoption of an energy management tool. Previous studies have considered the relationshipbetween management practices and energy (Bloom et al., 2010; Boyd and Curtis, 2014), betweenspecialized “climate-friendly” management practices and energy intensity (Martin et al., 2012),and between firm characteristics and management innovation (Mol and Birkinshaw, 2009). Weare not aware of any literature that has considered these concepts and outcomes within a singlepopulation of firms. We further extend this inquiry to mainland China, complementing previouswork largely focused on advanced industrialized economies. The firms we focus on are in many
3

Submission to the 9th Annual ARCS Research Conference (April 15, 2017)
cases directly or indirectly producing for export markets. Given that these firms are relatively smalland operate far upstream with low value added and minimal international exposure, they representan understudied population that makes a sizable aggregate contribution to global energy use andenvironmental quality in developing countries.
2.2 Empirical Setting
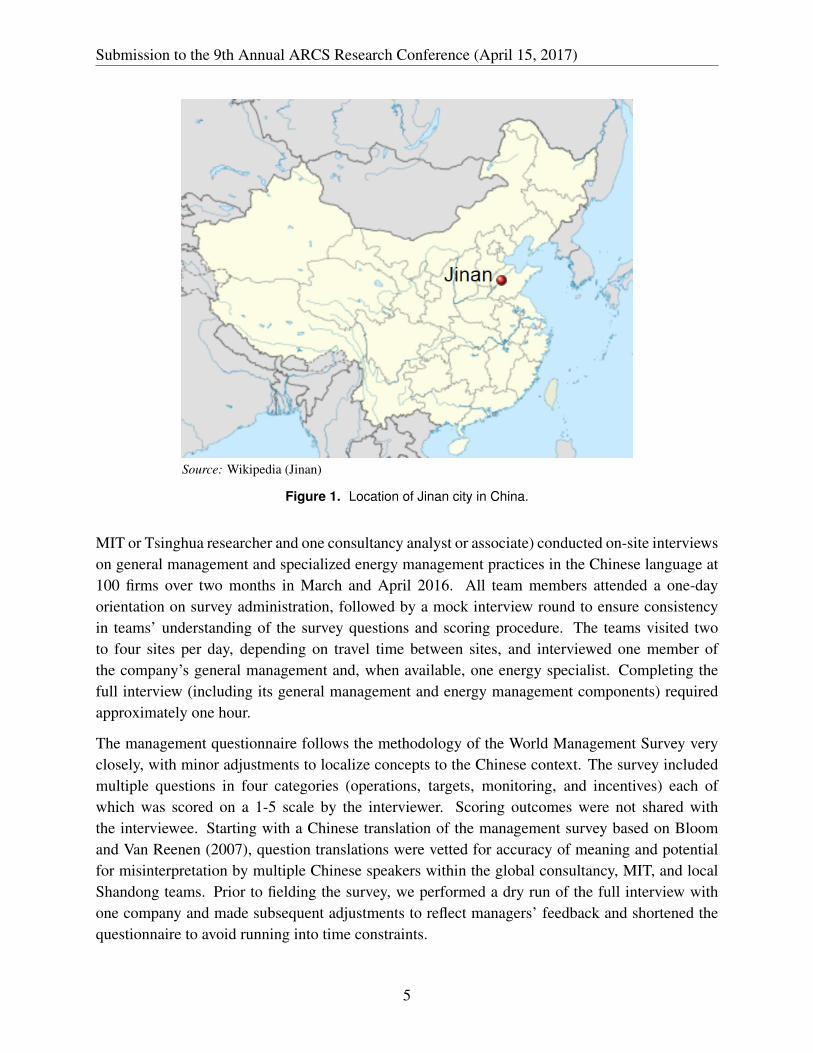
We study a cluster of 100 co-located machine component manufacturing firms in Jinan city, Shan-dong province, China (location shown as in Figure 1). All firms in the sample fall within a 50-mileradius and are spread across the city’s eight districts/counties, making all firms comparable on di-mensions of local climate (which can significantly impact energy use), governance at the city leveland above (thus policy environment is common to all firms), and market conditions (includingelectricity price schedules and labor force composition). Jinan city also has a distinct industrialhistory, as some industrial processes and product types have remained unchanged for thousands ofyears. Firms in our population represent seven two-digit industries and were chosen for similarityin their production processes (all firms are involved in metalworking, and can be divided into threesubcategories: machining, casting, and forging). Many of the firms in our sample manufacturemultiple products using a fixed set of production equipment that is powered by electricity. Two-thirds of the firms included in the final data set used in this analysis are single-plant firms. Our unitof analysis is the plant. Photographs (taken with permission) of the physical setting and productionfloor at several of the firms in our sample are shown in Figure A1 to Figure A4.
Electricity use and production information for all firms over three years (2013, 2014, and 2015)was obtained through a survey disseminated by our local partner in Jinan city, a non-governmentalorganization that has extensive prior experience providing information to industrial firms on energysaving opportunities, participating in government consulting projects, and developing national en-ergy management standards. Electricity consumption data, including the level during peak demandperiods, off-peak periods, and total consumption, was obtained at monthly resolution for all threeyears. Firms were assured that raw data provided would be kept strictly confidential. Our localpartner is not involved in regulatory enforcement and regularly interacts with government officesat the county level as well as with firms directly, leading to a high degree of trust and raising thechances of obtaining data that represent an honest collection effort. Firm submissions were cross-checked against metered electricity bills for a subsample of firms to ensure consistency. We wereunable to verify reported consumption of other energy types, which represented a modest shareof the overall total, and therefore we focus on electricity in this study. Other energy types werelargely used for space heating and not substitutable with electricity in core production processes.
A two-part survey covering management and energy management was designed and administeredby a collaborative team including an analyst, two associates, and one junior partner from the Chinaoffices of a global management consultancy and researchers from the Massachusetts Institute ofTechnology and Tsinghua University. The team administered the survey with logistical supportfrom our local Shandong partner. Over a period of five weeks, two groups (each comprised of one
4
Submission to the 9th Annual ARCS Research Conference (April 15, 2017)
Source: Wikipedia (Jinan)
Figure 1. Location of Jinan city in China.
MIT or Tsinghua researcher and one consultancy analyst or associate) conducted on-site interviewson general management and specialized energy management practices in the Chinese language at100 firms over two months in March and April 2016. All team members attended a one-dayorientation on survey administration, followed by a mock interview round to ensure consistencyin teams’ understanding of the survey questions and scoring procedure. The teams visited twoto four sites per day, depending on travel time between sites, and interviewed one member ofthe company’s general management and, when available, one energy specialist. Completing thefull interview (including its general management and energy management components) requiredapproximately one hour.
The management questionnaire follows the methodology of the World Management Survey veryclosely, with minor adjustments to localize concepts to the Chinese context. The survey includedmultiple questions in four categories (operations, targets, monitoring, and incentives) each ofwhich was scored on a 1-5 scale by the interviewer. Scoring outcomes were not shared withthe interviewee. Starting with a Chinese translation of the management survey based on Bloomand Van Reenen (2007), question translations were vetted for accuracy of meaning and potentialfor misinterpretation by multiple Chinese speakers within the global consultancy, MIT, and localShandong teams. Prior to fielding the survey, we performed a dry run of the full interview withone company and made subsequent adjustments to reflect managers’ feedback and shortened thequestionnaire to avoid running into time constraints.
5

Submission to the 9th Annual ARCS Research Conference (April 15, 2017)
The energy management questionnaire incorporates general requirements from China’s nationalstandard for energy management GB/T 23331, which closely follows the international energy man-agement standard ISO 50001. Questions attempted to measure the firm’s general awareness andexperience with energy saving measures, as well as the existence and extent of the company’s in-ternal energy management system. A copy of the energy management questionnaire is providedin Table A1. Both general management scores and energy management scores are calculated asunweighted averages of scores given on individual questions.
Interviewers began by asking general management questions to a member of firm’s middle man-agement or above. Energy management questions were answered by either the manager (if noenergy management staff was available), otherwise a specialized energy manager was interviewed.At the end of the management and energy management interviews, the firm representative wasasked if they would be interested in adopting an online platform that identifies energy saving op-portunities, known as the Resource Efficiency Deployment Engine or RedE, developed by theglobal consultancy. The platform guides the user to input information about the firm’s equipment,processes, energy use patterns, and energy expenditures, and returns a list of “levers” based ontheir estimated potential to reduce expenditures on energy use. The lever set provided to the firmis selected from a database of energy-saving interventions informed by a combination of engineer-ing estimates and prior implementation across a wide range of industries. The list includes manyprocess-based changes that incur no up-front cost. Each lever is accompanied by an estimate of thecost savings and payback period. The firm is then responsible for introducing the recommendedchanges, for instance by altering existing processes and practices, adjusting equipment settings, orinvesting in more energy efficient equipment.
Of the original set of 100 firms for which we obtained both management scores and energy useinformation, we dropped three firm outliers that either had very intermittent production, were in-volved solely in assembly (very low energy intensity), or reported dramatic shifts in energy inten-sity between 2014 and 2015. We further dropped seven firms that did not fall into the three processcategories related to metalworking, as discussed above.
3. RESULTS
3.1 Data and Descriptive Statistics
The firms in our sample were chosen for similarity in the basic energy-intensive production pro-cesses they employ. Firm size varies widely, measured both in terms of the number of employeesand sales value. The average firm age in the sample is 23 years, with the youngest firm 2 yearsold and the oldest 106. Just under 15% of the firms in our sample are state owned, among themfirms overseen by the central, provincial, and city government. The average share of electricity
6

Submission to the 9th Annual ARCS Research Conference (April 15, 2017)
consumption in total energy use (calculated on the basis of heating value) is 70%.* Many of thefirms in our sample directly export their products, with an average share of product sales exportedreported at 14%. Over 63% of the firms in our sample did not engage in any exporting activity.
We find that once we account for differences in energy-intensive production processes, the standarddeviation of energy use is smaller than the mean for all three process groups (metal machining,casting, and forging). Casting is the most electricity intensive, as it involves melting metal, whilemetal machining is the least energy intensive. Interestingly, these firms belong to multiple two-digitindustry categories, despite having very similar production processes within the three firm groups.Looking within two-digit and even four-digit industry categories, we find substantial differences inenergy-using processes among firms, underscoring that industry code may not be the best indicatorof a firm’s relative energy intensity.
Table 1. Summary statistics for the 90 firms from 2013 to 2015.
Mean Stdev Min Max
Overall management 3.1 1.0 1.0 4.9Energy management 1.9 1.1 1.0 5.0
Sales (million CNY) 294.6 722.8 300 408.4Employees 482.2 1029.8 10 6000Firm age 23.7 21.4 2 106Export share 0.14 0.24 0 1
Electricity consumption (GWh)Casting firms (24 obs) 39.5 62.6 1.5 207.2Forging firms (30 obs) 1.6 2.9 0.06 11.3Metal machining firms (214 obs) 3.3 7.0 0.04 35.1
Electricity intensity (kWh/yuan)Casting firms (24 obs) 1097.4 789.2 136.9 2982.0Forging firms (30 obs) 616.8 464.0 71.6 1978.3Metal machining firms (214 obs) 149.4 134.4 9.5 618.3
Compared to a national sample of firms (year 2011, sales larger than 20 million yuan) in the sameindustries from the China Industrial Census, the firms in our sample are not significantly differentin terms of sales, number of employees, or the proportion of state-controlled enterprises. Table1 shows summary statistics of the firms for which we have complete management survey andelectricity use data.
* We believe that firms’ self-reported energy use for energy types other than electricity was not reported consistentlyacross firms, with some firms including electricity consumption in reported totals and others omitting it. Thecalculation here is based on the average for the subset of firms that report electricity consumption smaller thantotal energy use (in units of tons of coal equivalent, a standard measure of energy in China).
7

Submission to the 9th Annual ARCS Research Conference (April 15, 2017)
3.2 Management and Energy Use
Figure 2 shows the kernel density of normalized electricity intensity in value terms (log deviationsfrom the industry mean) for the sample of metal machining firms with management score in thebottom quartile (badly managed) and the top quartile (well managed). The two distributions havelimited overlap, and the badly managed firms have substantially higher energy intensity. We cau-tion that our sample size is relatively limited, with each distribution representing approximately20 firms. Nevertheless, the difference in energy intensity between the badly managed and wellmanaged firms is striking, with the distribution for the latter much narrower than the former.
-2.5 -2.0 -1.5 -1.0 -0.5 0.0 0.5 1.0 1.5Energy intensity in value terms
(log deviations from industry average)
0.0
0.2
0.4
0.6
0.8
1.0
Ker
nel d
ensi
ty
Badly managedWell managed
Figure 2. Relationship between management practices and energy intensity for metal machining firms.
Notes: The graph shows kernel density plots of normalized electricity intensity in value term (log deviations fromindustry mean) for the sample of metal machining firms with management score in the bottom quartile (badly managed)and the top quartile (well managed).
As shown in Figure 3, there is a negative correlation between management and electricity useintensity, with moving from the 25th to 75th percentile in management score associated with areduction in electricity use intensity of 17% (in value terms) and 8% (in physical terms). Thestronger correlation with the value measure is consistent with the possibility that managementeffort is being directed toward minimizing energy cost but not physical use per se. Despite greaterhomogeneity in location, industry, and processes employed relative to the U.K. sample, the spreadis very similar to that observed for U.K. firms (at 17.4% in Bloom et al. (2010)). For energymanagement score, the correlation with electricity use intensity is much lower as shown in Figure4. This is perhaps unsurprising, as firms that tend to be more energy intensive may also have
8

Submission to the 9th Annual ARCS Research Conference (April 15, 2017)
stronger incentives to invest in developing energy management practices.
We regress electricity intensity on management level and a range of other firm characteristics:
EIi,t = βM ∗Mi + βY ∗ ln Yi,t + Zi + δt + εc,t (1)
where electricity intensity EIi,t is related to management score Mi, firm output value Yi,t, a yeardummy δt, and a vector of firm-specific controls Zi including the firm’s main energy-intensiveproduction process (metal machining, casting, forging), the firm’s voltage level (which affects thefirm’s electricity price, as will be described below), firm age, and noise controls.
As shown in Table 2, management is strongly associated with lower average energy intensity forthe firms in our sample. Once a firm’s output size is included in the regression, we find that thecoefficient on management remains negative, but loses its significance. In the preferred specifica-tion, which includes controls for process, firm age, voltage level, and noise, we find that while thecoefficient on energy management score is not significant either, while the coefficient on firm sizeis large and highly significant.
3.3 Management and Unit Electricity Cost
There are several operational adjustments that firms can make to influence their unit electricitycost. The first is load shifting, or running facilities during hours when electricity is less expensive.A second involves increasing utilization, conditional on transformer capacity, which spreads thefixed cost of the transformer over more units of output.
The firms in our sample face an identical schedule of electricity prices, which depends only on thetime of electricity use and the size of a firm’s transformer. The price schedule is described in Table3. There are four time-of-use based categories. Summit hours are 10:30 - 11:30, 19:00 - 21:00from June to August, peak hours are 8:30 - 11:30 and 16:00 - 21:00 from September to May and8:30 - 10:30, 16:00 - 19:00 from June to August, base hours are 11:30 - 16:00, 21:00 - 23:00, and7:00 - 8:30, and valley hours are overnight, 23:00 - 7:00. The electricity price during the valleyhours is only half of the base price and one third of the peak hour price, translating into potentiallylarge savings for firms that use electricity during these hours. Many of the firms we visited statedthat they were taking advantage of the low valley hour electricity price by shifting a portion ofproduction to the nighttime hours.
In this context, it is plausible that management is helping firms identify load-shifting opportunities,while utilization is largely determined by exogenous (product market) conditions that in turn affectelectricity requirements. We ask whether management is correlated with a lower per-unit electricitycost, conditional on firm size and other characteristics using the regression similar to Equation (1)with the imputed electricity cost as a dependent variable. Table 4 shows that firms with goodmanagement practices face lower per-unit electricity costs. We find that management score is
9

Submission to the 9th Annual ARCS Research Conference (April 15, 2017)
-1.0 -0.5 0.0 0.5 1.0Management score
(log deviations from industry average)
-3
-2
-1
0
1
2
Ele
ctric
ity in
tens
ity in
phy
sica
l ter
ms
(log
devi
atio
ns fr
om in
dust
ry a
vera
ge)
-1.0 -0.5 0.0 0.5 1.0Management score
(log deviations from industry average)
-3
-2
-1
0
1
2
Ele
ctric
ity in
tens
ity in
val
ue te
rms
(log
devi
atio
ns fr
om in
dust
ry a
vera
ge)
Figure 3. Energy intensity (physical and value terms), management and size at the firm level.
Notes: The graph shows a scatter plot of the residuals of a regression of log(energy expenditure / sales) on processdummies against the residuals of a regression of the management score on the same industry dummies. Circlesrepresent firm size in terms of sales value. We include the data for all three years.
10

Submission to the 9th Annual ARCS Research Conference (April 15, 2017)
-1.0 -0.5 0.0 0.5 1.0Energy management score
(log deviations from industry average)
-3
-2
-1
0
1
2
Ele
ctric
ity in
tens
ity in
phy
sica
l ter
ms
(log
devi
atio
ns fr
om in
dust
ry a
vera
ge)
-1.0 -0.5 0.0 0.5 1.0Energy management score
(log deviations from industry average)
-3
-2
-1
0
1
2
Ele
ctric
ity in
tens
ity in
val
ue te
rms
(log
devi
atio
ns fr
om in
dust
ry a
vera
ge)
Figure 4. Energy intensity in physical (top) and value (bottom) terms, energy management, and size offirms in our sample.
Notes: The graph shows a scatter plot of the residuals of a regression of log(energy expenditure / sales) on processdummies against the residuals of a regression of the energy management score on the same industry dummies. Circlesrepresent firm size in terms of sales value. We include the data for all three years.11

Submission to the 9th Annual ARCS Research Conference (April 15, 2017)
Table 2. Correlation between management practices and electricity intensity (in value terms), controllingfor firm characteristics.
Energy intensity in physical terms Energy intensity in value terms(kWh/10,000 yuan) (yuan/10,000 yuan)
(1) (2) (3) (4) (5) (6) (7) (8)
Management -59.6** -51.1** -9.6 -54.7*** -50.1** -21.4(24.6) (27.7) (32.1) (19.0) (21.4) (24.4)
Energy management -5.8 1.8(44.3) (30.8)
log (sales) -58.8** -59.2*** -40.7** -47.6***(26.5) (20.1) (19.1) (15.3)
Year controls Yes Yes Yes Yes Yes Yes Yes YesProcess controls Yes Yes Yes Yes Yes Yes Yes YesFirm age controls No Yes Yes Yes No Yes Yes YesVoltage level controls No Yes Yes Yes No Yes Yes YesNoise controls No Yes Yes Yes No Yes Yes Yes
Observations 271 253 253 253 271 253 253 253Firms 90 85 85 85 91 85 85 85
Notes: The dependent variable is energy consumption in kWh over sales (unit: 10,000 yuan) for regressions (1) to(4) and energy expenditure (yuan) over sales (unit: 10,000 yuan) for regressions (5) to (8). We treat sales as grossoutput value because all the firms report that they only produce when there is an order and keep a very low levelof inventory for final products. ‘Management’ is the unweighted average score of the 19 questions on managementpractices, and ‘Energy management’ is the unweighted average score of the 10 questions on energy managementpractices. Noise controls are a set of variables capturing interview characteristics: duration of the interview and thepatience and willingness to share information of the interviewee as perceived by the interviewer. Standard errorsare clustered at the firm level (i.e. robust to heteroscedasticity and autocorrelation of unspecified form) and reportedin parentheses below coefficients: * significant at 10%; ** significant at 5%; *** significant at 1%.
negatively correlated with per-unit electricity expenditure and significant at the 10% level. Movingfrom the 25th to 75th percentile on management score is correlated with an 8% decrease in per-unitelectricity cost. We further find that firms with a higher management score tended to report bothload shifting and higher transformer utilization rates.
Table 3. Shandong electricity price structure for large industrial users.
Price per kWh Monthly fixed cost
Voltage level (VL) Benchmark price (yuan/kWh) Time-of-use pricing multiplier based on transformer capacity
Summithours
Peak hours Base hours Valleyhours
(yuan/kVA)
1 kV ≤ VL ≤ 10 kV 0.6646 1.7 1.5 1 0.5 28
35 kV ≤ VL < 110 kV 0.6496 1.7 1.5 1 0.5 28
Sources: Shandong Bureau of Commodity Price (April 2015).Note: The benchmark price is occasionally changed by the Shandong Bureau of Commodity Prices, and changes apply uniformly to the population offirms. Summit hours (10:30 - 11:30, 19:00 - 21:00 from June to August), peak hours (8:30 - 11:30, 16:00 - 21:00 from September to May; 8:30 - 10:30,16:00 - 19:00 from June to August), base hours (11:30 - 16:00, 21:00 - 23:00, 7:00 - 8:30), and valley hours (23:00 - 7:00).
12

Submission to the 9th Annual ARCS Research Conference (April 15, 2017)
Table 4. Correlation between electricity cost per kWh and management practices
Imputed electricity cost (yuan/kWh)
(1) (2) (3) (4)
Management -0.034* -0.039* -0.051*(0.02) (0.02) (0.03)
Energy management -0.016(0.04)
0.018 0.001log (sales) (0.01) (0.02)
Year controls Yes Yes Yes YesProcess controls Yes Yes Yes YesFirm age controls No Yes Yes YesVoltage level controls No Yes Yes YesNoise controls No Yes Yes Yes
Observations 271 253 253 253Firms 91 85 85 85
Notes: The dependent variable is imputed electricity cost (yuan/kWh). ‘Management’ is the overallscore based on the 19 questions on management practices, and ‘Energy management’ is the overallrating based on the 10 questions on energy management practices. Noise controls are a set of variablescapturing interview characteristics: duration of the interview and the patience and willingness to shareinformation of the interviewee as perceived by the interviewer. Standard errors are clustered at thefirm level (i.e. robust to heteroscedasticity and autocorrelation of unspecified form) and reported inparentheses below coefficients: * significant at 10%; ** significant at 5%; *** significant at 1%.
3.4 General and energy-specific management capabilities
We now consider the relationship between general management and specialized energy manage-ment capabilities. We find that energy management is strong only when general management isstrong, but not the reverse. Firms size is strongly correlated with higher general managementcapabilities as well as specialized energy management scores. The relationship between generalmanagement score, energy management score, and firm size is shown in Figure ??.
We examine the predictors of both general management score and energy management score usingthe regression below.
Mi = βY ∗ ln Yi,t + βexp ∗ θexpi + βprod ∗Dprodi + βfamily ∗Dfamily
i + βstate ∗Dstatei + εi (2)
where Mi represents firm’s management score (or energy management score). Firm output valueYi,t, export share in sales θexpi , product type dummy Dprod
i (customized or standard products),ownership dummies (Dfamily
i and Dstatei ) as well as a vector of firm-specific controls Zi (similar
to Equation 1) are included as independent variables.
The results are shown in Table 5. We find that in addition to firm output value, several otherfirm-specific characteristics are associated with management score. Interestingly, we find that a
13

Submission to the 9th Annual ARCS Research Conference (April 15, 2017)
1 2 3 4 5Management score
1
2
3
4
5E
nerg
y m
anag
emen
t sco
re
Figure 5. Correlation between management and energy management capacities.
Notes: Circles represent firm size in numbers of employees.
firm’s export share in sales is positively correlated with its management practice level, but notwith its energy management practice level. The observation that good management practices areassociated with exporting is consistent with prior work (Tanaka, 2016). The fact that exportingis positively associated with general management score but not specialized energy managementscore, is plausible as in China it is the government that encourages firms, particularly state-ownedenterprises, to adopt energy management systems. In the context of export oriented buyer-supplyrelationships, however, energy efficiency may be far less important. Firms may even have incen-tives to hide energy efficiency information, as divulging it to suppliers could lead buyers to pushfor lower purchase prices (a concern expressed by firm representatives during several of the in-terviews). We did not find a significant relationship between firms making customized products(rather than standardized products) and higher management scores. Similar to the finding in Bloomand Van Reenen (2007) that family-owned firms with primogeniture are less well managed, we findthat firms with multiple family members on the management team are less well managed, and thiseffect is significant at the 1% level.
14

Submission to the 9th Annual ARCS Research Conference (April 15, 2017)
Table 5. Correlation between management practices and firm characteristics
Management practices Energy management practices
(1) (2) (3) (4) (5) (6) (7) (8) (9) (10)
log (sales) 0.26*** 0.28*** 0.22*** 0.26*** 0.25*** 0.47*** 0.47*** 0.47*** 0.43*** 0.43***(0.06) (0.05) (0.06) (0.07) (0.06) (0.06) (0.07) (0.06) (0.07) (0.07)
Export share in sales 0.82** 1.02*** 0.80** 0.82** 1.01*** 0.00 -0.14 0.00 0.04 -0.11(0.35) (0.37) (0.32) (0.35) (0.34) (0.21) (0.24) (0.21) (0.21) (0.24)
Customized products 0.03 0.08 -0.04 -0.03(0.41) (0.58) (0.27) (0.23)
Multiple family members in management -0.48*** -0.45*** 0.18 0.10(0.19) (0.18) (0.13) (0.14)
State ownership -0.03 -0.16 0.43 0.46(0.29) (0.28) (0.29) (0.30)
Process controls Yes Yes Yes Yes Yes Yes Yes Yes Yes YesFirm age controls Yes Yes Yes Yes Yes Yes Yes Yes Yes YesVoltage level controls Yes Yes Yes Yes Yes Yes Yes Yes Yes YesNoise controls Yes Yes Yes Yes Yes Yes Yes Yes Yes Yes
Firms 85 83 85 85 83 85 83 85 85 83
Notes: The dependent variable is management scores for regression (1) to (5) and energy management scores for regression (6) to (10). We treat the sales as grossoutput value because all the firms report that they only produce when there is an order, and they keep very low level of inventory for final products. ‘Management’is the overall score based on the 19 questions on management practices, and ‘Energy management’ is the overall rating based on the 10 questions on energymanagement practices. Noise controls are a set of variables capturing interview characteristics: duration of the interview and the patience and willingness to shareinformation of the interviewee as perceived by the interviewer. Standard errors are clustered at the firm level (i.e. robust to heteroscedasticity and autocorrelation ofunspecified form) and reported in parentheses below coefficients: * significant at 10%; ** significant at 5%; *** significant at 1%.
3.5 Management capabilities and technology adoption
We now turn to assess the relationship between pre-existing firm characteristics and the willingnessof the firm’s leadership adopt an online energy management tool free-of-charge that offers eachfirm an individualized menu of opportunities to improve its energy use efficiency. The onlinetool requires registering the company in a database and inputing detailed information about thefirm’s existing energy use patterns, which the system then uses to identify potential energy savingopportunities and to estimate the magnitude of associated financial savings and payback period.The tool identifies both operational changes with zero up-front cost as well as a range of possibleinvestments that pay back over a period of months or years.
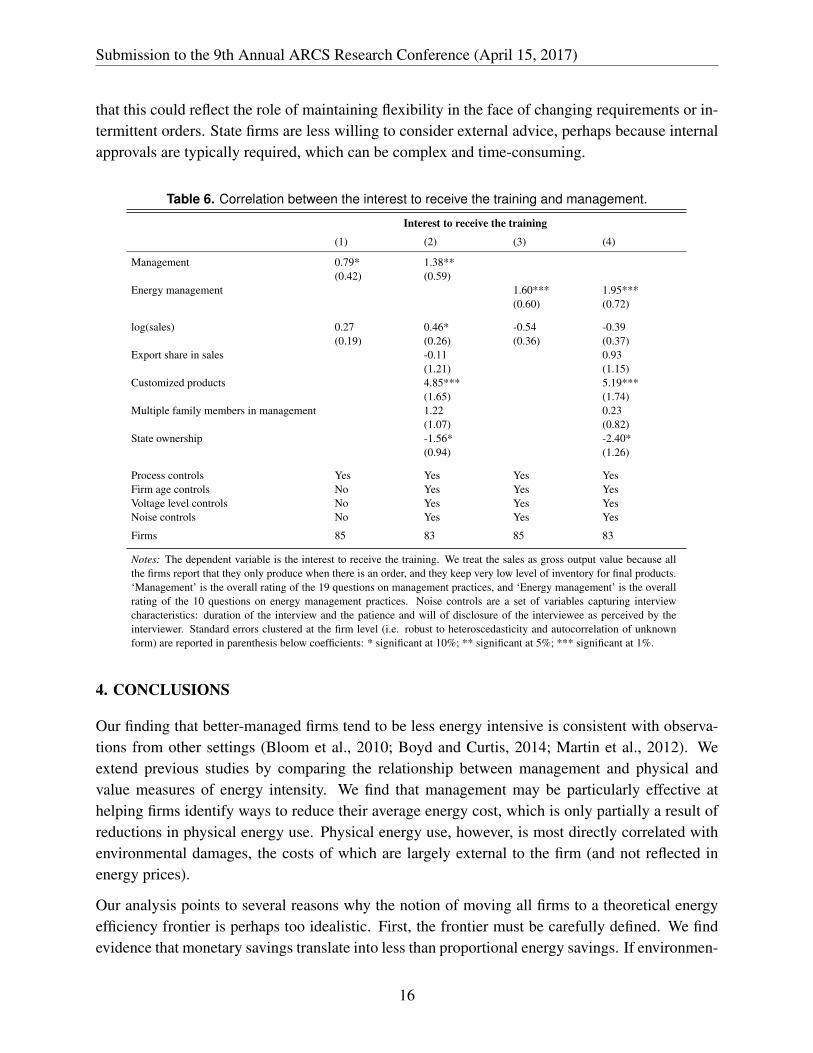
We estimate a logit regression with the dependent variable equal to one if the firm expresses in-terest, and zero if the firm has no interest in adopting the tool. The form of regression is similarto Equation 2, except the firm’s willingness to adopt the tool is the dependent variable and man-agement scores are included as independent variable. Of the firms in the sample, 39 firms wereinterested in adopting the tool, while 46 firms indicated no interest. Predictors of a firm’s expressedinterest in adopting the tool are shown in Table 6.
We find that a firm’s willingness to adopt the tool is strongly correlated with its management andenergy management score. This might be explained by the fact that firms with higher managementand energy management score likely acknowledge the value of efficient use of energy and are morewilling to adopt recommendations. Firm size is significant when only management is included inthe regression; once energy management score is included, the coefficient on firm size remainspositive but loses significance. There is a significant positive relationship between firms makingcustomized products (rather than standardized products) and willingness to adopt. We speculate
15
Submission to the 9th Annual ARCS Research Conference (April 15, 2017)
that this could reflect the role of maintaining flexibility in the face of changing requirements or in-termittent orders. State firms are less willing to consider external advice, perhaps because internalapprovals are typically required, which can be complex and time-consuming.
Table 6. Correlation between the interest to receive the training and management.
Interest to receive the training
(1) (2) (3) (4)
Management 0.79* 1.38**(0.42) (0.59)
Energy management 1.60*** 1.95***(0.60) (0.72)
log(sales) 0.27 0.46* -0.54 -0.39(0.19) (0.26) (0.36) (0.37)
Export share in sales -0.11 0.93(1.21) (1.15)
Customized products 4.85*** 5.19***(1.65) (1.74)
Multiple family members in management 1.22 0.23(1.07) (0.82)
State ownership -1.56* -2.40*(0.94) (1.26)
Process controls Yes Yes Yes YesFirm age controls No Yes Yes YesVoltage level controls No Yes Yes YesNoise controls No Yes Yes Yes
Firms 85 83 85 83
Notes: The dependent variable is the interest to receive the training. We treat the sales as gross output value because allthe firms report that they only produce when there is an order, and they keep very low level of inventory for final products.‘Management’ is the overall rating of the 19 questions on management practices, and ‘Energy management’ is the overallrating of the 10 questions on energy management practices. Noise controls are a set of variables capturing interviewcharacteristics: duration of the interview and the patience and will of disclosure of the interviewee as perceived by theinterviewer. Standard errors clustered at the firm level (i.e. robust to heteroscedasticity and autocorrelation of unknownform) are reported in parenthesis below coefficients: * significant at 10%; ** significant at 5%; *** significant at 1%.
4. CONCLUSIONS
Our finding that better-managed firms tend to be less energy intensive is consistent with observa-tions from other settings (Bloom et al., 2010; Boyd and Curtis, 2014; Martin et al., 2012). Weextend previous studies by comparing the relationship between management and physical andvalue measures of energy intensity. We find that management may be particularly effective athelping firms identify ways to reduce their average energy cost, which is only partially a result ofreductions in physical energy use. Physical energy use, however, is most directly correlated withenvironmental damages, the costs of which are largely external to the firm (and not reflected inenergy prices).
Our analysis points to several reasons why the notion of moving all firms to a theoretical energyefficiency frontier is perhaps too idealistic. First, the frontier must be carefully defined. We findevidence that monetary savings translate into less than proportional energy savings. If environmen-
16

Submission to the 9th Annual ARCS Research Conference (April 15, 2017)
tal impact is the main concern, better management directed toward realizing cost savings will notnecessarily lead to proportional improvements on environmental metrics. Pollution pricing or reg-ulation would still be required. Another definitional issue relates to industry classification, whichwe find that even the four-digit level may be too broad to identify a common set of energy-savingbest practices.
Second, our interviews revealed significant variation in the importance firms attached to energymanagement. Reasons we noted across firms included principal-agent problems (individuals op-erating equipment were not directly rewarded for energy efficiency nor were they knowledgeableabout savings opportunities), low salience (management, in some cases a single individual, showedlimited interest in energy management as a source of savings for the firm), and misaligned incen-tives (firms that demonstrated energy savings would be required to pass savings along to buyers).
Third, even though they share the same industry, location, and processes, firms in our sample var-ied in terms of their access to input and output markets, position in the supply chain, complexityand variety of products, and ownership. We found that these characteristics often translated intostriking differences in the internal organization and priorities of the firm, as well as external de-mand fluctuations that determine the timing of energy needs. While the energy efficiency frontieris not usually defined with respect to these differences, they may impose differentiating constraintson firms’ ability to reduce the intensity of energy use.
When studying the energy productivity of firms, we find evidence that grouping based on a firm’score process may be more useful than the sector classification. Even at the four-digit level, firmscan produce a wide variety of products, using an even greater variety of processes. For instancethe same firm might produce screws, flanges and pipes; another firm in our sample producedcomponents for railway wagons, large cranes, and large mechanical presses. Moreover, a firmthat produces two products classified as different based on industry code may actually use a singlemachine in almost exactly the same way to produce both.
We note that well-managed firms are found to excel on a variety of dimensions: productivity (Mef-ford, 1986; White et al., 1999; Bloom and Van Reenen, 2007), compliance with labor standards(Distelhorst et al., 2016), energy efficiency (Bloom et al., 2010), and environmental protection(Martin et al., 2012; Boyd and Curtis, 2014). We examine the relationship between general man-agement capabilities and specific (in this case, energy management) capabilities, and find evidencethat general management capabilities nearly always accompany energy management capabilities.Firms that are better managed on both general and specific measures also tend to be larger thanother firm types. Our findings are consistent with the possibility that firms that are well-managedin a general sense are better positioned to develop layers of management competencies within theorganization. In this conception, management practices serve a cognitive function for the organiza-tion, guiding the firm to identify and act on relevant information and cost reduction opportunities.More work is needed to test these notions in the field.
We further find that it is energy management score, and not general management score, that is
17

Submission to the 9th Annual ARCS Research Conference (April 15, 2017)
associated with interest in adopting an energy management tool. This observation suggests thatspecific knowledge of energy and the capacity to track and adjust its use will lead firms to seekand absorb new information or interventions that could enable them to further optimize. Our in-terviews suggested that establishing an energy management system carries fixed costs that requireeither sufficiently large and certain benefits or state pressure to overcome. It suggest there may bea positive feedback between establishing energy management functions and the firm’s ability toobtain value from external energy management resources. If true, the developers of energy man-agement tools may have the greatest success in targeting firms with at least a basic comprehensionof their internal energy use patterns and the management capabilities to adjust them on the basis ofexternal inputs. However, it is precisely these firms that are likely to have undertaken significantenergy-saving investments already. By contrast, firms that are less focused on energy managementtend not to be interested in the tool, despite large estimated potential savings. As a result, the firmsthat are most likely to benefit from the tool may also be the most challenging group to reach.
Acknowledgements
We are grateful to our partners at the global consultancy McKinsey and Company for provid-ing in-kind consulting time and complimentary access to the RedE energy management tool forthe firms involved in this study. Our Shandong partners provided vital on-the-ground support,arranging transportation and appointments for over 100 interviews and collecting energy data.We thank Tsinghua University student Guangzhi Yin for invaluable research assistance. This re-search was supported by Eni S.p.A. (Award No. 5210000541), the French Development Agency(AFD, Award No. RCH-2012-277), ICF International (MIT Energy Initiative Associate Member-ship Agreement), and Shell International Limited (Award No. PT14937), founding sponsors ofthe MIT-Tsinghua China Energy and Climate Project. We further acknowledge the Energy In-formation Administration of the U.S. Department of Energy for supporting this work through acooperative agreement to MIT (Award No. DE-EI0001908). At MIT, the China Energy and Cli-mate Project is part of the Joint Program on the Science and Policy of Global Change, which issupported by a consortium of industrial sponsors and U.S. federal grants, including a grant fromthe U.S. Department of Energy Office of Science (Award No. DE-FG02-94ER61937).
18

Submission to the 9th Annual ARCS Research Conference (April 15, 2017)
5. REFERENCES
Allcott, H., M. Greenstone. 2012. Is there an energy efficiency gap? J. Econ. Pers. 26(1) 3–28.
Allcott, Hunt, Nathan Wozny. 2014. Gasoline prices, fuel economy, and the energy paradox. Rev.Econ. Stat. 96(5) 779–795.
Anderson, S. T., R. G. Newell. 2004. Information programs for technology adoption: The case ofenergy-efficiency audits. Resour. Energy Econ. 26(1) 27–50.
Bloom, N., B. Eifert, A. Mahajan, D. McKenzie, J. Roberts. 2013. Does Management Matter?Evidence from India. Q. J. Econ. 128(1) 1–51.
Bloom, N., C. Genakos, R. Martin, R. Sadun. 2010. Modern management: Good for the environ-ment or just hot air? Econ. J. 120(544) 551–572.
Bloom, N., C. Genakos, R. Sadun, J. Van Reenen. 2012. Management practices across firms andcountries. Acad. Manage. Perspect. 26(1) 12–33.
Bloom, N., J. Van Reenen. 2007. Measuring and explaining management practices across firmsand countries. Q. J. Econ. 72(4) 1352–1408.
Boyd, G. A. 2017. Comparing the statistical distributions of energy efficiency in manufacturing:Meta-analysis of 24 Case studies to develop industry-specific energy performance indicators(EPI). Energ. Effic. 10(1) 217–238.
Boyd, G. A., M. E. Curtis. 2014. Evidence of an “Energy-Management Gap” in US manufacturing:Spillovers from firm management practices to energy efficiency. J. Environ. Econ. Manage.68(3) 467–479.
Bruhn, M., D. Karlan, A. Schoar. 2017. The impact of consulting services on small and mediumenterprises: Evidence from a randomized trial in Mexico. Journal of Political Economy forth-coming.
DeCanio, S. J. 1998. The efficiency paradox: Bureaucratic and organizational barriers to profitableenergy-saving investments. Energy Policy 21(26) 441–454.
DeCanio, S. J., W. E. Watkins. 1998. Investment in energy efficiency: Do the characteristics offirms matter? Rev. Econ. Stat. 80(1) 95–107.
Distelhorst, G., J. Hainmueller, R. M. Locke. 2016. Does lean improve labor standards? Manage-ment and social performance in the Nike supply chain. Manage. Sci. in press.
Gerarden, T. D., R. G. Newel, R. N. Stavins, R. C. Stowe. 2015. An assessment of the energy-efficiency gap and its implications for climate-change policy. National Bureau of EconomicResearch Working Paper No. 20905.
19

Submission to the 9th Annual ARCS Research Conference (April 15, 2017)
Ichniowski, C., K. Shaw, G. Prennushi. 1997. The effects of human resource management practiceson productivity: A study of steel finishing lines. Am. Econ. Rev. 87(3) 291–313.
International Energy Agency. 2014. Wold Energy Outlook 2014. International Energy Agency,Paris, France.
Jaffe, A. B., R. N. Stavins. 1994. The energy-efficiency gap What does it mean? Energy Policy22(10) 804–810.
Martin, R., M. Muuls, L. B. de Preuxe, U. J. Wagner. 2012. Anatomy of a paradox: Managementpractices, organizational structure and energy efficiency. J. Environ. Econ. Manage. 63(2)208–223.
Mefford, R. N. 1986. Introducing management into the production function. Rev. Econ. Stat. 68(1)96–104.
Mol, M. J., J. Birkinshaw. 2009. The sources of management innovation: When firms introducenew management practices. J. Bus. Res. 62(12) 1269–1280.
National Bureau of Statistics. 2013. China Energy Statistical Yearbook 2013. China StatisticsPress, Beijing, China.
Ryan, N. 2015. Is there an energy-efficiency gap? Experimental evidence from Indian manufac-turing plants. mimeo, Yale University .
Syverson, C. 2004. Market structure and productivity: A concrete example. J. Polit. Econ. 112(6)1181–1222.
Tanaka, M. 2016. Exporting sweatshops? Evidence from Myanmar. mimeo, Stanford University .
White, R. E., J. N. Pearson, J. R. Wilson. 1999. JIT manufacturing: A survey of implementationsin small and large U.S. manufacturers. Manage. Sci. 45(1) 1–15.
20

Submission to the 9th Annual ARCS Research Conference (April 15, 2017)
Figure A1. A metal press in one of the plants in our sample.
Figure A2. Metal raw materials outside one of the plants in our sample.
21

Submission to the 9th Annual ARCS Research Conference (April 15, 2017)
Figure A3. Women working on metal lathes in one of the plants in our sample.
Figure A4. Plant workers heading to lunch at one of the plants in our sample.
22

Submission to the 9th Annual ARCS Research Conference (April 15, 2017)
Tabl
eA
1.Fi
rmen
ergy
man
agem
entq
uest
ionn
aire
.
Prac
tice
Exa
mpl
esof
ques
tions
we
aske
dSc
orin
gcr
iteri
a
Ene
rgy
Man
agem
ent
Syst
em
Whe
ther
the
com
pany
has
anes
tabl
ishe
den
ergy
man
agem
ents
yste
ma)
Isth
ere
anen
ergy
man
agem
ents
yste
min
your
com
pany
?b)
Has
your
com
pany
met
any
ener
gym
anag
emen
tsta
ndar
ds?
Ifso
,whi
chst
anda
rds?
1po
intT
here
isno
ener
gym
anag
emen
tsys
tem
.3
poin
tsT
here
isan
ener
gym
anag
emen
tsys
tem
,but
the
rele
vanc
eto
any
natio
nalo
rin
tern
atio
nale
nerg
ym
anag
emen
tsta
ndar
dsis
uncl
ear.
5po
ints
The
reis
anen
ergy
man
agem
ent
syst
em,a
ndth
esy
stem
mee
tsa
natio
nal
orin
tern
atio
nal
ener
gym
anag
emen
tsta
ndar
d.
Ene
rgy
Man
agem
ent
Cap
acity
Whe
ther
ener
gym
anag
ers
have
prof
essi
onal
ener
gym
anag
emen
tski
llsan
din
fluen
ceco
mpa
nyde
cisi
ons
a)Is
ther
ean
yone
form
ally
appo
inte
das
the
pers
onin
char
geof
ener
gy?
b)H
asth
epe
rson
inch
arge
ofen
ergy
acqu
ired
any
tech
nica
lcre
dent
ials
orre
ceiv
edan
yen
ergy
man
agem
entt
rain
ing?
c)H
owdo
esth
een
ergy
man
agem
entt
eam
influ
ence
the
com
pany
’sde
cisi
onm
akin
g?
1po
intT
here
isno
spec
ializ
eden
ergy
man
agem
entt
eam
.3
poin
tsT
here
isa
spec
ializ
eden
ergy
man
agem
entt
eam
,but
only
one
pers
onw
ithlim
ited
influ
ence
onth
eco
mpa
ny’s
deci
sion
sm
akin
g.5
poin
tsT
heen
ergy
man
agem
entt
eam
isw
ellt
rain
edan
dca
nin
fluen
ceth
eco
mpa
ny’s
deci
sion
s.
Ene
rgy
Man
agem
ent
resp
onsi
bilit
ies
Whe
ther
ener
gym
anag
ers
have
wel
l-de
fined
form
alre
spon
sibi
litie
sa)
Plea
segi
vea
brie
fint
rodu
ctio
nto
the
orga
niza
tion
and
resp
onsi
bilit
ies
toth
een
ergy
man
agem
entt
eam
.b)
Cou
ldyo
usp
ecif
yth
edo
cum
entt
hatd
efine
sth
eab
ove
orga
niza
tion
and
resp
onsi
bilit
ies,
ifan
y?
1po
intT
heen
ergy
man
agem
entt
eam
does
noth
ave
any
clea
rly
defin
edro
les.
3po
ints
The
ener
gym
anag
emen
ttea
mha
sso
me
resp
onsi
bilit
ies
butt
hey
are
notc
lear
lyde
fined
ina
form
aldo
cum
ent.
5po
ints
The
ener
gym
anag
emen
ttea
man
dpe
rson
nelh
ave
form
ally
defin
edre
spon
sibi
litie
s.
Ene
rgy
Law
san
dR
egul
atio
ns
Whe
ther
empl
oyee
sun
ders
tand
and
conf
orm
toen
ergy
savi
ngla
ws
and
regu
latio
nsa)
Plea
sebr
iefly
intr
oduc
eho
wth
eco
mpa
nytr
acks
ener
gysa
ving
law
san
dre
gula
tions
.b)
Plea
sebr
iefly
intr
oduc
eth
eco
mpa
ny’s
prac
tices
toim
plem
entt
hese
law
san
dre
gula
tions
.
1po
intT
heco
mpa
nydo
esno
tsys
tem
atic
ally
trac
ken
ergy
law
san
dre
gula
tions
.3
poin
tsT
heco
mpa
nysy
stem
atic
ally
trac
ksen
ergy
law
san
dre
gula
tions
,but
the
com
pany
does
notp
rovi
deth
ere
ason
fort
rack
ing
orim
plem
enta
tion.
5po
ints
The
com
pany
syst
emat
ical
lytr
acks
the
ener
gyla
ws
and
regu
latio
ns.I
thas
acl
earg
oalt
oim
plem
ent
them
,and
the
goal
isal
igne
dw
ithth
eco
mpa
ny’s
goal
.
Ene
rgy
Mon
itori
ngan
dR
evie
w
Whe
ther
the
com
pany
regu
larl
ytr
acks
and
revi
ews
itsen
ergy
use
a)H
owof
ten
does
the
com
pany
mea
sure
and
revi
ewits
ener
gyus
e?Is
ther
ea
stan
dard
ized
proc
ess?
b)Is
the
firm
’sen
ergy
use
com
pare
dto
any
benc
hmar
ks?
c)D
oes
the
com
pany
keep
aco
mpr
ehen
sive
reco
rdof
itsen
ergy
use
and
revi
ewit
regu
larl
y?
1po
intT
heco
mpa
nydo
esno
trev
iew
ener
gyus
e.3
poin
tsT
heco
mpa
nyre
view
sen
ergy
use,
buti
tdoe
sno
thav
ea
clea
rgoa
land
lack
sco
nsis
tent
and
quan
ti-ta
tive
mea
sure
sof
prog
ress
.5
poin
tsT
here
view
hasa
clea
rgoa
l.It
isco
nduc
ted
regu
larl
yan
din
clud
esqu
antit
ativ
em
easu
reso
fpro
gres
s.
Ene
rgy
Ben
chm
arki
ngW
heth
erth
eco
mpa
nyha
sa
clea
rben
chm
ark
form
easu
ring
ener
gysa
ving
prog
ress
a)W
hats
tand
ard
orap
proa
chis
appl
ied
into
cons
truc
tben
chm
ark
ener
gyus
e,if
any?
b)D
oes
the
benc
hmar
kin
clud
een
ergy
use
atfa
ctor
y,w
orks
hop,
and
equi
pmen
tlev
el?
c)H
owdo
esth
ebe
nchm
ark
trea
tpar
amet
ers
that
refle
cten
ergy
effic
ienc
y?d)
Und
erw
hatc
ondi
tions
are
the
base
line
and
para
met
ers
adju
sted
?H
ave
they
ever
been
adju
sted
inth
epa
st?
1po
intT
heco
mpa
nydo
esno
tset
anen
ergy
benc
hmar
kfo
reva
luat
ing
prog
ress
.3
poin
tsT
heco
mpa
nyha
ses
tabl
ishe
dits
benc
hmar
ken
ergy
use.
The
reis
nom
echa
nism
forr
egul
arad
just
-m
ent.
5po
ints
The
com
pany
has
anad
vanc
een
ergy
base
line
syst
em.T
here
isa
mec
hani
smfo
rreg
ular
adju
stm
ent.
Ene
rgy
Targ
ets
Doe
sth
efir
mha
veen
ergy
-sav
ing
targ
ets
and
how
are
they
impl
emen
ted?
a)A
reth
efir
m’s
ener
gyta
rget
sdo
cum
ente
d?b)
Isth
een
ergy
targ
etde
fined
atth
ele
velo
fthe
com
pany
,wor
ksho
pan
deq
uipm
ent?
c)Is
the
com
pany
’sin
tern
alta
rget
conn
ecte
dw
ithan
yex
tern
alta
rget
sor
stan
dard
s?d)
Wha
tis
the
proc
ess
fors
ettin
g,re
view
ing,
and
adju
stin
gen
ergy
targ
ets?
Wha
thap
pens
ifth
eta
rget
itm
et?
Wha
tha
ppen
sif
the
targ
etis
notm
et?
1po
intT
here
isno
docu
men
tdes
crib
ing
the
firm
’sen
ergy
targ
ets.
3po
ints
The
reis
ado
cum
entt
hatd
escr
ibes
the
firm
’sen
ergy
targ
ets,
buti
tis
noti
nteg
rate
dw
ithm
anda
tory
requ
irem
ents
and
carr
ies
nopu
nish
men
tfor
non-
com
plia
nce.
5po
ints
Ene
rgy
targ
ets
are
wel
ldo
cum
ente
d,al
igne
dw
ithre
gula
tory
requ
irem
ents
,an
dno
n-co
mpl
ianc
epu
nish
men
tsar
ecl
earl
yst
ipul
ated
.
Info
rmat
ion
Exc
hang
eH
owst
rong
isth
efir
m’s
inte
rnal
com
mun
icat
ion
arou
nden
ergy
savi
nggo
als
and
requ
irem
ents
?a)
How
isin
form
atio
non
the
perf
orm
ance
ofen
ergy
-usi
ngeq
uipm
ente
xcha
nged
amon
gem
ploy
ees?
b)Is
itco
mm
onfo
rem
ploy
ees
toof
fer
advi
ceor
shar
ein
form
atio
non
how
toim
prov
een
ergy
effic
ienc
y?D
idth
eyre
ceiv
ean
yre
war
d?
1po
intE
nerg
ysa
ving
know
ledg
eis
limite
dto
asm
allg
roup
ofem
ploy
ees
and
notw
idel
yun
ders
tood
.3
poin
tsE
nerg
ysa
ving
know
ledg
eis
exch
ange
din
tern
ally
.Em
ploy
ees
occa
sion
ally
shar
ead
vice
onho
wto
impr
ove
ener
gyef
ficie
ncy.
5po
ints
Ene
rgy
savi
ngkn
owle
dge
isfr
eque
ntly
shar
ed.
Em
ploy
ees
are
enco
urag
eto
shar
ead
vice
onw
ays
toim
prov
een
ergy
effic
ienc
y.
Inve
stm
ent
and
Proc
urem
ent
Isen
ergy
savi
ngco
nsid
ered
inin
vest
men
t,pr
oduc
tdes
ign,
and
proc
urem
ent?
a)Is
ener
gysa
ving
cons
ider
edin
feas
ibili
tyst
udie
sfo
rne
win
vest
men
tsor
prod
ucts
?Is
anen
ergy
audi
tor
othe
rm
easu
res
ofen
ergy
use
requ
ired
forfi
xed
asse
tinv
estm
entp
roje
cts?
b)H
owdo
esth
eco
mpa
nyan
alyz
een
ergy
use
and
cons
umpt
ion
whe
npr
ocur
ing
larg
een
ergy
inte
nsiv
eeq
uipm
ent?
Do
you
calc
ulat
elif
e-cy
cle
econ
omic
cost
s?H
owlo
ngis
the
life
cycl
eor
depr
ecia
tion
peri
odco
nsid
ered
?c)
Plea
sede
scri
beho
wyo
utr
ack
and
asse
ssen
ergy
effic
ienc
ydu
ring
equi
pmen
tope
ratio
nan
dm
aint
enan
ce.
1po
intE
nerg
ysa
ving
isno
tcon
side
red
inin
vest
men
tand
proc
urem
ent.
3po
ints
The
com
pany
cons
ider
sen
ergy
savi
ngin
inve
stm
enta
ndpr
ocur
emen
tbut
lack
sa
syst
emat
icas
sess
-m
enta
ppro
ach.
5po
ints
The
com
pany
cons
ider
sen
ergy
savi
ngin
inve
stm
enta
ndpr
ocur
emen
tand
adop
tsa
syst
emat
icas
-se
ssm
enta
ppro
ach.
Ene
rgy
Man
agem
ent
Eva
luat
ion
How
does
the
com
pany
revi
ewan
dim
prov
eits
inte
rnal
ener
gym
anag
emen
tcap
abili
ties?
a)H
owof
ten
does
the
com
pany
revi
ewits
ener
gym
anag
emen
tsys
tem
?W
hati
sth
eob
ject
ive?
Isth
ebo
ard
invo
lved
?b)
How
doyo
uco
rrec
tany
prob
lem
sid
entifi
ed?
c)H
owis
perf
orm
ance
revi
ewed
?W
hath
appe
nsif
perf
orm
ance
isno
tsat
isfa
ctor
y?
1po
intT
here
isno
revi
ewpr
oces
s,w
ithno
rew
ards
orpu
nish
men
tsfo
rper
form
ance
.3
poin
tsT
here
isa
revi
ewpr
oces
s,bu
tthe
rew
ards
and
puni
shm
ents
are
limite
dor
notw
elld
efine
d.5
poin
tsT
here
isa
clea
rrev
iew
proc
ess,
and
clea
rly
defin
edre
war
dsan
dpu
nish
men
ts.
23