management of obesity in older adults benefits and risks of body weight interventions after age 65...
TRANSCRIPT

Management of Obesity in
Older Adults Benefits and Risks of Body
Weight Interventions after Age 65
Connie W. Bales, PhD, RD * +
Gwendolen Buhr, MD,MHS, CMD *
+GRECC, Durham VAMC*Division of Geriatrics, DUMC

We know that frailty due to underweight is linked with poor
health and functional outcomes…
2

But energy imbalances, whetherpositive or negative,
threaten health….
3

Management of Obesity in Older Adults
4

1998
Obesity Trends* Among U.S. AdultsBRFSS, 1990, 1998, 2007
(*BMI 30, or about 30 lbs. overweight for 5’4” person)
2007
1990
No Data <10% 10%–14% 15%–19% 20%–24% 25%–29% ≥30%
33.2% increase in obesity during the 1990’s
5

6

Men
Men
Women
7

Expectations for 2010
8.3 million Americans will be over the age of 50 yrs AND obese.
For those >60 yrs of age, prevalence of obesity 33.6-39.6%.
8

Causes of later life obesity:
Stable energy intake + Stable energy intake +
decreased energy requirement decreased energy requirement
positive energy balance, fat positive energy balance, fat accrual accrual
Also, shifts in the proportions of fat and Also, shifts in the proportions of fat and leanlean
9
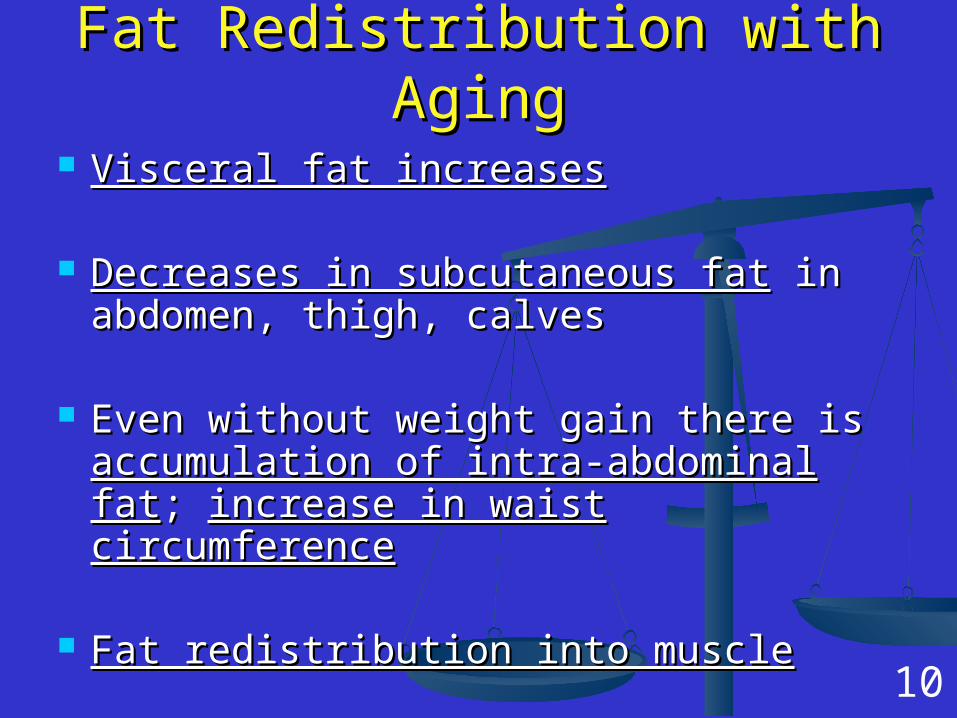
Fat Redistribution with AgingFat Redistribution with Aging
Visceral fat increasesVisceral fat increases
Decreases in subcutaneous fatDecreases in subcutaneous fat in in abdomen, thigh, calvesabdomen, thigh, calves
Even without weight gain there is Even without weight gain there is accumulation of intra-abdominal fataccumulation of intra-abdominal fat; ; increase in waist circumferenceincrease in waist circumference
Fat redistribution into muscleFat redistribution into muscle10
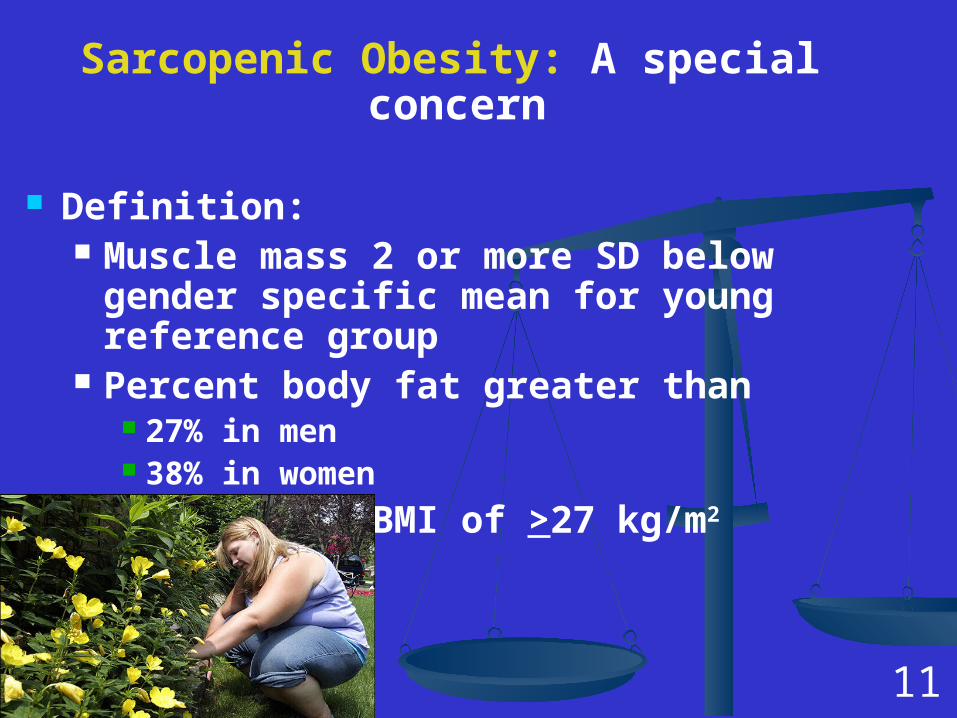
Sarcopenic Obesity: A special concern
Definition: Muscle mass 2 or more SD below gender
specific mean for young reference group Percent body fat greater than
27% in men 38% in women
Approximate BMI of >27 kg/m2
11
Sarcopenic Obesity: A New Health Sarcopenic Obesity: A New Health Concern in the ElderlyConcern in the Elderly11
Increased obesity rateIncreased obesity rate
++
Age-related changes in body compositionAge-related changes in body composition
There is excess weight along with There is excess weight along with reduced muscle mass or strengthreduced muscle mass or strength
11Zamboni et al. Nutr Metab CVD;18:388-75. 2008Zamboni et al. Nutr Metab CVD;18:388-75. 200812
Obesity may greatly increase the impact Obesity may greatly increase the impact of sarcopenia on functionof sarcopenia on function
Rolland et al.--women Rolland et al.--women >> 75 yrs 75 yrs Healthy wt vs purely obese vs purely sarcopenic Healthy wt vs purely obese vs purely sarcopenic
vs sarcopenic obese vs sarcopenic obese Purely sarcopenic-no effectPurely sarcopenic-no effect Purely obese- somewhat higher odds of difficultyPurely obese- somewhat higher odds of difficulty Sarcopenic-obeseSarcopenic-obese
2.6 higher odds of difficulty climbing 2.6 higher odds of difficulty climbing stairsstairs
2.3 higher odds of difficulty of 2.3 higher odds of difficulty of descending stairsdescending stairs
13

How bad is obesity for older adults?
Linked with major causes of morbidity and mortality:
Diabetes mellitusDiabetes mellitus Hypertension and strokeHypertension and stroke Dyslipidemia, CHD, CHFDyslipidemia, CHD, CHF CancerCancer DisabilityDisability
14
Obesity’s Effects on the Onset of FunctionalImpairment Among Older AdultsJenkins, KR. Gerontologist 44: 206-16. 2004.
Longitudinal data --Asset and Health Dynamics Among the Oldest Old (AHEAD) survey
Logistic regression models on the onset of functional impairment over two time points
15
Increased Functional impairmentsIncreased Functional impairments
Those overweight or obese are more likely to experience onset of
functional impairment in various domains.
have effects on the onset of impairment in strength, lower body mobility, and activities of daily living.
Jenkins. 2004.
16

Zamboni et al. Intl J Obesity 29:1011-29. 2005.Zamboni et al. Intl J Obesity 29:1011-29. 2005.
Despite the known detrimental Despite the known detrimental effects of obesity on health effects of obesity on health outcomes and function….outcomes and function….
There is “great controversy” There is “great controversy” concerning the net health concerning the net health impact of obesity in the impact of obesity in the elderly. elderly.
17
Zamboni et al. Intl J Obesity 29:1011-29. 2005.Zamboni et al. Intl J Obesity 29:1011-29. 2005.
““Debate persists about the relation Debate persists about the relation between between
obesity in old age and obesity in old age and total or disease-total or disease-
specific mortalityspecific mortality, the , the definitiondefinition of of obesity in obesity in
the elderly, its the elderly, its clinical relevanceclinical relevance, and , and about about
its its need for treatmentneed for treatment.”.”
18

The BMI--Mortality Relationship
Evidence from epidemiological studies has been sought to characterize the relationship between body mass and health that plays out as aging progresses.
At least 17 medium to large medium to large epidemiological studies in the last ten epidemiological studies in the last ten years aloneyears alone
19

At later ages….
There is a weakening of the body weight/mortality relationship
Only BMIs in the obese range are associated with higher mortality
20

Bales C.W., Buhr G. (2009) Body mass Bales C.W., Buhr G. (2009) Body mass trajectory and energy balance as trajectory and energy balance as determinants of health and determinants of health and mortality in older adults. mortality in older adults. Obesity Obesity Facts: European Journal of ObesityFacts: European Journal of Obesity. . 3; 171-178.3; 171-178.
21

How bad is obesity for older adults?
While being overweight in midlife is hazardous to survival, a BMI roughly in the 25-30 range is not associated with increased mortality when it is achieved in later life.
22

How bad is obesity for older adults?
Most of the epidemiological findings argue for a beneficial or neutral rather than a detrimental effect of a high BMI on length of life after the age of 65 years.
23

In addition, several studies have found recent weight loss to be linked with reduced longevity.
Even a modest decline in BW is an independent marker of mortality risk Newman et al.
Overweight but otherwise healthy men who lost weight had higher mortality rates than those weight stable.
Nilsson et al.
24

The “Reverse Epidemiology” of BMI and The “Reverse Epidemiology” of BMI and Survival in Late LifeSurvival in Late Life
Considerable evidence supports a survival Considerable evidence supports a survival benefit of adiposity in wasting diseasesbenefit of adiposity in wasting diseases like like
end stage renal failure, heart failure, COPD end stage renal failure, heart failure, COPD
and other inflammatory wasting diseases.and other inflammatory wasting diseases.
25

The “Reverse Epidemiology” of BMI and The “Reverse Epidemiology” of BMI and Survival in Late LifeSurvival in Late Life
May be explained byMay be explained by a larger amount of energy stored as fat a larger amount of energy stored as fat larger stores of lean masslarger stores of lean mass influence of adiposity on fuel selection:influence of adiposity on fuel selection:
During starvation, the proportion of energy During starvation, the proportion of energy expenditure expenditure derived from protein oxidation is derived from protein oxidation is lower.lower.
Lean tissue is better preserved in persons with Lean tissue is better preserved in persons with
large fat large fat stores.stores. 26

The The interpretation of the interpretation of the BMI/mortality relationship is BMI/mortality relationship is complicatedcomplicated by a host of by a host of confounding variables:confounding variables: Specific vs. all causeSpecific vs. all cause Smoking, underlying diseaseSmoking, underlying disease SurvivalSurvival
Arguments against this conclusion:
27

Future mortality trends may Future mortality trends may differdiffer due to much higher rates of due to much higher rates of mid-life obesitymid-life obesity In those obese 30-49 there is 6-In those obese 30-49 there is 6-
yr less life expectancy and a yr less life expectancy and a reduction in yrs free of reduction in yrs free of disabilitydisability
Caveats about this conclusion:
28

Since we cannot study effects on Since we cannot study effects on human lifespan directly, we asked..human lifespan directly, we asked..
What happens when overweight What happens when overweight older adults intentionally lose older adults intentionally lose weight?weight?
Conducted a Conducted a systematic reviewsystematic review of of randomized controlled weight loss randomized controlled weight loss trialstrials
29

Bales CW, Buhr G. Is obesity bad for older persons? A systematic review of the pros and cons of weigh reduction in later life. J Am Med Dir Assoc. 9:302-312. 2008.
30

Significance for this topic?Significance for this topic?
In general, guidelines for ideal body weight In general, guidelines for ideal body weight and approaches for weight reduction in obese and approaches for weight reduction in obese adults over age 65 years is lacking.adults over age 65 years is lacking.
Specifically, the MOVE! Program* for Specifically, the MOVE! Program* for veterans does not have any guidelines for veterans does not have any guidelines for eligible veterans if they are age 70 or older.eligible veterans if they are age 70 or older.
*Managing Overweight and Obesity for *Managing Overweight and Obesity for Veterans Everywhere Veterans Everywhere
31

Overall Approach for the Overall Approach for the Systematic ReviewSystematic Review
We examined data from randomized We examined data from randomized controlled trials exclusivelycontrolled trials exclusively
For endpoints, we used medical diseases/ For endpoints, we used medical diseases/ conditions associated with obesity or conditions associated with obesity or metabolic abnormalities that are prevalent metabolic abnormalities that are prevalent in the older adult population, namely:in the older adult population, namely: Cardiovascular disease and inflammationCardiovascular disease and inflammation HypertensionHypertension Type 2 diabetes mellitusType 2 diabetes mellitus Osteoarthritis and physical functionOsteoarthritis and physical function OsteoporosisOsteoporosis
32

Overall Approach for the Overall Approach for the Systematic ReviewSystematic Review
We wanted to identify the beneficialWe wanted to identify the beneficial-- improved metabolic parameters-- improved metabolic parameters
-- enhanced function-- enhanced function
as well as the negative outcomes of as well as the negative outcomes of
intentional weight lossintentional weight loss--loss of bone mineral--loss of bone mineral
-- loss of lean mass-- loss of lean mass
33
Methods for the Systematic ReviewMethods for the Systematic Review
PubMed database searchPubMed database search English onlyEnglish only 4 search domains4 search domains
ObesityObesity Weight lossWeight loss Weight loss interventionsWeight loss interventions Co-morbidities (as specified)Co-morbidities (as specified)
34

Results of Systematic ReviewResults of Systematic Review
Initial result = 268 articlesInitial result = 268 articles When narrowed for geriatric topic = 26When narrowed for geriatric topic = 26 Applied these criteria:Applied these criteria:
Subjects 60 >yrs of ageSubjects 60 >yrs of age Baseline BMI > 27Baseline BMI > 27 Weight loss of > 3% or 2 kg achievedWeight loss of > 3% or 2 kg achieved Trial duration > 6 monthsTrial duration > 6 months
13 papers met criteria; review of them 13 papers met criteria; review of them yielded 3 more; thus we reviewed a total yielded 3 more; thus we reviewed a total of 16 papersof 16 papers
However, the 16 articles actually However, the 16 articles actually represented only 5 major trialsrepresented only 5 major trials 35
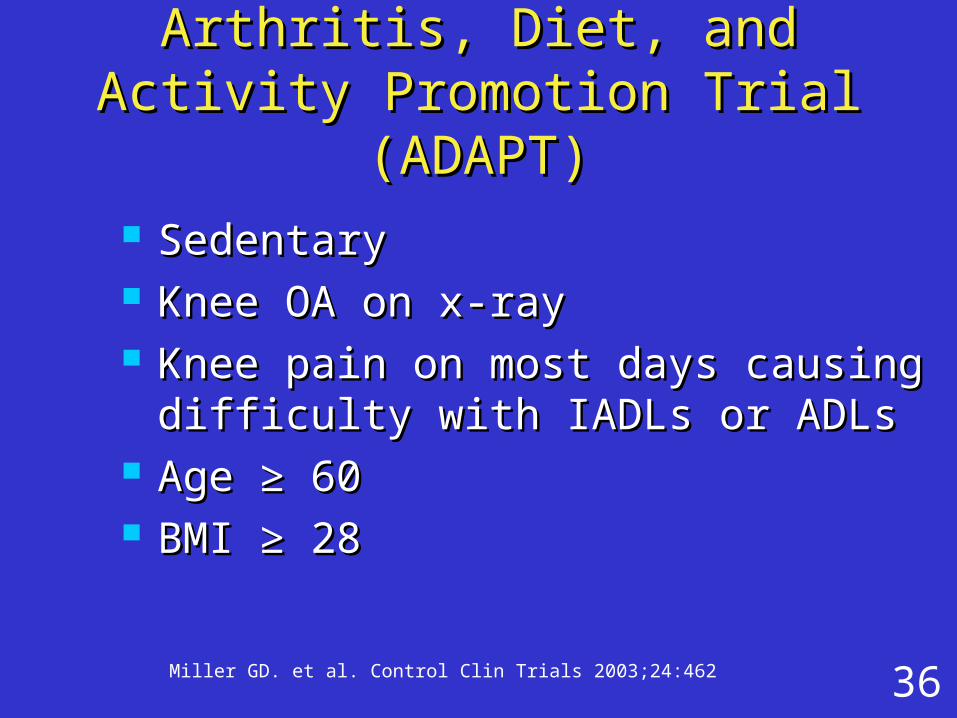
Miller GD. et al. Control Clin Trials 2003;24:462
Arthritis, Diet, and Activity Arthritis, Diet, and Activity Promotion Trial (ADAPT)Promotion Trial (ADAPT)
Sedentary Sedentary Knee OA on x-rayKnee OA on x-ray Knee pain on most days causing Knee pain on most days causing
difficulty with IADLs or ADLsdifficulty with IADLs or ADLs Age ≥ 60Age ≥ 60 BMI ≥ 28BMI ≥ 28
36

Miller GD. et al. Control Clin Trials 2003;24:462
ADAPT DesignADAPT Design
n = 76n = 76 n = 82
n = 78n = 78n = 80n = 80
37

Messier SP. et al. Arthritis Rheum 2004;50:1501
ADAPT ResultsADAPT Results
68 ± 6.3 years, BMI 34.5 ± 5.668 ± 6.3 years, BMI 34.5 ± 5.6 % Weight Loss % Weight Loss
Control – 1.3%; Control – 1.3%; Exercise – 2.6%;Exercise – 2.6%; Diet – 5.7%; Diet – 5.7%; Diet + Exercise – 4.4%Diet + Exercise – 4.4%
38

Messier SP. et al. Arthritis Rheum 2004;50:1501.
ADAPT Primary Outcome MeasureADAPT Primary Outcome Measure
Self-reported physical function (0-68 point scale)Self-reported physical function (0-68 point scale) Diet + Exercise improved 5.73 [2.63,8.83]Diet + Exercise improved 5.73 [2.63,8.83]
p <.05 compared to controlp <.05 compared to control
39

ADAPT Secondary Outcome MeasuresADAPT Secondary Outcome Measures
DietDiet ExEx Diet Diet + Ex+ Ex
SF-36 physical function SF-36 physical function composite scalecomposite scale
NSNS NSNS ↑↑
Satisfaction with physical Satisfaction with physical functionfunction
NSNS ↑↑ ↑↑
Satisfaction with appearanceSatisfaction with appearance ↑↑ ↑↑ ↑↑6-minute walk distance6-minute walk distance NSNS ↑↑ ↑↑Stair climb timeStair climb time NSNS NSNS ↓↓
Knee painKnee pain NSNS NSNS ↓↓
Messier SP. et al. Arthritis Rheum 2004;50:1501; Rejeski WJ et al. Health Psychol 2002;21:419 40
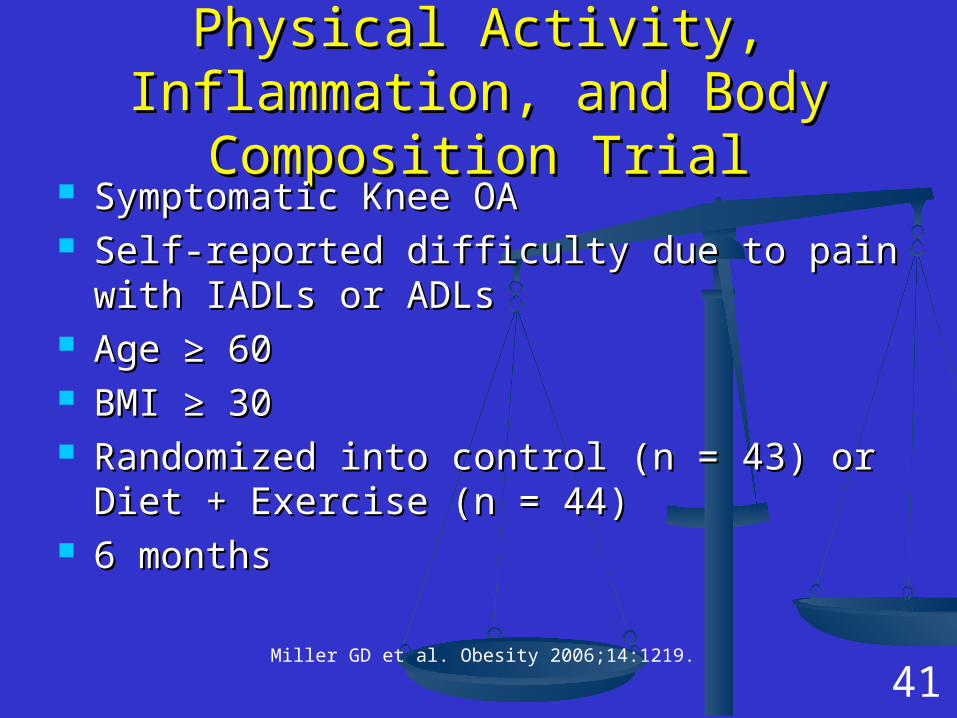
Miller GD et al. Obesity 2006;14:1219.
Physical Activity, Inflammation, and Physical Activity, Inflammation, and Body Composition TrialBody Composition Trial
Symptomatic Knee OASymptomatic Knee OA Self-reported difficulty due to pain with Self-reported difficulty due to pain with
IADLs or ADLsIADLs or ADLs Age ≥ 60Age ≥ 60 BMI BMI ≥ 30≥ 30 Randomized into control (n = 43) or Diet + Randomized into control (n = 43) or Diet +
Exercise (n = 44)Exercise (n = 44) 6 months6 months
41
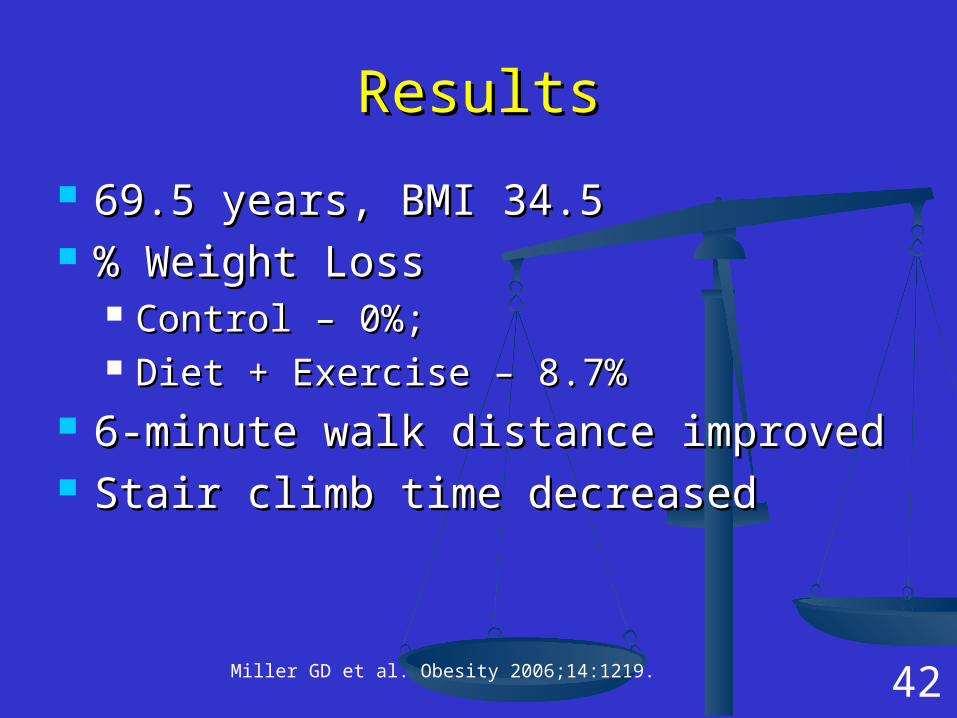
Miller GD et al. Obesity 2006;14:1219.
ResultsResults
69.5 years, BMI 34.569.5 years, BMI 34.5 % Weight Loss % Weight Loss
Control – 0%; Control – 0%; Diet + Exercise – 8.7%Diet + Exercise – 8.7%
6-minute walk distance improved 6-minute walk distance improved Stair climb time decreasedStair climb time decreased
42

Miller GD et al. Obesity 2006;14:1219.
Self-Reported Physical Function at 6 Self-Reported Physical Function at 6 monthsmonths
WO
MA
C s
core
(0-
96)
43
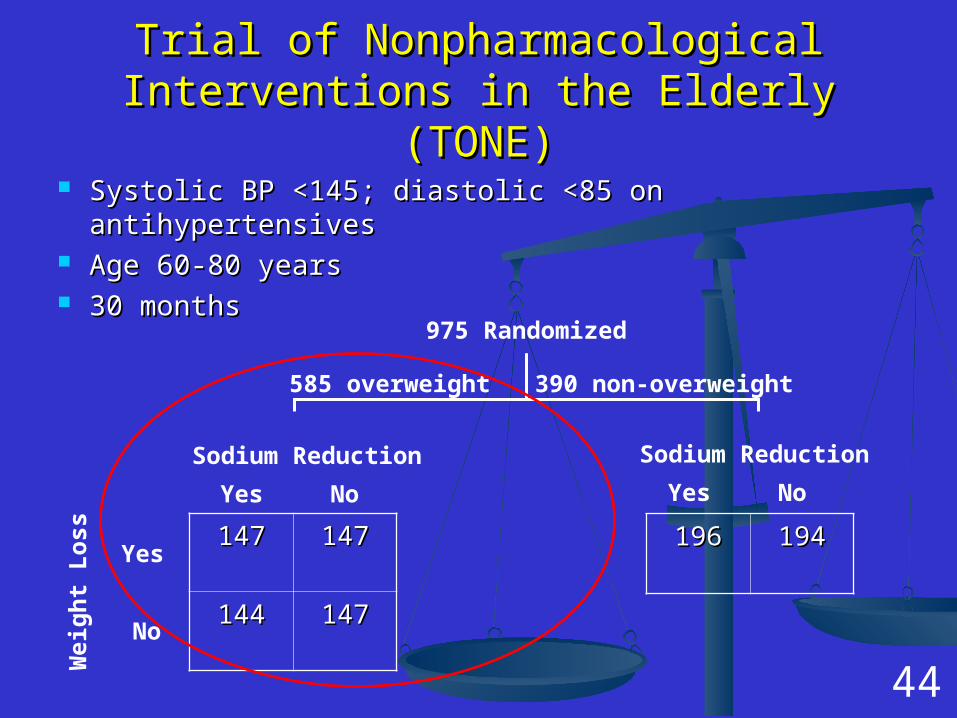
Trial of Nonpharmacological Interventions in Trial of Nonpharmacological Interventions in the Elderly (TONE)the Elderly (TONE)
Systolic BP <145; diastolic <85 on antihypertensivesSystolic BP <145; diastolic <85 on antihypertensives Age 60-80 yearsAge 60-80 years 30 months30 months
147147 147147
144144 147147
Wei
gh
t L
oss
Yes
No
Sodium Reduction
Yes No
975 Randomized
585 overweight 390 non-overweight
Sodium Reduction
Yes No
196196 194194
44

TONE ResultsTONE Results 66.5 ± 4.6 years; BMI 3166.5 ± 4.6 years; BMI 31
Whelton PK. JAMA 1998;279:839
45

TONE ResultsTONE Results
Whelton PK. et al. JAMA 1998;279:839 46

Villareal DT et al. Villareal DT et al.
Mild to Moderate Physical FrailtyMild to Moderate Physical Frailty Age ≥ 65Age ≥ 65 BMI BMI ≥ 30≥ 30 Randomized into control (n = 10) or Randomized into control (n = 10) or
Diet + Exercise (n = 17)Diet + Exercise (n = 17) 26 weeks26 weeks
Villareal DT et al. Arch Int Med 2006;166:860; Villareal DT et al. Am J Clin Nutr 2006;84:1317. 47

ResultsResults Control 71 ± 4 yrs, Diet + Exercise 69 ± 5 Control 71 ± 4 yrs, Diet + Exercise 69 ± 5
yrsyrs BMI 39 ± 5BMI 39 ± 5 % Weight Loss % Weight Loss
Control +0.5% ± 2.8%; Control +0.5% ± 2.8%; Diet + Exercise – 8.4% ± 5.6%Diet + Exercise – 8.4% ± 5.6%
Physical Test Performance ScorePhysical Test Performance Score 2.6 ± 2.5 vs. 0.1 ± 1.0 (p=.001)2.6 ± 2.5 vs. 0.1 ± 1.0 (p=.001)
Peak Oxygen ConsumptionPeak Oxygen Consumption Functional status questionnaire scoreFunctional status questionnaire score Physical function domains of SF-36Physical function domains of SF-36
Villareal DT et al. Arch Int Med 2006;166:860 48
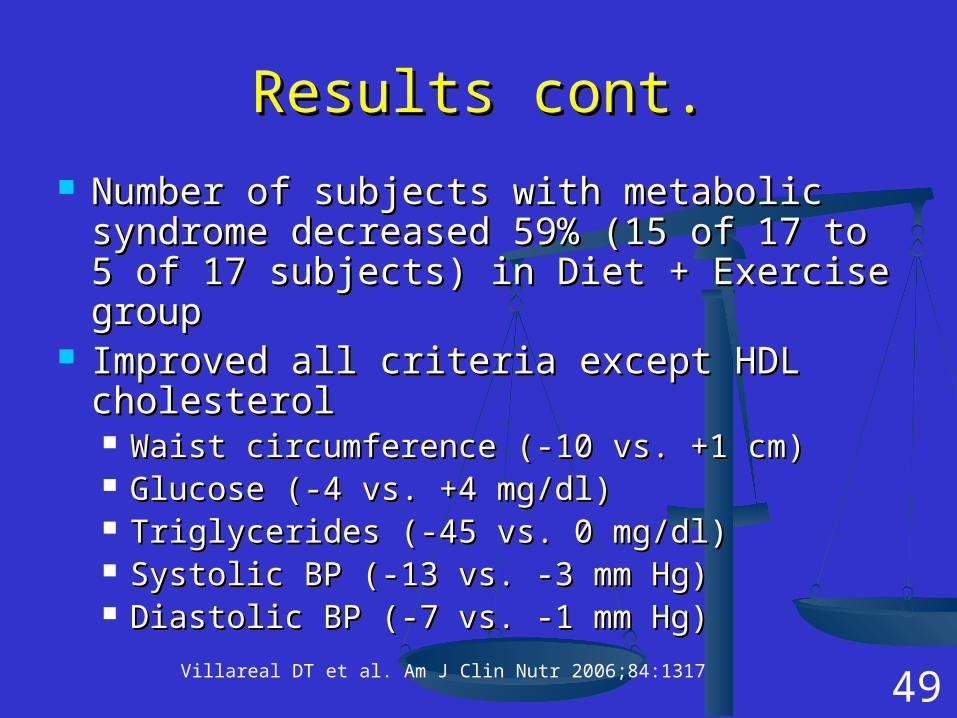
Results cont.Results cont.
Number of subjects with metabolic Number of subjects with metabolic syndrome decreased 59% (15 of 17 to 5 syndrome decreased 59% (15 of 17 to 5 of 17 subjects) in Diet + Exercise groupof 17 subjects) in Diet + Exercise group
Improved all criteria except HDL Improved all criteria except HDL cholesterol cholesterol Waist circumference (-10 vs. +1 cm)Waist circumference (-10 vs. +1 cm) Glucose (-4 vs. +4 mg/dl)Glucose (-4 vs. +4 mg/dl) Triglycerides (-45 vs. 0 mg/dl)Triglycerides (-45 vs. 0 mg/dl) Systolic BP (-13 vs. -3 mm Hg)Systolic BP (-13 vs. -3 mm Hg) Diastolic BP (-7 vs. -1 mm Hg)Diastolic BP (-7 vs. -1 mm Hg)
Villareal DT et al. Am J Clin Nutr 2006;84:1317 49
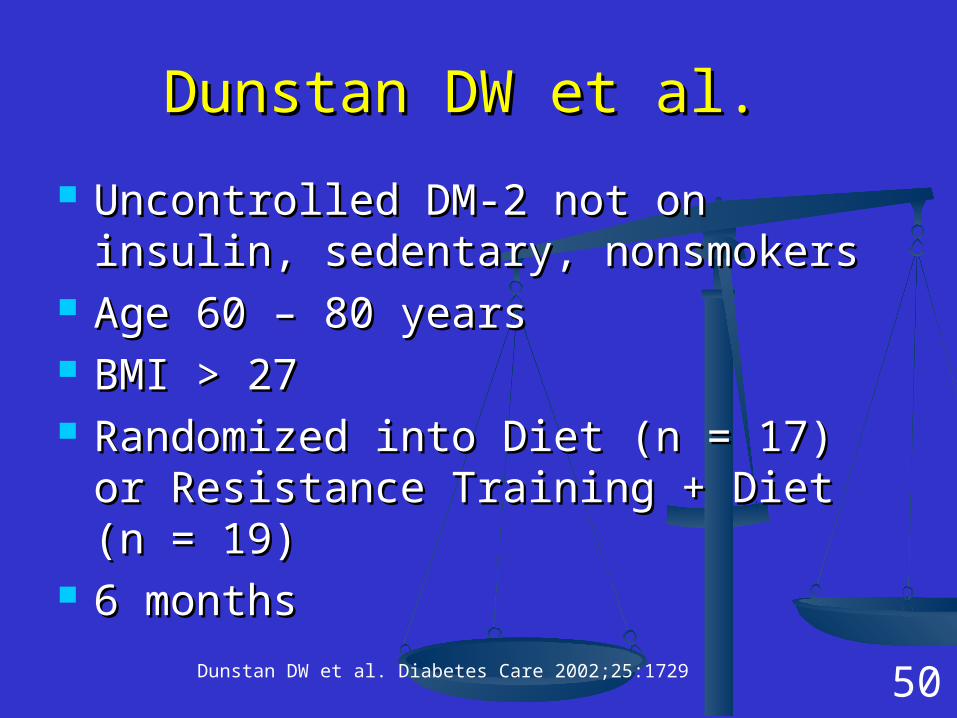
Dunstan DW et al. Dunstan DW et al.
Uncontrolled DM-2 not on insulin, Uncontrolled DM-2 not on insulin, sedentary, nonsmokerssedentary, nonsmokers
Age 60 – 80 yearsAge 60 – 80 years BMI BMI > 27> 27 Randomized into Diet (n = 17) or Randomized into Diet (n = 17) or
Resistance Training + Diet (n = 19)Resistance Training + Diet (n = 19) 6 months6 months
Dunstan DW et al. Diabetes Care 2002;25:1729 50

ResultsResults
67.6 ± 5.2 years; BMI 31.5 ± 3.767.6 ± 5.2 years; BMI 31.5 ± 3.7 % change in HbA1C % change in HbA1C
RT + Diet – reduced 1.2% ± 1.0%RT + Diet – reduced 1.2% ± 1.0% Diet – reduced 0.4% ± 0.8%Diet – reduced 0.4% ± 0.8%
51

Bone DensityBone Density
TONE TONE total body and femoral neck BMD total body and femoral neck BMD
declined significantly in all groupsdeclined significantly in all groups In a regression model controlling for In a regression model controlling for
baseline BMD and biomarkers of bone baseline BMD and biomarkers of bone metabolism, weight loss was associated metabolism, weight loss was associated with decrease in total body BMD (p with decrease in total body BMD (p = .003)= .003)
DunstanDunstan Total body BMD – no change in RT + Diet; Total body BMD – no change in RT + Diet;
Decreased in Diet (p <.05)Decreased in Diet (p <.05)Daly RM et al. Osteoporos INt 2005;16:1703; Chao D et al. J Am Geriatr Soc 2000;48:753 52

Lean Body Mass (LBM)Lean Body Mass (LBM)
Physical Activity, Inflammation, and Physical Activity, Inflammation, and Body Composition TrialBody Composition Trial Lower body fat and LBM in Diet + Exercise Lower body fat and LBM in Diet + Exercise
vs. Controlvs. Control VillarealVillareal
Lower fat mass; no change in fat-free mass Lower fat mass; no change in fat-free mass in Diet + Exercise vs. Controlin Diet + Exercise vs. Control
DunstanDunstan Lower fat mass in both groups; lower LBM Lower fat mass in both groups; lower LBM
in Diet; higher LBM in RT + Dietin Diet; higher LBM in RT + Diet
53

StudiesStudies Type of OutcomeType of Outcome Clinical Clinical SignificanceSignificanceMetabolicMetabolic ClinicalClinical Self-Self-
ReportReport
Osteoarthritis Osteoarthritis or physical or physical functionfunction
ADAPTADAPT √√ √√ ProbablyProbably
Physical Activity, Physical Activity, Inflammation, Inflammation, and Body and Body Composition TrialComposition Trial
√√ √√ ProbablyProbably
Villareal et alVillareal et al √√ √√ √√ ProbablyProbably
54
Summary of Weight Loss Trials by Summary of Weight Loss Trials by Primary Focus, Beneficial Primary Focus, Beneficial
Outcomes, and Clinical SignificanceOutcomes, and Clinical Significance
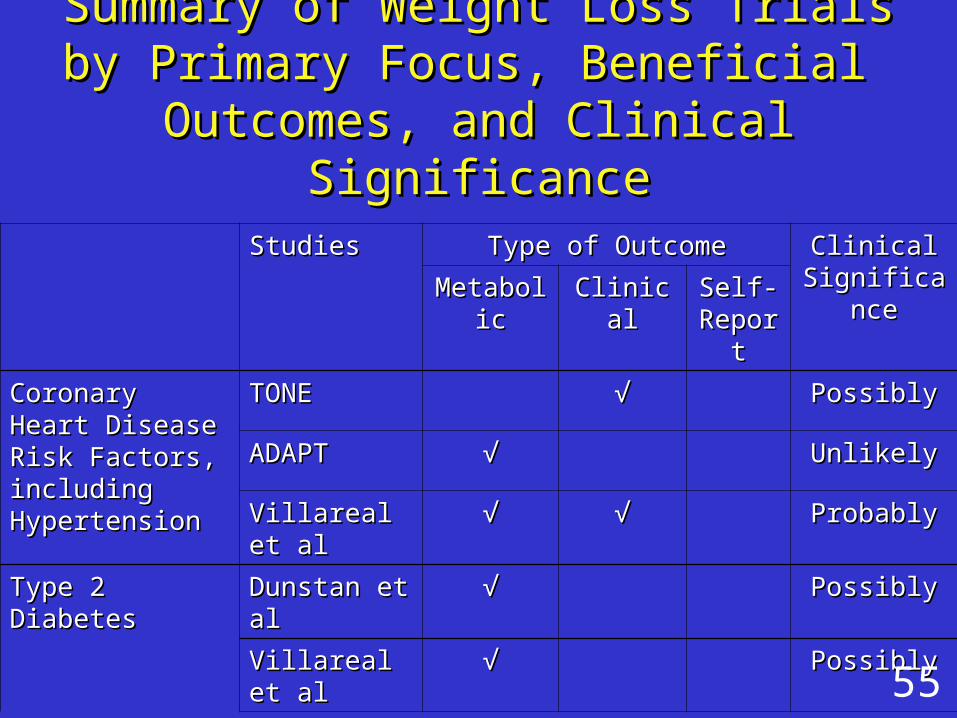
StudiesStudies Type of OutcomeType of Outcome Clinical Clinical SignificanceSignificanceMetabolicMetabolic ClinicalClinical Self-Self-
ReportReport
Coronary Heart Coronary Heart Disease Risk Disease Risk Factors, including Factors, including HypertensionHypertension
TONETONE √√ PossiblyPossibly
ADAPTADAPT √√ UnlikelyUnlikely
Villareal et alVillareal et al √√ √√ ProbablyProbably
Type 2 DiabetesType 2 Diabetes Dunstan et alDunstan et al √√ PossiblyPossibly
Villareal et alVillareal et al √√ PossiblyPossibly
55
Summary of Weight Loss Trials by Summary of Weight Loss Trials by Primary Focus, Beneficial Primary Focus, Beneficial
Outcomes, and Clinical SignificanceOutcomes, and Clinical Significance

Studies Type of Outcome Clinical SignificanceMetabolic Clinical Self-
Report
Bone Density
TONE √ Unlikely
Dunstan et al √ Unlikely
Lean Body Mass
Physical Activity, Inflammation, and Body Composition Trial
√ Possibly
Villareal et alet al √ Possibly
Dunstan et alet al √ Possibly
Summary of Negative OutcomesSummary of Negative Outcomes
56
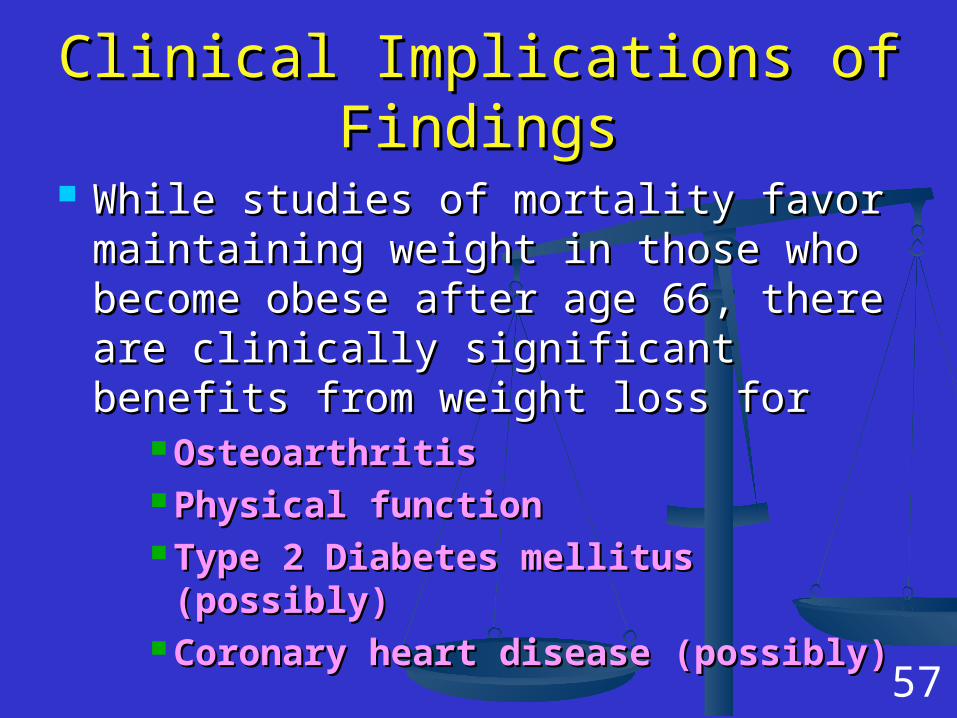
Clinical Implications of FindingsClinical Implications of Findings
While studies of mortality favor While studies of mortality favor maintaining weight in those who maintaining weight in those who become obese after age 66, there become obese after age 66, there are clinically significant benefits from are clinically significant benefits from weight loss forweight loss for
OsteoarthritisOsteoarthritis Physical functionPhysical function Type 2 Diabetes mellitus Type 2 Diabetes mellitus (possibly)(possibly)
Coronary heart disease (possibly)Coronary heart disease (possibly)57

Implications Implications
Clearly, decisions about whether or Clearly, decisions about whether or not to institute a weight reduction not to institute a weight reduction intervention should be made on a intervention should be made on a individualized basis, consideringindividualized basis, considering weight historyweight history health prioritieshealth priorities medical statusmedical status
58

Current status of the issue: Current status of the issue:
A VA work group is developing a white A VA work group is developing a white paper that includes paper that includes recommendations for primary recommendations for primary health care providers for adults 70 health care providers for adults 70 and older and older with a BMI >30 kg/mwith a BMI >30 kg/m22..
The question: Should all patients over The question: Should all patients over the age of 70 with a BMI > 30 kg/mthe age of 70 with a BMI > 30 kg/m22 be offered a weight loss and be offered a weight loss and exercise program?exercise program?
59

Important considerations Important considerations
Co-morbidities considered should Co-morbidities considered should include:include:
Osteoarthritis and osteoporosisOsteoarthritis and osteoporosis DementiaDementia Diabetes and metabolic syndromeDiabetes and metabolic syndrome HypertensionHypertension Cardiovascular conditionsCardiovascular conditions
60
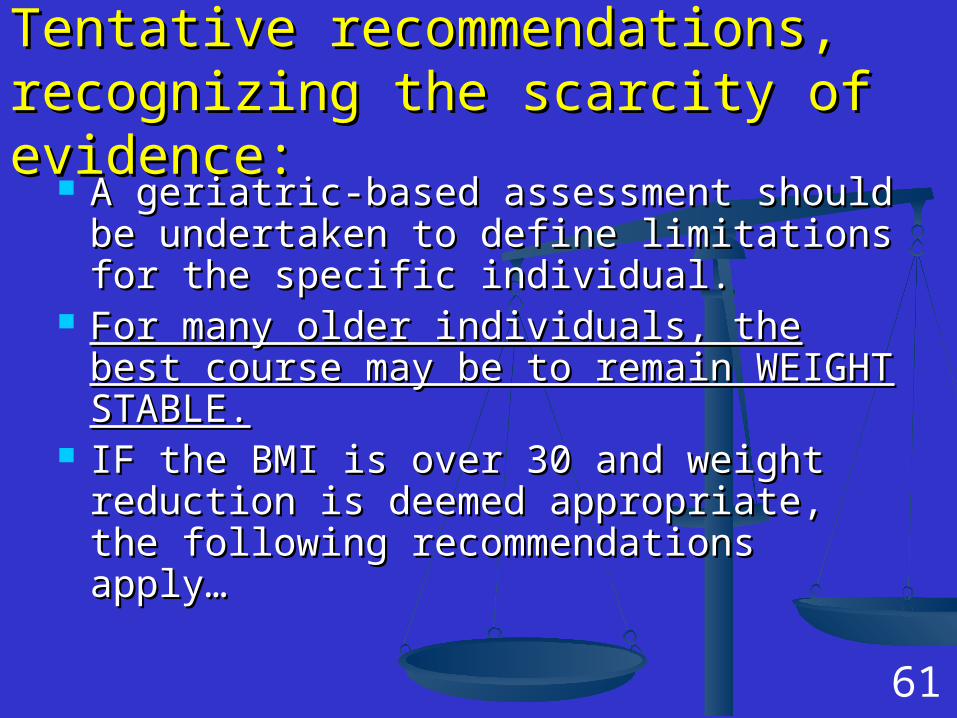
Tentative recommendations, Tentative recommendations, recognizing the scarcity of evidence:recognizing the scarcity of evidence:
A geriatric-based assessment should A geriatric-based assessment should be undertaken to define limitations be undertaken to define limitations for the specific individual. for the specific individual.
For many older individuals, the best For many older individuals, the best course may be to remain WEIGHT course may be to remain WEIGHT STABLE.STABLE.
IF the BMI is over 30 and weight IF the BMI is over 30 and weight reduction is deemed appropriate, the reduction is deemed appropriate, the following recommendations apply…following recommendations apply…
61

Tentative recommendationsTentative recommendations : : Most older adults embarking on a weight Most older adults embarking on a weight
reduction regimen would benefit from reduction regimen would benefit from and should receive and should receive nutrition counselingnutrition counseling. .
Dietary calorie reduction should be Dietary calorie reduction should be modestmodest, no more than 500 kcal per day , no more than 500 kcal per day
All intervention programs should include All intervention programs should include a a resistance training exerciseresistance training exercise component. component.
Calorie restriction alone should be Calorie restriction alone should be avoided.avoided. 62
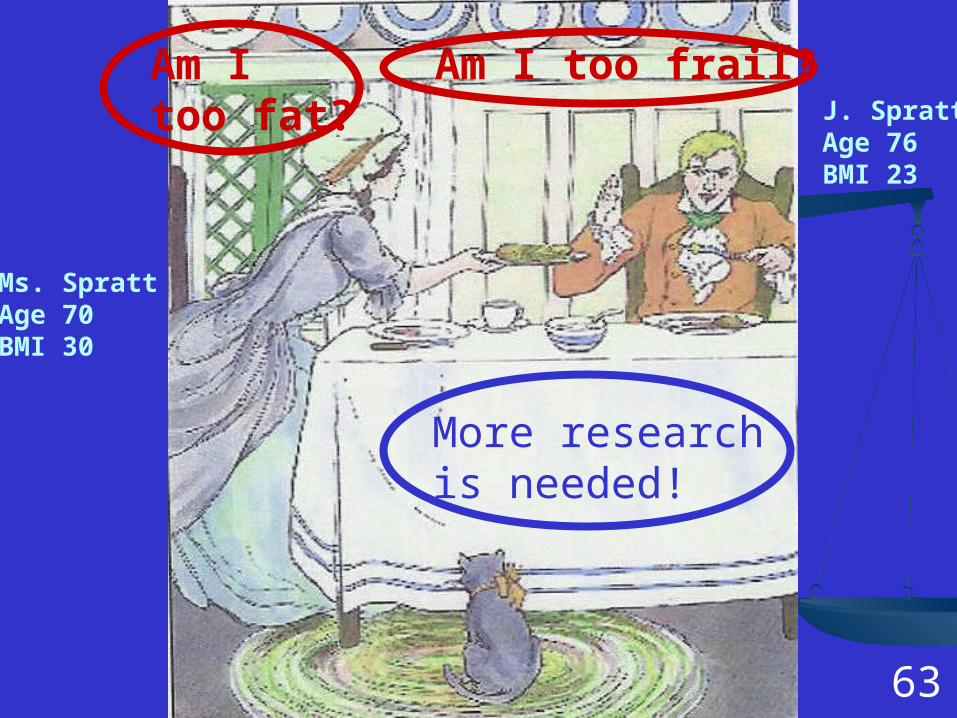
Ms. SprattAge 70BMI 30
J. SprattAge 76BMI 23
63
Am I too frail?Am I too fat?
More research is needed!