management of salt-affected soils in the ncew shemshemia
TRANSCRIPT

Management of Salt-affected Soils in the NCEW "Shemshemia" Irrigation Scheme in
the Upper Gash Valley of Eritrea
By Mhereteab Tesfai, Virginia Dawod and Kiflemariam Abreha
March 2002
DCG Report No. 20


Management of Salt-affected Soils in the NCEW ‘Shemshemia’ Irrigation Scheme in the Upper Gash
Valley of Eritrea.
Mehreteab Tesfai, University of Asmara, Eritrea. Virginia Dawod, University of Asmara, Eritrea. Kiflemariam Abreha, Ministry of Agriculture, Eritrea.
Report No. 20 March 2002

The Drylands Coordination Group (DCG) is an NGO-driven forum for exchange of practical experiences and knowledge on food security and natural resource management in the drylands of Africa. DCG facilitates this exchange of experiences between NGOs and research - and policy-making institutions. The DCG activities, which are carried out by DCG members in Ethiopia, Eritrea, Mali and Sudan, aim to contribute to improved food security of vulnerable households and sustainable natural resource management in the drylands of Africa. The founding DCG members consist of ADRA Norway, CARE Norway, Norwegian Church Aid, Norwegian People's Aid, The Stromme Foundation and The Development Fund. Noragric, the Centre for International Environment and Development Studies at the Agricultural University of Norway provides the secretariat as a facilitating and implementing body for the DCG. The DCG’s activities are funded by NORAD (the Norwegian Agency for Development Cooperation). This Report was carried out on behalf of the DCG branch in Eritreaa, which includes the National Confederation for Eritrean Workers, Norwegian Church Aid in Eritrea, Ministry of Agriculture and University of Asmara. Extracts from this publication may only be reproduced after prior consultation with the DCG secretariat. The findings, interpretations and conclusions expressed in this publication are entirely those of the author(s) and cannot be attributed directly to the Drylands Coordination Group.
Tesfai, M., V. Dawod, K. Abresha. Drylands Coordination Group Report No. 20 (March, 2002) Drylands Co-ordination Group P.O. Box 5001 N-1432 Ås Norway Tel.: +47 64 94 98 23 Fax: +47 64 94 07 60 Internet: http://www.drylands-group.org ISSN: 1503-0601 Photo credits: T. A. Benjaminsen, Gry Synnevåg, DCG Eritrea. Cover design: Spekter Reklamebyrå as, Ås Printed at: Rotator, Ås.

Drylands Coordination Group
iii
CONTENTS FOREWORD IV
ACRONYMS V
1. INTRODUCTION 1 1.1. BACKGROUND 1 1.2. JUSTIFICATION 2 1.3. OBJECTIVES OF THE STUDY 4 1.4. TERMS OF REFERENCE 4
2. DESCRIPTION OF THE STUDY AREA 5 2.1 LOCATION & TOPOGRAPHY 5 2.2 POPULATION 6 2.3. CLIMATE 9 2.4. GEOLOGY 10 2.5. HYDROLOGY & DRAINAGE 10 2.6. NATURAL VEGETATION & LAND USE 11
3. METHODS OF STUDY 12 3.1. FIELD SURVEY & MEASUREMENTS 12 3.2. SOIL AND WATER SAMPLING 14 3.3 LABORATORY ANALYSIS OF SOILS & WATER 14
3.4. SOIL CLASSIFICATION & MAPPING METHODS 15 3.5. INTERVIEWS AND GROUP DISCUSSIONS 16
4. FINDINGS & DISCUSSION 16 4.1. THE FARMING SYSTEMS ANALYSIS 16
4.1.1 Historic review of Shemshemia farm 17 4.1.2. Crop production systems 18 4.1.3. Irrigation water quality 21 4.1.4. Production constraints 23 4.2.1. Soil physical properties of the Shemshemia area 25 4.2.2. Soil chemical properties of the Shemshemia area 33
4.3. PROBLEM SOILS IN THE SHEMSHEMIA AREA 43 4.3.1. Characteristics of the sodic soils (black alkaline soils) in Shemshemia 44 4.3.2. Effects of sodicity on soil properties 44 4.3.3. Effects of sodicity on plant growth 45
4.4. RECLAMATION & MANAGEMENT OF THE SODIC SOILS 45 4.4.1. Chemical methods for soil amendments 45 4.4.2. Physical and biological methods for soil amendments 47 4.4.3. Socio-economic considerations 48
4.5. CHECKLIST FOR PREVENTION OF NON-SODIC AREAS 49 5. CONCLUSIONS 49
6. REFERENCES 51
ANNEXES 53 ANNEX A: SOIL PROFILE DESCRIPTIONS 53 ANNEX B: SOIL PHYSICAL AND CHEMICAL DATA 56 ANNEX C. CHECKLIST QUESTIONNAIRE 62
Management of Soil-affected Soils
iv
FOREWORD
Irrigated agriculture is one of the approaches used to increase food production so that
food security can be achieved in the semi-arid and arid regions of the world such as
Eritrea. In Eritrea, there are potential rivers draining into the southwestern lowlands of
the country where extensive flat plains are found, among others, in the area of the
Shemshemia irrigation scheme in the upper Gash valley. A study on the management of
salt affected soils in the Shemshemia irrigation scheme was carried out to determine the
magnitude of salt problems and to propose solutions.
This study report gives an insight into the background of the research project followed
by a description of the study area. Consequently, the methods and approaches used to
probe the problems in the Shemshemia irrigation scheme have been extensively
explained.
The findings of the report review the historical development of the Shemshemia farm
and then describe the crop production, land use types and land coverage in the study
area. Water and soil data collected in the field and in the laboratory are interpreted and
discussed. The possible methods to amend the soil problems (i.e. sodicity) from the
technical as well as the socio-economic point of view are considered and discussed.
Furthermore, a checklist has been prepared for prevention of sodic problems developing
in the currently non-sodic areas in Shemshemia and its vicinity.
The consultant team would like to thank NORAD for financing this research,
NORAGRIC and DCG (Norway) staff for co-ordination. We gratefully acknowledge
also the members of NCEW and DCG (Eritrea) in general and in particular to Mr.
Amanuel Negassi, Mrs. Laraine Black and others for their support in facilitating the
administrative and financial issues related to the research project.
We are indebted to all staff of the soil laboratory of the research department in the MoA
and also to water laboratory staff in the WRD at the MoLWE. Our special thanks goes
to Mr. Tekle Yemane in the WRD, Eritrea for assisting in the production of the digital
land use and soil use maps.
Asmara, March 2002
Salinity/sodicity project team

Drylands Coordination Group
v
ACRONYMS
CEC Cation Exchange Capacity
DCG Drylands Co-operation Group
DF Development Fund
EC Electrical Conductivity
EPLF Eritrean Peoples’ Liberation Front
ESP Exchangeable Sodium Percentage
FAO Food and Agriculture Organisation of the United Nations
GoE Government of Eritrea
GPS Global Positioning System
GIS Geographic Information System
MoA Ministry of Agriculture
MoLWE Ministry of Land, Water and Environment
MoME Ministry of Mines and Energy
NCEW National Confederation of Eritrean Workers
NPA Norwegians Peoples’ Aid
NORAD Norwegian Agency for Development Co-operation
NORAGRIC Centre for International Environment & Development Studies
PBS Percent Base Saturation
SAR Sodium Adsorption Ratio
SAS Salt Affected Soils
TDS Total Dissolved Solids
ToR Terms of Reference
UoA University of Asmara
WRD Water Resources Department


Drylands Coordination Group
1
1. INTRODUCTION 1.1. BACKGROUND
Norwegian People’s Aid (NPA) and the Development Fund (DF) have worked with
the National Confederation of Eritrean Workers (NCEW) to develop peasants’ co-
operatives and vocational training in south-western Eritrea for many years. Part of
this co-operation has been the development of the Shemshemia irrigation scheme in
the Gash-Barka region.
The farmers in the Shemshemia area have complained of increasing salinity and/or
sodicity in their fields and requested that the problem required study.
Recommendations on how to rehabilitate those areas already affected, and on how to
apply control measures to prevent further recurrence of salinity and/or sodicity
problems in other uncultivated fields were required. A team of local consultants from
the University of Asmara (UoA) and Ministry of Agriculture (MoA) was put together
to carry out the study.
During a preliminary field visit to the Shemshemia farm in May 2001, the consultant
team observed that poor drainage plus structural degradation of the soils in the
irrigated fields had retarded the growth of citrus plants and reduced crop yields.
Moreover, dark coloured soil surface layers, containing dispersed clay and organic
particles were observed in some parts of uncultivated fields in the form of slick spots.
These are characteristic of sodic soils. It was realised that the main problems in the
area may not be due to salinity but rather to sodicity. Preliminary field samples had
also shown low salinity levels (in most cases) i.e. electrical conductivity (ECe) <1 dS
m-1, and most of the soils measured a pH >8.5. This indicates that the soils have high
sodium content, which has led to structural degradation and poor drainage of applied
irrigation water.
The team prepared a proposal for the study and carried out a detailed field survey and
measurements in September 2001, the results of which are presented in this report,
together with recommendations for correction and prevention of the problem.
Management of Soil-affected Soils
2
1.2. JUSTIFICATION
Soil is one of the most important natural resources, especially in a country like
Eritrea where agriculture is the main source of income and employment for the
majority of the population (70-80% of its 3.5 million people) (World Bank, 1994).
Nonetheless, information on Eritrean soils in general and salt-affected soils in
particular, is very scarce and lacks ground verification. Eritrean soils are suffering
from various forms of degradation leading to decreasing productivity. Water and
wind erosion are the most severe forms of degradation, but the soils are also
physically degraded through compaction and structural breakdown, biologically
degraded through removal of organic matter, chemically degraded through
continuous removal of nutrients and through development of salt-affected soils
particularly in the more arid areas or areas under irrigation.
Salt-affected soils (SAS) refer to both saline and sodic soils, which are classified
under the major groups of Solonchaks and Solonetz respectively in the FAO-Unesco
(1988) soil classification system. These soils contain appreciable quantities of soluble
salts and/or salt-containing compounds in their profile that adversely affect the
growth of most crop plants.
Salt-affected soils are not uncommon in arid and semi-arid regions of the world
where annual precipitation is insufficient to meet potential evapotranspiration. The
salts may originate mainly from dissolution or weathering of rocks and soil minerals,
groundwater or human activities such as use of saline water for irrigation purposes.
Salty water from groundwater tables within a few meters of the surface can move
upwards by capillary action to the soil surface, where the water evaporates and leaves
behind the salts.
The arid and semi-arid climate of Eritrea, especially in the Red Sea coastal plains and
in the western lowlands, is a favourable environment for the development of saline
and sodic soils (Maskey, 1984). According to the FAO (1994) general soil
classification map of Eritrea (at a scale of 1:3,000,000) solonchak soils cover about
11,200 km2 of land, predominately found along the Red Sea coastal zones of the
country. However, the occurrence of solonetz soils is not reported on this map,
presumably because they are only found in small and localised areas, and also due to
the fact that this map has not been verified on the ground.

Drylands Coordination Group
3
High levels of salts in soils reduce plant growth and crop yield in a number of ways.
There may be direct toxic effects, especially from elements such as sodium, chlorine
or boron. Ionic imbalances may also be created in plants. Plants may also suffer from
physiological drought as water availability to plants is lowered due to the high
osmotic potential of salty water in the soil solution (FAO, 1988).
Sodic soils contain a high exchangeable sodium percentage (>15%) and also have a
high pH value (mostly in the range of 8.5 to 10). These soils seriously affect plant
growth in a number of ways. Sodium ions have an adverse effect on plant metabolism
and nutrition. Most plants cannot tolerate the high pH associated with sodic soils.
The high pH leads to low micronutrient availability and decreases the availability of
macronutrients such as calcium, magnesium and phosphorus. Accumulation of
elements such as sodium, molybdenum and boron in plants can result in direct
toxicity and may lead to plant injury or reduced growth and eventually death in more
sensitive plants. Anions associated with sodicity such as high HCO3− are directly
toxic to plants.
In sodic soils, plants suffer from oxygen deficiency as sodium disperses clays and
organic matter leading to structural breakdown of the soil particles and consequent
low porosity (FAO, 1988). Dispersed organic matter may accumulate at the surface
of poorly drained areas and impart a black colour; hence the common name ‘black
alkali soils’. Moreover, these properties reduce water infiltration and aeration in the
soils and hinder the growth of roots, which may eventually lead to loss of arable land
unless appropriate ameliorative measures are taken for the reclamation of the soils.
The Government of Eritrea is committed to enhancing food security in the country
and to developing sustainable agricultural production (via developing large-scale
irrigation schemes) in the coastal plains and in the western lowlands of the country.
However, most of the irrigated soils in these areas are predominantly affected by salts
presumably from the weathering of rocks and/or minerals containing salt compounds
and/or the use of saline or sodium–rich groundwater for irrigation. Therefore, there is
an urgent need to investigate and learn how to deal with the problem of salt-affected
soils before larger areas are put under irrigation. In other words, managing the SAS
requires a detail description of the nature and properties of the soils and water.
Saline soils may be controlled with careful irrigation management, but sodic soils
(with structural collapse) present a much more difficult management problem.

Management of Soil-affected Soils
4
Because the reclamation of sodic soils involves not only leaching out the soluble salts
but also replacing exchangeable sodium with calcium and improving the physical
properties of the soils. It is, therefore, essential that signs of developing SAS,
particularly sodicity problems, be recognised at an early stage, so that preventative
control measures can be put in place and on time.
1.3. OBJECTIVES OF THE STUDY
The main objectives of this study are:
i) To determine the extent and degree of soil and water salinity and/or sodicity
in Shemshemia irrigation scheme;
ii) To recommend possible soil chemical, physical, and/or biological
amendments in order to improve or reclaim the salt-affected soils;
iii) To produce an appropriate preventative checklist for unaffected sodic areas so
as to prevent any future salt and/or sodium hazards in the Shemshemia
irrigation scheme and its vicinity.
1.4. TERMS OF REFERENCE
In brief, the ToR for the consultants and assistants are shown in Table 1.1. The
detailed ToR for each consultant are appended in this report. The ToR of the study
team is to fulfil (at least) the three main objectives of this study, which have been
mentioned above. These objectives are to be meet by carrying out field surveys and
measurements and by conducting laboratory analysis.
The study team consisted of four members with some additional help from field
assistants and labourers. The team members had slightly different responsibilities as
shown in the above table. The 4th team member i.e. Mr. Mussie Ykeallo was only
involved in the preliminary field survey and proposal writing.

Drylands Coordination Group
5
Table 1.1. Terms of reference for the various consultants and assistants involved in the project.
Consultants & assistants Institution ToR
Dr. Mehreteab Tesfai † University of Asmara Overall organisation, preparation of
project proposal, field surveys, data
collection and analysis, report writing
Dr. Virginia Dawod ‡ University of Asmara Preparation of project proposal, data
analysis, report writing
Mr. Kiflemariam Abraha ‡ Ministry of Agriculture Field survey, data collection and
analysis and report writing.
Mr. Mussie Ykeallo ‡ University of Asmara Preliminary field survey and proposal
preparation.
Field assistants University of Asmara Field data collection and recording.
Daily labourers Shemshemia farm Preparing profile pits and auger holes.
† Team leader, ‡ Team members.
2. DESCRIPTION OF THE STUDY AREA
This chapter describes the physical and socio-economic settings of the Shemshemia
area in particular and the upper Gash sub-region in general.
The state of Eritrea is divided into six administrative regions (equivalent to
provinces). The Gash-Barka region is one of the six administrative regions, and
includes, among others, the upper Gash sub-region (equivalent to a district). The
upper Gash sub-region comprises 19 administrative units (locally called ‘kebabi
mimihidar’) which consist of about 104 villages.
2.1 LOCATION & TOPOGRAPHY
The study area, i.e. the Shemshemia farm, is located approximately 45 km along the
road southwest of Barentu, the capital of Gash-Barka region. More precisely, it is
found about 9 km west of Tokombia, (the administrative town of the upper Gash sub-
region) on a left junction from the road to Barentu (see Map 2.1).
Map 2.2 shows the topographic base map of the Shemshemia farm. The Shemshemia
farm is situated along the valley of the River Gash, which forms the western

Management of Soil-affected Soils
6
boundary of the farm. The largest part of the study area consists of a flat to almost
flat plain covering the western and central section of the farm. To the eastern part of
the project farm there is a range of hills and undulating plains. The Shemshemia farm
lies at a latitude 14°47’N and longitude of 37°28’E, at an average elevation of 885 m
above sea level.
The Shemshemia farm covers an area of about 125 hectares. A substantial part of the
area is devoted to the cultivation of citrus plants and cereals (mainly sorghum and
maize). A small area of land is occupied by houses for residences of farm workers
and workshops used for training and maintenance of farm implements. These
buildings, however, were demolished in May 2000 during the Ethiopian invasion into
the western lowlands of Eritrea.
2.2 POPULATION
The population of the upper Gash is estimated to be 50,000 people in about 12,800
households. The population density is about 10 persons per km2, which is low
compared to other regions of Eritrea. Various ethnics groups live in the area, namely
‘Kunama’, (the dominant ethnic group) followed by ‘Tigrigna’ and ‘Tigre’. The main
local languages spoken in the region are ‘Kunama’, ‘Tigrigna’ and ‘Tigre’.
Like other parts of Eritrea, most of the population (>80%) living in the rural areas
around Shemshemia is engaged in traditional agriculture, mainly growing crops and
raising cattle. The proportion of cultivated land to farming population ranges from
2.2 to 2.7 person ha-1 (MoA, 2000). At present, the Shemshemia farm has about 15
permanent workers. The average farm household size is about 5 persons. A large
number of daily labourers are employed during the peak season, particularly during
harvesting of the fruit and grains.

Drylands Coordination Group
7
Map 2.1. Location of the Shemshemia area in the upper Gash sub-region, Eritrea.

Management of Soil-affected Soils
8
Map 2.2. Topographic base map of Shemshemia study area.

Drylands Coordination Group
9
2.3. CLIMATE
Eritrea is divided into six agro-ecological zones on the basis of topography, climate
and soil conditions (FAO, 1997). These are moist lowland, arid lowland, semi-desert,
moist highland, arid highland and sub-humid zones.
Table 2.1. Climate (long-term) data at Barentu meteorological station.
Month Air temperature, °C Relative
humidity, %
Rainfall
mm
PET
mm
Maximum Minimum Mean
January 32.5 14.8 23.7 45 0 126
February 31.1 14.6 22.9 40 0 133
March 35.1 16.1 25.6 37 1 173
April 37.3 18.8 28.1 36 10 191
May 37.5 19.1 28.3 36 22 207
June 34.0 17.0 25.5 41 74 183
July 30.3 17.8 24.1 65 142 144
August 29.1 17.0 23.1 69 178 134
September 32.0 17.1 24.6 55 78 149
October 34.3 18.0 26.2 47 8 176
November 34.0 17.0 25.5 49 3 130
December 32.3 15.7 24.0 48 0 116
Mean 33.3 16.9 25.1 47.3 - -
Total - - - - 506 1,862
PET: Potential evapotranspiration.
Source: Civil Aviation Authority of Asmara, Eritrea.
Table 2.1 shows long-term climate data collected at Barentu meteorological station,
which is the nearest station to the Shemshemia farm (45 km away). The mean air
temperature varies from 22.9°C in February to 28.3°C in May. The relative humidity
is above 50% in the rainy months of July to September. More than 90% of the rain
falls in the four months of June to September (Table 2.1). The potential
evapotranspiration exceeds the rainfall in most months except in August, which is the
wettest month of the year. The period from December to February can be considered
as the dry season.
Based on the above climate information and topographic conditions of the study area, the Shemshemia area falls within the moist lowland agro-climatic zone of Eritrea.

Management of Soil-affected Soils
10
2.4. GEOLOGY
In general, the geology of the Gash catchment is characterised by Pre-Cambrian
rocks, composed of amphibole schist, chlorite schist, cordiorite schist and other
schists with porphyritic, lateritic or phylitic structure. Chlorite schist are intercalated
by diorites and diabases (MoME, 1999).
Very little information is available on the specific geology of the Shemshemia area.
According to the report of the MoME (1999), large areas around Shemshemia farm
are formed of meta-sedimentary rocks, which consist of both clastic and chemically
precipitated sediments. The clastic sediments are characterised by faint lamination
and bedding. These sediments consist of phyllites, slates, siltstone, sandstone,
mudstone and patches of quartzite, which are all metamorphosed.
2.5. HYDROLOGY & DRAINAGE
Eritrea has five main river drainage systems. These are Mereb–Gash, Setit, Barka-
Anseba, the Red Sea river basins, and the enclosed Danakil basin (see Table 2.2).
The Mereb-Gash and Setit river basins (mainly found in the Gash-Barka region) drain
into the Nile basin.
The Gash River flows along the western boundary of the Shemshemia farm. Its upper
catchment stretches from the southern part of the central highlands of Eritrea to the
southwestern part of the country and its lower catchment extends to the Sudanese
border. The river flow originates mostly in the upper highlands of Eritrea. The Gash
River is ephemeral but carries a significant quantity of sediment. The river deposits
large amounts of suspended sediments in the southern and western plains of Eritrea
(e.g. in the Aligheder irrigation schemes), and in the Kassala plains in eastern Sudan.
The river discharge is less than 0.5 m3 s-1 during the low flow season, i.e. from
October to May, while during the rainy months, especially in July and August, the
river water level reaches up to 10 m. It fluctuates appreciably, even within a span of
24 hours. During peak flows, the river may discharge about 500 3 s-1. In the past
decade or so, the river has flooded the low-lying areas of the Shemshemia farm
(Andemariam, pers. comm, 2001).

Drylands Coordination Group
11
Table 2.2. Mean annual flow volume of the major drainage basins, their catchment area and rainfall.
Drainage
basin
Catchment
area
Catchment Annual flow
Vol.
Mean annual
runoff coeff.
(km2) Annual rainfall
(mm)
Rainfall vol.
(Mm3)
(Mm3) -
Red Sea 44,689 300-400 13,406.7 444 0.152
Barka-Anseba 39,506 350-400 13,827.1 41 0.045
Mereb-Gash 23,455 500-700 11,727.5 532 0.003
Denkil basin 10,532 200 2,106.4 135 0.033
Setit basin 7,517 600-700 4,888.1 49 0.010
Total 125,699 - - - -
Source: WRD (2000).
The groundwater level along the Gash riverbank varies from 3 to 4 m during the
rainy seasons and deeper (about 8 m) in the dry season. The Shemshemia irrigation
scheme gets its supply of water from a well, which is found close to the riverbank of
Gash. Water is drawn by centrifuge motor pumps which have a diameter of 150-200
mm and a horse power of 60-80.
Gully erosion is seriously threatening the non-irrigated land in the northern part of
the farm. The cause of erosion is perhaps the excessive runoff from the nearby hills
and low vegetal cover of the upland areas. Soil and water conservation measures are
urgently needed in order to arrest the soil erosion and to promote better soil moisture
conditions so that these lands could be utilised for cropping and/or pasture.
2.6. NATURAL VEGETATION & LAND USE
The upper Gash area is covered with different species of woodland trees, shrubs and
herbaceous plants. Some of the dominant trees and shrubs found in the region are
species of Acacia, Balanites, Boswellia, Tamarix and Zyziphuse and riverine trees
such as doum palm (Hyphayene thebaica). The leaves of Dum plants are used for
making sacks, baskets, mats and other crafts.
In the past decades, the doum plants covered a large part of the area along the Gash
riverbank. However, the expansion of irrigation schemes along the riverbanks has
negatively affected the riverine forests, since a large number of trees (e.g. doum
plants) have been deforested from the area. As a result, riverbank erosion is more
severe particularly during the rainy season. Protection of the remaining doum plants

Management of Soil-affected Soils
12
and growing grass species along the riverbank may help mitigate the problem of bank
erosion along the Gash River.
The main land use in the Shemshemia farm is irrigated agriculture, dominantly for
citrus crops and some vegetables. A small area of the valley land is used for growing
sorghum and maize using the seasonal rainfall. There are riverine tree species
(notably doum plants) growing along the bank of the Gash River. Uncultivated lands
covered with sparse grass vegetation are found in the sodic areas, in the marginal
lands near the foothills and in the plains along the river valley.
3. METHODS OF STUDY This chapter explains the methodology used in this study i.e. field survey and
measurements, sampling and laboratory analysis, the soil classification and mapping
methods adopted, the contents of questionnaires, and the group discussions held with
the farmers working in the Shemshemia farm.
3.1. FIELD SURVEY & MEASUREMENTS
The study team made a preliminary visit to the Shemshemia area on 25th to 27th May
2001 to make initial observations and become familiarised with the area. A project
proposal and timetable of activities was then drawn up. The main field survey took
place from 13th to 19th September 2001. The field survey was delayed from the
original plan of July, due to the exceptionally heavy rains in the study area from June
to August.
Prior to conducting the main fieldwork, all available information regarding the
environment of the Shemshemia area and materials such as previous study reports,
topographic maps covering the area were collected, compiled and studied. A
topographic map of the Shemshemia farm (on a scale of 1:2,000 with 1 meter contour
intervals) was acquired from NCEW (1997). This map was used a base map for the
fieldwork.
Firstly, the boundary of the Shemshemia farm was verified in the field by tracing

Drylands Coordination Group
13
the benchmark (BM) points (which were already installed in the field) as well as by
plotting the BM points onto the topographic base map. This ground verification was
carried out by locating the BM points on the Universal Transverse Mercator (UTM)
grid using the Global Positioning System (GPS-315) (see Table 3.1). Major land
units comprising irrigated and currently not irrigated land units were then identified
during the field survey.
Profile pits and auger holes were selected on each land unit and their positions were
also located on a UTM grid using the GPS. Afterwards, the locations of the pits and
auger holes were transferred to the base map.
Because of the uniform flat terrain and great homogeneity of the soils, the
observations were made at an overall density of about 1 per 5 ha of land. In total, 5
profile pits and 10 auger holes were dug and prepared for soil descriptions and
analysis. The dimensions of the soil pits were about 1.5 meter deep and 1.5 meter
long unless otherwise prevented by the presence of rock, large stones or very coarse
gravel. Exposed sites such as river cuts were also used to study the morphology of the
riverine soils.
Table 3.1. Soil profile and auger hole location sites in Shemshemia farm.
Profile/auger no. UTM-eastings UTM-northings Elevation, m a.s.l.
P1 331899 1638490 900
P2 331031 1638266 920
P3 331000 1637940 885
P4 331348 1637592 905
P5 330900 1638300 915
A1 331649 1636854 885
A2 330993 1637961 890
A3 331067 1637883 887
A4 331375 1637767 885
A5 331188 1637727 887
A6 331116 1637705 882
A7 331014 1637674 888
A8 330997 1637703 885
A9 330998 1637704 885
A10 330998 1637704 885
SP: Profile pits, A: Auger holes.
The soils were described according to the international standards laid down by FAO:
Guidelines for soil profile descriptions (FAO, 1990). General information on the
Management of Soil-affected Soils
14
characteristics of the profile sites as well as information related to the identification
and soil horizon descriptions was recorded on standard soil description forms
conforming to the FAO-ISRIC (1998) soil coding sheet. Most of the field data such
as slope and elevation were measured, and others such as land use, vegetation and
erosion were observed and recorded on the data sheet.
Some soil properties were determined in the field, e.g. soil texture by feel method
and soil colour by comparison with Munsell soil colour charts (Munsell, 1994), and
calcium carbonate contents of the soils by adding 10% dilute HCl to the soil material.
A drainage problem could lead to sodicity problems and should be assessed if an
effective sodicity reclamation method is to be suggested. In this respect, the
infiltration rates of the soils in the non-irrigated fields (in the sodic land) were
measured using a double ring infiltrometer and saturated hydraulic conductivity of
the soils was tested following the inverse auger hole method (Landon, 1991).
3.2. SOIL AND WATER SAMPLING
A total of 37 soil samples were collected from 5 profiles and 10 auger holes for
laboratory analysis. These constituted 15 samples from the pedogenetic horizons in
the soil profiles and 22 samples from topsoil and subsoil depth by augering. The
samples were sent to the soil science research laboratory of the MoA for further soil
physical and chemical analysis to complement the field observations and analysis.
In order to ascertain the possible causes of sodicity problems in the fields from the
water aspect, water samples were taken from the river Gash (at three replication
sites), from the open hand dug well and from the irrigation canals in the fields. A
total of five water samples were taken from these sites using a manual bottle
sampling method. The bottle samples had a capacity of 500 ml.
3.3 LABORATORY ANALYSIS OF SOILS & WATER
Before the soil analysis in the laboratory, the soil samples were air-dried, crushed in a
porcelain mortar and passed through a 2 mm sieve. The method of analysis used for

Drylands Coordination Group
15
each of the determined soil properties is described in Table 3.2.
The water samples were brought to the water analysis laboratory of the Water
Resources Department at the Ministry of Land, Water and Environment. The water
samples were analysed for EC, pH, soluble cations and soluble anions following the
standard procedures by HACH (1986). Table 3.2. Soil physical and chemical analysis methods used in this study. †
Soil property Method of analysis
Particle size analysis (ϕ) Bouyoucos hydrometer
Soil texture (class) USDA textural triangle
Bulk density (g cm-3) Core method
Infiltration rate (cm hr-1) Double ring infiltrometer
Saturated hydraulic conductivity (m day-1) Inverse auger hole method
Soil reaction, pH (H2O) pH meter, soil: water (1:2.5)
Electrical conductivity (d S m-1) EC meter, soil: water (1:2.5)
Organic carbon (%) Walkey-Black method
Total Nitrogen (%) Macro Kjeldhal digestion
Available P (mg kg-1) Olsen’s method
Available K+ (mg kg-1) Flame emission Photometer
Exchangeable Na+ (meq 100g-1) Flame emission Photometer
Exchangeable cations of Ca 2+ and Mg 2+ (meq 100g-1) EDTA Titration of 1M ammonium
Cation exchange capacity (meq 100g-1) 1M ammonium acetate extract
CaCO3 (%) Rapid titration method
HCO3- (mg l-1) Titration with 0.005M sulphuric acid
SO42 - (mg l-1) Extract with barium chloride
Cl- (mg l-1) Silver nitrate method
CO32- (mg l-1) Titration method
† (Klute, 1986; John, et al., 1996).
3.4. SOIL CLASSIFICATION & MAPPING METHODS
The soils of the Shemshemia farm were classified on the basis of their
morphological, physical and chemical properties. Some of these properties were
measured and/or observed in the field, while others depend on the results of
laboratory analysis.
The boundaries of the land units (identified in this study) and contour lines were
digitised using a digitizer. Distances between the BM points were taken from the

Management of Soil-affected Soils
16
survey map while angles between the points were measured by a protractor. These
data were entered into the database of the Geographic Information System (GIS)
ARC/INFO program. Then, all attributes data were processed and analysed by
ARC/View GIS version 3.2. Finally a digital topographic base map of Shemshemia
farm (Map 2.2.), land use types (Map 4.1.) and soil use map (Maps 4.2.) were
produced on a scale of 1:2,000.
3.5. INTERVIEWS AND GROUP DISCUSSIONS
A checklist questionnaire was prepared in line with the objectives of this study. The
contents of the questionnaire include data on socio-economic conditions, crops
grown and yield, land use types, soil conditions, water management, agricultural
problems and their possible solutions and development potentials of the Shemshemia
area (see Annex C).
Groups of people comprising old and young were interviewed to gather information
on the history of the farm, especially its development and production problems
encountered since the establishment of the farm. Group discussions were also carried
out with 15 farm workers to identify the key problems facing the Shemshemia farm
and their possible solutions.
4. FINDINGS & DISCUSSION
This chapter details the data collected during the field surveys, observation and
interviews made in the study area and also discusses the results of the soil and water
analysis conducted in the laboratory.
4.1. THE FARMING SYSTEMS ANALYSIS
The following sections of this chapter describes the farming system of the
Shemshemia area; the historical development of the farm, cropping systems and
water quality analysis. Furthermore, the report identifies production problems of the
Shemshemia farm and their possible solutions from the farmers’ perspectives.

Drylands Coordination Group
17
4.1.1 Historic review of Shemshemia farm
In the early 1940s, an Italian national, Armando Motanti, carried out a reconnaissance
geological survey for mineral exploration in the Shemshemia area. He used to mine
precious minerals like gold in the Shemshemia area and its vicinity, and used to sell
several quantities of gold to Asmara and other towns in Eritrea. Later, the gold
mining was not encouraging, presumably due to low resources of gold in the area. He
then planned to establish irrigation schemes in the Shemshemia area.
In 1947, Mr. Motanti cleared the land and ploughed the lower fields along the course
of the Gash River in the Shemshemia area. He dug water well near the bank of the
river to irrigate the fields. He then planted banana seedlings but the seedlings did not
grow well due to high salt contents in the soils (Andegiorgis Embaye, pers. comm.,
2001). The banana plants (Musa sp.) are generally recommended to grow on soils
with no salt problems (i.e. ECe < 1 d S m-1) (Landon, 1991).
Later on, other Italian concessionaires used to grow vegetable crops such as tomato,
onion, and pepper in Shemshemia area using a canal irrigation system. The vegetable
production from the area and its surroundings was quite high and made a significant
contribution to the domestic market supply. During good years, large quantities of
fresh vegetables were even exported to neighbouring countries like Sudan and other
regions to the Gulf States and Europe. In addition, field crops such has cotton and
groundnuts were also grown using the seasonal rainfall.
In 1974, with the outbreak of the socialist revolution in Ethiopia, many of the Italian
concessionaires who were engaged in agriculture and other activities left to their
home country and some to other parts of the world. During this period, the armed
struggle for Eritrean independence was highly intensified. In the late 1970s, a large
part of the Eritrean territory was emancipated from the military regime of Ethiopia by
the Eritrean Peoples’ Liberation Front (EPLF), the ruling party now in the country.
The Shemshemia farm was virtually at a standstill from 1974 to 1991. In 1991, when
Eritrea got its independence after 3 decades of war for liberation, the GoE gave a
high priority to developing the agricultural sector under its Recovery and
Rehabilitation Programmes. The government invited all private sectors and other
development agencies to rehabilitate the agricultural infrastructure, which had been
demolished in the various parts of the country. Interest was shown in the irrigation

Management of Soil-affected Soils
18
schemes in the upper Gash valley, among which was the Shemshemia irrigation
scheme.
In 1992, an Eritrean investor, Afeworki Berhane, embarked on developing the
Shemshemia irrigation farm. He renewed the motor-pumped well and constructed a
feeder road that links (the Shemshemia farm) to the road network of Barentu to
Tokombia. He also developed several farm roads within the farmlands. He planted a
large number of orange trees and some lemon trees in the irrigated fields. He also
used to cultivate sorghum and maize crops during the rainy season.
In 1995, the Shemshemia irrigation farm was transferred from private ownership to
the National Confederation of Eritrean Workers (NCEW). The NCEW has repaid to
Mr. Afeworki Berhane all costs he incurred to develop the Shemshemia farm. The
staff of NCEW supervises and manages the farm. At present, there are about 15
permanent workers who are engaged in the farm. Apart from this, a large number of
daily labourers are also employed during the peak cropping seasons (such as
ploughing, harvesting of fruits and vegetables and also during harvesting of grains).
4.1.2. Crop production systems
The farming system in Shemshemia is characterised mainly by commercial irrigated
agriculture. However, most of the farmers in the surrounding area are engaged in
small-scale subsistence farming in a crop/livestock mixed production system using
simple traditional farming implements.
In Eritrea, land is under the domain of the state. Since 1991, the GoE has been
actively encouraging the development of commercial irrigated agriculture through
adopting the concession system. Since then, many concessionaires have been offered
land (for e.g. in the southwestern lowlands of Eritrea) on a long lease-based system at
nominal cost. Most of these concessionaires have developed small-scale irrigation
schemes along the course of Gash River basin, where they grow high value
vegetables and fruit crops.
The upper Gash valley is considered as one of the best arable agricultural lands in the
southwestern lowlands of Eritrea. In the upper Gash, particularly in the Shemshemia
farm, citrus fruits such as oranges and lemons are largely grown and vegetable crops
such as tomato and pepper in a smaller area. All these crops are grown using
irrigation. Field crops such as sorghum, maize and bulrush millet (Pennisetum

Drylands Coordination Group
19
typhoides) as the cereals and oilseed crops (such as sesame and groundnuts) are also
grown using the rainfall in the months of July to September.
In Shemshemia farm, there are about 5,500 orange trees, which were planted in 1996.
The spacing between the rows and within the rows is 6 m by 6 m. The lemon fields
constitute about 400 trees and their spacing is the same as for the orange trees. The
lemon trees were planted in 1998. During the same year, about 130 grape fruits were
also planted in the irrigated fields. Mineral fertilisers (such as DAP and Urea) and
organic fertilisers are seldomly applied in the citrus fields.
Table 4.1 presents the land use types and land coverage in the Shemshemia area. At
present, about 10% of the total area in Shemshemia is under irrigated land but a large
part of the area (about 56%) is not yet cultivated mainly due to the constraints
mentioned in the following subsections. Table 4.1. Land use and land coverage by ha and % in Shemshemia area.
Land use Coverage
ha %
Sodic land 5.3 3.3
Rainfed land 13.2 8.2
Irrigated land 15.9 9.9
Riverine forest land 35.6 22.1
Uncultivated land 90.8 56.5
Total 160.8 100.0

Management of Soil-affected Soils
20
Map 4.1. Land use types of Shemshemia area.

Drylands Coordination Group
21
4.1.3. Irrigation water quality
Table 4.2 shows the water sample site locations in the Shemshemia farm. These
samples were taken during the rainy season and after the season was over. Water
samples were collected at predetermined depths in the well, in the Gash riverbed and
from the canals in the fields.
Table 4.2. Water sample sites locations in Shemshemia irrigation scheme. Sample sites UTM co-ordinates Altitude
(m) a.s.l.
Eastings Northings
W1 330856 1637742 930
C1 331075 1638276 920
R1 330900 1638300 915
R2 330735 1637470 910
R3 331200 1637090 910
W1: well water
C1: canal water
R1: river water (replication 1)
R2: river water (replication 2)
R3: river water (replication 3)
The main criteria used for judging the quality of irrigation water are its chemical
characteristics such as the total salt concentration (as measured by electrical
conductivity) and relative proportions of cations as expressed by sodium adsorption
ratio (SAR) and other water characteristics such as bicarbonate and boron contents.
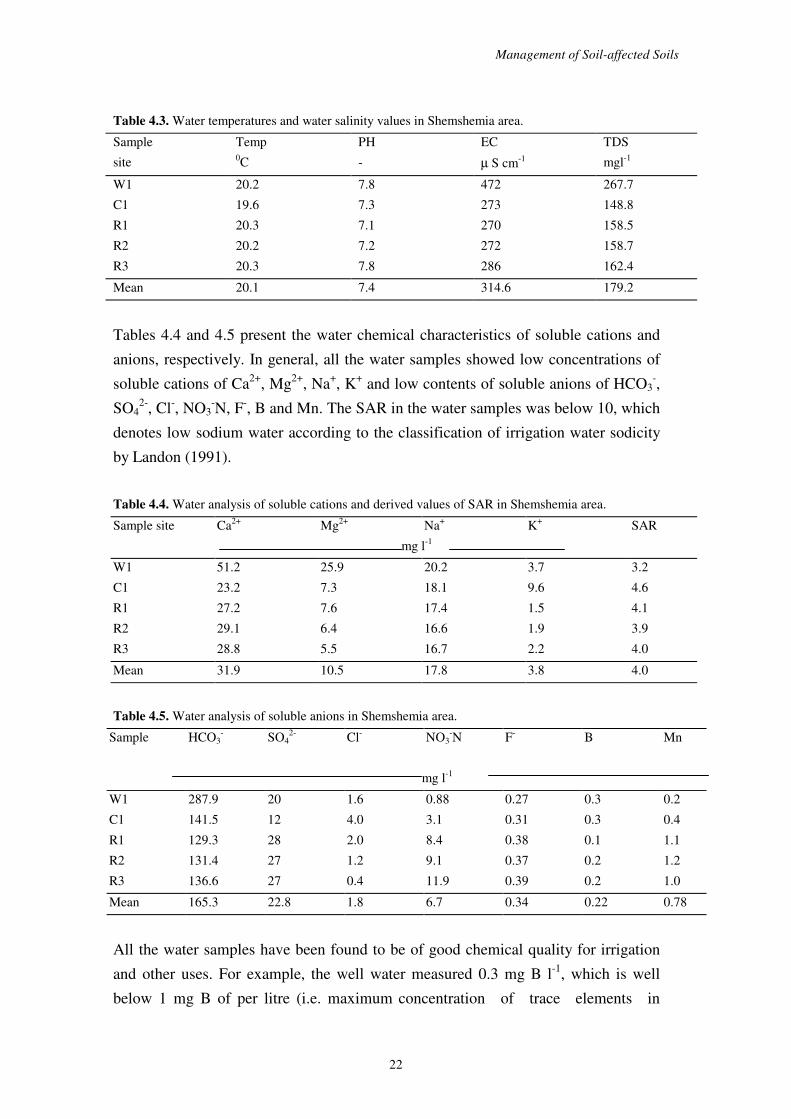
Table 4.3 shows the water temperature, pH and salinity values of the water analysis
carried out in the laboratory. The pH values ranged between 7.1 to 7.8 which falls in
the normal pH range (i.e. 6.5 to 8.4) for irrigation water. The Gash river water (the
primary source of irrigation water for the Shemshemia farm) has an EC below 300 µ
S cm-1, 200 mg l-1 of TDS and a SAR of 4, which are rated as low saline and low
sodium water. The river water therefore has no degree of restriction on use for
irrigation.
All the water samples measured in the range of 270 to 472 µ S cm-1, which are low to
moderate salt contents according to classification of irrigation water salinity by
Landon (1991). These waters can be used to irrigate low to moderate salt tolerant
crops such as citrus and vegetables.
Management of Soil-affected Soils
22
Table 4.3. Water temperatures and water salinity values in Shemshemia area.
Sample
site
Temp 0C
PH
-
EC
µ S cm-1
TDS
mgl-1
W1 20.2 7.8 472 267.7
C1 19.6 7.3 273 148.8
R1 20.3 7.1 270 158.5
R2 20.2 7.2 272 158.7
R3 20.3 7.8 286 162.4
Mean 20.1 7.4 314.6 179.2
Tables 4.4 and 4.5 present the water chemical characteristics of soluble cations and
anions, respectively. In general, all the water samples showed low concentrations of
soluble cations of Ca2+, Mg2+, Na+, K+ and low contents of soluble anions of HCO3-,
SO42-, Cl-, NO3
-N, F-, B and Mn. The SAR in the water samples was below 10, which
denotes low sodium water according to the classification of irrigation water sodicity
by Landon (1991).
Table 4.4. Water analysis of soluble cations and derived values of SAR in Shemshemia area.
Sample site Ca2+ Mg2+ Na+ K+ SAR
mg l-1
W1 51.2 25.9 20.2 3.7 3.2
C1 23.2 7.3 18.1 9.6 4.6
R1 27.2 7.6 17.4 1.5 4.1
R2 29.1 6.4 16.6 1.9 3.9
R3 28.8 5.5 16.7 2.2 4.0
Mean 31.9 10.5 17.8 3.8 4.0
Table 4.5. Water analysis of soluble anions in Shemshemia area.
Sample HCO3- SO4
2- Cl- NO3-N F- B Mn
mg l-1
W1 287.9 20 1.6 0.88 0.27 0.3 0.2
C1 141.5 12 4.0 3.1 0.31 0.3 0.4
R1 129.3 28 2.0 8.4 0.38 0.1 1.1
R2 131.4 27 1.2 9.1 0.37 0.2 1.2
R3 136.6 27 0.4 11.9 0.39 0.2 1.0
Mean 165.3 22.8 1.8 6.7 0.34 0.22 0.78
All the water samples have been found to be of good chemical quality for irrigation
and other uses. For example, the well water measured 0.3 mg B l-1, which is well
below 1 mg B of per litre (i.e. maximum concentration of trace elements in

Drylands Coordination Group
23
irrigation water) as suggested by FAO (1985 and 1988). Normally, citrus fruits are
sensitive at B contents of 0.5-0.75 mg l-1. All the water samples measured below 4
meq Cl l-1 and this indicates no chloride toxicity.
4.1.4. Production constraints
The main agricultural production constraints in the Shemshemia irrigation scheme
and their possible solutions are presented in Table 4.6. These problems were
identified during the interviews and groups discussion made with the farmers in the
area. Table 4.6. Production constraints and possible solutions in Shemshemia farm.
Constraints Possible solutions
Shortage of labourers �� Use of mechanised farming practices
Shortage of irrigation water pipe-lines �� Construct water reservoirs in the central part of the
farm to irrigate the upper and middle parts of the fields
Salty land �� Apply physical treatments like deep ploughing
River bank erosion �� Protection of riverine trees and growing grass sp.
along the riverbanks
Lack of motorised sprayers �� Provide motorised sprayers for pest control
Shortage of farm implements �� Provide hand farm tools
Poor farm management �� Employ qualified farm manager and develop
monitoring and evaluation systems
The suitability of irrigation water for agricultural development, however, is not only
evaluated by the quality of the irrigation water but also by the soil quality (like nature
and extent of salts in the soil profile and drainage conditions of the soils) and plant
characteristics.
One of the main production problems in the Shemshemia farm was the salty land
(Table 4.6). In order to manage these lands, a detail description of the soils of the
Shemshemia area is presented hitherto, followed by possible reclamation and
management practices for the sodic areas and prevention methods for non-sodic areas
in the Shemshemia area and its vicinity.

Management of Soil-affected Soils
24
Map 4.2. Soil types of Shemshemia area

Drylands Coordination Group
25
4.2. The Soils of Shemshemia Area This section describes the range of characteristics of the soil units identified in the
study area and their classification category.
The soils of the Shemshemia farm were studied in September 2001, with the aim of
assessing their main characteristics and their variability over the study area.
Based on field observations, the soils of the Shemshemia farm are broadly classified
into two main soil-mapping units (see Map 4.2). These are soils developed on
irrigated lands and those on currently non-irrigated lands (see profile descriptions in
Annex A).
The surveyed area covered irrigated and non-irrigated sites within the farm. The
irrigated sites were planted with citrus trees. The non-irrigated sites could be divided
into two: land that is cultivated during the rainy season and land that is currently
uncultivated due to its salt problem (which was in fact identified as a sodicity
problem). One uncultivated site on the riverbank was also sampled. The non-irrigated
areas were being used as grazing or fallow land at the time of sampling. The grazing
area in the northern part of the site was severely grazed, while that from the centre of
the site southwards to the River Gash was covered with long grass. There were some
bare patches without grass where a dark brown crust was seen on the surface of the
soil. It had not rained for almost two weeks prior to carrying out the field visit, yet on
the grazing areas and to some extent on the citrus plantation, water still remained on
the surface in these bare areas, it had not drained or infiltrated into the soil. The soils
in these areas also showed poor workability and were difficult to dig.
4.2.1. Soil physical properties of the Shemshemia area
a) Irrigated soils: The irrigated soils are all soils being used for cultivating fruit and
vegetable crops. These soils are mainly used for growing citrus fruits like orange,
lemon and grapes. The irrigated soils are found in the citrus fields located in the
middle part of the Shemshemia project farm. Water is pumped from the well that is
located near the river Gash and transported by water pipes to irrigate the fields. In the
fields, each citrus plant receives water by watering the soil around it, a kind of basin-
furrow irrigation system. The irrigated soils cover around 16 ha (which is 10% of the
total land area) in Shemshemia.

Management of Soil-affected Soils
26
The irrigated soils are developed on the almost flat plains of the Gash river valley.
They are presumed to be formed from the weathered parent rock (in situ). The soil
profiles show a well-developed Ap horizon (the plough layer) in the citrus fields. In
addition, a thick subsoil B horizon is found (which have > 1 m thickness), and in the
lower part of the profile, a transitional BC horizon is developed.
In general, the irrigated soils are deep (on average > 1.5 m), dark brown in colour,
structureless at the surface but with weak sub angular to angular blocky structures
developed in the subsurface soils.
Soil texture and colour: Texture is a basic property of soils because it affects both
the physical and chemical properties such as infiltration rate, porosity, fertility, etc,
(FAO, 1979). Table 4.7. Particle size distribution and colour of topsoils (0-0.20 m) in irrigated soil units.
Profile/ Sand Silt Clay Soil texture Soil colour
Auger no. % % % class moist dry
P4 61 24 15 sandy loam 7.5YR 3/3 nd
A1 25 42 33 clay loam nd nd
A2 28 45 27 loam nd nd
A3 32 34 34 clay loam nd nd
A4 65 21 14 sandy loam nd nd
A5 43 32 25 loam nd nd
A6 33 38 29 clay loam nd nd
A7 35 38 27 loam nd nd
Mean 40 34 26 loam - -
nd: not determined.
The particle size distribution and colour of the soils in the top 0.20 m are presented in
Table 4.7. Except for profile pit P4 and auger A4, the soils have more than 25% clay
content. The sand content in P4 and A4 were above 60%, probably because of the
local topography where coarse fragments are eroded from nearby hills and deposited
on these fields. Nonetheless, the soil units are fairly uniform in texture. Most of the
soils are loams with on average 40% sand, 34% silt and 26% clay (Table 4.7).
The colour of the soil profile P4 was dark brown at moist conditions, but the colour
of the soils at dry conditions was not determined since the soils were moist at the
time of survey.

Drylands Coordination Group
27
Soil structure: In the top 20 cm of the profile pit P4, which coincides with the
surface horizon and the plough layer (Ap), the soil particles do not have well-
developed aggregates. This may be due to the effect of tillage and cultivation on the
soils. The soils showed firm consistence under dry conditions and are slightly sticky
under wet conditions.
Further down in the profile (in the subsoil layer), the soils have developed weak
subangular blocky structures, with many termite channels in the soil peds.
Bulk density and porosity: The dry bulk density (BD) of the unit-A soils was
measured by taking undisturbed soil samples using a core sampler in a standard
volume sample ring (135.5 cm3). The samples were taken from each pedogenetic
horizon including the topsoil and subsoil layers.
Table 4.8. Bulk density and porosity of soils at different depth in the irrigated soil unit.
Sample depth
cm
Bulk density
g cm-3
Porosity
%
Risk of compaction
0-20 1.31 50.6 No
20-96 1.37 48.3 No
96-128 1.22 53.9 No
128-164 1.22 53.9 No
Mean 1.28 51.7 -
The bulk density and porosity values of the irrigated soils showed no risk of
compaction in the topsoil as well as in the subsoil depths (Table 4.8)
Drainage and soil moisture: The irrigated soils showed no signs of mottling in their
profile. Thus, the soil profile can be categorised as well drained (drainage class 4).
Moreover, the loamy textural characteristics of this soil unit (see Table 4.7.)
substantiate the drainage class to be well drained.
The external drainage conditions of the irrigated sites show slow run-off on the upper
part of the fields. However, a large part of the site neither receives nor sheds water.
But a small plot of land just above the sodic land was highly saturated with water. In
this plot, the infiltration rate is very slow where water stays on the surface for more
than a few days after irrigation. This may be largely due to the hard compacted
horizon found in the subsoil layer. In this plot, the citrus plants have stunted growth
and have not produced fruits since planting in 1996.
Management of Soil-affected Soils
28
The groundwater level in the irrigated fields varies during the dry and rainy seasons.
At the time of survey (i.e. at the end of rainy season), the depth of the ground water
table in the water well was about 8 m, which is classified as a deep water table. The
moisture conditions of the soils at the time of description were moist throughout the
profile depth.
b) Currently, non-irrigated soils These soils constitute all land currently not irrigated. Part of this area is cultivated for
growing cereals during the rainy season, and part is the marginal areas (including the
barren sodic area), which are covered with sparsely grass vegetation and/or riverine
trees.
The rainfed lands are found in the northern section of the Shemshemia farmland and
the sodic lands along the lower portion of the farm parallel to the bank of the Gash
River. The area under sodic soils forms a strip of land across the farm. In total, the
non-irrigated soils cover about 135 ha (or 56%) of the study area.
The non-irrigated soils are presumed to have developed in situ from parent material
weathering. The soils have developed on nearly flat non-irrigated lands under natural
conditions.
Soil texture and colour: The particle size distribution of the soils is given in Table
4.9. Except for profile pit P1, all the studied profiles and augers showed loamy
texture in the topsoil layer.
Table 4.9. Particle size distribution and colour of topsoils (0-0.20 m) in the non-irrigated units.
Profile/ Sand Silt Clay Soil texture Soil colour
Auger no. % % % class moist dry
P1 58 29 13 Sandy loam nd 7.5 YR 5/8
P2 42 40 18 Loam 7.5 YR 3/2 7.5 YR 4/2
P3 22 49 29 Clay loam 7.5 YR 2.5/2 7.5 YR 3/2
P5 42 46 12 Loam nd nd
A7 35 38 27 Loam nd nd
A8 30 46 24 Loam nd nd
A9 33 46 21 Loam nd nd
A10 35 47 18 Loam nd nd
Mean 37 43 20 Loam - -
The range of particle size distribution (by percentage) is higher for silt, followed

Drylands Coordination Group
29
by sand and clay particles. The colour of the topsoil profiles under dry conditions was
brown, and under moist conditions dark brown. The colour of the soils under moist
conditions was not determined in Profile P1 because the soils were dry throughout
their profile.
Soil structure and consistence: The soil structure in the ploughed layer (in the
rainfed land) was not well developed largely due to the effect of ploughing and
cultivation of crops. Weakly developed blocky structures are found in the surface
soils in the virgin land covered with grass. Subangular blocky structures have
developed underlying the plough layer in the rainfed land unit. In the virgin land unit,
angular blocky and weakly developed prismatic structures were found in the subsoil
layer (i.e. B horizon). This horizon was more than 1 m in thickness.
The profile pits P2 and P3 were very difficult to dig in the underlying topsoil layer,
which contained a compacted subsoil. A weakly developed natric B-horizon with
prismatic structures was noticed in profiles P2 and P3 at the time of carrying out the
soil descriptions. The soils are very deep (>150 cm) and the thickness of the horizons
in the studied profiles did not vary greatly.
In the topsoil layer, the consistency of the rainfed land unit under dry conditions is
loose and slightly sticky under wet conditions. This may be attributed to the high
content of sand (58%). The consistency of the sodic land unit is hard and sticky under
dry and wet conditions of the soils, respectively.
Bulk density and porosity: The dry bulk density of the non-irrigated soils in each
pedogenetic horizon of the studied profiles is shown in Table 4.10. The bulk density
of the soils increased with depth in both profiles. The increase of BD with depth
might be associated with the higher content of sodium in the subsoil than in of the
topsoils (Annex B). The mean value of the BD of the topsoils was 1.11 g cm-3 which
is common for uncultivated soils.
Management of Soil-affected Soils
30
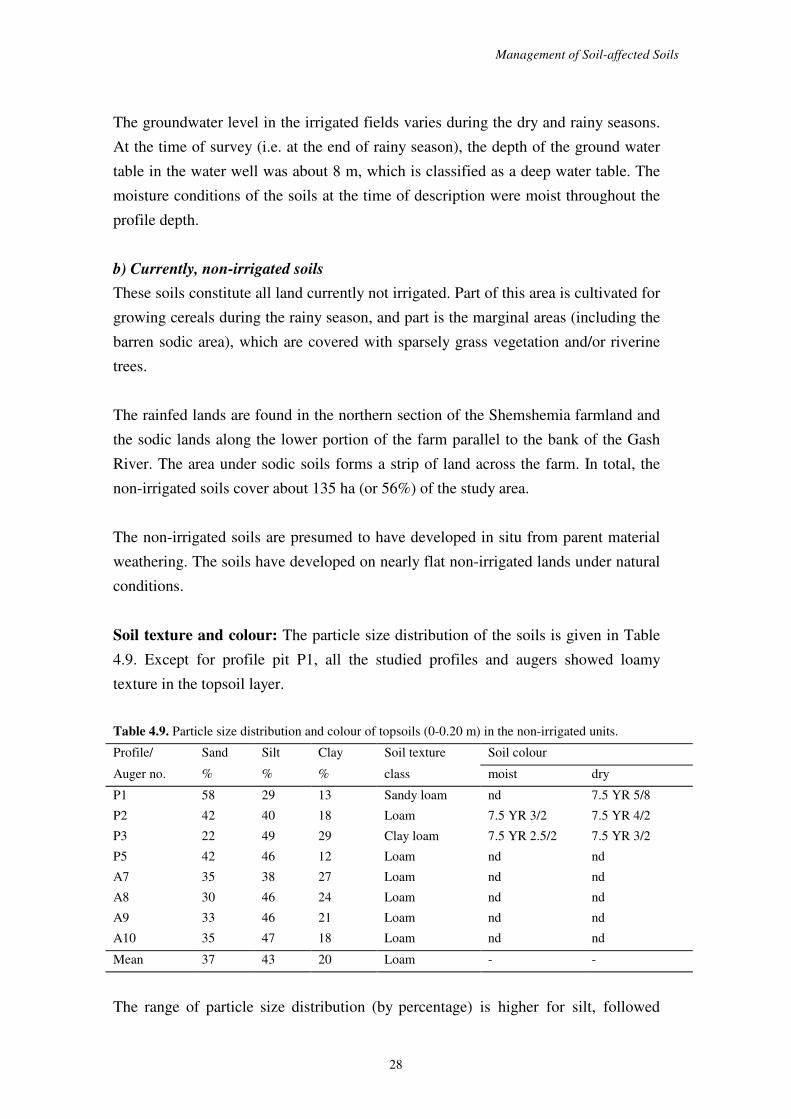
Photo 1. Dispersed organic matter in the surface soils of sodic land in Shemshemia farm.
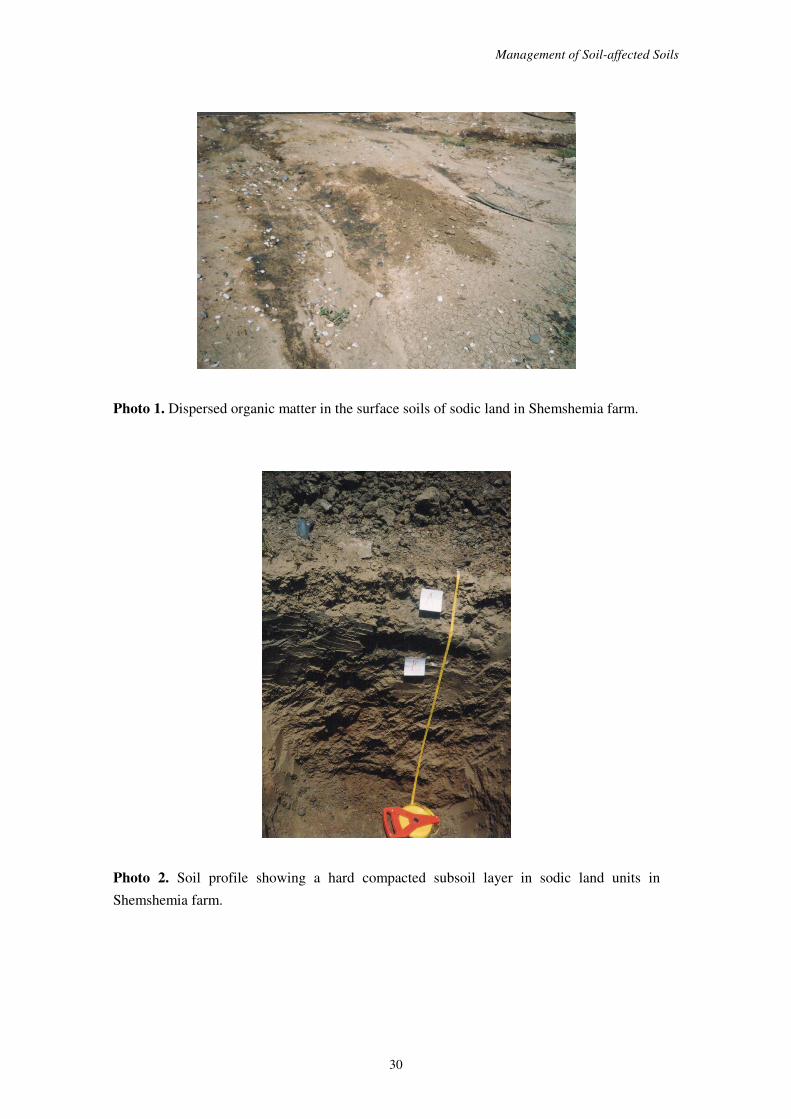
Photo 2. Soil profile showing a hard compacted subsoil layer in sodic land units in
Shemshemia farm.

Drylands Coordination Group
31
Table 4.10. Bulk density of non-irrigated soil unit in the topsoil and subsoil depth.
Depth P2 P3
g cm-3
Mean
Topsoil 1.18 1.05 1.11
Subsoil 1.37 1.25 1.31
Mean 1.28 1.15 1.22
Assuming an average value for particle density of 2.65 g cm-3, the total porosity of
most of the topsoils and subsoils were 58% and 51%, respectively. The risk of
compaction is more likely to occur in the subsoil than in the topsoil layer.
Drainage and soil moisture: The soils developed in the rainfed land unit are
classified as well-drained to excessively drained (drainage class 4 to 5) due to the
large proportion of coarse particles and less fine particles (i.e. clay) and no mottling
was observed in the profiles.
The topsoils in the sodic land unit do not show mottling but in the deeper subsoils
showed mottling conditions. The profile drainage class of this soil unit can be
categorised as poorly drained soils. This is due to the structural degradation
presumably caused by the high exchangeable sodium in the soils.
At the time of soil description, the moisture condition of the soils in the rainfed land
unit was dry throughout the profile, while the moisture condition of the soils in the
sodic land unit was moist throughout the profile. The moisture difference between
the soil units might be attributed to the higher water retention capacity due to the
higher clay content in the sodic land units.
The external drainage condition of the sodic units can be characterised as receiving
water because of their flat topography, while, the rainfed unit in the upper part of the
farm has a shedding water character.
Infiltration and hydraulic conductivity: The infiltration rate of the soils was
measured in the sodic land units where it is assumed that problems of drainage might
occur. The infiltration rate of the soils was measured using a double ring
infiltrometer. Figure 4.1 depicts the relationships of infiltration capacity of the sodic

Management of Soil-affected Soils
32
soils versus cumulative time. The infiltration rate of the soils decreases rapidly at the
beginning and then reaches a constant rate (i.e. the basic infiltration rate was 1.6 cm
hr-1). This rate is moderately slow for surface irrigation system according to the
classification suggested by Landon (1991).
The slow infiltration rate of water into the soils might be associated with the high
ESP. The ill effects of excess sodium on the soil exchange complex imparts
structural instability to the soils giving poor soil physical properties. Moreover, the
infiltration rate of the soils becomes low and the soils have restricted internal
drainage. For this reason, the surface soil layers remain nearly saturated for few days
following irrigation or rain resulting in temporary anaerobic conditions. Soil
properties such soil texture and structure also influence the water intake rate.
Figure 4.1 .The infiltration rate of the sodic land unit in Shemshemia farm.
The saturated hydraulic conductivity of the non–irirgated soils was tested in the sodic
land unit following the inverse auger hole method also known as the Porchet method.
The method consists of boring a hole to a given depth, filling it with water and
measuring the rate of fall of the water level (Landon, 1991). This method was used
because the ground water table in Shemshemia area is very deep (often >8 m) both in
the dry and wet seasons. The hydraulic conductivity was the calculated as follows:
1.15 × r log [h(ti) + r/2] − log [h(tn) + r/2] [1]
where, k is saturated hydraulic conductivity (m d-1), r is radius of the auger hole
tn − ti
× 864 k =
0
2
4
6
8
10
12
14
16
0 10 20 30 40 50 60 70 80 90 100 110 120Cumulative time (min)
Acc
umul
ativ
e in
take
(cm
)

Drylands Coordination Group
33
(cm), h(ti) is the water level in hole at initial time ti (cm), h(tn) is the water level in
hole at final time tn (cm) and 864 is used to convert into m d-1.
The k value was 0.03 m per day, which falls within the very slow conductivity class
according to the classification of Landon (1991). This result corresponds to the value
of indicative hydraulic conductivity for clayey soils with the prismatic or angular
blocky structure observed in profile pits P2 and P3.
The very slow hydraulic conductivity of the soils is perhaps due to the effect of the
Na+ ions in the soils. The soil structure has been broken down into finer particles,
which slows down the permeability of soils to water and air. The organic matter that
helps to maintain the aggregates of soils has been dispersed by the Na+ ions. The
black colour of dispersed soil particles was observed in the surface layer, which
indicates the effect of Na+ ions in degrading the soil structure.
4.2.2. Soil chemical properties of the Shemshemia area
Soil chemical properties indicate the status of the soil in terms of whether it is acid or
alkaline, its content of soluble salts, capacity to hold cations, content of cations and
anions, important plant nutrients such as nitrogen and phosphorus, organic matter and
carbonate. Overall, these properties will give a strong indication as to the fertility
status of the soil in terms of its ability to provide essential nutrients to plants/crops,
and to the favourability of the soil chemical environment for plant growth, i.e.
whether it is too acidic, too alkaline, too saline or too sodic, all of which would
negatively affect plant growth.
There are 13 essential mineral nutrients required by plants for growth. Those required
in the largest amounts are the macronutrients, of which three are the most important
and are classed as major nutrients. These are nitrogen (N), phosphorus (P) and
potassium (K) and are usually added as fertilisers for all crops on most soils. Three
further macronutrients, sulphur (S), calcium (Ca) and magnesium (Mg), are known as
the secondary nutrients, and may be added in fertilizers for some crops on some soils
where their availability is naturally low. The remaining seven nutrients are required
in smaller quantities, although they are still essential for growth, and are known as
micronutrients. These are iron (Fe), manganese (Mn), zinc (Zn), copper (Cu),
molybdenum (Mo), chlorine (Cl) and boron (B). They are usually not added as
fertilizers since they are naturally available in most soils in sufficient quantities. In

Management of Soil-affected Soils
34
some soils with particular chemical properties, however, there may be deficiencies in
certain micronutrients.
The full results of the soil chemical analysis are shown in Annex B, (Tables 1 to 7).
The samples have been divided into four groups for the sake of comparison: samples
from rainfed sites, salt-affected (sodic) sites (uncultivated), irrigated sites, and the
riverbank. Annex B, Table 1 shows the complete set of results for all soil samples
and Annex B, Table 2 shows a statistical summary of the results for all samples and
for each group separately. Annex B, Table 3 shows the chemical analysis for the
topsoil samples only, and Annex B, Table 4 the statistical summary for the topsoil
samples. Annex B, Tables 5 and 6 respectively show the statistical information for
the subsoil samples. Annex B, Table 7 shows the results of a correlation analysis
between the various chemical properties to indicate which properties are related to
each other. The chemical properties are described in the following sections for
irrigated soils and then for the non-irrigated (rainfed, sodic and river bank) soils.
Drylands Coordination Group
35
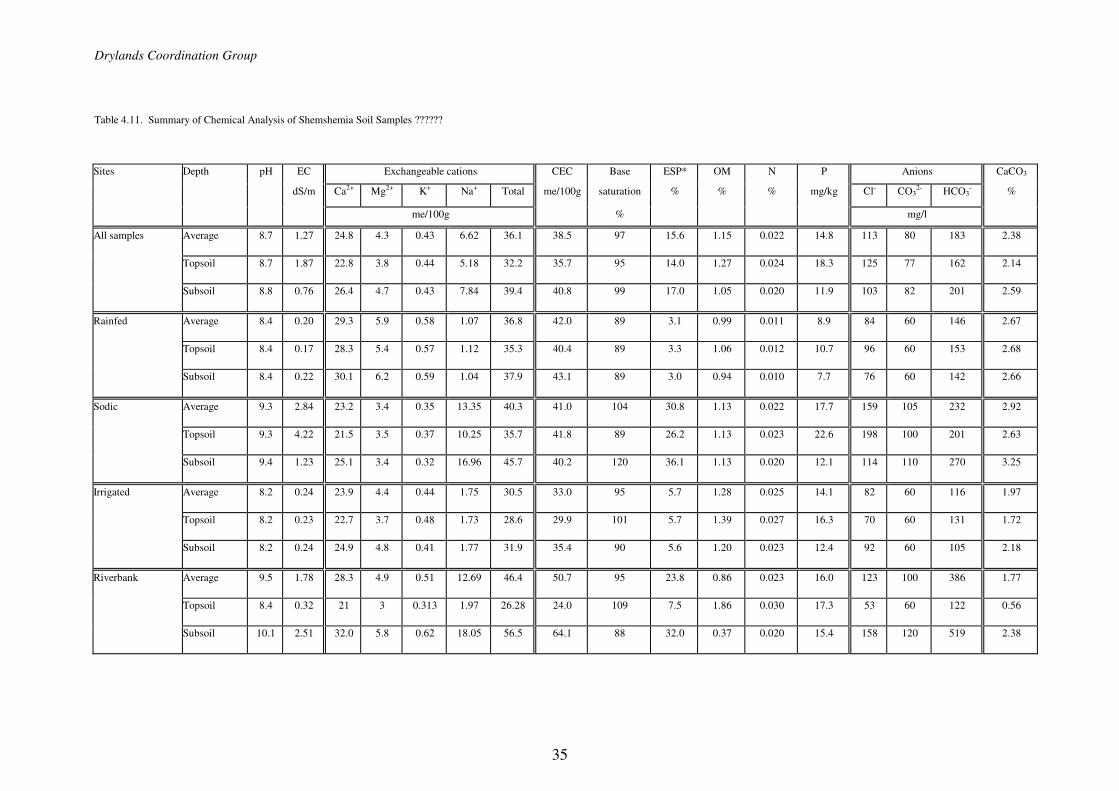
Table 4.11. Summary of Chemical Analysis of Shemshemia Soil Samples ?????? Sites Depth pH EC Exchangeable cations CEC Base ESP* OM N P Anions CaCO3
dS/m Ca2+ Mg2+ K+ Na+ Total me/100g saturation % % % mg/kg Cl- CO32- HCO3
- %
me/100g % mg/l
All samples Average 8.7 1.27 24.8 4.3 0.43 6.62 36.1 38.5 97 15.6 1.15 0.022 14.8 113 80 183 2.38
Topsoil 8.7 1.87 22.8 3.8 0.44 5.18 32.2 35.7 95 14.0 1.27 0.024 18.3 125 77 162 2.14
Subsoil 8.8 0.76 26.4 4.7 0.43 7.84 39.4 40.8 99 17.0 1.05 0.020 11.9 103 82 201 2.59
Rainfed Average 8.4 0.20 29.3 5.9 0.58 1.07 36.8 42.0 89 3.1 0.99 0.011 8.9 84 60 146 2.67
Topsoil 8.4 0.17 28.3 5.4 0.57 1.12 35.3 40.4 89 3.3 1.06 0.012 10.7 96 60 153 2.68
Subsoil 8.4 0.22 30.1 6.2 0.59 1.04 37.9 43.1 89 3.0 0.94 0.010 7.7 76 60 142 2.66
Sodic Average 9.3 2.84 23.2 3.4 0.35 13.35 40.3 41.0 104 30.8 1.13 0.022 17.7 159 105 232 2.92
Topsoil 9.3 4.22 21.5 3.5 0.37 10.25 35.7 41.8 89 26.2 1.13 0.023 22.6 198 100 201 2.63
Subsoil 9.4 1.23 25.1 3.4 0.32 16.96 45.7 40.2 120 36.1 1.13 0.020 12.1 114 110 270 3.25
Irrigated Average 8.2 0.24 23.9 4.4 0.44 1.75 30.5 33.0 95 5.7 1.28 0.025 14.1 82 60 116 1.97
Topsoil 8.2 0.23 22.7 3.7 0.48 1.73 28.6 29.9 101 5.7 1.39 0.027 16.3 70 60 131 1.72
Subsoil 8.2 0.24 24.9 4.8 0.41 1.77 31.9 35.4 90 5.6 1.20 0.023 12.4 92 60 105 2.18
Riverbank Average 9.5 1.78 28.3 4.9 0.51 12.69 46.4 50.7 95 23.8 0.86 0.023 16.0 123 100 386 1.77
Topsoil 8.4 0.32 21 3 0.313 1.97 26.28 24.0 109 7.5 1.86 0.030 17.3 53 60 122 0.56
Subsoil 10.1 2.51 32.0 5.8 0.62 18.05 56.5 64.1 88 32.0 0.37 0.020 15.4 158 120 519 2.38

Management of Soil-affected Soils
36
a) Soils of the irrigated areas
Soil pH indicates whether the soil is acidic, neutral or alkaline. Plants and soil micro-
organisms show a marked response to soil reaction since it has a major influence on the
soil chemical environment and on the availability of essential nutrients. Plants tend to
prefer a soil pH just below to just above pH 7 (neutral). When pH becomes too acidic or
too alkaline a range of problems occur, including deficiencies in the availability of various
nutrients and direct toxicity.
The irrigated soils in Shemshemia show a soil reaction ranging from 7.7 to 8.6, with an
average of 8.2, indicating slight to moderate alkalinity. Soils of arid and semi-arid regions
are commonly alkaline due to an accumulation of carbonates in the soil (Maskey, 1984).
The pH of the Shemshemia soils is slightly high for optimal plant growth.
Calcium carbonate contents ranged from 0.56 to 3.70% with an average of 1.97%. This
indicates a slightly calcareous soil.
Salinity and Exchangeable Sodium Percentage Salinity refers to the total concentration of all salts in the soil. The salts are usually
chlorides, sulphates, carbonates and bicarbonates of calcium, magnesium, sodium and
potassium. High concentrations of soluble salts are detrimental to plant growth particularly
because water availability is reduced, as well as due to direct toxicity from some ions such
as sodium and chloride, and ionic imbalances created in the plants. Salinity is a common
problem in arid and semi-arid areas, particularly where irrigation with water containing
dissolved salts is practised, due to the fact that as water evaporates from the soil surface the
salts remain in the soil and accumulates over time (FAO, 1988). Salts dissociate into
positive and negative ions in solution and therefore have the ability to conduct an electric
current. Salinity is therefore measured as electrical conductivity of a saturated soil extract
or paste (ECe), where the soil:water ratio is 1:2 (in this case a ratio of 1:2.5 was used). A
soil is classified as saline if it has an ECe value of 4.0 or more d S m-1, although some
plants, particularly for example fruit and vegetable crops, are sensitive to lower salinity
levels down to 2.0 d S m-1 (Landon, 1991).
The irrigated soils of the Shemshemia show and EC values ranging from 0.05 to 0.93 d S
m-1, with an average of 0.24 d S m-1. These are very low salinity levels indicating that the
soils have neither a significant input of salts from their parent materials or from the water
used for irrigation, and that the crops are unlikely to be affected.
Soils containing sodium salts have particular problems since high levels of sodium ions

Drylands Coordination Group
37
(Na+) cause clays to disperse, which breaks down the soil structure, decreases porosity and
lowers the permeability of the soil to water and air. High levels of sodium are also
associated with high alkalinity. The exchangeable sodium percentage (ESP) gives a
measure of the potential sodium problem, and is the percentage of sodium ions out of the
total base cations (Ca2+, Mg2+, K+ and Na+) or total cation exchange capacity (CEC) of the
soil. The CEC is a measure of the total number of cations (positive ions) that a soil can
hold. If the ESP is more than 15% and it is also associated with a high pH (of 8.5 or more)
then the soils are classified as sodic.
The irrigated soils in Shemshemia have an average ESP of 5.7% with most sites showing a
much lower value, indicating that there is no sodicity problem. However, site A2 shows
19.0% and 20.4% ESP and site A3 shows 9.7 and 14.0% ESP in the topsoil and subsoil
respectively. The soil pH for A2 is below 8.5 but for A3 is 8.4 and 8.6 for topsoil and
subsoil respectively. These values indicate that sodicity problems spread beyond the
uncultivated area into some of the irrigated areas, which are nearer to the observed non-
irrigated sodic area.
Cation Exchange Capacity, Exchangeable Cations and Percent Base Saturation Negatively charged surfaces on clay particles and humus molecules (decomposed organic
matter) in the soil attract cations (such as Ca2+, Mg2+, K+) and hold them in the soil,
where they are available to plants. The Cation Exchange Capacity (CEC) is used as one
way of estimating soil fertility. Soils with a high value of CEC are considered fertile, and
vice versa. In general, CEC ranges from a minimum of 2 meq 100 g-1 soil in sands up to a maximum
of 60 me 100 g-1 in clay soils (Brady, 1991). The soil textural class of non- irrigated soils in
Shemshemia is loams, with more or less equal proportions of sand, silt and clay (Table
4.9). The irrigated soils have CEC contents ranging from 14.8 to 44.9 me 100 g-1 soil with
an average of 33 me 100g-1.
Exchangeable Cations
Calcium (Ca2+) is a secondary macronutrient required by plants and is a major component
of cell walls and is important for root growth, especially root tips. Calcium deficiency
causes poorly developed roots with weak tips, and distorted leaves with hooked tips and
curled margins. Calcium is also beneficial in the soil due to its role in soil structure
stabilisation and combating soil sodicity. Calcium is the dominant cation in all the soil
samples from Shemshemia. The irrigated soils contain between 14 to 39 meq Ca2+ 100 g-1
Management of Soil-affected Soils
38
soil or 23.9 meq 100g-1 on average, which is 78% of the total base cations. This is high, as
is usual in neutral to alkaline soils.
Magnesium (Mg2+) is another secondary macronutrient required by plants and is vital for
chlorophyll production and is important in most enzyme reactions. Magnesium deficiency
causes different symptoms in different plants, but commonly includes leaf yellowing with
brilliant tints. Leaves may suddenly drop off without withering. Symptoms show first on
older leaves. The irrigated soils in Shemshemia contain between 2 to 7 meq Mg2+ 100g-1
soil, with an average of 4.4, or 14% of the total base cations. This gives a Ca:Mg ratio of
5.4:1, which means Mg becomes increasingly unavailable with increasing Ca. Calcium and
magnesium ions make up 92% of the total exchangeable base cations, which is usual in
neutral to alkaline soils. The magnesium contents are classed as very high (which requires
a magnesium content of >1.48 meq 100 g-1).
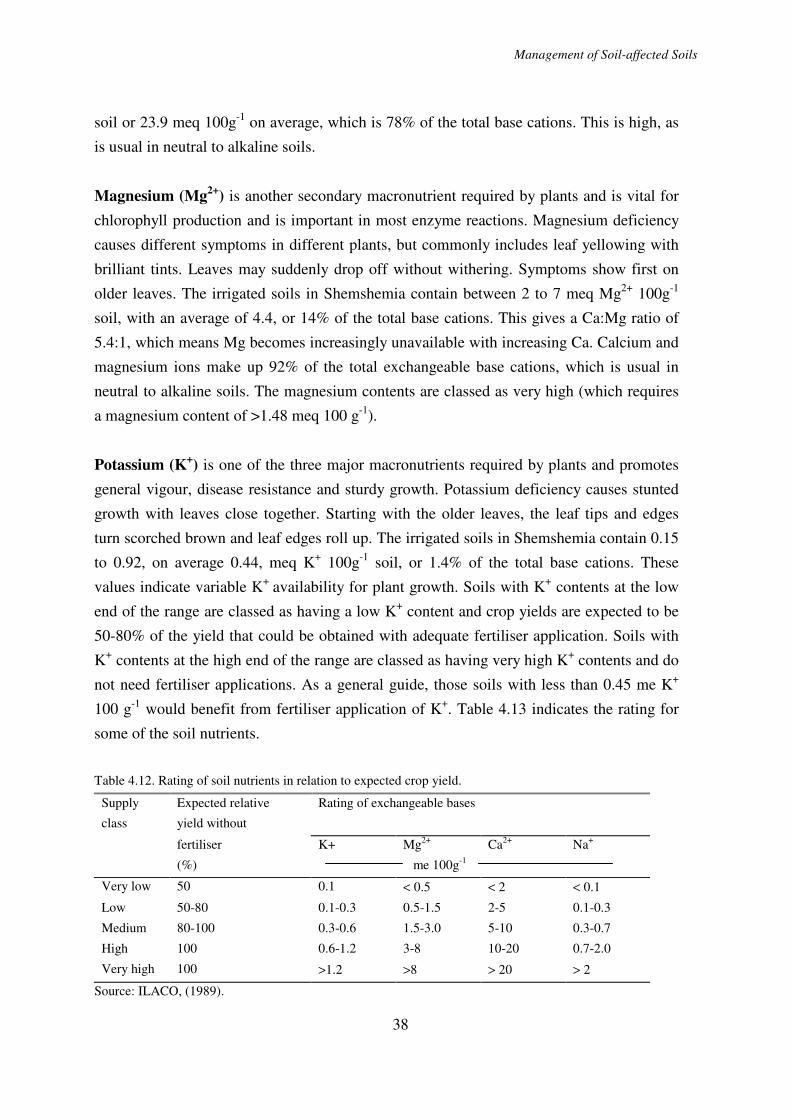
Potassium (K+) is one of the three major macronutrients required by plants and promotes
general vigour, disease resistance and sturdy growth. Potassium deficiency causes stunted
growth with leaves close together. Starting with the older leaves, the leaf tips and edges
turn scorched brown and leaf edges roll up. The irrigated soils in Shemshemia contain 0.15
to 0.92, on average 0.44, meq K+ 100g-1 soil, or 1.4% of the total base cations. These
values indicate variable K+ availability for plant growth. Soils with K+ contents at the low
end of the range are classed as having a low K+ content and crop yields are expected to be
50-80% of the yield that could be obtained with adequate fertiliser application. Soils with
K+ contents at the high end of the range are classed as having very high K+ contents and do
not need fertiliser applications. As a general guide, those soils with less than 0.45 me K+
100 g-1 would benefit from fertiliser application of K+. Table 4.13 indicates the rating for
some of the soil nutrients.
Table 4.12. Rating of soil nutrients in relation to expected crop yield.
Supply
class
Expected relative
yield without
Rating of exchangeable bases
fertiliser K+ Mg2+ Ca2+ Na+
(%) me 100g-1
Very low 50 0.1 < 0.5 < 2 < 0.1
Low 50-80 0.1-0.3 0.5-1.5 2-5 0.1-0.3
Medium 80-100 0.3-0.6 1.5-3.0 5-10 0.3-0.7
High 100 0.6-1.2 3-8 10-20 0.7-2.0
Very high 100 >1.2 >8 > 20 > 2
Source: ILACO, (1989).

Drylands Coordination Group
39
Sodium (Na+) is not a nutrient required by plants, and instead, when present in high
concentrations, causes a range of problems for plant growth. The contents of sodium in the
irrigated soils vary between 0.17 and 5.78, with an average of 1.75, meq Na+ 100g-1 soil,
or 5.7% of the total base cations. However, it is not the actual content of sodium that is
most important, but its relative amount compared to other cations, and this has already
been mentioned earlier as the exchangeable sodium percentage (ESP). Percent Base Saturation (PBS) is the percentage of base cations out of the total CEC of
the soil. In neutral to alkaline soils base cations make up most of the CEC, but as soils
become more acidic H+ and Al3+ become increasingly dominant. The irrigated soils give a
PBS range of 60-144%, with an average of 95%.
Organic matter, Nitrogen and Phosphorus Organic Matter (OM): Organic matter in soils consists primarily of plant remains in
various stages of decomposition, soil microorganisms and humus (complex, relatively
stable organic molecules formed during decomposition processes). Soil organic matter is
very important in binding soil particles together, thereby aiding soil structure development
(and consequently improving water infiltration, aeration and root development) and
increasing resistance to erosion. It is also able to absorb up to 20 times its own weight of
water, thereby increasing water retention in the soil, which is very useful in arid and semi-
arid climates. Organic matter also contains some of the most important plant nutrients such
as nitrogen, phosphorus and sulphur, and attaches cations such as calcium, magnesium,
potassium and ammonium to its negatively-charged surfaces. It therefore acts as a source of
all of the plant macronutrients in the soil.
In the irrigated soils, OM content varies between 0.54 to 2.18%, with an average of 1.28%.
This is very low, and unfortunately, this is commonly the case for soils of arid and semi-
arid regions probably due to the sparse vegetation cover. Several studies have indicated
organic matter contents in Eritrean soils of less than 1% (Maskey, 1984). The irrigated soils
contain a slightly higher OM content compared to the non-irrigated soils in Shemshemia,
probably due to the better vegetation growth and fertilisation under irrigation.
Nitrogen is a major plant macronutrient, stimulating leaf and stem growth. Nitrogen
deficiency causes reduced growth and pale yellowish green leaves. The older leaves turn
yellowish first since the nitrogen is readily removed from the old leaves to the new growth.
Nitrogen content of soils is usually correlated with OM content since over 90% of the
nitrogen found in soils are in an organic form. Table 4.7 in Annex B shows this to be the
Management of Soil-affected Soils
40
case where a highly significant correlation was found between the two properties. The total
nitrogen contents of the irrigated soils range from 0.01 to 0.05% (with an average of
0.03%) which are low values.
The average OM content of 1.28 can be converted to the soil organic carbon (OC) content
by dividing by 1.72. This gives an average OC content of 0.74%. The average C:N ratio
can then be calculated as 0.74 : 0.03 or 25:1. This C:N ratio is outside the common range in
arable soils of 8:1 to 15:1 in the upper 15 cm, again demonstrating the very low content of
nitrogen in the soils (Brady, 1990).
Phosphorus is another major plant macronutrient. It is important for the germination and
growth of seeds, the production of flowers and fruit and the growth of roots. Phosphorus
deficiency causes reduced growth and small leaves that drop early, starting with the oldest
leaves. Leaf colour is a dull, bluish green that becomes purplish or bronzy. Leaf edges often
turn scorched brown. The available phosphorus content of the irrigated soils in
Shemshemia ranges from 2.8 to 31.4 mg kg-1, with an average of 14.1 mg kg-1. These
indicate highly variable contents ranging from very low to very high (see Table 4.11), with
the average content being medium. Soils with less than 17 mg/kg of phosphorus would
benefit from the addition of P-containing fertilisers. Maximum phosphorus availability
occurs between pH 6.0 to 7.5, and so those soils with higher pH may be expected to show
phosphorus deficiency.
Soluble anions: These include chloride (Cl-), carbonate (CO32-), and bicarbonate (HCO3
-).
The irrigated soils contain lower concentrations of all three anions compared to the non-
irrigated soils. High Cl- concentrations would be expected in more saline soils, and high
CO32- and HCO3
- concentrations in more alkaline soils.
b) Soils of the (currently) non-irrigated areas Soil pH and calcium carbonate: The rainfed sites have an average soil pH of 8.4, the
sodic soils have 9.3 and the soils along the riverbank have 9.5. The pH of the rainfed sites
ranges from 8.2 to 8.6. This is on average slightly higher than the irrigated sites but the
rainfed areas do not show extreme alkalinity. Both the sodic and riverbank sites, however,
show maximum soil pH values of 10.3, and their average values are also very high. This
indicates an alkalinity problem in these areas and plant growth would be seriously affected.
Calcium carbonate contents averaged 2.67% in rainfed areas, 2.92% in sodic areas and
1.77% on the riverbank. These values do not very significantly from the irrigated soils and
indicate slightly calcareous soils with no detrimental effects on plant growth.

Drylands Coordination Group
41
Salinity and ESP: Salinity levels are very low in the rainfed areas, ranging from only 0.11
to 0.26 d S m-1. This is very slightly less, on average, than in the irrigated soils. In the sodic
areas, however, the EC ranges from 0.29 to >20 d S m-1 with an average of 2.84 d S m-1.
The upper value is very high and somewhat questionable, and the results for individual
samples show that most soils have an EC <2.0 d S m-1. The sodic soils have a higher salt
content than the irrigated and rainfed soils but cannot be classified as saline soils. The
riverbank samples show a very low salinity in the upper and deep horizons but a high salt
content (about 4.3 d S m-1) at a depth of 30-80 cm.
The ESP for the rainfed sites is low, on average only 3.1%, but the sodic sites show an
average ESP of 30.8%, an extremely high value. This clearly indicates the nature of the salt
problem in the area. It is the highest sodium content in the soils, not a high soluble salt
content. Two of the soil samples in the sodic area (from the surface layer) have ESP values
of 4.3 and 9.9, which strictly does not classify them as sodic soils, but all other samples
have ESP values of at least 16.6%, and most well over 30%. The average ESP value for the
topsoil samples is 26.2% and for the subsoil samples 36.1%, indicating that the sodicity
problem increases with depth. These soils also have an average pH of 9.3 and so are
classified as true sodic soils.
The riverbank site also shows a sodicity problem, with an average ESP of 23.8%, but ESPs
of more than 30% below 30 cm depth. The riverbank samples also have an average pH of
9.5, and so this site is also classified as a sodic soil.
CEC, Exchangeable cations and PBS: The CEC of the rainfed sites ranged from 36.6 to
47.0, with an average of 42.0 meq 100 g-1 soil. This is a narrower and higher range than for
the irrigated soils. The sodic areas in the topsoil and subsoil depth have a similar average
CEC of 41.0 but a much wider range (from 25.1 to 60.9 meq 100 g-1), and the riverbank
samples also have a high average CEC of 50.7 me 100 g-1. According to the rating of CEC
by Landon (1991), the soils in general all have very high CEC values indicating adequate
concentrations of cations.
Exchangeable cations Calcium: The calcium contents in the rainfed sites and on the riverbank are slightly higher
on average than in the irrigated soils, but in the sodic areas it is similar to the irrigated
soils. In all soils, calcium is the dominant cation, making up 80% of the total CEC in the
rainfed soils. Whereas, about 60% in the sodic and riverbank soils, reflecting the larger
proportion of sodium in these samples.

Management of Soil-affected Soils
42
Magnesium: Magnesium contents in the rainfed and riverbank sites are slightly higher
than those in the irrigated soils, but are slightly less in the sodic area. Even the lowest
content of 2.0 me 100 g-1, however, is classed as high (see Table 4.12). And this indicates
no shortage of magnesium for plant growth.
Potassium: As with magnesium, potassium contents in the rainfed and riverbank soils
(0.58 and 0.51 me 100 g-1 on average respectively) are slightly higher than in the irrigated
soils, but the sodic soils (0.35 meq 100 g-1) measured slightly lower potassium contents.
The soils show variable contents, however, and as already mentioned any sites with less
than 0.45 me 100 g-1 potassium would benefit from fertiliser additions.
Sodium: The sodium contents in the rainfed sites are lower on average and in range than in
the irrigated soils, being at maximum only 6.1% of the total base cation content. There is a
very clear difference, however, in the sodic and riverbank areas, where sodium clearly
makes up a high percentage of the CEC, and this has already been mentioned as the main
problem in these areas.
Percent Base Saturation: The Percent base saturation is high in all soils, which was above
47%.
Organic matter, Nitrogen and Phosphorus: The organic matter content of the rainfed
soils was on average only 0.99%, which is low. This is to be expected in dry soils where
vegetation cover for most of the year is low. The riverbank also has a low OM content of
0.86% on average. The soils in the sodic area had an average OM content of 1.1%, slightly
less than in the irrigated areas. In general, of course, all the soils in the area have low
amounts of OM and would definitely benefit from an increased input of organic materials
(maybe from crop residues or animals manure depending upon availability).
Nitrogen: The total nitrogen contents are low, even less than in the irrigated soils, ranging
from 0.01% in the rainfed soils to 0.02% on average in the sodic and riverbank areas. This
gives a C:N ratio of 58:1 in the rainfed soils, 33:1 in the soils of the sodic area and 50:1 in
the riverbank samples. All these C:N ratios are clearly outside the common range of
tropical soils (i.e. 8:1 to 15:1). The soils are in need of additional nitrogen.
Phosphorus: The phosphorus contents in the rainfed soils range from low to medium, and
so all soils in this area would benefit from additions of phosphorus fertilisers. The
Drylands Coordination Group
43
soils of the sodic area contain the highest P contents on average, ranging from low to very
high. Any soils with less than 18 mg kg-1 P would benefit from fertiliser additions (Landon,
1991).
Soluble anions: These include chloride (Cl-), carbonate (CO32-), and bicarbonate (HCO3
-).
The rainfed soils contain low concentrations of all three anions, similar to the irrigated
soils. Whereas, soils of the sodic and riverbank areas contain noticeably higher
concentrations of all anions.
4.3. PROBLEM SOILS IN THE SHEMSHEMIA AREA
For optimal plant growth, a soil must possess a range of favourable physical, chemical and
biological properties. Physical properties include soil texture and structure. Texture refers
to the range of particle sizes present in the soil and should ideally be a loam, or sub-class of
loam, where all particle sizes are present in some quantity. Structure refers to the
arrangement of the particles and affects aeration and water infiltration. With a suitable
proportion of small aggregates (particularly in the surface layers), and large and small
pores, water and air will be able to move easily through the soil, maintaining a well-
aerated, moist environment. Plant roots will also be able to grow unhindered by compacted
layers. From a chemical point of view, the soil must be able to supply the full range of
plant nutrients in the required amounts. It must also have no adverse chemical properties
such as excess acidity, alkalinity, salinity or sodicity, nor contain high concentrations of
harmful chemical components such as heavy metals. It is also beneficial for a soil to
support a healthy, diverse population of soil micro-organisms, which breakdown plant
residues, fix nitrogen, and generally improve the supply of nutrients to plants.
The main soil problems in Shemshemia are (1) sodicity (high sodium content), (2)
alkalinity (high pH), (3) poor structural development, (4) low infiltration rates and (5) low
content of some macronutrients, notably nitrogen throughout the area.
Points 1 to 4 all relate to the sodium content of the soil and will be discussed below. Points
5 and 6 are additional problems that the farmers should address to get the best yields from
the soils. It is advisable to add fertilisers to redress the nitrogen and phosphorus contents in
some parts of the farm. It is also advisable to increase the organic matter content of the
soils by adding crop residues or animal manure.

Management of Soil-affected Soils
44
4.3.1. Characteristics of the sodic soils (black alkaline soils) in Shemshemia
Sodic soils are characterised by high sodium content, low soluble salt content, and high pH.
Exchangeable sodium content must be at least 15% of the total cation exchange capacity
(CEC). In soils with high pH, the CEC is occupied mostly by base cations (Ca2+, Mg2+, K+,
and Na+) with a very small amount of other cations (Al3+, H+ and NH4+). The exchangeable
sodium percentage (ESP) was therefore calculated as a percentage of the total base cations
present rather than a percentage of the CEC. The sodic soils in Shemshemia measured an
ESP of 30% on average compared to only 3% and 6% for the rainfed and irrigated areas,
respectively.
Sodic soils have a high pH of more than at least 8.5, and even as high as pH 10. The
average pH for the sodic soils in Shemshemia was 9, with a maximum of 10. High pH is
associated with the presence of sodium bicarbonate (NaHCO3) and sodium carbonate
(Na2CO3), which are readily soluble in water. Sodium-rich clays, HCO3- and CO3
2- react
with water to form hydroxyl (OH-) ions that cause high pH (FAO, 1988).
The soluble salt content of the sodic soils (in Shemshemia farm) is 2.8 d S m-1 on average,
which is less than the required 4 d S m-1 for the soils to be classed as saline soils.
4.3.2. Effects of sodicity on soil properties
The positively charged sodium ions become attached to the negatively charged surfaces of
the clay particles in the soil. As a result, the clay particles lose their tendency to stick
together when wet. The clay particles are dispersed and block soil pores and the soils
become dense and compacted and impermeable to both water and roots. The infiltration
rate and hydraulic conductivity of the soil decreases to the extent that little or no water
movement occurs (Figure 4.1). Water remains on the surface of the soil for a long time
after rainfall or irrigation. This also leads to poor aeration of the soil. The soil is plastic
when wet and becomes hard and brick–like when dry and tillage becomes difficult.
Because the clay particles do not stick together, the soils also become structurally unstable
and are more susceptible to water and wind erosion. The high alkalinity associated with
sodicity cause soil organic matter to disperse, which further weakens soil structure. Surface
crusting is a common problem in cultivated sodic soils. Sodic surface layers are highly
prone to erosion because of the low aggregate stability and are easily detached by raindrop
impact. When dry, the surface soils in sodic sites forms a hard crust (Seelig, 2000).

Drylands Coordination Group
45
4.3.3. Effects of sodicity on plant growth
Root growth and seedling emergencies are restricted in the compacted and crusted sodic
layers with dispersed clays. Poor aeration due to poor drainage will reduce the oxygen
available to plant roots for respiration and will also cause carbon dioxide to build up in the
soil, both further restricting root growth.
The high pH often causes deficiencies in various plant nutrients, particularly phosphorus
and micronutrients such as iron, manganese, zinc, copper and cobalt, all of which are much
less available when pH is greater than 7.0.
Sodium ions and anions such as bicarbonate are directly toxic to most plants. The caustic
influence of high pH affects plant growth. Live roots were seen to be vulnerable to
deterioration when pH was above 9.5 in sodic soils in North Dakota, USA (Seelig, 2000).
4.4. RECLAMATION & MANAGEMENT OF THE SODIC SOILS
4.4.1. Chemical methods for soil amendments
The development and maintenance of successful irrigation projects involve not only the
supplying of good irrigation water quality to the land but also the control of soil problems
(such as sodicity problems) in the fields.
Basically, reclamation or improvements of sodic soils requires the removal of part or most
of the exchangeable sodium and its replacement by the more favourable calcium ions in the
root zone. For quick results, cropping must be preceded by the application of chemical soil
amendments followed by leaching for removal of salts derived from the reaction of the
amendment with the sodic soils.
The kind and quantity of a chemical amendment to be used for replacement of
exchangeable sodium in the soils depend on availability of the amendment, the soil
characteristics (including the extent of soil deterioration), the desired level of soil
improvement, the crops intended to be grown and economic considerations.
The chemical amendments used for sodic soil reclamation include gypsum (CaSO4.2H2O),
calcium chloride (CaCl2.2H2O), acids or acid forming substances (e.g.H2SO4, S, FeSO4,
etc.) and ground limestone (CaCO3).
a) Lime (CaCO3) is an effective amendment only in soils having pH<7 because its

Management of Soil-affected Soils
46
solubility rapidly decreases as the soil pH increases (FAO, 1988).
b) Calcium chloride (CaCl2.2H2O) is a highly soluble salt, which supplies soluble calcium
directly. Because of its high solubility in water, calcium chloride is the most readily
available source of calcium but it has rarely been used for reclamation (on an extensive
scale) because of its high cost.
c) Acids and/or acid forming substances (like sulphur and pyrite) are relatively slow
acting, because they must first be oxidised to sulphuric acid by soil micro-organisms before
they are available for reactions. Moreover, the soils should contain appreciable amount of
lime to react with the acids to form gypsum.
d) Gypsum is by far the most widely used amendment for reclaiming sodic soils because of
its abundant availability, replaces the sodium ions with calcium ions in the soil exchange
sites, low cost and easy application. Moreover, gypsum application improves soil
properties by providing calcium ions for plant nutrients and keeps the soil particles
flocculated.
The replacement of Na+ by Ca2+ in the gypsum can be presented in the form of chemical
equation as follows:
2Na+ + CaSO4 Ca 2+ + Na2SO4 [2]
Hence on the basis of soils characteristics, crops to be grown (i.e. citrus crops which are
sensitive at low ESP), cost of amendments and availability of the chemical amendment,
gypsum is recommended to reclaim the sodic affected lands in the Shemshemia farm.
Replacement of each mole of adsorbed sodium per 100 g soil will require half a mole of
soluble calcium as shown in Eq.[2].
1 mole of Na+ ion (23 g) would exchange with ½ mole of Ca2+ ion (20g)
To replace 1 centi-mole (cmole) of Na+ kg-1 soil = 20/100 = 0.2 g Ca2+ kg-1 soil
= 0.2 × 2.24 × 106 (mass of soil in 15 cm depth)
= 448,000g = 448 kg
= CaSO4.2H2O = 172
Ca2+ 40
= 4.3 × 448 kg
= 1,926 kg (1.93 tons) of pure gypsum ha-1
Micelle Micelle

Drylands Coordination Group
47
The quantity of pure gypsum required to supply half a cmole of calcium per kg soil for the
upper 15 cm soil depth will be 1,926 kg (1.93 tons) of pure gypsum ha-1 15 cm-1 depth.
Therefore, to replace the exchangeable Na+ of 10 meq 100g-1 soil (in the average topsoils
of the sodic areas), about 20 tons of pure gypsum per ha should be applied in Shemshemia
farm. The total gypsum requirement for 5 ha sodic land will then be about 100 tons of pure gypsum. This figure, however, should be used with caution because the effectiveness
of gypsum in replacing the Na+ ions should be tested in the field.
Gypsum is normally applied broadcast as a dry powder and then incorporated into the soil
by means of disking or ploughing. From the standpoint of efficiency in replacing
exchangeable sodium, it is advantageous to leach most of the soluble salts out of the soil
before applying chemical amendments. In other words, one irrigation prior to application of
gypsum would further ensure leaching of soluble carbonates, which are found in many
sodic soils. This leaching eliminates the need of additional quantities of gypsum for
neutralising the free sodium carbonate.
4.4.2. Physical and biological methods for soil amendments
a) Deep ploughing: Since the sodic profiles (in Shemshemia farm) have dense subsoil
layers, this soil should be chiselled to a depth of 1 m in order to breakdown the hard layer.
This will facilitate the movement of water ease to the lower layers and also plant roots can
readily proliferate in the zone of water and nutrients availability, which eventually
improves crop yields. Deep ploughing up to 100 cm has been reported to be a useful
practice for improving sodic soils with hardpans or dense clay subsoil layers (Rasmussen et
al., 1972).
However, deep tillage using chiselling and/or subsoiling implements should only be
performed when soils are dry enough to shatter and crack. If done wet, compaction,
aeration and permeability problems can be expected (FAO, 1985).
b) Organic residues: Animal manure, crop residues in conjunction with inorganic
amendments (like gypsum) could be applied to reclaim the sodic soils in Shemshemia
farm. Organic manure (like farmyard manure, animal manure) has long been known to
facilitate the reclamation of sodic soils by lowering of pH, replacing the exchangeable Na
by Ca and/or Mg and thereby lowering the ESP (Yadav and Agarwal, 1961; Kanwar et. al.,
1965).
c) Crop selection: Growing crops such as cotton, tomatoes or grass sp. (which are

Management of Soil-affected Soils
48
tolerant to semi-tolerant to ESP) or selection of tolerant rootstocks (which exclude Na+
ions from absorption) offer a practical solution to control soil sodicity problems in
Shemshemia farm. On the other hand, citrus crops are not recommended to grow on sodic
lands because of their extreme sensitiveness even at low ESP values (i.e. ESP = 2-10).
4.4.3. Socio-economic considerations
Reclamation of sodic soils requires application of amendments. For a technology to be
sustainable, it should, however, be socially acceptable, economical feasible and
environmentally sound.
The social and economic considerations should be taken into account when recommending
the chemical, physical and/or biological amendments to reclaim the sodic lands in
Shemshemia farm. These considerations include the availability of the amendments (to the
farmers) at a reasonable cost, the institutional finances available, marketing facilities if new
crops are to be introduced. In addition, on-the-job training about the principles of soil
amendments and the application methods in the field should be given to the farmers in
Shemshemia area.
Table 4. 12. The cost of gypsum application per ha and total cost (for 5 ha sodic land) at Shemshemia farm.
Activities Cost ha-1
nakfa †
Total cost
nakfa
Ploughing 228.00 1,140.00
Harrowing
Diesel for motor pump
45.00
100.00
180.00
500.00
Labour for watering‡ 20.00 100.00
Labour for ploughing‡ 100.00 500.00
Gypsum application§ 27,000.00 135,000.00
Total 27,493.00 137,420.00
† nakfa is a local currency of Eritrea. The exchange rate is 1 US = 13.50 nakfa in 2002.
‡ 1 labour cost = 20 nakfa per day
§ gypsum application for 20 tons ha-1 (estimated cost 10 US per ton of gypsum)
Table 4.12 shows estimated cost of gypsum application (exclusively of transport cost) to
reclaim the 5 ha sodic land in Shemshemia farm. Assuming the indicative annual yield of
orange fruits under smallholder production as 20 tons ha-1 (Landon, 1991) and the price of
1 ton orange fruit as 10,000 nakfa (about US $750), the total income will be 200,000 nakfa
(about US $15,000) per ha. This indicates that the total income from the citrus farm is
above the cost of gypsum application and other farm activities (Table 4.13). Therefore, it
seems economically feasible if citrus plants (such as orange) are planted after the
reclamation of the sodic land unit in the Shemshemia farm.

Drylands Coordination Group
49
4.5. CHECKLIST FOR PREVENTION OF NON-SODIC AREAS
Table 4.13. gives the prevention methods for unaffected sodic lands in Shemshemia farm.
Table 4.12. Checklist for prevention of non- sodic areas in Shemshemia farm.
Prevention methods Remarks
Frequent light irrigation • Solution favours the adsorption of calcium and
magnesium over sodium ions.
• Losses of calcium due to precipitation will be minimum.
Timing of irrigation • Irrigation should often proceeds or follows planting.
Slowing evaporation rate • Retard the translocation of upward movement of soluble
salts.
Changing irrigation methods (from
furrow to drip irrigation system) • Saves water and labour
• Increasing infiltration
Cultivation and deep tillage • Improves penetration of roots and infiltration of water
• Breaks up the compacted subsoil layer
Using organic residues • Incorporating crop resides into the soil improves water
infiltration and soil physical fertility (like soil structure).
Growing tolerant crops • Crops such as sorghum, tomatoes, cotton, etc. (which are
adaptable to Shemshemia area) are tolerant to high ESP.
5. CONCLUSIONS
One of the main problems in the Shemshemia farm is the sodic soils in the non-irrigated
fields. This sodicity problem could be ameliorated using the chemical amendments (like
gypsum) with a combination of application of physical amendments (such as deep
ploughing and cultivation).
However, field trials should be conducted to test the soil amendments to control the
sodicity problems so that crop yield is improved to an extent that justifies the cost incurred
in the application of the amendments. In other words, the soil amendments to correct the
sodicity problems must be tested on a pilot project scale (at a plot level) before being
applied on a large scale in the Shemshemia farm.

Management of Soil-affected Soils
50
The water quality of the river Gash, well water and canal water in the Shemshemia fields
have good water quality. The waters contain low concentration of salts and toxic elements,
which is safe to use for irrigation and drinking purpose. There is ample quantity of water to
irrigate the existing fields and further to expand irrigation schemes in the Shemshemia
area.
The causes of sodicity problems in the farm are not from the irrigation water source but
from the in situ weathering of the parent rock in the field. The parent rock consists of Na-
feldspar minerals (i.e.albite) which have weathered and increased the concentration of Na+
ions in the soil exchange complex.
On the other hand, the irrigated soils have good physical and chemical properties. They did
not show sodicity and/or salinity problems in their profile. The citrus crops in the irrigated
soils have good stand. Salinity and/or sodicity symptoms were not observed in the leaves of
the citrus plants.
Poor farm management and riverbank erosion also pose serious problems in the
Shemshemia irrigation scheme. These problems should be given due attention and the
possible solutions that are suggested in this report (Table 4.6) could be taken to address the
problems.

Drylands Coordination Group
51
6. REFERENCES Brady, N. C (1990). The Nature and Properties of Soils. 10th ed. Collier Macmillan
publishers, London, UK.
FAO (1979). Soil survey, investigations for irrigation, FAO soils bulletin 42, FAO, Rome,
Italy.
FAO (1985). Water quality for agriculture. FAO irrigation and drainage paper 29 rev.1,
Rome, Italy, 174 pp.
FAO (1988). Salt-affected soils and their management. FAO soils bulletin 39, Rome, Italy,
131 pp.
FAO-UNSECO (1988). Soil map of the World, Revised legend with corrections. World soil
resources report 60. FAO, Rome, Itlay, 140pp.
FAO (1990). Guidelines for soil profile descriptions, 3rd edition. FAO, Rome, Italy, 70pp.
FAO (1994). Eritrea agricultural sector review and project identification, /annex 5, Rome,
Italy, pp3-4.
FAO (1997). Support to forestry and wildlife sub-sector, pre investment study report
TCP/ERI/6712 (F). Annex 5: Afforestation in Eritrea, FAO, Eritrea.
FAO-ISRIC (1998). FAO-ISRIC soil database (SDB), In: FAO, 1990. Guidelines for soil
profile descriptions, third edition. FAO, Rome, Italy.
HACH (1986). Water analysis handbook, HACH company, Colorado, USA.
ILACO, B.V. (1989): Agricultural compendium for rural development in the tropics and
subtropics, Elsevier, Amsterdam. Pp.51-195.
John, Ryan, Sonia Garabet, Karl H.armsen and Abdul Rashid (1996). A soil and plant
analysis: Manual adapted for the West Asia and North Africa region, ICARDA,
Aleppo, Syria.
Kanwar, J.L., Bhumbla, D.R. and Singh, N.T. (1965). Studies on the reclamation of saline
and sodic soils in the Punjab. Indian J. Agric. Sci. 35: 43-51. In: FAO (1988). Salt-
affected soils and their management. FAO soils bulletin 39, Rome, Italy.
Klute, A.(Ed) (1986). Methods of soil analysis: Physical and mineralogical properties of
soils, Agronomy no.9 (Part I) AM. Soc. of Agronomy, Madison, Wisconsin.
Landon, J.R. (1991). Booker tropical soil manual: A handbook for soil survey and
agricultural land evaluation in the tropics and subtropics, Longman, London, UK.
Maskey, R.B. (1984). Soils, their fertility and management in Eritrea. Univeristy of
Asmara, Asmara, Eritrea.
MoA (2000). Ministry of Agriculture annual report, Asmara, Eritrea.
MoME (1999). Gash Barka mapping and mineral exploration project, geology of
Dukumbia-Maikokah area, Asmara, Eritrea.

Management of Soil-affected Soils
52
NCEW (1997). National Confederation of Eritreans Workers: Survey topographic map of
Shemshemia farm, Asmara, Eritrea.
Rasmussen, W.W., Moore, D.P. and Albasn, L.A. (1972). Improvement of a Solonetzic
(slick spot) soil by deep ploughing, subsoiling and amendments. Soil Sci. Soc. Amer.
Proc. 37: 137-142. In: FAO (1988). Salt-affected soils and their management. FAO soils
bulletin 39, Rome, Italy.
Seelig, B. D. (2000) Salinity and Sodicity in North Dakota Soils. North Dakota State
University Extension Service, EB 57.
World Bank Report (1994). Eritrea, options and strategies for growth: Vol II, report
no.12930 ER. Eritrea, Washington D.C., USA, Pp.59-89.
WRD (2000). Water Resources Department annual report, Asmara, Eritrea.
Yadav, J.S.P. and Agarwal, R.R., 1965. A comparative study of the effectiveness of
gypsum and dhaincha (Sesbania aculeata), J. Indian Soc. Sci. 9: 150-155. In: FAO
(1988). Salt-affected soils and their management. FAO soils bulletin 39, Rome, Italy.

Drylands Coordination Group
53
ANNEXES ANNEX A: SOIL PROFILE DESCRIPTIONS
Profile - P1 Soil name (local): ‘terir hamed’ Mapping unit: Currently not irrigated soil Location: About 700 m west of Tekombia road Co-ordinates (UTM) 331899 E, 1638490 N Date: 010915 Authors: Mehreteab & Kiflemariam Topography: almost flat Land element: valley Irrigation: River Gash Slope: 2% Land use: Uncultivated land Parent material: In situ weathered Drainage class (FAO) Somewhat excessively drained Surface characteristic: None Moisture conditions: dry to 50 cm, moist below.
Depth (cm)
Horizon/Layer
Profile descriptions
0-26 Ap sandy loam, strong brown (7.5YR5/6,dry); grainy structure; the soil consistence is loose (d), friable (m), slight sticky (w); strong calcareous; abundant roots; clear lower boundary.
26-50 A1 Dry moisture statues; loamy texture; strong brown (7.5YR4/6); sub-angular blocky, weak developed structure; hard (d), slight friable (m), very slight sticky (w), extreme strong calcareous; fine, very few roots; defuse lower boundary.
50-150+
B Dry moisture statues; sandy loamy; strong brown (5YR5/8,d), strong brown (5YR4/6,m); dry (d), friable (m), nonstick (w) consistence; extreme strong calcareous; mineral nodules carbonate concrete;
Profile-P2 Soil name (local): ‘chew hamed’ Mapping unit: Currently not irrigated soil Location: About 200 m east of River Gash Co-ordinates (UTM) 331031 E, 1638266 N Date: 010915 Authors: Mehreteab & Kiflemariam Topography: almost flat Land element: valley Slope: 2% Land use: Uncultivated land Parent material: In situ weathered Drainage class (FAO) poorly drained
Depth (cm)
Horizon/Layer
Profile descriptions

Management of Soil-affected Soils
54
0-24 A Dry loam soil; brown (7.5YR4/2d), dark brown (7.5YR3/2 m); sub angular blocky; hard (d), firm(m), sticky (w); very slight calcium carbonates; abundant roots; clear lower boundary.
24-57 AB Dry clay loam soil; dark brown (7.53/2 d), very dark brown (7.53/1 m); angular blocky; hard (d), firm (m), sticky (w); strong calcareous; carbonates mineral nodules; very few fine roots; defuse lower boundary.
57-82 B1 Moist silt loam; strong brown (7.54/6 d), brown (7.54/2 m); angular blocky weak developed; friable (m), sticky (w); slightly calcareous; very few, very fine, and faint mottles; clear to defuse lower boundary.
82-125 B2 Almost moist clay loam; strong brown (7.5YR4/6 d), brown (7.5YR4/3 m); sub angular weak developed; friable (m), slight sticky (w); very slight calcareous; abundant -few, fine size and prominent mottles; clear lower boundary
125-150+
B3 Moist loam; brown (7.54/4m, 7.5YR4/4w); sub angular weak developed; friable (m), slight sticky (w).
Profile – P3 Soil name (local): ‘tin hamed’ Mapping unit: Currently not irrigated soil Location: About 50 m east of citrus farm Co-ordinates (UTM) 331000 E, 1637940 N Date: 010916 Authors: Mehreteab & Kiflemariam Topography: almost flat Land element: valley Slope: 2% Land use: Uncultivated land Parent material: In situ weathered Drainage class (FAO) poorly drained
Depth (cm)
Horizon/Layer
Profile descriptions
0-35 Ap Dry clay loam; brown (7.5YR4/2, d) dark brown (7.53/2,w); sub angular blocky, poor developed; hard (d), friable (m), sticky (w); abundant roots; clear lower boundary.
35-100 B1 Moist clay loam; dark brown to very dark brown (7.5YR3/2 – 7.5YR2.5/2, m); hard (m), firm (w); very slight calcium carbonates; abundant, fine size, distinct mottles; defuse lower boundary.
100-150+
B2 Moist clay loam; dark brown to very dark brown (7.5YR3/2 - 7.5YR2.5/2 m); sub angular to prismatic; slight hard (m), sticky (w); medium calcareous; abundant –few, fine distinct mottles; few carbonates mineral nodules; few roots.
Profile -P4 Soil name (local): ‘duka hamed’ Mapping unit: Irrigated soil Location: About 100 m north of River Gash Co-ordinates (UTM) 331348 E, 1637592 N Date: 010916

Drylands Coordination Group
55
Authors: Mehreteab & Kiflemariam Topography: Gently undulating Land element: valley Slope: 3% Land use: Irrigated citrus farm Parent material: In situ weathered Drainage class (FAO) well drained
Depth (cm)
Horizon/Layer
Profile descriptions
0-20 Ap Moist sandy loam; dark brown (7.5YR3/3,m); friable (m), abundant roots; defused lower boundary.
20-96 B1 Moist sandy loam; brown (7.5YR4/4 m); blocky, weak developed; friable (m); many, fine root; clear lower boundary; many termites are occurred in the layer.
96-128 B2 Moist clay loam; dark brown (7.5YR3/2,m); sub angular blocky, weak developed; friable (m), sticky (w); abundant, fine roots; clear lower boundary.
128-164+
BC Dry silt loam; brown (7.5YR4/4,d), dark brown (7.5YR3/3,m); sub angular blocky, developed; slight hard (d), friable (m), sticky (w); slight calcareous; few and fine roots

Management of Soil-affected Soils
56
ANNEX B: SOIL PHYSICAL AND CHEMICAL DATA Table 1. Physical and Chemical Analysis of Shemshemia Soil Samples Table 2. Summary Statistics: All Samples. Table 3. Chemical Analysis of Shemshemia Soil Samples Topsoil Table 4. Summary Statistics for Topsoil Samples. Table 5. Chemical Analysis of Shemshemia Soil Samples: Subsoil Table 6. Summary Statistics for Subsoil Samples. Table 7. Correlation between soil chemical properties

Drylands Coordination Group
57

Management of Soil-affected Soils
58

Drylands Coordination Group
59
Table 3

Management of Soil-affected Soils
60

Drylands Coordination Group
61
Table 5

Management of Soil-affected Soils
62
Table 6 Table 7 ANNEX C. CHECKLIST QUESTIONNAIRE
1. Farmer’s name:
2. Gender: Male Female:
3. Education:
4. Place of origin:
5. How many people live in your household:
Boys:
Girls:
Wives:
6. Major source of income for the household:
a. b.
c. d.
7. When did the Shemshemia farm started?
8. What is the total area of land in tsimidi
9. Current land use appropriation in tsimidi for
Irrigated land:
Rainfed land:
Non- agricultural land:
10. What kind of crops do you grow?
11. What is the average crops yields?
Crops Yield (kg ha-1)
Sorghum
Orange
Lemon
Maize
Other (specify)
12. What is the type of the soil in the agricultural field?

Drylands Coordination Group
63
a) Walka hamed:
b) Hutsa hamed
c) Duka hamed
d) Other, specify
13. Have you observed any salinity and/or sodicity problem in the field?
a) Yes
b) Not at all
c) Rarely
14. If yes, at what period of the year?
a) During the dry season
b) During the rainy season
c) All year round
15. Do you have the following water sources?
a) Well
b) River
c) Other, specify
16. How far is the nearest water source to you? kms.
17. Do you have water shortage to grow crops?
a) Yes
b) No
18. If yes, what do you suggest to alleviate water problems in the area?
a.
b.
c.
d.
e.
19. What are the main agricultural problems in your area? (in order of significance) apart from water
shortage?
a.
b.
c.
d.
e.
20. What are the possible solutions to these problems?
a.

Management of Soil-affected Soils
64
b.
c.
d.
e.
21. What are the development potentials of the Shemshemia area?
a.
b.
c.
d.
e.
22. List five most severe development problems facing your area? (in order of significance) and suggest
possible solutions
Problems Solutions
1.
1.
2.
2
3.
3.
4.
4.
5.
5.
Thank you!

Drylands Coordination Group
65
List of Publications: 1 A. Synnevåg, G. et Halassy, S. 1998: “Etude des indicateurs de la sécurité alimentaire dans deux sites de la zone d’intervention de l’AEN-Mali: Bambara Maodé et Ndaki (Gourma Malien)”, Groupe de Coordination des Zones Arides et Noragric, Agricultural University of Norway. 1 B. Synnevåg, G. and Halassy, S. 1998: “Food Security Indicators in Two Sites of Norwegian Church Aid’s Intervention Zone in Mali: Bambara Maoudé and N’Daki (Malian Gourma)”, Drylands Coordination Group and Noragric, Agricultural University of Norway. 2 A. Aune, J.B. and Doumbia, M.D. 1998: “Integrated Plant Nutrient Management (IPNM), Case studies of two projects in Mali: CARE Macina programme and PIDEB”, Drylands Coordination Group and Noragric, Agricultural University of Norway. 2 B. Aune, J.B. et Doumbia, M.D. 1998: “Gestion Intégrée de Nutriments Végétaux (GINV), Etude de Cas de deux projets au Mali: Programme de CARE Macina et PIDEB”, Groupe de Coordination des Zones Arides et Noragric, Agricultural University of Norway. 3 A. Berge, G., Larsen, K., Rye, S., Dembele, S.M. and Hassan, M. 1999: “Synthesis report and Four Case Studies on Gender Issues and Development of an Improved Focus on Women in Natural Resource Management and Agricultural Projects”, Drylands Coordination Group and Noragric, Agricultural University of Norway. 3 B. Berge, G., Larsen, K., Rye, S., Dembele, S.M. et Hassan, M. 1999:“Rapport de synthèse et quatre études de cas sur Les Questions de Genre et Développement d’une Approche Améliorée concernant les Femmes et les Projets d’Agriculture et de Gestion des Ressources Naturelles”, Groupe de Coordination des Zones Arides et Noragric, Agricultural University of Norway. 4 A. Sydness, M. et Ba, B. 1999: “Processus de decentralisation, développement institutionnel et reorganisation des ONG financées par la Norvège au Mali”, Groupe de Coordination des Zones Arides et Noragric, Agricultural University of Norway. 4 B. Sydness, M. and Ba, B. 1999: “Decentralisation Process, Institution Development and Phasing out of the Norwegian Involvement in Mali”, Drylands Coordination Group and Noragric, Agricultural University of Norway. 5. Waktola, A. and Michael, D.G. 1999: “Institutional Development and Phasing Out of the Norwegian Involvement, the Case of Awash Conservation and Development Project, Ethiopia”, Drylands Coordination Group and Noragric, Agricultural University of Norway. 6. Waktola, A. 1999: “Exploratory Study of Two Regions in Ethiopia: Identification of Target Areas and partners for Intervention”, Drylands Coordination Group and Noragric, Agricultural University of Norway. 7. Mossige, A. 2000: “Workshop on Gender and Rural Development – Training Manual”, Drylands Coordination Group and Noragric, Agricultural University of Norway.
Management of Soil-affected Soils
66
8. Synnevåg, G. et Halassy, S. 2000: ”Sécurité Sémenciére: Etude de la gestion et de l’approvisionnement en semences dans deux villages du cercle de Ké-Macina au Mali: Kélle et Tangana”, Groupe de Coordination des Zones Arides et Noragric, Agricultural University of Norway. 9. Abesha, D., Waktola, A, Aune, J.B. 2000: ”Agricutural Extension in the Drylands of Ethiopia”, Drylands Coordination Group and Noragric, Agricultural University of Norway. 10. Sydness, M., Doumbia, S. et Diakité K. 2000: ”Atelier sur la désentralisation au Mali”, Groupe de Coordination des Zones Arides et Noragric, Agricultural University of Norway. 11. N’Dior, P. A. et Traore, N. 2000: ”Etude sur les programmes d’espargne et de credit au Mali”, Groupe de Coordination des Zones Arides et Noragric, Agricultural University of Norway. 12. Lode, K. and G. Kassa. 2001: ”Proceedings from a Workshop on Conflict Resolution Organised by the Drylands Coordination Group (DCG), November 8-10, 2000 Nazareth, Ethiopia”, Drylands Coordination Group and Noragric, Agricultural University of Norway. 13. Shiferaw, B. and A. Wolday, 2001: “Revisiting the Regulatory and Supervision Framework of the Micro-Finance Industry in Ethiopia”, Drylands Coordination Group and Noragric, Agricultural University of Norway. 14 A. Doumbia, M. D., A. Berthé and J. B. Aune, 2001: “Intergrated Plant Nutrition Management (IPNM): Practical Testing of Technologies with Farmers Groups”, Drylands Coordination Group and Noragric, Agricultural University of Norway. 14 B. Doumbia, M. D., A. Berthé and J. B. Aune, 2001: “Gestion Intégrée de Nutriments Bégetaux (GINV): Tests Pratiques de Technologies avec des Groupes de Paysans”, Groupe de Coordination des Zones Arides et Noragric, Agricultural University of Norway. 15. Larsen, K. and M. Hassan, 2001: “Perceptions of Knowledge and Coping Strategies in Nomadic Communities – The case of the Hawawir in Northern Sudan”, Drylands Coordination Group and Noragric, Agricultural University of Norway. 16 A. Mossige, A., Berkele, Y. & Maiga, S., 2001: “Participation of Civil Society in the national Action Programs of the United Nation’s Convention to Combat Desertification: Synthesis of an Assessment in Ethiopia and Mali”, Drylands Coordination Group and Noragric, Agricultural University of Norway. 16 B. Mossige, A., Berkele, Y. & Maiga, S., 2001: “La Participation de la Societe Civile aux Programme d’Actions Nationaux de la Convention des Nations Unies sur la lutte contre la Desertification”, Groupe de Coordination des Zones Arides et Noragric, Agricultural University of Norway. 17. Kebebew, F., D. Tsegaye and G. Synnevåg: “Traditional Coping Strategies of the Afar and Borana Pastoralists in Response to Drought”, Drylands Coordination Group and Noragric, Agricultural University of Norway. 18. Shanmugaratnam, N., D. Mamer and M. R. Kenyi, 2002: “From Emergency Relief to Local Development and Civil Society Building: Experiences from the Norwegian Peoples’ Aid’s Interventions in Southern Sudan”, Drylands Coordination Group and Noragric, Agricultural University of Norway.

Drylands Coordination Group
67
19. Mitiku, H. and S. N. Merga, 2002: Workshop on the Experience of Water Harvesting in the Drylands of Ethiopia: Principles and practices”, Drylands Coordination Group and Noragric, Agricultural University of Norway.

Management of Soil-affected Soils
68
Drylands Coordination Group Addresses in Norway: ADRA Norge, P.O. Box 6897 St. Olavs Plass, 0165 Oslo, Norway Tel: +47 22 11 20 80, Fax: +47 22 20 53 27 e-mail: [email protected] CARE Norge, Universitetsgt. 12, 0164 Oslo, Norway Tel: +47 22 20 39 30, Fax: +47 22 20 39 36 e-mail: [email protected] The Development Fund, Nedregt. 8, 0551 Oslo, Norway Tel: +47 22 35 10 10, Fax: .+47 22 35 20 60 e-mail: [email protected] Norwegian Church Aid, P.O. Box 4544 Torshov, 0404 Oslo, Norway Tel: +47 22 09 27 99, Fax: + 47 22 09 27 20 e-mail: [email protected] Norwegian People’s Aid, P.O. Box 8844 Youngstorget, 0028 Oslo, Norway Tel: + 47 22 03 77 00, Fax: + 47 22 20 08 70 e-mail: [email protected] Strømme Foundation, P.O. Box 414, 4601 Kristiansand, Norway Tel: +47 38 12 75 00, Fax: + 47 38 02 57 10 e-mail: [email protected] Noragric, Centre for International Environment and Development Studies Agricultural University of Norway, P.O. Box 5001, 1432 Ås, Norway Tel: +47 64 94 99 50, Fax: +47 64 94 07 60 e-mail: [email protected]