management plan for the south australian charter boat fishery · management plan for the south...
TRANSCRIPT

MANAGEMENT PLAN FOR THE SOUTH AUSTRALIAN
CHARTER BOAT FISHERY
Approved by the Minister for Agriculture and Fisheries pursuant to section 44 of the Fisheries Management Act 2007. Hon Michael O’Brien MP Minister for Agriculture and Fisheries 1 August 2011

Page 2 of 66
CONTENTS
1 FISHERY TO WHICH THIS PLAN APPLIES ....................................................... 5
2 CONSISTENCY WITH OTHER MANAGEMENT PLANS ..................................... 5
3 TERM OF PLAN ................................................................................................... 5
4 DESCRIPTION OF FISHERY ............................................................................... 5
4.1 Historical overview ......................................................................................... 6 4.2 Biological and environmental characteristics .................................................. 8 4.3 Economic characteristics ............................................................................. 12 4.4 Social characteristics ................................................................................... 15
5 CO- MANAGEMENT ARRANGEMENTS ........................................................... 16
6 ALLOCATION OF ACCESS BETWEEN SECTORS .......................................... 17
6.1 Current allocated shares of the resource ..................................................... 17 6.2 Information used to allocate shares ............................................................. 18 6.3 Review of allocations ................................................................................... 19 6.4 Process for adjusting allocations of access in future .................................... 19
7 ECOSYSTEM IMPACTS .................................................................................... 22
7.1 Strategies .................................................................................................... 23
8 GOALS AND OBJECTIVES ............................................................................... 25
8.1 Goal 1 – Charter Boat Fishery resources harvested within ecologically sustainable limits ........................................................................................................ 25 8.2 Goal 2 – Optimum utilisation and equitable distribution of the Charter Boat Fishery resources for the benefit of the community .................................................... 26 8.3 Goal 3 – Fishery impacts on the ecosystem are minimised .......................... 26 8.4 Goal 4 – Cost-effective, efficient and participative management of the fishery 26
9 HARVEST STRATEGY ...................................................................................... 32
9.1 Spatial scale of fishery management............................................................ 32 9.2 Catch of Allocated Share ............................................................................. 32
10 EXPLORATORY AND DEVELOPMENTAL FISHING ........................................ 34
10.1 Permits for research fishing ......................................................................... 34 10.2 Exploratory and Developmental Fishing ....................................................... 34
11 STOCK ASSESSMENT AND RESEARCH ........................................................ 35
11.1 Research services ....................................................................................... 35 11.2 Data collection and analysis ......................................................................... 35 11.3 Reporting ..................................................................................................... 35 11.4 Strategic research priorities ......................................................................... 36
12 COMPLIANCE AND MONITORING ................................................................... 37
12.1 Objectives .................................................................................................... 37 12.2 Cost recovery ............................................................................................... 37 12.3 Planning ....................................................................................................... 37 12.4 Risk assessment .......................................................................................... 38 12.5 Responses and benchmarks ........................................................................ 38 12.6 Compliance plans ........................................................................................ 38

Page 3 of 66
12.7 Compliance reporting ....................................................................................38
13 REGULATORY ARRANGEMENTS ....................................................................39
13.1 Licensing ......................................................................................................39 13.2 Management arrangements ..........................................................................42 13.3 Permits .........................................................................................................42
14 REVIEW OF PLAN ..............................................................................................43
15 RESOURCES REQUIRED TO IMPLEMENT THE PLAN ....................................44
15.1 Cost recovery - overview ..............................................................................44 15.2 Cost recovery – Charter Boat Fishery ...........................................................44
16 APPENDICES .....................................................................................................45
16.1 Appendix 1 – Methodology for ESD risk assessment ....................................45 16.2 Appendix 2 – ESD Risk Assessment Overview Table ...................................51 16.3 Appendix 3 – Charter Boat Fishery Statistical Areas .....................................55
17 ACRONYMS .......................................................................................................56
18 GLOSSARY OF COMMON FISHERIES MANAGEMENT TERMS .....................57
19 REFERENCES ....................................................................................................65

Page 4 of 66
LIST OF FIGURES
Figure 1: The number of charter boat clients and trip days per month ........................... 14 Figure 2: The average number of trip days per month and the average number of clients
per trip per licence ........................................................................................................... 15 Figure 3: Allocation framework for the Charter Boat Fishery (flow diagram) ............... 21 Figure 4: Summary of the ESD reporting framework processes .................................... 47
Figure 5: South Australian Charter Boat Fishery Component Tree Structure ................ 48 LIST OF TABLES
Table 1: The number of Charter Boat Fishery licence holders active in the fishery ......... 8 Table 2: Species harvested and retained by financial year in the Charter Boat Fishery . 10
Table 3. Simplified economic cost model for the 2006/07 financial year for the most
popular activities ............................................................................................................. 14 Table 4. Allocated shares of primary target species for the Charter Boat Fishery ......... 17 Table 5: Summary of moderate to extreme risks identified in the Charter Boat Fishery
ESD risk assessment ........................................................................................................ 23
Table 6: Summary of performance indicators and reference points for the Charter Boat
Fishery ............................................................................................................................. 28
Table 7: Permitted devices in the Charter Boat Fishery .................................................. 41 Table 8: Annual schedule for cost recovery in relation to commercial fisheries ............ 44
Table 9: Primary ESD Components ................................................................................ 46 Table 10: Risk ranking definitions .................................................................................. 49 Table 11: Overview of the ESD Risk Assessment for the Charter Boat Fishery ............ 51

Page 5 of 66
1 FISHERY TO WHICH THIS PLAN APPLIES This plan applies to the South Australian Charter Boat Fishery, which is formally constituted by the Fisheries Management (Charter Boat Fishery) Regulations 2005. The regulations define the fishery as consisting of: Facilitating recreational fishing by persons by the provision of charter boat fishing services to the persons under charter boat fishing agreements. Charter boat fishing services means carrying persons as passengers on a boat and otherwise assisting or enabling the persons to engage in recreational fishing from the boat. A charter boat fishing agreement means an agreement made by a person in the course of a business under which the person agrees, for money or other consideration, to facilitate recreational fishing by persons by the provision of charter boat fishing services to the persons. These regulations do not apply in relation to recreational fishing in inland waters.
2 CONSISTENCY WITH OTHER MANAGEMENT PLANS This is the first management plan to be developed under the Fisheries Management Act 2007 (the Act). This management plan has been developed so that it can be integrated with any Aboriginal traditional fishing management plans that are made in the future that apply to the waters of this management plan.
3 TERM OF PLAN This applies from 1 August 2011 for a period of 10 years. Section 49 of the Fisheries Management Act 2007 prescribes the requirements for reviewing or reinstating this management plan.
4 DESCRIPTION OF FISHERY
The South Australian Charter Boat Fishery is a commercial platform for recreational fishing activities. As such, all catch from the fishery is regarded as recreational catch. Charter boat fishing offers recreational fishers an increased probability of success through the guidance of an experienced operator, often using sophisticated fish location technology and a fishing platform that can access good fishing grounds.
A boat is considered to be used for charter boat fishing even if recreational fishing activities are not the sole or primary purpose for which the boat is being used. For example, a dive charter operator or a shark/whale viewing charter operator requires a

Page 6 of 66
Charter Boat Fishery licence if passengers participate in recreational fishing and/or take fish during the charter trip.
A charter boat fishing trip may involve passengers leaving the boat to undertake shore-based fishing. In these cases, all fish taken are considered to be taken pursuant to the charter boat fishing trip. A boat ferrying passengers to and/or from a shore-based fishing destination, provided that no fishing is undertaken while passengers are on board the boat or in association with that boat trip, does not require a Charter Boat Fishery licence.
A charter boat fishing trip may vary from a few hours (enabling a charter fishing operator to conduct multiple charter trips in one day) to a few days, where passengers may stay on board the charter boat and fish taken pursuant to the charter trip are kept on board the boat.
4.1 Historical overview
Primary Industries and Resources South Australia (PIRSA) Fisheries recognised the need for direct management controls on charter boat fishing in the mid 1990s, following the increasing popularity of these fishing ventures. The potential existed for large charter operations to take many passengers on regular trips and take significant quantities of fish.
Left unmanaged, the continued expansion and development of the charter boat fishing industry was likely to have biological impacts on fish stocks and economic consequences for the commercial, recreational and charter sectors. Charter fishing operations needed to be better managed to ensure the sustainability of the state’s aquatic resources.
Moreover, it was considered that controlled development and regulation of the charter boat fishing industry would provide:
Capacity for the management of catch and effort of the sector under sustainable use principles
Reliable information for fisheries management decisions and planning
Capacity to identify and legitimise professional charter fishing operators as stakeholders in fisheries matters and provide for their representation in fisheries management forums
Capacity for the provision of a contribution by the charter boat fishing sector towards the costs of managing fish stocks
Capacity to manage and develop fishing-based tourism in South Australia
In order to meet legislated sustainability objectives and manage charter boat fishing under the auspices of the precautionary principle, charter boat fishing activities needed to be, at least, maintained at existing levels while the level of activity and impacts of this activity on fish resources were assessed. This was important because information relating to the impact of charter fishing on fish stocks was largely unknown.
Prior to the establishment of the Charter Boat Fishery, the industry operated within the constraints of recreational daily bag and boat limits. Operators using larger vessels experienced difficulties in providing an equitable share of fish to passengers, especially with larger numbers (i.e. greater than 3 passengers). For this reason, Ministerial exemptions were required on an annual basis under the Fisheries Act 1982 to increase

Page 7 of 66
individual passenger limits and total boat limits, in order to cater for larger passenger numbers.
On 28 November 2003, the Minister for Agriculture and Fisheries released a policy directions paper on the proposed management of charter boat fishing in South Australia for public consultation. There were 27 recommendations in the paper relating to definitions, licensing, licence endorsements, regulations, industry representation and the development and review of a management plan for the fishery.
A Charter Boat Working Group was established in February 2004. It comprised representatives of the charter boat industry, government agencies including PIRSA and Transport SA, the South Australian Recreational Fishing Advisory Council (SARFAC), the South Australian Tourism Commission and representatives of the commercial Marine Scalefish Fishery. The working group met on four occasions to advise on proposed management arrangements for charter boat fishing and the preparation of a management plan.
The first draft management plan was released on 18 October 2004 for further public consultation and was subsequently finalised in May 2005. A key objective of the first management plan for the Charter Boat Fishery was to integrate the management of charter boat fishing into the overall management of South Australian fish stocks. With many fish stocks at, or near, full exploitation, there was a need to ensure that charter fishing, along with the recreational and commercial fishing sectors, was included in management arrangements for the conservation and sustainable utilisation of fish stocks.
Management controls and standards were also necessary to:
Assist with the orderly expansion and development of a charter boat fishing industry that contributed to the tourism and regional development objectives of the State
Reduce potential conflict with the recreational, Aboriginal and commercial fishing sectors through issues of localised depletion of fish stocks and overcrowding of fishing locations
Ensure orderly and economically sustainable development of the industry so that operators have long-term viability and are willing to invest and promote resource stewardship and best practice for this industry sector
The industry came under new licensing and management arrangements with the Fisheries (Scheme of Management—Charter Boat Fishery) Regulations 2005, gazetted on 21 July 2005. The new regulations (and amendments to existing fisheries legislation) included implementation of:
Eligibility criteria for access
Issuing of licences
Licence transferability
Cost recovery for management through licence fees
Boat registration
Registration of fishing gear
Registration of masters
Requirement to submit catch and effort returns
Specific charter boat fishing catch limits

Page 8 of 66
Licensing and management of the Charter Boat Fishery provided a mechanism for collecting accurate information about catch and effort levels and for putting controls on catch and effort. The establishment of the fishery also brought the industry into the co-management framework for South Australian fisheries, which recognised the South Australian Surveyed Charter Boat Owners and Operators Association (SCBOOA) as the peak industry body to provide advice on management decisions.
Restricted entry was implemented by the first management plan to restrain catch and to avoid over-capitalisation so that biological and economic objectives could be developed for the fishery and pursued in a managed way. Whilst management arrangements developed for the Charter Boat Fishery sought to remove obstacles to competition, it was considered necessary to restrict entry to the fishery as a first step to implementing sustainable management arrangements. The policy of restricted entry has been considered as part of the review of the management arrangements for the Charter Boat Fishery and is maintained by this management plan.
In 2007, the Fisheries Management Act 2007 was introduced to replace the Fisheries Act 1982. The Charter Boat Fishery regulations were carried over under the new Act and became the Fisheries Management (Charter Boat Fishery) Regulations 2005.
A wildlife interaction logbook was introduced for all South Australian commercial fisheries in July 2007, which required mandatory reporting of interactions with threatened, endangered or protected species.
There are 109 licence holders in the Charter Boat Fishery with approximately 71% of operators undertaking regular charter operations (Table 1). On average, 20 000 passengers utilise charter fishing operations in South Australia, undertaking approximately 2 800 fishing trip days every year (SARDI Aquatic Sciences, 2009). Table 1: The number of Charter Boat Fishery licence holders active in the fishery
August 2005 to June 2006
2006/07 2007/08 2008/09 2009/10
Number Active Licence Holders
78 81 78 79 77
(Source: Knight, 2010b)
4.2 Biological and environmental characteristics
4.2.1 Ecosystem and habitat The Charter Boat Fishery operates throughout the coastal marine waters off South Australia and in a variety of different habitat areas. ‘An Inventory of Important Coastal Fisheries Habitats in South Australia’ (Bryars, 2003) identified 12 habitats in South Australia:
Reef
Surf beach
Seagrass meadow
Un-vegetated soft bottom
Sheltered beach
Tidal flat
Tidal creek

Page 9 of 66
Estuarine river
Coastal lagoon
Mangrove forest
Saltmarsh
Freshwater spring The majority of charter boat fishing activities occur around reef, seagrass meadows, unvegetated soft bottom, sheltered beaches and tidal flats. A goal of this management plan is to manage the Charter Boat Fishery as part of the broader ecosystem. Ecosystem impacts of fishing are considered in more detail in section 7.
4.2.2 Biology of key species The following descriptions provide brief background information on the biological characteristics, commercial production statistics and recreational catch and effort levels for primary species in the Charter Boat Fishery. More detailed information is provided in stock assessment and stock status reports prepared by the South Australian Research and Development Institute (SARDI) Aquatic Sciences. All completed reports are available on the PIRSA and SARDI Aquatic Sciences websites at www.pir.sa.gov.au/fisheries or www.sardi.sa.gov.au. Two species have been identified as primary target species in consultation with SARDI and the SCBOOA. The primary target species are recognised as the icon species targeted by operators and most sought after by passengers utilising charter operations. An additional secondary target species list has also been provided. These species were identified as being targeted by operators at much lower levels in regional areas of the state. Primary Target Species
Snapper (Pagrus auratus)
King George Whiting (Sillaginodes punctatus) Secondary Target Species
Western Australian Salmon (Arripis truttacea)
Bight Redfish (previously called Nannygai) (Centroberyx gerrardi)
Snook (Sphyraena novaehollandiae)
Yellowtail Kingfish (Seriola lalandi)
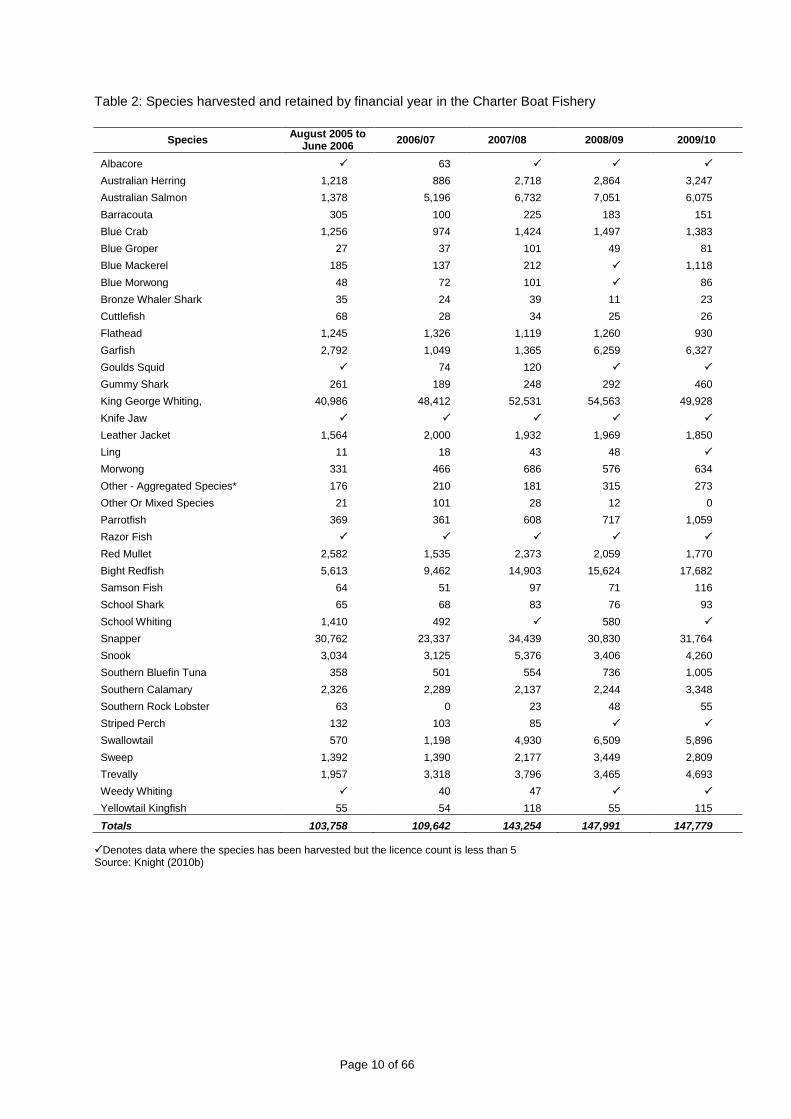
Samsonfish (Seriola hippos) Further to the above mentioned species, Table 2 shows all species harvested and retained in the Charter Boat Fishery through logbook returns.
Page 10 of 66
Table 2: Species harvested and retained by financial year in the Charter Boat Fishery
Species August 2005 to
June 2006 2006/07 2007/08 2008/09 2009/10
Albacore 63
Australian Herring 1,218 886 2,718 2,864 3,247
Australian Salmon 1,378 5,196 6,732 7,051 6,075
Barracouta 305 100 225 183 151
Blue Crab 1,256 974 1,424 1,497 1,383
Blue Groper 27 37 101 49 81
Blue Mackerel 185 137 212 1,118
Blue Morwong 48 72 101 86
Bronze Whaler Shark 35 24 39 11 23
Cuttlefish 68 28 34 25 26
Flathead 1,245 1,326 1,119 1,260 930
Garfish 2,792 1,049 1,365 6,259 6,327
Goulds Squid 74 120
Gummy Shark 261 189 248 292 460
King George Whiting, 40,986 48,412 52,531 54,563 49,928
Knife Jaw
Leather Jacket 1,564 2,000 1,932 1,969 1,850
Ling 11 18 43 48
Morwong 331 466 686 576 634
Other - Aggregated Species* 176 210 181 315 273
Other Or Mixed Species 21 101 28 12 0
Parrotfish 369 361 608 717 1,059
Razor Fish
Red Mullet 2,582 1,535 2,373 2,059 1,770
Bight Redfish 5,613 9,462 14,903 15,624 17,682
Samson Fish 64 51 97 71 116
School Shark 65 68 83 76 93
School Whiting 1,410 492 580
Snapper 30,762 23,337 34,439 30,830 31,764
Snook 3,034 3,125 5,376 3,406 4,260
Southern Bluefin Tuna 358 501 554 736 1,005
Southern Calamary 2,326 2,289 2,137 2,244 3,348
Southern Rock Lobster 63 0 23 48 55
Striped Perch 132 103 85
Swallowtail 570 1,198 4,930 6,509 5,896
Sweep 1,392 1,390 2,177 3,449 2,809
Trevally 1,957 3,318 3,796 3,465 4,693
Weedy Whiting 40 47
Yellowtail Kingfish 55 54 118 55 115
Totals 103,758 109,642 143,254 147,991 147,779
Denotes data where the species has been harvested but the licence count is less than 5 Source: Knight (2010b)

Page 11 of 66
A brief synopsis is provided below on each of the two primary target species, Snapper and King George Whiting, based on the most recent SARDI Aquatic Sciences fishery assessment reports for those species. SNAPPER (Pagrus auratus) Snapper are a member of the family Sparidae, occurring throughout the warm, temperate and sub-tropical waters of the Indo-Pacific region, including Japan, the Philippines, India, Indonesia, as well as Australia and New Zealand (Kailola et al., 1993). They are found in a broad range of habitats from shallow, coastal, demersal areas to the edge of the continental shelf across a depth range from 1 – 200 m. The broad distribution is thought to be divisible into a number of separate stocks, including a division between Victorian and South Australian stocks in the vicinity of the mouth of the River Murray. Snapper can also form separate stocks at spatial scales smaller than the regional geographic scale, however there is little evidence for any finer-scale genetic differentiation amongst Snapper captured from the remaining SA waters. Spawning in Northern Spencer Gulf commences in late November, peaking in December and declining in January before finishing in early February. The timing appears to be approximately one month later in the Southern Spencer Gulf (Fowler et al., 2010). Snapper are multiple batch spawners that spawn over several consecutive days. While spawning seems to occur widely through SA, the main nursery areas are thought to be in the northern parts of both gulfs, particularly Spencer Gulf (Fowler et al., 2008). Mature adults form large schools in preferred spawning areas. Spawning generally occurs in waters less than 50m deep although on occasions schooling does take place at the surface (Kailola et al., 1993). Snapper eggs are pelagic and hatch after approximately 36 hours at 21°C. The larvae are also pelagic and take 20-30 days to develop before they become demersal juveniles (Fowler et al. 2010). Studies on the distribution patterns of eggs are limited but they have patchy distribution patterns, which suggest distinct spawning hotspots. Recruitment of Snapper is highly variable (Fowler et al., 2010). The life history model for Snapper suggest that the majority of fish remain resident to their region whilst a lower proportion of fish are migrants (Fowler et al., 2008) Snapper are long-lived and slow-growing fish; the oldest estimate of age obtained so far from SA is 36 years. The age structures of Snapper from different regions of SA show the presence of strong and weak year classes (Fowler et al., 2010). Age at first maturity also varies throughout their distribution. Snapper from New South Wales are, on average, 3 years old and 30 cm fork length at first maturity. Snapper in Port Philip Bay first breed when they are about 4 years old and 27 cm total length, while those from Southern Australian waters are about 28 cm total length at first maturity. In New Zealand, some juvenile Snapper change sex from female to male but all such changes are completed by the onset of maturity. There have been no investigations of sex reversal in Australian Snapper populations (Kailola et al., 1993). Snapper in Victorian waters feed primarily on crustaceans, bivalve molluscs and small fish. Juveniles and small adults in South Australia feed on King Prawns (Penaeus latisulcatus), while larger fish also feed on thick shelled animals such as Blue Swimmer Crabs (Portunus pelagicus) and mussels (Mytilidae). Whaler sharks (e.g. Carcharhinus obscurus) are known to accompany spawning aggregations of Snapper but their significance as a predator is unknown (Kailola et al., 1993). The Charter Boat Fishery captured and released 3,464 legal sized and 22,263 undersize Snapper during the 2009/10 financial year (Knight, 2010b).

Page 12 of 66
KING GEORGE WHITING (Sillaginodes punctatus) King George Whiting is a member of the family Sillaginidae and is endemic to the shelf waters of southern Australia ranging from Port Jackson on the east coast through Bass Strait and west to Jurien Bay on the west coast of Australia (Kailola et al., 1993). Juveniles occur in shallow waters to depths of 20 m, whilst adults are found in a range of habitats and depths from sandy patches in seagrass meadows to more exposed waters along coastal beaches and reef areas in the continental shelf waters to depths of 50m and greater (Kailola et al. 1993). The nursery areas for King George Whiting are shallow, protected bays where the post-larvae arrive during the winter and spring each year (Fowler et.al., 2008). Spawning in South Australia occurs at the offshore grounds to which fish migrate, including Investigator Strait along the north coast of Kangaroo Island and south-eastern Spencer Gulf around Corny Point and Wardang Island (Fowler et al., 2008). Spawning typically occurs between March and May. King George Whiting are serial batch spawners, yet the number of spawnings in a season is unknown. Batch fecundity increases as the female fish grow – from an average of 100 000 eggs at 34 cm total length to 800 000 eggs at 45 cm (Kailola et al., 1993). King George Whiting eggs are buoyant and the larvae are planktonic. The larvae move inshore to sheltered areas and settle out of the plankton when 60-150 days old and 15-18 mm long, depending on when spawned. Juveniles remain in protected waters for 2-3 years. Older King George Whiting (more than 25 cm total length) move to deeper water, particularly during winter (Kailola et al., 1993). A maximum age of 22 years and a maximum size of 72 cm total length and 4.8 kg have been recorded. Growth rates vary from region to region, depending on the water temperature. King George Whiting grow very little in winter but grow rapidly in the summer months of December to March. They typically reach 31 cm in 3-4 years (Kailola et al., 1993). Maturity is attained at 3 or 4 years of age when males are between 27 cm and 32 cm total length and females between 32 cm and 36 cm total length. The sex ratio at that time is even but among older fish (greater than 50 cm total length), females are 4 times more numerous than males (Kailola et al., 1993). Juvenile King George Whiting feed on benthic amphipods and other crustaceans. As they grow larger, their diet expands to include polychaete worms, molluscs and peanut worms (Sipuncula). Adult King George Whiting are preyed upon mostly by sharks, whilst juveniles are eaten by other fish such as Flathead (Platycephalidae), Australian Salmon (Arripis species) and Barracouta (Thyrsites atun). The Charter Boat Fishery captured and released 1,186 legal sized and 5,718 undersize King George Whiting during the 2009/10 financial year (Knight, 2010b).
4.3 Economic characteristics
There is limited information available on the economic characteristics of the Charter Boat Fishery. Knight et al. (2007) showed costs for individual charter trips vary depending on the type of activity. For example, an inshore scalefish fishing trip may cost between $120 and

Page 13 of 66
$180 per day per client; an offshore/deepwater scalefishing trip between $200 and $650 per day per client, depending on the originating port and destination; a diving tour between $150 and $230 per person; and an eco/passenger tour between $100 and $180 per day per client. On the basis of these figures, the economic value of the Charter Boat Fishery can be estimated to be between $3 and $4.7 million per annum (Table 3).

Page 14 of 66
Table 3. Simplified economic cost model for the 2006/07 financial year for the most popular
activities
Activity Types No. of Clients
Minimum Fee
Maximum Fee
Gross Revenue Est. Min.
Gross Revenue Est. Max.
Diving
36 150 230 5,400 8,280
Deepwater Scalefishing
17 200 650 3,400 11,050
Game Fishing
407 80 150 32,560 61,050
Inshore Scalefishing
16,553 120 180 1,986,360 2,979,540
Offshore Scalefishing
2,107 400 650 842,800 1,369,550
Eco/Passenger Tour
2,405 50 100 120,250 240,500
Totals 21,726 $2,990,770 $4,669,970
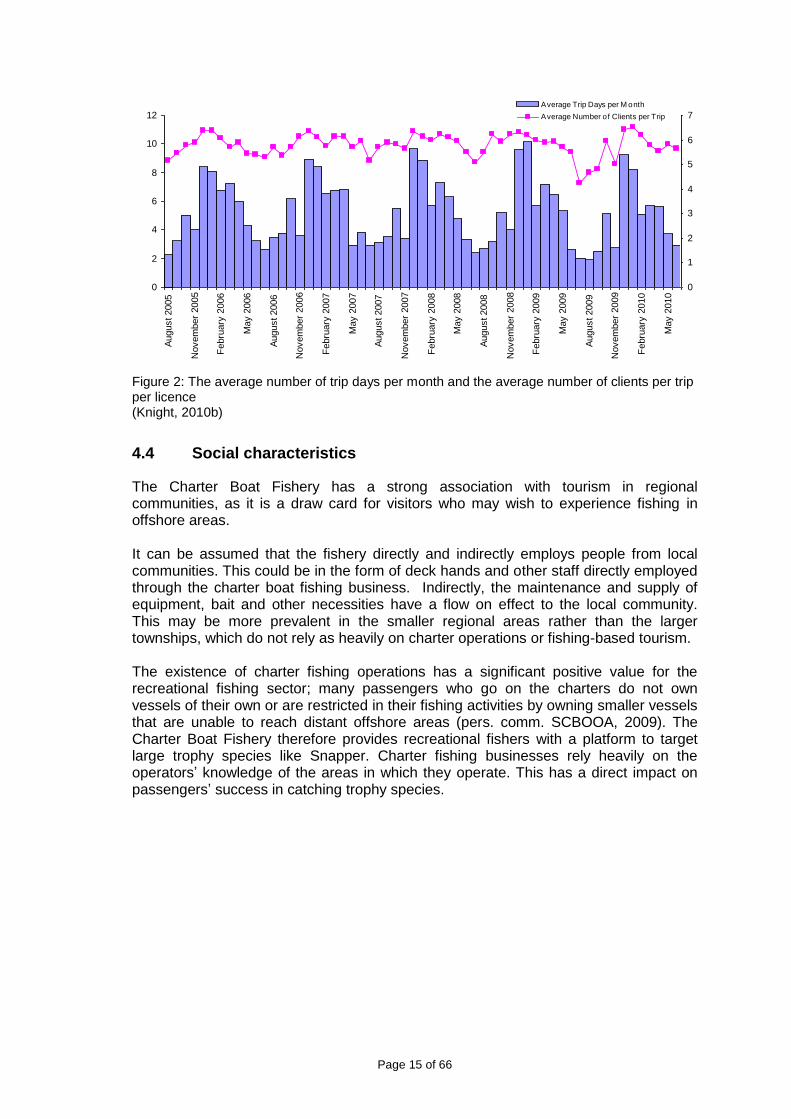
This simple cost model does not illustrate the true value of the industry. A full economic analysis would take into account the benefits the Charter Boat Fishery generates in a community in regards to tourism dollars, charter operators’ maintenance and operating costs and any associated employment stimulation (Knight et al., 2007). Development and assessment of economic indicators for the Charter Boat Fishery will commence in 2010/11. In 2009/10 there were 21,816 clients in the Charter Boat Fishery and 3,693 trip days1 in total. The number of clients and trip days per month peak in December/January each year and are shown in Figure 1 below. The average number of trip days per month during 2009/10 ranged from 1.94 in August to 9.27 in December; the average number of clients per trip ranged from 4.23 in July to 6.52 in January (Figure 2).
Figure 1: The number of charter boat clients and trip days per month (Knight, 2010b)
1 A trip day is the number of times the operator goes out each day
0
500
1000
1500
2000
2500
3000
3500
4000
4500
August 2005
Novem
ber
2005
Febru
ary
2006
May 2
006
August 2006
Novem
ber
2006
Febru
ary
2007
May 2
007
August 2007
Novem
ber
2007
Febru
ary
2008
May 2
008
August 2008
Novem
ber
2008
Febru
ary
2009
May 2
009
August 2009
Novem
ber
2009
Febru
ary
2010
May 2
010
Nu
mb
er
of
Clien
ts
0
100
200
300
400
500
600
700
Nu
mb
er
of
Tri
p D
ays
Number of Clients
Number of Trips
Page 15 of 66
Figure 2: The average number of trip days per month and the average number of clients per trip per licence (Knight, 2010b)
4.4 Social characteristics
The Charter Boat Fishery has a strong association with tourism in regional communities, as it is a draw card for visitors who may wish to experience fishing in offshore areas. It can be assumed that the fishery directly and indirectly employs people from local communities. This could be in the form of deck hands and other staff directly employed through the charter boat fishing business. Indirectly, the maintenance and supply of equipment, bait and other necessities have a flow on effect to the local community. This may be more prevalent in the smaller regional areas rather than the larger townships, which do not rely as heavily on charter operations or fishing-based tourism. The existence of charter fishing operations has a significant positive value for the recreational fishing sector; many passengers who go on the charters do not own vessels of their own or are restricted in their fishing activities by owning smaller vessels that are unable to reach distant offshore areas (pers. comm. SCBOOA, 2009). The Charter Boat Fishery therefore provides recreational fishers with a platform to target large trophy species like Snapper. Charter fishing businesses rely heavily on the operators’ knowledge of the areas in which they operate. This has a direct impact on passengers’ success in catching trophy species.
0
2
4
6
8
10
12
August 2005
Novem
ber
2005
Febru
ary
2006
May 2
006
August 2006
Novem
ber
2006
Febru
ary
2007
May 2
007
August 2007
Novem
ber
2007
Febru
ary
2008
May 2
008
August 2008
Novem
ber
2008
Febru
ary
2009
May 2
009
August 2009
Novem
ber
2009
Febru
ary
2010
May 2
010
0
1
2
3
4
5
6
7
Average Trip Days per M onth
Average Number of Clients per Trip

Page 16 of 66
5 CO- MANAGEMENT ARRANGEMENTS The Fisheries Management Act 2007 establishes the Fisheries Council of South Australia. The Council has responsibility for the preparation of management plans under the Act and for advising the Minister on a range of fisheries management matters. In particular, the Council has been formed to provide advice on strategic issues such as allocation between fishing sectors and the preparation of management plans under the Fisheries Management Act 2007. Arrangements have been established between PIRSA and the representative industry body for each major commercial fishery. The co-management process is aimed at strengthening communication and consultation between PIRSA and industry bodies. These arrangements recognise the relevant body as the representative body for the industry on the basis that they meet the following criteria:
1. Financially viable. The body must be demonstrably financially viable to the extent that it can fulfil a fisheries management advisory role. This will be assessed in terms of financial support for the body and financial capacity to engage in the communication and extension necessary to provide input to fisheries management processes.
2. Representative. The body must be able to demonstrate that it represents the interests of members and the broader industry. This may be demonstrated through the structure of the body, its governance arrangements and its processes for canvassing industry feedback.
3. Credible. The body must have demonstrated an ability to provide credible industry advice on fisheries management issues and to engage with PIRSA in a constructive manner.
The arrangements for specific fisheries have been agreed between PIRSA and the relevant body and are encapsulated in a communication protocol signed by the Director of Fisheries and the body. The Surveyed Charter Boat Owners and Operators Association (SCBOOA) has been recognised as the representative industry body of the Charter Boat Fishery. A communication protocol has been ratified by both PIRSA and the SCBOOA and an annual schedule of meetings and responsibilities is set out pursuant to the protocol. The Minister for Agriculture and Fisheries and the Fisheries Council has oversight of the management of the fishery under this management plan, but day to day management is conducted by PIRSA in association with SCBOOA. Once this management plan has been approved, further discussions will take place with the association to progress co-management, whereby the association considers taking greater responsibility of the management of the fishery.

6 ALLOCATION OF ACCESS BETWEEN SECTORS
6.1 Current allocated shares of the resource
The Fisheries Management Act 2007 provides that a management plan must specify the share of the fishery to be allocated to each fishing sector under the plan (s43(2)(h)). The Act also provides that, in determining the share of aquatic resources to be allocated to a particular fishing sector under the first management plan for an existing fishery, the share of aquatic resources to which that fishing sector had access at the time the Minister requested the Council to prepare the plan (based on the most recent information available to the Minister) must be taken into account (s43(3)). The Minister formally requested that the Fisheries Council prepare this management plan on 3 July 2008. Therefore, this plan must take into account the share of aquatic resources that the Charter Boat Fishery (as part of the recreational sector) had access to at that time. Allocations for the commercial and Aboriginal traditional fishing sectors must be determined at the same time. For the purpose of this management plan, Charter Boat Fishery catch is considered to be recreational catch and is allocated as part of the broader recreational fishing sector. In the allocation of shares of aquatic resources between fishing sectors, the Fisheries Council has also taken the following considerations into account:
1. The importance of equity between the Charter Boat Fishery component and the broader recreational fishing sector allocation
2. The Charter Boat Fishery has commercial interests in allocation (i.e. economic reliance on the resource)
The shares allocated to each sector in relation to the Charter Boat Fishery are: Table 4. Allocated shares of primary target species for the Charter Boat Fishery
Species Commercial Recreational Aboriginal traditional
Snapper
MSF 79% Charter 10%
1% RLF 2% Recreational 8%
LCF 0.03%
Total 81% 18% 1%
King George Whiting
MSF 49.5% Charter 3%
1% RLF 1% Recreational 45.5%
LCF -
Total 50.5% 48.5% 1%
The Charter Boat Fishery also has access to take other aquatic resources (refer to Table 2), which are provided by the Fisheries Management (General) Regulations 2007. There have been no or very low reported catches of these other species by the fishery to date. Therefore, the Fisheries Council has determined that for this Charter

Page 18 of 66
Boat Fishery management plan, it is appropriate to allocate shares of the two primary target species taken in the fishery (Snapper and King George Whiting) only. PIRSA will continue to monitor the take of these other species through catch and effort logbook returns. Any additional future management arrangements will be developed as required and as more information on these species becomes available. Allocations of shares of other species may be made in other relevant fishery management plans, such as for the Marine Scalefish Fishery and the recreational fishery. Commercial Sector Licence holders in the Marine Scalefish Fishery (MSF), rock lobster fisheries (RLF) and Lakes and Coorong Fishery (LCF) with the appropriate gear entitlements are permitted to take Snapper and King George Whiting. There has been a high level of historical take of these two species by the Marine Scalefish Fishery in particular. Commercial fishing activities of the Marine Scalefish Fishery, rock lobster fisheries and Lakes and Coorong Fishery are not managed under this management plan. Shares of the Snapper and King George Whiting resources have been allocated to these commercial fisheries, as components of the commercial sector allocation. Aboriginal Traditional Sector Access to South Australia’s fisheries resources by Aboriginal communities under the Fisheries Management Act 2007 will be provided through Aboriginal traditional fishing management plans. These plans may be developed when an Indigenous Land Use Agreement (ILUA), agreed to resolve a native title claim, is in place in relation to a native title claim area. The State is currently engaged in ILUA negotiations with native title claimants and other stakeholder groups, including the fishing industry. The agreements arising from these negotiation processes will inform the way that access to fisheries resources by Aboriginal communities is defined and implemented. Aboriginal traditional fishing under the Act only relates to fishing agreed through the ILUA process. Aboriginal people are also recreational fishers outside of these arrangements. In this management plan, a share of access has been allocated and set aside for the purpose of resolving these native title claims. There is little available information on the take of the primary target species by the Aboriginal traditional fishing sector; however the small number of claims with fishery-related interests and negotiations to date has informed the share that has been put aside for this purpose. A nominal share of 1% has been made to the Aboriginal tradition sector in this management plan, which has been deducted from the recreational share. This is because Aboriginal traditional fishing is non-commercial fishing. It is anticipated that all fishery-related ILUAs will be negotiated within five years. Therefore, at the five year review for this management plan, any difference between the nominal share put aside and the actual share agreed through the ILUA can be calculated. Any difference would then be re-allocated to or from the recreational sector.
6.2 Information used to allocate shares
In determining the share to be allocated to a particular fishing sector under the first management plan for an existing fishery, the share to which that sector had access at the time the Minister requested the Council to prepare the plan (based on the most recent information available to the Minister) must be taken into account.
Page 19 of 66
Quantifying current shares was an estimate based on the best available information on the current level of use of all sectors. The Allocation Policy requires that information about current use by sectors must be –
Real – that is, data must be available – it must have been collected and published.
Recent – data on which the information is based should be the most recent available, and in any case no more than five years old.
Reliable – the data on which the information is based should have been obtained, and the information or report collated or prepared, in a way that is verifiable. The process for obtaining the data and preparing the information should be properly documented.
The information used to allocate shares of aquatic resources in this management plan is derived from the following sources:
2007/08 South Australian Recreational Fishing Survey (Jones, 2009)
The South Australian Recreational Charter Boat Fishery Report 2009 (Knight, 2010)
South Australian Wild Fisheries Information and Statistics Report (Knight and Tsolos, 2009)
South Australian Wild Fisheries Information and Statistics Report 2008/09 (Knight and Tsolos, 2010)
SARDI Aquatic Sciences catch and effort database of licensed commercial fishers’ logbook returns
6.3 Review of allocations
Allocations between sectors are to be reviewed periodically in accordance with the criteria set out in the Allocation Policy. For the Charter Boat Fishery, the first comprehensive review of shares will be commenced on the fifth anniversary of the commencement of this plan. Where there is a sustainability concern for a particular species or stock, a review will be undertaken at that time.
6.4 Process for adjusting allocations of access in future
A need for adjustment of shares between different sectors may be triggered by:
1. A review of the allocations between sectors (refer to section 6.3 above);
2. A review of the management plan, which will reassess the appropriateness of shares and may trigger an adjustment (refer to section 14);
3. Outcomes of a resource assessment, which trigger a fisheries management decision to adjust the allocated share to each sector; or
4. A trend of increasing catch in the Charter Boat Fishery that exceed the reference limit of 10% increase in allocated catch over a three-year period.
The declaration of a marine protected area that would result in reallocation of shares would be given effect through the Marine Parks Act 2007 and policies applying under
Page 20 of 66
that Act. That Act provides that compensation may be paid to licensed fishers affected by the closure of an area or restrictions of activities within a marine park. The process to allocate shares of aquatic resources for the recreational fishing sector and adjust allocations for the Charter Boat Fishery is displayed in Figure 3. These options will be considered if the allocated catch for the Charter Boat Fishery is exceeded as per the reference limit. The allocation framework for the Charter Boat Fishery is: Initial allocation
1. Undertake 2007/08 South Australian Recreational Fishing Survey to estimate recreational take of aquatic resources.
2. Allocate initial shares of aquatic resources to the recreational sector (including the Charter Boat Fishery component).
Monitoring
3. Monitor Charter Boat Fishery catch annually through catch and effort logbook returns.
4. Monitor recreational sector catch through recreational fishing survey undertaken every five years.
Assessment
5. Use Charter Boat Fishery catch data to assess whether reference limit is triggered (i.e. increasing catch trend for Charter Boat Fishery exceeds 10% allocation over a three-year period).
Adjustment
6. If reference limit is triggered, consider options for trading shares within the Charter Boat Fishery component (including constraining catches to within the fishery’s allocated share), trading shares with the recreational sector or trading shares with the commercial sector.

Page 21 of 66
Figure 3: Allocation framework for the Charter Boat Fishery (flow diagram)
Recreational fishing sector allocation Charter Boat Fishery
component allocation
Monitoring of recreational sector catch every 5 years
Annual monitoring of Charter Boat Fishery catch
Reference limit: Is there an increasing catch trend for the Charter Boat Fishery exceeding 10% allocation over a 3-year period?
Options for adjustment: 1. Trading within Charter Boat
Fishery 2. Trading between Charter
Boat Fishery and broader recreational sector
3. Trading between Charter Boat Fishery and commercial sector
Yes
INITIAL
ALLOCATION
MONITORING
ASSESSMENT
ADJUSTMENT
Estimate of recreational fishing sector catch
No
Charter Boat Fishery allocation remains the same

Page 22 of 66
7 ECOSYSTEM IMPACTS The Fisheries Management Act 2007 requires that ecological impacts be identified and assessed as the first step in developing a management plan. A goal of this plan is to manage the Charter Boat Fishery resources as a part of the broader ecosystem, using an ecosystem-based fisheries management (EBFM) approach. The Act specifically requires that the following impacts are identified:
current known impacts of the fishery on the ecosystem
potential impacts of the fishery on the ecosystem
ecological factors that could have an impact on the performance of the fishery These risks must be assessed to determine the most serious risks and strategies for addressing those risks must be developed. The ecological impacts associated with the fishery have been identified and assessed through the process of conducting an ecologically sustainable development (ESD) risk assessment for the fishery. The National ESD Reporting Framework for Australian Fisheries (Fletcher et al 2002) was used to conduct the risk assessment. The methodology for this risk assessment is described in detail at Appendix 1. In accordance with the ESD objective in the Act, this approach is aimed at assisting PIRSA with identifying and prioritising all of the important ecological, social and economic factors affecting the management of the fishery. Risks and important issues in the fishery were identified in consultation with stakeholders and were prioritised using risk ratings from negligible to extreme. Risks identified as moderate, high or extreme have been summarised in Table 5. Specific management strategies to minimise these risks and associated performance indicators have been developed and are provided in Table 6. An overview of the ESD risk assessment for the Charter Boat Fishery is provided at Appendix 2. The report ‘Ecologically Sustainable Development (ESD) Risk Assessment for the South Australian Charter Boat Fishery’ (PIRSA, 2010) provides detailed information about the Charter Boat Fishery and the outcomes of the ESD risk assessment.
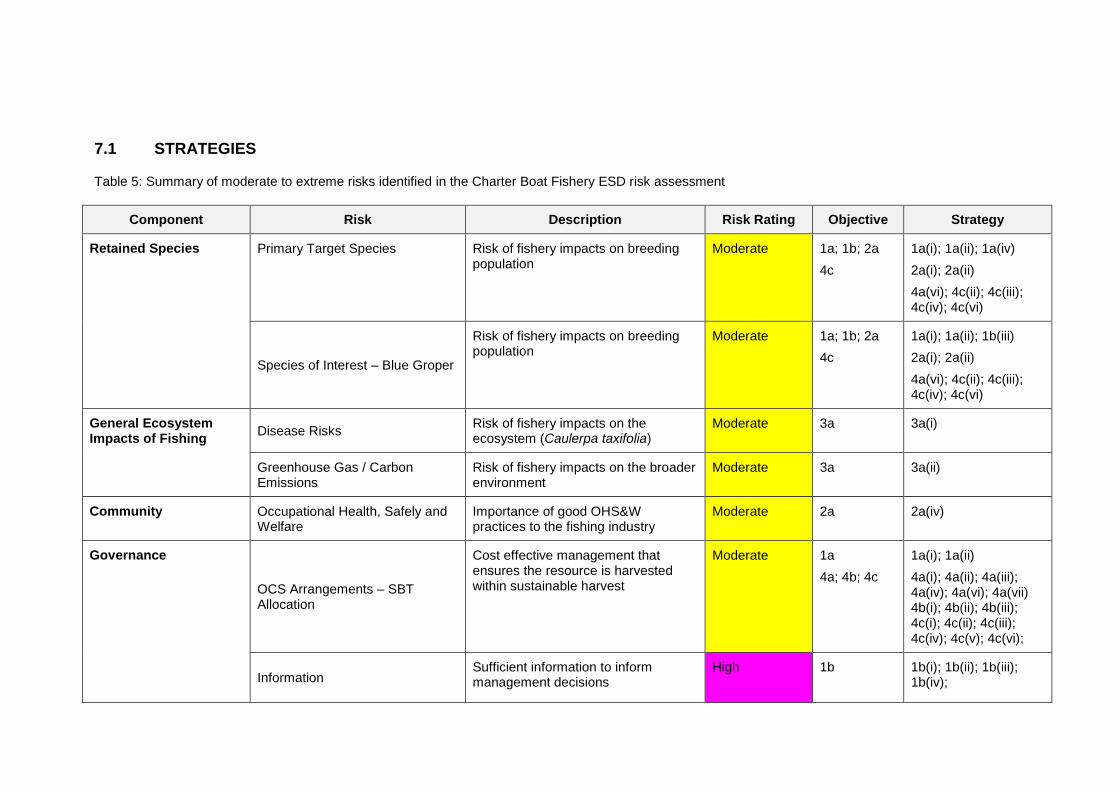
7.1 STRATEGIES
Table 5: Summary of moderate to extreme risks identified in the Charter Boat Fishery ESD risk assessment
Component Risk Description Risk Rating Objective Strategy
Retained Species Primary Target Species Risk of fishery impacts on breeding population
Moderate 1a; 1b; 2a
4c
1a(i); 1a(ii); 1a(iv)
2a(i); 2a(ii)
4a(vi); 4c(ii); 4c(iii); 4c(iv); 4c(vi)
Species of Interest – Blue Groper
Risk of fishery impacts on breeding population
Moderate 1a; 1b; 2a
4c
1a(i); 1a(ii); 1b(iii)
2a(i); 2a(ii)
4a(vi); 4c(ii); 4c(iii); 4c(iv); 4c(vi)
General Ecosystem Impacts of Fishing
Disease Risks Risk of fishery impacts on the ecosystem (Caulerpa taxifolia)
Moderate 3a 3a(i)
Greenhouse Gas / Carbon Emissions
Risk of fishery impacts on the broader environment
Moderate 3a 3a(ii)
Community Occupational Health, Safely and Welfare
Importance of good OHS&W practices to the fishing industry
Moderate 2a 2a(iv)
Governance
OCS Arrangements – SBT Allocation
Cost effective management that ensures the resource is harvested within sustainable harvest
Moderate 1a
4a; 4b; 4c
1a(i); 1a(ii)
4a(i); 4a(ii); 4a(iii); 4a(iv); 4a(vi); 4a(vii) 4b(i); 4b(ii); 4b(iii); 4c(i); 4c(ii); 4c(iii); 4c(iv); 4c(v); 4c(vi);
Information Sufficient information to inform management decisions
High 1b
1b(i); 1b(ii); 1b(iii); 1b(iv);

Page 24 of 66
Component Risk Description Risk Rating Objective Strategy
2d 2d(i)
Allocation Explicit allocation of resource for optimum utilisation & equitable distribution for benefit of community
High 2a; 2b; 2c; 2d
2a(i); 2a(ii) 2a(iii); 2a(vi); 2b(i); 2b(ii) 2b(iii) 2c(i); 2d(i)
Threatened, Endangered and Protected Species
Communicate research and information on the Charter Boat Fishery to the broader community, including charter operators
High 3b 3b(i); 3b(ii); 3b(iii)
External factors affecting performance of the fishery
Water Quality Impact of human induced changes to water quality on resource and performance of fishery
Moderate 3a 3a(i); 3a(iii)
Running Costs Impact of external factors on performance and profitability of the fishery
Moderate 2a; 2d
4a
2a(iii); 2d(i)
4a(i); 4a(ii); 4a(iv)
Marine Parks Impact of external factors (access issues) on performance of fishery
Extreme 4a; 4b 4a(iii); 4a(iv); 4a(vii)
4b(i); 4b(ii); 4b(iii)
Aquaculture Impact on expanding aquaculture sites and loss of access
Moderate 4a; 4b 4a(vii)
4b(i); 4b(ii); 4b(iii);

8 GOALS AND OBJECTIVES Section 7 of the Fisheries Management Act 2007 sets out the objects of the Act. Ecologically sustainable development is established as the overall object of the Act. A number of biological, social and economic factors are identified that must be balanced in pursuing ecologically sustainable development. Object 8.1, relating to the avoidance of over-exploitation, is specified as the primary consideration. Objectives for the Charter Boat Fishery are set out in Table 6. They are organised under four broad goals. These goals and objectives capture all of the factors identified in the Act that must be balanced to pursue ecologically sustainable development. These goals have been developed through the process of undertaking an ESD risk assessment. The methodology for this assessment is described in Appendix 1.
8.1 Goal 1 – Charter Boat Fishery resources harvested within ecologically sustainable limits
This goal relates to the sustainability of the target stock. The primary objective for goal 1 is to ensure that species targeted in the Charter Boat Fishery are harvested sustainably and that adequate information exists and is collected to ensure this occurs. The main management arrangements in place to ensure this occurs are through a mix of controls which include: Input controls
Restricted entry
Restrictions on gear endorsements
Spatial and temporal closures for some species caught in the fishery Output controls
Minimum and maximum legal size limits
Bag and boat limits
Permitted species for harvest As the fishery is relatively new to specific management arrangements under the Act, there is limited historical information on the catch, effort and harvest levels in the fishery. Current species and harvested estimates are collected through catch and effort logbook returns provided to SARDI by charter boat operators for each fishing trip. Further information is available through stock assessments of primary species conducted through the commercial Marine Scalefish Fishery and results from the 2007/08 South Australian Recreational Fishing Survey (Jones, 2009). These additional reports are key pieces of information used to manage the aquatic resources of the State. The objectives in this management plan in relation to sustainability are:
Maintain catches within allocated shares
Collect sufficient fishery, biological and environmental information to inform management decisions

Page 26 of 66
8.2 Goal 2 – Optimum utilisation and equitable distribution of the Charter Boat Fishery resources for the benefit of the community
This goal relates to the economic and social benefits derived from the Charter Boat Fishery. The objectives of this management plan in relation to these benefits are:
Ensure allocation framework provides for development of the Charter Boat Fishery
Equitable public access and recreational fishing opportunities
Recognise Aboriginal traditional fishing access
Sufficient economic information to ensure management decisions are properly informed
Goal 2 aims to optimise the use of the fishery in an equitable way. The fishery aims to maximise economic returns through paying passengers while operating at a level that is ecologically sustainable. Optimising the use of the fishery is addressed in the objectives and strategies in terms of maintaining equitable access to the resource for the broader recreational sector and other sectors while allowing for the development of the Charter Boat Fishery.
8.3 Goal 3 – Fishery impacts on the ecosystem are minimised
This goal relates to the management of the fishery using an ecosystem-based fisheries management (EBFM) approach. The objectives of this management plan in relation to EBFM are:
Minimise fishery impacts on bycatch species and the ecosystem
Avoid the incidental mortality of endangered, threatened and protected species Australian Government guidelines for the ecological sustainability of Australian fisheries acknowledge the need to minimise the impacts of fishing on the ecosystem. Three key objectives were identified to achieve this goal: ensure sustainability of by-catch and by-product species; minimise interactions with threatened, endangered and protected species (TEPS); and minimise impacts on benthic habitats and associated communities.
8.4 Goal 4 – Cost-effective, efficient and participative management of the fishery
This goal relates to co-management of the fishery, planning of management activities and the recovery of the costs of management of the fishery. The objectives of this management plan in relation to co-management, planning and cost recovery are:
Provide cost-effective and efficient management of the fishery, in line with Government’s cost recovery policy
Management arrangements reflect concerns and interests of the wider community
Compliance with management arrangements The key objectives of this goal are to ensure that the Charter Boat Fishery has opportunities to be involved in developing and adopting management arrangements and ensuring that these arrangements are complied with. Changes in management

Page 27 of 66
arrangements need to take into consideration the impact they will have on licence holders and their operations. This, in addition to social and cultural issues, will need to be taken into account when managing the fishery as part of the recreational fishing sector.

Table 6: Summary of performance indicators and reference points for the Charter Boat Fishery
Goal Objective Strategies Addressing Risk Performance Indicator Description Limit Reference Point
Goal 1
Charter Boat Fishery Resources harvested within ecologically sustainable limits
1a Maintain catches within allocated shares.
1a(i) Explicit allocation of key species between identified stakeholders.
Target Species – Breeding Stock populations
Species of Interest
Allocation
Total sector catch for each species identified
Catch ratio between recreational and charter
Catch ratio between charter and commercial
Increasing catch trend for the Charter Boat Fishery that exceeds 10% of the Charter Boat Fishery’s allocation over a three-year period
1a(ii) Ensure other input and output controls support sustainable use of the resource.
1a(iii) Recreational and commercial data on catches is collected.
1a(iv) Monitor catches annually and report in stock assessment.
1b Collect sufficient fishery, biological and environmental information to inform management decisions.
1b(i) Collect fishery-dependent information through commercial logbooks.
Research/information
Target Species – Breeding Stock populations
Licence holders providing timely and regular monthly logbook information.
Charter data used in reports.
Good quality fishery-dependent data on the target species is vital to building a robust suite of fishery data.
N/A
1b(ii) Charter information is made available for inclusion into stock assessments.
1b(iii) Review and update the strategic research and monitoring plan tri-annually.
1b(iv)
1b(v)
Communicate research and information on the Charter Boat Fishery to the broader community, including charter operators.
Develop catch validation processes to improve integrity of fishery-dependant data
Goal 2
Optimum utilisation and equitable distribution of the Charter Boat Fishery resources for the benefit of the community
2a
Ensure allocation framework provides for development of the Charter Boat Fishery.
2a(i) Catch rates monitored annually (where available).
Target Species – Breeding Stock populations
Allocation
Growth of passenger numbers in charter sector.
Increase in trips.
Economic performance of Charter Boat Fishery
Allocation framework will allow for allocation transfer arrangements.
N/A
Information on economic indicators for the Charter Boat Fishery will be collected and reported from 2010/11.
2a(ii) Where shares require adjustment, processes are implemented as per options outlined in this plan (Section 6)
2a(iii) Develop and implement management arrangements that allow commercial operators to maximise operational flexibility, economic efficiency, value and returns.
Running costs
Occupational health,
2a(iv) Industry to maintain adherence to existing occupational health, safety and welfare
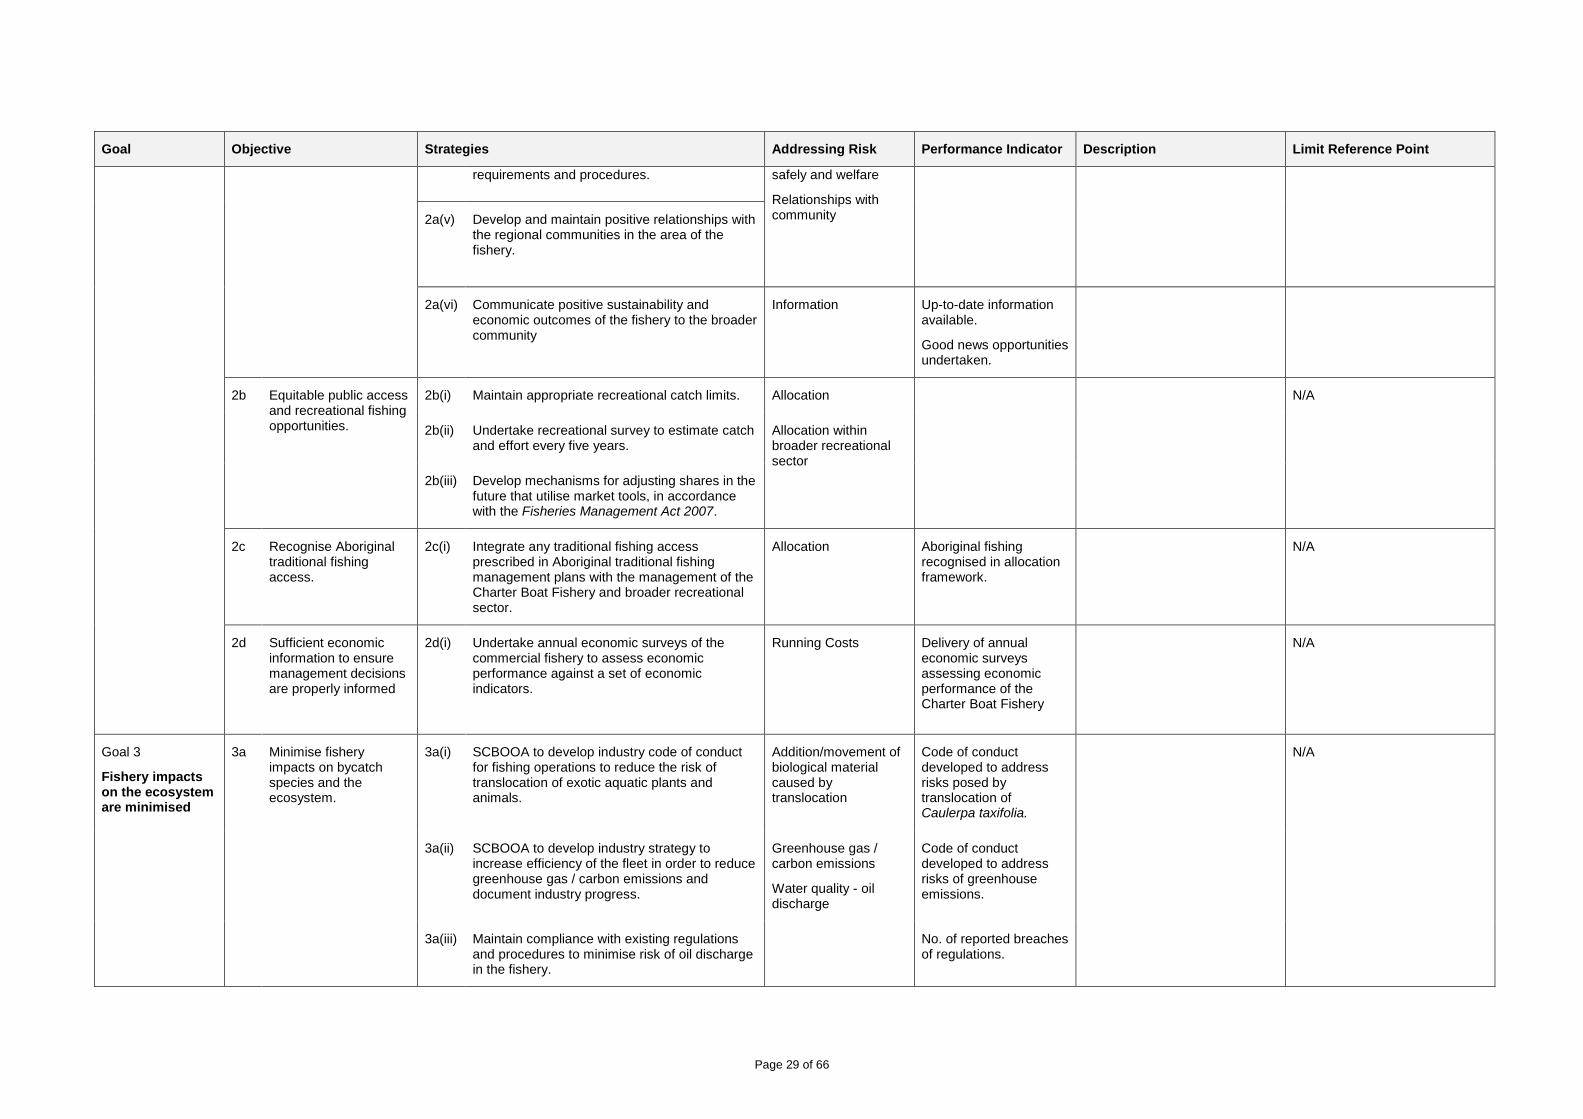
Page 29 of 66
Goal Objective Strategies Addressing Risk Performance Indicator Description Limit Reference Point
requirements and procedures. safely and welfare
Relationships with community
2a(v) Develop and maintain positive relationships with the regional communities in the area of the fishery.
2a(vi) Communicate positive sustainability and economic outcomes of the fishery to the broader community
Information Up-to-date information available.
Good news opportunities undertaken.
2b Equitable public access and recreational fishing opportunities.
2b(i) Maintain appropriate recreational catch limits. Allocation N/A
2b(ii) Undertake recreational survey to estimate catch and effort every five years.
Allocation within broader recreational sector
2b(iii) Develop mechanisms for adjusting shares in the future that utilise market tools, in accordance with the Fisheries Management Act 2007.
2c Recognise Aboriginal traditional fishing access.
2c(i) Integrate any traditional fishing access prescribed in Aboriginal traditional fishing management plans with the management of the Charter Boat Fishery and broader recreational sector.
Allocation Aboriginal fishing recognised in allocation framework.
N/A
2d Sufficient economic information to ensure management decisions are properly informed
2d(i) Undertake annual economic surveys of the commercial fishery to assess economic performance against a set of economic indicators.
Running Costs Delivery of annual economic surveys assessing economic performance of the Charter Boat Fishery
N/A
Goal 3
Fishery impacts on the ecosystem are minimised
3a Minimise fishery impacts on bycatch species and the ecosystem.
3a(i) SCBOOA to develop industry code of conduct for fishing operations to reduce the risk of translocation of exotic aquatic plants and animals.
Addition/movement of biological material caused by translocation
Code of conduct developed to address risks posed by translocation of Caulerpa taxifolia.
N/A
3a(ii) SCBOOA to develop industry strategy to increase efficiency of the fleet in order to reduce greenhouse gas / carbon emissions and document industry progress.
Greenhouse gas / carbon emissions
Water quality - oil discharge
Code of conduct developed to address risks of greenhouse emissions.
3a(iii) Maintain compliance with existing regulations and procedures to minimise risk of oil discharge in the fishery.
No. of reported breaches of regulations.

Page 30 of 66
Goal Objective Strategies Addressing Risk Performance Indicator Description Limit Reference Point
3a(iv) Manage the take of non-target species to ensure that catches remain at very precautionary levels.
Code of conduct developed to address better handling of non-target species.
3a(v) Best handling practices of non-target species are utilised.
3b Avoid the incidental mortality of threatened, endangered and protected species.
3b(i) Continue annual information collection on any interactions with threatened, endangered and protected species (TEPS).
Monitoring of TEPS logbook forms for rising trends.
Number of protected species caught.
Annual report on TEPS interactions available for stakeholders
N/A
3b(ii)
3b(iii)
Improve commercial data recording systems to capture fishing interactions with threatened, endangered and protected species.
Provide threatened, endangered and protected species interaction report summaries to SACBOOA and other stakeholders
3b(iv) Develop management measures to avoid interactions with threatened, endangered and protected species should any new issues arise in the fishery.
Goal 4
Cost-effective, efficient and participative management of the fishery
4a Cost-effective and efficient management of the fishery, in line with government’s cost recovery policy.
4a(i) Develop and implement management arrangements that are effective at achieving management objectives and optimising costs.
Management effectiveness
Economic drivers
PIRSA participates in broader government processes which may impact the fishery.
Communication with recognised peak industry body.
SCBOOA membership reflects the stakeholder interests within the fishery.
N/A
4a(ii) Recover licence fees from commercial licence holders, sufficient to cover the attributed costs of fisheries management, research and compliance of the commercial fishery in accordance with the Government’s cost recovery policy.
4a(iii) Develop options for greater co-management by the Charter Boat Fishery.
Access
Information
4a(iv) Influence other management processes that impact on the ecologically sustainable development of the fishery and access security.
4a(v) Develop and review annually communication protocol.
4a(vi) Changes in status and management arrangements to relevant species in other sectors are communicated to the charter sector

Page 31 of 66
Goal Objective Strategies Addressing Risk Performance Indicator Description Limit Reference Point
4a(vii) Process in place to ensure information is passed on to industry as it becomes available (unless confidentiality policy applies)
4b Management arrangements reflect concerns and interests of the wider community.
4b(i) Promote stakeholder input to the management of the fishery, through co-management processes and communication strategies.
Management effectiveness
ERA re-assessed at management plan review.
N/A
4b(ii) Ensure that social and cultural issues are given appropriate consideration when new management strategies are being developed. Management of key species in other sectors will be consulted prior to a decision.
4b(iii) Communicate management arrangements to the wider community.
4c Compliance with management arrangements.
4c(i) Undertake annual compliance risk assessment. Target Species – Breeding Stock populations
Management effectiveness
Compliance risk assessment undertaken annually.
Number of high-rated risks.
Knowledge of requirements under a licence
Number of prosecutions.
N/A
4c(ii) Review existing reporting and monitoring arrangements where necessary.
4c(iii) Investigate methods to quantify illegal catch.
4c(iv) Develop and implement management arrangements that are clear and uncomplicated so as to promote voluntary compliance and assist with successful enforcement.
4c(v) Where possible, develop and implement licensing, compliance and monitoring arrangements that are consistent with other fisheries to reduce administrative costs.
4c(vi) Encourage the community to report fisheries offences to the Fishwatch number.

9 HARVEST STRATEGY
9.1 Spatial scale of fishery management
The Charter Boat Fishery operates from the Western Australian border (129 E
longitude) to the Victorian border (141 E longitude); a total of 3 820 km of coastline. The South Australian marine waters are divided into marine fishing areas, which are used to distinguish harvest locations and enable spatial research and management of the fishery. Each of the fishing areas have a corresponding map number; charter boat fishing activities are reported against those map numbers (refer to Appendix 3) (Knight and Tsolos, 2010). The marine fishing areas are amalgamated into five regions for the purpose of reporting:
West Coast
Spencer Gulf / Coffin Bay
Gulf St. Vincent / Kangaroo Island
Victor Harbor / South East
Other (offshore areas) The fishery is generally managed at a whole-of-state level with size and catch limits in place for individual species, although there are some specific management arrangements that apply to particular regions of the fishery.
9.2 Catch of Allocated Share
Unlike other fisheries operating with commercial interests, the Charter Boat Fishery is deemed to comprise recreational catch taken from a commercial platform. Monitoring the total catch allocated to the Charter boat Fishery will inform management decisions to constrain future catches taken by the fishery and/or make adjustments to the catch share allocated to the Charter Boat Fishery as a component of the broader recreational fishing sector’s allocation. Such decisions would primarily be made to pursue the sustainability objectives of the Act and the goals of this management plan. Future changes to input and output controls in place for the Charter Boat Fishery (including size and catch limits) would also be considered in the context of these sustainability provisions, as well as the arrangements for the broader recreational fishing sector. The Charter Boat Fishery may expand as the industry continues to develop, via options in this management plan to adjust allocated shares between fishing sectors (including within the charter component of the recreational sector allocation). The framework with options for future allocation adjustments is outlined in Section 6. This plan does not formally outline a harvest strategy for the Charter Boat Fishery as has been done for other commercial fishing management plans. It focuses on maintaining catches within allocated shares for the fishery within the broader recreational sector, at the same time as allowing for development of the Charter Boat Fishery.
Section 6.4 outlines the circumstances that may trigger a need for adjustment of shares between fishing sectors. One of these relates to an increasing trend in Charter Boat Fishery catch. The reference limit defined for exploring options to trade shares of the

Page 33 of 66
two allocated species within the Charter Boat Fishery component, with the recreational sector or with the commercial sector is that there is ‘an increasing catch trend for the Charter Boat Fishery that exceeds 10% of the Charter Boat Fishery’s allocation over a three-year period’.
Page 34 of 66
10 EXPLORATORY AND DEVELOPMENTAL FISHING
10.1 Permits for research fishing
Regulations under the Fisheries Management Act 2007 have provisions to issue permits for research activities with a commercial element. Other non-commercial research activities are authorised by Ministerial exemption. Examples of exemptions issued to licence holders may be the scientific study of species with little scientific knowledge and which may be at risk of over-exploitation. Charter boats may be used as platforms for research under these exemptions in some cases.
10.2 Exploratory and Developmental Fishing
Applications for exploratory and developmental fishing are dealt with under the Exploratory and Developmental Fishing Policy. The Exploratory and Developmental Fishing Policy deals with applications on a case by case basis.

Page 35 of 66
11 STOCK ASSESSMENT AND RESEARCH
11.1 Research services
PIRSA contracts research services for each fishery. SARDI Aquatic Sciences is currently the primary research provider for core research for the Charter Boat Fishery.
11.2 Data collection and analysis
The primary source of data used for stock assessments for Snapper and King George Whiting is fishery-dependent. The collection of fishery-dependent data is facilitated by a commercial logbook program, which requires all commercial fishers to compulsorily record daily information on catch and effort levels and other details on daily fishing operations. This information is entered into a database, which is managed by SARDI Aquatic Sciences. Information collected through the logbook program is periodically reviewed to ensure data collection meets management and research needs. The common unit of effort currently used to measure catch per unit effort (CPUE) in the fishery is fishing time on target species (e.g. Snapper & King George Whiting). These broad units of effort will be refined and standardised during the life of the management plan to improve estimates of CPUE. Due to the inherent limitations associated with fishery-dependent data sets, it is recognised that the information required to generate accurate estimates of some fishery performance indicators may require additional fishery-independent data. It is also recognised that it may be necessary for fishery-dependent data sets to be periodically validated by independent means to ensure accuracy of the data collected. All data available on recreational catch and effort levels will be taken into account when assessing the performance of the Charter Boat Fishery through stock assessment. The data provided by the 2007/08 South Australian Recreational Fishing Survey (Jones, 2009) will be used as the main source of information on catch and effort levels in the recreational sector. Development of cost-effective methods to continue the collection of accurate recreational catch and effort data is identified as a priority in Section 11.4 of this plan.
11.3 Reporting
Three types of report are prepared and delivered periodically for the Charter Boat Fishery:
1. Annual catch and effort report. This annual report compiles catch and effort data supplied by licensed commercial operators in the Charter Boat Fishery. This report monitors catches of all species in the fishery and is delivered to an industry forum each year.
2. The South Australian Recreational Charter Boat Fishery Research Report. This is a more comprehensive report that is published once every three years analysing the performance of the Charter Boat Fishery along with additional information including customer origins, TEPS interactions and limited socio-economic summaries.
3. Economic report. An economic indicators report for the Charter Boat Fishery will be published annually from 2010/11.

Page 36 of 66
4. Stock assessment reports. These major reports for Snapper and King George Whiting are published regularly and document, analyse and interpret the available data and assess these key target species against the performance indicators identified in the management plan for the Marine Scalefish Fishery. Information on stock assessment and stock status for individual species in the Charter Boat Fishery currently relies on reports published by SARDI Aquatic Sciences through the research program for the commercial Marine Scalefish Fishery.
11.4 Strategic research priorities
During the term of this management plan, the Charter Boat Fishery aims to build an understanding about the impacts of the fishery on the aquatic resources of the State. Issues associated with stock abundance and health are primarily addressed under the Marine Scalefish Fishery Strategic Research Plan, developed by PIRSA in conjunction with SARDI and industry. Strategic research priorities identified for the Charter Boat Fishery include:
Cost-effective methods to continue the collection of accurate catch and effort data
Collection of sound economic data for the fishery and the development of economic indicators
Continuing stock assessments for Snapper and King George Whiting
Information on survival and mortality for catch and release fishing
Building capacity and communication / education programs for participants in the Charter Boat Fishery
There are avenues for future research specifically targeted on charter fishing projects, which will be identified by stakeholders including PIRSA, SARDI and the SCBOOA.
Page 37 of 66
12 COMPLIANCE AND MONITORING
12.1 Objectives
PIRSA runs a compliance program that has dual objectives:
To maximise voluntary compliance with fisheries rules2
To create effective deterrence to breaching fisheries rules These objectives are consistent with the National Fisheries Compliance Policy. Voluntary compliance is maximised through ensuring that fishers are aware of the rules that apply to their fishing activities, understand the rules and the purpose of those rules, and operate in a culture of compliance. Effective deterrence is created through the presence of Fisheries Officers and awareness of compliance operations, as well as through detection and prosecution of illegal activity.3
12.2 Cost recovery
The costs of the compliance program are funded in two ways. The costs attributed to the commercial sector are recovered from licence holders through licence fees. This is done in accordance with the Government’s cost recovery policy for fisheries. PIRSA and industry associations are involved in annual negotiations in relation to the proposed compliance program and associated costs. The costs attributed to non-commercial sectors are funded by the Government from consolidated revenue. The compliance program directly related to charter boat operators is funded by the Charter Boat Fishery through licence fees.
12.3 Planning
PIRSA compliance programs are developed on an annual basis to:
Support the fisheries management objectives for each fishery
Identify compliance risks in each fishery
Respond to key risks within each year
Have an appropriate mix of tools designed to maximise voluntary compliance and create effective deterrence
Establish benchmarks against which to measure responses to risks
2 Rules include regulations, licence conditions, closure notices or any other enforceable instrument under
the Fisheries Management Act 2007. 3 Prosecution may include the issuing of a formal caution or an expiation notice, in addition to prosecution
through the courts.

Page 38 of 66
12.4 Risk assessment
A risk assessment is undertaken on an annual basis for each fishery. This assessment identifies and prioritises the compliance risks that exist in the fishery. Risks are ranked according to the likelihood and consequence of the risk occurring. This risk assessment is used to inform annual compliance planning processes. The risk assessment for the Charter Boat Fishery will be conducted each year prior to the commencement of the cost recovery cycle for the following year. The risk assessment process will involve representatives of the SCBOOA.
12.5 Responses and benchmarks
Compliance activities are planned to respond to the risks identified in each fishery, with an emphasis on the most serious risks. Responses must include measures aimed at both maximising voluntary compliance and creating effective deterrence. Benchmarks are established by which to measure compliance activities. These benchmarks are used to guide the allocation of resources in compliance planning.
12.6 Compliance plans
Plans are developed each year and are implemented for the full licensing year.
12.7 Compliance reporting
Every year a report is to be prepared assessing the compliance status of the Charter Boat Fishery. This report will:
Describe the compliance program for the previous year, including an overview of activities and relevant statistics
Describe how the program has been implemented to achieve both voluntary compliance and create effective deterrence
Describe the risks that have been addressed as a priority over that period
Comment on any changes to the risk profile of the fishery during that period
Analyse the compliance status of the fishery (including information about intelligence reports received)
Make suggestions for future compliance planning In addition to the yearly report, quarterly reports will be provided to the industry to capture any emerging compliance trends for the Charter Boat Fishery.

13 REGULATORY ARRANGEMENTS Regulatory arrangements for the Charter Boat Fishery are contained within the Fisheries Management (Charter Boat Fishery) Regulations 2005 and the Fisheries Management (General) Regulations 2007. Any amendments to the above regulations could change the regulatory arrangements listed in this section. Appropriate consultation will be undertaken should that occur. In relation to licences, the Minister reserves the right to amend licence conditions and entitlements for the Charter Boat Fishery if required to meet sustainability objectives of the Fisheries Management Act 2007 and/or in this plan through the term of the plan. In addition, the Fisheries Council of South Australia is currently undertaking a review of the rules and regulations under the Act (the Rules Review) in order to standardise and simplify the number of rules imposed across all fisheries. The Minister reserves the right to amend licence conditions and entitlements as a result of the outcomes of the Rules Review, including the gear review component.
13.1 Licensing
13.1.1 Issue of licences
Upon the establishment of the Charter Boat Fishery, applicants were granted a licence if they could demonstrate that they had a current charter boat fishing business and were operating that charter boat fishing business on 28 November 2003, or that they were in the process of establishing a charter boat fishing business as of that date.
Persons previously operating charter boat fishing businesses, but who sold or ceased to operate those businesses were not eligible for a licence under the criteria established in the previous management plan.
The Director of Fisheries undertook an initial assessment of licence applications in accordance with the qualification criteria listed below. However, an independent arbiter was appointed to review all applications that were assessed by the Director as not meeting the qualification criteria. This independent arbiter provided further advice to the Director of Fisheries.
An “eligible person or company” was deemed to be:
(a) A person or company who demonstrated that, at the time of making the application, they currently owned a charter fishing business and that business was operating on 28 November 2003; or
(b) A person or company who demonstrated that they were in the process of establishing a charter fishing business on 28 November 2003; or
(c) An Aboriginal corporation who demonstrated that, at the time of making the application, they were a signatory to an Indigenous Land Use Agreement (ILUA) or associated with a signatory to an ILUA that includes provisions about entering the Charter Boat Fishery, and had a business plan for a charter boat fishing business.

Page 40 of 66
These criteria were established by the regulations with the intention of ensuring that a licence was able to be issued to each existing charter boat fishing business that was operating, or was in the process of being established, on 28 November 2003, or an Aboriginal corporation that enters into an ILUA with the Government. The intention of the process was that only one licence was issued in relation to each existing or proposed business. It was not intended that persons involved in charter boat fishing but who did not own an existing or proposed charter boat fishing business would be eligible.
Entry to the fishery was restricted using eligibility criteria to restrain catch and to avoid over-capitalisation so that biological and economic objectives can be developed for the fishery and pursued in a managed way. Management arrangements have been implemented for the Charter Boat Fishery to ensure that there is sustainable utilisation of the marine aquatic resources in the State.
Access to the Charter Boat Fishery is provided through a licence for the Charter Boat Fishery. Licences are issued for a period of ten years under the term of this management plan.
13.1.2 Transferability Charter Boat Fishery licences are fully transferable with the consent of the Director of Fisheries. An application for transfer of a licence must be made to the Director of Fisheries and an appropriate application fee must be paid. Proof of stamp duty payment from Revenue SA must be provided to PIRSA prior to any transfer being finalised.
13.1.3 Registered masters Registered boats must always be in the charge of a registered master who is endorsed on the licence. A maximum of five registered masters are allowed to be endorsed on a licence and only one vessel per licence can be used on the water at any one time. The exception to this rule occurs when licence holders are endorsed to use multiple vessels on the water at any one time. In such cases the number of permitted registered masters then reduces to three per vessel. An application for registration of a person as the master of a boat used pursuant to a licence must be made on the approved form and submitted to the Director of Fisheries. Before registering a master on a licence, the Director must be satisfied as to the following matters:
That the person nominated as a master holds appropriate qualifications as required under the Harbours and Navigation Act 1993 to operate the boat registered on the licence on which the person will be a registered master; and
Holds a current Senior First Aid Certificate; and
Has not, within the period of three years preceding the date of application, been convicted in the State or elsewhere in Australia of an offence involving a breach of any legislation relating to fishing; and
Has no legal proceedings pending alleging an offence involving a breach of any legislation relating to fishing in this State or elsewhere in Australia.
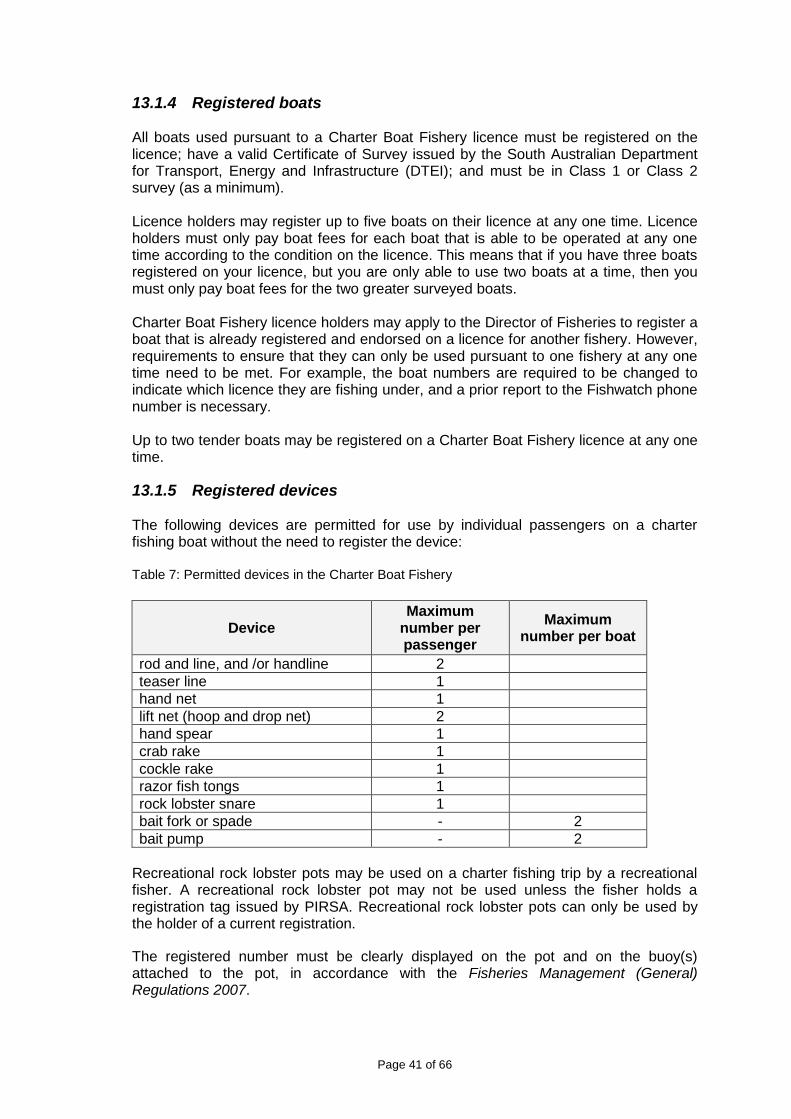
Page 41 of 66
13.1.4 Registered boats All boats used pursuant to a Charter Boat Fishery licence must be registered on the licence; have a valid Certificate of Survey issued by the South Australian Department for Transport, Energy and Infrastructure (DTEI); and must be in Class 1 or Class 2 survey (as a minimum). Licence holders may register up to five boats on their licence at any one time. Licence holders must only pay boat fees for each boat that is able to be operated at any one time according to the condition on the licence. This means that if you have three boats registered on your licence, but you are only able to use two boats at a time, then you must only pay boat fees for the two greater surveyed boats. Charter Boat Fishery licence holders may apply to the Director of Fisheries to register a boat that is already registered and endorsed on a licence for another fishery. However, requirements to ensure that they can only be used pursuant to one fishery at any one time need to be met. For example, the boat numbers are required to be changed to indicate which licence they are fishing under, and a prior report to the Fishwatch phone number is necessary. Up to two tender boats may be registered on a Charter Boat Fishery licence at any one time.
13.1.5 Registered devices The following devices are permitted for use by individual passengers on a charter fishing boat without the need to register the device:
Table 7: Permitted devices in the Charter Boat Fishery
Device Maximum
number per passenger
Maximum number per boat
rod and line, and /or handline 2
teaser line 1
hand net 1
lift net (hoop and drop net) 2
hand spear 1
crab rake 1
cockle rake 1
razor fish tongs 1
rock lobster snare 1
bait fork or spade - 2
bait pump - 2
Recreational rock lobster pots may be used on a charter fishing trip by a recreational fisher. A recreational rock lobster pot may not be used unless the fisher holds a registration tag issued by PIRSA. Recreational rock lobster pots can only be used by the holder of a current registration.
The registered number must be clearly displayed on the pot and on the buoy(s) attached to the pot, in accordance with the Fisheries Management (General) Regulations 2007.

Page 42 of 66
A Charter Boat Fishery licence holder, a registered master and crew operating as agents of the licence holder are not permitted to use recreational rock lobster pots registered under their name, pursuant to the charter fishing licence. Furthermore, they must not be in possession of a rock lobster pot on a registered boat.
The Director may impose conditions on licences in respect of the Charter Boat Fishery, limiting the number of devices that may be carried on boats and otherwise regulating the carrying of devices used for fishing activities pursuant to the licences.
13.2 Management arrangements
The management arrangements in the Charter Boat Fishery include both input and output controls. Current input controls include:
Restrictions on the number of licences through eligibility criteria
Restrictions on the number of vessels per licence that can be used on the water at any one time
Gear limits per passenger
Limited number of qualified registered masters per vessel
Seasonal / area closures for certain species
Prohibition on Charter Boat Fishery licence holders or crew undertaking fishing activities while operating a charter fishing trip (other than assisting customers)
Output controls include limits on the length of retained fish, and bag limits on a per boat and trip basis. These arrangements are legislated under the Fisheries Management (General) Regulations 2007 and Fisheries Management (Charter Boat Fishery) Regulations 2005 and are in place to pursue ESD outcomes for the fishery. Charter operators must also meet marine vessel survey requirements and hold appropriate levels of public liability insurance. Operators must clearly display their Charter Boat Fishery licence number while undertaking fishing charters.
13.3 Permits
There are currently no permits granted in the Charter Boat Fishery. Permit applications can be made by licence holders and will be assessed by the Director of Fisheries on a case-by-case basis.

Page 43 of 66
14 REVIEW OF PLAN Under the Fisheries Management Act 2007 management plans are subject to periodic review by the Fisheries Council. Section 49 of the Act outlines the process of reviewing a management plan.
49—Review of management plans
(1) The Council may review a management plan at any time.
(2) The Council must, as soon as practicable after the fifth anniversary of the commencement of a management plan, conduct a comprehensive review of the plan for the purpose of determining whether the plan should be amended, replaced or reinstated without amendment.
(3) The Council must submit a report on the outcome of a review under this section to the Minister within 12 months after the commencement of the review.
(4) The Minister must, within 12 sitting days after receiving a report under this section, cause copies of the report to be laid before both Houses of Parliament.
(5) If a report under this section recommends that a management plan should be reinstated without amendment on its expiry, the plan may be so reinstated without following the procedures set out in section 44.
(6) If a plan is to be reinstated under this section, the Minister must—
(a) adopt the plan; and
(b) cause notice of that fact to be published in the Gazette; and
(c) in the Gazette notice adopting the plan, fix a date on which the plan will take effect.

Page 44 of 66
15 RESOURCES REQUIRED TO IMPLEMENT THE PLAN
15.1 Cost recovery - overview
South Australian commercial fisheries operate in accordance with the Government’s cost recovery policy, which provides that the costs attributed to the management of the commercial fishery are recovered from industry. Therefore, the costs of policy development, research and compliance programs are 100% cost recovered through legislated licence fees. The commercial fishing industry, through its representative bodies, has a high level of involvement in structuring the relevant policy, compliance and research programs in partnership with PIRSA and its service providers. This is an important facet of co-management in South Australia. The annual schedule for cost recovery in relation to commercial fisheries includes the following key dates: Table 8: Annual schedule for cost recovery in relation to commercial fisheries
Date Activity Parties
Sept/Oct Review long term objectives for fishery and update if necessary.
Identify priority outcomes for upcoming financial year.
PIRSA and Industry Association
October Develop policy, research and compliance work programs in readiness for discussions (fisheries managers with industry) in November
PIRSA
November Consult relevant Industry Associations in relation to proposed programs and reach agreement on these programs. Industry associations to consult with wider industry.
PIRSA and Industry Association
February Formal meetings with Industry Associations to finalise work programs and summarise costs.
PIRSA and Industry Association
March Submit proposed licence fees to Minister.
Prepare cabinet submission to amend regulations to prescribe new fees.
PIRSA and government agencies
June Invoices sent for licence fees. PIRSA
Further details about the process for developing compliance and research programs are set out in sections 11 and 12 of this management plan.
15.2 Cost recovery – Charter Boat Fishery
Charter Boat Fishery management costs are recovered through a base licence fee and an additional boat registration fee per each vessel registered. The base licence fee applies to all licence holders. In addition to the base licence fee, three categories of boat registration fees exist reflecting surveyed capability for taking paying passengers. The three classes are as follows:
Boat that is surveyed to take up to 6 unberthed passengers (Class 1).
Boat that is surveyed to take 7 to 12 unberthed passengers (Class 2).
Boat that is surveyed to take over 12 unberthed passengers (Class 3).

16 APPENDICES
16.1 Appendix 1 – Methodology for ESD risk assessment
The current series of PIRSA ESD performance reports have been prepared to ensure that South Australian fisheries management is both effective and efficient in the context of achieving ESD outcomes. In addition to meeting the statutory requirements of the Fisheries Management Act 2007, and national environmental legislation, this approach will also provide the fishing industry, key stakeholders, and the broader community with an ongoing opportunity to contribute to, and influence, fisheries management outcomes. The reports will also provide the basis for the development of statutory management plans required under the Fisheries Management Act 2007. On behalf of the Fisheries Council of South Australia, PIRSA Fisheries and Aquaculture has used the comprehensive issue identification and subsequent risk assessment and priority setting process to collaboratively develop more effective management arrangements under the Act. Where necessary this may include development of fishery specific harvest strategies, and related research and monitoring programs for each of the fisheries assessed. The issue identification, risk assessment, and reporting process described in detail below, as well as the final report format, is closely based on the National ESD Framework How To Guide (see www.fisheries-esd.com), as well as the Department of Fisheries Western Australia ESD performance reports pioneered by Dr Rick Fletcher and other WA Fisheries staff. SCOPE This ESD report describes “the contribution of the South Australian Charter Boat Fishery to ESD” in the context of South Australian Fisheries legislation and policy. The report is based on preliminary scoping and issue identification work by PIRSA Fisheries staff in conjunction with the Surveyed Charter Boat Owners and Operators industry representatives. This initial scoping was then refined and validated through a broader stakeholder workshop on 15 May 2009 facilitated by Dr Fletcher. The scope of the assessment was contained to issues relevant to the commercial South Australian Charter Boat Fishery. The recreational catch will be assessed separately through an ESD assessment of South Australian recreational fishing. The assessment process examined an extensive range of issues, risks and opportunities identified by stakeholders during various Charter Boat Fishery workshops. The identification of issues was informed by the generic ESD component tree approach with each fishery component tree refined specifically for this fishery. Each major component tree reflects the primary components of ESD, and the ESD report assesses the performance of the fishery for each of the relevant ecological, economic, social and governance issues facing the fishery. The process also identifies where additional (or reduced) management or research attention is needed, and identifies strategies and performance criteria to achieve management objectives to the required standard.

Page 46 of 66
Table 9: Primary ESD Components
OVERVIEW The steps followed to complete this Charter Boat Fishery ESD report are detailed below: 1. A set of “Generic ESD Component Trees” were modified through an iterative
process with stakeholders into a set of trees specific to the fishery. This process identified the issues relevant to ESD performance of the fishery under the categories described in Table 1 above.
2. A risk assessment of the identified issues (or components) was completed based
on the likelihood and consequence of identified events that may undermine or alternatively contribute to ESD objectives. This was an iterative process involving managers, scientists, industry and key stakeholders.
3. Risks were then prioritised according to their severity. For higher level risks -
where an increase in management or research attention was considered necessary - a detailed analysis of the issue, associated risks, and preferred risk management strategies was completed. For low risk issues, the reasons for assigning low risk and/or priority were recorded.
4. For higher level risks a full ESD performance report was prepared. This was
completed in the context of specific management objectives and includes operational objectives, indicators, performance measures and preferred management responses.
5. A background report providing context and necessary supporting information about
the fishery was also prepared to guide the identification of issues, risks and management strategies. This report includes the history of the fishery and its management, the areas of operation and their biological and physical characteristics, target species and by-product and bycatch species, and other relevant information.
The process is illustrated in Figure 4 below.
Retained Species
Non-Retained Species Ecological Wellbeing
General Ecosystem
Community Wellbeing
Aboriginal Community Human Wellbeing
Governance
External Factors Affecting Ability to Achieve Fishery Performance

Page 47 of 66
Figure 4: Summary of the ESD reporting framework processes (Source: ESD Reporting How To Guide).
ISSUE IDENTIFICATION (COMPONENT TREES) The Charter Boat Fishery ESD reporting component trees are a refined version of the generic trees suggested in the National ESD Reporting Framework. The generic trees and the issues that they encompass were the result of extensive consideration and refinement during the initial development of the National Fisheries ESD approach. The trees were designed to be very comprehensive to ensure that all of the conceivable issues facing a fishery would be considered during the workshop process. The fishery specific component trees developed after expert and stakeholder consideration provide a more realistic and practical illustration of the issues facing a particular fishery. The generic component trees have been used as the starting point to ensure thorough, consistent, and rigorous identification and evaluation of ESD issues across all of the South Australian Fisheries being assessed. When developing each of the major fishery specific component trees, each primary component is broken down into more specific sub-components for which operational objectives can then be developed. For example, the component tree identifying external factors affecting ESD performance of the fishery that was refined during the stakeholder workshop for the Charter Boat Fishery is reproduced below.
Report on
Justification for Risk
Rating Only
Low Risk/Priority
Develop Objectives
Indicators
Performance limits
Report Current Status
> Low Risk/Priority
Risk Assessment
ESD Component
Trees
(issues identified)
PLUS
GENERAL
BACKGROUND
INFORMATION
=
ESD REPORT
Use Data for
other
purposes
For
example,
Applications
to EA

Page 48 of 66
Figure 5: South Australian Charter Boat Fishery Component Tree Structure
RISK ASSESSMENT AND PRIORITISATION OF ISSUES Once the fishery specific component trees were developed and reviewed by stakeholders, the focus moved to the assessment and prioritisation of risks and opportunities facing the fishery. These have been considered in the context of the specific management objectives for each fishery being assessed. The higher level management objectives and desired ESD outcomes are those described in the Fisheries Management Act 2007. Risks and opportunities are also evaluated against more detailed fishery specific objectives - such as those articulated in the fishery’s management plan. The risk assessment of issues identified for the Charter Boat Fishery has been done on the basis of existing management which is currently managing risks to the fishery. Hence the risk assessment conducted during stakeholder workshops considered the residual risk after the existing risk treatments were taken into account. For example, PIRSA’s current compliance program for the Charter Boat Fishery is itself based on a separate compliance risk assessment process. This process identifies compliance risks in the context of the fishery’s management objectives, and then develops and applies strategies to mitigate those risks. The ESD assessment and reporting process works across the full suite of fishery ESD objectives in a similar way. Risk assessment applied under the national ESD framework has been designed to be consistent with the Australian Standard AS/NZS 4360:1999 for Risk Management. Subject matter experts and key fishery stakeholders consider the range of potential consequences of an issue, activity, or event (identified during the component tree development process) and how likely those consequences are to occur. The estimated consequence of an event is multiplied by the likelihood of that event occurring to produce an estimated level of risk.
Climate Change
Climate
Pollution
Desalination
Water
Quality
Artificial Reefs
Habitat
Modification
Disease
Biosecurity/pests
Exotic and non-endemic
plant and animals
Human Induced
Changes
Ecological Impacts on the Fishery
Community attitudes
User group conflicts
Social
Running Costs
Travel Costs
Cost of charter
Market Forces
Labour
Availability
Economic
Impacts of Other
Drivers
Marine Parks
Aquaculture
Access
External Factors Affecting Performance of the Fishery

Page 49 of 66
ESD workshop participants worked methodically through each component tree from the top down and conducted a qualitative risk assessment of each issue. An estimate of the consequence level for each issue was made and scored from 0-5, with 0 being negligible and 5 being catastrophic/irreversible. The consequence estimate was based upon the combined judgement of workshop participants who had considerable expertise in the issues being assessed. The level of consequence was estimated at the appropriate scale and context for the issue in question. For the target species the consequence assessment was based at the population not the individual level. Killing one fish is catastrophic for the individual but not for the population. Similarly, when assessing possible ecosystem impacts this was done at the level of the whole ecosystem or at least in terms of the entire extent of the habitat, not at the level of an individual patch or individuals of non-target species4. The likelihood of that consequence occurring was assigned to one of six levels from remote (1) to likely (6). This was based on a judgement about the probability of the events - or chain of events - occurring that could result in a particular adverse consequence. This judgement about conditional probability was again based on the collective experience and knowledge of workshop participants. From the consequence and likelihood scores, the overall risk value (Risk = Consequence x Likelihood), was calculated. On the basis of this risk value each issue was assigned a Risk Ranking within one of five categories. Table 10: Risk ranking definitions
RISK
Rank Likely Management Response Reporting
Negligible
0 Nil Short Justification Only
Low
1 None Specific Full Justification needed
Moderate
2 Specific Management Needed Full Performance Report
High
3
Possible increases to management activities needed
Full Performance Report
Extreme
4 Likely additional management activities needed
Full Performance Report
4 These descriptions, and detailed guidance about developing consequence and likelihood scores for
fishery issues are provided in the ESD How To Guide at www.fisheries-esd.com.
What is Risk Analysis?
“Risk analysis involves consideration of the sources of risk, their
consequences and the likelihood that those consequences may occur.”
Australian and New Zealand Standard (AS/NZS) 4360 – 1999

Page 50 of 66
Where a more detailed and/or quantitative risk assessment and management process was in place for the fishery - such as a robust quantitative stock assessment for a target species - the resultant risk score could be expected to be moderate to low. The risk score in this example reflects the fact that the risk is effectively being managed through existing arrangements. The National ESD Reporting Framework suggests that only those issues scored at moderate, high and extreme risk, which require additional management attention, need to have full ESD performance reports completed. This is the approach that has been used in the PIRSA ESD reports. The rationale for scoring other issues as low or negligible risk has also been documented and form part of these reports. This encourages transparency and should help stakeholders to understand the basis for risk scores and the justification for no further management, or for additional management action if necessary. The process is summarised earlier in this section. PERFORMANCE REPORTS FOR HIGHER RISK ISSUES As noted above, a comprehensive ESD performance report has only been prepared for higher risk/priority issues that require additional management attention (Section 4 in the ESD Risk Assessment of the South Australian Charter Boat Fishery Report). The content of these reports is based on the standard subject headings recommended in the ESD Framework’s How To Guide. The full performance report for the Charter Boat Fishery was developed by PIRSA Fisheries and Aquaculture, informed by the initial consultation with industry and then broader stakeholders at PIRSA’s Adelaide ESD workshop on 15 May 2009. A preliminary draft ESD report was sent to industry members and other stakeholders for review. The review period was brief due to the short time frame available to finalise the reports before consideration by the Fisheries Council in June 2009.

16.2 Appendix 2 – ESD Risk Assessment Overview Table
Table 11: Overview of the ESD Risk Assessment for the Charter Boat Fishery
Issue Risk / Priority
Objective Developed
Indicator Measured
Performance Measure
Current Performance
Robustness Actions
Retained Species
Primary Target Species
M
Yes Total Catch / CPUE
Increasing trend over a period of 3 years exceeding 10% of current level
Acceptable Low Review in 3 years
Regional Target Species
L N
Yes Total Catch / CPUE
Increasing trend over a period of 3 years exceeding 10% of current level
Acceptable Low Review in 3 years
Species of Interest
M N
Yes Total Catch Take of Western Blue Groper remains below 100 fish/year.
Acceptable Low Review with DENR in 3 years
Other N
N/A – negligible risk N/A N/A N/A N/A Review at next major assessment in 5 years
Non-retained species
Captured N
Yes but negligible risk
Number of Interactions
TBD N/A N/A Review at next major assessment in 5 years
Direct Interaction but no Capture
N Yes but negligible risk
Number of Interactions
TBD N/A N/A Review at next major assessment in 5 years
General Ecosystem Effects
Fishing N
N/A – negligible risk N/A N/A N/A N/A Review at next major assessment in 5 years
Bait Collection N
N/A – negligible risk N/A N/A N/A N/A Review at next major assessment in 5 years
Recreational Rock Lobster Pots
N N/A – negligible risk N/A N/A N/A N/A Review at next major
assessment in 5 years

Page 52 of 66
Issue Risk / Priority
Objective Developed
Indicator Measured
Performance Measure
Current Performance
Robustness Actions
Benthic Biota N
N/A – negligible risk N/A N/A N/A N/A Review at next major assessment in 5 years
Discarding N
N/A – negligible risk N/A N/A N/A N/A Review at next major assessment in 5 years
Translocation – Caulerpa taxifolia
N N/A – negligible risk N/A N/A N/A N/A Review at next major
assessment in 5 years
Berleying N
N/A – negligible risk N/A N/A N/A N/A Review at next major assessment in 5 years
Disease Risks M
Yes Number of outbreaks
N/A N/A Bio-security SA monitor disease outbreaks
Green House Emissions M
Yes Code of conduct developed about emissions
N/A N/A N/A Review at next major assessment in 5 years
Water Quality L
N/A – low risk N/A N/A N/A N/A Review at next major assessment in 5 years
4WD Beach Launching N
N/A – negligible risk N/A N/A N/A N/A Review at next major assessment in 5 years
Community
Profit L
N/A – low risk N/A N/A N/A N/A Review at next major assessment in 5 years
Employment L
N/A – low risk N/A N/A N/A N/A Review at next major assessment in 5 years
Asset Value L
N/A – low risk N/A N/A N/A N/A Review at next major assessment in 5 years
Occupational Health, Safely and Welfare M
Yes, as per OHS&W Act
Number of injuries
Under different legislation
N/A N/A N/A - under different Act. Work closely with other Gov Dept.
Relationships N
N/A – negligible risk N/A N/A N/A N/A Review at next major assessment in 5 years
Lifestyle L
N/A – low risk N/A N/A N/A N/A Review at next major assessment in 5 years
Enjoyment L
N/A – low risk N/A N/A N/A N/A Review at next major assessment in 5 years

Page 53 of 66
Issue Risk / Priority
Objective Developed
Indicator Measured
Performance Measure
Current Performance
Robustness Actions
Economic Value L
N/A – low risk N/A N/A N/A N/A Review at next major assessment in 5 years
Social Value N
N/A – negligible risk N/A N/A N/A N/A Review at next major assessment in 5 years
Infrastructure N
N/A – negligible risk N/A N/A N/A N/A Review at next major assessment in 5 years
City Centres N
N/A – negligible risk N/A N/A N/A N/A Review at next major assessment in 5 years
Research / Knowledge L
N/A – low risk N/A N/A N/A N/A Review at next major assessment in 5 years
Research Platform L
N/A – low risk N/A N/A N/A N/A Review at next major assessment in 5 years
Governance
OCS Arrangements – SBT Allocation
M Yes Bag and trip
limits Catches not exceeding limits
Acceptable Medium Subject to AFMA allocation
Information H
Yes Timely provision of information to SCBOOA
Reports provided to SCBOOA as available.
Acceptable Medium Improve provision of information to industry
Allocation
H
Yes Delivery of fishery management plan; To be determined
To be determined
Acceptable Medium As per allocation policy
TEPS H
Yes Timely provision of information to SCBOOA
Reports provided to SCBOOA as delivered.
Acceptable Medium Improve provision of information to industry
External factors affecting performance of the fishery
Climate N
N/A – negligible risk N/A N/A N/A N/A Review at next major assessment in 5 years
Water Quality M
Yes As per EPA water quality guidelines
As per EPA water quality guidelines
Acceptable Low N/A - under different Act Work closely with other Gov Dept.
Habitat Modification L
N/A – low risk N/A N/A N/A N/A Review at next major assessment in 5 years

Page 54 of 66
Issue Risk / Priority
Objective Developed
Indicator Measured
Performance Measure
Current Performance
Robustness Actions
Exotic and Non-Endemic Plants and Animals
N Yes New species
appearing in SA marine habitats
New species, changes in habitat diversity
Acceptable Medium Review at next major assessment in 5 years
Social N
N/A – negligible risk N/A N/A N/A N/A Review at next major assessment in 5 years
Running Costs
M
Yes Economic performance of fishery
To be determined
N/A N/A Pursue reporting of economic indicators for fishery Review at next major assessment in 5 years
Market Forces L
N/A – low risk N/A N/A N/A N/A Review at next major assessment in 5 years
Labour Availability N
N/A – negligible risk N/A N/A N/A N/A Review at next major assessment in 5 years
Marine Parks
E
Yes To be determined
To be determined
N/A N/A Industry and PIRSA Fisheries participate in Marine Parks planning processes
Aquaculture M
Yes To be determined
To be determined
N/A N/A Provide comments to Aquaculture Dept on new proposals
An extreme (red), high (pink) or moderate (yellow) risk/priority rating indicates that the issue was considered a high enough risk/priority to warrant a full performance report and specific management. A green box indicates that a full justification is needed for why the issue was considered low risk. A blue box indicates that the issue was considered a negligible risk, with no specific management required.

Page 55 of 66
16.3 Appendix 3 – Charter Boat Fishery Statistical Areas

17 ACRONYMS AFMA Australian Fisheries Management Authority COC Code of Conduct CPUE Catch Per Unit Effort DEH Department of Environment and Heritage ESD Ecologically Sustainable Development EPBC Act Environment Protection and Biodiversity Conservation Act 1999 FMA Fisheries Management Act 2007 FRDC Fisheries Research and Development Corporation ILUA Indigenous Land Use Agreement MPA Marine Protected Area NRIFS National Recreational and Indigenous Fishing Survey PIRSA Department of Primary Industries and Resources South Australia SARDI South Australian Research and Development Institute SCBOOA Surveyed Charter Boat Owners and Operators Association TEPS Threatened, Endangered and Protected Species

18 GLOSSARY OF COMMON FISHERIES MANAGEMENT TERMS
These terms are intended to be used for the purposes of this management plan only and are not intended to be inconsistent with fisheries legislation. Aboriginal traditional fishing Fishing engaged in by an Aboriginal person for the purposes of satisfying personal, domestic or non-commercial, communal needs, including ceremonial, spiritual and educational needs, and using fish and other natural marine and freshwater products according to relevant aboriginal custom. Adaptive management Management involving active responses to new information or the deliberate manipulation of fishing intensity or other aspects in order to learn something of their effects. Within a stock, several sub-stocks can be regarded as experimental units in which alternative strategies are applied. Age structure A breakdown of the different age groups within an individual population, or population sample. Allocation Distribution of the opportunity to access fisheries resources, within and between fishing sectors. Aquatic plant An aquatic plant of any species, including the reproductive products and parts of an aquatic plant. Aquatic reserve An area of water, or land and water, established as an aquatic reserve by proclamation under the Fisheries Management Act 2007. Aquatic resource Fish or aquatic plants. Bag limit The maximum number of a species that can be legally taken by a recreational fisher per day or per fishing trip, as specified. Beach price Price received by commercial fishers at the "port level" for their catch, and is generally expressed in terms of $/kg. Processing costs are not included in the beach price, as processing operations are assumed to occur further along the value chain. The use of beach prices also removes the effect of transfer pricing by the firm if it is vertically integrated into the value chain. Benthic Describes animals that live on, in or near the substrate. Biodiversity The variability among living organisms from all sources (including terrestrial, marine and other aquatic ecosystems and the ecological complexes of which they are a part) and includes: (a) diversity within species and between species; and (b) diversity of ecosystems. Biological reference point An indicator of the status of an exploited stock and a standard for comparison between years. Two types are often used when sufficient biological data are available: those based on fishing mortality and those based on the sustainability of recruitment. In data poor fisheries, other BPIs related to estimates of relative biomass may be used (i.e. total catch and catch per unit effort). Reference points can be either desirable targets (target reference points) or minimum biologically acceptable limits (limit reference points). Biomass The total weight or volume of individuals in a fish stock.

Page 58 of 66
Boat Business Profit Defined as GOS less Depreciation less Owner-operator and Unpaid Family Labour. Boat Business Profit represents a more complete picture of the actual financial status of an individual firm, compared with GOS, which represents the cash in-cash out situation only. Boat Capital Capital items that are required by the licence holder to earn the boat income. It includes boat hull, engine, electronics and other permanent fixtures and tender boats. Other capital items such as motor vehicles, sheds, cold-rooms, and jetty/moorings can be included to the extent that they are used in the fishing business. The fishing licence/permit value is included in total boat capital. Boat Cash Income Defined as Gross Operating Surplus less imputed wages for owner- operator and unpaid family labour. Boat Gross Margin Total Boat Income less Total Boat Variable Costs. This is a basic measure of profit which assumes that capital has no alternative use and that as fishing activity (days fished) varies there is no change in capital or fixed costs. Boat limit The maximum number of a species that can be legally taken by recreational fishers on a boat per day or per fishing trip, as specified. Bycatch At a broad level, fisheries by-catch includes all material, living and non-living, other than targeted species which is caught while fishing. It includes discards (that part of the catch returned to the water) and also that part of the catch that is not landed but is killed as a result of interaction with fishing gear. By-product Non-targeted catch that is commercially valuable and retained by fishers. Catch The total amount (weight or number) of a species captured from within a specified area over a given period of time. The catch includes any animals that are released or returned to the water. Catch per unit effort (CPUE) The weight or number of a species caught by a specified amount of effort. Typically, effort units are defined using a combination of the following factors: gear type; gear size; the amount of gear; the amount of time the gear is used ; and the number of people operating the gear. CPUE is often used as an index of relative abundance in fisheries stock assessment. In modern assessments, CPUE is standardised to account for the diverse range of factors that can affect CPUE. Closures Prohibition of fishing during particular times or seasons (temporal closures) or in particular areas (spatial closures), or a combination of both. Cohort A group of fish spawned during a specified period, usually within a year. A cohort is also referred to as an age class. Co-management Arrangements between governments and stakeholder groups to allow joint responsibility for managing fisheries resources on a cooperative basis. Co-management arrangements can range from a consultative model, where stakeholders have an advisory role to government, to an informative model where co-managers have decision-making powers. Commercial fishing Fishing undertaken for the purpose of trade or business.

Page 59 of 66
Common property resource A resource that is determined to be owned by the community, or by the State on behalf of the community, and to which no individuals or user groups have exclusive access rights. Cost of management services Commercial fishery management services will generally include biological monitoring and reporting; policy, regulation and legislation development; compliance and enforcement services; licensing services; and research. Where a commercial fishery operates under full cost recovery, licence fees will be set to cover the cost of managing the fishery or at least the commercial sector’s share of the resource. In fisheries where there is full cost recovery, it can be assumed that the cost of providing these management services to the commercial sector will be equal to the gross receipts from licence fees in the fishery. With information on licence fee receipts, GVP, catch and the number of commercial fishers in the fishery, the following indicators can be readily calculated: • aggregate licence fee receipts for the fishery ($) • licence fee/GVP (%) • licence fee/catch ($/kg) • licence fee/licence holder ($/licence holder) Critical habitats Habitats that are crucial in at least part of the life cycle of a species, which typically includes nurseries such as estuaries, mangroves, seagrass beds, reefs and defined spawning areas. Data poor fishery A fishery where limited data are available to inform management. For example, fisheries for species where baseline biological data such as size at maturity, fishing mortality and growth rates are unknown. Depreciation Depreciation refers to the annual reduction in the value of boat capital due to general wear and tear or the reduction in value of an item over time. Ecologically sustainable development Using, conserving and enhancing the community’s resources so that ecological processes, on which life depends, are maintained, and the total quality of life, now and in the future, can be increased. Economic efficiency The maximisation of the value of the net benefits derived from fishery resources. Ecosystem A dynamic complex of plant, animal, fungal, and micro-organism communities and the associated non-living environment interacting as an ecological unit. Effort Amount of fishing taking place, usually described in terms of gear type and frequency or period during which the gear is in use; for example, 'hook-sets', 'trawl-hours', 'searching hours'. Effective fishing effort Measures of fishing effort (such as hooks per day of fishing) that have been standardised so that the measure is proportional to the fishing mortality rate that the gear(s) impose on the stock of fish. Management measures to limit effective effort imply that the fishing mortality rate is to be limited. Fecundity Number of eggs an animal produces each reproductive cycle; the potential reproductive capacity of an organism or population. Fish An aquatic animal other than an aquatic bird, an aquatic mammal, a reptile or an amphibian.

Page 60 of 66
Fishery A term used to describe the collective enterprise of taking fish. A fishery is usually defined by a combination of the species caught (one or several), the gear and/or fishing methods used, and the area of operation. Fishery dependent data Information collected about a fishery or fish stock by the participants of a fishery, eg. catch and effort information from fishery log sheets. Fishery independent data Information collected about a fishery or fish stock by researchers, independent of the fishery, eg. scientific surveys, observer reports. Fishing capacity The amount of fishing effort that a fishing boat, or a fleet of fishing boats, could exert if utilised to its/their full potential. Fishing mortality The rate of deaths of fish due to fishing. Fully exploited This describes a fish stock for which current catches and fishing pressure are close to optimum (the definition of which may vary between fisheries; for example, catches are close to maximum sustainable yield). Categorising a species as 'fully fished' suggests that increasing fishing pressure or catches above optimum (allowing for annual variability) may lead to overfishing. Gear restriction A type of input control used as a management tool to restrict the amount and/or type of fishing gear that can be used by fishers in a particular fishery. Gross Operating Surplus (GOS) is defined as Total Boat Income less Total Boat Cash Costs and is expressed in current dollar terms. GOS may be used interchangeably with the term Gross Boat Profit. A GOS value of zero represents a breakeven position for the business, where Total Boat Cash Costs equals Total Boat Income. If GOS is a negative value the firm is operating at a cash loss and if positive the firm is making a cash profit. GOS does not include a value for owner/operator wages, unpaid family work, or depreciation. Gross value of production (GVP) Value of the total annual catch for individual fisheries, fishing sectors or the fishing industry as a whole, and is measured in dollar terms. GVP, generally reported on an annual basis, is the quantity of catch for the year multiplied by the average monthly landed beach prices. Growth overfishing A level of fishing pressure beyond that required to maximise the yield (or value) per recruit; a level of fishing where young recruits entering the fishery are caught before they reach an optimum marketable size. Habitat The place or type of site in which an organism naturally occurs. Harvest The total number or weight of fish caught and kept from an area over a period of time. Indicator species A species whose presence or absence is indicative of a particular habitat, community or set of environmental conditions. Individually transferable quota A management tool by which portions of the total allowable catch are allocated among licence holders (individual fishers or companies) as units of quota. Quota entitlements can be made to be temporarily or permanently transferable between these licence holders. Input controls Limitations on the amount of fishing effort; restrictions on the number, type, and size of fishing vessels or fishing gear, or on the fishing areas or fishing times in a fishery.
Page 61 of 66
Latent effort The potential for effective effort within a fishery to increase over time (i.e. inactive fishing licences that may be used in the future). Length Frequency An arrangement of recorded lengths of a species of fish, which indicates the number of times each length or length interval occurs in a population or sample. Limited entry Fishing effort is controlled by restricting the number of operators. It usually requires controlling the number of licences in a fishery. It can also include restrictions on the number and size of vessels, the transfer of fishing rights, and the replacement of vessels Logbook An official record (statutory declaration) of catch and effort data made by commercial fishers. Marine protected area An area of land and/or sea especially dedicated to the protection and maintenance of biological diversity and of natural and associated cultural resources, and managed through legal or other effective means. Marine park An area of water, or land and water, considered to be of national significance because of the aquatic flora or fauna of those waters or the aquatic habitat, and established as a marine park by proclamation under the Fisheries Management Act 2007 and/or the National Parks and Wildlife Act 1972. Minimum mesh size The smallest size of mesh permitted in nets and traps; imposed on the basis that smaller individuals will escape unharmed. Mortality Rate of deaths (usually in terms of proportion of the stock dying annually) from various causes. Comprises (i) Natural Mortality - deaths in a fish stock caused by predation, pollution, senility, etc., but not fishing and (ii) Fishing Mortality - deaths in a fish stock caused by fishing. Nominal fishing effort ‘Nominal’ means quantities as they are reported, before any analyses or transformations. Nominal effort refers to measures of fishing effort or vessel carrying capacity that have not been standardised. Non-target species Any part of the catch, except the target species, and including by-catch and by-product. Non-retained species Species that are taken as part of the catch but are subsequently discarded, usually because they have low market value or because regulations preclude them being retained. Offshore Constitutional Settlement (OCS) An agreement between the State(s) and the Commonwealth whereby the State or the Commonwealth (or in some cases a Joint Authority) is given jurisdiction for a particular fishery occurring in both coastal waters and the Australian Fishing Zone. When no OCS agreement has been reached, the fishery remains under the jurisdiction of the State out to 3 nm, and the Commonwealth from 3 to 200 nm. Output controls Limitations on the weight of the catch (quota), or the allowable size, sex or reproductive condition of individuals in the catch. Over-exploited or overfished A fish stock in which the amount of fishing is excessive or for which the catch depletes the biomass too much; or a stock that still reflects the effects of previous excessive fishing.
Page 62 of 66
Owner-operator and Unpaid Family Labour Many fishing businesses there is a component of labour that does not draw a direct wage or salary from the business. This will generally include owner/operator labour and often also include some unpaid family labour. The value of this labour needs to be accounted which involves imputing a labour cost based on the amount of time and equivalent wages rate. In the above calculations this labour cost can be included simply as another cost so that Gross Operating Surplus takes account of this cost. Alternatively, it can be deducted from GOS to give a separate indicator called Boat Cash Income. Owner-operator and unpaid family labour is separated into variable labour (fishing and repairs and maintenance) and overhead labour (management and administration). Parameter A ‘constant’ or numerical description of some property of a population. Parental stock The weight of the adult population of a species. Population A group of individuals of the same species, forming a breeding unit and sharing a habitat. Possession limit A possession limit under the Fisheries Management Act 2007 is a prescribed number of fish for a species that represents what is considered a commercial quantity of that species. If a person has the prescribed amount of fish in their possession, then the onus of proof is reversed in any prosecution relating to taking those fish illegally. Precautionary principle This concept asserts that where there are threats of serious or irreversible damage, lack of full scientific certainty shall not be used as a reason for postponing measures to prevent environmental degradation. In the application of the precautionary principle, public and private decision-making should be guided by: (i) careful evaluation to avoid, wherever practicable, serious or irreversible damage to the environment; and (ii) an assessment of the risk-weighted consequences of various options. Profit at Full Equity Calculated as Boat Business Profit plus rent, interest and lease payments. Profit at Full Equity represents the profitability of an individual licence holder, assuming the licence holder has full equity in the operation, i.e. there is no outstanding associated with the investment in boat capital. Profit at Full Equity is a useful absolute measure of the economic performance of fishing firms. Quota A limit on the weight or number of fish that may be caught of a particular stock or from specified waters. Quota entitlement The proportion of a quota that is allocated to a particular licence, which limits the total amount of a species that is permitted to be taken pursuant to that licence. Rate of Return to Capital Calculated as Profit at Full Equity divided by Boat Capital multiplied by 100. This measure is expressed in percentage terms and is calculated for an individual licence holder. It refers to the economic return to the total investment in capital items, and is a useful relative measure of the performance of individual firms. Rate of return to capital is useful to compare the performance of various licence holders, and to compare the performance of other types of operators, and with other industries. Recreational fishing Fishing other than commercial fishing or Aboriginal traditional fishing, where the catch is released or used for personal consumption or taken for sport. Recruitment The addition of new individuals to a stock. Recruitment overfishing Occurs when excessive fishing effort or catch reduces recruitment to the extent that the stock biomass falls below the pre-defined limit reference point.
Page 63 of 66
Relative abundance An index of fish population abundance used to compare fish populations from year to year. This does not measure the actual numbers of fish, but shows changes in the population over time. Retained species The species within the catch that are not discarded. Sample A proportion or a segment of a fish stock which is removed for study, and is assumed to be representative of the whole. The greater the effort, in terms of both numbers and magnitude of the samples, the greater the confidence that the information obtained is a true reflection of the status of a stock (level of abundance in terms of numbers or weight, age composition, etc.). Seasonal closure The closure of a fishing ground for a defined period of time, usually used to protect a stock during a spawning season. Selectivity The ability of a type of gear to target and catch a certain size or species of fish. Socio-economic Relating to both social and economic considerations. Spatial Of or relating to space. Species A group of organisms capable of interbreeding freely with each other but not with members of other species. Size limits A minimum or maximum size limit determines the legal size at which a given species can be retained. Size of maturity Length or weight of the fish when it attains reproductive maturity. Slot size limit Refers to a situation where both a minimum and maximum size limit has been determined for a given species. Stakeholder An individual or a group with an interest in the conservation, management and use of a resource. Stock A group of individuals of a species occupying a well defined spatial range independent of other groups of the same species, which can be regarded as an entity for management or assessment purposes. Stock assessment A detailed analysis of stock status (abundance, distribution, age structure, etc.) to support the management of the species/fishery. Target species The most highly sought component of the catch taken by fishers. Target effort Effort that is directed at a particular species. Total Boat Cash Costs (TBCC) Defined as Total Boat Variable Costs plus Total Boat Fixed Costs. Total Boat Fixed Costs Costs that remain fixed regardless of the level of catch or the amount of time spent fishing. As such these costs, measured in current dollar terms, are likely to remain relatively constant from one year to the next. Examples of fixed cost include: • insurance • licence and industry fees

Page 64 of 66
• office & business administration (communication, stationery, accountancy fees) • interest on loan repayments and overdraft • leasing Total Boat Income (TBI) Term refers to the cash receipts received by an individual firm and is expressed in dollar terms. Total boat income is calculated as catch (kg) multiplied by ‘beach price’ ($/kg). Total boat income is the contribution of an individual licence holder to the GVP of a fishing sector or fishery. Total Boat Variable Costs Costs which are dependent upon the level of catch or, more commonly, the amount of time spent fishing. As catch or fishing time increases, variable costs also increase. Variable costs are measured in current dollar terms and include the following individual cost items: • fuel, oil and grease for the boat (net of diesel fuel rebate) • bait • ice • provisions • crew payments • fishing equipment, purchase and repairs (nets, pots, lines, etc) • repairs & maintenance: ongoing (slipping, painting, overhaul motor) Traditional fishing Fishing for the purposes of satisfying personal, domestic or non-commercial communal needs, including ceremonial, spiritual and educational needs and utilising fish and other natural marine and freshwater products according to relevant indigenous custom. Temporal Of or relating to time. Threatened A species or community that is vulnerable, endangered or presumed extinct. Total allowable catch (TAC) For a fishery, a catch limit set as an output control on fishing. The total amount of a species that may be taken during a specified time period. Total allowable commercial catch (TACC) For a fishery, a catch limit set as an output control specifically on commercial fishing. The total amount of species that may be taken by commercial fishing during a specified time period. Trigger points Events or measures that, if they occur or if they reach specified levels, are used to determine when a response should be made. Not usually used as a criterion for overfishing, but to indicate the need for review of management. Uncertain A fish stock that may be underfished, fully fished or overfished, but for which there is inadequate or inappropriate information to make a reliable assessment of its status. Under-exploited or underfished A fish stock that has potential to sustain catches higher than those currently taken. Vulnerable species Under endangered species protection legislation, a species that within 25 years will become endangered unless mitigating action is taken. Yield Total weight of fish harvested from a fishery. Yield per recruit Analysis of how growth and natural mortality interact to determine the best size of animals for harvest.
19 REFERENCES Bryars, S. (2003). An Inventory of Important Coastal Fisheries Habitats in South Australia: Fisheries habitat Program, Department of Primary Industries and Resources South Australia (PIRSA), Adelaide. FAO. (1996) Precautionary approach to capture fisheries and species introductions. Elaborated by the Technical Consultation on the Precautionary Approach to Capture Fisheries (Including Species Introductions). Lysekil, Sweden, 6-13 June 1995. FAO Technical Guidelines for Responsible Fisheries. No. 2. Rome. FAO. 1996. 54p. Fletcher, W.J., Chesson, J., Fisher M., Sainsbury, K.J., Hundloe, T., Smith, A.D.M. and B. Whitworth (2002) National ESD Reporting Framework for Australian Fisheries: The ‘How To’ Guide for Wild Capture Fisheries. FRDC Project 2000/145, Canberra, Australia. Fowler, AJ (2008). The Population biology of snapper (Pagrus auratus) in Gulf St Vincent. Natural history of Gulf St Vincent: 385-98. Fowler, AJ and Jones, GK (2008). The Population biology of King George whiting (Sillaginodes punctata) in Gulf St Vincent. Natural history of Gulf St Vincent: 399-414. Fowler, AJ, McGarvey, R & Feenstra, JE (2008). King George whiting (Sillaginodes punctata) Fishery. Fishery Assessment Report to PIRSA. SARDI Aquatic Sciences Publication No F2007/000843-2. SARDI Research Report Series Number 296. August 2008. Fowler, AJ, McGarvey, R, Burch, P, Feenstra, JE & Jackson WB (2010). Snapper (Chrysophrys auratus) Fishery. Fishery Assessment Report to PIRSA. SARDI Aquatic Sciences Publication No F2010/??? SARDI Research Report Series Number ???. June 2010. [to be published] Henry, G.W. & Lyle, J.M. (2003). The National Recreational and Indigenous Fishing Survey. FRDC Project No. 99/158. Kailola, P.J., Williams, J.M., Stewart, C.P., Reichelt, E.R., McNee, A. and Grieve, C. (1993). Australian Fisheries Resources. Bureau of Resource Sciences, Department of Primary Industries and Energy, and the Fisheries Research and Development Corporation. Canberra, Australia. Imprint Limited, Brisbane. Knight. M (2010a). The South Australian Recreational Charter Boat Fishery Report 2009. South Australian Research and Development Institute (Aquatic Sciences), Adelaide, 46p. SARDI Publication No. F2007/000847-2. Knight. M (2010b). Data Summary of the South Australian Recreational Charter Boat Fishery September 2010. South Australian Research and Development Institute (Aquatic Sciences), Adelaide, 11p. Knight, M.A. Doonan, A.M. & Tsolos, A. (2007). The South Australian Recreational Charter Boat Fishery. SARDI Research Report Series 239 Publication number F2007/000847-1. South Australian Research and Development Institute. Knight, M. and Tsolos, A. (2009). South Australian Wild Fisheries Information and Statistics Repot. South Australian Research and Development Institute (Aquatic Sciences), Adelaide, F2008/000804-1. SARDI Research Report Series No.305. 72p.
Page 66 of 66
Noell, C., Presser, J., Jones, K (2006) Management Plan for the South Australian Marine Scalefish Fishery. The South Australian Fisheries Management Series, Paper No 45. Primary Industries and Resources South Australia. Presser, J and Mavrakis, V (2005). Management Plan for the South Australian Recreational Charter Boat Fishery. The South Australian Fisheries Management Series, Paper No 43. Primary Industries and Resources South Australia. Wayte,S, Hobday, A., Fulton, E., Williams, A., Smith, A. (2004). Draft Ecological Risk Assessment for the Effects of Fishing: South East Trawl and Danish Seine Fishery. In Hobday, A., A.D.M. Smith and I. Stobutzki. Ecological Risk Assessment for Australian Commonwealth Fisheries. Final Report - Stage 1. Hazard identification and preliminary risk assessment, July 2004. Report to the Australian Fisheries Management Authority, Canberra, Australia Webb, H. Hobday, A., Walker, T, Timmis, T. and Smith, ADM. (2004). Draft Ecological Risk Assessment for the Effects of Fishing: Gillnet, Hook and Trap Fishery (v7). In Hobday, A., A.D.M. Smith and I. Stobutzki. Ecological Risk Assessment for Australian Commonwealth Fisheries. Final Report - Stage 1. Hazard identification and preliminary risk assessment. July 2004. Report to the Australian Fisheries Management Authority, Canberra, Australia