management review full year 2014 - amadeus management review… · ... vistara) are implemented, we...
TRANSCRIPT

amadeus.com
Management Review
Full Year 2014
February 27, 2015

Page 2 of 50 amadeus.com
© 2
015 A
madeus I
T G
roup S
A
Index
1 Summary .............................................................................................. 3
1.1 Introduction .................................................................................. 4
1.2 Summary of operating and financial information ................................ 6
2 Operating Review ................................................................................... 7
2.1 Key business highlights for the fourth quarter ................................... 8
2.2 Key ongoing R&D projects............................................................. 10
3 Presentation of financial information ....................................................... 12
3.1 Acquisitions completed in 2014...................................................... 13
3.2 Purchase price allocation exercises ................................................. 14
3.3 Presentation of financial information .............................................. 14
4 Operating and financial performance by segment ..................................... 19
4.1 Distribution ................................................................................. 20
4.2 IT Solutions ................................................................................ 24
4.3 EBITDA ...................................................................................... 27
5 Consolidated financial statements ........................................................... 28
5.1 Group income statement .............................................................. 29
5.2 Statement of financial position (condensed) .................................... 35
5.3 Group cash flow ........................................................................... 40
6 Investor information ............................................................................. 44
6.1 Capital stock. Share ownership structure ........................................ 45
6.2 Share price performance in 2014 ................................................... 45
6.3 Shareholder remuneration ............................................................ 46
7 Key terms............................................................................................ 47
8 Annexe. Amadeus social and environmental initiatives .............................. 48
Page 3 of 50 amadeus.com
© 2
015 A
madeus I
T G
roup S
A
1 Summary

Page 4 of 50 amadeus.com
© 2
015 A
madeus I
T G
roup S
A
1.1 Introduction
Full year 2014 highlights (year ended December 31, 2014)
_ In Distribution, our air travel agency bookings grew 5.2%, to 466.5 million
_ In IT Solutions, our total passengers boarded increased by 12.9%, to 695.4 million
_ Revenue increased by 10.1%, to €3,417.7 million
_ EBITDA increased by 9.9%, to €1,306.0 million
_ Adjusted profit1 increased by 9.9%, to €681.1 million
_ Free Cash Flow increased by 10.1%, to €596.3 million
_ Ordinary shareholder remuneration of €0.70 per share (12% increase) plus €320 million share
buy-back programme
_ Covenant net financial debt was €1,738.5 million at December 31, 2014 (1.32 times covenant last
twelve month’s EBITDA)
We have closed 2014 with a strong set of results. In 2014, group Revenue and EBITDA achieved growth of 10.1%
and 9.9%, respectively, which in turn supported Adjusted Profit growth of 9.9%. Our steady growth stems from
the positive underlying evolution of both our Distribution and IT Solutions businesses, as well as from our 2014
M&A activity completed in the first and second quarter (Newmarket, UFIS and i:FAO2). Revenue, EBITDA and
Adjusted Profit growth, excluding acquisitions, was 7.5%, 7.7% and 7.8%, each respectively.
In Distribution, during the fourth quarter, we successfully renewed or signed content agreements with 15 airlines.
Our volumes continued building positively, on the back of stable industry growth and our notable global market
share gains of 1.4 p.p. in the quarter. These were fuelled by our presence in Asia, where we have increased our
addressable markets by expanding our presence in South Korea. Beyond this regional expansion, the US continues
to be our fastest-growing region, where our credentials continue to grow positively on several fronts. For the full
year, our global market share grew to 40.7%, an increase of 0.7 p.p. over last year. Excluding acquisitions, our
Distribution Revenue increased by 5.6% in 2014, primarily driven by air volume growth (5.2%) and moderate
pricing expansion.
Our IT Solutions business continued its positive track record in the fourth quarter. Migrations continued
contributing to passengers boarded volumes, which grew by 9.7%. The positive results in the fourth quarter
confirmed the solid performance delivered in the year, evidenced by a 12.9% revenue increase (excluding
acquisitions), driven by a 12.9% increase in processed passengers. We benefited throughout 2014 from the large
Asian migrations completed towards the end of 2013 and we also migrated Korean Air at quarter-end 3Q2014.
Once the new customer gains announced throughout 2014 (such as Southwest, Japan Airlines, Swiss, Thomas
Cook, Vistara) are implemented, we will be processing close to 1bn passengers boarded annually in 2017.
Additionally, we have 16 new airlines using our Altéa DCS module in 2014 and have continued to upsell e-
commerce and standalone IT solutions to our customer base during the year.
In 2014, we have also made key, positive progress in our new initiatives, such as airport, hotel and rail IT.
Amadeus is uniquely placed to address these market opportunities, to drive innovation in these sectors and to
shape the future of travel. Although still early, Airport IT continues to gain ground in the ground handling market
1 Excluding after-tax impact of the following items: (i) accounting effects derived from PPA exercises and impairment losses,
(ii) changes in fair value of financial instruments and non-operating exchange gains (losses) and (iii) other non-recurring
items.
2 Newmarket, UFIS and i:FAO results are consolidated by Amadeus with effect from February 5, 2014, February 1, 2014 and
July 1, 2014, respectively.

Page 5 of 50 amadeus.com
© 2
015 A
madeus I
T G
roup S
A
through our Altéa DCS for Ground Handlers solution, our differentiated ACUS offering has had very positive
reception in the market and our portfolio of airport management solutions continues to gradually grow its
customer base. In Hotel IT and Rail IT, we continue to work ahead with InterContinental Hotels Group and
BeneRail International in the context of our strategic relationships and partnerships. Furthermore, we believe that
in the future, by enabling connectivity across all these segments. Amadeus will bring important benefits to our
partners in the travel market, by facilitating increased personalization of offers to travellers.
We remain highly focused on our technology. Our investment in R&D increased by 8.7% in 2014, reaching 15.9%
of our revenue. Customer implementations, product evolution, portfolio expansion and investment in new
opportunities, all supporting future growth, represented our main R&D activity in the period.
As of December 31, 2014 our consolidated net financial debt was €1,738.5 million (based on our covenants’
definition), representing 1.32 times last twelve months’ EBITDA. Despite our free cash flow generation of €596.3
million (up 10.1% over 2013), our leverage has increased over prior year, driven by the M&A activity completed
in first half as well as the share repurchase programme announced by Amadeus on December 11, 2014.
The Board of Directors of Amadeus agreed to undertake a share buy-back programme, in accordance with the
authorisation granted to it by the Annual General Shareholders Meeting held on June 20, 2013, with the purpose
of reducing Amadeus’ share capital (subject to agreement at the Annual General Shareholders Meeting in June
2015). The programme will remain in force until May 29, 2015 and the maximum investment will amount to €320
million, not exceeding 2.79% of the share capital of the Company (or 12,500,000 shares).
In December 2014, the Board of Directors also proposed a 50% pay-out target ratio for 2014. Accordingly, the
Board of Directors will submit a final gross dividend of €0.70 per share from the 2014 reported profit to the
General Shareholders Meeting for approval in June 2015, representing an increase of 12% vs. the 2013 dividend.
An interim gross dividend of €0.32 per share was paid in January 2015.

Page 6 of 50 amadeus.com
© 2
015 A
madeus I
T G
roup S
A
1.2 Summary of operating and financial information
Summary of KPI Figures in million euros
Full year 2014
Full year 2013
% Change
Full year 2014 (excl. M&A)1
% Change (excl. M&A)1
Operating KPI
Air TA Market Share 40.7% 40.1% 0.7 p.p. 40.7% 0.7 p.p.
Air TA bookings (m) 466.5 443.4 5.2% 466.5 5.2%
Non air bookings (m) 59.4 59.2 0.3% 59.4 0.3%
Total bookings (m) 525.8 502.6 4.6% 525.8 4.6%
Passengers Boarded (m) 695.4 615.7 12.9% 695.4 12.9%
Financial results
Distribution Revenue 2,455.1 2,317.8 5.9% 2,447.7 5.6%
IT Solutions Revenue2 962.62 785.9 22.5% 887.3 12.9%
Revenue2 3,417.72 3,103.7 10.1% 3,335.0 7.5%
Distribution Contribution 1,082.1 1,035.9 4.5% 1,080.3 4.3%
IT Solutions Contribution2 651.02 550.7 18.2% 627.0 13.8%
Contribution2 1,733.12 1,586.6 9.2% 1,707.2 7.6%
EBITDA2 1,306.02 1,188.7 9.9% 1,280.1 7.7%
EBITDA margin (%) 38.2% 38.3% (0.1 p.p.) 38.4% 0.1 p.p.
Adjusted profit3 681.1 619.5 9.9% 667.7 7.8%
Adjusted EPS (euros)4 1.53 1.39 9.9% 1.50 7.8%
Cash flow
Capital expenditure 427.5 411.2 4.0% 419.4 2.0%
Free cash flow5 596.3 541.7 10.1% n.a. n.a.
31/12/2014 31/12/2013 % Change
Indebtedness6
Covenant Net Financial Debt 1,738.5 1,210.7 43.6%
Covenant Net Financial Debt / LTM Covenant EBITDA
1.32x 1.01x
1. For comparability purposes, we have excluded the Newmarket, UFIS and i:FAO results. The “% Change (excl. M&A)”
column above shows the comparable growth, excluding the impact from these acquisitions. See section 3.1. 2. The revenue and contribution of the IT Solutions business (including M&A) are impacted by the accounting effects
derived from the PPA exercises undertaken in Q4 2014 related to the consolidation of Newmarket and UFIS in Amadeus. Such effects, amounting to €10.1 million, negatively impact the group revenue, group contribution and EBITDA (in-cluding M&A). Figures excluding M&A are not impacted by these effects. See table in section 3.3 and a detailed expla-nation in section 3.2.
3. Excluding after-tax impact of the following items: (i) accounting effects derived from PPA exercises and impairment losses, (ii) changes in fair value of financial instruments and non-operating exchange gains (losses) and (iii) other non-recurring items. See section 5.1.8 for further explanation.
4. EPS corresponding to the Adjusted profit attributable to the parent company. Calculated based on weighted average outstanding shares of the period. See section 5.1.9 for further explanation.
5. Calculated as EBITDA less capital expenditure plus changes in operating working capital less taxes paid less interests and financial fees paid. See further detail in section 5.3.
6. Based on the definition included in the senior credit agreement covenants. Covenant net financial debt at December 31, 2014 includes debt amounting to €288.8 million relating to the share buy-back programme announced on Decem-ber 11, 2014, as explained in section 5.2.5.

Page 7 of 50 amadeus.com
© 2
015 A
madeus I
T G
roup S
A
2 Operating Review

Page 8 of 50 amadeus.com
© 2
015 A
madeus I
T G
roup S
A
2.1 Key business highlights for the fourth quarter
The following include selected business highlights for the fourth quarter of 2014:
Distribution
Airlines
_ Content agreements with 15 carriers were renewed or signed as part of the on-going commitment of Amadeus
to provide our travel agency subscribers globally with the most comprehensive range of fares, schedules and
availability. Airlines with whom Amadeus has a content agreement represent over 80% of Amadeus’ airline
bookings worldwide.
_ Bookings from travel agencies on low-cost carriers were up by 12% year-on-year during the last quarter.
Amadeus’ XML technology has enabled low-cost carriers, since its introduction in 2007, to benefit from the
reach and yield provided by distribution through travel agencies whilst removing the complexity for airlines
associated with traditional ticketing processes. To date 79 low-cost carriers have become Amadeus
distribution partners.
_ Expedia, one of the world's largest full service online travel sites, has partnered with Amadeus to begin
offering customers branded fares from select airlines by mid-2015 and several more by the end of the year.
This allows participating airlines to seamlessly offer their branded fares and travellers the possibility to select
a fare with the attributes that matter most to them. Merchandising and retailing are vital for travel players to
better meet traveller needs and unlock additional revenues in a rapidly changing market.
_ A multi-year agreement was reached with Ctrip, China’s leading travel company in terms of market
capitalisation, to include the provision of all air content for points of sale outside of mainland China. This
initially includes Hong Kong, Taiwan, Korea and the USA, with future plans to move into Canada, Australia,
New Zealand, Japan and Thailand. Ctrip will implement Amadeus Master Pricer TravelBoard (including multi-
merchant capability) as its low fare search engine, as well as Amadeus Mini Rules and Amadeus Ticket
Changer, with the aim of adopting more of Amadeus’ powerful online search solutions in the near future.
_ The gap in the ‘first and last mile’ of air journeys has been closed with Amadeus Taxi & Transfer solution,
working in partnership with Cabforce to make the service already bookable via the website of launch partner
Scandinavian Airlines. Although the taxi-transfer services of Cabforce, which provides a unified service in
more than 35 countries worldwide, are already available through Amadeus e-Travel Management and
Amadeus Selling Platform, this partnership marks the first time that a taxi-transfer solution is integrated into
an airline’s website. Already several other airlines are in the pipeline to integrate Amadeus Taxi & Transfer
solution onto their sites.
_ Merchandising solutions from Amadeus attracted further customers with eight new airlines signing-up for the
Amadeus Airline Ancillary Services solution. This included Etihad Airways when it became the first airline in
the United Arab Emirates to deploy the solution, enabling travel agencies using Amadeus to book the airline’s
popular ‘extra leg-room seats’. One airline also signed an agreement for the Amadeus Fare Family Solution,
taking the total to 15. Currently a total of 110 airlines have contracts for the Amadeus Airline Ancillary Services
solution, which is integrated and supporting airlines to deploy ancillary services in over 100 markets
worldwide.
_ Additionally Etihad Airways has also deployed a local pilot version of Amadeus Electronic Miscellaneous
Document (EMD), enabling travel agents to issue documents for all travel-related services, including

Page 9 of 50 amadeus.com
© 2
015 A
madeus I
T G
roup S
A
unbundled airline services, in a single passenger name record (PNR). We estimate that Amadeus currently
generates at least 90%3 of EMDs produced worldwide.
IT Solutions
Airline IT
_ Following the successful Altéa migrations of Seaport Airlines and Southwest Airlines’ international flights, Cape
Air selected the full Altéa Suite and became the third U.S. carrier to be implemented in 2014. Cape Air is one
of the leading regional carriers in the U.S. and flies over 735,000 passengers annually across five regions,
including the United States, Caribbean and Micronesia.
_ Azul Brazilian Airlines, a leading Brazilian low-cost carrier, adopted Altéa Reservation and ticketing for its
international flights, following the airline launching routes to new international destinations such as Fort
Lauderdale / Miami and Orlando. Implemented successfully in just three months, already Azul’s international
flights can now be viewed, searched and purchased through any sales channel both direct and indirect,
including connections.
_ Vistara, the recently launched full service carrier, became the first airline in India to implement airline IT
solutions from Amadeus. The joint venture between Tata Sons Limited and Singapore Airlines Limited (SIA)
uses the Amadeus Altéa Suite to power Vistara’s travel reservations, inventory management, and airport
departure control systems, as well as revenue accounting and revenue management.
_ Thomas Cook group airlines will become the first leisure carriers to use the Amadeus Altéa Suite. Four of
the group’s airlines based in Germany, the UK, Scandinavia and Belgium will adopt the single platform to
manage reservations, inventory and departure control.
_ At the close of the year there were 133 airlines around the world contracted for both Altéa Reservation and
Altéa Inventory, 117 of which were contracted to use the full Altéa Suite. At the same date, 124 airlines were
implemented to both Altéa Reservation and Altéa Inventory, 91 of which to the full Altéa Suite. Amadeus
Altéa Suite facilitates closer integration between partner airlines that need to share availability, fares,
customer and booking information, enabling a seamless customer experience across alliance members. Based
upon these contracts, Amadeus estimates that by 2017 the number of annual contracted Passengers Boarded
will be close to one billion, which would represent an increase of 44% vs. the 695 million passengers processed
on the Altéa platform during 2014 – or a compound annual growth rate (CAGR) of c. 13%.
Airport IT
_ London Gatwick Airport (LGW) became the first airport to implement the Amadeus cloud-based Airport-
Collaborative Decision Making Portal (A-CDM). The European-wide A-CDM standard aims to bring the entire
airport ecosystem (airport operators, airlines, ground handlers and air traffic management) together to
operate more efficiently and transparently, sharing timely and accurate information. Gatwick opted for the
cost-effective cloud technology from Amadeus to speed up the implementation time of A-CDM, rolling out the
Amadeus portal to 300 users in just eight weeks. Assisted by Amadeus, London Gatwick Airport will handle
55 flights per hour from the world’s busiest runway and estimates up to 2 million additional passengers.
_ More recently, Innsbruck became the first airport to contract the Amadeus Airport Passenger Verification
solution, which facilitates smoother security control processes, as well as the first airport to deploy Amadeus
Airport Common Use Service. In addition the airport is also implementing Baggage Reconciliation Solution
(BRS).
3 Based on internal estimates. Calculated as the volume of EMDs issued by Amadeus over the total EMDs produced annually.

Page 10 of 50 amadeus.com
© 2
015 A
madeus I
T G
roup S
A
Payments
_ Further expanding the capacity of Amadeus travel customers to accept more payment forms from travellers
in more countries and in more currencies, a global agreement was reached to integrate into the Amadeus
Payment Platform (APP) the extensive payment services of Worldpay, the global leader in payment
processing, risk management and alternative payments. As authorisation is integrated into the ticketing and
selling flow, the Amadeus Payment Platform ensures a fast and easy payment process for all its users –
additionally enhancing transaction information facilitates payment reconciliation.
Additional news from the fourth quarter
_ Further recognition of our long-standing commitment to innovation was gained: Amadeus has been recently
announced to be 2013´s leading European investor in R&D for the travel and tourism sector by the EU
Industrial R&D Investment Scoreboard. The annual European Commission report ranks European companies
by total investment in R&D. Between 2004 and 2013 Amadeus has invested close to €3 billion in R&D.
_ Shortly before Christmas Iberia.com’s UNICEF initiative celebrated its first year by announcing that its
Amadeus-powered micro-donation engine had raised more than €200,000 – helping to protect the lives of
600,000 infants in Chad as part of a vaccination campaign. Donations had increased from €70,000 in the first
half of the year to an extra €130,000 in second half, demonstrating the still unfulfilled but transformative
potential of using travel technology to help social causes. This news followed Finnair also joining the initiative
during the fourth quarter and installing the Amadeus-powered micro-donation engine on its website to help
further support UNICEF.
_ ‘Cleared for take-off’ urged travel businesses to adopt and apply the principles of ‘lean’ thinking across IT and
operations, or risk being left behind. The Amadeus commissioned research was written by innovation
forecaster James Woudhuysen and argues that only by embracing lean thinking in IT, and removing those
activities that do not create value for the customer, can the industry also have more control over both system
complexity and costs.
_ The CDP Climate Performance Leadership Index 2014 awarded an A grade to Amadeus for its actions to
reduce carbon emissions and mitigate the business risks of climate change. The index presents 187 listed
companies identified as demonstrating a superior approach to climate change mitigation and is produced by
CDP, the international NGO that drives sustainable economies, at the request of over 700 investors who
represent more than a third of the world’s invested capital.
2.2 Key ongoing R&D projects
R&D investment in the year 2014 relates primarily to:
_ Customer implementation efforts:
Migration development work in relation to Altéa implementations carried out in the year (namely
Southwest –the international passengers business- and Korean Air, as well as a large number of
migrations to the DCS module). Also, the contracted pipeline scheduled for migration in the coming
years (such as Southwest –the domestic passengers business-, Japan Airlines and Swiss). Additionally,
implementation developments in relation to new customers adopting e-commerce and standalone
solutions.
Works for implementation of our new Revenue Accounting module in our customers British Airways and
South African Airways.
Implementation efforts in relation to our DCS solution for ground handlers, including those implemented
in the year as well as those scheduled to be implemented in the coming years.

Page 11 of 50 amadeus.com
© 2
015 A
madeus I
T G
roup S
A
Migration of travel agencies in Korea from the local reservation system, Topas, to the Amadeus
platform.
Implementation of customers to our portfolio of solutions for airlines and travel agencies, including the
addition of low cost carriers to the platform and the expansion of our customer base in ancillary services
products.
_ Product portfolio expansion:
For airlines, including revenue management, availability, schedules, mobile functionality and XML
development in compliance with NDC standards.
For travel agencies, travel management companies and for corporations, such as a new generation
selling platform, search engines and mobile tools.
Investment in our Global Merchandising Platform, including the expansion of merchandising capabilities,
enhanced shopping and booking solutions and ancillary services.
Investment in relation to the creation of the Total Travel Record (the future evolution of the PNR,
containing all traveller information with cross-sell, cross-channel, multi-GDS data and related customer
management functionalities).
Regionalisation investment, with the aim to better adapt part of our product portfolio to specific regions.
_ Increased resources dedicated to our new initiatives (hotel, rail, airport IT, payments and travel intelligence)
to expand our current portfolio of solutions:
Development of new modules of our airport IT suite of products, including those contracted by the
Copenhagen and Munich airports.
Development costs associated with our agreements with IHG and BeneRail within the scopes of our
hotel and rail businesses, respectively.
Enhanced distribution capabilities for hotel and rail.
Investment in payments and travel intelligence, where we continue to work with different industry
partners.
_ Ongoing TPF decommissioning, which implies the progressive migration of the company’s platform to next-
generation technologies such as Linux and Unix (today, close to 90% of Amadeus’ software is supported by
next-generation open systems, which allow for improved efficiency, greater flexibility in terms of the
architecture and scalability of the platform), other cross-area technologies such as the Amadeus Collaborative
Technology (a corporate program built to enhance the Amadeus system and which will bring a new technical
platform and architecture for a new selling platform, shared by our two businesses) and system performance
projects aiming to optimise service levels and system reliability and performance.

Page 12 of 50 amadeus.com
© 2
015 A
madeus I
T G
roup S
A
3 Presentation of financial information

Page 13 of 50 amadeus.com
© 2
015 A
madeus I
T G
roup S
A
The source for the financial information included in this document is the audited consolidated financial statements
of Amadeus IT Holding, S.A. and subsidiaries, which have been prepared in accordance with International
Financial Reporting Standard as adopted by the European Union.
Certain amounts and figures included in this report have been subject to rounding adjustments. Any discrepancies
in any tables between the totals and the sums of the amounts listed are due to rounding.
3.1 Acquisitions completed in 2014
Acquisition of Newmarket
On February 5, 2014 Amadeus acquired, 100% of the voting rights of NMTI Holdings, Inc. and its group of
companies ("Newmarket”). The cash paid was €333.2 million. The transaction was fully financed by a new bank
loan facility, which was drawn down on February 4, 2014 (as explained in section 5.2.5, this facility was refinanced
in December 2014 with a Euro denominated bond issuance). The Newmarket results have been consolidated into
Amadeus’ books from February 5, 2014, following the approval of the acquisition by the US Federal Trade
Commission in January 2014.
Acquisition-related costs incurred amounted to €4.9 million, all of which were recognised in “Other operating
expenses” in the consolidated statement of comprehensive income for the year ended December 31, 2013. These
costs negatively impacted our operating results, in particular our EBITDA, EBITDA margin, Operating income,
Profit, Adjusted profit, EPS and adjusted EPS in 2013.
Newmarket posted sound results in 2014. Revenue increased by high single-digit and EBITDA grew double-digit.
EBITDA margin expansion was driven by a combination of revenue growth and efficiencies achieved in certain
cost lines.
Acquisition of i:FAO
On June 23, 2014 Amadeus acquired 69.07% of the voting rights of i:FAO AG and its group of companies (“i:FAO”)
through a public takeover offer, for a total consideration paid in cash of €55.8 million. As of December 31, 2014
Amadeus owns 70.22% of the shares of the entity. The i:FAO results have been consolidated in our income
statement from July 1, 2014.
i:FAO continued with its positive track record and delivered high single-digit revenue growth, supported by an
increase in revenue from both existing customers and new customers. In turn, EBITDA increased by low double-
digit.
The financial statements of i:FAO consolidated into Amadeus’ books are provisional and subject to changes in the
next quarters. Also, a purchase price allocation exercise will be carried out during the following twelve months
from the acquisition date. As a consequence, the balances of the consolidated assets and liabilities of i:FAO may
be adjusted, and income or loss effects may arise.
As a result of the tender offer process launched and its associated costs in relation to the acquisition of i:FAO, we
incurred extraordinary (non-deductible) costs amounting to €1.6 million in the first quarter of 2014. These costs
have negatively impacted our operating results, in particular our EBITDA, EBITDA margin, Operating income,
Profit, Adjusted profit, EPS and adjusted EPS.

Page 14 of 50 amadeus.com
© 2
015 A
madeus I
T G
roup S
A
Acquisition of UFIS
In addition, Amadeus acquired 100% of the voting rights of UFIS Airport Solutions AS, and its group of companies
(“UFIS”) on January 24, 2014. The purchase consideration was €18.8 million. The transaction was fully financed
with cash. The UFIS results have been consolidated into Amadeus’ books from February 1, 2014.
UFIS delivered strong results in 2014. Revenue experienced double-digit growth, driven by implementation of
contract wins in the year, and EBITDA significantly improved. UFIS has now been operationally integrated within
Amadeus.
3.2 Purchase price allocation exercises
A purchase price allocation exercise in relation to the consolidation of Newmarket and UFIS into Amadeus’ books
was carried out in the fourth quarter of 2014. As a consequence of such PPA exercise, the following effects have
arisen:
(i) an amount of €10.1 million which was previously recognised as revenue has been deferred in the balance
sheet, resulting in a reduction of our group revenue for such amount,
(ii) an additional amortisation expense of €13.5 million, raising the total group amortisation expense.
These effects have impacted group figures (in particular, the IT Solutions figures including the M&A results, as
both Newmarket and UFIS are consolidated into this segment). Figures excluding the M&A contribution are not
impacted by them.
3.3 Presentation of financial information
2014 group figures are impacted by the contribution of the acquired companies. Our financial results as shown
in the tables below include group figures (including the Newmarket, UFIS and i:FAO consolidated results) as well
as figures excluding the consolidated results of the acquired companies, in two separate columns.
In addition, for clarity purposes, the impacts of the PPA exercises associated with the consolidation of Newmarket
and UFIS into Amadeus’ books carried out in 2014 (which affect the IT Solutions segment, since both companies
are consolidated into it), as explained above, are also disclosed separately in the tables below.
For purposes of comparability, the financial results displayed in the sections 4 “Operating and financial
performance by segment” and 5.1 “Group income statement” are disclosed excluding the consolidated results of
the acquired companies. These figures are not impacted by the adjustments derived from the PPA exercises
associated with the consolidation of Newmarket and UFIS.

Page 15 of 50 amadeus.com
© 2
015 A
madeus I
T G
roup S
A
Group Income Statement Figures in million euros
FY2014 PPA adj.
FY2014 incl. M&A excl. PPA
M&A contri-bution
FY2014 excl. M&A
FY2013 %
Change
% Change
excl. M&A
Revenue 3,417.7 10.1 3,427.8 92.7 3,335.0 3,103.7 10.1% 7.5%
Cost of revenue (879.7) 0.0 (879.7) (7.8) (872.0) (803.7) 9.5% 8.5%
Personnel and related ex-penses
(970.4) 0.0 (970.4) (38.5) (931.9) (846.3) 14.7% 10.1%
Other operating expenses (254.3) 0.0 (254.3) (10.5) (243.7) (259.7) (2.1%) (6.2%)
Ordinary D&A (257.6) 0.0 (257.6) (3.5) (254.1) (218.1) 18.1% 16.5%
Amortisation from PPA (80.7) 13.5 (67.2) (0.1) (67.1) (69.1) 16.8% (2.8%)
Impairments (19.4) 0.0 (19.4) 0.0 (19.4) (18.8) 2.9% 2.9%
Depreciation & amortisation (357.6) 13.5 (344.1) (3.5) (340.6) (306.0) 16.9% 11.3%
Operating income 955.7 23.6 979.3 32.4 946.8 888.0 7.6% 6.6%
Financial income 2.8 0.0 2.8 0.0 2.8 2.1 33.8% 32.0%
Interest expense (68.1) 0.0 (68.1) (8.7) (59.4) (69.8) (2.5%) (14.9%)
Other financial expenses (5.6) 0.0 (5.6) (0.8) (4.9) (1.9) 203.2% 161.2%
Exchange gains (losses) 14.6 0.0 14.6 0.3 14.3 (1.6) n.m. n.m.
Net financial expense (56.3) 0.0 (56.3) (9.1) (47.2) (71.2) (20.9%) (33.7%)
Other income (expense) (1.3) 0.0 (1.3) (0.1) (1.2) 7.1 n.m. n.m.
Profit before income taxes
898.0 23.6 921.6 23.3 898.3 823.9 9.0% 9.0%
Income taxes (268.7) (8.9) (277.6) (9.7) (267.9) (266.0) 1.0% 0.7%
Profit after taxes 629.4 14.7 644.1 13.6 630.5 558.0 12.8% 13.0%
Share in profit from associ-ates and JVs
2.8 0.0 2.8 0.0 2.8 5.1 (45.3%) (45.3%)
Profit for the period 632.2 14.7 646.9 13.6 633.3 563.1 12.3% 12.5%
EPS (euros) 1.42 0.03 1.45 0.03 1.42 1.27 12.2% 12.5%
Impact of PPA 44.9 (14.7) 30.2 (0.0) 30.2 47.3 (5.1%) (36.2%)
Non-operating FX results and mark-to-market
(10.1) 0.0 (10.1) (0.3) (9.8) 1.2 n.m. n.m.
Non-recurring items 0.9 0.0 0.9 0.0 0.9 (4.8) n.m. n.m.
Impairments 13.2 0.0 13.2 0.0 13.2 12.8 3.6% 3.6%
Adjusted profit1 681.1 0.0 681.1 13.3 667.7 619.5 9.9% 7.8%
Adjusted EPS (euros)2 1.53 0.00 1.53 0.03 1.50 1.39 9.9% 7.8%
Key financial metrics
EBITDA 1,306.0 10.1 1,316.1 36.0 1,280.1 1,188.7 9.9% 7.7%
EBITDA margin (%) 38.2% n.m. 38.4% 38.8% 38.4% 38.3% (0.1 p.p.) 0.1 p.p.
1. Excluding after-tax impact of the following items: (i) accounting effects derived from PPA exercises and impairment
losses, (ii) changes in fair value of financial instruments and non-operating exchange gains (losses) and (iii) other non-recurring items.
2. EPS corresponding to the Adjusted profit attributable to the parent company. Calculated based on weighted average outstanding shares of the period.

Page 16 of 50 amadeus.com
© 2
015 A
madeus I
T G
roup S
A
Segment reporting Figures in million euros
FY2014 PPA adj.
FY2014 incl. M&A excl. PPA
M&A contri-bution
FY2014 excl. M&A
FY2013 %
Change
% Change
excl. M&A
Distribution revenue 2,455.1 0.0 2,455.1 7.4 2,447.7 2,317.8 5.9% 5.6%
IT Solutions revenue 962.6 10.1 972.7 85.3 887.3 785.9 22.5% 12.9%
Group Revenue 3,417.7 10.1 3,427.8 92.7 3,335.0 3,103.7 10.1% 7.5%
Operating costs (1,433.9) 0.0 (1,433.9) (5.5) (1,428.3) (1,339.3) 7.1% 6.6%
Direct capitalisations 60.9 0.0 60.9 0.0 60.9 57.4 6.1% 6.1%
Net operating costs (1,373.0) 0.0 (1,373.0) (5.5) (1,367.5) (1,281.9) 7.1% 6.7%
Distribution contribution 1,082.1 0.0 1,082.1 1.9 1,080.3 1,035.9 4.5% 4.3%
Contribution margin (%) 44.1% n.m. 44.1% 25.3% 44.1% 44.7% (0.6 p.p.) (0.6 p.p.)
Operating costs (479.2) 0.0 (479.2) (57.8) (421.4) (409.9) 16.9% 2.8%
Direct capitalisations 167.6 0.0 167.6 6.6 161.0 174.7 (4.1%) (7.9%)
Net operating costs (311.6) 0.0 (311.6) (51.2) (260.4) (235.1) 32.5% 10.7%
IT Solutions contribution 651.0 10.1 661.1 34.1 627.0 550.7 18.2% 13.8%
Contribution margin (%) 67.6% n.m. 68.0% 40.0% 70.7% 70.1% (2.5 p.p.) 0.6 p.p.
Total Contribution 1,733.1 10.1 1,743.2 36.0 1,707.2 1,586.6 9.2% 7.6%
Contribution margin (%) 50.7% n.m. 50.9% 38.8% 51.2% 51.1% (0.4 p.p.) 0.1 p.p.
Indirect costs (528.7) 0.0 (528.7) 0.0 (528.7) (500.5) 5.6% 5.6%
Indirect capitalisations and RTCs
101.6 0.0 101.6 0.0 101.6 102.5 (0.9%) (0.9%)
Net indirect costs (427.1) 0.0 (427.1) 0.0 (427.1) (398.0) 7.3% 7.3%
EBITDA 1,306.0 10.1 1,316.1 36.0 1,280.1 1,188.7 9.9% 7.7%
EBITDA margin (%) 38.2% n.m. 38.4% 38.8% 38.4% 38.3% (0.1 p.p.) 0.1 p.p.

Page 17 of 50 amadeus.com
© 2
015 A
madeus I
T G
roup S
A
Group Income State-ment Figures in million euros
Q42014 PPA adj.
Q42014 incl. M&A excl. PPA
M&A contri-bution
Q42014 excl. M&A
Q42013 %
Change
% Change
excl. M&A
Revenue 832.7 10.1 842.8 30.2 812.6 741.7 12.3% 9.6%
Cost of revenue (214.6) 0.0 (214.6) (2.3) (212.3) (187.3) 14.5% 13.3%
Personnel and related ex-penses
(265.2) 0.0 (265.2) (12.2) (253.0) (227.0) 16.8% 11.5%
Other operating expenses (81.5) 0.0 (81.5) (1.4) (80.1) (86.5) (5.8%) (7.5%)
Ordinary depreciation and amortisation
(76.0) 0.0 (76.0) (0.7) (75.3) (63.2) 20.2% 19.1%
Amortisation derived from PPA
(25.6) 13.5 (12.1) 4.7 (16.8) (16.8) 52.6% 0.0%
Impairments (10.5) 0.0 (10.5) 0.0 (10.5) (11.3) (6.8%) (6.8%)
Depreciation and amorti-sation
(112.1) 13.5 (98.6) 3.9 (102.6) (91.3) 22.8% 12.3%
Operating income 159.2 23.6 182.8 18.2 164.6 149.6 6.5% 10.1%
Financial income 0.7 0.0 0.7 0.0 0.7 0.9 (16.5%) (20.7%)
Interest expense (18.8) 0.0 (18.8) (4.0) (14.8) (17.3) 8.7% (14.4%)
Other financial expenses (3.6) 0.0 (3.6) (0.7) (2.8) 0.7 n.m. n.m.
Exchange gains (losses) 5.8 0.0 5.8 0.5 5.3 (2.1) n.m. n.m.
Net financial expense (15.8) 0.0 (15.8) (4.2) (11.6) (17.8) (11.3%) (34.8%)
Other income (expense) (0.3) 0.0 (0.3) (0.1) (0.2) 4.6 n.m. n.m.
Profit before income taxes
143.2 23.6 166.8 13.9 152.8 136.4 5.0% 12.1%
Income taxes (30.9) (8.9) (39.8) (6.8) (32.9) (46.4) (33.4%) (29.0%)
Profit after taxes 112.3 14.7 127.0 7.1 119.9 89.9 24.9% 33.3%
Share in profit from asso-
ciates and JVs 0.9 0.0 0.9 0.0 0.9 1.4 (39.5%) (39.5%)
Profit for the period 113.2 14.7 127.9 7.1 120.8 91.4 23.8% 32.2%
EPS (euros) 0.25 0.03 0.29 0.02 0.27 0.21 23.7% 32.3%
Impact of PPA 7.2 (14.7) (7.5) (3.2) (4.3) 11.5 (36.9%) n.m.
Non-operating FX results and mark-to-market
(4.0) 0.0 (4.0) (0.4) (3.5) 0.9 n.m. n.m.
Non-recurring items 0.2 0.0 0.2 0.0 0.1 (3.1) n.m. n.m.
Impairments 7.2 0.0 7.2 0.0 7.2 7.6 (6.3%) (6.3%)
Adjusted profit 123.8 0.0 123.8 3.5 120.3 108.3 14.3% 11.0%
Adjusted EPS (euros) 0.28 0.00 0.28 0.01 0.27 0.24 14.2% 11.2%
Key financial metrics
EBITDA 268.5 10.1 278.6 14.3 264.3 239.7 12.0% 10.3%
EBITDA margin (%) 32.2% n.m. 33.1% 47.3% 32.5% 32.3% (0.1 p.p.) 0.2 p.p.
1. Excluding after-tax impact of the following items: (i) accounting effects derived from PPA exercises and impairment
losses, (ii) changes in fair value of financial instruments and non-operating exchange gains (losses) and (iii) other non-recurring items.
2. EPS corresponding to the Adjusted profit attributable to the parent company. Calculated based on weighted average outstanding shares of the period.

Page 18 of 50 amadeus.com
© 2
015 A
madeus I
T G
roup S
A
Segment reporting Figures in million euros
Q42014 PPA adj.
Q42014 incl. M&A excl. PPA
M&A contri-bution
Q42014 excl. M&A
Q42013 %
Change
% Change
excl. M&A
Distribution revenue 593.6 0.0 593.6 3.7 589.9 534.2 11.1% 10.4%
IT Solutions revenue 239.1 10.1 249.2 26.4 222.7 207.5 15.2% 7.4%
Group Revenue 832.7 10.1 842.8 30.2 812.6 741.7 12.3% 9.6%

Page 19 of 50 amadeus.com
© 2
015 A
madeus I
T G
roup S
A
4 Operating and financial performance by segment

Page 20 of 50 amadeus.com
© 2
015 A
madeus I
T G
roup S
A
Segment reporting Figures in million euros
Full year 2014 (excl. M&A)
Full year 2013 % Change
Distribution revenue 2,447.7 2,317.8 5.6%
IT Solutions revenue 887.3 785.9 12.9%
Group Revenue 3,335.0 3,103.7 7.5%
Distribution contribution 1,080.3 1,035.9 4.3%
Distribution contribution margin (%) 44.1% 44.7% (0.6 p.p.)
IT Solutions contribution 627.0 550.7 13.8%
IT Solutions contribution margin (%) 70.7% 70.1% 0.6 p.p.
Total Contribution 1,707.2 1,586.6 7.6%
Net indirect costs1 (427.1) (398.0) 7.3%
EBITDA 1,280.1 1,188.7 7.7%
EBITDA Margin (%) 38.4% 38.3% 0.1 p.p.
1. Net indirect costs include extraordinary costs associated with the acquisition of i:FAO in 2014 (€1.6 million) and with the acquisition of Newmarket in 2013 (€4.9 million).
Revenue increased by 7.5% in the year. This increase was driven by the strong performance of both our
businesses: (i) growth of €129.9 million, or 5.6%, in our Distribution business, and (ii) an increase of €101.5
million, or 12.9%, in our IT Solutions business.
EBITDA amounted to €1,280.1 million, representing a 7.7% increase vs. 2013 and an EBITDA margin of 38.4%.
The increase in EBITDA was supported by growth in the contributions of both our Distribution and IT Solutions
businesses, partly offset by an increase in net indirect costs.
4.1 Distribution
Distribution Figures in million euros
Full year 2014 (excl. M&A)
Full year 2013 % Change
Operating KPI
Air TA market share 40.7% 40.1% 0.7 p.p.
Total bookings (m) 525.8 502.6 4.6%
Profit & Loss
Revenue 2,447.7 2,317.8 5.6%
Operating costs (1,428.3) (1,339.3) 6.6%
Direct capitalisations 60.9 57.4 6.1%
Net operating costs (1,367.5) (1,281.9) 6.7%
Contribution 1,080.3 1,035.9 4.3%
As % of Revenue 44.1% 44.7% (0.6 p.p.)
The core offering of our Distribution business is our reservations platform. It provides a global network that
connects travel providers, such as full service and low-cost airlines, hotels, rail operators, cruise and ferry

Page 21 of 50 amadeus.com
© 2
015 A
madeus I
T G
roup S
A
operators, car rental companies, tour operators and insurance companies, with online and offline travel agencies,
facilitating the distribution of travel products and services (sometimes referred to as the “indirect channel”). We
also offer technology solutions, such as desktop and e-commerce platforms and mid- and back-office systems to
some of our travel agency customers and corporations.
Our Distribution business continued to grow during 2014, driven by an increase in our booking volumes, fuelled
by market share gains, industry growth and an improvement in our average pricing.
As a result, our Distribution revenue increased by 5.6% to €2,447.7 million in 2014. Our contribution grew by
4.3% to €1,080.3 million, and represented 44.1% as a percentage of revenue (down from 44.7% in 2013).
4.1.1 Evolution of operating KPI
During the fourth quarter of 2014, the volume of air bookings processed through travel agencies connected to
Amadeus increased by 7.5% while the air TA booking industry grew by 3.6%. Our market share4 experienced a
1.4 p.p. expansion, primarily driven by North America and by South Korea, where we have migrated the travel
agencies previously connected to Topas to our platform. Amadeus reached a global market share of 42.0%.
Operating KPI Oct-Dec
2014 Oct-Dec
2013 %
Change Full year
2014 Full year
2013 %
Change
Air TA booking Industry growth 3.6% 4.3% 3.2% 2.0%
Air TA market share 42.0% 40.6% 1.4 p.p. 40.7% 40.1% 0.7 p.p.
Air TA bookings (m) 110.3 102.6 7.5% 466.5 443.4 5.2%
Non air bookings (m) 14.9 14.4 3.0% 59.4 59.2 0.3%
Total bookings (m) 125.2 117.0 6.9% 525.8 502.6 4.6%
Air TA booking industry
Total air travel agency bookings continued the positive trend observed in the first three quarters of 2014 and
increased by 3.6% in the fourth quarter. By region, Asia and Pacific was the strongest, driven by the migration
to Amadeus of travel agencies previously connected to Topas in South Korea. North America continued its
recovery and grew at a moderate rate. In turn, Central, Eastern and Southern Europe and Middle East and Africa
were impacted by geopolitical situations in some key countries in the regions (such as Russia, Ukraine and Libya).
As observed throughout the whole year, the industry in Latin America continued declining, negatively impacted
by the poor performance of some countries with a significant weighting in the region (such as Venezuela and
Argentina). However, Western Europe had a positive performance albeit at a slow rate.
The trends observed in the fourth quarter of the year are a continuation of what has been observed in the whole
year. For the full year 2014, the industry increased 3.2%. More specifically, some important factors affecting the
industry in 2014 include: (i) the volume decline experienced in Latin America, due to the negative performance
of some key countries in the region, (ii) the impact from the geopolitical situation in Russia and Ukraine, affecting
the Central, Eastern and Southern European region, and (iii) the weak performance of certain countries in Middle
East and Africa, mainly driven by political unrest. In turn, the Asia and Pacific region have benefitted from the
4 Market share is calculated based on the total volume of travel agency air bookings processed by the global or regional CRS. Excludes air bookings made directly through in-house airline systems or single country operators, the latter primarily in China, Japan, South Korea (until the migration of Topas’ connected travel agencies to Amadeus at the end of the third quarter of 2014) and Russia. Also excludes bookings of other types of travel products, such as hotel rooms, car rentals and train tickets.

Page 22 of 50 amadeus.com
© 2
015 A
madeus I
T G
roup S
A
migration of travel agencies from Topas in South Korea to Amadeus. Finally, both Western Europe and North
America recovered from their negative performance in 2013 and reported moderate industry growth rates.
Amadeus bookings
Our air TA bookings increased by 7.5% in the fourth quarter of 2014, driving full year growth to 5.2%. Amadeus
continued outperforming the industry, supported by our market share gains. As of December 31, 2014 our global
market share was 40.7%, 0.7 p.p. higher than that of 2013.
Both Asia and Pacific and North America were the regions with highest volume increase for Amadeus, both driven
by industry growth and market share gains. In particular, the migration of travel agencies from Topas to our
platform at the end of the third quarter of 2014 supported our booking increase in that region. In addition, our
bookings in Middle East and Africa showed a healthy growth, despite a weak industry due to political instability
in some key countries. In turn, our volumes in Latin America and Central, Eastern and Southern Europe were
impacted by the negative macro and geo-political environment. Finally, our Western European bookings continued
increasing albeit at a moderate rate.
Amadeus Air TA Bookings Figures in million
Full year 2014
% of Total Full year
2013 % of Total % Change
Western Europe 192.5 41.3% 187.9 42.4% 2.4%
Asia and Pacific 70.4 15.1% 62.2 14.0% 13.2%
North America 63.4 13.6% 55.3 12.5% 14.6%
Middle East and Africa 62.0 13.3% 57.7 13.0% 7.4%
Central, Eastern and South-ern Europe
45.8 9.8% 46.9 10.6% (2.3%)
Latin America 32.5 7.0% 33.5 7.6% (3.0%)
Total Air TA Bookings 466.5 100.0% 443.4 100.0% 5.2%
With regard to non-air distribution, bookings for 2014 increased by 0.3% to 59.4 million vs. 59.2 million in 2013,
mostly driven by growth in hotel, car rental and insurance bookings, and despite a decline in rail bookings.
4.1.2 Revenue
Distribution Figures in million euros
Oct-Dec 2014
(excl. M&A)
Oct-Dec
2013 % Change
Full year 2014
(excl. M&A)
Full year
2013 % Change
Revenue 589.9 534.2 10.4% 2,447.7 2,317.8 5.6%
Our Distribution revenue increased by 10.4% in the fourth quarter of 2014 to €589.9 million. This increase was
driven by the growth in air bookings, as detailed above, higher average pricing and a positive FX impact.
In 2014, total Distribution revenue was 5.6% higher than in 2013. This increase was driven by growth in booking
revenue (+6.8%), partially offset by a decline in non-booking revenue (-1.4%):
_ Booking revenue: 6.8% increase, driven by a combination of volume growth (4.6% increase in total
bookings) and a positive pricing impact. Pricing increased 2.1% vs. 2013, mainly driven by (i) positive mix in
air bookings, as the weight of high-yield bookings (global and regional) over our total air booking volume
increased, (ii) positive customer mix, (iii) positive product mix in the non-air volumes, as the contribution of

Page 23 of 50 amadeus.com
© 2
015 A
madeus I
T G
roup S
A
rail bookings, with low unit booking fee, to the total non-air volumes decreased in the year in comparison to
previous year, and (iv) an overall increase in the unit booking fee in our non-air products.
_ Non booking revenue: 1.4% decline in 2014, mostly due to the negative effect from the evolution of the
cancellation provision5.
Distribution. Revenue Figures in million euros
Full year 2014 (excl. M&A)
Full year 2013 % Change
Booking revenue 2,113.5 1,979.0 6.8%
Non booking revenue 334.2 338.9 (1.4%)
Revenue 2,447.7 2,317.8 5.6%
Average fee per booking (air and non-air) (€)1 4.02 3.94 2.1%
1. Represents our booking revenue divided by the total number of air and non-air bookings.
4.1.3 Contribution
The contribution of our Distribution business is calculated after deducting from our revenue those operating costs
which can be directly allocated to the business (variable costs, mainly related to distribution fees and incentives,
and product development, marketing and commercial costs).
The contribution of our Distribution business increased by 4.3% for 2014, leading to a total contribution of
€1,080.3 million in 2014 vs. €1,035.9 million in 2013. As a percentage of revenue, this represents 44.1%, down
from 44.7% in 2013.
Operating costs, net of capitalisations, increased by 6.7% in the full year period. On a gross basis, operating
costs in 2014 increased by 6.6%, as a result of:
_ The increase in our booking volumes (4.6% growth in total travel agency bookings, or 5.2% increase in air
bookings).
_ Growth in our unit distribution cost, driven by (i) an increase in the contribution to booking volumes of
countries where we operate through third-party distributors, in particular in the Middle East and North Africa
region and India, where we pay distribution fees, and (ii) higher average unit incentive fee paid to travel
agencies, driven by a combination of the competitive environment and the mix of travel agencies originating
our bookings.
_ An increase in R&D expenditure, including development activities related to (i) new products for travel
agencies, airlines and corporations to provide sophisticated booking and search engines, ancillary services,
merchandising and retail capabilities and mobile functionality, and (ii) regionalisation efforts aiming to adapt
our portfolio of solutions to local needs.
_ An increase in our commercial support, driven by the expansion of our product portfolio (e.g. new solutions
for corporations and travel management companies and within the new businesses), customer base and
geographic reach. Additionally, higher expenses were incurred relating to local taxes and building and
facilities.
5 The cancellation provision corresponds to the estimated amount of booking fees which will be refunded to the airlines due to
booking cancellations and is included as a negative amount within non-booking revenue.
Page 24 of 50 amadeus.com
© 2
015 A
madeus I
T G
roup S
A
4.2 IT Solutions
IT Solutions Figures in millions
Full year 2014 (excl. M&A)
Full year 2013 % Change
Operating KPI
Passengers Boarded (PB) (m) 695.4 615.7 12.9%
Airlines migrated (as of December 31)1 124 112
Profit & Loss
Revenue 887.3 785.9 12.9%
Operating costs (421.4) (409.9) 2.8%
Direct capitalisations 161.0 174.7 (7.9%)
Net operating costs (260.4) (235.1) 10.7%
Contribution 627.0 550.7 13.8%
As % of Revenue 70.7% 70.1% 0.6 p.p.
1. Airlines migrated to at least the Altéa Inventory module, in addition to the Reservations module.
Through our IT Solutions business we provide a comprehensive portfolio of technology solutions that automate
certain mission-critical business processes, such as reservations, inventory management and other operational
processes for travel providers, as well as providing direct distribution technologies.
Our IT Solutions business continued posting significant growth in 2014. Revenue grew by 12.9% in the year,
helped by the increase in both IT Transactional revenue, fuelled by growth in PB volumes and a higher average
unit fee, and non-transactional revenue. In turn, contribution increased by 13.8% to €627.0 million, and
represented 70.7% as a percentage of revenue (a margin expansion of 0.6 p.p.).
4.2.1 Evolution of operating KPI
Total number of passengers boarded increased by 9.7% to 175.8 million in the fourth quarter of 2014 vs. the
fourth quarter of 2013, driven by the migrations implemented in the year (most notably Korean Air) as well as
the full-year impact of those implemented in 2013 (Thai Airways, Asiana Airlines and Sri Lankan Airlines) and
organic growth.
During the full year 2014, the number of passengers boarded reached 695.4 million, 12.9% higher than in 2013,
driven by the above mentioned Altéa migrations and organic growth (+3.5%).
Operating KPI Oct-Dec
2014 Oct-Dec
2013 %
Change Full year
2014 Full year
2013 %
Change
Passengers Boarded (PB) (m) 175.8 160.3 9.7% 695.4 615.7 12.9%
Airlines migrated (as of Dec 31)1 124 112
1. Airlines migrated to at least the Altéa Inventory module, in addition to the Reservations module.
As of December 31, 2014, 45.8% of our total PB were generated by Western European airlines, a decrease vs.
the same period in 2013, given the increase in the weight of our PB volumes in Asia and Pacific. This increase
has been driven by the contribution of Asian airlines added to our platform, such as Singapore Airlines, EVA
Airways, Garuda Indonesia, Thai Airways, Asiana Airlines and Korean Air. This shift towards Asia and Pacific will
continue, as we have a number of migrations of Asian carriers scheduled for the coming years (such as All Nippon

Page 25 of 50 amadeus.com
© 2
015 A
madeus I
T G
roup S
A
Airways –the international passengers business- and Japan Airlines). Similarly, our exposure to the North
American region will increase as we migrate Southwest -the domestic passengers business- over the next few
years. The migrations of Southwest –the international passengers business- and Seaport in the year have already
started contributing to this region. In turn, the Middle Eastern and African and Central, Eastern and Southern
European regions have been negatively impacted by (i) the political unrest in some countries of Middle East and
North Africa, which impacted some of our key customers in the region, and (ii) airlines that are no longer using
the Altéa platform.
Amadeus PB Figures in million
Full year 2014
% of Total Full year
2013 % of Total % Change
Western Europe 318.7 45.8% 308.6 50.1% 3.3%
Asia and Pacific 166.6 24.0% 109.2 17.7% 52.6%
Middle East and Africa 100.5 14.5% 96.3 15.6% 4.4%
Latin America 73.2 10.5% 66.6 10.8% 10.0%
Central, Eastern and Southern Europe 35.6 5.1% 35.1 5.7% 1.4%
North America 0.8 0.1% - - n.m.
Total PB 695.4 100.0% 615.7 100.0% 12.9%
4.2.2 Revenue
IT Solutions Figures in million
euros
Oct-Dec 2014 (excl. M&A)
Oct-Dec 2013
% Change
Full year 2014 (excl. M&A)
Full year 2013
% Change
Revenue 222.7 207.5 7.4% 887.3 785.9 12.9%
IT Solutions revenue increased by 7.4% in the fourth quarter of 2014, driving second half growth to 14.1% and
full year growth to 12.9%. As detailed in the table below, group revenue was fuelled by growth in both IT
transactional and non-transactional revenues.
IT Solutions. Revenue Figures in million euros
Full year 2014 (excl. M&A)
Full year 2013 % Change
IT transactional revenue 684.7 590.5 16.0%
Direct distribution revenue 104.7 103.5 1.1%
Transactional revenue 789.3 694.0 13.7%
Non transactional revenue 98.0 91.9 6.7%
Revenue 887.3 785.9 12.9%
IT Transactional revenue per PB (€)1 0.98 0.96 2.7%
1. Represents IT transactional revenue divided by the total PB figure

Page 26 of 50 amadeus.com
© 2
015 A
madeus I
T G
roup S
A
Transactional Revenue
IT Transactional Revenue
As shown above, IT Transactional revenue increased by 16.0% in 2014, to €684.7 million. This increase was
supported by strong growth in all main revenue lines:
_ Altéa: significant increase driven by the volume growth, both in relation to new migrations that took place in
the year and the full year impact of the 2013 migrations (as described above), as well as an increase in the
Altéa average unit fee, driven by the DCS migrations implemented in the year and in 2013. In addition,
positive contribution came from the cross-selling activity with e-commerce and standalone solutions.
_ E-commerce: significant increase in Passenger Name Record volumes, partly driven by an increase in the
number of customers. In addition, positive contribution from up-selling activities.
_ Stand Alone IT solutions: continued strong performance based on the success of several products, such as
Amadeus Ticket Changer, self-services solutions, ancillary services, web services and loyalty. As in the case
of Altéa, growth is driven by the organic growth of existing customers, as well as by new implemented
customers and, as mentioned above, by cross-selling with other products.
_ New businesses: increasing, albeit still small, contribution of the new businesses such as airport IT and
payments.
Average IT transactional revenue per PB for the year was €0.98, above the average fee of €0.96 reported in
2013. The main reasons for this increase are: (i) a higher Altéa unit fee, driven by the migrations to the Altéa
DCS module, (ii) the positive results from cross-selling and up-selling, and (iii) the higher contribution of the new
initiatives, such as airport IT and payments.
Direct Distribution
Revenue from Direct Distribution increased by 1.1% in 2014 compared to 2013. This increase was mostly driven
by organic growth in our volumes, partly offset by the full-year impact of the migration of some of our existing
users of our Reservations module (notably Thai Airways) to the Inventory module of our Altéa Suite in 2013.
Non Transactional Revenue
Non transactional revenue increased by 6.7% in 2014, mainly as a result of higher revenue from services (for
example, consulting and bespoke services related to e-commerce). In addition, gaps and implementations
continued growing, mostly driven by deferred revenues starting to be recognised after the customer migration
cutover, in particular in relation to the migrations implemented in 2013 and 2014.
4.2.3 Contribution
The contribution of our IT Solutions business is calculated after deducting from our revenue those operating costs
which can be directly allocated to this business (variable costs, including certain distribution fees, and product
development, marketing and commercial costs).
The contribution of the IT Solutions business grew by 13.8%, or €76.2 million, to €627.0 million in 2014. As a
percentage of revenue, contribution margin expanded to 70.7%.
The 13.8% increase in the contribution of our IT Solutions business in 2014 was driven by an increase of 12.9%
in revenues and of 10.7% in net operating costs (as a combination of gross operating costs growing at 2.8% and
capitalisations declining by 7.9%).
Growth in operating costs on a gross basis was mainly due to:

Page 27 of 50 amadeus.com
© 2
015 A
madeus I
T G
roup S
A
_ An increase in our development costs associated with product development in our airline IT portfolio of
solutions (e.g. revenue accounting, revenue management, merchandising and e-commerce) and across the
new business initiatives (airport, rail, hotel, payments), most of which are subject to capitalisation.
_ Contained growth in commercial costs, as a result of the combination of an increase in commercial support in
the new businesses, driven by the expansion of the offering and the intense commercial activity undertaken
during the period, and cost efficiencies achieved in the airline IT business.
In turn, capitalisations in the period slowed down, resulting in a reduction in the capitalisation ratio, which is
impacted by the intensity of the development activity, the mix of projects undertaken and the different stages in
which the ongoing projects are in.
4.3 EBITDA
In 2014, EBITDA amounted to €1,280.1 million, an increase of 7.7%. EBITDA margin expanded to 38.4%, mainly
driven by the increasing weight of the IT Solutions business, with higher margins.
Growth in EBITDA was driven by the increase in contribution from both Distribution and IT Solutions, partially
offset by higher net indirect costs, which grew by 7.3% in 2014 vs. 2013.
This growth in net indirect costs, as shown in the table below, was driven by the combination of an increase in
gross indirect costs, which were 5.6% higher than 2013, and indirect capitalisations, which declined by 0.9%.
The increase in gross indirect costs was mainly attributable to:
_ Increased efforts in cross-area development and in our data centre, mainly related to maximisation of our
system reliability and security, whilst achieving optimal levels of system performance. In addition, continued
TPF decommissioning process.
_ An increase in integration costs related to our M&A activity in the year.
_ An increase in computing expenses, partly due to our increasing use of “software-as-a-service” contracts vs.
licenses (higher operating expenses and lower capital expenditure), as well as in other cost lines such as
consultancy, training and recruitment (driven by growth in FTEs and development activities), local taxes and
building and facilities costs.
_ The annual salary reviews.
Indirect costs Figures in million euros
Full year 2014 (excl. M&A)
Full year 2013 % Change
Indirect costs1 (528.7) (500.5) 5.6%
Indirect capitalisations & RTCs2 101.6 102.5 (0.9%)
Net indirect costs1 (427.1) (398.0) 7.3%
1. Indirect costs include extraordinary costs associated with the acquisition of i:FAO in 2014 (€1.6 million) and with the
acquisition of Newmarket in 2013 (€4.9 million). 2. Includes the Research Tax Credit (RTC).

Page 28 of 50 amadeus.com
© 2
015 A
madeus I
T G
roup S
A
5 Consolidated financial statements

Page 29 of 50 amadeus.com
© 2
015 A
madeus I
T G
roup S
A
5.1 Group income statement
Income Statement Figures in million euros
Oct-Dec 2014 (excl. M&A)
Oct-Dec 2013
% Change
Full year 2014 (excl. M&A)
Full year 2013
% Change
Revenue 812.6 741.7 9.6% 3,335.0 3,103.7 7.5%
Cost of revenue (212.3) (187.3) 13.3% (872.0) (803.7) 8.5%
Personnel and related expenses (253.0) (227.0) 11.5% (931.9) (846.3) 10.1%
Other operating expenses1 (80.1) (86.5) (7.5%) (243.7) (259.7) (6.2%)
Depreciation and amortisation (102.6) (91.3) 12.3% (340.6) (306.0) 11.3%
Operating income 164.6 149.6 10.1% 946.8 888.0 6.6%
Net financial expense (11.6) (17.8) (34.8%) (47.2) (71.2) (33.7%)
Other income (expense) (0.2) 4.6 n.m. (1.2) 7.1 n.m.
Profit before income taxes 152.8 136.4 12.1% 898.3 823.9 9.0%
Income taxes (32.9) (46.4) (29.0%) (267.9) (266.0) 0.7%
Profit after taxes 119.9 89.9 33.3% 630.5 558.0 13.0%
Share in profit from associates and JVs
0.9 1.4 (39.5%) 2.8 5.1 (45.3%)
Profit for the period 120.8 91.4 32.2% 633.3 563.1 12.5%
Key financial metrics
EBITDA 264.3 239.7 10.3% 1,280.1 1,188.7 7.7%
EBITDA margin (%) 32.5% 32.3% 0.2 p.p. 38.4% 38.3% 0.1 p.p.
Adjusted profit2 120.3 108.3 11.0% 667.7 619.5 7.8%
Adjusted EPS (€)3 0.27 0.24 11.2% 1.50 1.39 7.8%
1. Other operating costs include extraordinary costs associated with the acquisition of i:FAO in 2014 (€1.6 million) and
with the acquisition of Newmarket in 2013 (€4.9 million). 2. Excluding after-tax impact of the following items: (i) accounting effects derived from PPA exercises and impairment
losses, (ii) changes in fair value of financial instruments and non-operating exchange gains (losses) and (iii) other non-recurring items.
3. EPS corresponding to the Adjusted profit attributable to the parent company. Calculated based on weighted average outstanding shares of the period.
5.1.1 Revenue
Revenue in the fourth quarter of 2014 increased by 9.6%, from €741.7 million to €812.6 million, vs. the fourth
quarter of 2013. For the full year 2014, revenue increased 7.5%, to €3,335.0 million. Group revenue growth was
driven by strong underlying growth in both our business lines:
_ Growth of €55.6 million, or 10.4%, in our Distribution business in the fourth quarter of 2014. For the full year
period, Distribution revenue grew by 5.6%.
_ An increase of €15.3 million, or 7.4%, in our IT Solutions business in the fourth quarter of 2014. IT Solutions
revenue increased by 12.9% in the full year period.

Page 30 of 50 amadeus.com
© 2
015 A
madeus I
T G
roup S
A
Revenue Figures in million euros
Oct-Dec 2014 (excl. M&A)
Oct-Dec 2013
% Change
Full year 2014 (excl. M&A)
Full year 2013
% Change
Distribution 589.9 534.2 10.4% 2,447.7 2,317.8 5.6%
IT Solutions 222.7 207.5 7.4% 887.3 785.9 12.9%
Revenue 812.6 741.7 9.6% 3,335.0 3,103.7 7.5%
5.1.2 Cost of revenue
These costs are mainly related to: (i) incentive fees per booking paid to travel agencies, (ii) distribution fees per
booking paid to those local commercial organisations which are not majority owned by Amadeus, (iii) distribution
fees paid to Amadeus Altéa customers for certain types of air bookings made through their direct sales channels,
and (iv) data communication expenses relating to the maintenance of our computer network, including connection
charges.
Cost of revenue amounted to €872.0 million, an increase of 8.5% vs. 2013. The increase was mainly due to (i)
higher air booking volumes in the Distribution business (+5.2%), (ii) growth in distribution fees, driven by the
higher weight over our total volumes of some of the countries where Amadeus has non-fully owned ACOs (third
party distribution), in particular in the Middle East and North Africa region, India and South Korea, and (iii)
increase in our average unit incentive, driven by client mix and competitive pressure. Additionally, data
communication costs increased in the period, driven by higher volume of transactions and connectivity activity
around the globe.
As a percentage of revenue, cost of revenue represented 26.1% in 2014, broadly in line with the percentage rate
reported in 2013.
Cost of revenue in the fourth quarter increased by 13.3%, from €187.3 million in the fourth quarter of 2013 to
€212.3 million, highly impacted by negative FX impact. Excluding FX impact, cost of revenue increased in the
fourth quarter broadly in line with the full year growth.
5.1.3 Personnel and related expenses and other operating expenses
Personnel and related expenses increased by 11.5% in the fourth quarter of 2014, driving total growth for the
full year vs. 2013 to 10.1% (from €846.3 million in 2013 to €931.9 million in 2014).
During 2013 and 2014, a large number of employees who were previously working as contractors in our
development centres were hired as permanent staff, resulting in a shift of operating costs from Other operating
expenses to Personnel expenses.
Our combined operating expenses cost line, including both Personnel expenses and Other operating expenses,
increased by 6.2% in the fourth quarter of 2014 vs. the same quarter of 2013, or 6.3% in the year vs. 2013.

Page 31 of 50 amadeus.com
© 2
015 A
madeus I
T G
roup S
A
1. Other operating costs include extraordinary costs associated with the acquisition of i:FAO in 2014 (€1.6 million) and
with the acquisition of Newmarket in 2013 (€4.9 million).
The increase in these cost lines in aggregate in 2014 was mainly driven by the combination of:
_ Growth of 5% in average FTEs (permanent staff and contractors) in 2014 vs. 2013.
_ A slight increase in our unitary cost due to the annual salary reviews on a global basis. This increase was
partially offset by efficiencies reached through (i) the transfer of part of our development activity to countries
with a lower unit cost, and (ii) the positive effect of certain human resources measures undertaken in the
year aiming to optimise our personnel cost structure.
_ The decline in capitalised expense in the year.
_ An increase in other cost lines (e.g. higher expenses relating to local taxes and building and facilities), driven
by the overall business expansion.
_ These effects were partly offset by a positive FX impact which reduced the reported cost figure.
The increase in average FTEs was mainly driven by:
_ Higher headcount in R&D across all our development sites, with a significant reinforcement of our teams in
Bangalore and US. This increase focused on:
Ongoing projects such as Revenue Management or enhanced solutions for corporations, as well as new
projects related to functionality enhancements and portfolio expansion, such as ancillary services,
merchandising capabilities, shopping and search solutions and mobile functionality. Notably,
development efforts in the airport and hotel areas, as well as in payments, rail and travel intelligence.
Implementation work in all business areas, notably in airport IT, as we work on the implementation of
the large number of contracts signed with ground handlers during 2013 and 2014 to our DCS offering
for ground handlers, and in airline IT, in relation to our Revenue Accounting solution. Implementation
activity to our Altéa suite continues, in relation to airlines implemented in the year (namely Korean Air,
as well as a large number of Altéa DCS implementations) and to the contracted pipeline (e.g. Southwest
–the domestic passengers business-, Japan Airlines and Swiss).
Ongoing TPF decommissioning, which implies the progressive migration of the company’s platform to
open systems through next-generation technologies, such as Linux and Unix, as well as system
performance projects aiming to maximise service and security levels and system reliability.
_ Increase of our commercial and technical support driven by the expansion of our product portfolio (including
the new initiatives), customer base and geographical reach (e.g. the US and Asia and Pacific).
5.1.4 Depreciation and Amortisation
D&A (including capitalised D&A) increased by 10.6% in the fourth quarter of 2014, or 10.9% in the full year
period.
Ordinary D&A increased by 19.1% in the fourth quarter of 2014, or 16.5% full year. This increase was mainly
driven by higher amortisation of intangible assets, in turn mostly linked to the amortisation of capitalised
Personnel expenses + Other operating expenses Figures in million euros
Oct-Dec 2014 (excl. M&A)
Oct-Dec 2013
% Change
Full year 2014 (excl. M&A)
Full year 2013
% Change
Personnel expenses + Other operating expenses1
(333.1) (313.6) 6.2% (1,175.7) (1,106.0) 6.3%

Page 32 of 50 amadeus.com
© 2
015 A
madeus I
T G
roup S
A
development expenses on our balance sheet, as the associated product / contract started generating revenues
during the year (for example, those costs related to Altéa migrations which were implemented in the period, as
well as to certain projects related to product development). Depreciation expense was also higher, mostly due to
the additions to PP&E in 2014, including data processing hardware and software acquired for our data processing
centre in Erding (Germany) and a finance lease agreement for an office building in Nice (France) signed in March
2014.
In compliance with IFRS, impairment tests are carried out every year (and, in the absence of any impairment
indicator, we generally concentrate them in the second half of the year). During 2014 and 2013 we reported
certain impairment losses in relation to (i) products that we estimate will not deliver the expected economic
benefits, due to either unforeseen efforts required to deliver the customer's needs, or a reassessment downwards
of the expected demand, or (ii) software developments carried out for a customer which has ceased operations.
Depreciation and Amortisation Figures in million euros
Oct-Dec 2014 (excl. M&A)
Oct-Dec 2013
% Change
Full year 2014 (excl. M&A)
Full year 2013
% Change
Ordinary depreciation and amortisation
(75.3) (63.2) 19.1% (254.1) (218.1) 16.5%
Amortisation derived from PPA (16.8) (16.8) 0.0% (67.1) (69.1) (2.8%)
Impairments (10.5) (11.3) (6.8%) (19.4) (18.8) 2.9%
Depreciation and amortisation (102.6) (91.3) 12.3% (340.6) (306.0) 11.3%
Capitalised depreciation and amortisation1
2.9 1.1 157.6% 7.3 5.3 36.6%
Depreciation and amortisation
post-capitalisations (99.7) (90.2) 10.6% (333.3) (300.6) 10.9%
1. Included within the other operating expenses caption in the Group Income Statement.
5.1.5 EBITDA and Operating income
EBITDA amounted to €264.3 million in the fourth quarter of 2014, representing a 10.3% increase vs. the fourth
quarter of 2013. EBITDA margin over revenue expanded by 0.2 p.p. to 32.5%.
For the full year period, EBITDA amounted to €1,280.1 million, 7.7% higher than 2013.
As explained in the section 4.3 above, the increase in EBITDA was supported by growth in both our Distribution
and IT Solutions businesses, partly offset by an increase in net indirect costs. EBITDA margin expanded to 38.4%,
mainly driven by the increasing weight of the IT Solutions business, with higher margins.
Operating income for the fourth quarter of 2014 increased by €15.1 million or 10.1%, driving our operating
income in the full year to €946.8 million, 6.6% higher than 2013. The increase was driven by growth in our
Distribution and IT Solutions business lines, partially offset by an increase in the indirect costs line and higher
D&A charges.
The table below shows the reconciliation between operating income and EBITDA.
Page 33 of 50 amadeus.com
© 2
015 A
madeus I
T G
roup S
A
EBITDA Figures in million euros
Oct-Dec 2014 (excl. M&A)
Oct-Dec 2013
% Change
Full year 2014 (excl. M&A)
Full year 2013
% Change
Operating income 164.6 149.6 10.1% 946.8 888.0 6.6%
Depreciation and amortisation 102.6 91.3 12.3% 340.6 306.0 11.3%
Capitalised depreciation and amortisation
(2.9) (1.1) 157.6% (7.3) (5.3) 36.6%
EBITDA 264.3 239.7 10.3% 1,280.1 1,188.7 7.7%
EBITDA margin (%) 32.5% 32.3% 0.2 p.p. 38.4% 38.3% 0.1 p.p.
5.1.6 Net financial expense
Net financial expense Figures in million euros
Oct-Dec 2014 (excl. M&A)
Oct-Dec 2013
% Change
Full year 2014 (excl. M&A)
Full year 2013
% Change
Financial income 0.7 0.9 (20.7%) 2.8 2.1 32.0%
Interest expense (14.8) (17.3) (14.4%) (59.4) (69.8) (14.9%)
Other financial expenses (2.8) 0.7 n.m. (4.9) (1.9) 161.2%
Exchange gains (losses) 5.3 (2.1) n.m. 14.3 (1.6) n.m.
Net financial expense (11.6) (17.8) (34.8%) (47.2) (71.2) (33.7%)
Net financial expense decreased by 34.8% in the fourth quarter of 2014, from €17.8 million in the fourth quarter
of 2013 to €11.6 million in the same quarter of 2014. For the full year, net financial expense declined by 33.7%,
from €71.2 million in 2013 to €47.2 million in 2014.
This decrease is mainly explained by (i) a 14.9% lower interest expense (excluding the financing cost of the
Newmarket facility), in turn mostly driven by a reduction in the average gross debt outstanding (excluding the
acquisition financing for Newmarket), and lower average cost of debt, and (ii) exchange gains, largely due to the
appreciation of the US Dollar vs Euro in the year vs. last year.
5.1.7 Income taxes
Income taxes for the full year 2014 amounted to €267.9 vs. €266.0 million for 2013. Income taxes in 2014 were
reduced by an adjustment of €20.2 million to the deferred tax assets and liabilities held in our statement of
financial position which are subject to Spanish regulation to adapt them to the new (lower) corporate tax rates
as per the latest regulatory changes in Spain.
The income tax rate for 2014 was 29.9%. Excluding the above mentioned adjustment, income tax rate for 2014
was 32.2%, in line with the income tax rate in 2013.
5.1.8 Profit for the period. Adjusted profit
As a result of the above, profit amounted to €633.3 million in 2014, an increase of 12.5% vs. a profit of €563.1
million in 2013.
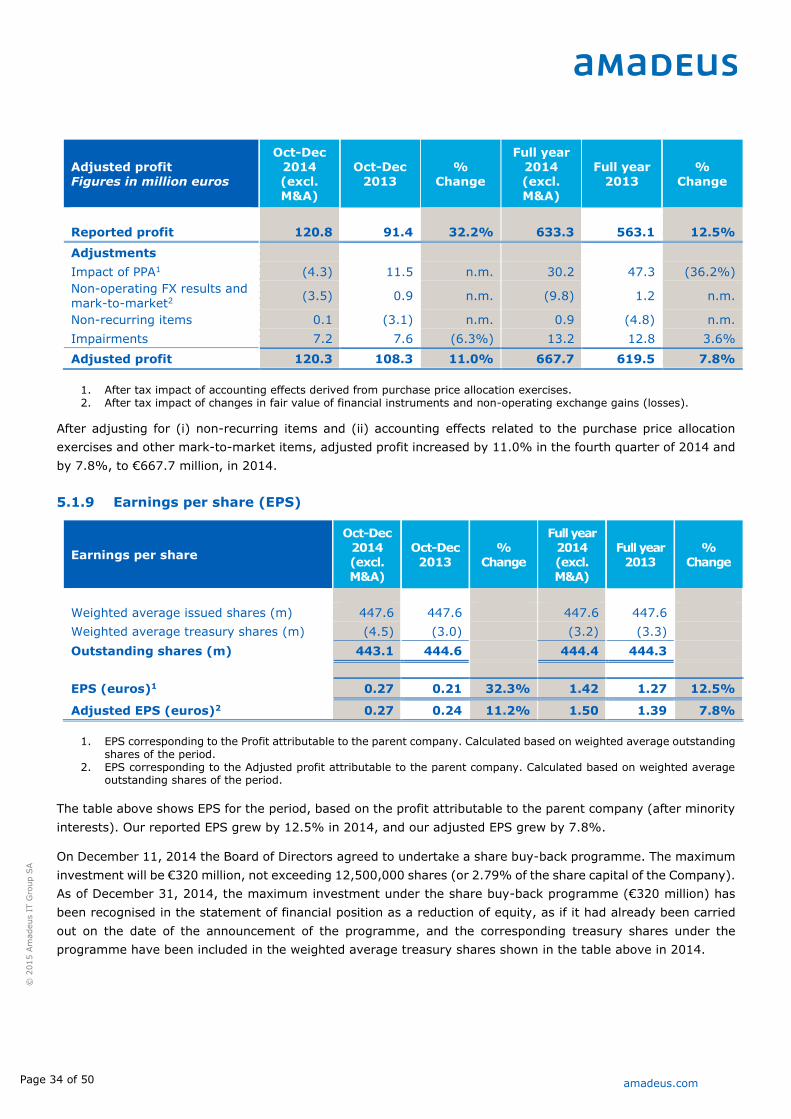
Page 34 of 50 amadeus.com
© 2
015 A
madeus I
T G
roup S
A
Adjusted profit Figures in million euros
Oct-Dec 2014 (excl. M&A)
Oct-Dec 2013
% Change
Full year 2014 (excl. M&A)
Full year 2013
% Change
Reported profit 120.8 91.4 32.2% 633.3 563.1 12.5%
Adjustments
Impact of PPA1 (4.3) 11.5 n.m. 30.2 47.3 (36.2%)
Non-operating FX results and
mark-to-market2 (3.5) 0.9 n.m. (9.8) 1.2 n.m.
Non-recurring items 0.1 (3.1) n.m. 0.9 (4.8) n.m.
Impairments 7.2 7.6 (6.3%) 13.2 12.8 3.6%
Adjusted profit 120.3 108.3 11.0% 667.7 619.5 7.8%
1. After tax impact of accounting effects derived from purchase price allocation exercises. 2. After tax impact of changes in fair value of financial instruments and non-operating exchange gains (losses).
After adjusting for (i) non-recurring items and (ii) accounting effects related to the purchase price allocation
exercises and other mark-to-market items, adjusted profit increased by 11.0% in the fourth quarter of 2014 and
by 7.8%, to €667.7 million, in 2014.
5.1.9 Earnings per share (EPS)
Earnings per share
Oct-Dec 2014 (excl. M&A)
Oct-Dec 2013
% Change
Full year 2014 (excl. M&A)
Full year 2013
% Change
Weighted average issued shares (m) 447.6 447.6 447.6 447.6
Weighted average treasury shares (m) (4.5) (3.0) (3.2) (3.3)
Outstanding shares (m) 443.1 444.6 444.4 444.3
EPS (euros)1 0.27 0.21 32.3% 1.42 1.27 12.5%
Adjusted EPS (euros)2 0.27 0.24 11.2% 1.50 1.39 7.8%
1. EPS corresponding to the Profit attributable to the parent company. Calculated based on weighted average outstanding
shares of the period. 2. EPS corresponding to the Adjusted profit attributable to the parent company. Calculated based on weighted average
outstanding shares of the period.
The table above shows EPS for the period, based on the profit attributable to the parent company (after minority
interests). Our reported EPS grew by 12.5% in 2014, and our adjusted EPS grew by 7.8%.
On December 11, 2014 the Board of Directors agreed to undertake a share buy-back programme. The maximum
investment will be €320 million, not exceeding 12,500,000 shares (or 2.79% of the share capital of the Company).
As of December 31, 2014, the maximum investment under the share buy-back programme (€320 million) has
been recognised in the statement of financial position as a reduction of equity, as if it had already been carried
out on the date of the announcement of the programme, and the corresponding treasury shares under the
programme have been included in the weighted average treasury shares shown in the table above in 2014.

Page 35 of 50 amadeus.com
© 2
015 A
madeus I
T G
roup S
A
5.2 Statement of financial position (condensed)
Statement of Financial Position
Figures in million euros 31/12/2014 31/12/2013
Property, plant and equipment 359.0 304.6
Intangible assets 2,352.9 1,983.9
Goodwill 2,379.1 2,068.3
Other non-current assets 150.7 164.9
Non-current assets 5,241.7 4,521.8
Current assets 550.7 414.5
Cash and equivalents 373.0 490.9
Total assets 6,165.4 5,427.1
Equity 1,867.4 1,840.1
Non-current debt 1,528.9 1,427.3
Other non-current liabilities 1,105.7 946.7
Non-current liabilities 2,634.6 2,374.0
Current debt 294.7 270.9
Other current liabilities 1,368.6 942.2
Current liabilities 1,663.4 1,213.0
Total liabilities and equity 6,165.4 5,427.1
Net financial debt (as per financial statements) 1,450.6 1,207.3
5.2.1 Property, plant and equipment (PP&E)
This caption principally includes land and buildings, data processing hardware and software, and other PP&E
assets such as building installations, furniture and fittings and miscellaneous.
PP&E increased by €54.4 million in 2014. This increase was mainly the result of the combination of the following
effects: (i) additions (+€141.9 million), mainly related to data processing hardware and software acquired for
our data processing centre in Erding (Germany) and a finance lease agreement for an office building in Nice
(France) signed in March 2014 for an amount of €23.3 million, (ii) additions from the acquisitions (+€6.1 million),
and (iii) depreciation charges (-€95.4 million).
Page 36 of 50 amadeus.com
© 2
015 A
madeus I
T G
roup S
A
5.2.2 Intangible assets
This caption principally includes (i) the net cost of acquisition or development and (ii) the excess purchase price
allocated to patents, trademarks and licenses6, technology and content7 and contractual relationships8.
Intangible assets increased by €369.0 million in 2014. This increase was mainly the result of the combination of
the following effects: (i) additions of software internally developed (+€319.0 million) and acquired assets (+€31.3
million), (ii) additions from the acquisitions, including the effects derived from the purchase price allocation
exercises carried out as part of the consolidation process of Newmarket and UFIS into Amadeus’ books (+€255.7
million), and (iii) amortisation charges and impairment losses (-€262.3 million).
Following the acquisition of Amadeus IT Group, S.A. (the former listed company) by Amadeus IT Holding, S.A.
(the current listed company, formerly known as WAM Acquisition, S.A.) in 2005, the excess purchase price derived
from the business combination between them was partially allocated to intangible assets. The intangible assets
identified for the purposes of the purchase price allocation exercise in 2005 are amortised on a straight-line basis
over the useful life of each asset and the amortisation charge is recorded in our P&L. The amortisation charge
attributable to PPA amounted to €16.8 million in the fourth quarter of 2014 and €67.1 million in the full year
2014.
5.2.3 Goodwill
Goodwill amounted €2,379.1 million as of December 31, 2014. Goodwill mainly relates to the unallocated amount
of the excess purchase price derived from the business combination between Amadeus IT Holding, S.A. (the
current listed company, formerly known as WAM Acquisition, S.A.) and Amadeus IT Group, S.A. (the former listed
company), following the acquisition of Amadeus IT Group, S.A. by Amadeus IT Holding, S.A. in 2005. In addition,
the acquisitions completed in 2014 increased the goodwill by €286.2 million (Newmarket, UFIS and i:FAO added
€213.5 million, €7.4 million and €65.4 million, respectively). Goodwill generated in the acquisition of i:FAO is
subject to changes as a result of the purchase price allocation exercise that will be carried out in the next quarters.
5.2.4 Equity. Share capital
As of December 31, 2014 the share capital of our Company was represented by 447,581,950 shares with a
nominal value of €0.01 per share.
On December 11, 2014 the Board of Directors agreed to undertake a share buy-back programme. The programme
will remain in force until May 29, 2015 and the maximum investment will be €320 million, not exceeding
12,500,000 shares (or 2.79% of the share capital of the Company). As of December 31, 2014 1,316,411 shares
had been acquired.
As of December 31, 2014, the maximum investment under the share buy-back programme (€320 million) has
been recognised in the statement of financial position as a reduction of the equity of the Company. The future
6 Net cost of acquiring brands and trademarks (either by means of business combinations or in separate acquisitions) as well
as the net cost of acquiring software licenses developed outside the Group for Distribution and IT Solutions.
7 Net cost of acquiring technology software and travel content either by means of acquisitions through business combinations
/ separate acquisitions or internally generated (software applications developed by the Group, including the development
technology of the IT solutions business). Travel content is obtained by Amadeus through its relationships with travel providers.
8 Net cost of contractual relationships with travel agencies, as acquired through business combinations, as well as costs subject
to capitalisations, related to travel agency incentives, that can be recognised as an asset.

Page 37 of 50 amadeus.com
© 2
015 A
madeus I
T G
roup S
A
payments under the share buy-back programme, amounting to €288.8 million, have been included in the “Other
current liabilities” caption in the statement of financial position, as well as in covenant net financial debt.
For information in relation to dividend payments, see section 6.3.1 “Dividend payment and dividend policy”.
5.2.5 Financial indebtedness
Net financial debt as per the existing financial covenants’ terms amounted to €1,738.5 million on December 31,
2014, an increase of €527.8 million vs. December 31, 2013, as a result of the cash generated during the period,
after (i) the payment of a dividend in a total amount of €278.1 million, (ii) the acquisitions of Newmarket, UFIS
and i:FAO, (iii) the finance lease agreement for an office building in Nice signed in March 2014 for an amount of
€23.3 million (of which €22.1 million remains outstanding at the end of the year), and (iv) the launch of a share
buy-back programme (as explained in section 6.3.2). In addition, the reported figure has increased as a
consequence of the evolution of the EUR/USD FX rate in our USD denominated debt.
As of December 31, 2014, our covenant net financial debt represented 1.32 times covenant net financial debt to
EBITDA.
During the year, the following changes to our debt structure took place:
_ Partial amortisation of the bank financing (tranche A of the senior credit facility), as agreed in the senior
credit agreement, as well as voluntary repayments of €74.4 million in October 2014.
_ Refinancing of the loan associated with the acquisition of Newmarket (USD 500 million) in November 2014,
which had been drawn in February 2014, with a €400 million fixed rate bond issuance (EMTN), successfully
priced on November 25, 2014. The maturity date for this bond issue is December 2, 2017 and it has an annual
coupon of 0.625%.
As explained in section 6.3.2, Amadeus announced a share buy-back programme on December 11, 2014 which
will remain in force until May 29, 2015. The maximum investment will be €320 million, not exceeding 12,500,000
shares (or 2.79% of the share capital of the Company). As of December 31, 2014, the Company had acquired a
total number of shares of 1,316,411 for an amount of €42.4 million, out of which €11.2 million was unpaid. The
future payments under the share buy-back programme, amounting to €288.8 million, have been included in the
“Other current liabilities” caption in the statement of financial position, as well as in covenant net financial debt
as of December 31, 2014.

Page 38 of 50 amadeus.com
© 2
015 A
madeus I
T G
roup S
A
Indebtedness Figures in million euros
31/12/2014 31/12/2013
Covenants definition1
Senior Loan (EUR) 74.4 265.9
Senior Loan (USD)2 157.1 253.6
Long term bonds 1,150.0 750.0
EIB loan 350.0 350.0
Other debt with financial institutions 46.5 60.7
Obligations under finance leases 44.8 21.4
Share buy-back programme 288.8 0.0
Covenant Financial Debt 2,111.6 1,701.6
Cash and cash equivalents (373.0) (490.9)
Covenant Net Financial Debt 1,738.5 1,210.7
Covenant Net Financial Debt / LTM Covenant EBITDA3 1.32x 1.01x
Reconciliation with financial statements
Net financial debt (as per financial statements) 1,450.6 1,207.3
Interest payable (18.7) (20.6)
Deferred financing fees 8.3 12.3
EIB loan adjustment 9.6 11.7
Share buy-back programme 288.8 0.0
Covenant Net Financial Debt 1,738.5 1,210.7
1. Based on the definition included in the senior credit agreement. 2. The outstanding balances denominated in USD have been converted into EUR using the USD / EUR exchange rate of
1.2141 and 1.3791 (official rate published by the ECB on Dec 31, 2014 and Dec 31, 2013, respectively). 3. LTM Covenant EBITDA as defined in the senior credit agreement.
Reconciliation with net financial debt as per our financial statements
Under the covenant terms, Covenant Financial Debt (i) does not include the accrued interest payable (€18.7
million at December 31, 2014) which is treated as debt in our financial statements, (ii) is calculated based on its
nominal value, while in our financial statements our financial debt is measured at amortised cost, i.e., after
deducting the deferred financing fees (that correspond mainly to fees paid upfront in connection with the set-up
of new credit agreements and amount to €8.3 million at December 31, 2014), (iii) does not include an adjustment
for the difference between the nominal value of the loan granted by the EIB at below-market interest rate and
its fair value (€9.6 million at December 31, 2014), and (iv) includes the outstanding payment of the share buy-
back programme at December 31, 2014 (€288.8 million), as explained above, which has been included in the
“Other current liabilities” caption in the statement of financial position.
USD denominated debt
In line with our company policy of minimising our financial risks, part of our financial debt is denominated in USD,
in order to hedge our exposure to FX movements in the EUR-USD exchange rate. As of December 31, 2014, we
had USD 191 million bank debt, which is serviced with the cash flow generated in USD. Therefore, both the
interest and the principal of the USD denominated debt are providing an economic hedge of the operating cash
flows generated in that currency.

Page 39 of 50 amadeus.com
© 2
015 A
madeus I
T G
roup S
A
Hedging arrangements
At December 31, 2014, 13% of our total financial debt was subject to floating interest rates, indexed to the
EURIBOR or the USD LIBOR, while 87% of our debt had a fixed interest and was therefore not subject to interest
rate risk. However, we use hedging arrangements to limit our exposure to movements in the underlying interest
rates. Under these arrangements, 80% of our USD-denominated gross debt subject to floating interest rates had
its base interest rate fixed until November 2015 at a rate of 0.485%. Therefore, in total, as of December 31,
2014, 94% of our total financial debt had a fixed cost.
Debt structure as of December 31, 2014
Description Amount Maturity
Bank financing Amortising Term Loan €231m1 November 2015 (Last payment)
Capital markets financing
Euro Bond €750m €400m
July 2016 December 2017
EIB Loans Development loans
(Amortising) €200m €150m
May 2021 May 2022
(Last payment)
Revolving Credit Facilities
Revolver €300m November 2018
1. USD denominated debt converted into EUR using the USD/EUR exchange rate of 1.2141 (official rate published by the
ECB on Dec 31, 2014).
As of December 31, 2014 the revolver facility remained undrawn.
In December 2014, Amadeus set up a Multi-Currency European Commercial Paper (ECP) programme, which can
be used for raising short term financing up to a maximum notional of €500 million. As of December 31, 2014 this
programme was unused.
Debt maturity profile as of December 31, 2014
231
750
400
13
30
50
65 65 65 48 15
2015 2016 2017 2018 2019 2020 2021 2022
Bank financing Euro Bond EIB loans

Page 40 of 50 amadeus.com
© 2
015 A
madeus I
T G
roup S
A
5.3 Group cash flow
Consolidated Statement of Cash Flows Figures in million euros
Oct-Dec 2014
Oct-Dec 2013
% Change
Full Year 2014
Full Year 2013
% Change
EBITDA 268.5 239.7 12.0% 1,306.0 1,188.7 9.9%
Change in working capital 105.3 88.7 18.7% 71.1 65.6 8.3%
Capital expenditure (113.5) (105.1) 8.0% (427.5) (411.2) 4.0%
Pre-tax operating cash flow 260.3 223.4 16.5% 949.6 843.1 12.6%
Taxes (134.1) (131.0) 2.3% (290.7) (231.1) 25.8%
Interest and financial fees paid (6.8) (11.7) (42.1%) (62.6) (70.3) (11.0%)
Free cash flow 119.4 80.6 48.2% 596.3 541.7 10.1%
Equity investments (1.1) (0.9) 21.8% (387.2) (8.0) n.m.
Cash flow from extraordinary items 15.8 (1.8) n.m. 11.8 (3.6) n.m.
Debt payment (154.1) (42.9) n.m. (22.2) (212.1) n.m.
Cash to shareholders (30.8) 0.0 n.m. (316.5) (227.1) 39.4%
Change in cash (50.7) 35.0 n.m. (117.8) 91.0 n.m.
Cash and cash equivalents, net1
Opening balance 423.5 455.5 (7.0%) 490.6 399.6 22.8%
Closing balance 372.8 490.6 (24.0%) 372.8 490.6 (24.0%)
1. Cash and cash equivalents are presented net of overdraft bank accounts.
5.3.1 Change in working capital
Amadeus typically works on negative working capital (i.e. cash inflows), driven by the fact that Amadeus collects
payments from most airlines (more than 80% of our group collections) through IATA, ICH and ACH, with an
average collection period of just over one month, whilst payments to providers and suppliers are made on average
over a significantly longer period.
Cash inflow in 2014 was higher than in 2013, mainly driven by the negative effect affecting the 2013 figure
related to factoring done in 2012 as opposed to no factoring done in 2013. Similarly, no factoring was done in
2014.
5.3.2 Capital expenditure. R&D investment
The table below details the capital expenditure in the period, both on tangible and intangible assets. Based on
the nature of our investments on tangible assets, the figures may show variations on a quarterly basis, depending
on the timing on certain investments. The same applies to our investments in contractual relationships where
payments to travel agencies may take place in different periods, based on the timing of the renegotiations.
Capex in the fourth quarter of 2014 amounted to €109.7 million (excluding the consolidated capex of Newmarket,
UFIS and i:FAO), 4.4% higher than in the same period of 2013. This increase was mostly explained by higher
capitalised R&D, partially offset by a reduction in signing bonuses paid in the period.
For the full year period, on a comparable basis, capex increased by €8.2 million, or 2.0%, and represented 12.6%
of revenue.

Page 41 of 50 amadeus.com
© 2
015 A
madeus I
T G
roup S
A
This increase in capex was driven by a combination of:
(i) €14.7 million higher investment in property, plant and equipment, mostly due to the acquisition of certain
specific software at our data centre.
(ii) A decline of €6.5 million or 1.8% in investment in intangible assets, driven by (i) a decline in capitalised
R&D, due to a reduction in the capitalisation ratio, which fluctuates depending on the intensity of the
development activity, the mix of projects undertaken and the different stages in which the ongoing
projects are in, and (ii) lower payments in relation to the purchase of software licenses, partly due to the
replacement of some of them by contracts “software-as-a-service”. In turn, signing bonuses paid in the
year increased.
It is important to note that most of our investments do not have any revenue associated at this stage, or are
investments for projects that will produce the revenues during the life of the contracts, on average 10 to 15 years
in airline IT and 3 to 5 in Distribution, therefore affecting the capex as a percentage of revenue ratio in the short
term. More importantly, a large part of our investments (those related to the migration of our clients) is paid by
the customer, although not recognised as revenue but deferred in the balance sheet. It is therefore capex which
does not have a negative cash impact and where revenue does not get recognised as such, making the ratio of
capex to revenue less relevant.
Capital Expenditure Figures in million
euros
Oct-Dec 2014
Oct-Dec 2014 (excl. M&A)1
Oct-Dec 2013
% Change (excl. M&A)1
Full year 2014
Full year 2014 (excl. M&A)1
Full year 2013
% Change (excl. M&A)1
Capital Expenditure in PP&E
22.4 22.0 20.4 7.8% 77.8 76.3 61.6 23.8%
Capital Expenditure in intangible assets
91.1 87.7 84.7 3.5% 349.7 343.1 349.6 (1.8%)
Capital Expenditure 113.5 109.7 105.1 4.4% 427.5 419.4 411.2 2.0%
As % of Revenue 13.6% 13.5% 14.2% (0.7 p.p.) 12.5% 12.6% 13.2% (0.7 p.p.)
1. For comparability purposes, we have excluded the Newmarket, UFIS and i:FAO results. The “% Change” column above
shows the comparable growth, excluding the impact from these acquisitions.
R&D expenditure
As a leading and differentiated technology provider for the travel industry, Amadeus undertakes significant R&D
activities, which are the main driver for growth. Our investment in R&D can be classified in various categories,
including customer implementations, portfolio expansion / product evolution, diversification into non-air IT and
internal technological projects.
In the fourth quarter of 2014, R&D investment (including both capitalised and non-capitalised expenses and
excluding the Newmarket, UFIS and i:FAO consolidated investment) increased by 6.2% vs. the same period in
2013. Total R&D for the year on the same basis amounted to €527.1 million, 5.3% higher than in 2013. As a
percentage of revenue, R&D costs amounted to 15.8%.
The increase in R&D is explained by:
_ Increased resources devoted to the new businesses, in particular (i) airport IT, linked to the contracts signed
in the year as well as to portfolio development, (ii) hotel, including resources dedicated to our agreement
with IHG, (iii) rail, with teams dedicated to our partners, such as BeneRail, and (iv) payments and travel
intelligence.
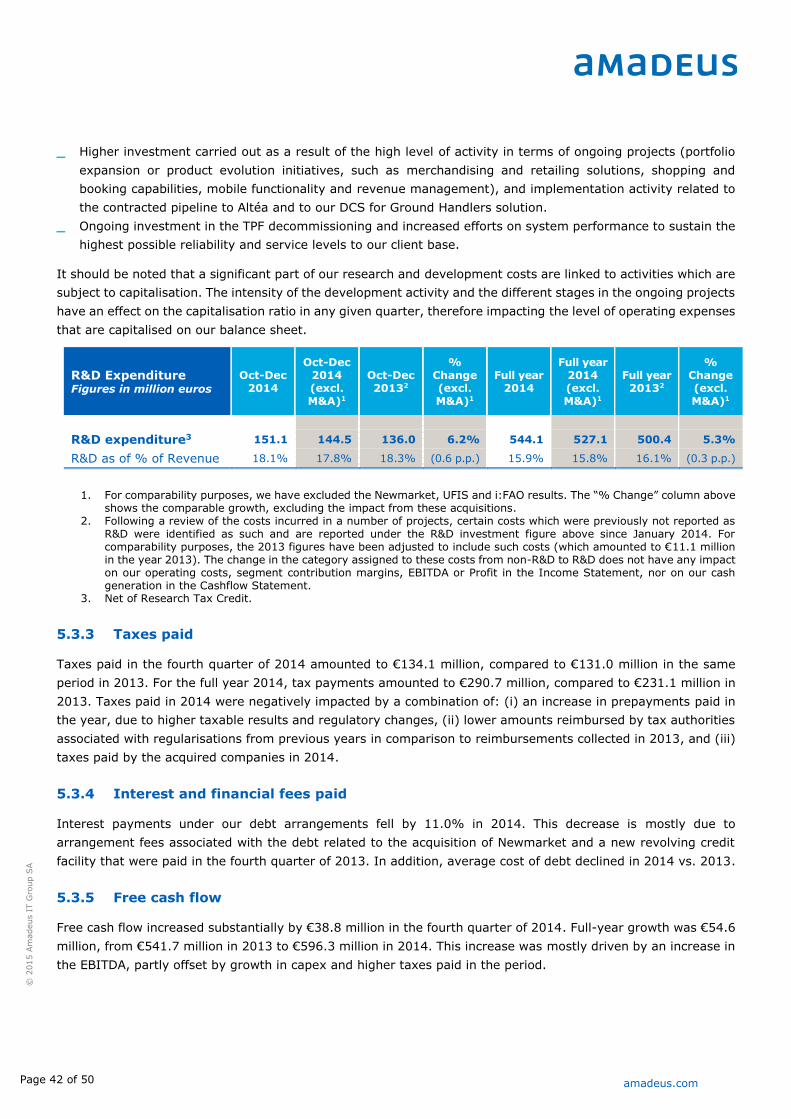
Page 42 of 50 amadeus.com
© 2
015 A
madeus I
T G
roup S
A
_ Higher investment carried out as a result of the high level of activity in terms of ongoing projects (portfolio
expansion or product evolution initiatives, such as merchandising and retailing solutions, shopping and
booking capabilities, mobile functionality and revenue management), and implementation activity related to
the contracted pipeline to Altéa and to our DCS for Ground Handlers solution.
_ Ongoing investment in the TPF decommissioning and increased efforts on system performance to sustain the
highest possible reliability and service levels to our client base.
It should be noted that a significant part of our research and development costs are linked to activities which are
subject to capitalisation. The intensity of the development activity and the different stages in the ongoing projects
have an effect on the capitalisation ratio in any given quarter, therefore impacting the level of operating expenses
that are capitalised on our balance sheet.
R&D Expenditure Figures in million euros
Oct-Dec 2014
Oct-Dec 2014 (excl. M&A)1
Oct-Dec 20132
% Change (excl. M&A)1
Full year 2014
Full year 2014 (excl. M&A)1
Full year 20132
% Change (excl. M&A)1
R&D expenditure3 151.1 144.5 136.0 6.2% 544.1 527.1 500.4 5.3%
R&D as of % of Revenue 18.1% 17.8% 18.3% (0.6 p.p.) 15.9% 15.8% 16.1% (0.3 p.p.)
1. For comparability purposes, we have excluded the Newmarket, UFIS and i:FAO results. The “% Change” column above shows the comparable growth, excluding the impact from these acquisitions.
2. Following a review of the costs incurred in a number of projects, certain costs which were previously not reported as R&D were identified as such and are reported under the R&D investment figure above since January 2014. For comparability purposes, the 2013 figures have been adjusted to include such costs (which amounted to €11.1 million in the year 2013). The change in the category assigned to these costs from non-R&D to R&D does not have any impact on our operating costs, segment contribution margins, EBITDA or Profit in the Income Statement, nor on our cash generation in the Cashflow Statement.
3. Net of Research Tax Credit.
5.3.3 Taxes paid
Taxes paid in the fourth quarter of 2014 amounted to €134.1 million, compared to €131.0 million in the same
period in 2013. For the full year 2014, tax payments amounted to €290.7 million, compared to €231.1 million in
2013. Taxes paid in 2014 were negatively impacted by a combination of: (i) an increase in prepayments paid in
the year, due to higher taxable results and regulatory changes, (ii) lower amounts reimbursed by tax authorities
associated with regularisations from previous years in comparison to reimbursements collected in 2013, and (iii)
taxes paid by the acquired companies in 2014.
5.3.4 Interest and financial fees paid
Interest payments under our debt arrangements fell by 11.0% in 2014. This decrease is mostly due to
arrangement fees associated with the debt related to the acquisition of Newmarket and a new revolving credit
facility that were paid in the fourth quarter of 2013. In addition, average cost of debt declined in 2014 vs. 2013.
5.3.5 Free cash flow
Free cash flow increased substantially by €38.8 million in the fourth quarter of 2014. Full-year growth was €54.6
million, from €541.7 million in 2013 to €596.3 million in 2014. This increase was mostly driven by an increase in
the EBITDA, partly offset by growth in capex and higher taxes paid in the period.

Page 43 of 50 amadeus.com
© 2
015 A
madeus I
T G
roup S
A
5.3.6 Equity investments
Equity investments amounted to €387.2 million in 2014. This cash outflow mainly corresponds to payments in
relation to the acquisition of Newmarket, UFIS and i:FAO.
5.3.7 Cash flow from extraordinary items
Cash inflow from extraordinary items in 2014 was largely driven by gains in the cancellation of certain FX hedging
instruments in the year.
5.3.8 Cash to shareholders
The cash outflow to shareholders in 2014, amounting to €316.5 million, corresponds to (i) the dividend of €278.1
million, or €0.625 per share (gross), on the 2013 profit, paid in the year, and (ii) an amount of €38.4 million
related to the acquisition of treasury shares in the year, most of which were acquired as part of the share buy-
back programme announced on December 11, 2014 (see section 6.3).

Page 44 of 50 amadeus.com
© 2
015 A
madeus I
T G
roup S
A
6 Investor information

Page 45 of 50 amadeus.com
© 2
015 A
madeus I
T G
roup S
A
6.1 Capital stock. Share ownership structure
As of December 31, 2014 the capital stock of Amadeus IT Holding, S.A. is €4,475,819.5 represented by
447,581,950 shares with a nominal value of €0.01 per share, all belonging to the same class, completely
subscribed and paid in.
The shareholding structure as of December 31, 2014 is as described in the table below:
Shareholders Shares % Ownership
Free float 443,505,214 99.08%
Treasury shares1 3,605,477 0.81%
Board members 471,259 0.11%
Total 447,581,950 100%
1. Voting rights suspended for as long as the shares are held by Amadeus IT Holding, S.A.
6.2 Share price performance in 2014
Amadeus
Number of publicly traded shares (# shares) 447,581,950
Share price at December 31, 2014 (in €) 33.09
Maximum share price in Jan - Dec 2014 (in €) (Dec 24, 2014) 33.20
Minimum share price in Jan - Dec 2014 (in €) (Oct 20, 2014) 25.94
Market capitalisation at December 31, 2014 (in € million) 14,808
Weighted average share price in Jan – Dec 2014 (in €)1 30.02
Average Daily Volume in Jan - Dec 2014 (# shares) 3,451,541
1. Excluding cross trades.
80
85
90
95
100
105
110
115
AMADEUS IBEX EUROSTOXX S&P 500
+3.7%
+11.4%
+6.4%
Rebased to 100
+1.2%

Page 46 of 50 amadeus.com
© 2
015 A
madeus I
T G
roup S
A
6.3 Shareholder remuneration
6.3.1 Dividend payments and dividend policy
At the Shareholders’ General Meeting held on June 26, 2014 our shareholders approved the annual gross dividend
from the profit of the year 2013. The total value of the dividend was €279.7 million, representing a pay-out of
50% of the 2013 reported profit for the year, or €0.625 per share (gross), which is a 25% increase over prior
year. Regarding the payment, an interim amount of €0.30 per share (gross) was paid up on January 31, 2014
and the complementary dividend of €0.325 per share (gross) was paid up on July 29, 2014.
The Board of Directors of Amadeus IT Holding, S.A held on December 11, 2014 proposed a 50% pay-out target
ratio for the year 2014 (the maximum percentage within the 40%-50% approved pay-out range).
In June 2015, the Board of directors will submit to the General Shareholders Meeting for approval a final gross
dividend of €0.70 per share, including an interim dividend of €0.32 per share (gross), which was paid in full on
January 30, 2015. Based on this, the proposed appropriation of the 2014 results included in our 2014 audited
consolidated financial statements of Amadeus IT Holding, S.A. and subsidiaries includes a total amount of €313.3
million corresponding to dividends pertaining to the financial year 2014.
6.3.2 Share buy-back programme
The Board of Directors of Amadeus at the meeting of December 11, 2014 agreed to undertake a share buy-back
programme, in accordance with the authorisation granted by the Annual General Shareholders Meeting held on
20 June 2013, in order to reduce the share capital of the Company (subject to agreement at the Annual General
Shareholders Meeting in June 2015). The programme will remain in force until May 29, 2015 and the maximum
investment will be €320 million, not exceeding 12,500,000 shares (or 2.79% of the share capital of the Company).
As of December 31, 2014, the Company had acquired a total number of shares of 1,316,411 for an amount of
€42.4 million, out of which €11.2 million was unpaid. The future payments under the programme, amounting to
€288.8 million, have been included in the “Other current liabilities” caption in the statement of financial position,
as well as in covenant net financial debt, as of December 31, 2014.
The share repurchase programme constitutes an extraordinary shareholder remuneration event which together
with the annual ordinary dividend will bring substantial shareholder remuneration growth. Since the Amadeus
IPO, shareholder remuneration has grown consistently, evidencing its importance within the Amadeus capital
allocation process.

Page 47 of 50 amadeus.com
© 2
015 A
madeus I
T G
roup S
A
7 Key terms
_ “ACH”: refers to “Airlines Clearing House”
_ “ACO”: refers to “Amadeus Commercial Organisation”
_ “Air TA bookings”: air bookings processed by travel agencies using our distribution platform
_ “CRS” : refers to “Computerised Reservation System”
_ “DCS”: refers to “Departure Control System”
_ “EMD”: refers to “Electronic Miscellaneous Document”
_ “EPS”: refers to “Earnings Per Share”
_ “EIB”: refers to “European Investment Bank”
_ “EMTN”: “European Medium-Term Notes”
_ “FTE”: refers to “Full-Time Equivalent” employee
_ “GDS”: refers to a “Global Distribution System”, i.e. a worldwide Computerised Reservation System (“CRS”)
used as a single point of access for reserving airline seats, hotel rooms and other travel-related items by
travel agencies and large travel management corporations
_ “Air TA booking industry”: includes the total volume of air bookings processed by GDSs, excluding (i) air
bookings processed by the single country operators (primarily in China, Japan and Russia) and (ii) bookings
of other types of travel products, such as hotel rooms, car rentals and train tickets
_ “IATA”: the “International Air Transportation Association”
_ “ICH”: the “International Clearing House”
_ “IPO”: refers to “Initial Public Offering”
_ “JV”: refers to “Joint Venture”
_ “KPI”: refers to “key Performance Indicators”
_ “LATAM”: refers to “Latin America”
_ “LTM”: refers to “Last Twelve Months”
_ “n.a.”: refers to “not available”
_ “NDC”: refers to “New Distribution Capability” as defined by IATA
_ “n.m.”: refers to “not meaningful”
_ “PB”: refers to “Passengers Boarded”, i.e. actual passengers boarded onto flights operated by airlines using
at least our Amadeus Altéa Reservation and Inventory modules
_ “PNR”: refers to “Passenger Name Record”
_ “p.p.”: refers to “percentage point”
_ “PPA”: refers to “Purchase Price Allocation”
_ “PP&E”: refers to “Property, Plant and Equipment”
_ “RTC”: refers to “Research Tax Credit”
_ “TA”: refers to “Travel Agencies”
_ “TPF”: refers to “Transaction Processing Facility”, a software license from IBM
_ “XML”: refers to “eXtensible Markup Language”

Page 48 of 50 amadeus.com
© 2
015 A
madeus I
T G
roup S
A
8 Annexe. Amadeus social and environmental initiatives
The travel industry comprises diverse and interdependent sectors which together represent 9% of both global
GDP and employment worldwide. Connecting the complex ecosystem of sellers and buyers of travel, Amadeus is
in a privileged position to drive social and environmental responsibility initiatives, leveraging underlying technol-
ogy capabilities, expertise and stakeholder relations.
To support social development, we tap into the vast opportunities that the world’s travel sector has to offer. We
involve our business, our people and partners in the sector, to contribute to change through development pro-
jects, education and welfare of underserved communities – especially in the markets where we operate.
The strategy of Amadeus in social responsibility is to use the core strengths of our business and the opportunities
in the global travel industry, in order to help alleviate widespread social challenges that our stakeholders identify
and that we are well placed to answer.
In 2014, over 140 projects and initiatives were carried out with measurable impact in 57 countries. All these
initiatives were identified and developed in partnership with external social stakeholders, in the three core pro-
gramme areas in which we deliver our commitment to society: Amadeus Technology for Good, Amadeus
Knowledge & Skills Transfer and Amadeus Community Support programmes.
Our social responsibility initiatives can be divided into three categories. First, our community support programme
covers the projects that Amadeus offices and people carry out in their locations, generally in partnership with
their local communities. The specific activities range from fundraising events to Amadeus volunteers that dedicate
part of their time on educational activities for children in various parts of the world.
Secondly, Amadeus technology for good program takes advantage of our core business technology to use it for
social responsibility programmes. In 2013, Amadeus reached a major milestone with the implementation of a
global online donation project, in partnership with UNICEF and players in the travel industry. Spanish carrier
IBERIA became the first airline to go live with the programme on its website. Every time a traveller buys a ticket
on www.iberia.com, they can make a donation of between 3 to 20 Euros. The funds raised go to UNICEF projects.
In 2014, Finnair joined the Amadeus UNICEF online donation project.
Thirdly, the Amadeus knowledge and skills transfer programme aims primarily at bridging the gap between main-
stream academia and real-life business needs. Amadeus works in cooperation with NGOs or academic institutions
and contributes with the expertise and industry knowledge of our people. In 2014, our collaboration with more
than one hundred university or training centre partners resulted in more than five thousand young people bene-
fitting from Amadeus Knowledge & Skills Transfer programme, receiving either training in travel reservation and
general business management, mentoring or certifications in the Amadeus System. On the environmental front,
our strategy is based on the continuous improvement of the environmental performance of our operations, on
delivering solutions that contribute positively to the environmental performance of our customers and on working
in partnership with other industry stakeholders towards a sustainable travel future.
Internally, we look at our operations and aim at minimising our resource consumption and impact. In this respect,
the energy efficiency program in our Data Centre in Erding (Germany) is particularly relevant. The Data Centre
received the certification from TÜV SÜD as an energy efficient centre in 2010, and the certification was renewed
in 2012 with validity until 2015. The Power Usage Effectiveness of the Data Centre was 1.39, a figure that is

Page 49 of 50 amadeus.com
© 2
015 A
madeus I
T G
roup S
A
associated with a very efficient performance. On the other hand, the Amadeus Environmental Management Sys-
tem (EMS) monitors energy and resource consumption at our top office sites worldwide. The EMS also provides
a basis for continuous improvement since best practices are identified and actions for improvement recom-
mended. Since 2010, when the system was systematically implemented, we have continuously improved perfor-
mance. The parameters covered in the EMS are energy consumption, greenhouse gas emissions, paper consump-
tion, water consumption and waste generation.
Amadeus was included in 2014 in the Carbon Disclosure Leadership Index with a score of 93 in disclosure (range
0 to 100), and an A in performance (range E to A). Additionally, Amadeus remained for the third consecutive year
in the Dow Jones Sustainability Index.
The second category of environmental initiatives analyses and fosters the environmental benefits of Amadeus
products and services. Since Amadeus solutions generally improve efficiencies, some of these efficiencies also
translate into environmental improvements. For example, the Amadeus Altéa Departure Control System (DCS)
improves productivity and efficiency for airlines and it also reduces airlines fuel consumption. The sophisticated
methodology that Altéa DCS uses to estimate the weight of the aircraft before the fuel is loaded is fundamental
to optimize the amount of fuel uplift and aircraft fuel consumption. In 2014 our Airport Management solutions
were starting to be implemented. These solutions permit, among other benefits, the reduction of aircraft taxi time
at airports, reducing fuel consumption, noise, local pollution, greenhouse gases emissions and permitting as well
the improved use of airport infrastructure, particularly regarding aircraft de-icing processes. Finally, we work
together with other industry stakeholders to achieve industry environmental goals. In our partnership with the
International Civil Aviation Organisation (ICAO), we are developing solutions to keep travellers and other stake-
holders informed about the estimated emissions per person of any flight covered by civil aviation, thanks to the
use in Amadeus platforms of ICAO’s carbon calculator. In this project, Amadeus contributes with our global reach
and exposure to millions of travellers daily, and ICAO contributes with its carbon calculator and its legitimacy to
represent the industry as the UN body that takes care of civil aviation. At the moment the ICAO carbon calculator
is used in several Amadeus platforms including our corporate booking tool, and in 2015 we plan to expand the
use to other users and applications.

Page 50 of 50 amadeus.com
© 2
015 A
madeus I
T G
roup S
A
Contacts
For any other information please contact:
Ana de Pro Cristina Fernández Chief Financial Officer Director, Investor Relations [email protected] [email protected]
You can follow us on:
AmadeusITGroup
investors.amadeus.com
Disclaimer
There may be statements in this financial report which are not purely historical facts, including statements about
anticipated or expected future revenue and earnings growth. All forward looking statements in this presentation
are based upon information available to Amadeus on the date of this presentation. Any forward looking statements
involve risks and uncertainties that could cause actual events or results to differ materially from the events or
results described in the forward looking statements. Amadeus undertakes no obligation to publicly update or
revise any forward looking statements, whether as a result of new information, future events or otherwise. Read-
ers are cautioned not to place undue reliance on forward looking statements.