management strategy evaluation (mse) · 6/7/2016 · management strategy evaluation (mse) sarah...
TRANSCRIPT

Management Strategy Evaluation (MSE)
Sarah Gaichas NEFSC
NEFSC Ecosystem and Climate Science Program Review Modeling and Analysis Session
June 7, 2016

U.S. Department of Commerce | National Oceanic and Atmospheric Administration | NOAA Fisheries | Page 2
You are here: Themes 3 and 4 (mostly)
Effe
ctiv
e R
esou
rce
Man
agem
ent 450+ Fisheries
Species
117 Marine Mammals & 93 ESA species
2000+ Habitat Actions
200 + Aquaculture actions
100 + NEPA actions & 11 LMEs
Observations & Data
Research & Modeling
Synthesis & Assessment
Management Advice
Science Enterprise

Powerful strategic tools • Risk assessment methods • Management Strategy Evaluation
Redrawn with permission of Beth Fulton
U.S. Department of Commerce | National Oceanic and Atmospheric Administration | NOAA Fisheries | Page 3

For the Review Panel—this addresses Theme 1: Management Context and Strategic Planning
• See 2014 Stock Assessment Program Review
• NEFSC MSE working group established 2015 • Expertise: Fish, Marine mammals, Ecosystems, Economics,
Social policy • Charge: Develop NEFSC MSE plan • Contacted Councils/Commission; Initial project Atlantic herring
• NEFSC MSE FTE shared 50:50 (PopDy:EcoAP) • SPERS MSE Activity plan developed 2016
NEFSC: Assessment and MSE Capability
U.S. Department of Commerce | National Oceanic and Atmospheric Administration | NOAA Fisheries | Page 4

Overview of NEFSC MSE projects
6/2/2016 U.S. Department of Commerce | National Oceanic and Atmospheric Administration | NOAA Fisheries | Page 5

Towards Ecosystem Level Assessment, MSE Theme 3: Tool Development • Diverse operating models (see modeling presentation) • Multispecies assessment model performance testing and
multi-model inference (see poster)
Theme 3: Analyses • Evaluating multispecies management procedures • Identifying ecosystem thresholds • Evaluating climate change impacts • MSE for Integrated Ecosystem Assessment
U.S. Department of Commerce | National Oceanic and Atmospheric Administration | NOAA Fisheries | Page 6
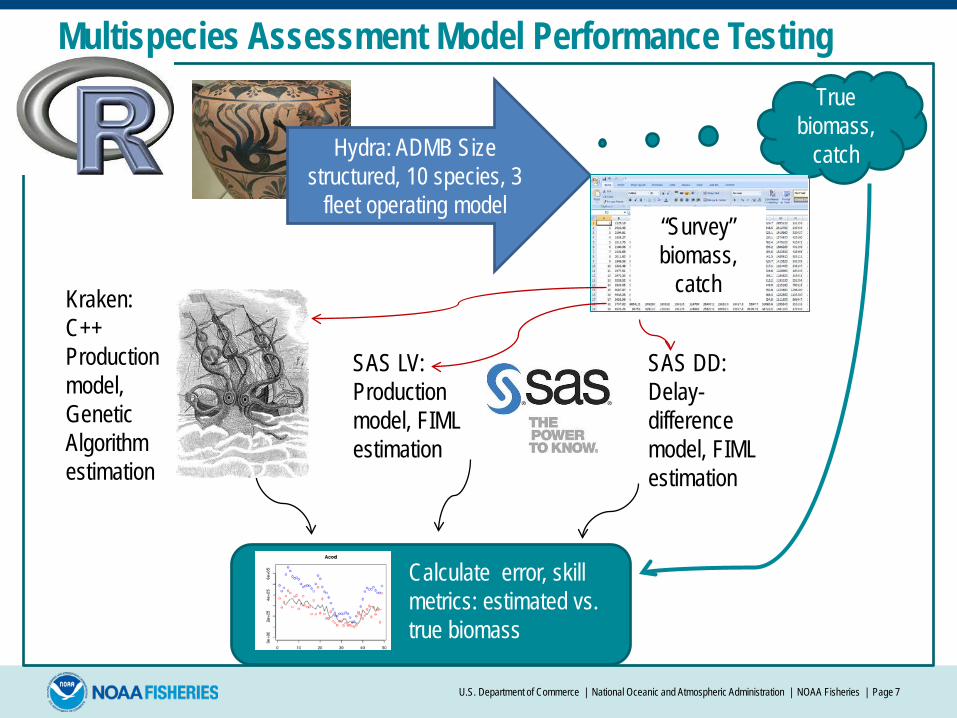
Hydra: ADMB Size structured, 10 species, 3
fleet operating model
True biomass,
catch
“Survey” biomass,
catch Kraken: C++ Production model, Genetic Algorithm estimation
SAS LV: Production model, FIML estimation
SAS DD: Delay-difference model, FIML estimation
Calculate error, skill metrics: estimated vs. true biomass
Multispecies Assessment Model Performance Testing
U.S. Department of Commerce | National Oceanic and Atmospheric Administration | NOAA Fisheries | Page 7

Survey bias + obs. error scenario Best Modeling Efficiency performance: 0 < MEF ≤ 1
3 model ensemble
Simplest
Delay Diff
U.S. Department of Commerce | National Oceanic and Atmospheric Administration | NOAA Fisheries | Page 8

Evaluating multispecies management procedures
Four component management procedure: 1. a limit on total removals for the ecosystem; 2. an allocation of the total removals limit to aggregate
species groups; 3. minimum stock size thresholds for individual species;
and 4. guidance for optimizing the species mix (within
aggregates) based on bio-economic portfolio analysis.
• Manage fewer catch limits—simple, flexible • Integrated assessment of species status
Total catch limit
flatfish groundfish
forage fish elasmos
U.S. Department of Commerce | National Oceanic and Atmospheric Administration | NOAA Fisheries | Page 9

Example Species Yield Curves Distribution of catches over 500 iterations
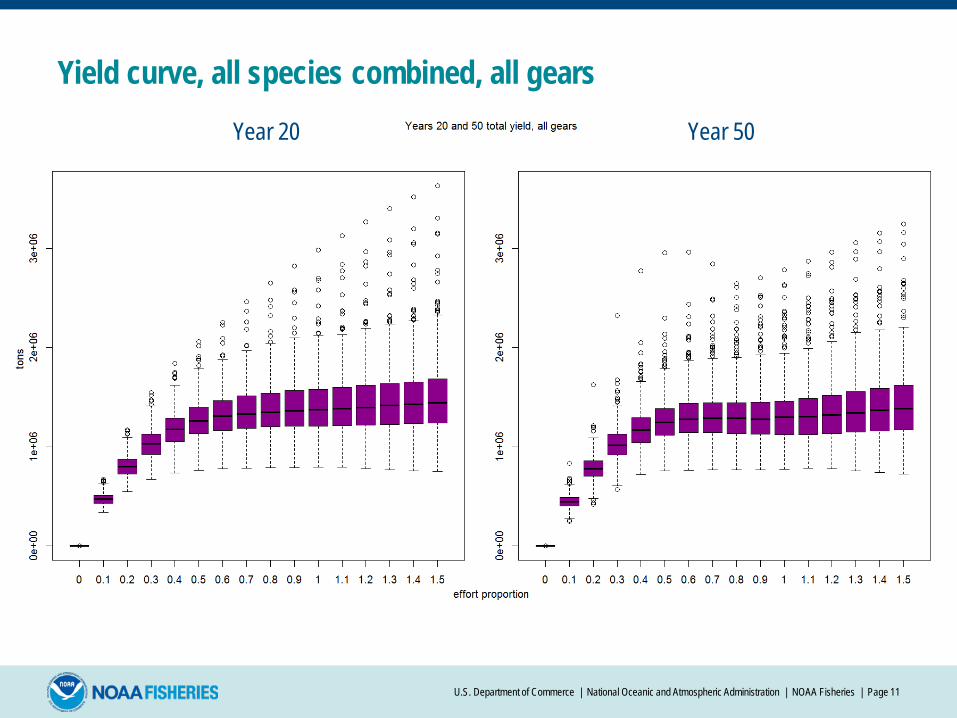
Year 20 Year 50
Yield curve, all species combined, all gears
U.S. Department of Commerce | National Oceanic and Atmospheric Administration | NOAA Fisheries | Page 11

U.S. Department of Commerce | National Oceanic and Atmospheric Administration | NOAA Fisheries | Page 12

U.S. Department of Commerce | National Oceanic and Atmospheric Administration | NOAA Fisheries | Page 13

Year 20 Year 50
Yield curve, all species combined, all gears
U.S. Department of Commerce | National Oceanic and Atmospheric Administration | NOAA Fisheries | Page 14
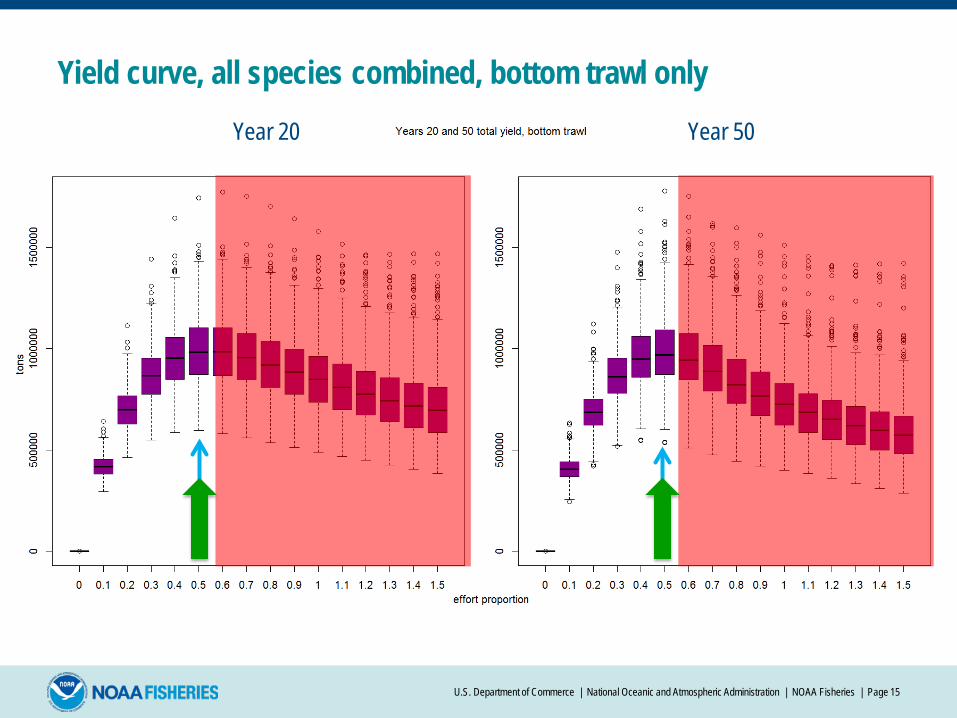
Year 20 Year 50
Yield curve, all species combined, bottom trawl only
U.S. Department of Commerce | National Oceanic and Atmospheric Administration | NOAA Fisheries | Page 15

Year 20 Year 50
Yield curve, all species combined, fixed gear only
U.S. Department of Commerce | National Oceanic and Atmospheric Administration | NOAA Fisheries | Page 16

Yield curve, all species combined, pelagic trawl gear only
Year 20 Year 50
U.S. Department of Commerce | National Oceanic and Atmospheric Administration | NOAA Fisheries | Page 17

Can an improved mix of gears higher yields?
+ ~12%
Gaichas et al in review, ICES JMS
U.S. Department of Commerce | National Oceanic and Atmospheric Administration | NOAA Fisheries | Page 18

Identifying ecosystem indicators and thresholds
• Full system responses to climate and fishing
• Energy flow indicators most sensitive to fishing
• Diversity most sensitive to SST and precipitation
U.S. Department of Commerce | National Oceanic and Atmospheric Administration | NOAA Fisheries | Page 19

Sensitivity of thresholds to climate impact
• Reduction in groundfish growth rate.
• Thresholds of response to fishing can be dependent on other system drivers.
010
0000
2000
0030
0000
TotBio pPel pPred MTLcaIndicator
Land
ings
thre
shol
d (
Slide courtesy Gavin Fay
U.S. Department of Commerce | National Oceanic and Atmospheric Administration | NOAA Fisheries | Page 20

Full system climate impacts MSE
Fay, G., J.S. Link, and J.A. Hare. In Review. Assessing the effects of ocean acidification in the Northeast US using an end-to-end marine ecosystem model. Marine Ecology Progress Series.
U.S. Department of Commerce | National Oceanic and Atmospheric Administration | NOAA Fisheries | Page 21

Integrated Ecosystem Assessment and MSE
6/2/2016 U.S. Department of Commerce | National Oceanic and Atmospheric Administration | NOAA Fisheries | Page 22

Ecosystem tradeoffs: increasing individual fleets
Negative change Positive change
U.S. Department of Commerce | National Oceanic and Atmospheric Administration | NOAA Fisheries | Page 23

Theme 4: New England Atlantic Herring MSE • Develop herring ABC control rules that consider
herring’s role as forage within the ecosystem http://www.nefmc.org/calendar/may-16-17-2016-herring-workshop
• First in US(?) to employ full stakeholder process to establish objectives prior to analysis
• Stakeholder process with Council in progress • Brief overview of workshop outcomes from report
U.S. Department of Commerce | National Oceanic and Atmospheric Administration | NOAA Fisheries | Page 24
U.S. Department of Commerce | National Oceanic and Atmospheric Administration | NOAA Fisheries | Page 25
• Peer reviewed papers • Outreach to Councils and Commission through
Northeast Regional Coordination Council • Incorporating MSE into Council initiatives
• New England Herring management, EBFM • Mid Atlantic EAFM Policy Document
• Communication via MSE stakeholder process
Theme 5: MSE Review and Communication

Successes and Challenges
U.S. Department of Commerce | National Oceanic and Atmospheric Administration | NOAA Fisheries | Page 26
• World class analytical talent at NEFSC • Multiple potential operating models available • Interdisciplinary NEFSC MSE working group • Stakeholders, Councils enthusiastic to use MSE • Stakeholder processes for MSE in development • MSE requires large resource and time investment • NEFSC is resource limited (already over capacity) • Tradeoffs between MSE and current analyses

Questions?
U.S. Department of Commerce | National Oceanic and Atmospheric Administration | NOAA Fisheries | Page 27