management support system effectiveness: further empirical … · issue, the university’s...
TRANSCRIPT

1Both authors contributed equally to this paper.
Journal of the Association for Information Systems 1
Volume 1, Article 3May 2000
MANAGEMENT SUPPORT SYSTEMEFFECTIVENESS: FURTHER
EMPIRICAL EVIDENCE1
Guisseppi A. ForgionneInformation Systems Department
University of Maryland Baltimore CountyCatonsville, Maryland 21228
Rajiv KohliUniversity of Notre Dame and
Holy Cross Health SystemSouth Bend, Indiana 46628
ABSTRACTModern research has engendered frameworks, such as the management
support system (MSS), that are designed to provide comprehensive and integrated
support for the decision making process. While one recent study has empirically
measured the effects of these frameworks on decision making, there have been
few, if any, corroborating or deprecating investigations. This article offers further
empirical evidence on MSS effectiveness.

Journal of the Association for Information Systems 2
The paper begins with a brief overview of the previous research. Next, itassesses the influences of the MSS on the process and outcomes of businesspolicy decision making. The paper also examines the implications of the analysesfor information systems research and management practice.
Keywords: business policy, decision making processes, decision supportsystems, decision outcome measures, decision process measures,management support systems
I. INTRODUCTIONModern decision making, particularly business decision making, is an art that
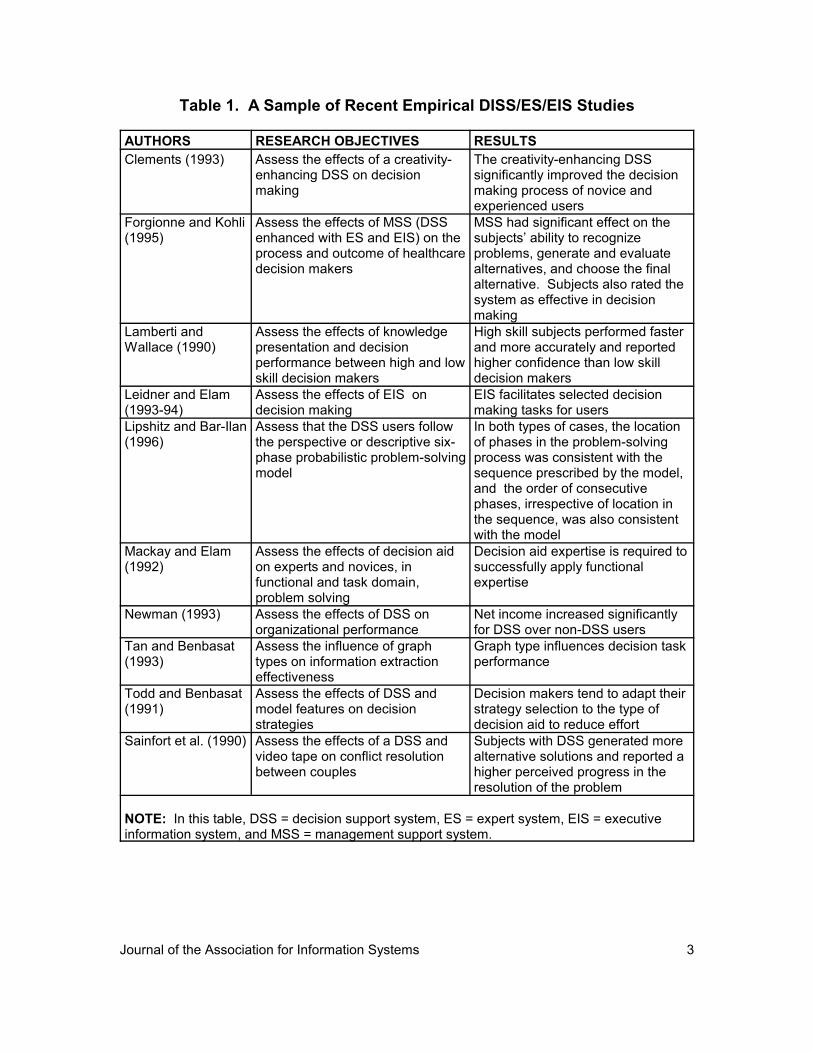
can be enhanced with science and technology. Decision support, expert, andexecutive information systems can be used to provide the artistic, scientific, andtechnological support needed for effective decision making. A variety of studieshave provided empirical verifications of this notion. Table 1 summarizes a smallsample of recent empirical studies.
While each of the individual systems can bolster a separate segment of theprocess, no one system by itself is designed to render entire decision makingsupport. Comprehensive support will require a consolidation of the separatedecision support system, expert system, and executive information system functionsand an effective delivery of the integrated capabilities (El-Najdawi and Stylianou1993; Fazlollahi 1997; Forgionne 1991; Gottinger and Weimann 1992). Integratingthe standalone functions can enhance the quality and efficiency of the segmentedsupport, create synergistic effects, and augment decision making performance andvalue (Potter et al. 1992; Silverman 1994).
A high level of integration can be achieved by embellishing a decisionsupport system with executive information and expert systems to form a “manage-ment support system (MSS).” In theory, such a system provides more problem-specific information and knowledge, and thereby offers more support for decisionmaking, than less integrated systems. Improvement should be reflected in theprocess of, as well as the outcomes from, decision making.
Journal of the Association for Information Systems 3
Table 1. A Sample of Recent Empirical DISS/ES/EIS Studies
AUTHORS RESEARCH OBJECTIVES RESULTSClements (1993) Assess the effects of a creativity-
enhancing DSS on decisionmaking
The creativity-enhancing DSSsignificantly improved the decisionmaking process of novice andexperienced users
Forgionne and Kohli (1995)
Assess the effects of MSS (DSSenhanced with ES and EIS) on theprocess and outcome of healthcaredecision makers
MSS had significant effect on thesubjects’ ability to recognizeproblems, generate and evaluatealternatives, and choose the finalalternative. Subjects also rated thesystem as effective in decisionmaking
Lamberti andWallace (1990)
Assess the effects of knowledgepresentation and decisionperformance between high and lowskill decision makers
High skill subjects performed fasterand more accurately and reportedhigher confidence than low skilldecision makers
Leidner and Elam(1993-94)
Assess the effects of EIS ondecision making
EIS facilitates selected decisionmaking tasks for users
Lipshitz and Bar-Ilan(1996)
Assess that the DSS users followthe perspective or descriptive six-phase probabilistic problem-solvingmodel
In both types of cases, the locationof phases in the problem-solvingprocess was consistent with thesequence prescribed by the model,and the order of consecutivephases, irrespective of location inthe sequence, was also consistentwith the model
Mackay and Elam(1992)
Assess the effects of decision aidon experts and novices, infunctional and task domain,problem solving
Decision aid expertise is required tosuccessfully apply functionalexpertise
Newman (1993) Assess the effects of DSS onorganizational performance
Net income increased significantlyfor DSS over non-DSS users
Tan and Benbasat (1993)
Assess the influence of graphtypes on information extractioneffectiveness
Graph type influences decision taskperformance
Todd and Benbasat(1991)
Assess the effects of DSS andmodel features on decisionstrategies
Decision makers tend to adapt theirstrategy selection to the type ofdecision aid to reduce effort
Sainfort et al. (1990) Assess the effects of a DSS andvideo tape on conflict resolutionbetween couples
Subjects with DSS generated morealternative solutions and reported ahigher perceived progress in theresolution of the problem
NOTE: In this table, DSS = decision support system, ES = expert system, EIS = executiveinformation system, and MSS = management support system.

Journal of the Association for Information Systems 4
Recently, the theory has been tested empirically through a series of health-
care experiments (Forgionne and Kohli 1995). In these experiments, clinicians and
administrators used a DSS and a MSS to help make strategic decisions for a
simulated hospital. Both the DSS and MSS were tailored to the specific needs of
hospital decision-makers. By comparing DSS- and MSS-assisted results, it was
possible to measure the MSS's influence on hospital decision making. The test
results generally supported the hypotheses that the MSS improved both the process
of, and outcomes from, the simulated decision making.
Although the MSS showed promise, the concept needed further research.
Among other things, the application base should be expanded beyond hospitals.
Also, MSS effects on novices, as well as experts, should be evaluated. To date,
however, there have been no other follow-up studies reported in the literature.
This article presents an additional empirical investigation designed to assess
the effectiveness of management support systems (MSS) on strategic decision
making. It reports the research plan, details of the experiment, and experimental
findings. Then, the paper discusses these findings and examines the implications
for information systems research and management practice.
II. BUSINESS POLICY EXPERIMENTTo realize strategic business objectives, executives will need complete,
integrated, and systematic analyses and sharing in real time of marketing, finance,
and marketing information and knowledge (West and Courtney 1993). There are
information technologies to support selected strategic decision making tasks,
including individual (stand-alone) decision support systems (Parsaye and Chigell
1993) and separate expert systems (Spangler 1991; Tyran and George 1993).
Since the separate systems focus on individual department tasks, however, they
cannot deliver the organization-oriented information or knowledge needed to
optimize business performance.
By providing organization modeling, data access and reporting, and
knowledge delivery, a management support system, in theory, can help executives

Journal of the Association for Information Systems 5
make decisions that better achieve the strategic policy objectives of a business.
Improvements should be observed in both the outcomes from, and the process of,
strategic business decision making. An experiment was developed to test this
theory.
SUBJECTSAs in many previous DSS, EIS, and ES studies, the business policy experi-
ment utilized students as subjects. The original design called for a single sampleinvolving a representative mix of undergraduate and graduate students. Forbudgetary and logistical reasons, the participants were students in a cross-listedDecision Support and Expert System course taught by one of the authors. Thiscourse was both an upper-division requirement for undergraduates and a coreobligation for graduate students in a major public university’s information systemsprograms. Students taking the course as undergraduates were not allowed torepeat the course as graduate students. Because of teaching assignments, therewas about a two-year period that elapsed between the time that the author offeredthe undergraduate and graduate versions of the course.
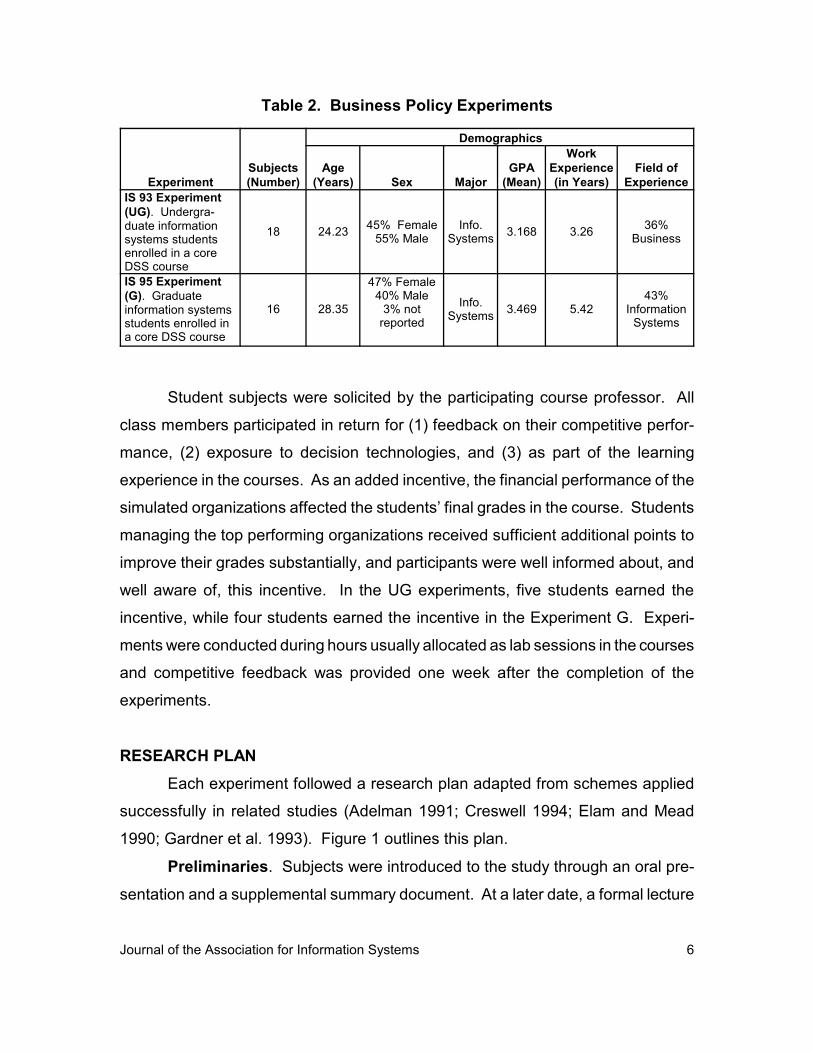
Budgetary, logistical, and timing considerations, then, necessitated anexperiment that consisted of two independent samples. Table 2 briefly describesthese samples and summarizes the modal characteristics of their volunteersubjects.
While the program restrictions should have excluded Experiment UGenrollees from the Experiment G course, it is possible that some students may havecircumvented the rules. To check for such a possibility, the two class rosters werecompared. This roster check revealed that none of the Experiment UG studentsparticipated in the experiments again as students in Experiment G. On a relatedissue, the university’s undergraduates are generally full-time, day students, whilethe graduate students have tended to be part-time, evening students. This disparityin student populations plus the approximately two-year time spread betweenexperiments made it unlikely that the subjects from the first experiment sharedinformation with the subjects of the later experiment.
Journal of the Association for Information Systems 6
Table 2. Business Policy Experiments
ExperimentSubjects(Number)
Demographics
Age(Years) Sex Major
GPA(Mean)
WorkExperience(in Years)
Field ofExperience
IS 93 Experiment(UG). Undergra-duate informationsystems studentsenrolled in a coreDSS course
18 24.23 45% Female55% Male
Info.Systems 3.168 3.26 36%
Business
IS 95 Experiment (G). Graduateinformation systemsstudents enrolled ina core DSS course
16 28.35
47% Female40% Male
3% notreported
Info.Systems 3.469 5.42
43%Information
Systems
Student subjects were solicited by the participating course professor. All
class members participated in return for (1) feedback on their competitive perfor-
mance, (2) exposure to decision technologies, and (3) as part of the learning
experience in the courses. As an added incentive, the financial performance of the
simulated organizations affected the students’ final grades in the course. Students
managing the top performing organizations received sufficient additional points to
improve their grades substantially, and participants were well informed about, and
well aware of, this incentive. In the UG experiments, five students earned the
incentive, while four students earned the incentive in the Experiment G. Experi-
ments were conducted during hours usually allocated as lab sessions in the courses
and competitive feedback was provided one week after the completion of the
experiments.
RESEARCH PLANEach experiment followed a research plan adapted from schemes applied
successfully in related studies (Adelman 1991; Creswell 1994; Elam and Mead
1990; Gardner et al. 1993). Figure 1 outlines this plan.
Preliminaries. Subjects were introduced to the study through an oral pre-
sentation and a supplemental summary document. At a later date, a formal lecture

Journal of the Association for Information Systems 7
Introduce Study Decision makingLecture
Conduct Experiments
MSS DSS
DSS
EIS
ES
Document Results
Analyze Data
Introduce Study Decision makingLecture
Conduct Experiments
MSS DSS
DSS
EIS
ES
Document Results
Analyze Data
Introduce Study Decision makingLecture
Conduct Experiments
MSS DSS
DSS
EIS
ES
Document Results
Analyze Data
Figure 1. Research Plan
was given about the business policy simulation, the variable to outcome relation-
ships, the decision making process, and the role of information systems in the
process. The lecture was augmented with written instructions. Next, a question-
naire was used to collect data on the subjects' demographic characteristics and
experience levels and subjects were given practice in using the simulation software
to solve several hypothetical, but realistic, strategic decision making problems. The
practice sessions continued throughout most of the semester, with the professor
available to answer questions about the problems, decision environment, software
usage, and other concerns of the participants. Subjects were told, and were well
aware, that the practice results would be strictly for learning purposes and would not
affect their grades. During the training sessions, it was apparent from the questions
and software usage that none of the Experiment UG or Experiment G subjects were
Journal of the Association for Information Systems 8
initially familiar with the problems, the software, the decision environment, or the
decision process.
By the end of the training sessions, the reduction in question quantity and
complexity and software usage improvements indicated that significant learning had
occurred. All subjects in both experiments had become accustomed to, and
comfortable with, the problems, the software, the decision environment, and the
decision process.
At this point (toward the end of the semester), students were informed, and
were well aware, that the last two lab sessions in the courses would constitute the
recorded experiments, with results counting toward their grades. All subjects were
given a new problem, similar to but different from the problems they had been
working on previously. Both the control and experimental groups were given that
same new problem. Initially, the information system was a basic DSS (and the
subjects were designated as the control group), and later a MSS was available to
facilitate decision-making (and the same subjects were denoted as the control
group).
As in previous related studies, this investigation utilized a within-subjects
research design. Such a design has been shown to offer superior control for sub-
ject heterogeneity, or individual subject differences (Keppel 1982; Maxwell and
Delaney 1990, p. 487). A within-subjects design also will yield more data points for
analysis than a between-subjects design. For example, by dividing an initial sample
into two groups, there would be half as many observations in each group than in the
initial sample. This data-point efficiency is particularly important in relatively small-
sample investigations such as this study.
The within-subjects design does create a need for stringent learning effect
controls (Cook and Campbell 1979). Otherwise, it would be difficult to isolate
treatment from time, problem experience, and other learning effects. This
investigation provided a variety of the necessary controls. First, the training
sessions and the course materials ensured that all subjects were completely familiar
with strategic decision making, representative problems, appropriate decision tools,

Journal of the Association for Information Systems 9
the software (which actually formed the basic DSS), the decision environment, and
the decision process. Second, there was a one-week time spread between the use
of the basic DSS and the MSS. This time lapse between treatments served to
dissipate any learning by subjects about the experimental problem. Third, the
decision situation, the data capture methodology, and the nature of the information
systems rendered the first to second period knowledge transfers unlikely and
ineffective.
Decision Situation. As in previous DSS and EIS studies, subjects were
challenged with a complex, semi-structured management problem. The problem
involves a market in which an organization competes for a product’s four-quarter
total market potential on the basis of price and marketing (McLeod 1986). Demand
for the organization’s product will be influenced by (1) its actions, (2) a major
competitor’s behavior, and (3) the economic environment. In both the experimental
and control groups, every subject was instructed to utilize available information with
her/his experience, judgment, and knowledge in developing a business policy that
would generate as much total profit as possible over the four-quarter planning
period. Policy making required the subject to
(1) set the levels of four decision variables, including the product price,
marketing budget, research and development expenditures, and plant
expansion investment; and
(2) forecast the levels of four key uncontrollable variables, consisting of
the competitor’s price and marketing budget, a seasonal product-
sales index, and an index of general economic conditions.
These eight variables jointly influenced the profitability of the simulated
business organization. Twelve additional variables, including plant capacity, raw
materials inventory, and finished goods inventory, were fixed from trial to trial or
implied from the policy making variables (could not be altered by the subject) and
thereby became the scenario for decision making.
As is the case in a competitive business environment, this problem is
dynamic in nature, i.e., a decision made in one quarter affects decisions and out-

Journal of the Association for Information Systems 10
comes in the current and subsequent quarters. In this dynamic environment, it also
is difficult to recover from initially poor decision strategies within the simulated time
frame. Further, simplistic strategies, such as reacting to the competitor’s current
actions or linearly extrapolating current patterns without considering other condi-
tions, are penalized in the simulation. This problem situation has been used to
educate a variety of undergraduate, graduate, and executive and continuing educa-
tion students in representative strategic decision making at various universities and
institutions.
An information system was provided to support the decision making. By
using this system, a subject could input decisions and uncontrollable variable
forecasts and get an instant report on the resulting profit (or loss) and other key
situation outcomes. Written instructions were given on the use of the information
system and assistants were available to help subjects operate the computer hard-
ware and software. Subjects competed against each other and they were aware of
the competition. Participants were allowed to run as many trials as desired in a
single 90-minute session, but only the end-of-simulation (last 10 trial) results were
recorded for, and counted in, the competition and statistical testing. Subjects were
conscious of these rules.
Data Capture. At the start of the experiment, every subject in each group
was given a four part questionnaire that requested: (1) demographic data, (2)
computer, information system, and work experience levels, (3) a record of the time
expended, number of problems and opportunities identified, and the number of
alternatives considered during the simulations, and (4) the subject’s ratings, on a
10-point Likert scale with least helpful to most helpful anchors, of the information
system's usefulness in supporting the user's ability to perform the steps of decision
making. Parts (1) and (2) were completed by the students before they ran trials;
part (3) was completed at the end of each trial; and part (4) was completed after all
trials were completed. An item analysis on the questionnaire’s decision-making
step components verified (with a Cronbach's α = .85) that the instrument reliably
measured the subjects' self-ratings.

Journal of the Association for Information Systems 11
At the end of each trial (run of the simulation), the subject immediately
directed the results to the printer. While still at the computer terminal, and without
delay, the subject also recorded, on the questionnaire, the time expended, the num-
ber of problems and opportunities identified, and the number of alternatives consi-
dered during the trial. Subjects had full access to the information system, their final
inputs (including decisions), and the results as they completed the questionnaire.
The computer printout recorded the respondent’s name, the final input
values, final results (including profit), and the time of day when the results were
directed to the printer. A comparison of computer-recorded with subject-reported
times indicated that the participants were very accurate in their self-reporting. The
software logged the final decision set, but it did not log all the problems/oppor-
tunities identified or all alternatives considered. Thus, there was no way to verify
the correctness of the self-reported values for these measures. Nonetheless, the
self-reported numbers of problems/opportunities and alternatives were likely to be
accurate for the following reasons:
(1) the subjects probably remembered the correct values, because each
trial typically consumed only two or three minutes;
(2) since subjects knew they were being judged only on the financial
performance of the simulated organization, there was no incentive for
misreporting other measures; and
(3) problem/opportunity and alternative quantities were self-recorded at
the same time as the expended time, and participants were accurate
in self-reporting the expended time.
Immediately after the 90-minute session, end-of-simulation results for all
trials were printed in hard copy form and submitted to the instructor. Subjects were
not allowed to keep notes of their effort or to keep the hard copy printouts. These
prohibitions effectively precluded subjects from studying the problem and their
actions between the first and second periods of experimentation. The complicated
nature of the problem also made it unlikely that student recollections from the first

Journal of the Association for Information Systems 12
period would be of much specific value to the participants during the second period
of experimentation.
Statistical Summaries. Collected outcome data were metric, but demo-
graphic data were categorical (nonmetric), and experience levels were ordinal
(nonmetric), in nature. The gathered process data (subjects' Likert-scaled self-
ratings) data were arguably interval-scaled and thereby metric in character (Creswell
1994; Emory and Cooper 1991). Nonmetric data were summarized with frequency
distributions and cross-tabulations. Chi-square, Fisher's test, and Spearman
correlation analyses of the cross-tabulated data were used to test the hypotheses
that the two (IS 93 or UG and IS 95 or G) samples had the same background (age,
experience, gender, and GPA) composition. The metric data were summarized with
measures of central tendency and dispersions; multivariate analyses were used to
test the hypotheses that the outcome and process measures were each
independent of the study group. The SPSS for Windows computer package was
used to perform the descriptive and inferential statistical analyses (Norusis 1992).
INFORMATION SYSTEMSEach subject in the control group was given a decision support system
(DSS), delivered through the Academic Information System's (AIS) software pack-
age to support the simulated strategic decision making. AIS's software package is
useful in illustrating how the computer can be used in problem solving (McLeod
1986). Although the software is tailored specifically for strategic management, AIS
is similar in architecture and usage to the decision support systems utilized in
previous DSS studies. This strategic-management-specific DSS has (1) a database
that captures and stores internal organizational and external competitive and
environmental data and (2) a model base of mathematical expressions that
describes the relationships between the decision and uncontrollable variables and
profit. The mathematical expressions are hidden from the DSS user.
By making selections from display screen menus, subjects could input the
decision variables, forecast the uncontrollable variables, obtain profit status reports,

Journal of the Association for Information Systems 13
and perform sensitivity analyses. Such analyses and evaluations assist users in
arriving at a recommended policy (set of decision variables) for the simulated
business organization. However, the system does not guide the user toward
accurate uncontrollable variable forecasts or recommended policies, nor does the
DSS provide any explanation or justification for the results.
Subjects in the experimental group were provided with a management
support system (MSS). In this MSS, the AIS-based DSS was enhanced with
Windows-based executive information (EIS) and expert (ES) systems. Since AIS
is a DOS program, the MSS could not take advantage of Windows's dynamic data
exchange (DDE) feature to “hotlink” the components. Instead, subjects utilized
Windows's task-switching and Clipboard capabilities to move among the
components.
Still, the MSS had the same look and feel to the user as the DSS. That is,
inputs were entered, and reports were generated and formatted, identically in both
the DSS and MSS. While the MSS had pushbutton links to the EIS and ES
components, the component processing was transparent to the user. To the MSS
user, the pushbuttons merely elicited guidance in setting some inputs for the
problem analysis and evaluation. Both systems utilized the same mathematical
expressions to perform the analysis and evaluation, and both systems supported
decision making in a consistent manner. If MSS users followed the same decision
process and supplied identical inputs as DSS users, both groups would obtain the
same results from each system.
EIS Component. The executive information system component was
delivered through the popular EIS product Forest & Trees. Like the executive
information systems in previous EIS studies, this Forest & Trees-delivered EIS
allowed subjects to access and report data pertinent to the management problem's
decisions. In the simulated business organization situation, these data included
(1) statistical-modeling-based forecasts for the seasonal and economic indexes and
(2) estimates of the competitor’s price and marketing budget over the upcoming
four-quarter planning period. By selecting a topical folder, the subject could quickly

Journal of the Association for Information Systems 14
search for the desired summary information. Each folder had further linked views
that enabled the user to drill-down to supporting detail in tabular or graphic form.
An explanation about the relevance of the selected variable and about the source
of the provided data was available through a Clipboard icon in the EIS.
ES Component. The expert system component was delivered through the
popular ES development shell Level 5 Object. Like the expert systems in previous
ES studies, this Level 5 Object-delivered ES acted as an electronic counselor to the
user. A hybrid object-production rule knowledge base captured and stored strategic
decision making expertise elicited from the professor instructions and underlying
computer code for the AIS-based policy game. Upon entrance, the ES prompted
the subject for information about her/his specified scenario. Completed responses
triggered the ES's chaining-based inference engine to display professional advice
on some (but not all) of the decision variables. The advice consisted of the recom-
mended (1) prices and (2) marketing budgets for the forthcoming four-quarter
planning period. By selecting the ES's Expand menu item, the user could get an
explanation for the prompts and ensuing recommendations.
Decision Making Support. The MSS supports all phases of the decision
making process in the simulated business organization situation. The embedded
EIS helps users discern pricing and marketing problems or opportunities and gather
pertinent environmental information (intelligence). Users can utilize the information
with the base DSS (with the aid of the embedded ES and EIS) to generate price and
marketing alternatives and to establish the environmental variable levels for the
simulation model (design). These operationalized models can be used with the
base DSS and the embedded ES to help decision makers evaluate the alternatives
and select the best alternative (choice). The EIS and ES can provide explanations
to help users gain confidence in, and execute, the decision (implementation). After
the decision is implemented on a trial basis, the user will want to observe the new
reality and follow through with intelligence, design, choice, and implementation. The
interactive feedback loops of the MSS make it relatively easy for the user to perform
the consequent sensitivity analyses and other post-trial evaluations.

Journal of the Association for Information Systems 15
The MSS was designed to offer the support in an integrated and complete,
rather than separate and fragmented, manner. No one component offered know-
ledge sufficient for the entire decision-making process. Users could obtain fore-
casts for some, but not all, uncontrollable inputs from the EIS, and some, but not
all, controllable inputs from the ES. The rest of the controllable and uncontrollable
inputs had to be supplied by the user, presumably from her or his insight, judgment,
and experience. All inputs were needed to generate a simulated financial outcome,
and such an outcome could be obtained only through the basic DSS.
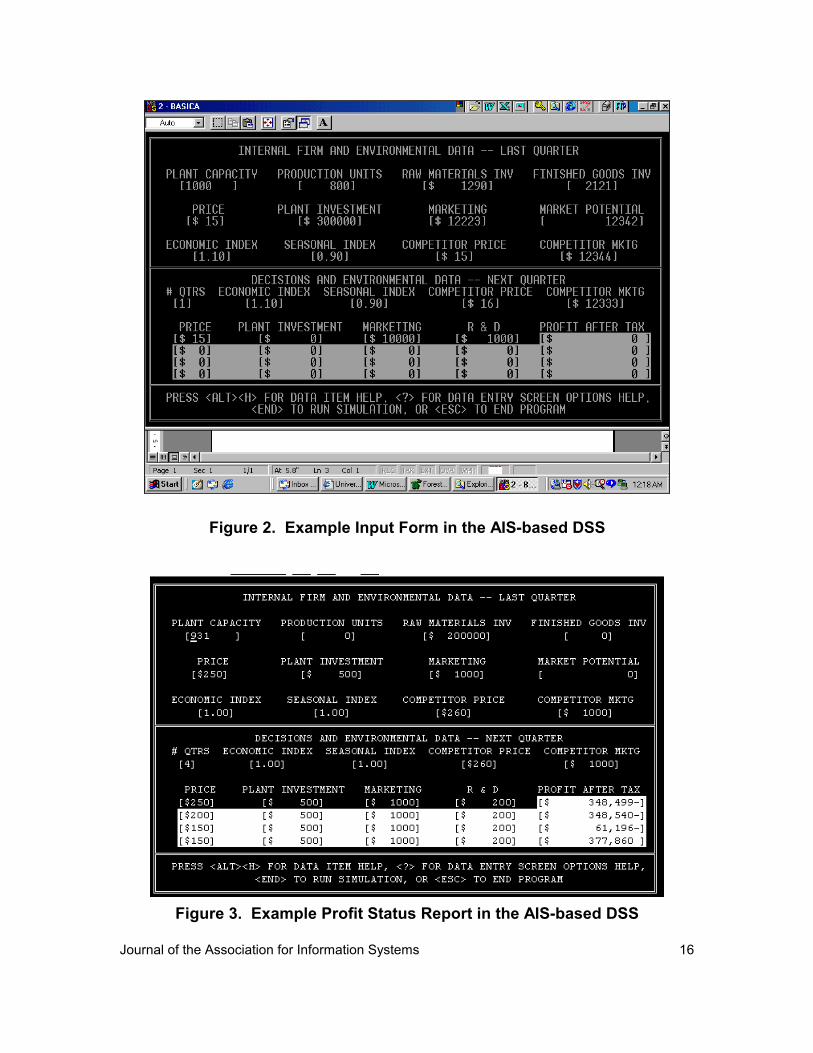
SYSTEM SESSIONSThe DSS user accesses the system by clicking the Pricing Model selection
on the desktop’s displayed pull-down menu. This selection places the user in the
DSS input (data entry form) window shown by example in Figure 2. By entering the
controllable and uncontrollable inputs on the entry form and selecting the END
command, the DSS user will generate the corresponding simulated profit, as shown
by example in Figure 3. DSS users also can drill down to the details behind the
summary report.
The MSS user accesses the system in the same manner as the DSS user,
by clicking the Pricing Model selection on the desktop’s displayed pull-down menu.
Once again, inputs are entered on Figure 2’s data entry form and simulated results
are shown on Figure 3’s report screen. Unlike the DSS users, however, MSS users
had access to an EIS and ES. Access to the EIS or ES was achieved by task
switching to the desktop’s displayed pull-down menu and selecting the Pricing
Model EIS or ES button.
By selecting the EIS button, the MSS user would access a window, shown
by example in Figure 4, that displayed forecasts for key uncontrollable inputs in the
simulated decision making. If desired, the MSS user also could obtain view notes
for any of the forecasted inputs by selecting the thumbnail icon in the index’s
window. Figure 5 gives an example view note.
Journal of the Association for Information Systems 16
Figure 2. Example Input Form in the AIS-based DSS
Figure 3. Example Profit Status Report in the AIS-based DSS

Journal of the Association for Information Systems 17
Figure 4. Example EIS Display
Figure 5. Example EIS View Notes

Journal of the Association for Information Systems 18
Figure 6. ES Welcome Screen
Figure 7. Decision Variable Screen

Journal of the Association for Information Systems 19
Figure 8. ES Application Screen
Selecting the ES button would put the MSS user in the ES welcome window
shown in Figure 6. As this figure demonstrates, the MSS user would have to
affirmatively seek decision advice. By doing so, he or she would access a screen
that focuses the advice on the desired decision variable, as shown in Figure 7. A
selection from the decision variable screen (Figure 7) would put the MSS user in a
window, shown by example in Figure 8, that focused the advice on the desired
application. If desired, the user could also obtain an explanation about the selected
decision variable. By selecting an application, the user would be placed in a screen,
shown by example in Figure 9, that recommended a strategy for the selected
decision variable and application. If desired, users could get an explanation for the
recommendation.
MSS users could access the EIS and ES anytime during the simulation.
Since the simulation was dynamic in nature, however, it was preferable to seek
assistance before entering uncontrollable inputs and decision variables on the data
entry screen (Figure 2).

Journal of the Association for Information Systems 20
Figure 9. ES Recommendation Screen
DECISION VALUEThe outcome from, and the process of, decision making are interrelated.
Enhanced outcomes will be the result of improvements in the process of decision-
making (Dean and Sharfman 1996). Indeed, outcome enhancements cannot be
reliably credited to DSS or MSS usage without explaining how the system improved
the decision making process. Assessing DSS or MSS value, then, will be a multiple
criteria problem that should include valid process, as well as outcome, measures
(Forgionne and Kohli 1996).
Outcome improvements from using the DSS or MSS can include (1) gains
in organization performance, such as an increase in return or a decrease in cost
(DeLone and McLean 1992; Sethi and King 1991), and (2) the maturation of the
user as a decision maker, as would occur when there is progress in the person's (or
group’s) understanding of the current problem and solution or a gain in the person's

Journal of the Association for Information Systems 21
(or group’s) general problem-solving skills (Forgionne and Kohli 1996; Li 1997).
Process improvements involve enhancements in the users' ability to perform the
phases and steps of decision making (Udo 1992). As in previous DSS, EIS, and ES
studies, decision value was assessed by the system's separate effects on the
outcomes from, and the process of, decision making.
Outcomes. Business organization performance was assessed with total
profit (O_PROFIT). A mature strategic decision maker will expend considerable
effort on, and be capable of, defining the management problem, exploring the inter-
pretation's relationship to alternative views, and generating alternative clinical and
administrative solution concepts. Effort was assessed by the time (in minutes)
spent on the simulated decision making (O_TIME). In the original plan, capability
was to be measured by the numbers of opportunities and problems (O_PROB)
identified during the simulation and the number of alternatives considered during the
simulation (O_ALT). Unfortunately, such variables were not recorded consistently
in the IS 93 (UG) experiments. To avoid potential data comparability problems, the
plan was modified to exclude the capability measures.
Process. The decision making process was described to subjects as a step-
augmented adaptation of the intelligence-design-choice-implementation paradigm.
Self-ratings assessed the usefulness of the system in supporting the subject's ability
to perform the identifying objectives (P_OBJ), recognizing problem or opportunity
(P_PRB), gathering qualitative data (P_QUAL), gathering quantitative data
(P_QUANT), generating alternatives (P_GENALT), establishing criteria
(P_CRTRIA), evaluating alternatives (P_EVLALT), choosing the most preferable
alternative (P_CHSALT), decision confidence (P_MKDEC), system effectiveness
(P_EFECTV), and implementing the final choice (P_IMPLCH) steps of this
adaptation.
III. EXPERIMENTAL RESULTSExperimental results were used to assess the management support system's
impact on the outcomes from, and process of, simulated strategic decision making.

Journal of the Association for Information Systems 22
As in related studies, separate hypotheses were examined for outcome and process
effects.
RESEARCH QUESTIONS AND HYPOTHESESThe fundamental research question and corresponding hypotheses for
outcome effects can be stated as follows:
Question: Can the MSS improve decision making outcomesrelative to the DSS?
Null: The MSS and DSS outcomes are the same.
Alternative: The MSS results in different outcomes than theDSS.
The fundamental research question and corresponding hypotheses for process
effects can be stated as follows:
Question: Can the MSS improve the decision makingprocess relative to the DSS?
Null: Process ratings are the same from MSS and DSSusers.
Alternative: Process ratings are different for MSS than DSSusers.
OUTCOME AND PROCESS FUNCTIONSNeither information system generated a computer log that could be checked
for feature usage during simulation trials. However, an examination of the end-of-
simulation computer printouts showed that
(1) all subjects in the control group utilized the DSS,
(2) all subjects in the experimental group used the DSS, EIS, and ES
components of the MSS, and
Journal of the Association for Information Systems 23
(3) all subjects in the experimental group asked for, and virtually all
accepted, the EIS and ES recommendations.
Hence, it was unnecessary to distinguish experimental group subjects by their
feature usage.
Since the groups differed only by the information systems provided to the
subjects, the control group served as a proxy for the DSS and the experimental
group was a surrogate for the MSS. Outcome and process effects then were
functions of the group (GROUP) and any other moderating factors, or
Outcomes = f(GROUP, Moderating Factors)and
Process Ratings = f(GROUP, Moderating Factors)and the hypotheses could be tested through the statistically estimated parameters
of the pertinent functions.
MODERATING FACTORSIn this study, demographics and experience levels were the only surveyed
factors that can moderate the influence of the information systems on outcomes
and process ratings. Within each experiment, all subjects used both the DSS and
MSS. Consequently, within-sample control and experimental groups had equivalent
demographic characteristics and experience levels. While the small sample sizes
precluded definitive statistical testing, it seemed reasonable to assume that the
subjects’ backgrounds would have no moderating effects on outcomes or process
ratings within each experiment.
The remaining factor was the type of the student (undergraduate or
graduate). Each experiment had a different student composition and the partici-
pants’ backgrounds were significantly different between the experiments (IS 93 or
UG versus IS 95 or G). Student type and background, as proxied by the sample
number (EXP_NUM), then, could have a moderating effect on the dependent
variables, or
Outcomes = f(GROUP, EXP_NUM, EXP_NUM by GROUP)

Journal of the Association for Information Systems 24
and
Process Ratings = f(GROUP, EXP_NUM, EXP_NUM by GROUP)Namely, outcomes and process ratings were functions of group (and thereby the
information system provided to the subjects), the type of student, and any
interaction between the student type and the provided information system.
HYPOTHESIS TESTINGSince outcomes and process ratings were metric, MANOVA seemed to be
an appropriate procedure to statistically test the hypotheses. Several diagnostics
were conducted to ensure that this procedure was appropriate for the experiment.
Diagnostics. Bartlett-Box F and Cochran C univariate tests indicated that
the homogeneity-of-variance assumption was valid with respect to (1) most (but not
all) of the outcome variables and (2) most (but not all) of the process step variables.
The Bartlett test for sphericity demonstrated that there were significant correlations
(1) among the outcome variables and (2) among the process step variables. Box
M multivariate tests suggested that the homogeneity-of-variance assumption was
valid with respect to the outcome and process step variables.
According to the diagnostics, there were some variations from the equal
variance assumption. Yet, MANOVA is reasonably robust with respect to minor
assumption variations, and the procedure is more powerful (and generates more
information) statistically than its nonparametric counterparts (Kanji 1993; Tatsuoka
1988). For these reasons, the hypotheses were tested with MANOVA.
As a precaution, the outcome and process variables were recoded into
nonmetric categories and these recoded variables were cross-tabulated against
GROUP and EXP_NUM for hypothesis testing purposes. Loglinear analyses and
Chi-square goodness-of-fit tests of the cross-tabulated data yielded results that
were essentially the same as the MANOVA findings.
MANOVA Tests. Pillais, Wilks, Roy, and Hotelling T2 statistics were used to
test for the multivariate equality of mean outcomes. The same statistics were used
to perform analogous multivariate process step tests. In every case, the Pillais,

Journal of the Association for Information Systems 25
Wilks, Roy, and Hotelling tests yielded identical results. Bonferroni simultaneous
confidence intervals and Roy-Bargman stepdown F statistics were used to isolate
separate dependent variable differences. Each of these analyses generated the
same results.
Sample Size and Other Potential Problems. Both the undergraduate and
graduate experiments involved small sample sizes (18 in the undergraduate and 16
in the graduate groups). These samples are consistent with the sizes used in
previous, related experiments (Adelman 1991; Creswell 1994; Elam and Mead
1990; Gardner et al. 1993). Moreover, each subject performed repeated measures
of the experiment, so that there were more than 100 observations for many
measures of performance. Nevertheless, other measures had observations equal
only to the number of subjects in the experiments. Such small sample sizes
potentially could affect the statistical analyses involving these other measures and
thereby must be acknowledged as a limitation of the study. While the ideal solution
would be to increase the sample size, budgetary, logistical, and timing (longitudinal)
considerations precluded the implementation of this solution.
Another potential problem involved a few MSS users. As in real-life, users
were free to disregard the system recommendations and suffer the consequences.
A couple of MSS users requested, but ignored, EIS and ES recommendations.
Such nonacceptance may be an unmeasured moderating factor that could have
affected the statistical analyses. Yet, nonaccepting MSS users obtained signifi-
cantly inferior outcomes than the other MSS users. Hence, the potential
unmeasured moderating would have a dampening effect on MSS results, thereby
leading to a type II error (accepting the null hypothesis when it was false). Since
the number of nonaccepting MSS users was very small, there is little chance for the
error. For these reasons, the potential, and unlikely, error was not viewed as a
serious threat to the integrity of the study.
Journal of the Association for Information Systems 26
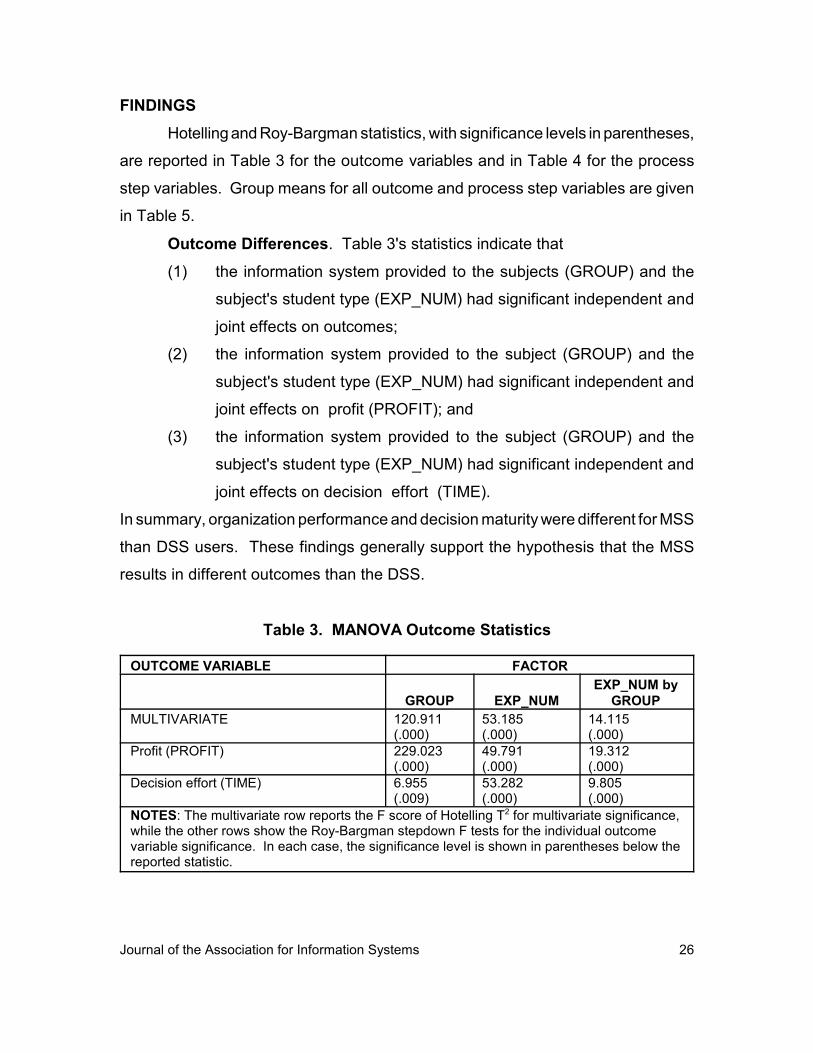
FINDINGSHotelling and Roy-Bargman statistics, with significance levels in parentheses,
are reported in Table 3 for the outcome variables and in Table 4 for the process
step variables. Group means for all outcome and process step variables are given
in Table 5.
Outcome Differences. Table 3's statistics indicate that
(1) the information system provided to the subjects (GROUP) and the
subject's student type (EXP_NUM) had significant independent and
joint effects on outcomes;
(2) the information system provided to the subject (GROUP) and the
subject's student type (EXP_NUM) had significant independent and
joint effects on profit (PROFIT); and
(3) the information system provided to the subject (GROUP) and the
subject's student type (EXP_NUM) had significant independent and
joint effects on decision effort (TIME).
In summary, organization performance and decision maturity were different for MSS
than DSS users. These findings generally support the hypothesis that the MSS
results in different outcomes than the DSS.
Table 3. MANOVA Outcome Statistics
OUTCOME VARIABLE FACTOR
GROUP EXP_NUMEXP_NUM by
GROUPMULTIVARIATE 120.911
(.000)53.185(.000)
14.115(.000)
Profit (PROFIT) 229.023(.000)
49.791(.000)
19.312(.000)
Decision effort (TIME) 6.955(.009)
53.282(.000)
9.805(.000)
NOTES: The multivariate row reports the F score of Hotelling T2 for multivariate significance,while the other rows show the Roy-Bargman stepdown F tests for the individual outcomevariable significance. In each case, the significance level is shown in parentheses below thereported statistic.
Journal of the Association for Information Systems 27
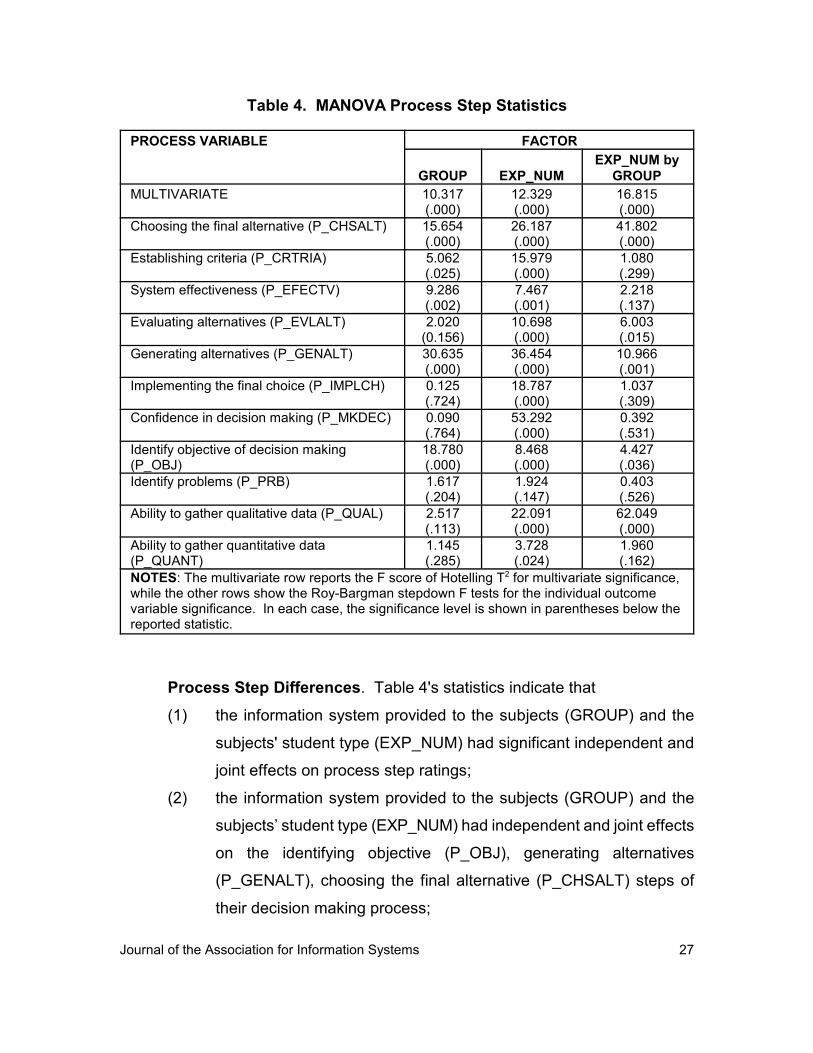
Table 4. MANOVA Process Step Statistics
PROCESS VARIABLE FACTOR
GROUP EXP_NUMEXP_NUM by
GROUPMULTIVARIATE 10.317
(.000)12.329(.000)
16.815(.000)
Choosing the final alternative (P_CHSALT) 15.654(.000)
26.187(.000)
41.802(.000)
Establishing criteria (P_CRTRIA) 5.062(.025)
15.979(.000)
1.080(.299)
System effectiveness (P_EFECTV) 9.286(.002)
7.467(.001)
2.218(.137)
Evaluating alternatives (P_EVLALT) 2.020(0.156)
10.698(.000)
6.003(.015)
Generating alternatives (P_GENALT) 30.635(.000)
36.454(.000)
10.966(.001)
Implementing the final choice (P_IMPLCH) 0.125(.724)
18.787(.000)
1.037(.309)
Confidence in decision making (P_MKDEC) 0.090(.764)
53.292(.000)
0.392(.531)
Identify objective of decision making(P_OBJ)
18.780(.000)
8.468(.000)
4.427(.036)
Identify problems (P_PRB) 1.617(.204)
1.924(.147)
0.403(.526)
Ability to gather qualitative data (P_QUAL) 2.517(.113)
22.091(.000)
62.049(.000)
Ability to gather quantitative data(P_QUANT)
1.145(.285)
3.728(.024)
1.960(.162)
NOTES: The multivariate row reports the F score of Hotelling T2 for multivariate significance,while the other rows show the Roy-Bargman stepdown F tests for the individual outcomevariable significance. In each case, the significance level is shown in parentheses below thereported statistic.
Process Step Differences. Table 4's statistics indicate that
(1) the information system provided to the subjects (GROUP) and the
subjects' student type (EXP_NUM) had significant independent and
joint effects on process step ratings;
(2) the information system provided to the subjects (GROUP) and the
subjects’ student type (EXP_NUM) had independent and joint effects
on the identifying objective (P_OBJ), generating alternatives
(P_GENALT), choosing the final alternative (P_CHSALT) steps of
their decision making process;

Journal of the Association for Information Systems 28
(3) the information system provided to the subjects (GROUP) and the
subjects’ student type (EXP_NUM) had significant independent
effects on the establishing criteria (P_CRTRIA) and system
effectiveness (P_EFECTV) steps of their decision making process;
and
(4) the interaction between the provided information system and student
type (GROUP by EXP_NUM) had a significant effect on the evaluating
alternatives (P_ EVLALT) and gathering qualitative data (P_QUAL)
steps of the subjects’ decision making process.
In summary, subject self-ratings on seven (out of 11) decision-making steps
were different for MSS than DSS users. These findings generally support the
hypothesis that process step ratings are different for MSS than DSS users.
Decision Value. Table 5's statistics indicate that
(1) MSS users had a larger mean profit (PROFIT) than DSS users in both
experiments;
(2) MSS users had a larger mean effort (TIME) during simulated decision
making than DSS users only in the case of graduate (IS 95 or G)
students;
(3) MSS users had larger mean self-ratings than DSS users for the
establishing criteria (P_CRTRIA) and generating alternatives
(P_GENALT) decision-making steps in both experiments;
(4) MSS users had larger mean self-ratings than DSS users for the
evaluating alternatives (P_EVLALT) decision-making step only in the
case of graduate (IS 95 or G) students; and
(5) MSS users had larger mean self-ratings than DSS users for the
choosing the final alternative (P_CHSALT) and gathering qualitative
data (P_QUAL) decision-making steps only in the case of under-
graduate (IS 93 or UG) students.
In summary, the results show that the MSS clearly improved organization
performance (PROFIT) and at least two decision making steps (P_CRTRIA and

Journal of the Association for Information Systems 29
P_GENALT). These results plus the MANOVA conclusions support the general
finding that the MSS results in better decision value (superior outcomes from, and
an improved process of, simulated strategic decision making) than the DSS. The
implications of all results are examined in the following discussion.
Table 5. Group Means for Outcome and Process Variables
EXPERIMENT Experiment G Experiment UGOutcomes DSS MSS DSS MSSProfit (O_PROFIT in $) - 57,469.64 6,452,701.39 -3,806,022.57 2,638,990.42Decision Effort (O_TIME in minutes) 2.20 2.81 1.54 1.13Process StepsChoosing the final alternative(P_CHSALT)
8.50 6.76 7.58 8.00
Establishing criteria (P_CRTRIA) 6.35 6.92 7.32 7.66System effectiveness (P_EFECTV) 8.14 7.38 8.09 7.83Evaluating alternatives (P_EVLALT) 6.64 7.23 7.68 7.50Generating alternatives(P_GENALT)
6.85 8.30 7.44 8.16
Implementing the final choice(P_IMPLCH)
6.64 6.76 7.42 7.16
Confidence in decision making(P_MKDEC)
6.92 7.07 7.88 7.83
Identify objective of decision making(P_OBJ)
8.35 7.38 7.50 7.50
Identify problems (P_PRB) 6.64 6.53 7.10 7.10Ability to gather qualitative data(P_QUAL)
7.57 5.76 6.50 8.16
Ability to gather quantitative data(P_QUANT)
7.92 7.53 8.10 8.16
DISCUSSIONIn assessing the additional costs that an organization might incur from
development and usage time in implementing a MSS vis-à-vis a DSS, it may be
helpful to conduct a cost-benefit analysis. Following is a brief cost-benefit analysis
we conducted for our experiments. A summary of the cost benefit analysis is also
presented in Table 6.
Costs. Both simulation software tools were delivered through a Windows
interface, thereby becoming the DSS, and the MSS. The MSS and DSS were

Journal of the Association for Information Systems 30
developed by three graduate students, none of whom were subjects in Experiment
UG or Experiment G. It took these students a total of about three person hours to
develop the DSS and a total of approximately 40 person hours to develop the MSS.
Assigning a $50 per hour expense for the development time, the MSS then cost
(40 – 3) x $50 = $1,850
more to develop than the DSS. All development software was donated by the
vendors for the study. If purchased, this software would have cost a total of $995,
and $935 of the expense would have been for MSS-specific development software.
Thus, the fixed cost was
$1,850 + $935 = $2,785
higher in total for MSS, than for DSS, development.
The same hardware and system software was utilized to run the MSS and
DSS, and the computer processing time was virtually identical for both systems.
Hence, both systems consumed virtually identical computing resources. Another
variable cost that may occur is the maintenance expense. Since MSS and DSS
models and data were internalized, both systems were self-maintaining systems.
As the Decision Effort (Time) data in Table 5 indicates, a MSS user spent
approximately
(2.81 – 2.20) x 10 = 6.1 minutes
more than a DSS user during the 10 runs of the simulation in the Experiment G but
(1.13 – 1.54) x 10 = -4.1 minutes
or 4.1 minutes less than a DSS user in Experiment UG. Assigning a $120 per hour,
or $2 per minute, expense for the users’ time, the MSS then had a variable cost that
was
[($2 x 6.1) x 16 subjects]– [($2 x 4.1) x 18 subjects] = $47.60
more than the DSS for the simulated decision making.
The computations, then, show that the MSS cost a total of about
fixed cost + variable cost = $2832.60
more than the DSS.
Journal of the Association for Information Systems 31
Benefits. According to the data in Table 5, when compared to the DSS user,
this investment enabled the MSS user to increase simulated profit by approximately
($6,452,701 – (-$57,469)) x 10 runs x 16 subjects = $1,041,627,200
in Experiment G and
($2,638,990 – (-$3,806,022) x 10 runs x 18 subjects = $1,160,102,160
in Experiment UG. Consequently, the MSS increased users’ simulated profit by a
net of more than $2 billion.
Breakeven Analysis. In addition to the cost-benefit analysis, the decision
to invest in a MSS can be viewed also in the context of the time it would take to
recover the costs of developing and implementing the MSS. This factor could be
a consideration for small and medium-size business where the IT expenditures have
to be weighed against other competing needs. A breakeven analysis can help
identify the duration in which the system would pay for itself.
An MSS could cost more than our experimental system. The extent of costs
incurred and benefits resulting from the implementation of MSS within an
organization are dependent, among other factors, upon the complexity of decisions,
the number of decision-makers, the technology used and expected payoff from the
decisions, and training and acquisition costs. These factors, however, were
recognized and incorporated in the cost-benefit analysis presented in Table 6. The
expenses and profits in Table 6 demonstrate that MSS users earned approximately
$6.5 million more than DSS users in the 90 simulated minutes of decision making.
Consequently, MSS users would recover the additional $2,832.60 development cost
in about
$2,832.60/($6.5 million/90) = 0.03922 minutes
or about 2.35 seconds of simulated decision making.
Improvement Mechanisms. These significant simulated net monetary gains
were achieved in different ways for various MSS users. One difference involves the
nonuniform effects of the MSS on the level of users' decision making maturity.
Graduate (IS 95 or G) students used the MSS to increase the effort (TIME) expended
on simulated decision making, while undergraduate (IS 93 or UG) MSS users had a

Journal of the Association for Information Systems 32
Table 6. A Summary of the Cost-benefit Analysis of MSS and DSS
DSS MSS MSS-DSSCOSTSFixed CostsDevelopment Cost @$50/hour (3 hours x $50) = $150 (40 hours x
$50) =$2,000
Software Costs $60 $995Difference in DevelopmentCosts
($2000 - $150) $1,850.00
Difference in Software Costs ($995 - $60) $935.00Variable CostsDecision Time - G (minutes) 2.2 2.81Decision Time – UG (minutes) 1.13 1.54Time Difference – G 2.81 - 2.2 = 0.61
(min)Time Difference – UG 1.54 - 1.13 = 0.41
(min)10 runs for 16 subjects – G (.61 X 10 x16) x
$2/min $195.2010 runs for 18 subjects – UG (.41 x 10 x 18) x
$2/min $147.60Difference in Time Costs (G –UG)
$195.20 - $147.60 $47.60
Total Costs $2,832.60
BENEFITSSimulated Profit – G per run $ (57,469) $6,452,701Simulated Profit – UG per run $ (3,806,022) $2,638,990Benefit Difference – G $ 6,510,170Benefit Difference – UG $ 6,445,012 10 runs 16 subjects – G $ 6,510,170 x10
x16$1,041,627,200
10 runs for 18 subjects – UG $ 6,445,012 x10x18
$1,160,102,160
Total Benefits $2,201,729,360
decreased decision time. One explanation is that maturity may have been expressed
differently between the groups and these expressions could have been confounded
within the TIME variable. For example, undergraduates may have been most con-
cerned with personal efficiency (reducing the time needed to perform individual decision
steps), while graduate students may have focused on personal productivity (increasing
the amount of pertinent information, knowledge, and wisdom gained during decision
making). Such a theory could have been tested had the IS 93 (UG) experiment

Journal of the Association for Information Systems 33
consistently captured the capability measures (the number of problems identified and
alternatives considered).
Another difference involves the process results. Graduate (IS 95 or G) students
had a different perception of the MSS decision making process support than did the
undergraduates. For example, the MSS was better than the DSS for undergraduates
in gathering qualitative data and choosing the final alternative, while the MSS was better
than the DSS for graduate students in evaluating alternatives. One explanation is that
different groups had varying decision perspectives and the MSS was better suited to
particular viewpoints. For example, the undergraduates may have an intelligence and
final choice focus and they may have found that the MSS was better suited than the
DSS to these decision making phases. On the other hand, the graduate students may
have an early choice phase orientation and they may have found that the MSS was
better suited to that decision making phase. A related explanation is that different
groups had varying (real or perceived) support needs, and the MSS was better suited
than the DSS to particular needs. For example, undergraduates may have needed
strong intelligence support and they found that the MSS was better suited to this need.
On the other hand, the graduate students may have needed strong early choice
support and they found that the MSS was better suited to this need.
Nevertheless, the MSS evidently supported the relevant steps of both the
undergraduate and graduate students’ decision making process. Even with the DSS,
neither student type was able to earn a profit in the simulated strategic decision making.
With the MSS, both student types were able to earn substantial profits. The empirical
testing helps to pinpoint the linkages between this performance and the MSS support.
For undergraduates, the profit improvement can be derived from the MSS support for
establishing criteria, gathering qualitative data, generating alternatives, and choosing
the final alternative. For graduate students, the profit improvement was educed from
the MSS support for establishing criteria, generating alternatives, and evaluating
alternatives. Such pinpointing can be used to enhance future system design and
development.

Journal of the Association for Information Systems 34
IV. CONCLUSIONSThe results of this study confirm the previous research and continue to indicate
that a management support system (MSS) can significantly improve both the outcomes
from, and process of, strategic decision making. This MSS is a workstation-based
combination of decision support, executive information, and expert system functions
that
(1) provides central repositories for decision data, models, and knowledge;
(2) incorporates a user-extensible knowledge-representation scheme that
links information, knowledge, and models;
(3) delivers models that support an organization-oriented view of strategic
decision making;
(4) assists staff in understanding business decision making tasks, events,
and processes; and
(5) serves as a learning tool for future business policy decision makers.
Results, provided in desired vivid detail, can be used to explain, justify, and communi-
cate the information and knowledge to colleagues in a real-time, very user-friendly
manner.
By delivering comprehensive decision making support effectively, a MSS can
serve as an important strategic weapon for business organizations. Adaptations of the
MSS can deliver the same benefits to executives and managers in diverse public and
private sector enterprises.
Although the MSS continues to show promise, the concept needs additional
research. Enhancements can be made to the MSS that will provide more pervasive
support than the empirical prototypes for all steps in the strategic decision making
process. The application base can be expanded further. A higher-level integration
strategy can be adopted to test the research questions. Experiments can be designed
that will comparatively evaluate the decision value of each management support system
(MSS) component. For example, it would be useful to isolate the impact of the DSS,
ES, and EIS components on decision-making outcomes and process. If properly
designed, such an experiment would also enable the researcher to compare the

Journal of the Association for Information Systems 35
decision value of executive support (ESS = DSS + EIS), intelligent DSS (DSS + ES),
MSS (DSS + EIS + ES), and other integration strategies. A composite indicator can be
developed that will measure joint, rather than separate, impacts of process and
outcome on decision making value. Large and broad-based samples with stringent
moderating factor designs can be used to confirm the original, and test the additional,
hypotheses.
V. REFERENCES
Adleman, L. “Experiments, Quasi-experiments, and Case Studies: A Review ofEmpirical Methods for Evaluating Decision Support Systems,” IEEE Trans-actions of Systems, Man and Cybernetics (21:2), 1991, pp. 293-301.
Clements, J. P. An Investigation of the Effectiveness of Information Systems on theCreative Aspects of Managerial Decision Making,. Unpublished DoctoralDissertation, University of Maryland, Baltimore, 1993.
Cook, T. D., and Campbell, D. T. Quasi-Experimentation: Design and Analysis Issuesfor Field Settings, Chicago: Rand McNally College Publishing Company, 1979.
Creswell, J. W. Research Design: Qualitative and Quantitative Approaches, ThousandOaks, CA: Sage, 1994.
Dean, J. W., and Sharfman, M. P. “Does Decision Process Matter? A Study ofDecision-making Effectiveness,” Academy of Management Journal (39:2), 1996,pp. 368-396.
DeLone, W. H., and McLean, E. R. “Information Systems Success: The Quest for theDependent Variable,” Information Systems Research (3:1), 1992, pp. 61-95.
Elam, J., and Mead, M. “Can Software Influence Productivity?” Information SystemsResearch (1:1), 1990, pp. 1-22.
El-Najdawi, M. K., and Stylianou, A. C. “Expert Support Systems: Integrating AITechnologies,” Communications of the ACM (36:12), 1993, pp. 55-65.
Emory, C. W., and Cooper, D. R. Business Research Methods, 4th Edition,Homewood, IL: Irwin, 1991.
Fazlollahi, B. “Adaptive Decision Support Systems,” Decision Support Systems (20:4),1997, pp. 297-315.
Forgionne, G. A. “Decision Technology Systems: A Vehicle to Consolidate DecisionMaking Support,” Information Processing and Management (27:6), 1991, pp.679-797.
Forgionne, G., and Kohli, R. “Integrated MSS Effects: An Empirical Healthcare Investi-gation,” Information Processing and Management (31), 1995, pp. 879-896.
Forgionne, G. A., and Kohli, R. “DSS Effectiveness: The Davis-Kottemann ProductionPlanning Experiments,” Systems Analysis Modeling Simulation (SAMS) (26),1996, pp. 185-195.

Journal of the Association for Information Systems 36
Gardner, C. L., Masrsden, J. R., and Pingry, D. E. “The Design and Use of LaboratoryExperiments for DSS Evaluation,” Decision Support Systems (9), 1993, pp. 369-379.
Gottinger, H. W., and Weimann, P. “Intelligent Decision Support Systems,” DecisionSupport Systems (8:4), 1992, pp. 8(4), 317-332.
Kanji, G. K. 100 Statistical Tests, Thousand Oaks, CA: Sage, 1983.Keppel, G. Design and Analysis: A Researcher's Handbook, Englewood Cliffs, NJ:
Prentice-Hall, Inc. 1982.Lamberti, D. M., and Wallace, W. A. “Intelligent Interface Design: An Empirical
Assessment of Knowledge Presentation in Expert Systems,” MIS Quarterly(4:3), 1990, pp. 279-311.
Leidner, D., and Elam, J. “Executive Information Systems: Their Impact on ExecutiveDecision Making,” Journal of Management Information Systems (10:3), 1993/94,pp. 139-155.
Li, E. Y. “Perceived Importance of Information System Success Factors: A MetaAnalysis of Group Differences,” Information and Management (32:1), 1997, pp.15-28.
Lipshitz, R., and Bar-Ilan, O “How Problems Are Solved: Reconsidering the PhaseTheorem,” Organizational Behavior and Human Decision Processes (65:1),1996, pp. 48-60.
Mackay, J. M., and Elam, J. J. “A Comparative Study of How Experts and Novices Usea Decision Aid to Solve Problems in Complex Domains,” Information SystemsResearch (3:2), 1992, pp. 150-172.
Maxwell, S. E., and Delaney, H. D. Designing Experiments and Analyzing Data,Belmont, CA: Wadsworth Publishing Company, 1990.
McLeod, R. P. Academic Information Systems (AIS) Software Package II, 1986.Available from R. P. McLeod, 1106 Glade, College Station, TX 77840, (409)693-1241.
Newman, J. The Role of Idea Processing in Decision Support Systems,” UnpublishedDoctoral Dissertation, University of Maryland, Baltimore, 1993.
Norusis, M. J. SPSS for Windows: Base System Users' Guide, Release 5.0, Chicago:SPSS, Inc., 1992.
Parsaye, K., and Chignell, M. “Data Quality Control with Smart Databases,” AI Expert(8:5), 1993, pp. 22-27.
Potter, W., Byrd, T., Miller, J., and Kochut, K. “Extending Decision Support Systems:The Integration of Data, Knowledge, and Model Management,” Annals ofOperations Research (38), 1992, pp. 501-527.
Sainfort, F., Gustafson, D. H., Bosworth, K., and Hawkins, R. P. “Decision SupportSystems Effectiveness: Conceptual Framework and Empirical Evaluation,”Organizational Behavior and Human Decision Processes (45:2), 1990, pp. 232-252.
Sethi, V., and King, W. R. “Construct Measurement in Information Systems Research:An Illustration in Strategic Systems,” Decision Sciences (22:3), 1991, pp. 455-472.
Journal of the Association for Information Systems 37
Silverman, B. G. “Unifying Expert Systems and the Decision Sciences,” OperationsResearch (42:3), 1994, pp. 393-413.
Spangler, W. E. “The Role of Intelligence in Understanding the Decision-makingProcess,” IEEE Transactions on Knowledge and Data Engineering (3:2), 1991,pp. 149-159.
Tan, J. K. H., and Benbasat, I. “The Effectiveness of Graphical Presentation forInformation Extraction: A Cumulative Experimental Approach,” DecisionSciences (24:1), 1993, pp. 167-191.
Tatsuoka, M. M. Multivariate Analysis, 2nd Edition, New York: Macmillan, 1988.Todd, P., and Benbasat, I. “An Experimental Investigation of the Impact of Computer
Based Decision Aids on Decision Making Strategies,” Information SystemsResearch (2:2), 1991, pp. 87-115.
Tyran, C. K., and George, J. F. “The Implementation of Expert Systems: A Survey ofSuccessful Implementations,” Database (24:1), 1993, pp. 24(1), 5-15.
Udo, G. J. “Rethinking the Effectiveness Measures of Decision Support Systems,”Information and Management (22:2), 1992, pp. 123-135.
West, L. A., and Courtney, J. F. “The Information Problems in Organizations: AResearch Model for the Value of Information and Information Systems,”Decision Sciences (24:4), 1993, pp. 229-251.
V. ABOUT THE AUTHORSGuisseppi A. Forgionne is a professor of Information Systems at the University
of Maryland Baltimore County (UMBC). Professor Forgionne holds a B.S. in
Commerce and Finance, an M.A. in Econometrics, an MBA, and a Ph.D. in Manage-
ment Science and Econometrics. He has published 23 books and approximately 100
research articles and consulted for a variety of public and private organizations on
decision support systems theory and applications. Dr. Forgionne also has served as
department chair at UMBC, Mount Vernon College, and Cal Poly Pomona. He has
received several national and international awards for his work.
Rajiv Kohli is a project leader in Decision Support Services at the corporate
office of Holy Cross Health System in South Bend, Indiana. He received his Ph.D. in
information systems from the University of Maryland Baltimore County (UMBC) in 1994.
Dr. Kohli's research interests include enhancing DSS with expert systems and the
application of decision technologies for competitive advantage. He also is adjunct
assistant professor at the University of Notre Dame where he teaches in the area of
Strategic Information Systems in the MBA program.

Copyright for components of this work owned by others than the Association for Information Systems must behonored. Abstracting with credit is permitted. To copy otherwise, to republish, to post on servers, or to redistributeto lists requires prior specific permission and/or fee. Request permission to publish from: AIS Administrative Office,PO Box 2712 Atlanta, GA, 30301-2712 Attn: Reprints or via e-mail from [email protected].
EDITORPhillip Ein-Dor
Tel Aviv University
AIS SENIOR EDITORIAL BOARD
Henry C. Lucas. Jr.Editor-in-ChiefNew York University
Paul GrayEditor, CAISClaremont Graduate University
Phillip Ein-DorEditor, JAISTel-Aviv University
Edward A. StohrEditor-at-LargeNew York University
Blake IvesEditor, Electronic PublicationsLouisiana State University
Reagan RamsowerEditor, ISWorld NetBaylor University
JAIS ADVISORY BOARD
Izak BenbasatUniversity of British Columbia,Canada
Niels Bjørn-AndersenCopenhagen Business School,Denmark
Gerardine DeSanctisDuke University, USA
Robert GalliersUniversity of Warwick, UK
Sirkka JarvenpaaUniversity of Texas at Austin,USA
John L. KingUniversity of Michigan,USA
Edgar SibleyGeorge Mason University,USA
Ron WeberUniversity of Queensland,Australia
Vladimir ZwassFairleigh-DickinsonUniversity, USA

JAIS EDITORIAL BOARD
Paul AlparPhillipps University,Germany
Richard J. Boland Jr.Case Western ReserveUniversity, USA
Claudio CiborraUniversity of Bologna, Italy
Roger ClarkeAustralian NationalUniversity, Australia
Joyce ElamFlorida International University,USA
Henrique FreitasUniversidade Federal do RioGrande do Sul, Brazil
John HendersonBoston University, USA
Rudy HirschheimUniversity of Houston, USA
Sid HuffWestern Ontario University,Canada
Magid IgbariaTel-Aviv University, Israel
Mathias JarkeUniversity of Aachen,Germany
Rob KauffmanUniversity of Minnesota,USA
Julie KendallRutgers University, USA
Rob KlingUniversity of Indiana, USA
Claudia LoebbeckeUniversity of Cologne,Germany
Stuart MadnickMassachusetts Institute ofTechnology, USA
Ryutaro ManabeByunkyo University, Japan
Tridas MukhopadhyayCarnegie-Mellon University,USA
Mike NewmanUniversity of Manchester, UK
Ojelanki K. NgwenyamaVirginia CommonwealthUniversity, USA
Markku SaaksjarviHelsinki School ofEconomics and BusinessAdministration, Finland
Christina SohNanyang TechnologicalUniversity, Singapore
Kar Tan TamHong Kong University ofScience and Technology,Hong Kong
Alex TuzihlinNew York University, USA
Rick WatsonGeorgia State University,USA
Peter WeillMelbourne Business School,Australia
Leslie WillcocksOxford University, UK
ADMINISTRATIVE PERSONNEL
Eph McLeanAIS, Executive DirectorGeorgia State University
Colleen BauderSubscriptions ManagerGeorgia State University
Reagan RamsowerPublisher, JAISBaylor University