management’s discussion and analysis (md&a) and operating...
TRANSCRIPT

PTT Public Company Limited 1
Q2/2015
Management’s Discussion and Analysis (MD&A) and operating results for the three-month and
six-month periods ended June 30, 2015
Economic Overview in the second quarter of 2015
The world economy in the second quarter of 2015 (Q2/2015) expanded at a greater pace than the first quarter of 2015 (Q1/2015) as advanced economies improved. The US economy continued to grow after experienced a slowdown in Q1/2015 from the West Coast port strike, cold weather, and US dollar appreciation. Moreover, the economy of the Eurozone countries continued to recover, partly as a result of the European Central Bank (ECB)’s quantitative easing (QE) program, which resulted in the weakening of the Euro. On the other hand, Greece’s debt crisis remained protract as a result of the shortage of liquidity, causing Greece to default on the International Monetary Fund (IMF) loan repayment of 1.6 billion euros on June 30, 2015, whilst developing and emerging economies continued to slow down. However, the Chinese economic growth was in lined with the government’s target of 7.0%, partly as a result of government stimulus measures and the easing of monetary policy by the People’s Bank of China (PBOC) by cutting lending and deposit rates as well as the require reserved ratio for financial institutions. Subsequently with global economic recovery slower than anticipated, the IMF, in
July 2015, projected the world economy to grow 3.3%, decreased from its 3.5% projection in April 2015.
The International Energy Agency (IEA) reported in July 2015 that global oil demand in Q2/2015 averaged 93.1 million barrels per day (MMBD), declined from 93.5 MMBD in Q1/2015 mainly from the decrease in demand
from the OECD countries. However, demand increased from 91.8 MMBD when compared to Q2/2014.
Average Dubai crude oil price in Q2/2015 was US$61.3 per barrel, rising from US$51.9 per barrel in Q1/2015 as a result of the drop in Non-OPEC crude oil production and the geopolitical tensions within the Middle East, which cause concerns on supply, but declined from US$106.1 per barrel in Q2/2014 mainly from global supply surplus since the second half of 2014 particularly from US shale oil production, despite several producers
started to cease their production, as well as, OPEC producing more than its agreed quota of 30 MMBD.
Unit: US$/bbl Q2/2014 Q1/2015 Q2/2015 % Inc.(Dec.) 1H/2014 1H/2015 % Inc.(Dec.)
YoY QoQ
Average Dubai 106.1 51.9 61.3 (42.2%) 18.1% 105.3 56.6 (46.2%)
All Petroleum product prices in the Singapore Spot Market in Q2/2015 increased from those in Q1/2015, aligned with the Dubai oil price, but decreased when compared to Q2/2014. Respectively, gasoline crack spread in Q2/2015 also increased from Q1/2015 due to higher demands from China and India as well as supply shortfalls from refineries maintenance shutdowns. On the contrary, diesel crack spread in Q2/2015 declined from the
Economic Overview
Non-recurring items
Overall Performance Segm
entation Performance Analysis of Financial Position
Economic Outlook

PTT Public Company Limited 2
Q2/2015
previous quarter on accounts of reduced demands from China and Indonesia, similar to fuel oil crack spread in Q2/2015, which also fell because of demand reduction from China and increased supply from the West.
Petrochemical prices of Olefins in Q2/2015, both High Density Polyethylene (HDPE) and Polypropylene (PP), surged from Q1/2015, in parallel with the rise in crude and naphtha prices and tight supply as a result of maintenance shutdowns by majority of producers in Asia. For Aromatics, Benzene (BZ) price increased amid limited supply from the effects of maintenance shutdowns in conjunction with increased demand of Styrene Monomer (SM) after heavy SM turnarounds during Spring ended in May. Moreover, Paraxylene (PX) price also jumped up after the explosion incident of Dragon Aromatics plant in China, which has PX capacity of 1.6 million tons/year and BZ capacity of 460 thousand tons/year, and the polyester seasonal demand peak in China.
Unit: US$ per Ton Q2/2014 Q1/2015 Q2/2015 % Inc.(Dec.) 1H/2014 1H/2015 % Inc.(Dec.)
YoY QoQ
HDPE 1,443 1,555 1,569 8.7% 0.9% 1,463 1,562 6.8%
PP 1,582 1,148 1,343 (15.1%) 17.0% 1,572 1,246 (20.7%) BZ 1,288 1,299 1,292 0.3% (0.5%) 1,335 1,296 (2.9%)
PX 1,419 1,269 1,236 (12.9%) (2.1%) 1,509 1,249 (17.2%)
Thai economy in Q2/2015 expanded slightly from Q1/2015 as public investments and tourism were the key drivers of the economic growth, despite weak recovery in exports and private consumptions from the problem of high household debt and low agricultural product prices. Respectively, the Office of the National Economic and Social Development Board (NESDB), as of May 2015, projected the Thai economy to grow in the range of 3.0 - 4.0% in 2015.
Economic Overview
Non-recurring items
Overall Performance Segm
entation Performance Analysis of Financial Position
Economic Outlook

PTT Public Company Limited 3
Q2/2015
Non-recurring items in the second quarter of 2015
Summary of non-recurring items for Q2/2015 are as follows:
April 2015 IRPC’s Vacuum Gas Oil Hydro Treating Unit (VGOHT) resumed its operation for commercial production since April 12, 2015. Moreover, IRPC has received insurance claim from the insurance company for the complete amount.
PTT divested its total shareholdings in BCP of 374,748,571 shares or 27.22% of the total paid-up shares to Vayupak Fund 1 (“VAYU 1”) and the Social Security Office (“SSO”), for the portion of 15.25% and 11.96% respectively, at the price of Baht 36/share.
May 2015 PTT Green Energy Pte Ltd. ("PTTGE SG") (a wholly owned subsidiary of PTT in Singapore) signed a Share and Purchase Agreement (SPA) with another Shareholder to dispose its entire investment of 77.56 % of the total issued shares in Chancellor Oil Pte. Ltd., a company that operates a palm oil business through PT.
First Borneo Plantations ("PT FBP") in Indonesia
GPSC completed its initial public offering (IPO) of its shares and started the first trading day on May 18, 2015 at Baht 27/share
PTTEP established PTTEP Treasury Center Company Limited (PTTEP TC) as the Treasury Center of PTTEP and its subsidiaries
June 2015 PTTGE SG completed the process of disposing the shares, transferring liabilities and advance investment payment of PT. Mitra Aneka Rezeki (PT. MAR) to Harvey Bay Overseas ("HBO") on June 9, 2015. Total value of the transaction was 35 MMUSD.
PTTGC acquired 25% shareholding interest in PTT Polymer Marketing Company
Limited ("PTTPM") from IRPC at Baht 2,500/share in line with the towards Marketing & Logistic management organizational structure
PTTGC established PTTGC America Corporation and PTTGC America LLC holding 100% share ownership to conduct Front End Engineering Design (FEED) study and invest in Petrochemical Complex Project in the US to take advantage of ethane feedstock from Shale gas
Economic Overview
Non-recurring items
Overall Performance Segm
entation Performance Analysis of Financial Position
Economic Outlook

PTT Public Company Limited 4
Q2/2015
July 2015 PTTGC and its subsidiary acquired 50% shareholding interest in PTT Polymer Logistics (“PTTPL”) from PTT at Baht 118/share in line with PTT Group’s restructuring policy aiming to better align the shareholding proportions of PTTPL with the proportions of service used
PTTGE SG signed the Sale and Purchase Agreement to dispose its entire investment in PT. Az Zhara of 99.98% and expected that the disposition of the entire investment and the transfer of liabilities to be completed within September 2015
Economic Overview
Non-recurring items
Overall Performance Segm
entation Performance Analysis of Financial Position
Economic Outlook
PTT Public Company Limited 5
Q2/2015
Overall performance of PTT and its subsidiaries
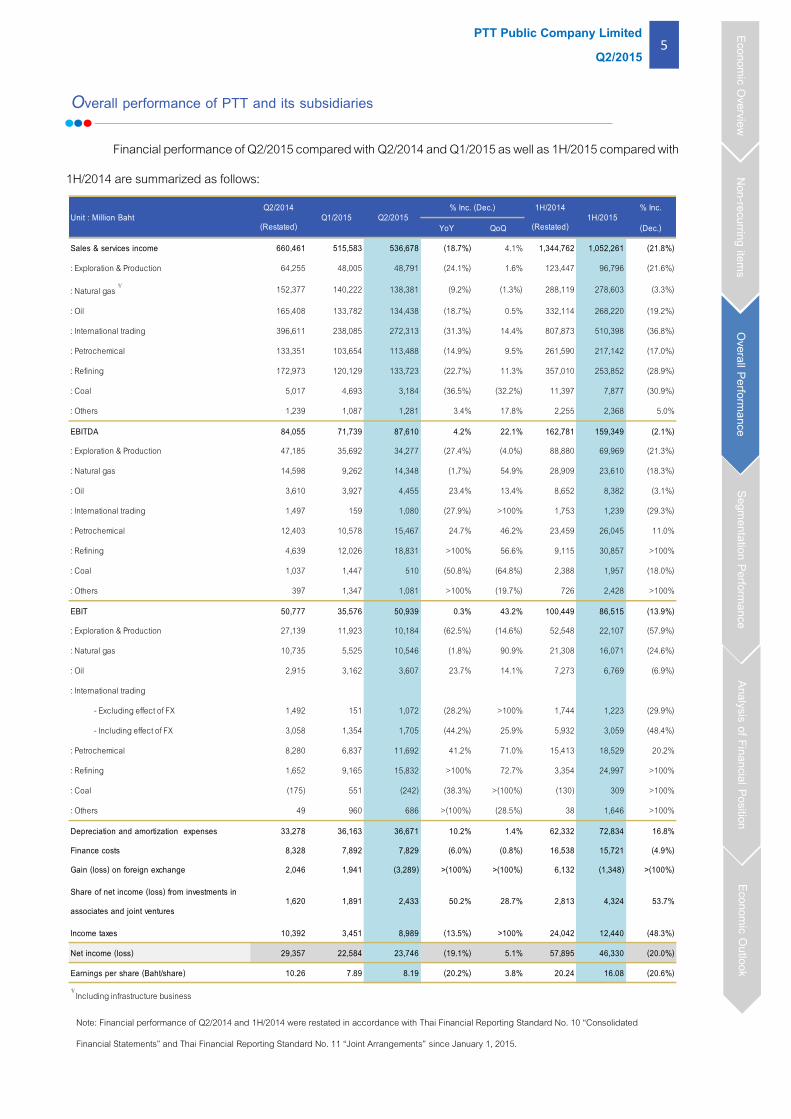
Financial performance of Q2/2015 compared with Q2/2014 and Q1/2015 as well as 1H/2015 compared with
1H/2014 are summarized as follows:
% Inc.
YoY QoQ (Dec.)
Sales & services income 660,461 515,583 536,678 (18.7%) 4.1% 1,344,762 1,052,261 (21.8%)
: Exploration & Production 64,255 48,005 48,791 (24.1%) 1.6% 123,447 96,796 (21.6%)
: Natural gas 1/ 152,377 140,222 138,381 (9.2%) (1.3%) 288,119 278,603 (3.3%)
: Oil 165,408 133,782 134,438 (18.7%) 0.5% 332,114 268,220 (19.2%)
: International trading 396,611 238,085 272,313 (31.3%) 14.4% 807,873 510,398 (36.8%)
: Petrochemical 133,351 103,654 113,488 (14.9%) 9.5% 261,590 217,142 (17.0%)
: Refining 172,973 120,129 133,723 (22.7%) 11.3% 357,010 253,852 (28.9%)
: Coal 5,017 4,693 3,184 (36.5%) (32.2%) 11,397 7,877 (30.9%)
: Others 1,239 1,087 1,281 3.4% 17.8% 2,255 2,368 5.0%
EBITDA 84,055 71,739 87,610 4.2% 22.1% 162,781 159,349 (2.1%)
: Exploration & Production 47,185 35,692 34,277 (27.4%) (4.0%) 88,880 69,969 (21.3%)
: Natural gas 14,598 9,262 14,348 (1.7%) 54.9% 28,909 23,610 (18.3%)
: Oil 3,610 3,927 4,455 23.4% 13.4% 8,652 8,382 (3.1%)
: International trading 1,497 159 1,080 (27.9%) >100% 1,753 1,239 (29.3%)
: Petrochemical 12,403 10,578 15,467 24.7% 46.2% 23,459 26,045 11.0%
: Refining 4,639 12,026 18,831 >100% 56.6% 9,115 30,857 >100%
: Coal 1,037 1,447 510 (50.8%) (64.8%) 2,388 1,957 (18.0%)
: Others 397 1,347 1,081 >100% (19.7%) 726 2,428 >100%
EBIT 50,777 35,576 50,939 0.3% 43.2% 100,449 86,515 (13.9%)
: Exploration & Production 27,139 11,923 10,184 (62.5%) (14.6%) 52,548 22,107 (57.9%)
: Natural gas 10,735 5,525 10,546 (1.8%) 90.9% 21,308 16,071 (24.6%)
: Oil 2,915 3,162 3,607 23.7% 14.1% 7,273 6,769 (6.9%)
: International trading
- Excluding effect of FX 1,492 151 1,072 (28.2%) >100% 1,744 1,223 (29.9%)
- Including effect of FX 3,058 1,354 1,705 (44.2%) 25.9% 5,932 3,059 (48.4%)
: Petrochemical 8,280 6,837 11,692 41.2% 71.0% 15,413 18,529 20.2%
: Refining 1,652 9,165 15,832 >100% 72.7% 3,354 24,997 >100%
: Coal (175) 551 (242) (38.3%) >(100%) (130) 309 >100%
: Others 49 960 686 >(100%) (28.5%) 38 1,646 >100%
Depreciation and amortization expenses 33,278 36,163 36,671 10.2% 1.4% 62,332 72,834 16.8%
Finance costs 8,328 7,892 7,829 (6.0%) (0.8%) 16,538 15,721 (4.9%)
Gain (loss) on foreign exchange 2,046 1,941 (3,289) >(100%) >(100%) 6,132 (1,348) >(100%)
Share of net income (loss) from investments in
associates and joint ventures1,620 1,891 2,433 50.2% 28.7% 2,813 4,324 53.7%
Income taxes 10,392 3,451 8,989 (13.5%) >100% 24,042 12,440 (48.3%)
Net income (loss) 29,357 22,584 23,746 (19.1%) 5.1% 57,895 46,330 (20.0%)
Earnings per share (Baht/share) 10.26 7.89 8.19 (20.2%) 3.8% 20.24 16.08 (20.6%)1/ Including infrastructure business
1H/2015 Unit : Million Baht Q2/2014
(Restated) Q1/2015 Q2/2015
% Inc. (Dec.) 1H/2014
(Restated)
Economic Overview
Non-recurring items
Overall Performance Segm
entation Performance Analysis of Financial Position
Economic Outlook
Note: Financial performance of Q2/2014 and 1H/2014 were restated in accordance with Thai Financial Reporting Standard No. 10 “Consolidated
Financial Statements” and Thai Financial Reporting Standard No. 11 “Joint Arrangements” since January 1, 2015.
PTT Public Company Limited 6
Q2/2015
Second quarter of 2015 compared with First quarter of 2015
Net income of PTT and its subsidiaries in Q2/2015 was Baht 23,746 million, increased from Baht 22,584
million in Q1/2015 by Baht 1,162 million or 5.1% mainly due to higher crude oil price and reference petrochemical
product prices compared with the previous quarter; therefore, performances of PTT and its affiliates in the
petrochemical and refinery business groups increased. However, PTTEP performance dropped, despite the rise in
crude oil prices, as a result of Baht depreciation against US$ in this quarter. Consequently, PTTEP, which its
functional currency is US$, had significant increase in taxes. Moreover the Baht depreciation against US$ also led
to loss on foreign exchange from foreign currency debts of PTT Group, although PTT recognized net gain from
disposal of investments in affiliates in this quarter.
In Q2/2015, sales revenue of PTT and its subsidiaries was Baht 536,678 million, increased by Baht 21,095
million or 4.1% mainly due to sales of international trading business, petrochemical and refinery business groups.
The main reason was the higher average selling prices of petroleum and petrochemical products, including
Olefins and Aromatics, following the rise in crude oil price. The average Dubai crude oil price increased 18.1%
from US$ 51.9 per barrel in Q1/2015 to US$ 61.3 per barrel in Q2/2015, resulting from the higher demand of crude
oil and geopolitical tensions within the Middle East. These causes have brought about stock gains for refinery
business in this quarter. Additionally, the average selling prices of petrochemical products increased because of
tight supply from turnaround of petrochemical plants in this quarter. Moreover, gas business had better
performance, especially PTT’s GSPs; mainly from lower cost while petrochemical reference prices increased,
hence, earnings before interest, taxes, depreciation and amortization (excluding other non-operating incomes
and expenses) (EBITDA) of PTT and subsidiaries in Q2/2015 was Baht 87,610 million, increased by Baht 15,871
million or 22.1%.
845
1,892596
105
248
209
237
280
(35) (53)
Q1/2015 Q2/2015
Others
Gas
Oil
Petrochemical
Refinery
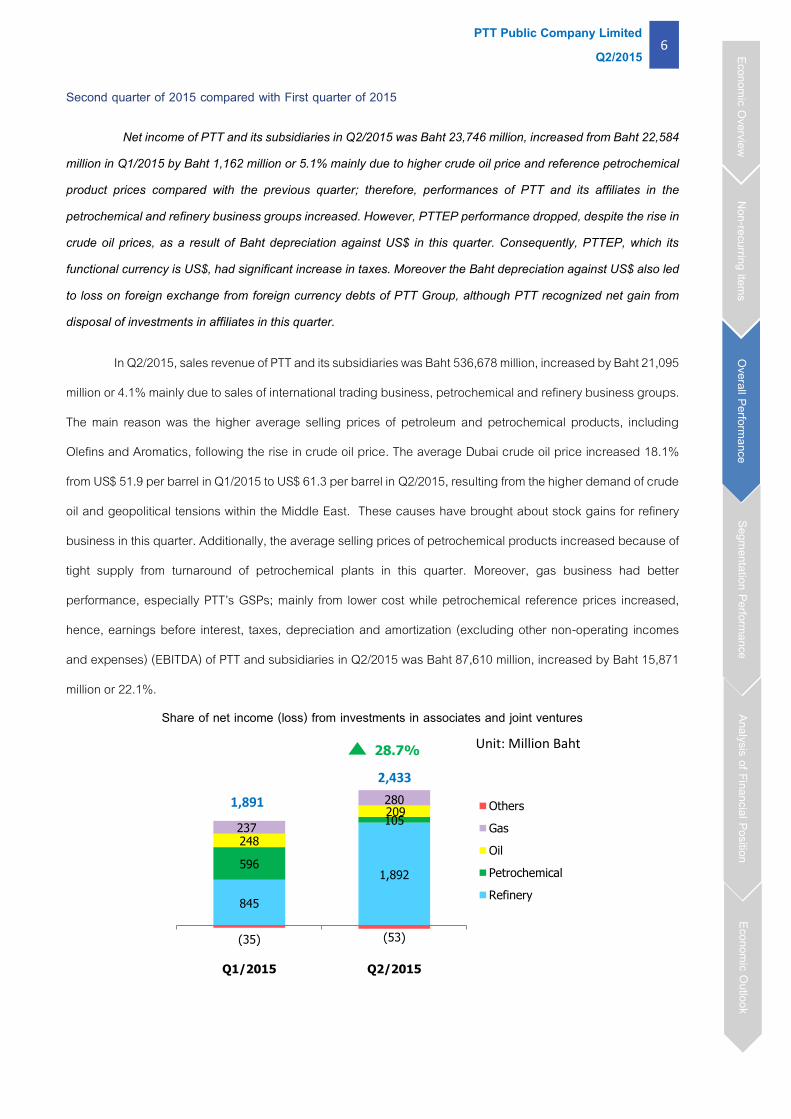
Share of net income (loss) from investments in associates and joint ventures
2,433
1,891
Unit: Million Baht 28.7%
Economic Overview
Non-recurring items
Overall Performance Segm
entation Performance Analysis of Financial Position
Economic Outlook

PTT Public Company Limited 7
Q2/2015
In Q2/2015, the share of net income from investments in associates and joint ventures was Baht 2,433
million, increased by Baht 542 million from Baht 1,891 million in Q1/2015, mainly due to better performance of
refining business associates from stock gain, which is in line with the rise in crude oil price, compare to stock loss
in Q1/2015, despite the drop in most petroleum product spreads.
In Q2/2015 there was loss on foreign exchange of Baht 3,289 million, compared to gain on foreign
exchange in Q1/2015 of Baht 1,941 million. This was mainly resulted from the effect of the Baht depreciation
against US$; hence, many companies within PTT Group had unrealized loss on foreign exchange from foreign
currencies debts.
Moreover, there was loss on financial derivatives of Baht 3,210 million, whereas gain on financial derivatives in Q1/2015 was Baht 1,470 million. This was mainly resulted from loss on financial derivatives from oil price hedging of PTTEP and cross-currency swap contracts of PTT. Nevertheless, there was net gain on disposal of investment in Q2/2015 of Baht 3,096 million, mainly from the disposal of investment in BCP (an associate of PTT). In Q2/2015, corporate income taxes were Baht 8,989 million, increased by Baht 5,538 million from Baht
3,451 million in Q1/2015, mainly from the Baht depreciation against US$. As a result, PTTEP, with functional
currency in US$, had significant increase in taxes. In addition, tax expenses of PTT also increased due to the rise
in operating income.
First half of 2015 compared with First half of 2014
Net income of PTT and its subsidiaries in the first half of 2015 (1H/2015) was Baht 46,330 million,
decreased from Baht 57,895 million in the first half of 2014 (1H/2014) by Baht 11,565 million or 20.0% mainly due
to the decrease in average selling prices following a decline of crude oil price, as well as petroleum product and
petrochemical reference prices. Moreover, depreciation expenses increased in relations to higher completed assets
and production volumes. As a result, the performance of PTT and PTTEP decreased. On the other hand, the
performance of refinery and petrochemical business groups increased mainly due to the rise in gross refining
margin (GRM) and decrease in feed costs following the drop in crude oil price. In addition, PTT’s refineries had
higher production volumes in 1H/2015, while they had major turnarounds in 1H/2014. However, the weakening of
Baht against US$ compared to last year has generated loss on foreign exchange for PTT group
In 1H/2015, sales revenue of PTT and its subsidiaries was Baht 1,052,261 million, decreased by Baht
292,501 million or 21.8%, mainly due to the average selling prices, despite the continuous growth in sales volume.
Average product selling prices declined dramatically following Dubai crude oil and reference product prices,
Economic Overview
Non-recurring items
Overall Performance Segm
entation Performance Analysis of Financial Position
Economic Outlook
PTT Public Company Limited 8
Q2/2015
where average Dubai crude price in 1H/2015 was 56.6 decreased by 46.2% when compared to US$ 105.3 per
barrel in 1H/2014 as a result of the increase in oversupply from both OPEC and Non-OPEC producers, thus led
to the drop in sales revenue of all business groups especially the performance of PTTEP and gas business group;
even though, gas production costs have started to decrease following crude oil price. Since the gas cost is linked
to historical fuel oil reference price, the decrease in average costs of production was lower than the drop in
average product selling prices. On the other hand, the drop in crude oil price resulted in positive impact on lower
production costs of downstream businesses, such as refinery and petrochemical businesses, by reducing fuel
used and loss amount resulting in higher gross margins in 1H/2015. Consequently, EBITDA of PTT and
subsidiaries in 1H/2015 was Baht 159,350 million, decreased by Baht 3,432 million or 2.1% compared to 1H/2014.
.
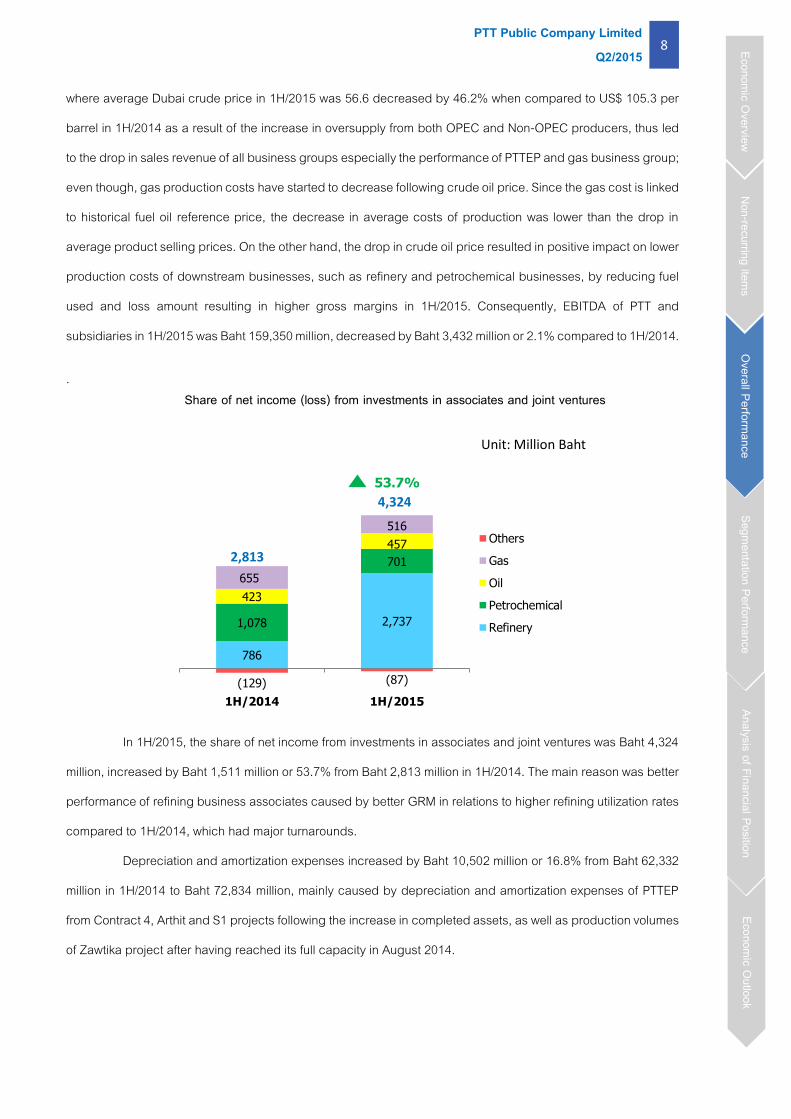
In 1H/2015, the share of net income from investments in associates and joint ventures was Baht 4,324
million, increased by Baht 1,511 million or 53.7% from Baht 2,813 million in 1H/2014. The main reason was better
performance of refining business associates caused by better GRM in relations to higher refining utilization rates
compared to 1H/2014, which had major turnarounds.
Depreciation and amortization expenses increased by Baht 10,502 million or 16.8% from Baht 62,332
million in 1H/2014 to Baht 72,834 million, mainly caused by depreciation and amortization expenses of PTTEP
from Contract 4, Arthit and S1 projects following the increase in completed assets, as well as production volumes
of Zawtika project after having reached its full capacity in August 2014.
786
2,7371,078
701
423
457
655
516
(129) (87)
1H/2014 1H/2015
Others
Gas
Oil
Petrochemical
Refinery
4,324
2,813
Unit: Million Baht
53.7%
Share of net income (loss) from investments in associates and joint ventures
Economic Overview
Non-recurring items
Overall Performance Segm
entation Performance Analysis of Financial Position
Economic Outlook

PTT Public Company Limited 9
Q2/2015
Loss on foreign exchange in 1H/2015 was Baht 1,348 million while gain on foreign exchange in 1H/2014
was Baht 6,132 million mainly from unrealized losses of foreign currency debts of subsidiaries within PTT group
principally resulted from the Baht depreciation against US$. Additionally, PTTEP, with its functional currency being
US$, had unrealized loss on foreign exchange mainly from accounts receivable and foreign currency deposit at
bank.
Furthermore, loss on financial derivatives in 1H/2015 was Baht 1,740 million while there was gain on
financial derivatives in 1H/2014 of Baht 4,583 million. The loss was mainly from crack spread hedging of PTT’s
subsidiaries within the refinery business group caused by higher market crack spreads than contract prices.
However, gain on disposal of investment in this period was Baht 3,096 million primarily from disposal of investment
in BCP (an associate of PTT). Additionally, in 1H/2014, there were expenses from business restructuring of
Vencorex (a subsidiary of PTTGC).
In 1H/2015, finance costs were Baht 15,721 million, decreased by Baht 817 million or 4.9% from Baht
16,538 million in 1H/2014, mainly due to repayment of long-term loans that were matured during period.
In 1H/2015, corporate income taxes were Baht 12,440 million, decreased by Baht 11,602 million or
48.3% from Baht 24,042 million in 1H/2014, mainly from a drop in PTTEP’s petroleum income tax expenses due
to a reduction in operating income.
Economic Overview
Non-recurring items
Overall Performance Segm
entation Performance Analysis of Financial Position
Economic Outlook

PTT Public Company Limited 10
Q2/2015
Segmentation performance of PTT and its subsidiaries
The details of revenue, EBITDA and EBIT of 1H/2015 by segmentation are as follow;
1. Upstream Petroleum and Natural Gas Business Group
Petroleum Exploration and Production Business: PTT Exploration and Production Public Co., Ltd. (PTTEP)
%Inc.
YoY QoQ (Dec.)
Average selling price
(US$/BOE)
Average sales volume
(BOED)
(26.8%)
315,810 327,145 325,534 3.1% (0.5%) 307,263 326,335 6.2%
1H/2015
67.7 48.7 48.5 (28.4%) (0.4%) 66.4 48.6
1H/2014Q2/2014 Q1/2015 Q2/2015%Inc. (Dec.)
Second quarter of 2015 compared with First quarter of 2015
In Q2/2015, sales revenue of PTTEP, a subsidiary of PTT, was 48,791 million, increased by Baht 786 million or 1.6% because the average selling prices of crude oil and condensate increased by 18.4% from US$ 50.1 per barrel of oil equivalent (BOE) in Q1/2015 to US$ 59.3 per BOE in Q2/2015, in relation to the increase in the global reference crude oil prices. In addition, the sales volume of crude oil and condensate increased mainly from Montara. However, planned shutdown for maintenance for Yedana, Yetagun and Zawtika projects in April 2015 led to the decrease in average gas sales volume by 0.5% from 327,145 barrels of oil equivalent per day (BOED) in Q1/2015 to 325,534 BOED in Q2/2015. The average selling price slightly decreased by 0.4% from US$ 48.7 per barrel in Q1/2015 to US$ 48.5 per barrel in Q2/2015 mainly caused by the selling prices of gas product started to decrease relative to historical fuel oil reference price.
17%
13%15%
48%
6%1%
14%
16%19%
6%
42%
3%
18%
20%
27%
9% 24%
2%
Economic Overview
Non-recurring items
Overall Performance Segm
entation Performance Analysis of Financial Position
Economic Outlook
* Including coal and others.
Gas Oil & Trading PTTEP Others*
1,052,261 159,349 86,515
GAS Oil & Trading PTTEP Refine Petrochem Others*
Unit: Million Baht

PTT Public Company Limited 11
Q2/2015
In Q2/2015, EBITDA was Baht 34,277 million, decreased by Baht 1,415 million or 4.0%, because of the rise in exploration expenses as a result of the exploration well write – off in the Myanmar PSC-G and EP2 projects, as well as the increase in maintenance expenses mainly from projects in Myanmar and Arthit project. In Q2/2015, EBIT was Baht 10,184 million, decreased by Baht 1,739 million or 14.6%, as a result of a drop of EBITDA as aforementioned. Furthermore, depreciation and amortization expenses increased in relations to higher completed assets.
First half of 2015 compared with First half of 2014
In 1H/2015, sales revenue of PTTEP was Baht 96,796 million, decreased by Baht 26,651 million or 21.6%, because the average selling prices decreased by 26.8% from US$ 66.4 per BOE in 1H/2014 to US$ 48.6 per BOE in 1H/2015, in relations to the decrease in the reference crude oil price since Q3/2014. On the other hand, the average sales volume continuously increased by 6.2% from 307,263 BOED in 1H/2014 to 326,335 BOED in 1H/2015 mainly because Zawtika started its natural gas sales in Myanmar since March 2014, and reached its full production capacity as well as exported natural gas to Thailand since August 2014. In 1H/2015, EBITDA was Baht 69,969 million, decreased by Baht 18,911 million or 21.3%, mainly from lower sales revenue as aforementioned despite the decrease in royalty and operating expenses primarily because in 1H/14, PTTEP Australasia project incurred additional expenditures from drilling of H5 development well and from the restructuring of participating interest in the Canada Oil Sand KKD project in Q1/2014. In 1H/2015, EBIT was Baht 22,107 million, decreased by Baht 30,441 million or 57.9%, as a result of the increase in depreciation and amortization expenses in relation to higher completed assets of Contract 4, Arthit and S1 projects as well as higher production volume of Zawtika project.
Economic Overview
Non-recurring items
Overall Performance Segm
entation Performance Analysis of Financial Position
Economic Outlook
PTT Public Company Limited 12
Q2/2015
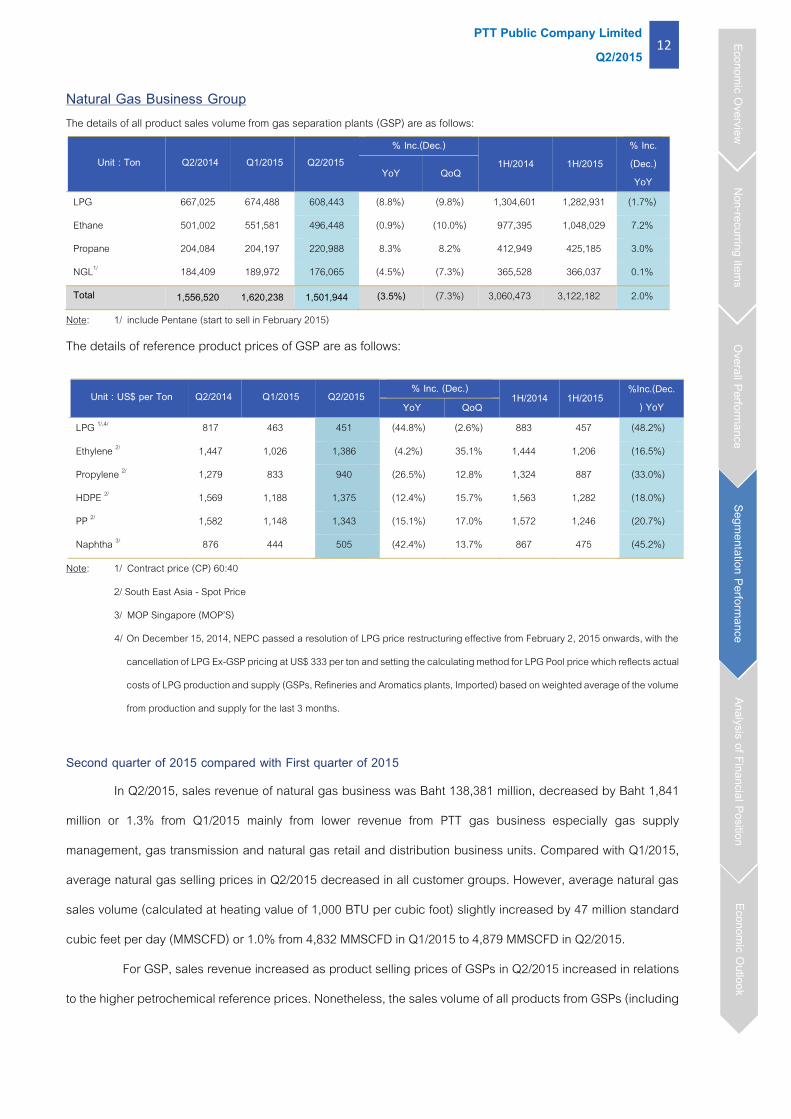
Natural Gas Business Group The details of all product sales volume from gas separation plants (GSP) are as follows:
Note: 1/ include Pentane (start to sell in February 2015)
The details of reference product prices of GSP are as follows:
Note: 1/ Contract price (CP) 60:40
2/ South East Asia - Spot Price
3/ MOP Singapore (MOP’S)
4/ On December 15, 2014, NEPC passed a resolution of LPG price restructuring effective from February 2, 2015 onwards, with the
cancellation of LPG Ex-GSP pricing at US$ 333 per ton and setting the calculating method for LPG Pool price which reflects actual
costs of LPG production and supply (GSPs, Refineries and Aromatics plants, Imported) based on weighted average of the volume
from production and supply for the last 3 months.
Second quarter of 2015 compared with First quarter of 2015
In Q2/2015, sales revenue of natural gas business was Baht 138,381 million, decreased by Baht 1,841
million or 1.3% from Q1/2015 mainly from lower revenue from PTT gas business especially gas supply
management, gas transmission and natural gas retail and distribution business units. Compared with Q1/2015,
average natural gas selling prices in Q2/2015 decreased in all customer groups. However, average natural gas
sales volume (calculated at heating value of 1,000 BTU per cubic foot) slightly increased by 47 million standard
cubic feet per day (MMSCFD) or 1.0% from 4,832 MMSCFD in Q1/2015 to 4,879 MMSCFD in Q2/2015.
For GSP, sales revenue increased as product selling prices of GSPs in Q2/2015 increased in relations
to the higher petrochemical reference prices. Nonetheless, the sales volume of all products from GSPs (including
Unit : Ton Q2/2014 Q1/2015 Q2/2015 % Inc.(Dec.)
1H/2014 1H/2015 % Inc. (Dec.) YoY
YoY QoQ
LPG 667,025 674,488 608,443 (8.8%) (9.8%) 1,304,601 1,282,931 (1.7%)
Ethane 501,002 551,581 496,448 (0.9%) (10.0%) 977,395 1,048,029 7.2%
Propane 204,084 204,197 220,988 8.3% 8.2% 412,949 425,185 3.0%
NGL1/ 184,409 189,972 176,065 (4.5%) (7.3%) 365,528 366,037 0.1%
Total 1,556,520 1,620,238 1,501,944 (3.5%) (7.3%) 3,060,473 3,122,182 2.0%
Unit : US$ per Ton Q2/2014 Q1/2015 Q2/2015 % Inc. (Dec.)
1H/2014 1H/2015 %Inc.(Dec.
) YoY YoY QoQ
LPG 1/,4/ 817 463 451 (44.8%) (2.6%) 883 457 (48.2%)
Ethylene 2/ 1,447 1,026 1,386 (4.2%) 35.1% 1,444 1,206 (16.5%)
Propylene 2/ 1,279 833 940 (26.5%) 12.8% 1,324 887 (33.0%)
HDPE 2/ 1,569 1,188 1,375 (12.4%) 15.7% 1,563 1,282 (18.0%)
PP 2/ 1,582 1,148 1,343 (15.1%) 17.0% 1,572 1,246 (20.7%)
Naphtha 3/ 876 444 505 (42.4%) 13.7% 867 475 (45.2%)
Economic Overview
Non-recurring items
Overall Performance Segm
entation Performance Analysis of Financial Position
Economic Outlook

PTT Public Company Limited 13
Q2/2015
NGL derived from Dew Point Control units) dropped from 1,620,238 tons in Q1/2015 to 1,501,944 tons in Q2/2015,
especially LPG and Ethane from maintenance shutdown of GSP unit 1.
EBITDA of natural gas business in Q2/2015 was Baht 14,348 million, increased by Baht 5,086 million or
54.9%. The main reason was the increase in gross margin of PTT’s GSPs due to the rise in product selling prices
as aforementioned. EBIT in Q2/2015 was Baht 10,546 million, increased by 90.9% in line with EBITDA.
First half of 2015 compared with First half of 2014
In 1H/2015, sales revenue of natural gas business was Baht 278,603 million, decreased by Baht 9,517
million or 3.3% from 1H/2014 mainly due to the lower sales revenue of PTT’s GSPs as a result of the drop in
product selling price in line with global product reference prices in 1H/2015. Nevertheless, the sales volume of all
products from GSPs (including NGL derived from Dew Point Control units) increased 2.0% from 3,060,473 tons in
1H/2014 to 3,122,182 tons in 1H/2015, mainly from the sales volume of Ethane and Propane.
In addition, sales revenue of PTT gas supply management, gas transmission and natural gas retail and
distribution business units decreased as a result of the drop in average selling prices in all customer groups,
especially selling prices for industrial customers, which was in line with the decrease in reference fuel oil price,
compared with the same period of last year. However, the average natural gas sales volume (calculated at heating
value of 1,000 BTU per cubic foot) increased by 245 MMSCFD or 5.3% from 4,610 MMSCFD in 1H/2014 to 4,855
MMSCFD in 1H/2015. The higher sales volume was mainly from higher demands from IPP customers as a result
of new IPPs that commercially operated in June and December 2014.
EBITDA of Natural Gas Business in 1H/2015 was Baht 23,610 million, decreased by Baht 5,299 million or
18.3%. The main reason was from the drop in gross margin of PTT’s natural gas business, especially the gross
margins of GSP, gas supply management, gas transmission and natural gas retail and distribution business units.
These were the results of the decrease in product selling prices of GSP as aforementioned and the drop in selling
prices for industrial customers of natural gas retail and distribution business unit in relations to the lower reference
fuel oil price. Nevertheless, NGV loss decreased from NGV price lifting to be at Baht 13 per kilogram for private
cars and Baht 10 per kilogram for taxi and public cars. EBIT in 1H/2015 was Baht 16,071 million, decreased by
24.6% in line with EBITDA.
Economic Overview
Non-recurring items
Overall Performance Segm
entation Performance Analysis of Financial Position
Economic Outlook
PTT Public Company Limited 14
Q2/2015
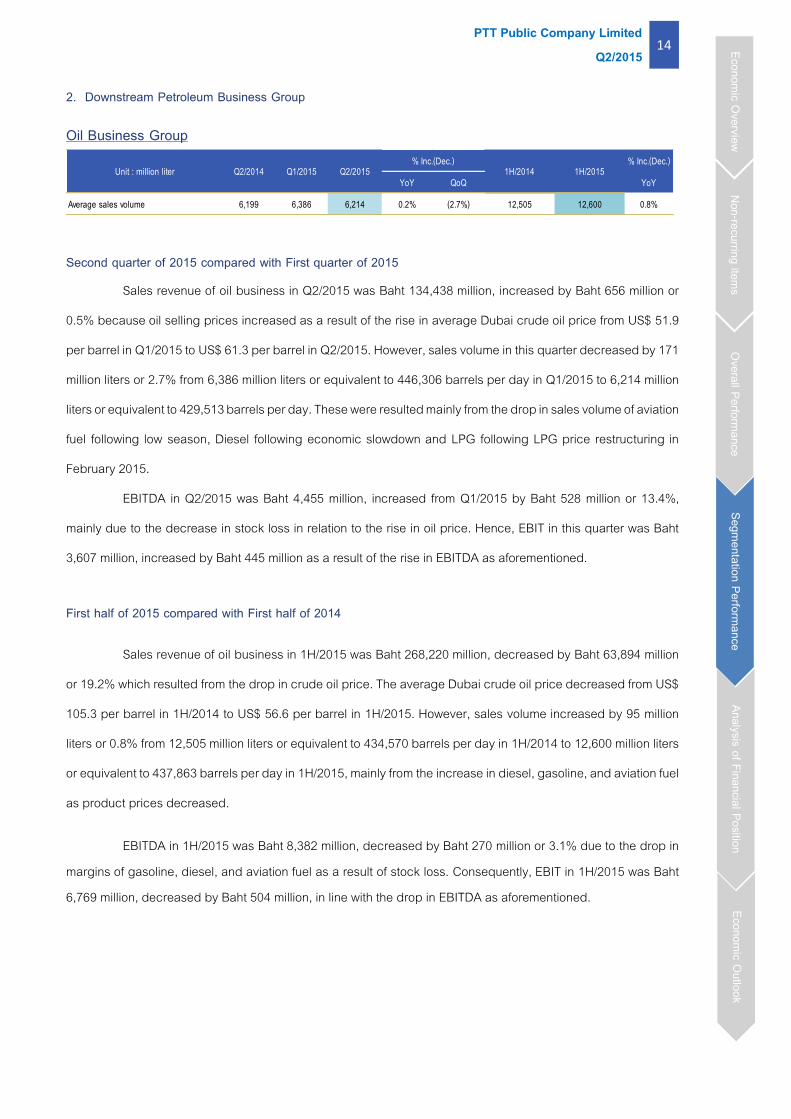
2. Downstream Petroleum Business Group
Oil Business Group
YoY QoQ YoY
Average sales volume 6,199 6,386 6,214 0.2% (2.7%) 12,505 12,600 0.8%
% Inc.(Dec.)1H/2014 1H/2015Unit : million liter Q2/2014 Q1/2015 Q2/2015
% Inc.(Dec.)
Second quarter of 2015 compared with First quarter of 2015
Sales revenue of oil business in Q2/2015 was Baht 134,438 million, increased by Baht 656 million or
0.5% because oil selling prices increased as a result of the rise in average Dubai crude oil price from US$ 51.9
per barrel in Q1/2015 to US$ 61.3 per barrel in Q2/2015. However, sales volume in this quarter decreased by 171
million liters or 2.7% from 6,386 million liters or equivalent to 446,306 barrels per day in Q1/2015 to 6,214 million
liters or equivalent to 429,513 barrels per day. These were resulted mainly from the drop in sales volume of aviation
fuel following low season, Diesel following economic slowdown and LPG following LPG price restructuring in
February 2015.
EBITDA in Q2/2015 was Baht 4,455 million, increased from Q1/2015 by Baht 528 million or 13.4%,
mainly due to the decrease in stock loss in relation to the rise in oil price. Hence, EBIT in this quarter was Baht
3,607 million, increased by Baht 445 million as a result of the rise in EBITDA as aforementioned.
First half of 2015 compared with First half of 2014
Sales revenue of oil business in 1H/2015 was Baht 268,220 million, decreased by Baht 63,894 million
or 19.2% which resulted from the drop in crude oil price. The average Dubai crude oil price decreased from US$
105.3 per barrel in 1H/2014 to US$ 56.6 per barrel in 1H/2015. However, sales volume increased by 95 million
liters or 0.8% from 12,505 million liters or equivalent to 434,570 barrels per day in 1H/2014 to 12,600 million liters
or equivalent to 437,863 barrels per day in 1H/2015, mainly from the increase in diesel, gasoline, and aviation fuel
as product prices decreased.
EBITDA in 1H/2015 was Baht 8,382 million, decreased by Baht 270 million or 3.1% due to the drop in margins of gasoline, diesel, and aviation fuel as a result of stock loss. Consequently, EBIT in 1H/2015 was Baht 6,769 million, decreased by Baht 504 million, in line with the drop in EBITDA as aforementioned.
Economic Overview
Non-recurring items
Overall Performance Segm
entation Performance Analysis of Financial Position
Economic Outlook

PTT Public Company Limited 15
Q2/2015
International Trading Business Group
YoY QoQ YoY
Average sales volume 18,224 21,067 20,253 11.1% (3.9%) 36,581 41,320 13.0%
% Inc. (Dec.)1H/2014 1H/2015Unit : million liter Q2/2014 Q1/2015 Q2/2015
% Inc. (Dec.)
Second quarter of 2015 compared with First quarter of 2015
Sales revenue of international trading business was Baht 272,313 million in Q2/2015, increased by Baht
34,228 million or 14.4% from Q1/2015 mainly from the rise in global crude oil price. However, sales volume in this
quarter decreased by 814 million liters or 3.9% from 21,067 million liters or equivalent to 1,472,302 barrels per
day in Q1/2015 to 20,253 million liters or equivalent to 1,399,891 barrels per day in Q2/2015, mainly due to the
drop in sales volume of crude oil and condensate from the out – out trading as well as lower naphtha sales volume
from weakening demand after price rebounded.
EBITDA in Q2/2015 was Baht 1,080 million, increased by Baht 921 million. EBIT, which included effect
on foreign exchange, was Baht 1,705 million, increased by Baht 351 million. This was resulted mainly from the
higher margins from domestic sales of crude oil and condensate following higher crude oil price.
First half of 2015 compared with First half of 2014
Sales revenue of international trading business was Baht 510,398 million in 1H/2015, decreased by
Baht 297,475 million or 36.8% which resulted from the drop in product selling prices in accordance with global oil
market prices. However, the sales volume in 1H/2015 increased by 4,739 million liters or 13.0% from 36,581 million
liters or equivalent to 1,271,227 barrels per day in 1H/2014 to 41,320 million liters or equivalent to 1,435,897
barrels per day, mainly due to the rise in sales volume of crude oil and condensate from the out – in and out – out
trading due to the absence of major refinery turnaround in this period.
EBITDA in 1H/2015 was Baht 1,239 million, which decreased by Baht 514 million. Nonetheless, EBIT, which included effect on foreign exchange, in 1H/2015 was Baht 3,059 million, decreased by Baht 2,873 million from 1H/2014 mainly due to the drop in margin of domestic condensate.
Economic Overview
Non-recurring items
Overall Performance Segm
entation Performance Analysis of Financial Position
Economic Outlook

PTT Public Company Limited 16
Q2/2015
Petrochemical Business Group
YoY QoQ
HDPE 1,569 1,188 1,375 (12.4%) 15.7% 1,563 1,282 (18.0%)
PP 1,582 1,148 1,343 (15.1%) 17.0% 1,572 1,246 (20.7%)
BZ - Cond 370 217 271 (26.8%) 24.9% 375 244 (34.9%)
PX - Cond 334 333 391 17.1% 17.4% 360 362 0.6%
1H/2014 1H/2015 % Inc. (Dec.)% Inc. (Dec.)
Q2/2015Q1/2015Unit : US$ per ton Q2/2014
Second quarter of 2015 compared with First quarter of 2015
Sales revenue of petrochemical subsidiaries of PTT in Q2/2558 was Baht 113,448 million, increased by
Baht 9,834 million or 9.5% mainly from the increase in sales revenue of PTTGC especially from Aromatics
products. The reason was because of the increase in Aromatics selling prices following the rise in BZ and PX
prices which resulted from the seasonal planned shutdown and the unplanned shutdown of Dragon Aromatics
plant in China, which led to partial drop in supply, while demand of downstream products increased especially
for polyester.
Moreover, the better sales revenue of petroleum products was mainly from increases in both product
selling prices following crude oil price and sales volumes from previous quarter especially diesel and fuel oil.
Olefins and derivatives sales revenue also increased because of polyethylene price increased following crude oil
price with HDPE price rose 15.7% from US$ 1,188 per ton in Q1/2015 to US$ 1,375 per ton in Q2/2015, despite
Olefins and polymer sales volume dropped from Q1/2015 in relations to declined utilization rates from the planned
and unplanned shutdowns of Olefins Plant I-4/2 and polymer plants as well as GSP unit 1.
EBITDA in Q2/2015 was Baht 15,467 million, increased by Baht 4,889 million or 46.2%, and EBIT in
Q2/2015 was Baht 11,692 million, increased by Baht 4,855 million or 71.0% mainly from better performance of
refinery business group. The higher crude oil price led to stock gain in Q2/2015, while there was stock loss in
previous quarter. However, most of petroleum product spreads declined in accordance with market conditions
from oil price volatility, except for gasoline price, which significantly increase because of higher seasonal demand.
In Q2/2015, total refinery intake increased from higher condensate residual level supplied from Aromatics plant.
As a result, the petroleum sales volume increased. The performance of Aromatics business also improved
because BZ and PX spreads increased by 24.9% and 17.4%, respectively. For Olefins and derivatives business,
performance was better mainly from the increase in its sales revenue as aforementioned.
Economic Overview
Non-recurring items
Overall Performance Segm
entation Performance Analysis of Financial Position
Economic Outlook

PTT Public Company Limited 17
Q2/2015
Share of net income from investments in associates and joint ventures of petrochemical business group
decreased by Baht 491 million from Baht 596 million in Q1/2015 to Baht 105 million in Q2/2015. The main part
came from the lower performance of PTTAC caused by unrealized loss on foreign exchange from foreign currency
debt. This was resulted from the impact of the Baht depreciation against the US$. Nonetheless, HMC, a joint
venture of PTT (production and distribution of PP/PDH products), had better performance due to the increase of
PP price, following the rise in crude oil price.
First half of 2015 compared with First half of 2014
Sales revenue of petrochemical subsidiaries of PTT in 1H/2015 was Baht 217,142 million, decreased
by Baht 44,448 million or 17.0% mainly from the reduction in sales revenue of PTTGC especially from petroleum
products group due to the decrease in average selling prices following crude oil price, despite sales volume
increased. Aromatics sales revenue also decreased from the decline of both price and sales volume. BZ and PX
selling prices significantly declined following oversupply in the market. Additionally, sales volume decreased from
the reduction of utilization rate. Also, Olefins and derivatives sales revenue declined mainly caused by the drop
in polyethylene price following crude oil price. HDPE price dropped by 18.0% from US$ 1,563 per ton in 1H/2014
to US$ 1,282 per ton in 1H/2015.
Although sales revenue significantly dropped, EBITDA and EBIT of petrochemical business group
increased. EBITDA in 1H/2015 was Baht 26,045 million, increased by Baht 2,586 million or 11.0% and EBIT in
1H/2015 was Baht 18,529 million increased by Baht 3,116 million or 20.2% mainly from better performance of
Aromatics business. Although PX spread was maintained and BZ spread decreased by 34.9%, the value of fuel
and loss was lower following the decrease in condensate price, which is the main material of production. Similarly,
the performance of refinery business also increased from the increase in petroleum product crack spreads
especially fuel oil crack spread and gasoline crack spread, despite some stock loss in 1H/2015.
Share of net income from investments in associates and joint ventures of petrochemical business
decreased by Baht 377 million from Baht 1,078 million in 1H/2014 to Baht 701 million in 1H/2015. The main part
came from the decrease in selling price in relations to reference product prices and unrealized loss on foreign
exchange from foreign currency debt, resulting from the impact of the Baht depreciation against the US$.
Economic Overview
Non-recurring items
Overall Performance Segm
entation Performance Analysis of Financial Position
Economic Outlook

PTT Public Company Limited 18
Q2/2015
Refinery Business Group
YoY QoQ
Market GRM 3.24 8.34 6.97 >100% (16.4%) 3.44 7.64 >100%
Inventory gain (loss) 0.96 (3.62) 2.81 >100% (>100%) (0.03) (0.35) >100%
Accounting GRM 5.09 4.75 9.70 90.6% >100% 4.22 7.27 72.3%
Accounting GIM 7.46 6.71 13.13 >100% >100% 6.68 9.99 49.6%
Utilization rate (%) 88.8% 96.9% 99.2% 11.7% 2.4% 86.8% 98.1% 13.0%
Q1/2015Unit: US$ per ton Q2/2014 1H/2014 1H/2015%Inc.
(Dec.)
%Inc. (Dec.)Q2/2015
Note: GRM was calculated from refineries of TOP, IRPC, and SPRC excluding PTTGC’s refining unit and BCP refinery GIM was calculated from refineries of TOP and IRPC
Second quarter of 2015 compared with First quarter of 2015
In Q2/2015, sales revenue of refinery subsidiaries of PTT (TOP and IRPC) was Baht 133,723 million,
increased by Baht 13,594 million or 11.3% mainly because average petroleum product prices increased following
the rise in average Dubai crude oil price. In the meantime, petroleum product sales volume slightly increased
following higher utilization rate and refinery intake. Petrochemical product sales revenue of TOP and IRPC also
increased mainly from the increase in average selling price of petrochemical products especially PX and BZ
prices. The higher prices were from seasonal refinery turnarounds and higher demand of downstream products.
EBITDA in Q2/2015 of TOP and IRPC was Baht 18,831 million, increased by Baht 6,805 million from Baht
12,026 million in Q1/2015 and EBIT was Baht 15,832 million, increased by 6,667 million. This was mainly from
stock gains following the increase in average Dubai crude oil price as aforementioned; even though, most
petroleum product crack spreads decreased except for gasoline crack spread. Gasoline crack spread improved
as a result of higher demand in Asia, from low retail price, as well as in US during driving season. Also, the
performance of petrochemical business, especially Aromatics, improved because of higher selling prices as
aforementioned, while feed costs remained low following crude oil price.
Share of net income from investments in associates and joint ventures of refinery business group
increased by Baht 1,048 million to Baht 1,892 million in Q2/2015. The main portion came from better performance
of SPRC which improved from stock gains, despite stock losses in Q1/2015.
Overall, market GRM of PTT group refineries (including refineries of TOP, IRPC, and SPRC excluding
PTTGC’s refining unit) was at US$ 6.97 per barrel in Q2/2015, decreased from US$ 8.34 per barrel in Q1/2015
mainly from the drop in most petroleum product crack spreads. Overall utilization rate, however, increased from
96.9% to 99.2%. Nevertheless, higher crude oil price led to stock gains of US$ 2.81 per barrel in Q2/2015. All in
Economic Overview
Non-recurring items
Overall Performance Segm
entation Performance Analysis of Financial Position
Economic Outlook

PTT Public Company Limited 19
Q2/2015
all, accounting GRM of PTT group refineries was at US$ 9.70 per barrel, increased by US$ 4.95 per barrel, and
when combined with the better performance of Aromatics business as mentioned, accounting GIM of TOP and
IRPC was at US$ 13.13 per barrel, increased by US$ 6.42 per barrel.
First half of 2015 compared with First half of 2014
In 1H/2015, sales revenue of refinery subsidiaries of PTT (TOP and IRPC) was Baht 253,852 million,
decreased by Baht 103,158 million or 28.9%. The decrease was mainly caused by the drop in petroleum product
prices following the decrease in average Dubai crude oil price. Also, Aromatics sales revenue of TOP dropped
since Aromatics selling price significantly declined in line with higher supply from new producers.
Although the sales revenue declined, the performance of refinery business group significantly
improved. EBITDA of TOP and IRPC in 1H/2015 was Baht 30,857 million, increased by Baht 21,742 million from
Baht 9,115 million in 1H/2014 and EBIT in 1H/2015 was Baht 24,996 million, increased by Baht 21,642 million.
These were mainly from the increase in petroleum product crack spread especially gasoline crack spread and
fuel oil crack spread as a result of shortened supply since there were the seasonal refinery turnarounds in the
region as well as increasing demand from low retail price. Moreover, the costs of production decreased following
the drop in crude price. The utilization rates and crude intake also rose due to higher production rates of TOP and
IRPC, while there were planned and emergency shutdowns in 1H/2014.
Share of net income from investments in associates and joint ventures of refinery business group
increased by Baht 1,951 million to Baht 2,737 million in 1H/2015. The main portion came from better performance
of SPRC which improved from higher utilization rate, while there was major turnaround in 1H/2014, as well as
increase in GRM.
Overall, market GRM of PTT group refineries (including TOP, IRPC, and SPRC excluding PTTGC’s
refining unit) was at US$ 7.64 per barrel, increased from US$ 3.44 per barrel in 1H/2014. Utilization rate also
increased from 86.8% in 1H/2014 to 98.1% in 1H/2015. However, continuous fluctuation in crude oil price resulted
in stock loss of US$ 0.35 per barrel in 1H/2015. All in all, accounting GRM of PTT group refineries was at US$
7.27 per barrel, increased by US$ 3.05 per barrel or 72.3% comparing to 1H/2014. As a result, accounting GIM
of TOP and IRPC was at US$ 9.99 per barrel, increased by US$ 3.31 per barrel or 49.6%.
Economic Overview
Non-recurring items
Overall Performance Segm
entation Performance Analysis of Financial Position
Economic Outlook

PTT Public Company Limited 20
Q2/2015
Coal Business
%Inc.
YoY QoQ (Dec.)
Average selling price (US$ per ton) 64.2 56.4 55.0 (14.3%) (2.5%) 66.1 55.7 (15.7%)
Sales volume (million ton) 2.4 2.5 1.7 (29.2%) (32.0%) 5.3 4.2 (20.8%)
1H/2014 1H/2015Q1/2015Q2/2014 Q2/2015%Inc. (Dec.)
Second quarter of 2015 compared with First quarter of 2015
Sales revenue of coal business in Q2/2015 was Baht 3,184 million, decreased by Baht 1,509 million or
32.2% mainly due to the drop in sales volume which decreased by 0.8 million tons or 32.0% following the
slowdown production and selling policy in order to lower impact during a coal price down turn. The average selling
price was 55.0 US$ per ton, decreased by US$ 1.4 per ton or 2.5%.
In Q2/2015, EBITDA was Baht 510 million, decreased by Baht 937 million or 64.8% mainly caused by
dropped sales volume as mentioned, higher stripping ratio from Jembayan coal mine and higher operating
expenses following the increase in crude oil price. Therefore, EBIT was Baht 242 million losses, whereas there
was Baht 551 million gains in Q1/2015 mainly due to the drop in EBITDA as aforementioned, despite decrease in
depreciation and amortization expenses in line with the decline in production volume.
First half of 2015 compared with First half of 2014
Sales revenue of coal business in 1H/2015 was Baht 7,877 million, decreased by Baht 3,520 million or
30.9% mainly due to the drop in both average selling price and sales volume. The sales volume decreased by
20.8% mainly from Sebuku mine and the average selling price decreased by US$ 10.7 per ton or 15.7%.
In 1H/2015, EBITDA was Baht 1,957 million, decreased by Baht 431 million or 18.0% mainly caused by
both average sales volume and selling price as aforementioned. However, EBIT was Baht 309 million gains in
1H/2015, while there was Baht 130 million losses in 1H/2014, mainly from the drop in depreciation and amortization
expenses in line with the drop in production volume, as well as improving efficiencies in production and
transportation thus lowering US$ operating costs.
Economic Overview
Non-recurring items
Overall Performance Segm
entation Performance Analysis of Financial Position
Economic Outlook

PTT Public Company Limited 21
Q2/2015
The analysis of PTT and its subsidiaries’ consolidated financial position as of June 30, 2015 compared with December 31, 2014
Assets
As of June 30, 2015, total assets of PTT and its subsidiaries were Baht 2,244,387 million, decreased by
Baht 6,068 million or 0.3% compared with December 31, 2014. This decrease was mainly from the net effect of
the followings:
: A decrease of Baht 15,978 million or 2.3% in current assets was mainly from the followings: - A decrease of Baht 11,838 million in accounts receivable, mainly from receiving payments of trade
accounts receivable in international trading business and oil marketing business of PTT. - A decrease of Baht 9,517 million in cash and cash equivalents and current investments mainly
due to debenture and long-term loan repayments and payment of corporate income tax for the year ended 2014 of PTTEP. However, PTTGC has increased cash and current investments from cash flows from operation
- A decrease of Baht 7,045 million of other accounts receivable was principally from advances for long-term crude purchasing contract of PTTT.
: A decrease of Baht 5,204 million or 5.0% in long-term investments was mainly from the disposal of
investment in BCP on April 30, 2015.
336,913 335,801
1,105,147 1,121,373
104,154 98,950
704,241 688,263
1,054,694 1,122,628
191,562 188,604
697,000 669,946
307,199 263,209
2,250,455 2,244,387
0.3% 0.3%
2,250,455 2,244,387
Economic Overview
Non-recurring items
Overall Performance Segm
entation Performance Analysis of Financial Position
Economic Outlook
Total Assets Total Liabilities & Equity Unit: Million Baht
Current assets
Long-term loans (including current portion)
Non-current liabilities
Other current liabilities
Equity
Available-for-sale investments, Investments in associates, and
other long-term investments
Other non-current assets
Property, plant and equipment
31 Dec 2014 30 Jun 2015 31 Dec 2014 30 Jun 2015

PTT Public Company Limited 22
Q2/2015
: An increase of Baht 16,226 million or 1.5% in property, plant and equipment was principally from land
purchase and assets under construction of UHV project of IRPC, assets under construction of the 4 th natural gas
pipeline project and Nakornsawan pipeline project of PTT, and assets under construction of power plant of TOP.
Liabilities
As of June 30, 2015, PTT and its subsidiaries had total liabilities of Baht 1,121,759 million, decreased by
Baht 74,002 million or 6.2% from the year-ended 2014. This decrease was mainly from the net effect of the
followings:
: Long-term loans (including the current portion within 1 year) decreased by Baht 27,054 million or 3.9%.
The decrease was mainly from the long-term loan repayment and bond redemption totaling Baht 55,612 million,
mainly due to PTT, PTTGC and TOP. However, during the period, there were additional long-term loans totaling
Baht 20,662 million, mainly from PTTGC and TOP. Furthermore, the Baht depreciation, compared with the year-
ended 2014, led to the increase in the foreign currency loans by Baht 7,616 million.
: A decrease of Baht 43,990 million or 14.3% in other current liabilities was primarily from repayment of
short-term loans from financial institutions and payment for income tax payable of PTTEP.
Equity
As of June 30, 2015, PTT and its subsidiaries had total shareholders’ equity of Baht 1,122,628 million,
increased by Baht 67,934 million or 6.4% from the year-ended 2014 principally from
: The increase of Baht 31,665 million in retained earnings resulted from an increase of Baht 46,330 million
in PTT and its subsidiaries’ net income in 1H/2015. However, there were payments of dividends for the second
half-year performances of 2014 by Baht 14,265 million.
: Non-controlling interests increased by Baht 27,338 million.
: Other comprehensive income increased by Baht 8,930 million.
Economic Overview
Non-recurring items
Overall Performance Segm
entation Performance Analysis of Financial Position
Economic Outlook

PTT Public Company Limited 23
Q2/2015
Liquidity
For the six-month period ended June 30, 2015, PTT and its subsidiaries had net decrease in cash and cash equivalents amounting to Baht 61,547 million, and cash and cash equivalents at the beginning of the period was Baht 234,212 million. As a result, cash and cash equivalents at the end of the period was Baht 172,665 million. Details of cash flow by activities are as follows:
Net cash provided by operating activities 126,364 Net cash used in investing activities (113,352)Net cash used in financing activities (72,528)Effects of exchange rates on cash and cash equivalents (151)Currency translation differences (1,833)Cash and cash equivalents attributable to non-current assets held-for-sale (47)
Net decrease in cash and cash equivalents during the period (61,547)Cash and cash equivalents at the beginning of the period 234,212
Cash and cash equivalents at the end of the period 172,665
Unit: Million Baht
Net cash provided by operating activities of Baht 126,364 million was derived from Baht 46,330 million
of net profit attributable to equity holders of the company, adjusted by net profit to net cash provided (used in) by
operating activities. The increase in net cash flow from operating activities mainly resulted from Baht 72,835 million
of depreciation and amortization expenses, Baht 20,760 million of net profit attributable to non-controlling
interests, Baht 15,722 million of finance costs, and Baht 12,440 million of income taxes expenses. However, the
decrease in net cash flow from operating activities was mainly from reversal of allowance for loss on decline in
value of inventories amounting to Baht 10,192 million, together with Baht 865 million of changes in net operating
assets and Baht 32,429 million of income taxes paid.
Net cash used in investing activities was Baht 113,352 million resulting mainly from the followings:
: The net cash outflow of investments in property, plant and equipment, intangible assets, and mining
properties amounting to Baht 84,977 million mainly due to the additional investments of PTTEP in petroleum
exploration and production assets mainly from the investments in Myanmar Zawtika, Arthit, and Bongkot projects.
In addition, there were investments in various projects of PTT principally from the 4th natural gas transmission
pipeline projects, as well as investment in UHV project of IRPC.
: The decrease in current investments amounting to Baht 52,030 million, mainly from an increase in fixed
deposits and current investments of PTTEP, PTTGC and GPSC.
Economic Overview
Non-recurring items
Overall Performance Segm
entation Performance Analysis of Financial Position
Economic Outlook

PTT Public Company Limited 24
Q2/2015
: The net cash received from long-term investments amounting to Baht 13,938 million, mainly due to cash
received from selling investment in BCP amounting to Baht 13,491 million. However, there were the payments of
long-term investments principally due to GPSC’s investment in Ichinoseki Solar Power 1 GK, power plant in Japan,
amounting to Baht 274 million. In addition, there were additional investments in joint ventures and associates of
GPSC and IRPC.
Net cash used by financing activities was Baht 72,528 million resulting mainly from the followings:
: The repayment of loans and debentures totaling Baht 65,454 million, principally from PTT, TOP and
PTTGC.
: Dividend paid amounting to Baht 20,295 million.
: Cash paid for finance cost amounting to Baht 16,924 million.
: Cash received from the proceeds from loans totaling to Baht 20,612 million, mainly derived from PTTGC
and TOP.
Economic Overview
Non-recurring items
Overall Performance Segm
entation Performance Analysis of Financial Position
Economic Outlook

PTT Public Company Limited 25
Q2/2015
Financial ratios and earnings per share of PTT and its subsidiaries
Profitability Ratios
Gross profit margin % 10.63 12.03
Net profit margin % 5.64 6.38
Solvency Ratios
Interest coverage Times 11.10 9.38
Earnings per share
Earnings per share Baht/share 20.24 16.08
Financial Ratio and Earnings per share Unit 1H/2014 1H/2015
Financial Ratio Unit 31 Dec 2014 30 June 2015
Liquidity Ratios
Current ratio Times 1.71 2.03
Quick ratio Times 1.20 1.39
Solvency Ratios
Debt to equity Times 0.69 0.61
Note:
Gross profit margin = Gross profit divided by Sales and service income
Net profit margin = Net profit (including Non-controlling interests) divided by Sales and service income
Interest coverage = (Net cash flow from operating activities + Taxes paid from operating activities) divided by Interest paid from financing activities
Current ratio = Current assets divided by Current liabilities
Quick ratio = (Cash and cash equivalent + Current investments + Accounts receivable) divided by Current Liabilities
Debt to equity = Interest bearing debt divided by Total shareholder’s equity
Economic Overview
Non-recurring items
Overall Performance Segm
entation Performance Analysis of Financial Position
Economic Outlook

PTT Public Company Limited 26
Q2/2015
Economic Outlook in the third quarter of 2015
The world economy in the third quarter of 2015 (Q3/2015) is expected to expand at a similar pace as Q2/2015 mainly from the advance economies such as the US where the economy has been improving continuously especially from consumption and employment activities causing Federal Reserve (Fed) to signal the increase in policy rate within the second half of the year. In addition, economies within the Eurozone continue to recover from the support of the QE program by the ECB, which helps the Euro to weaken, thus benefit exports. Moreover, the issue with Greece’s debt crisis began to ease after the Greek parliament approved the draft bill to carry out tough reforms in exchange for a three-year international bailout worth 86 billion euros. For developing and emerging economies, growth momentums are expected to remain largely the same, especially for China. The easing of monetary policy by China’s central bank and the accelerated investment by the government are the key factors that will help China’s economy maintain its growth target at 7.0%. However, risk factors that need to be monitored include political and geopolitical tensions within several regions, effects from the Chinese financial market volatilities and the hiking of the Federal Reserve’s policy rate.
Global oil demand in 2015 is forecasted to grow by 1.4 MMBD reaching a total of 94.0 MMBD according to the IEA report in July 2015 mainly driven by an increase in oil demand from developing countries while demands from developed countries such as Europe and US only slightly increased from previous year. Despite the increased oil demand compared to the year 2014, US shale oil and OPEC production is expected to remain at a high level. As a result, crude oil price in 2015 is estimated to average in the range of US$50-60 per barrel owing to a continued supply surplus. However oil price is expected to gradually increase in the second half of the year as the drop in price could cause high cost producers to reduce their production thus improve the oversupply condition. Moreover lower oil price should also boost global oil demand.
GRM in Singapore in 2015 is estimated to average in the range of US$8-9 per barrel, slightly increased from 2014.
Olefins prices in Q3 / 2 0 1 5 are on a downward trend due to the restart of production units from maintenances as well as from the sluggish demand for plastic. As a result, HDPE and PP prices are expected to be US$ 1 ,341 and US$ 1 ,270 per ton respectively. Meanwhile, Aromatics prices tend to be stable as demand outlook remains bearish but supported by the possibility of delay in startups of some petrochemical plants. BZ and PX prices are to stay at US$ 802 and US$ 915 per ton respectively.
Thai economy in Q3/2015 is expected to expand at a similar pace as Q2/2015, driven primarily by the accelerated disbursement of the government investment and from the tourism sectors. On the other hand, private consumption still remain weak as agricultural earnings drop from the effect of the drought. The government therefore has to implement various measures totaling 30 billion baht in order to help troubled farmers. Nevertheless, risk factors that need to be monitored include delays in government investment projects, and the recovery of exports.
Economic Overview
Non-recurring items
Overall Performance Segm
entation Performance Analysis of Financial Position
Economic Outlook

PTT Public Company Limited 27
Q2/2015
Appendix
Natural Gas Business consists of PTT natural gas business unit, PTT Natural Gas Distribution Co., Ltd. (PTTNGD), PTT LNG Co., Ltd (PTTLNG), and PTT FLNG Limited, which is a joint venture of PTT International (Singapore) Pte. Ltd. (a subsidiary of PTTER) with 50% shareholding interest and a joint venture of PTTEP FLNG Holding Company
Limited (a subsidiary of PTTEP) with 50% shareholding interest. PTT FLNG is currently under business dissolution.
Oil Business consists of PTT oil business unit, PTT (Cambodia) Co., Ltd. (PTTCL), Subic Bay Energy Co., Ltd. (SBECL), PTT Tank Terminal Co., Ltd. (PTT TANK), PTT Retail Business Co., Ltd. (PTTRB), consolidating Thai Lube Blending Company Limited (TLBC) due to the 100% TLBC’s shareholding acquisition by PTTRB and PTT,
and PTT Oil Myanmar Co., Ltd. (PTTOM).
International Trading Business consists of PTT international business unit and PTT International Trading Pte Ltd (PTTT).
Petrochemical Business consists of PTT Global Chemical Public Company Limited (PTTGC), PTT Polymer Marketing Co., Ltd. (PTTPM), PTT Polymer Logistics Co., Ltd. (PTTPL), PTT Maintenance and Engineering Co.,
Ltd. and PTT PMMA Co., Ltd. (PTTPMMA).
Refinery Business consists of Thai Oil Public Company Limited (TOP), IRPC Public Company Limited (IRPC), and Thai Oil Power Co., Ltd. (TP).
Coal Business consists of Sakari Resources Ltd. (SAR), Straits (Brunei) Pte Ltd (Straits (Brunei)), and Yoxford Holdings (95.26% shareholding in SAR and 100% shareholdings in the others, held by PTT Mining Limited
(PTTML), a 100% shareholding subsidiary of PTT Energy Resources Company Limited (PTTER)).
Infrastructure Business consists of Global Power Synergy Public Company Limited (GPSC), PTT Energy Solution Co., Ltd. (PTTES) and Energy Complex Co., Ltd. (EnCo).
Other Business consists of Business Services Alliance Co., Ltd. (BSA), PTT Green Energy Pte . Ltd. (PTTGE), PTT Energy Resources Company Limited (PTTER), and PTT Regional Treasury Center Pte. Ltd. (PTTRTC) and PTT
ICT Solution Co., Ltd. (PTTICT).
Earnings per share is calculated by dividing net income attributable to ordinary shareholders by the weighted average number of ordinary shares which are held by third parties during the periods.