management’s - cloud object storage | store & retrieve … · 2017-11-23 · management’s...
TRANSCRIPT
FOR THE THIRD QUARTER ENDING
SEPTEMBER 30, 2017
MANAGEMENT’S
DISCUSSION &
ANALYSIS
Q 3 2 0 1 7 M D & A P a g e | 1
ADVISORIES
Management’s discussion and analysis (“MD&A”) is Ikkuma Resources Corp.’s (“Ikkuma” or the “Corporation”) explanation of its financial performance for the period covered by the financial statements along with an analysis of the Corporation’s financial position. Comments relate to and should be read in conjunction with the audited financial statements of the Corporation for the year ended December 31, 2016 and the unaudited condensed interim financial statements as at and for the three and nine months ended September 30, 2017 and 2016. This MD&A is dated November 22, 2017 and based on information available to that date. All figures provided herein and in the September 30, 2017 unaudited condensed interim financial statements are reported in Canadian dollars.
FORWARD-LOOKING STATEMENTS
Ikkuma is a Canadian-based corporation whose common shares are traded on the TSX Venture Exchange (“TSX-V”) under the symbol
“IKM”. This MD&A contains forward-looking statements. The use of any of the words “expect”, “anticipate”, “continue”, “estimate”,
“objective”, “ongoing”, “may”, “will”, “project”, “should”, “believe”, “plans”, “intends” and similar expressions are intended to identify
forward-looking statements or information. Management’s assessment of future plans and operations, drilling plans, and the timing
thereof, plans for the tie-in and completion of wells and the timing thereof, capital expenditures, timing of capital expenditures, and
methods of financing capital expenditures and the ability to fund financial liabilities, production estimates, expected commodity mix
and prices, future operating costs, future transportation costs, expected royalty rates, general and administrative expenses, interest
rates, debt levels, funds from operations and the timing of and impact of implementing accounting policies, estimates regarding
undeveloped land position and estimated future drilling, recompletion, or reactivation locations and anticipated impact on the
Corporation’s forecasts in respect of capital expenditures may constitute forward-looking statements under applicable securities laws
and necessarily involve risks including, without limitation, risks associated with oil and gas exploration, development, exploitation,
production, marketing and transportation, loss of markets, volatility of commodity prices, currency fluctuations, imprecision of reserve
estimates, environmental risks, competition from other producers, inability to retain drilling rigs and other services, incorrect
assessment of the value of acquisitions, failure to realize the anticipated benefit of acquisitions, the inability to fully realize the benefits
of acquisitions, delays resulting from or inability to obtain required regulatory approvals and inability to access sufficient capital from
internal and external sources. As a consequence, the Corporation’s actual results may differ materially from those expressed in, or
implied by, the forward-looking statements. Forward-looking statements or information is based on a number of factors and
assumptions which have been used to develop such statements and information but which may prove to be incorrect. Although the
Corporation believes that the expectations reflected in such forward-looking statements or information are reasonable, undue reliance
should not be placed on forward-looking statements and information but which may prove to be incorrect. Although the Corporation
believes that the expectations reflected in such forward-looking statements or information are reasonable, undue reliance should not
be placed on forward-looking statements because the Corporation can give no assurance that such expectations will prove to be correct.
In addition to other factors and assumptions which may be identified in this document and other documents filed by the Corporation,
assumptions have been made regarding, among other things: the impact of increasing competition; the general stability of the
economic and political environment in which the Corporation operates; the ability of the Corporation to obtain qualified staff,
equipment and services in a timely and cost efficient manner; drilling results; the ability of the operator of the projects which the
Corporation has an interest in to operate the field in a safe, efficient and effective manner; the Corporation’s ability to obtain financing
on acceptable terms; changes in the Corporation’s banking facility; field production rates and decline rates; the ability to reduce
operating costs; the ability to replace and expand oil and natural gas reserves through acquisition, development or exploration; the
timing and costs of pipeline, storage and facility construction and expansion; the ability of the Corporation to secure adequate product
transportation; future petroleum and natural gas prices; currency exchange and interest rates; the regulatory framework regarding
royalties, taxes, and environmental matters in the jurisdictions in which the Corporation operates; and the Corporation’s ability to
successfully market its petroleum and natural gas products. Readers are cautioned that the foregoing list of factors is not exhaustive.
Additional information on these and other factors that could affect the Corporation’s operations and financial results are included in
reports on file with Canadian securities regulatory authorities and may be accessed through the SEDAR website (www.sedar.com) or
at the Corporation’s website (www.ikkumarescorp.com). Furthermore, the forward-looking statements contained in this document are
made as at the date of this document and the Corporation does not undertake any obligation to update publicly or to revise any of the
included forward-looking statements, whether as a result of new information, future events, or otherwise, except as may be required
by applicable securities laws.
Q 3 2 0 1 7 M D & A P a g e | 2
CONVERSIONS
The oil and gas industry commonly expresses production volumes and reserves on a “barrel of oil equivalent” basis (“boe”) whereby
natural gas volumes are converted at the ratio of six thousand cubic feet to one barrel of oil. The intention is to sum oil and natural gas
measurement units into one basis for improved analysis of results and comparisons with other industry participants.
Throughout this MD&A the Corporation has used the 6:1 boe measure which is the approximate energy equivalency of the two
commodities during combustion. Boe does not represent a value equivalency at the wellhead nor at the plant gate which is where the
Corporation sells its production volumes, and therefore, may be a misleading measure, particularly if used in isolation. Given that the
value ratio based on the current price of crude oil as compared to natural gas is significantly different from the energy equivalency of
6:1, utilizing a 6:1 conversion may be misleading as an indication of value.
NON-IFRS MEASURES
FUNDS FROM OPERATIONS
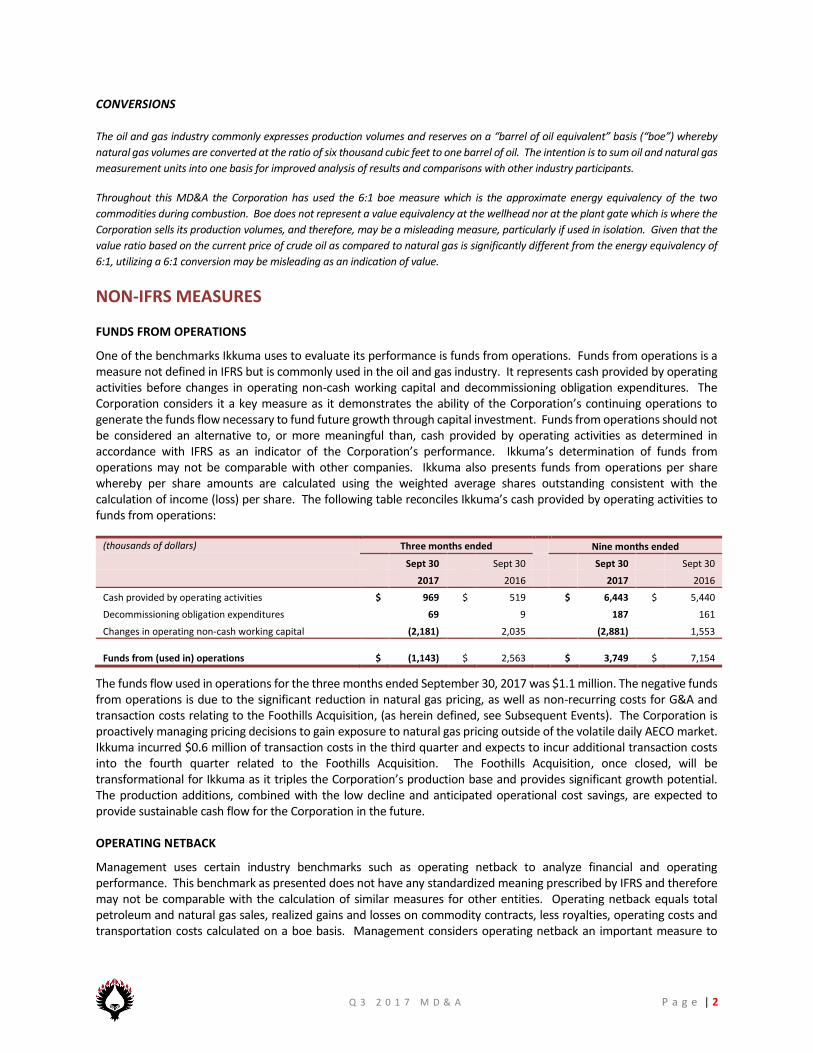
One of the benchmarks Ikkuma uses to evaluate its performance is funds from operations. Funds from operations is a measure not defined in IFRS but is commonly used in the oil and gas industry. It represents cash provided by operating activities before changes in operating non-cash working capital and decommissioning obligation expenditures. The Corporation considers it a key measure as it demonstrates the ability of the Corporation’s continuing operations to generate the funds flow necessary to fund future growth through capital investment. Funds from operations should not be considered an alternative to, or more meaningful than, cash provided by operating activities as determined in accordance with IFRS as an indicator of the Corporation’s performance. Ikkuma’s determination of funds from operations may not be comparable with other companies. Ikkuma also presents funds from operations per share whereby per share amounts are calculated using the weighted average shares outstanding consistent with the calculation of income (loss) per share. The following table reconciles Ikkuma’s cash provided by operating activities to funds from operations:
(thousands of dollars) Three months ended Nine months ended
Sept 30 Sept 30 Sept 30 Sept 30 2017 2016 2017 2016
Cash provided by operating activities $ 969 $ 519 $ 6,443 $ 5,440
Decommissioning obligation expenditures 69 9 187 161
Changes in operating non-cash working capital (2,181) 2,035 (2,881) 1,553
Funds from (used in) operations $ (1,143) $ 2,563 $ 3,749 $ 7,154
The funds flow used in operations for the three months ended September 30, 2017 was $1.1 million. The negative funds from operations is due to the significant reduction in natural gas pricing, as well as non-recurring costs for G&A and transaction costs relating to the Foothills Acquisition, (as herein defined, see Subsequent Events). The Corporation is proactively managing pricing decisions to gain exposure to natural gas pricing outside of the volatile daily AECO market. Ikkuma incurred $0.6 million of transaction costs in the third quarter and expects to incur additional transaction costs into the fourth quarter related to the Foothills Acquisition. The Foothills Acquisition, once closed, will be transformational for Ikkuma as it triples the Corporation’s production base and provides significant growth potential. The production additions, combined with the low decline and anticipated operational cost savings, are expected to provide sustainable cash flow for the Corporation in the future.
OPERATING NETBACK
Management uses certain industry benchmarks such as operating netback to analyze financial and operating performance. This benchmark as presented does not have any standardized meaning prescribed by IFRS and therefore may not be comparable with the calculation of similar measures for other entities. Operating netback equals total petroleum and natural gas sales, realized gains and losses on commodity contracts, less royalties, operating costs and transportation costs calculated on a boe basis. Management considers operating netback an important measure to
Q 3 2 0 1 7 M D & A P a g e | 3
evaluate its operational performance as it demonstrates its field level profitability relative to current commodity prices. The calculation of Ikkuma’s netbacks can be seen below in the Operating Netbacks section.
RESULTS OF OPERATIONS
PRODUCTION
Three months ended Nine months ended
Sept 30 Sept 30 Sept 30 Sept 30 2017 2016 2017 2016
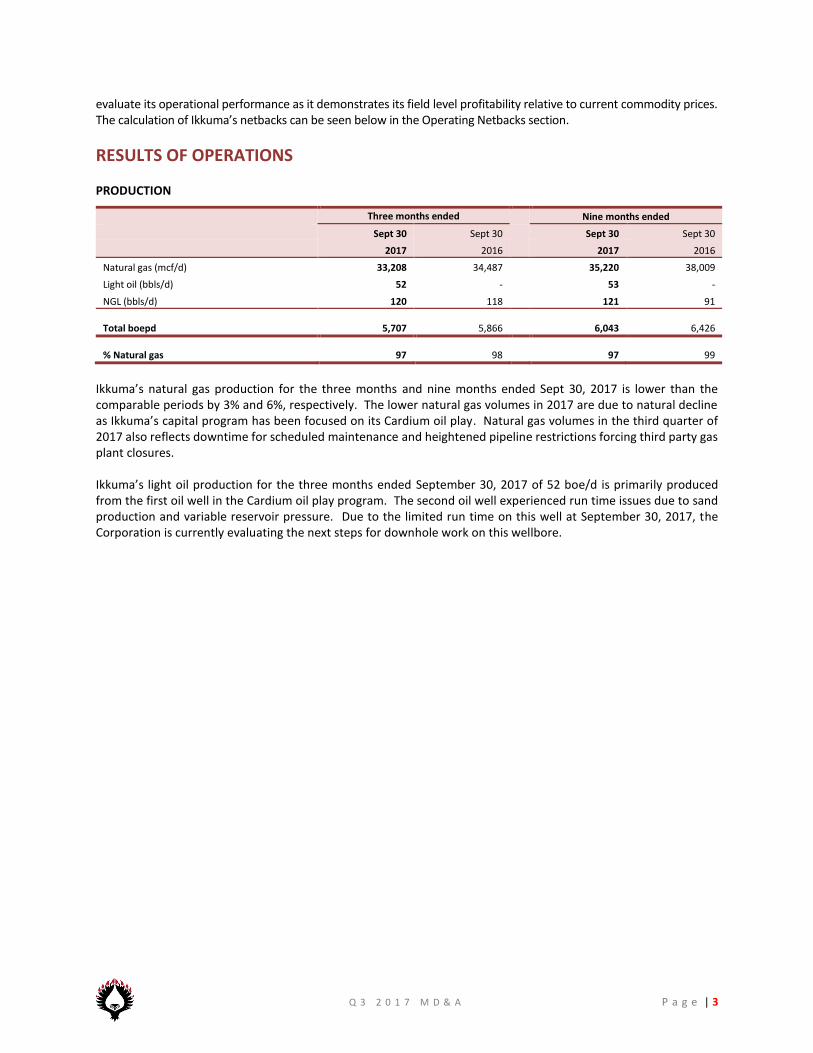
Natural gas (mcf/d) 33,208 34,487 35,220 38,009
Light oil (bbls/d) 52 - 53 -
NGL (bbls/d) 120 118 121 91
Total boepd 5,707 5,866 6,043 6,426
% Natural gas 97 98 97 99
Ikkuma’s natural gas production for the three months and nine months ended Sept 30, 2017 is lower than the comparable periods by 3% and 6%, respectively. The lower natural gas volumes in 2017 are due to natural decline as Ikkuma’s capital program has been focused on its Cardium oil play. Natural gas volumes in the third quarter of 2017 also reflects downtime for scheduled maintenance and heightened pipeline restrictions forcing third party gas plant closures.
Ikkuma’s light oil production for the three months ended September 30, 2017 of 52 boe/d is primarily produced from the first oil well in the Cardium oil play program. The second oil well experienced run time issues due to sand production and variable reservoir pressure. Due to the limited run time on this well at September 30, 2017, the Corporation is currently evaluating the next steps for downhole work on this wellbore.
Q 3 2 0 1 7 M D & A P a g e | 4
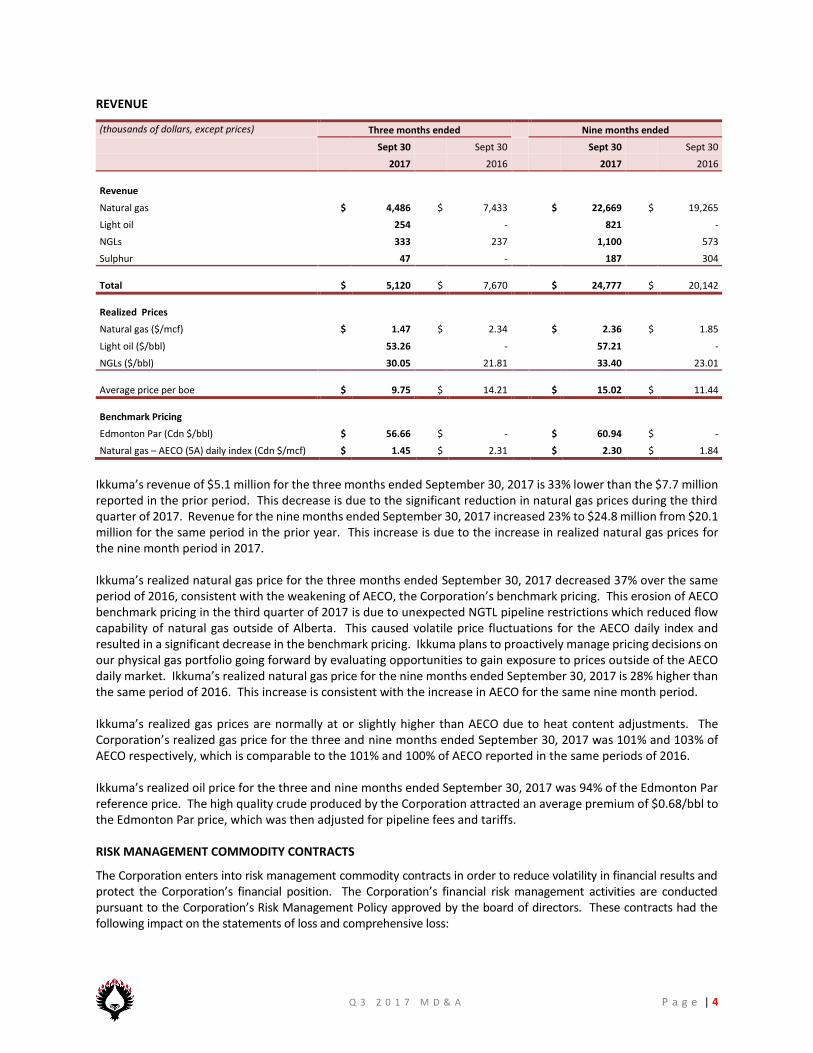
REVENUE
(thousands of dollars, except prices) Three months ended Nine months ended
Sept 30 Sept 30 Sept 30 Sept 30
2017 2016 2017 2016
Revenue
Natural gas $ 4,486 $ 7,433 $ 22,669 $ 19,265
Light oil 254 - 821 -
NGLs 333 237 1,100 573
Sulphur 47 - 187 304
Total $ 5,120 $ 7,670 $ 24,777 $ 20,142
Realized Prices
Natural gas ($/mcf) $ 1.47 $ 2.34 $ 2.36 $ 1.85
Light oil ($/bbl) 53.26 - 57.21 -
NGLs ($/bbl) 30.05 21.81 33.40 23.01
Average price per boe $ 9.75 $ 14.21 $ 15.02 $ 11.44
Benchmark Pricing
Edmonton Par (Cdn $/bbl) $ 56.66 $ - $ 60.94 $ -
Natural gas – AECO (5A) daily index (Cdn $/mcf) $ 1.45 $ 2.31 $ 2.30 $ 1.84
Ikkuma’s revenue of $5.1 million for the three months ended September 30, 2017 is 33% lower than the $7.7 million reported in the prior period. This decrease is due to the significant reduction in natural gas prices during the third quarter of 2017. Revenue for the nine months ended September 30, 2017 increased 23% to $24.8 million from $20.1 million for the same period in the prior year. This increase is due to the increase in realized natural gas prices for the nine month period in 2017.
Ikkuma’s realized natural gas price for the three months ended September 30, 2017 decreased 37% over the same period of 2016, consistent with the weakening of AECO, the Corporation’s benchmark pricing. This erosion of AECO benchmark pricing in the third quarter of 2017 is due to unexpected NGTL pipeline restrictions which reduced flow capability of natural gas outside of Alberta. This caused volatile price fluctuations for the AECO daily index and resulted in a significant decrease in the benchmark pricing. Ikkuma plans to proactively manage pricing decisions on our physical gas portfolio going forward by evaluating opportunities to gain exposure to prices outside of the AECO daily market. Ikkuma’s realized natural gas price for the nine months ended September 30, 2017 is 28% higher than the same period of 2016. This increase is consistent with the increase in AECO for the same nine month period.
Ikkuma’s realized gas prices are normally at or slightly higher than AECO due to heat content adjustments. The Corporation’s realized gas price for the three and nine months ended September 30, 2017 was 101% and 103% of AECO respectively, which is comparable to the 101% and 100% of AECO reported in the same periods of 2016.
Ikkuma’s realized oil price for the three and nine months ended September 30, 2017 was 94% of the Edmonton Par reference price. The high quality crude produced by the Corporation attracted an average premium of $0.68/bbl to the Edmonton Par price, which was then adjusted for pipeline fees and tariffs.
RISK MANAGEMENT COMMODITY CONTRACTS
The Corporation enters into risk management commodity contracts in order to reduce volatility in financial results and protect the Corporation’s financial position. The Corporation’s financial risk management activities are conducted pursuant to the Corporation’s Risk Management Policy approved by the board of directors. These contracts had the following impact on the statements of loss and comprehensive loss:
Q 3 2 0 1 7 M D & A P a g e | 5
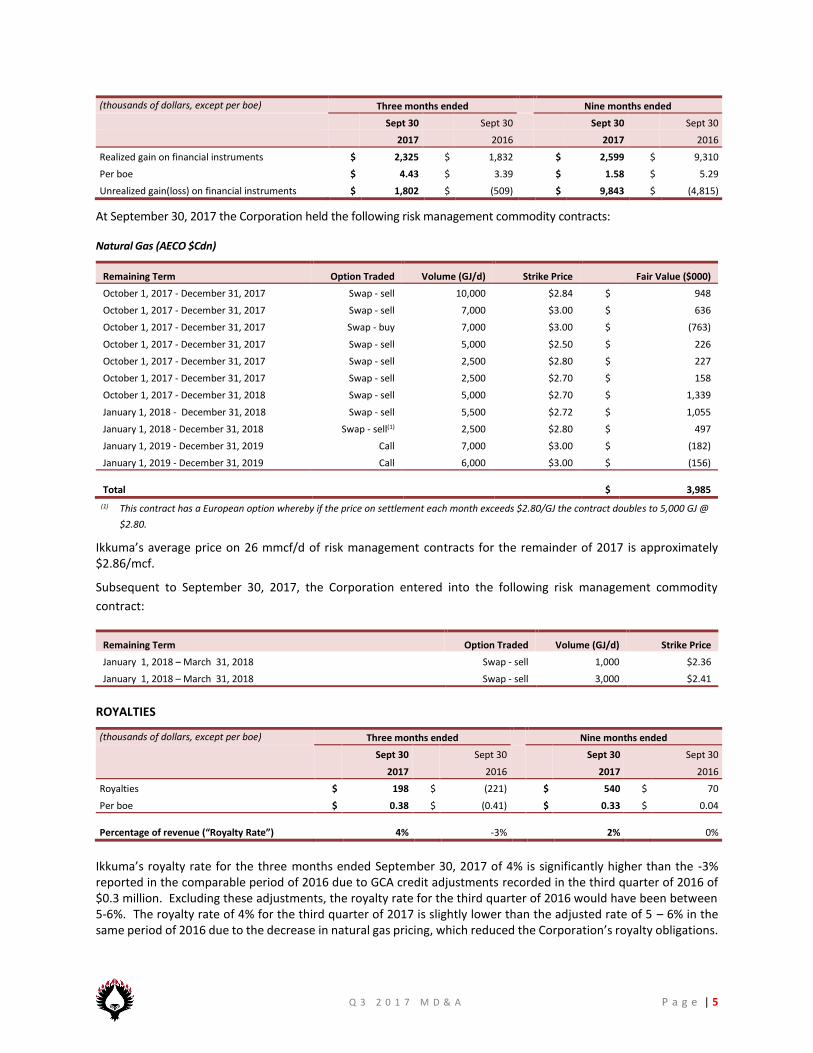
(thousands of dollars, except per boe) Three months ended Nine months ended
Sept 30 Sept 30 Sept 30 Sept 30 2017 2016 2017 2016
Realized gain on financial instruments $ 2,325 $ 1,832 $ 2,599 $ 9,310
Per boe $ 4.43 $ 3.39 $ 1.58 $ 5.29
Unrealized gain(loss) on financial instruments $ 1,802 $ (509) $ 9,843 $ (4,815)
At September 30, 2017 the Corporation held the following risk management commodity contracts:
Natural Gas (AECO $Cdn)
Remaining Term Option Traded Volume (GJ/d) Strike Price Fair Value ($000)
October 1, 2017 - December 31, 2017 Swap - sell 10,000 $2.84 $ 948
October 1, 2017 - December 31, 2017 Swap - sell 7,000 $3.00 $ 636
October 1, 2017 - December 31, 2017 Swap - buy 7,000 $3.00 $ (763)
October 1, 2017 - December 31, 2017 Swap - sell 5,000 $2.50 $ 226
October 1, 2017 - December 31, 2017 Swap - sell 2,500 $2.80 $ 227
October 1, 2017 - December 31, 2017 Swap - sell 2,500 $2.70 $ 158
October 1, 2017 - December 31, 2018 Swap - sell 5,000 $2.70 $ 1,339
January 1, 2018 - December 31, 2018 Swap - sell 5,500 $2.72 $ 1,055
January 1, 2018 - December 31, 2018 Swap - sell(1) 2,500 $2.80 $ 497
January 1, 2019 - December 31, 2019 Call 7,000 $3.00 $ (182)
January 1, 2019 - December 31, 2019 Call 6,000 $3.00 $ (156)
Total $ 3,985
(1) This contract has a European option whereby if the price on settlement each month exceeds $2.80/GJ the contract doubles to 5,000 GJ @
$2.80.
Ikkuma’s average price on 26 mmcf/d of risk management contracts for the remainder of 2017 is approximately $2.86/mcf.
Subsequent to September 30, 2017, the Corporation entered into the following risk management commodity
contract:
Remaining Term Option Traded Volume (GJ/d) Strike Price
January 1, 2018 – March 31, 2018 Swap - sell 1,000 $2.36
January 1, 2018 – March 31, 2018 Swap - sell 3,000 $2.41
ROYALTIES
(thousands of dollars, except per boe) Three months ended Nine months ended
Sept 30 Sept 30 Sept 30 Sept 30 2017 2016 2017 2016
Royalties $ 198 $ (221) $ 540 $ 70
Per boe $ 0.38 $ (0.41) $ 0.33 $ 0.04
Percentage of revenue (“Royalty Rate”) 4% -3% 2% 0%
Ikkuma’s royalty rate for the three months ended September 30, 2017 of 4% is significantly higher than the -3% reported in the comparable period of 2016 due to GCA credit adjustments recorded in the third quarter of 2016 of $0.3 million. Excluding these adjustments, the royalty rate for the third quarter of 2016 would have been between 5-6%. The royalty rate of 4% for the third quarter of 2017 is slightly lower than the adjusted rate of 5 – 6% in the same period of 2016 due to the decrease in natural gas pricing, which reduced the Corporation’s royalty obligations.
Q 3 2 0 1 7 M D & A P a g e | 6
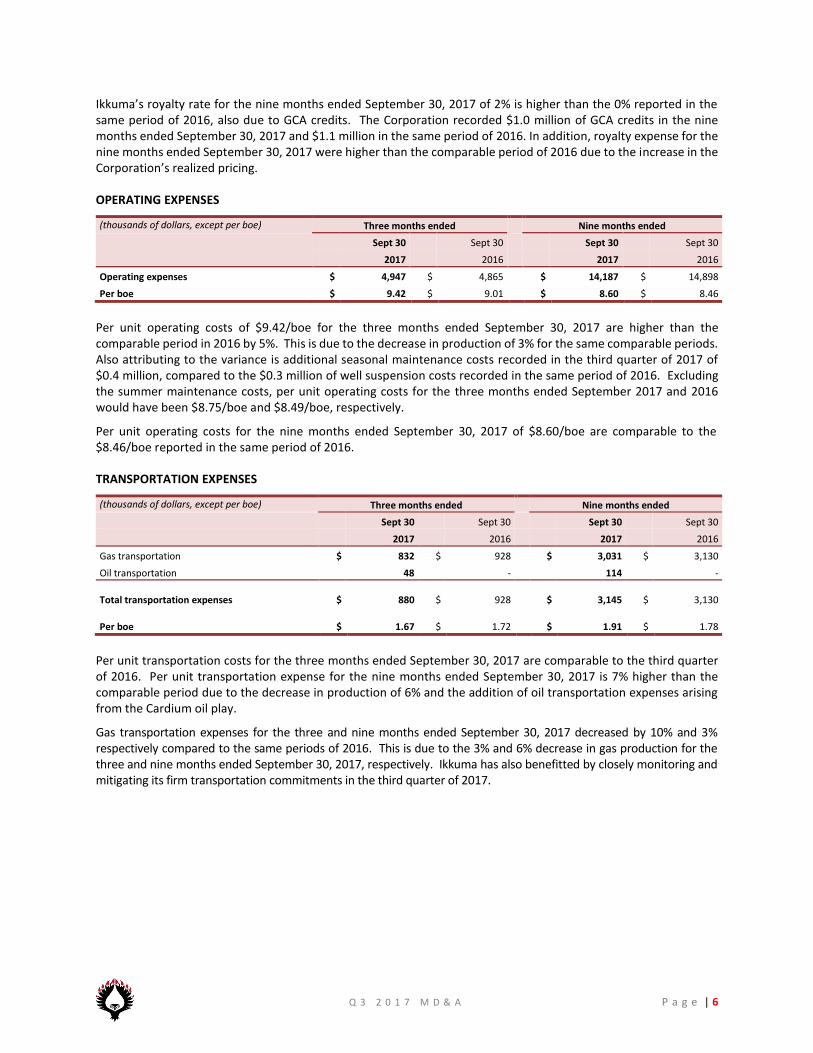
Ikkuma’s royalty rate for the nine months ended September 30, 2017 of 2% is higher than the 0% reported in the same period of 2016, also due to GCA credits. The Corporation recorded $1.0 million of GCA credits in the nine months ended September 30, 2017 and $1.1 million in the same period of 2016. In addition, royalty expense for the nine months ended September 30, 2017 were higher than the comparable period of 2016 due to the increase in the Corporation’s realized pricing.
OPERATING EXPENSES
(thousands of dollars, except per boe) Three months ended Nine months ended
Sept 30 Sept 30 Sept 30 Sept 30 2017 2016 2017 2016
Operating expenses $ 4,947 $ 4,865 $ 14,187 $ 14,898
Per boe $ 9.42 $ 9.01 $ 8.60 $ 8.46
Per unit operating costs of $9.42/boe for the three months ended September 30, 2017 are higher than the comparable period in 2016 by 5%. This is due to the decrease in production of 3% for the same comparable periods. Also attributing to the variance is additional seasonal maintenance costs recorded in the third quarter of 2017 of $0.4 million, compared to the $0.3 million of well suspension costs recorded in the same period of 2016. Excluding the summer maintenance costs, per unit operating costs for the three months ended September 2017 and 2016 would have been $8.75/boe and $8.49/boe, respectively.
Per unit operating costs for the nine months ended September 30, 2017 of $8.60/boe are comparable to the $8.46/boe reported in the same period of 2016.
TRANSPORTATION EXPENSES
(thousands of dollars, except per boe) Three months ended Nine months ended
Sept 30 Sept 30 Sept 30 Sept 30 2017 2016 2017 2016
Gas transportation $ 832 $ 928 $ 3,031 $ 3,130
Oil transportation 48 - 114 -
Total transportation expenses $ 880 $ 928 $ 3,145 $ 3,130
Per boe $ 1.67 $ 1.72 $ 1.91 $ 1.78
Per unit transportation costs for the three months ended September 30, 2017 are comparable to the third quarter of 2016. Per unit transportation expense for the nine months ended September 30, 2017 is 7% higher than the comparable period due to the decrease in production of 6% and the addition of oil transportation expenses arising from the Cardium oil play.
Gas transportation expenses for the three and nine months ended September 30, 2017 decreased by 10% and 3% respectively compared to the same periods of 2016. This is due to the 3% and 6% decrease in gas production for the three and nine months ended September 30, 2017, respectively. Ikkuma has also benefitted by closely monitoring and mitigating its firm transportation commitments in the third quarter of 2017.
Q 3 2 0 1 7 M D & A P a g e | 7
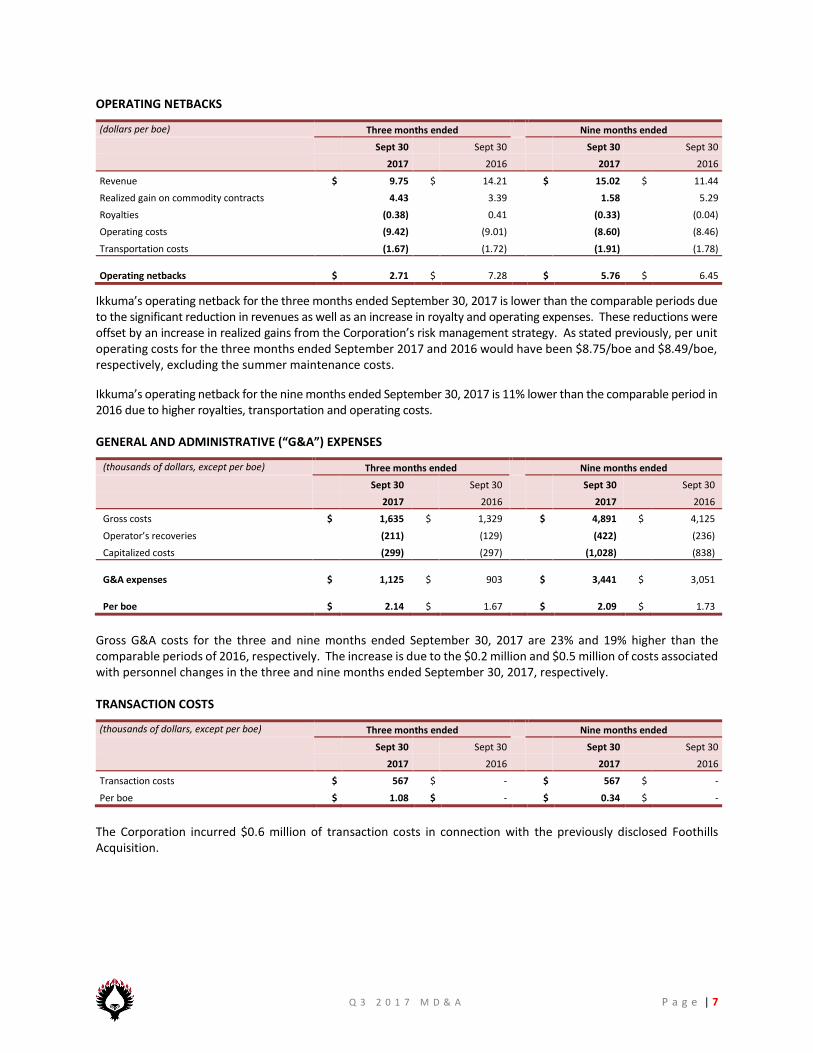
OPERATING NETBACKS
(dollars per boe) Three months ended Nine months ended
Sept 30 Sept 30 Sept 30 Sept 30 2017 2016 2017 2016
Revenue $ 9.75 $ 14.21 $ 15.02 $ 11.44
Realized gain on commodity contracts 4.43 3.39 1.58 5.29
Royalties (0.38) 0.41 (0.33) (0.04)
Operating costs (9.42) (9.01) (8.60) (8.46)
Transportation costs (1.67) (1.72) (1.91) (1.78)
Operating netbacks $ 2.71 $ 7.28 $ 5.76 $ 6.45
Ikkuma’s operating netback for the three months ended September 30, 2017 is lower than the comparable periods due to the significant reduction in revenues as well as an increase in royalty and operating expenses. These reductions were offset by an increase in realized gains from the Corporation’s risk management strategy. As stated previously, per unit operating costs for the three months ended September 2017 and 2016 would have been $8.75/boe and $8.49/boe, respectively, excluding the summer maintenance costs.
Ikkuma’s operating netback for the nine months ended September 30, 2017 is 11% lower than the comparable period in 2016 due to higher royalties, transportation and operating costs.
GENERAL AND ADMINISTRATIVE (“G&A”) EXPENSES
(thousands of dollars, except per boe) Three months ended Nine months ended
Sept 30 Sept 30 Sept 30 Sept 30
2017 2016 2017 2016
Gross costs $ 1,635 $ 1,329 $ 4,891 $ 4,125
Operator’s recoveries (211) (129) (422) (236)
Capitalized costs (299) (297) (1,028) (838)
G&A expenses $ 1,125 $ 903 $ 3,441 $ 3,051
Per boe $ 2.14 $ 1.67 $ 2.09 $ 1.73
Gross G&A costs for the three and nine months ended September 30, 2017 are 23% and 19% higher than the comparable periods of 2016, respectively. The increase is due to the $0.2 million and $0.5 million of costs associated with personnel changes in the three and nine months ended September 30, 2017, respectively.
TRANSACTION COSTS
(thousands of dollars, except per boe) Three months ended Nine months ended
Sept 30 Sept 30 Sept 30 Sept 30 2017 2016 2017 2016
Transaction costs $ 567 $ - $ 567 $ -
Per boe $ 1.08 $ - $ 0.34 $ -
The Corporation incurred $0.6 million of transaction costs in connection with the previously disclosed Foothills Acquisition.

Q 3 2 0 1 7 M D & A P a g e | 8
SHARE-BASED COMPENSATION
(thousands of dollars) Three months ended Nine months ended
Sept 30 Sept 30 Sept 30 Sept 30 2017 2016 2017 2016
Gross costs $ 325 $ 54 $ 429 $ 157
Capitalized costs (57) (12) (83) (34)
Total share-based compensation $ 268 $ 42 $ 346 $ 123
At September 30, 2017, the Corporation had 6,940,100 options outstanding with a weighted average exercise price of $0.90. The Corporation granted 6,159,500 stock options at an exercise price of $0.86 on June 8, 2017. As a result, share-based compensation for the three and nine months ended September increased substantially as compared to the same periods of 2016.
Stock options granted have a five year term to expiry and a three year vesting period from the date of grant.
DEPLETION AND DEPRECIATION
(thousands of dollars, except per boe) Three months ended Nine months ended
Sept 30 Sept 30 Sept 30 Sept 30 2017 2016 2017 2016
Depletion and depreciation expense $ 4,434 $ 4,067 $ 13,712 $ 13,385
Per boe $ 8.45 $ 7.54 $ 8.31 $ 7.60
Per unit depletion and depreciation expenses for the three months and nine months ended September 30, 2017 are 12% and 9% higher than the comparable periods of 2016. This reflects the impact of conservative initial reserve bookings in the fourth quarter of 2016 for the emerging Cardium oil play.
IMPAIRMENT
There were no impairment charges or recoveries recorded for the three or nine months ended September 30, 2017 as no indicators of impairment were identified. Commodity prices remain volatile, and accordingly, impairment charges or recoveries could be recorded in future periods.
Q 3 2 0 1 7 M D & A P a g e | 9
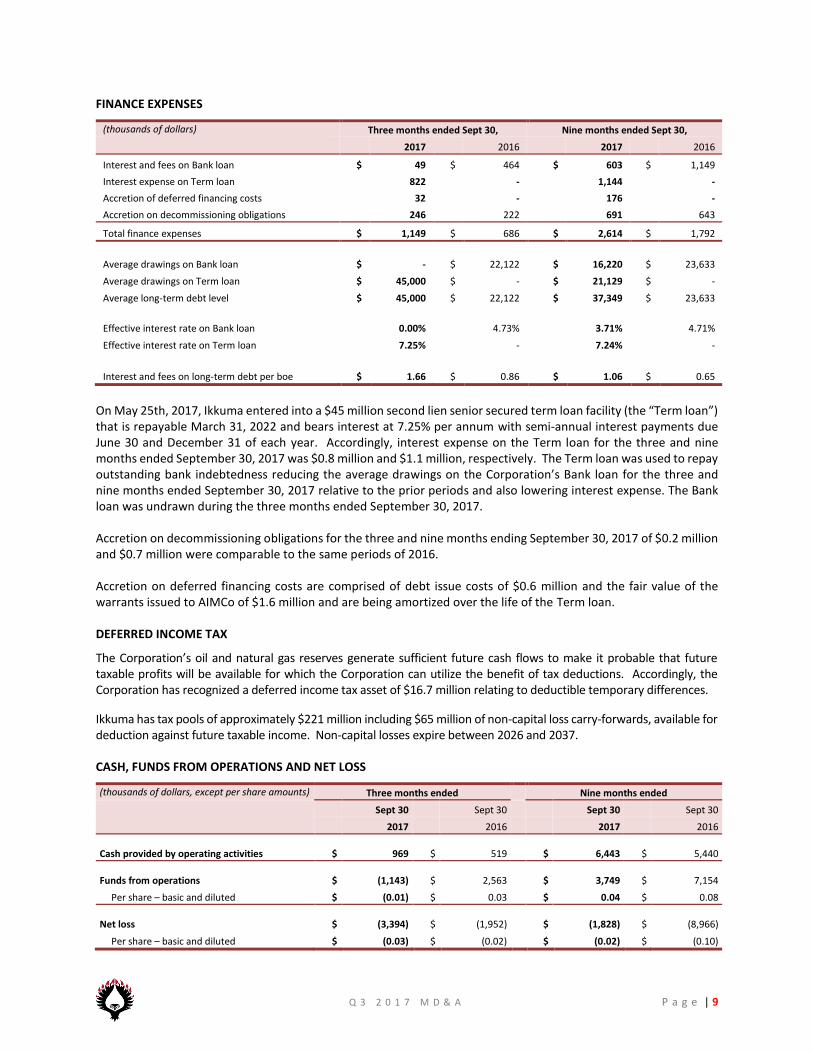
FINANCE EXPENSES
(thousands of dollars) Three months ended Sept 30, Nine months ended Sept 30, 2017 2016 2017 2016
Interest and fees on Bank loan $ 49 $ 464 $ 603 $ 1,149
Interest expense on Term loan 822 - 1,144 -
Accretion of deferred financing costs 32 - 176 -
Accretion on decommissioning obligations 246 222 691 643
Total finance expenses $ 1,149 $ 686 $ 2,614 $ 1,792
Average drawings on Bank loan $ - $ 22,122 $ 16,220 $ 23,633
Average drawings on Term loan $ 45,000 $ - $ 21,129 $ -
Average long-term debt level $ 45,000 $ 22,122 $ 37,349 $ 23,633
Effective interest rate on Bank loan 0.00% 4.73% 3.71% 4.71%
Effective interest rate on Term loan 7.25% - 7.24% -
Interest and fees on long-term debt per boe $ 1.66 $ 0.86 $ 1.06 $ 0.65
On May 25th, 2017, Ikkuma entered into a $45 million second lien senior secured term loan facility (the “Term loan”) that is repayable March 31, 2022 and bears interest at 7.25% per annum with semi-annual interest payments due June 30 and December 31 of each year. Accordingly, interest expense on the Term loan for the three and nine months ended September 30, 2017 was $0.8 million and $1.1 million, respectively. The Term loan was used to repay outstanding bank indebtedness reducing the average drawings on the Corporation’s Bank loan for the three and nine months ended September 30, 2017 relative to the prior periods and also lowering interest expense. The Bank loan was undrawn during the three months ended September 30, 2017.
Accretion on decommissioning obligations for the three and nine months ending September 30, 2017 of $0.2 million and $0.7 million were comparable to the same periods of 2016.
Accretion on deferred financing costs are comprised of debt issue costs of $0.6 million and the fair value of the warrants issued to AIMCo of $1.6 million and are being amortized over the life of the Term loan.
DEFERRED INCOME TAX
The Corporation’s oil and natural gas reserves generate sufficient future cash flows to make it probable that future taxable profits will be available for which the Corporation can utilize the benefit of tax deductions. Accordingly, the Corporation has recognized a deferred income tax asset of $16.7 million relating to deductible temporary differences.
Ikkuma has tax pools of approximately $221 million including $65 million of non-capital loss carry-forwards, available for deduction against future taxable income. Non-capital losses expire between 2026 and 2037.
CASH, FUNDS FROM OPERATIONS AND NET LOSS
(thousands of dollars, except per share amounts) Three months ended Nine months ended
Sept 30 Sept 30 Sept 30 Sept 30 2017 2016 2017 2016
Cash provided by operating activities $ 969 $ 519 $ 6,443 $ 5,440
Funds from operations $ (1,143) $ 2,563 $ 3,749 $ 7,154
Per share – basic and diluted $ (0.01) $ 0.03 $ 0.04 $ 0.08
Net loss $ (3,394) $ (1,952) $ (1,828) $ (8,966)
Per share – basic and diluted $ (0.03) $ (0.02) $ (0.02) $ (0.10)
Q 3 2 0 1 7 M D & A P a g e | 10
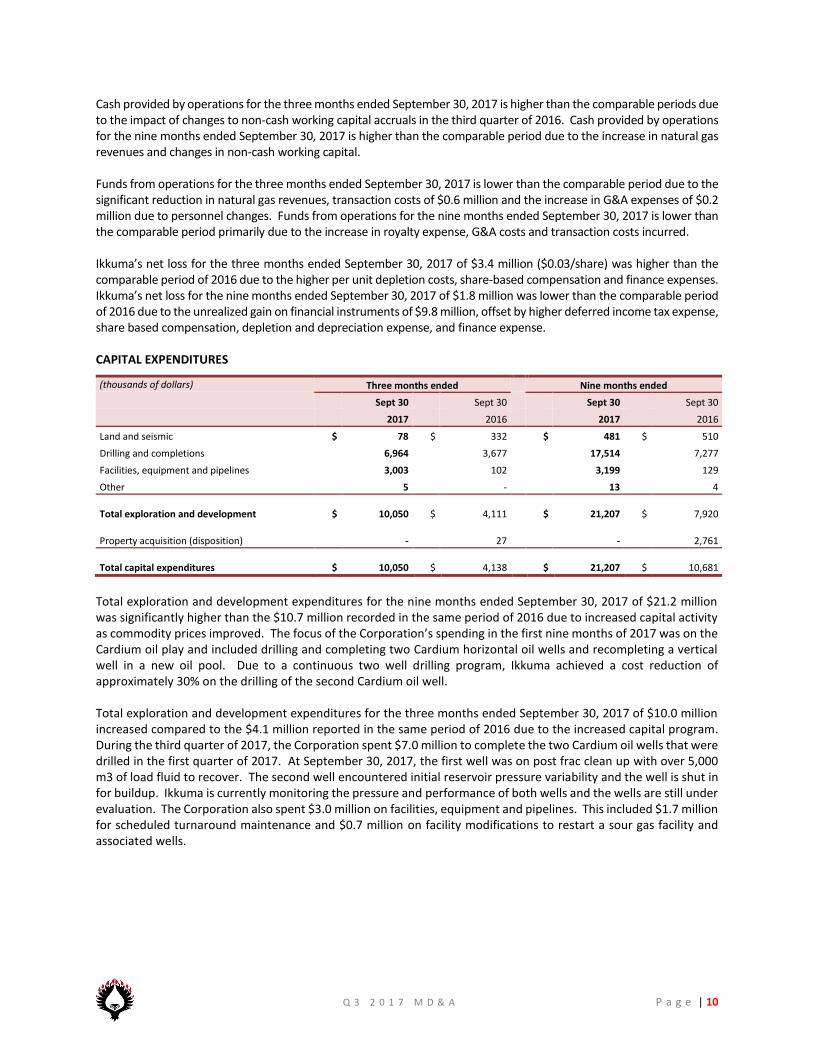
Cash provided by operations for the three months ended September 30, 2017 is higher than the comparable periods due to the impact of changes to non-cash working capital accruals in the third quarter of 2016. Cash provided by operations for the nine months ended September 30, 2017 is higher than the comparable period due to the increase in natural gas revenues and changes in non-cash working capital.
Funds from operations for the three months ended September 30, 2017 is lower than the comparable period due to the significant reduction in natural gas revenues, transaction costs of $0.6 million and the increase in G&A expenses of $0.2 million due to personnel changes. Funds from operations for the nine months ended September 30, 2017 is lower than the comparable period primarily due to the increase in royalty expense, G&A costs and transaction costs incurred.
Ikkuma’s net loss for the three months ended September 30, 2017 of $3.4 million ($0.03/share) was higher than the comparable period of 2016 due to the higher per unit depletion costs, share-based compensation and finance expenses. Ikkuma’s net loss for the nine months ended September 30, 2017 of $1.8 million was lower than the comparable period of 2016 due to the unrealized gain on financial instruments of $9.8 million, offset by higher deferred income tax expense, share based compensation, depletion and depreciation expense, and finance expense.
CAPITAL EXPENDITURES
(thousands of dollars) Three months ended Nine months ended
Sept 30 Sept 30 Sept 30 Sept 30 2017 2016 2017 2016
Land and seismic $ 78 $ 332 $ 481 $ 510
Drilling and completions 6,964 3,677 17,514 7,277
Facilities, equipment and pipelines 3,003 102 3,199 129
Other 5 - 13 4
Total exploration and development $ 10,050 $ 4,111
$ 21,207 $ 7,920
Property acquisition (disposition) - 27
- 2,761
Total capital expenditures $ 10,050 $ 4,138
$ 21,207 $ 10,681
Total exploration and development expenditures for the nine months ended September 30, 2017 of $21.2 million was significantly higher than the $10.7 million recorded in the same period of 2016 due to increased capital activity as commodity prices improved. The focus of the Corporation’s spending in the first nine months of 2017 was on the Cardium oil play and included drilling and completing two Cardium horizontal oil wells and recompleting a vertical well in a new oil pool. Due to a continuous two well drilling program, Ikkuma achieved a cost reduction of approximately 30% on the drilling of the second Cardium oil well.
Total exploration and development expenditures for the three months ended September 30, 2017 of $10.0 million increased compared to the $4.1 million reported in the same period of 2016 due to the increased capital program. During the third quarter of 2017, the Corporation spent $7.0 million to complete the two Cardium oil wells that were drilled in the first quarter of 2017. At September 30, 2017, the first well was on post frac clean up with over 5,000 m3 of load fluid to recover. The second well encountered initial reservoir pressure variability and the well is shut in for buildup. Ikkuma is currently monitoring the pressure and performance of both wells and the wells are still under evaluation. The Corporation also spent $3.0 million on facilities, equipment and pipelines. This included $1.7 million for scheduled turnaround maintenance and $0.7 million on facility modifications to restart a sour gas facility and associated wells.
Q 3 2 0 1 7 M D & A P a g e | 11
LIQUIDITY AND CAPITAL RESOURCES
LIQUIDITY RISK
Liquidity risk is the risk that the Corporation will not be able to meets its financial obligations as they become due. The Corporation’s approach to managing liquidity is to ensure that they will have sufficient liquidity to meet its short-term and long-term financial obligations when due, under both normal and unusual conditions, without incurring unacceptable losses or risking harm to the Corporation’s reputation.
The Corporation’s financial liabilities include accounts payable and accrued liabilities which are due within the next year. The Corporation also has a Term loan outstanding of $45 million, with a maturity date of March 31, 2022, and a fully undrawn credit facility of $25 million, which are subject to a debt to EBITDA ratio of 4.0 to 1 being maintained. At September 30, 2017, the Corporation has a debt to EBITDA ratio of 3.3 to 1 and is forecasting continued compliance with this covenant over the following twelve month period based on current expected acquisition and disposition activities. The ability of the Corporation to maintain the 4.0 to 1 covenant is predicated on certain natural gas prices being maintained and active management of the Corporation’s working capital balances, as the covenant restricts the Corporation’s ability to draw on the full available credit facility. While the Corporation believes it will be successful in maintaining the necessary debt to EBITDA ratio, there is uncertainty due to continued natural gas price volatility.
The Corporation will also need to spend $12.4 million of flow-through commitments.
To manage liquidity risk, the Corporation continues to explore all available options including non-core asset disposals, hedging future revenue, equity issuances and amend, revise or extend the terms of its Term loan and its Bank loan.
CAPITAL MANAGEMENT
The Corporation’s objective when managing capital is to maintain a flexible capital structure which will allow it to execute on its capital expenditure program, which includes expenditures on oil and gas activities which may or may not be successful. Therefore, the Corporation monitors the level of risk incurred in its capital expenditures to balance the proportion of debt and equity in its capital structure.
The Corporation considers its capital structure to include working capital, the Bank loan, Term loan and shareholders’ equity. Ikkuma’s primary capital management objective is to maintain a strong financial position in order to continue the future growth of the Corporation. Ikkuma monitors its capital structure and makes adjustments on an ongoing basis in order to maintain the flexibility needed to achieve the Corporation’s long-term objectives. To manage the capital structure the Corporation may adjust capital spending, hedge future revenue and costs, issue new equity, issue new debt, amend, revise or extend the terms of the existing Term loan and Bank loan or repay existing debt through non-core asset sales.
CAPITAL FUNDING
On May 25, 2017 Ikkuma entered into a $45 million second lien senior secured term loan facility (the "Term loan") with Alberta Investment Management Corporation (“AIMCo”) that is repayable March 31, 2022 and bears interest at 7.25% per annum. In conjunction with funding the Term loan, AIMCo received, for no additional consideration, 6,750,000 warrants to acquire common shares on a one for one basis, at an exercise price of $0.86 per share at any time prior to May 25, 2020.
The Corporation has a credit facility with a syndicate of Canadian banks consisting of a revolving line of credit of $10 million and an operating line of credit of $15 million collectively, (the “Facility”or “Bank loan”). Subsequent to September 30, 2017, the Syndicate completed its semi-annual review of the borrowing base with no changes to the Facility. The Facility revolves for a 364 day period and will be subject to its next 364 day extension at the next borrowing base review. If not extended, the Facility will cease to revolve, the margins thereunder will increase by 0.5 percent and all outstanding advances thereunder will become repayable in one year from the extension date. The available lending limits are reviewed semi-annually and are based on the bank syndicate’s interpretation of the Corporation’s reserves and future commodity prices. The Facility is secured by a floating charge debenture and a general security agreement on the assets

Q 3 2 0 1 7 M D & A P a g e | 12
of the Corporation. There can be no assurance that the amount of the available Facility will not be adjusted at the next scheduled borrowing base review on or before May 31, 2018.
The Corporation is subject to a quarterly financial covenant that the Corporation’s adjusted debt to EBITDA ratio for each quarter end is not to exceed 4.0 to 1. As at September 30, 2017, the Corporation is compliant with all Facility and Term loan covenants.
SHARE CAPITAL
Between September 1, 2017 and September 15, 2017, the Corporation completed a non-brokered private placement of 15,091,221 flow-through shares at a price of $0.82 per flow-through share, resulting in gross proceeds of $12.4 million. The implied premium on the flow-through shares was determined to be $1.7 million or $0.12 per flow-through share, assuming a market price of $0.70 per ordinary common share. Pursuant to the provisions of the Income Tax Act (Canada), the Corporation is committed to incur eligible Canadian exploration expenses after the closing date and prior to December 31, 2018 in the aggregate amount of not less than the total gross proceeds raised from the offering. Ikkuma shall renounce the Qualifying Expenditures of $12.4 million on or prior to December 31, 2017.
CONTRACTUAL OBLIGATIONS
Throughout the course of its ongoing business, the Corporation enters into various contractual obligations such as credit agreements, purchase of services, royalty agreements, operating agreements, processing agreements, right of way agreements and lease obligations for office space and field equipment. These obligations reflect market conditions prevailing at the time of contract. Ikkuma believes it has adequate sources of capital to fund all contractual obligations as they come due. The following are the obligations of the Corporation representing future commitments.
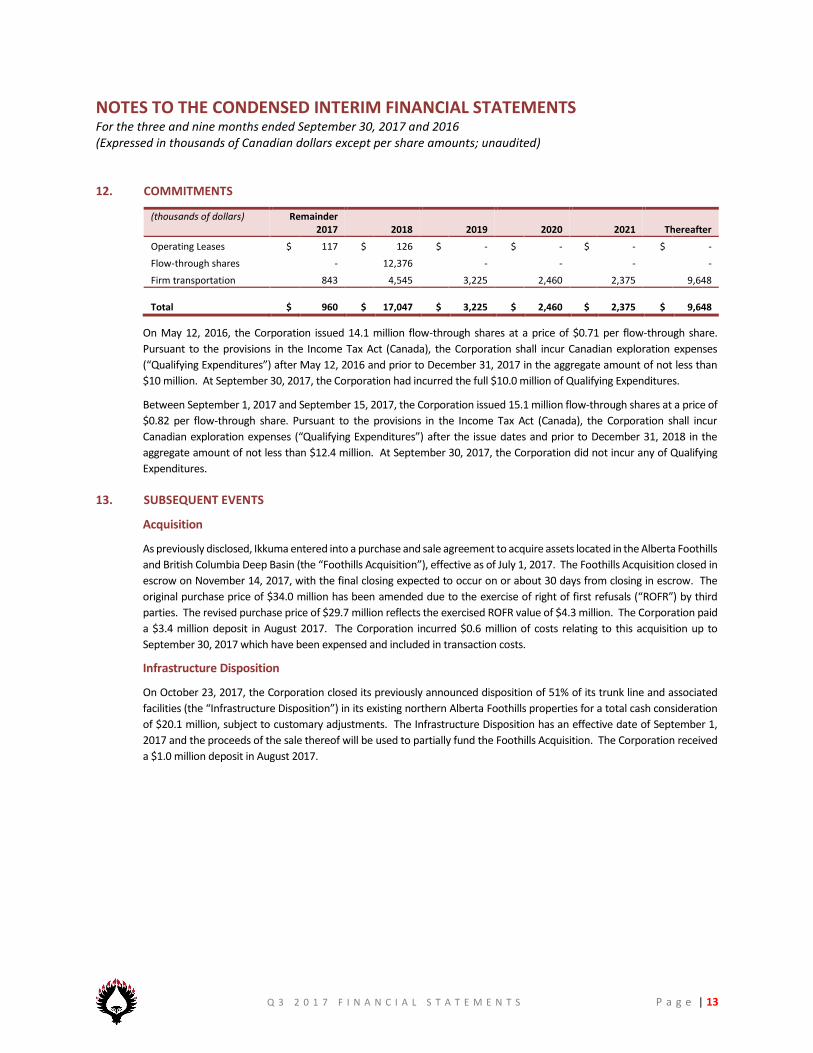
(thousands of dollars) Remainder 2017 2018 2019 2020 2021 Thereafter
Operating leases $ 117 $ 126 $ - $ - $ - $ -
Flow-through shares - 12,376 - - - -
Firm transportation 843 4,545 3,225 2,460 2,375 9,648
Total $ 960 $ 17,047 $ 3,225 $ 2,460 $ 2,375 $ 9,648
On May 12, 2016, the Corporation issued 14.1 million flow-through shares at a price of $0.71 per flow-through share. Pursuant to the provisions in the Income Tax Act (Canada), the Corporation shall incur Canadian exploration expenses (“Qualifying Expenditures”) after May 12, 2016 and prior to December 31, 2017 in the aggregate amount of not less than $10 million. At September 30, 2017, the Corporation had incurred the full $10.0 million of Qualifying Expenditures.
Between September 1, 2017 and September 15, 2017, the Corporation issued 15.1 million flow-through shares at a price of $0.82 per flow-through share. Pursuant to the provisions in the Income Tax Act (Canada), the Corporation shall incur Canadian exploration expenses (“Qualifying Expenditures”) after the issue dates and prior to December 31, 2018 in the aggregate amount of not less than $12.4 million. At September 30, 2017, the Corporation did not incur any Qualifying Expenditures.
RELATED PARTY TRANSACTIONS
The Corporation did not have any related party transactions in the third quarter of 2017.
Q 3 2 0 1 7 M D & A P a g e | 13
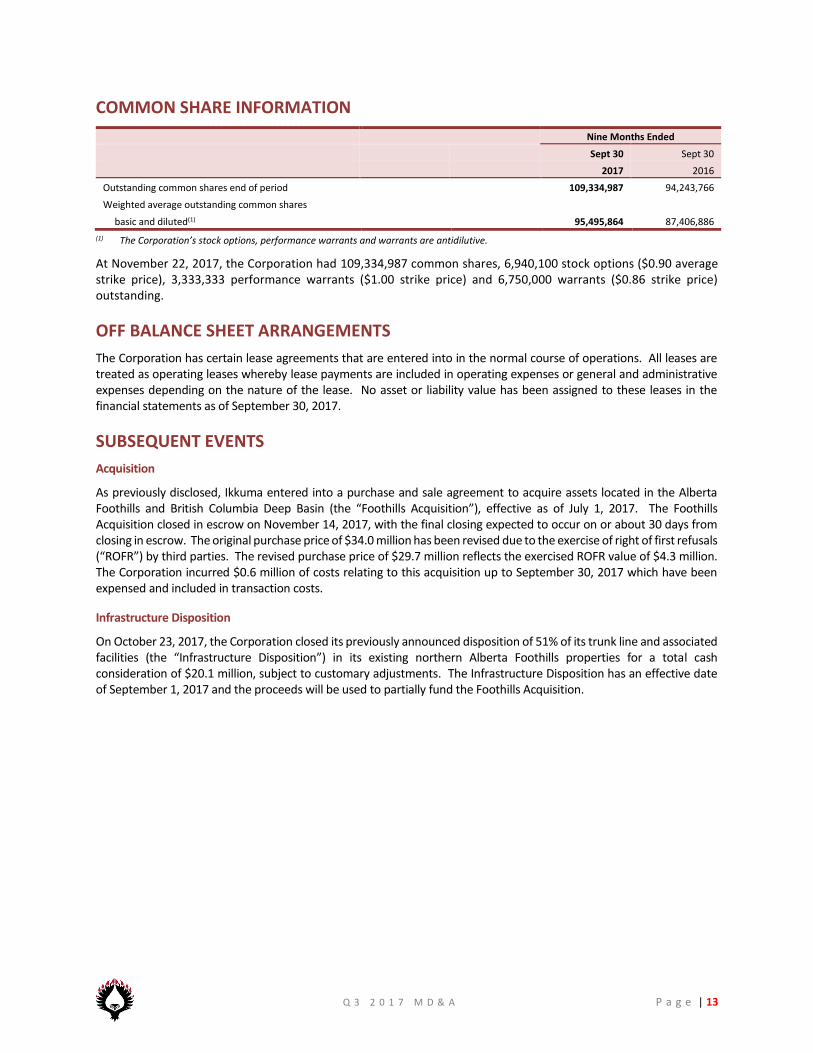
COMMON SHARE INFORMATION
Nine Months Ended
Sept 30 Sept 30 2017 2016
Outstanding common shares end of period 109,334,987 94,243,766
Weighted average outstanding common shares
basic and diluted(1) 95,495,864 87,406,886
(1) The Corporation’s stock options, performance warrants and warrants are antidilutive.
At November 22, 2017, the Corporation had 109,334,987 common shares, 6,940,100 stock options ($0.90 average strike price), 3,333,333 performance warrants ($1.00 strike price) and 6,750,000 warrants ($0.86 strike price) outstanding.
OFF BALANCE SHEET ARRANGEMENTS
The Corporation has certain lease agreements that are entered into in the normal course of operations. All leases are treated as operating leases whereby lease payments are included in operating expenses or general and administrative expenses depending on the nature of the lease. No asset or liability value has been assigned to these leases in the financial statements as of September 30, 2017.
SUBSEQUENT EVENTS
Acquisition
As previously disclosed, Ikkuma entered into a purchase and sale agreement to acquire assets located in the Alberta Foothills and British Columbia Deep Basin (the “Foothills Acquisition”), effective as of July 1, 2017. The Foothills Acquisition closed in escrow on November 14, 2017, with the final closing expected to occur on or about 30 days from closing in escrow. The original purchase price of $34.0 million has been revised due to the exercise of right of first refusals (“ROFR”) by third parties. The revised purchase price of $29.7 million reflects the exercised ROFR value of $4.3 million. The Corporation incurred $0.6 million of costs relating to this acquisition up to September 30, 2017 which have been expensed and included in transaction costs.
Infrastructure Disposition
On October 23, 2017, the Corporation closed its previously announced disposition of 51% of its trunk line and associated facilities (the “Infrastructure Disposition”) in its existing northern Alberta Foothills properties for a total cash consideration of $20.1 million, subject to customary adjustments. The Infrastructure Disposition has an effective date of September 1, 2017 and the proceeds will be used to partially fund the Foothills Acquisition.
Q 3 2 0 1 7 M D & A P a g e | 14
ADDITIONAL DISCLOSURES
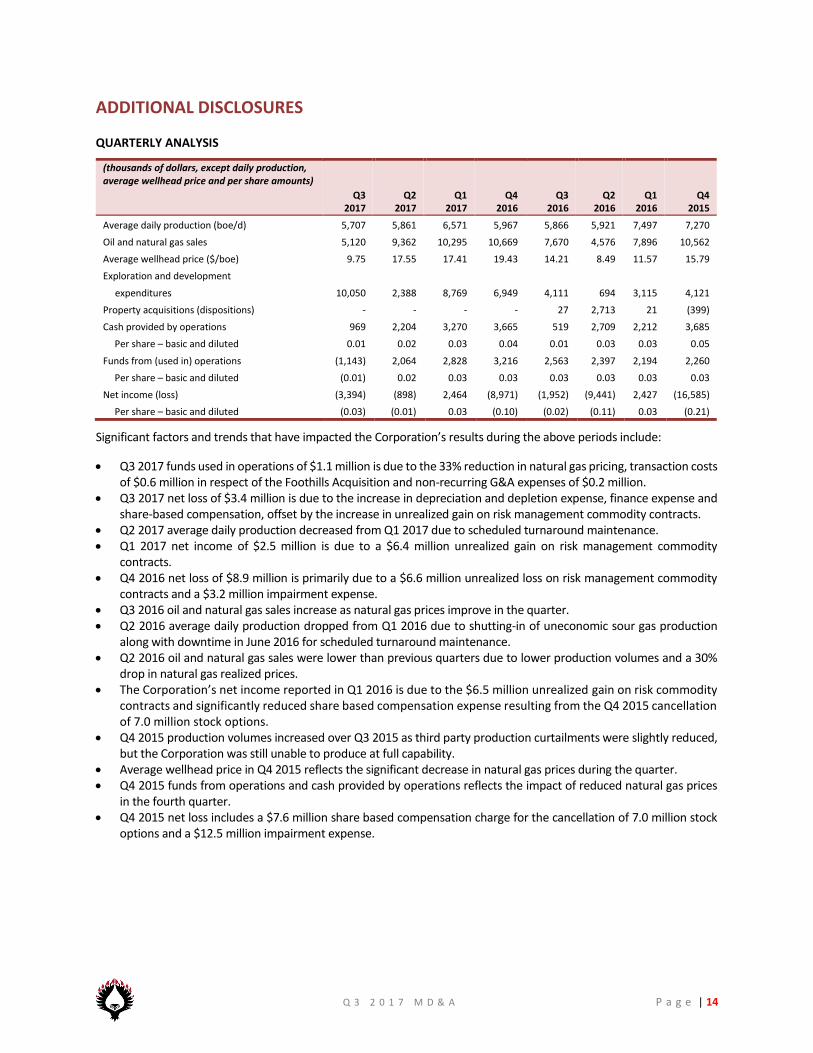
QUARTERLY ANALYSIS
(thousands of dollars, except daily production, average wellhead price and per share amounts)
Q3 2017
Q2 2017
Q1 2017
Q4 2016
Q3 2016
Q2 2016
Q1 2016
Q4 2015
Average daily production (boe/d) 5,707 5,861 6,571 5,967 5,866 5,921 7,497 7,270
Oil and natural gas sales 5,120 9,362 10,295 10,669 7,670 4,576 7,896 10,562
Average wellhead price ($/boe) 9.75 17.55 17.41 19.43 14.21 8.49 11.57 15.79
Exploration and development
expenditures 10,050 2,388 8,769 6,949 4,111 694 3,115 4,121
Property acquisitions (dispositions) - - - - 27 2,713 21 (399)
Cash provided by operations 969 2,204 3,270 3,665 519 2,709 2,212 3,685
Per share – basic and diluted 0.01 0.02 0.03 0.04 0.01 0.03 0.03 0.05
Funds from (used in) operations (1,143) 2,064 2,828 3,216 2,563 2,397 2,194 2,260
Per share – basic and diluted (0.01) 0.02 0.03 0.03 0.03 0.03 0.03 0.03
Net income (loss) (3,394) (898) 2,464 (8,971) (1,952) (9,441) 2,427 (16,585)
Per share – basic and diluted (0.03) (0.01) 0.03 (0.10) (0.02) (0.11) 0.03 (0.21)
Significant factors and trends that have impacted the Corporation’s results during the above periods include:
Q3 2017 funds used in operations of $1.1 million is due to the 33% reduction in natural gas pricing, transaction costs of $0.6 million in respect of the Foothills Acquisition and non-recurring G&A expenses of $0.2 million.
Q3 2017 net loss of $3.4 million is due to the increase in depreciation and depletion expense, finance expense and share-based compensation, offset by the increase in unrealized gain on risk management commodity contracts.
Q2 2017 average daily production decreased from Q1 2017 due to scheduled turnaround maintenance. Q1 2017 net income of $2.5 million is due to a $6.4 million unrealized gain on risk management commodity
contracts. Q4 2016 net loss of $8.9 million is primarily due to a $6.6 million unrealized loss on risk management commodity
contracts and a $3.2 million impairment expense. Q3 2016 oil and natural gas sales increase as natural gas prices improve in the quarter. Q2 2016 average daily production dropped from Q1 2016 due to shutting-in of uneconomic sour gas production
along with downtime in June 2016 for scheduled turnaround maintenance. Q2 2016 oil and natural gas sales were lower than previous quarters due to lower production volumes and a 30%
drop in natural gas realized prices. The Corporation’s net income reported in Q1 2016 is due to the $6.5 million unrealized gain on risk commodity
contracts and significantly reduced share based compensation expense resulting from the Q4 2015 cancellation of 7.0 million stock options.
Q4 2015 production volumes increased over Q3 2015 as third party production curtailments were slightly reduced, but the Corporation was still unable to produce at full capability.
Average wellhead price in Q4 2015 reflects the significant decrease in natural gas prices during the quarter. Q4 2015 funds from operations and cash provided by operations reflects the impact of reduced natural gas prices
in the fourth quarter. Q4 2015 net loss includes a $7.6 million share based compensation charge for the cancellation of 7.0 million stock
options and a $12.5 million impairment expense.
Q 3 2 0 1 7 M D & A P a g e | 15
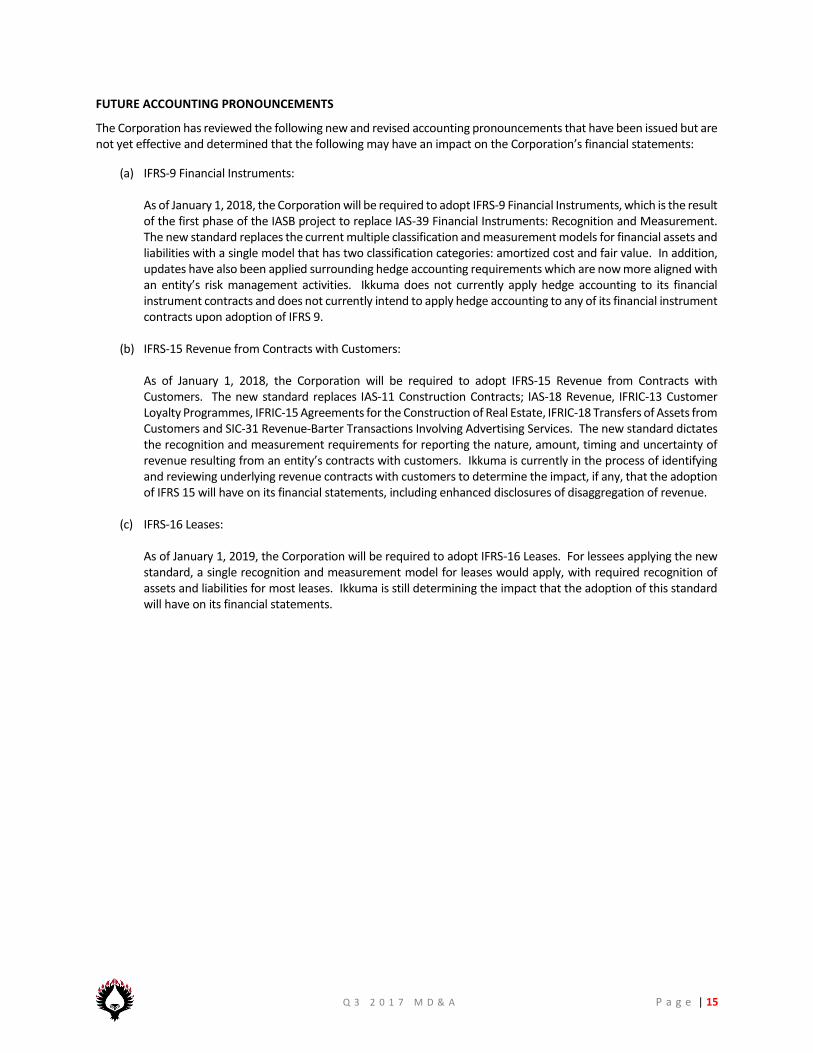
FUTURE ACCOUNTING PRONOUNCEMENTS
The Corporation has reviewed the following new and revised accounting pronouncements that have been issued but are not yet effective and determined that the following may have an impact on the Corporation’s financial statements:
(a) IFRS-9 Financial Instruments: As of January 1, 2018, the Corporation will be required to adopt IFRS-9 Financial Instruments, which is the result of the first phase of the IASB project to replace IAS-39 Financial Instruments: Recognition and Measurement. The new standard replaces the current multiple classification and measurement models for financial assets and liabilities with a single model that has two classification categories: amortized cost and fair value. In addition, updates have also been applied surrounding hedge accounting requirements which are now more aligned with an entity’s risk management activities. Ikkuma does not currently apply hedge accounting to its financial instrument contracts and does not currently intend to apply hedge accounting to any of its financial instrument contracts upon adoption of IFRS 9.
(b) IFRS-15 Revenue from Contracts with Customers: As of January 1, 2018, the Corporation will be required to adopt IFRS-15 Revenue from Contracts with Customers. The new standard replaces IAS-11 Construction Contracts; IAS-18 Revenue, IFRIC-13 Customer Loyalty Programmes, IFRIC-15 Agreements for the Construction of Real Estate, IFRIC-18 Transfers of Assets from Customers and SIC-31 Revenue-Barter Transactions Involving Advertising Services. The new standard dictates the recognition and measurement requirements for reporting the nature, amount, timing and uncertainty of revenue resulting from an entity’s contracts with customers. Ikkuma is currently in the process of identifying and reviewing underlying revenue contracts with customers to determine the impact, if any, that the adoption of IFRS 15 will have on its financial statements, including enhanced disclosures of disaggregation of revenue.
(c) IFRS-16 Leases: As of January 1, 2019, the Corporation will be required to adopt IFRS-16 Leases. For lessees applying the new standard, a single recognition and measurement model for leases would apply, with required recognition of assets and liabilities for most leases. Ikkuma is still determining the impact that the adoption of this standard will have on its financial statements.
FOR THE THIRD QUARTER ENDING
SEPTEMBER 30, 2017
INTERIM
FINANCIAL
STATEMENTS
Q 3 2 0 1 7 F I N A N C I A L S T A T E M E N T S P a g e | 1
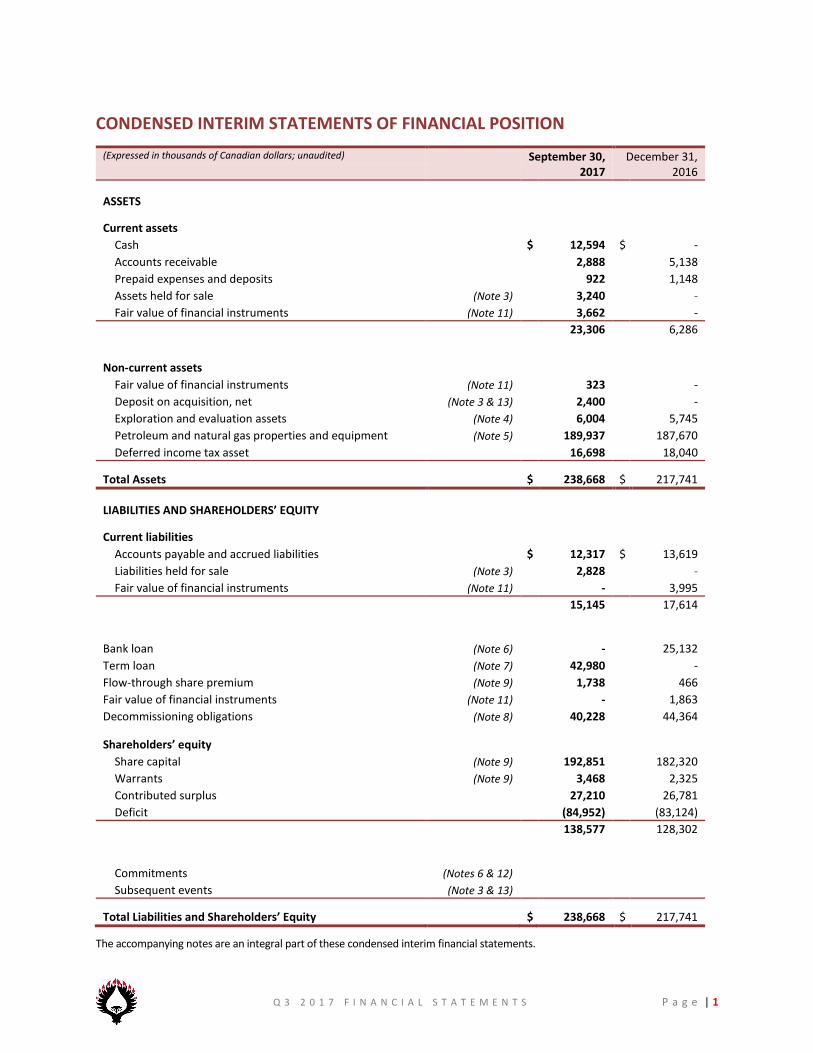
CONDENSED INTERIM STATEMENTS OF FINANCIAL POSITION
(Expressed in thousands of Canadian dollars; unaudited) September 30, December 31, 2017 2016
ASSETS
Current assets
Cash $ 12,594 $ -
Accounts receivable 2,888 5,138
Prepaid expenses and deposits 922 1,148
Assets held for sale (Note 3) 3,240 -
Fair value of financial instruments (Note 11) 3,662 -
23,306 6,286
Non-current assets
Fair value of financial instruments (Note 11) 323 -
Deposit on acquisition, net (Note 3 & 13) 2,400 -
Exploration and evaluation assets (Note 4) 6,004 5,745
Petroleum and natural gas properties and equipment (Note 5) 189,937 187,670
Deferred income tax asset 16,698 18,040
Total Assets $ 238,668 $ 217,741
LIABILITIES AND SHAREHOLDERS’ EQUITY
Current liabilities
Accounts payable and accrued liabilities $ 12,317 $ 13,619
Liabilities held for sale (Note 3) 2,828 -
Fair value of financial instruments (Note 11) - 3,995
15,145 17,614
Bank loan (Note 6) - 25,132
Term loan (Note 7) 42,980 -
Flow-through share premium (Note 9) 1,738 466
Fair value of financial instruments (Note 11) - 1,863
Decommissioning obligations (Note 8) 40,228 44,364
Shareholders’ equity
Share capital (Note 9) 192,851 182,320
Warrants (Note 9) 3,468 2,325
Contributed surplus 27,210 26,781
Deficit (84,952) (83,124)
138,577 128,302
Commitments (Notes 6 & 12)
Subsequent events (Note 3 & 13)
Total Liabilities and Shareholders’ Equity $ 238,668 $ 217,741
The accompanying notes are an integral part of these condensed interim financial statements.
Q 3 2 0 1 7 F I N A N C I A L S T A T E M E N T S P a g e | 2
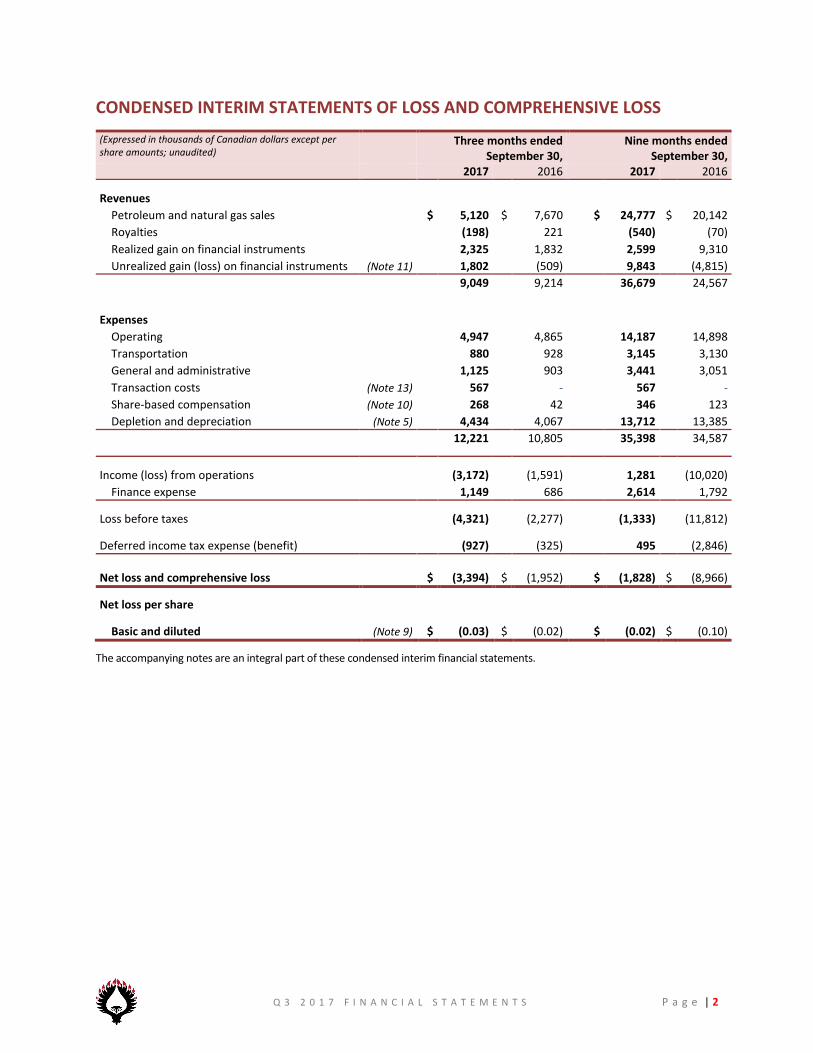
CONDENSED INTERIM STATEMENTS OF LOSS AND COMPREHENSIVE LOSS
(Expressed in thousands of Canadian dollars except per share amounts; unaudited)
Three months ended September 30,
Nine months ended September 30,
2017 2016 2017 2016
Revenues
Petroleum and natural gas sales $ 5,120 $ 7,670 $ 24,777 $ 20,142
Royalties (198) 221 (540) (70)
Realized gain on financial instruments 2,325 1,832 2,599 9,310
Unrealized gain (loss) on financial instruments (Note 11) 1,802 (509) 9,843 (4,815)
9,049 9,214 36,679 24,567
Expenses
Operating 4,947 4,865 14,187 14,898
Transportation 880 928 3,145 3,130
General and administrative 1,125 903 3,441 3,051
Transaction costs (Note 13) 567 - 567 -
Share-based compensation (Note 10) 268 42 346 123
Depletion and depreciation (Note 5) 4,434 4,067 13,712 13,385
12,221 10,805 35,398 34,587
Income (loss) from operations (3,172) (1,591) 1,281 (10,020)
Finance expense 1,149 686 2,614 1,792
Loss before taxes (4,321) (2,277) (1,333) (11,812)
Deferred income tax expense (benefit) (927) (325) 495 (2,846)
Net loss and comprehensive loss $ (3,394) $ (1,952) $ (1,828) $ (8,966)
Net loss per share
Basic and diluted (Note 9) $ (0.03) $ (0.02) $ (0.02) $ (0.10)
The accompanying notes are an integral part of these condensed interim financial statements.
Q 3 2 0 1 7 F I N A N C I A L S T A T E M E N T S P a g e | 3
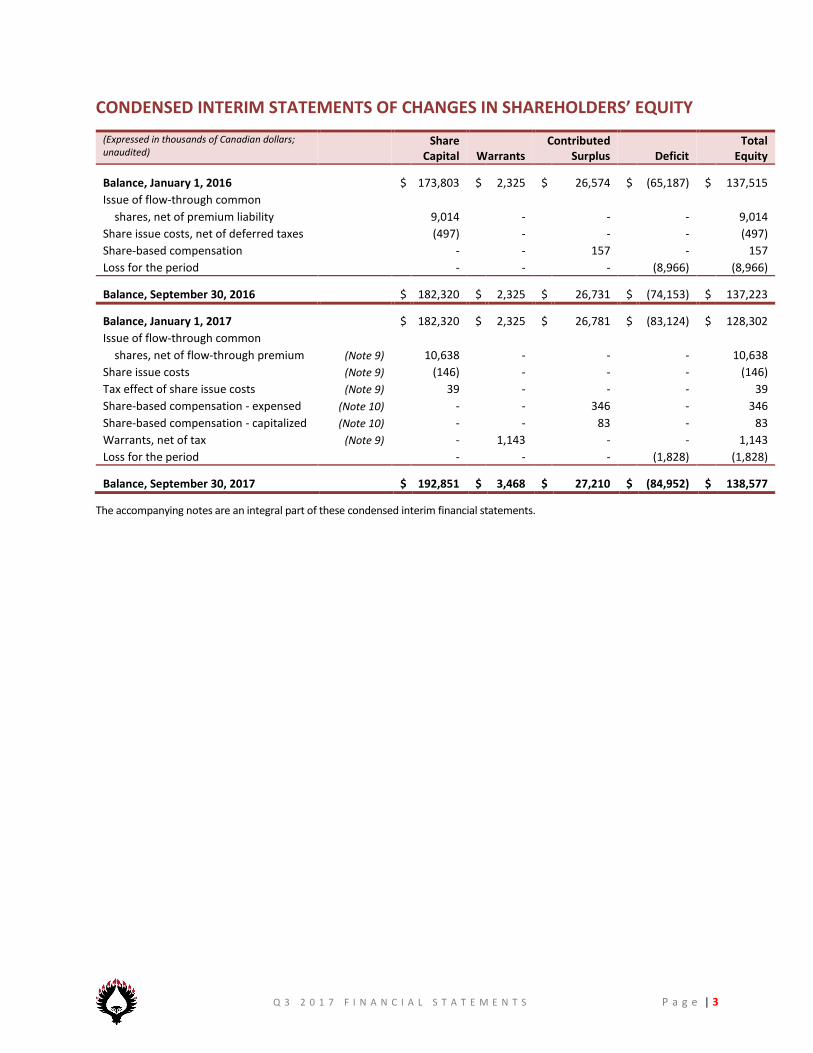
CONDENSED INTERIM STATEMENTS OF CHANGES IN SHAREHOLDERS’ EQUITY
(Expressed in thousands of Canadian dollars; unaudited)
Share Capital Warrants
Contributed Surplus Deficit
Total Equity
Balance, January 1, 2016 $ 173,803 $ 2,325 $ 26,574 $ (65,187) $ 137,515
Issue of flow-through common
shares, net of premium liability 9,014 - - - 9,014
Share issue costs, net of deferred taxes (497) - - - (497)
Share-based compensation - - 157 - 157
Loss for the period - - - (8,966) (8,966)
Balance, September 30, 2016 $ 182,320 $ 2,325 $ 26,731 $ (74,153) $ 137,223
Balance, January 1, 2017 $ 182,320 $ 2,325 $ 26,781 $ (83,124) $ 128,302
Issue of flow-through common
shares, net of flow-through premium (Note 9) 10,638 - - - 10,638
Share issue costs (Note 9) (146) - - - (146)
Tax effect of share issue costs (Note 9) 39 - - - 39
Share-based compensation - expensed (Note 10) - - 346 - 346
Share-based compensation - capitalized (Note 10) - - 83 - 83
Warrants, net of tax (Note 9) - 1,143 - - 1,143
Loss for the period - - - (1,828) (1,828)
Balance, September 30, 2017 $ 192,851 $ 3,468 $ 27,210 $ (84,952) $ 138,577
The accompanying notes are an integral part of these condensed interim financial statements.
Q 3 2 0 1 7 F I N A N C I A L S T A T E M E N T S P a g e | 4
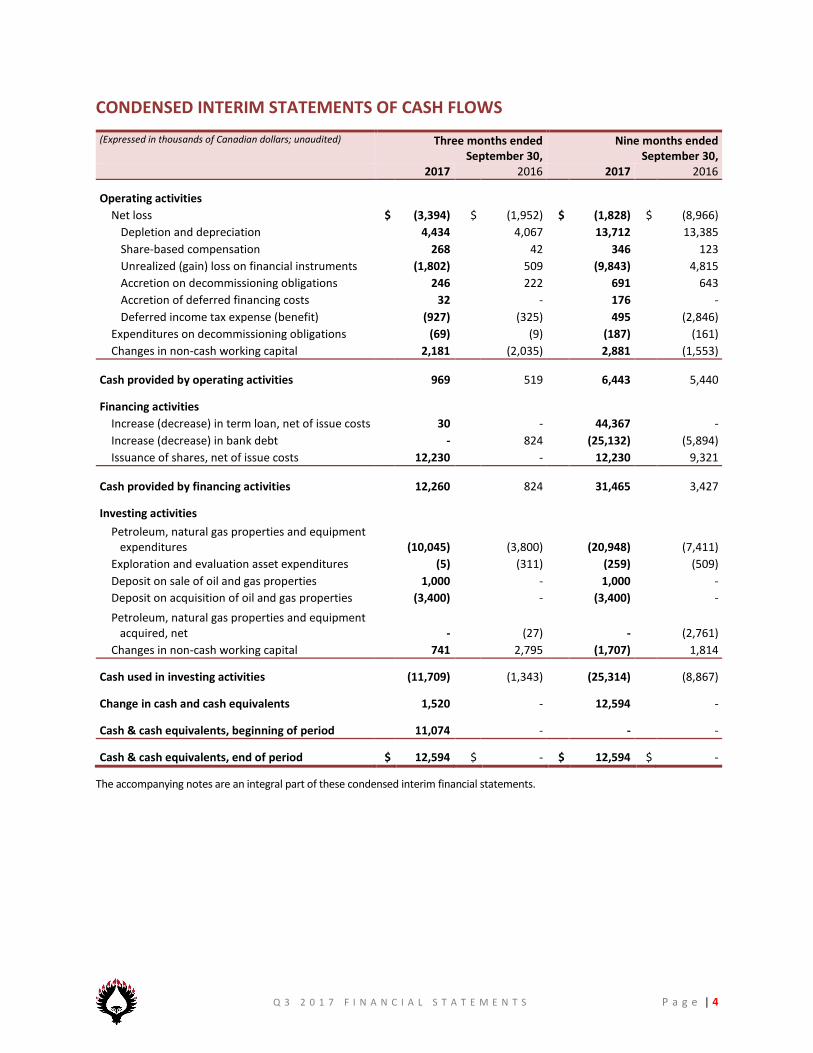
CONDENSED INTERIM STATEMENTS OF CASH FLOWS
(Expressed in thousands of Canadian dollars; unaudited) Three months ended September 30,
Nine months ended September 30,
2017 2016 2017 2016
Operating activities
Net loss $ (3,394) $ (1,952) $ (1,828) $ (8,966)
Depletion and depreciation 4,434 4,067 13,712 13,385
Share-based compensation 268 42 346 123
Unrealized (gain) loss on financial instruments (1,802) 509 (9,843) 4,815
Accretion on decommissioning obligations 246 222 691 643
Accretion of deferred financing costs 32 - 176 -
Deferred income tax expense (benefit) (927) (325) 495 (2,846)
Expenditures on decommissioning obligations (69) (9) (187) (161)
Changes in non-cash working capital 2,181 (2,035) 2,881 (1,553)
Cash provided by operating activities 969 519 6,443 5,440
Financing activities
Increase (decrease) in term loan, net of issue costs 30 - 44,367 -
Increase (decrease) in bank debt - 824 (25,132) (5,894)
Issuance of shares, net of issue costs 12,230 - 12,230 9,321
Cash provided by financing activities 12,260 824 31,465 3,427
Investing activities
Petroleum, natural gas properties and equipment expenditures (10,045) (3,800) (20,948) (7,411)
Exploration and evaluation asset expenditures (5) (311) (259) (509)
Deposit on sale of oil and gas properties 1,000 - 1,000 -
Deposit on acquisition of oil and gas properties (3,400) - (3,400) -
Petroleum, natural gas properties and equipment acquired, net - (27) - (2,761)
Changes in non-cash working capital 741 2,795 (1,707) 1,814
Cash used in investing activities (11,709) (1,343) (25,314) (8,867)
Change in cash and cash equivalents 1,520 - 12,594 -
Cash & cash equivalents, beginning of period 11,074 - - -
Cash & cash equivalents, end of period $ 12,594 $ - $ 12,594 $ -
The accompanying notes are an integral part of these condensed interim financial statements.
NOTES TO THE CONDENSED INTERIM FINANCIAL STATEMENTS For the three and nine months ended September 30, 2017 and 2016 (Expressed in thousands of Canadian dollars except per share amounts; unaudited)
Q 3 2 0 1 7 F I N A N C I A L S T A T E M E N T S P a g e | 5
1. REPORTING ENTITY
Ikkuma Resources Corp. (the “Corporation” or “Ikkuma”) is an oil and gas exploration and production Corporation with
producing properties in the foothills of Alberta and British Columbia. The Corporation is headquartered in Calgary and is an
Alberta-based reporting entity whose shares are listed on the TSX Venture Exchange under the symbol: IKM.V. The
registered office and principal address is located at 2700, 605 – 5th Avenue S.W. Calgary, AB, T2P 3H5.
2. BASIS OF PRESENTATION
These condensed interim financial statements have been prepared in accordance with International Accounting Standard
(“IAS”) 34 – Interim Financial Reporting using accounting policies consistent with the International Financial Reporting
Standards (“IFRS”) and have been prepared following the same accounting policies and methods of computation in the
Corporation’s annual financial statement for the year ended December 31, 2016, except for as stated below. The condensed
interim financial statements do not include certain disclosures that are required to be included in annual financial statements
and they should be read in conjunction with the annual financial statements for the year ended December 31, 2016.
These condensed interim financial statements were authorized for issuance by Ikkuma’s Board of Directors on November
22, 2017.
Certain comparative numbers have been reclassified to conform to current presentation.
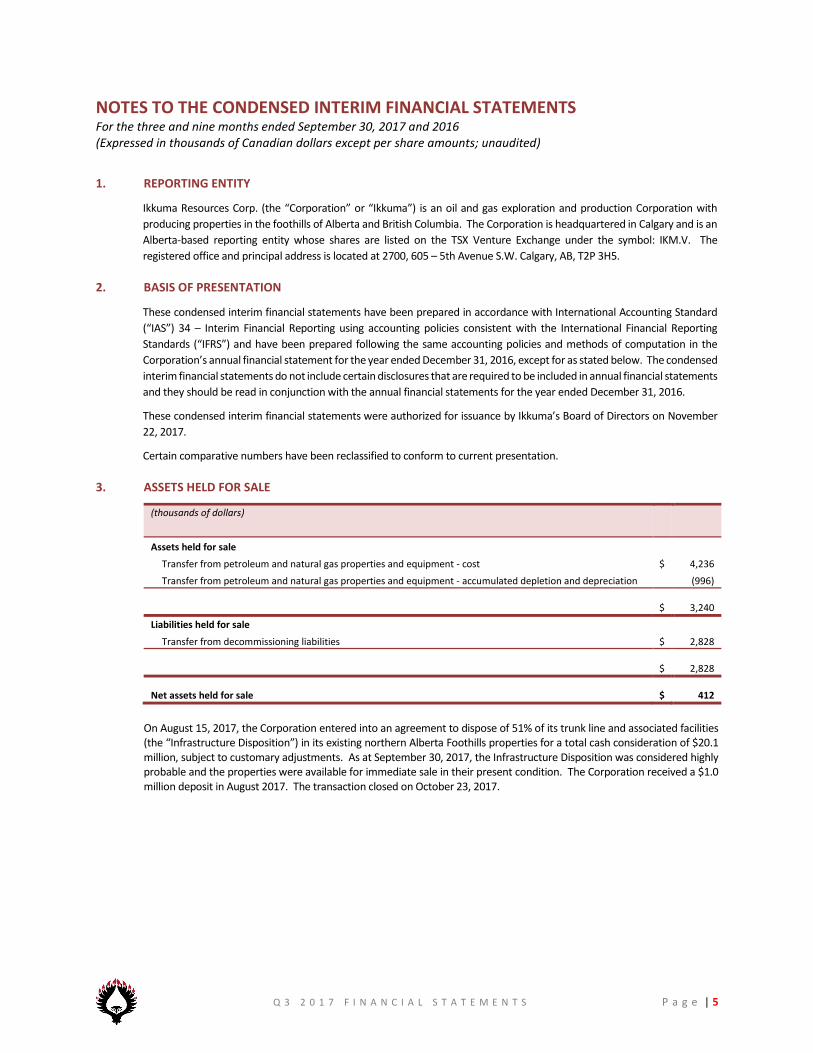
3. ASSETS HELD FOR SALE
(thousands of dollars)
Assets held for sale
Transfer from petroleum and natural gas properties and equipment - cost $ 4,236
Transfer from petroleum and natural gas properties and equipment - accumulated depletion and depreciation (996)
$ 3,240
Liabilities held for sale
Transfer from decommissioning liabilities $ 2,828
$ 2,828
Net assets held for sale $ 412
On August 15, 2017, the Corporation entered into an agreement to dispose of 51% of its trunk line and associated facilities (the “Infrastructure Disposition”) in its existing northern Alberta Foothills properties for a total cash consideration of $20.1 million, subject to customary adjustments. As at September 30, 2017, the Infrastructure Disposition was considered highly probable and the properties were available for immediate sale in their present condition. The Corporation received a $1.0 million deposit in August 2017. The transaction closed on October 23, 2017.
NOTES TO THE CONDENSED INTERIM FINANCIAL STATEMENTS For the three and nine months ended September 30, 2017 and 2016 (Expressed in thousands of Canadian dollars except per share amounts; unaudited)
Q 3 2 0 1 7 F I N A N C I A L S T A T E M E N T S P a g e | 6
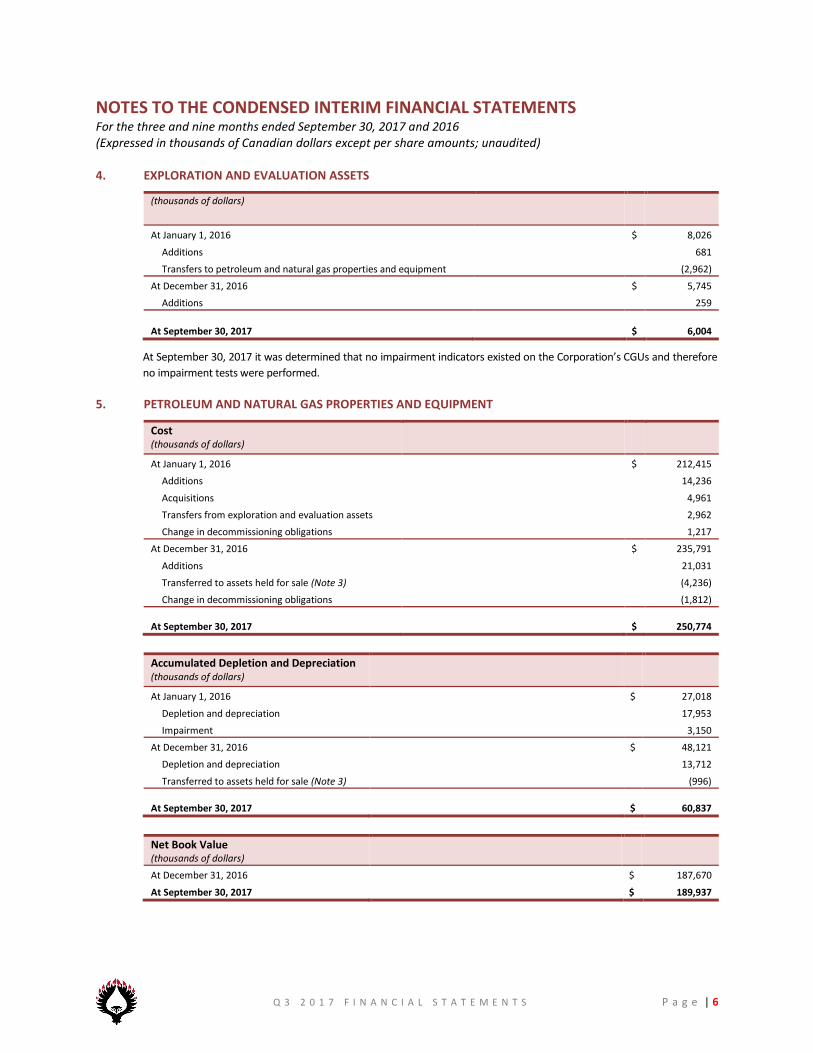
4. EXPLORATION AND EVALUATION ASSETS
(thousands of dollars)
At January 1, 2016 $ 8,026
Additions 681
Transfers to petroleum and natural gas properties and equipment (2,962)
At December 31, 2016 $ 5,745
Additions 259
At September 30, 2017 $ 6,004
At September 30, 2017 it was determined that no impairment indicators existed on the Corporation’s CGUs and therefore
no impairment tests were performed.
5. PETROLEUM AND NATURAL GAS PROPERTIES AND EQUIPMENT
Cost (thousands of dollars)
At January 1, 2016 $ 212,415
Additions 14,236
Acquisitions 4,961
Transfers from exploration and evaluation assets 2,962
Change in decommissioning obligations 1,217
At December 31, 2016 $ 235,791
Additions 21,031
Transferred to assets held for sale (Note 3) (4,236)
Change in decommissioning obligations (1,812)
At September 30, 2017
$ 250,774
Accumulated Depletion and Depreciation (thousands of dollars)
At January 1, 2016 $ 27,018
Depletion and depreciation 17,953
Impairment 3,150
At December 31, 2016 $ 48,121
Depletion and depreciation 13,712
Transferred to assets held for sale (Note 3) (996)
At September 30, 2017
$ 60,837
Net Book Value (thousands of dollars)
At December 31, 2016 $ 187,670
At September 30, 2017 $ 189,937
NOTES TO THE CONDENSED INTERIM FINANCIAL STATEMENTS For the three and nine months ended September 30, 2017 and 2016 (Expressed in thousands of Canadian dollars except per share amounts; unaudited)
Q 3 2 0 1 7 F I N A N C I A L S T A T E M E N T S P a g e | 7
Depletion
At September 30, 2017, future development costs of Ikkuma’s proved plus probable reserves of $39.6 million were included
in the depletion calculations (December 31, 2016: $39.6 million). Residual value of $11.1 million (December 31, 2016: $14.4
million) and $13.4 million of work-in-progress drilling and completion expenditures were excluded from the depletion
calculations.
At September 30, 2017 it was determined that no impairment indicators existed on the Corporation’s CGUs and therefore
no impairment tests were performed.
6. BANK LOAN
As at September 30, 2017 the Corporation’s credit facility with a syndicate of Canadian banks consisted of a revolving line of
credit of $10 million and an operating line of credit of $15 million collectively, (the “Facility” or “Bank loan”). The Facility
revolves for a 364 day period and will be subject to its next 364 day extension at the next borrowing base review. If not
extended, the Facility will cease to revolve, the margins thereunder will increase by 0.5 percent and all outstanding advances
thereunder will become repayable in one year from the extension date. The available lending limits are reviewed semi-
annually and are based on the bank syndicate’s interpretation of the Corporation’s reserves and future commodity prices.
The Facility is secured by a floating charge debenture and a general security agreement on the assets of the Corporation.
Subsequent to September 30, 2017, the Syndicate completed its semi-annual review of the borrowing base with no changes
to the Facility. There can be no assurance that the amount of the available Facility will not be adjusted at the next scheduled
borrowing base review on or before May 31, 2018.
Advances under the Facility are available by way of prime rate loans with interest rates between 1.0 percent and 3.0 percent
over the bank’s prime lending rate and bankers’ acceptances and LIBOR loans, which are subject to stamping fees and
margins ranging from 2.0 percent to 4.0 percent. Standby fees are charged on the undrawn Facility at rates ranging from
0.5 percent to 1.0 percent. The financial covenant for the credit facility and the term loan, along with the applicable rate, is
dependent upon the debt to EBITDA ratio, as defined in the credit agreements. EBITDA used in the ratio is based on the
Corporation’s last four quarters completed and is adjusted for the proforma EBITDA of any material acquisitions or
dispositions, as defined in the agreement, as if the material acquisition or disposition was completed on the first day of the
applicable four quarter period. EBITDA is comprised of earnings before interest, taxes, depreciation and amortization and
adjustments for other non-cash items. Debt is defined as the outstanding principal amounts of the Term loan and Bank loan,
plus outstanding letters of credit, less unrestricted cash. As at September 30, 2017, the Corporation is in compliance with
all Facility covenants.
As at September 30, 2017 the Corporation’s debt to EBITDA ratio is 3.3 to 1 (December 31, 2016 – 2.2 to 1). Accordingly,
applicable pricing will be a 2.5 percent margin on prime lending and a 3.5 percent stamping fee and margin on bankers’
acceptances and LIBOR loans along with a 0.875 percent per annum standby fee on the portion of the facility that is not
drawn. Borrowing margins and fees are reviewed annually as part of the bank syndicate’s annual renewal. At September
30, 2017, the Corporation had outstanding letters of credit totaling $1.0 million (December 31, 2016 - $1.0 million) that
reduce the amount otherwise drawn on the Facility. The effective interest rate on the Corporation’s borrowings under its
bank Facility for the nine month’s ended September 30, 2017 was 3.71% (September 30, 2016 – 4.7%).
NOTES TO THE CONDENSED INTERIM FINANCIAL STATEMENTS For the three and nine months ended September 30, 2017 and 2016 (Expressed in thousands of Canadian dollars except per share amounts; unaudited)
Q 3 2 0 1 7 F I N A N C I A L S T A T E M E N T S P a g e | 8
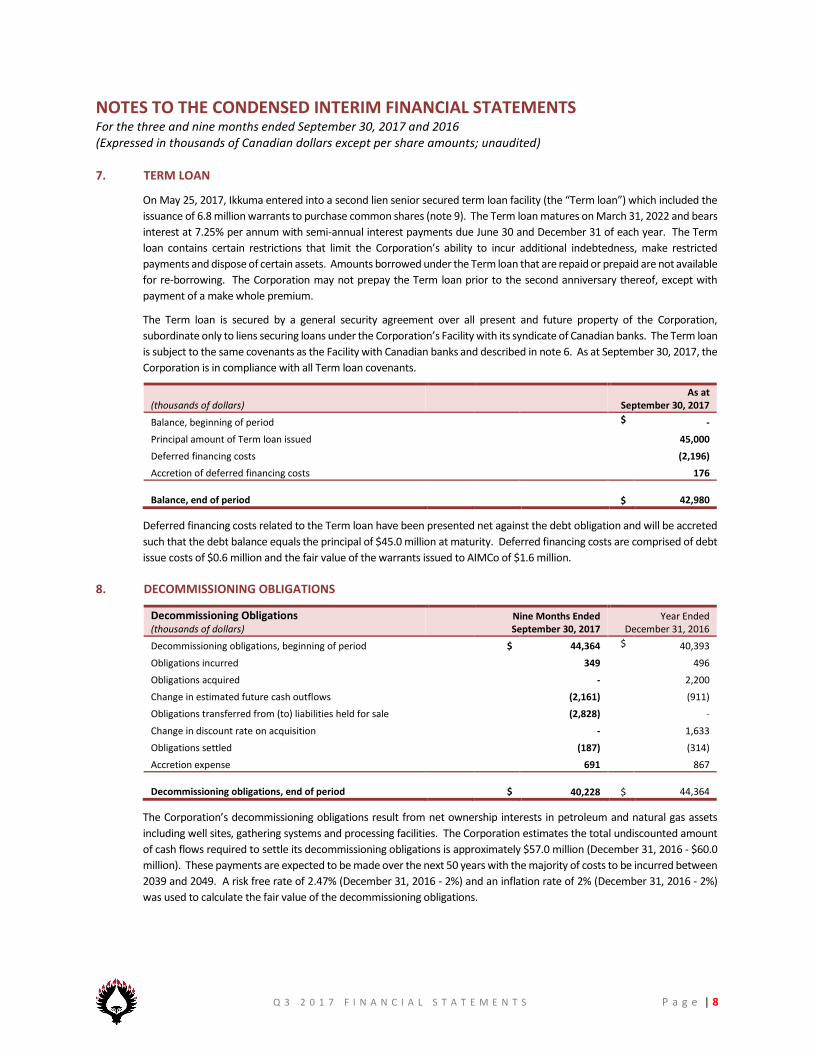
7. TERM LOAN
On May 25, 2017, Ikkuma entered into a second lien senior secured term loan facility (the “Term loan”) which included the
issuance of 6.8 million warrants to purchase common shares (note 9). The Term loan matures on March 31, 2022 and bears
interest at 7.25% per annum with semi-annual interest payments due June 30 and December 31 of each year. The Term
loan contains certain restrictions that limit the Corporation’s ability to incur additional indebtedness, make restricted
payments and dispose of certain assets. Amounts borrowed under the Term loan that are repaid or prepaid are not available
for re-borrowing. The Corporation may not prepay the Term loan prior to the second anniversary thereof, except with
payment of a make whole premium.
The Term loan is secured by a general security agreement over all present and future property of the Corporation,
subordinate only to liens securing loans under the Corporation’s Facility with its syndicate of Canadian banks. The Term loan
is subject to the same covenants as the Facility with Canadian banks and described in note 6. As at September 30, 2017, the
Corporation is in compliance with all Term loan covenants.
(thousands of dollars)
As at September 30, 2017
Balance, beginning of period $ -
Principal amount of Term loan issued 45,000
Deferred financing costs (2,196)
Accretion of deferred financing costs 176
Balance, end of period
$ 42,980
Deferred financing costs related to the Term loan have been presented net against the debt obligation and will be accreted
such that the debt balance equals the principal of $45.0 million at maturity. Deferred financing costs are comprised of debt
issue costs of $0.6 million and the fair value of the warrants issued to AIMCo of $1.6 million.
8. DECOMMISSIONING OBLIGATIONS
Decommissioning Obligations (thousands of dollars)
Nine Months Ended September 30, 2017
Year Ended December 31, 2016
Decommissioning obligations, beginning of period $ 44,364 $ 40,393
Obligations incurred 349 496
Obligations acquired - 2,200
Change in estimated future cash outflows (2,161) (911)
Obligations transferred from (to) liabilities held for sale (2,828) -
Change in discount rate on acquisition - 1,633
Obligations settled (187) (314)
Accretion expense 691 867
Decommissioning obligations, end of period $
40,228
$ 44,364
The Corporation’s decommissioning obligations result from net ownership interests in petroleum and natural gas assets
including well sites, gathering systems and processing facilities. The Corporation estimates the total undiscounted amount
of cash flows required to settle its decommissioning obligations is approximately $57.0 million (December 31, 2016 - $60.0
million). These payments are expected to be made over the next 50 years with the majority of costs to be incurred between
2039 and 2049. A risk free rate of 2.47% (December 31, 2016 - 2%) and an inflation rate of 2% (December 31, 2016 - 2%)
was used to calculate the fair value of the decommissioning obligations.
NOTES TO THE CONDENSED INTERIM FINANCIAL STATEMENTS For the three and nine months ended September 30, 2017 and 2016 (Expressed in thousands of Canadian dollars except per share amounts; unaudited)
Q 3 2 0 1 7 F I N A N C I A L S T A T E M E N T S P a g e | 9
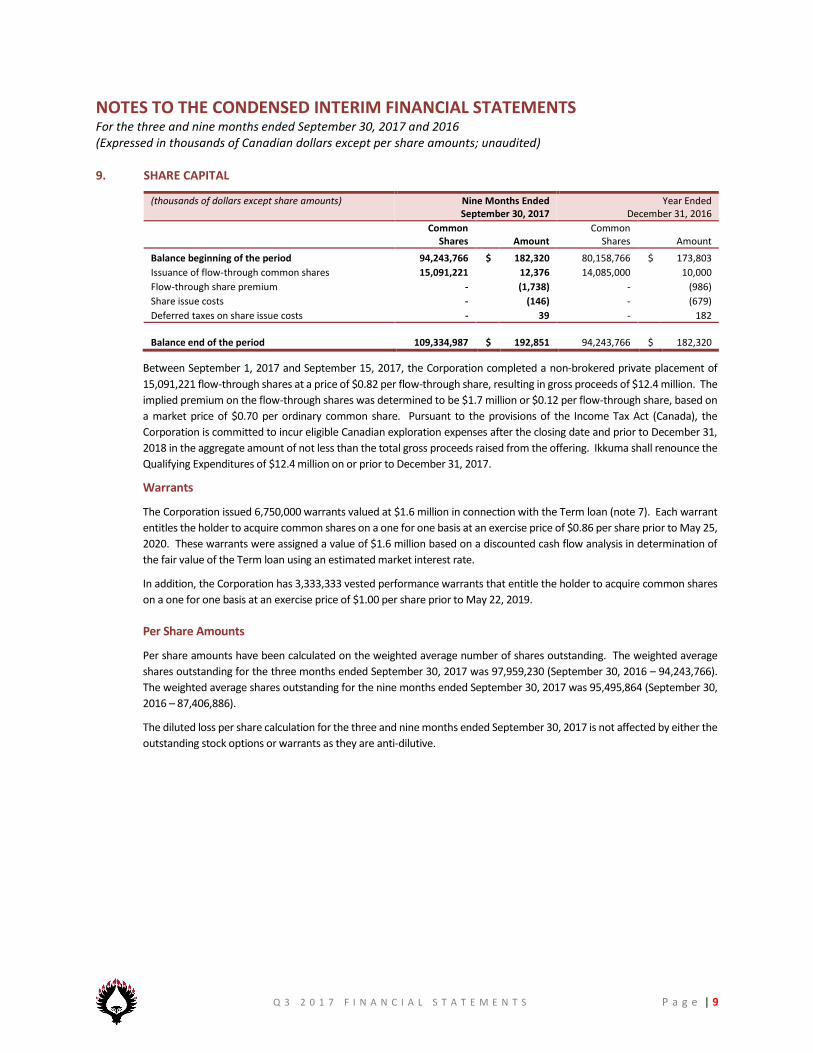
9. SHARE CAPITAL
(thousands of dollars except share amounts) Nine Months Ended September 30, 2017
Year Ended December 31, 2016
Common Shares Amount
Common Shares Amount
Balance beginning of the period 94,243,766 $ 182,320 80,158,766 $ 173,803
Issuance of flow-through common shares 15,091,221 12,376 14,085,000 10,000
Flow-through share premium - (1,738) - (986)
Share issue costs - (146) - (679)
Deferred taxes on share issue costs - 39 - 182
Balance end of the period 109,334,987 $ 192,851 94,243,766 $ 182,320
Between September 1, 2017 and September 15, 2017, the Corporation completed a non-brokered private placement of
15,091,221 flow-through shares at a price of $0.82 per flow-through share, resulting in gross proceeds of $12.4 million. The
implied premium on the flow-through shares was determined to be $1.7 million or $0.12 per flow-through share, based on
a market price of $0.70 per ordinary common share. Pursuant to the provisions of the Income Tax Act (Canada), the
Corporation is committed to incur eligible Canadian exploration expenses after the closing date and prior to December 31,
2018 in the aggregate amount of not less than the total gross proceeds raised from the offering. Ikkuma shall renounce the
Qualifying Expenditures of $12.4 million on or prior to December 31, 2017.
Warrants
The Corporation issued 6,750,000 warrants valued at $1.6 million in connection with the Term loan (note 7). Each warrant
entitles the holder to acquire common shares on a one for one basis at an exercise price of $0.86 per share prior to May 25,
2020. These warrants were assigned a value of $1.6 million based on a discounted cash flow analysis in determination of
the fair value of the Term loan using an estimated market interest rate.
In addition, the Corporation has 3,333,333 vested performance warrants that entitle the holder to acquire common shares
on a one for one basis at an exercise price of $1.00 per share prior to May 22, 2019.
Per Share Amounts
Per share amounts have been calculated on the weighted average number of shares outstanding. The weighted average
shares outstanding for the three months ended September 30, 2017 was 97,959,230 (September 30, 2016 – 94,243,766).
The weighted average shares outstanding for the nine months ended September 30, 2017 was 95,495,864 (September 30,
2016 – 87,406,886).
The diluted loss per share calculation for the three and nine months ended September 30, 2017 is not affected by either the
outstanding stock options or warrants as they are anti-dilutive.
NOTES TO THE CONDENSED INTERIM FINANCIAL STATEMENTS For the three and nine months ended September 30, 2017 and 2016 (Expressed in thousands of Canadian dollars except per share amounts; unaudited)
Q 3 2 0 1 7 F I N A N C I A L S T A T E M E N T S P a g e | 10
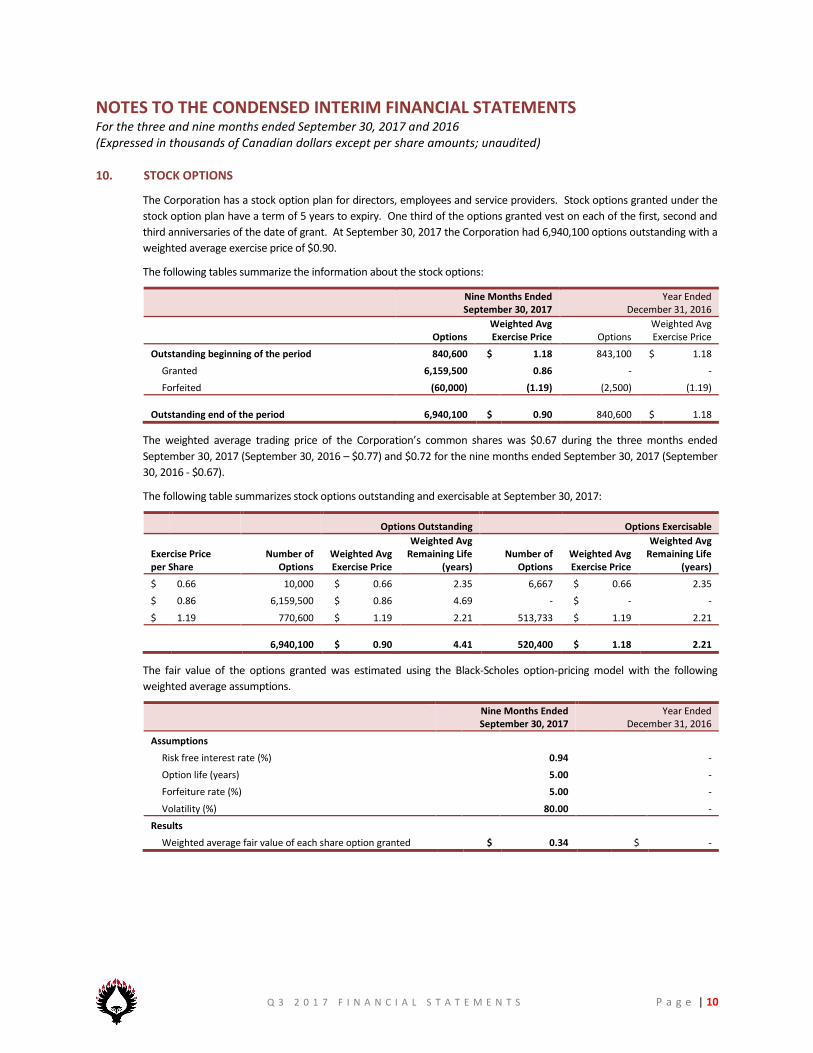
10. STOCK OPTIONS
The Corporation has a stock option plan for directors, employees and service providers. Stock options granted under the
stock option plan have a term of 5 years to expiry. One third of the options granted vest on each of the first, second and
third anniversaries of the date of grant. At September 30, 2017 the Corporation had 6,940,100 options outstanding with a
weighted average exercise price of $0.90.
The following tables summarize the information about the stock options:
Nine Months Ended September 30, 2017
Year Ended December 31, 2016
Options
Weighted Avg Exercise Price Options
Weighted Avg Exercise Price
Outstanding beginning of the period 840,600 $ 1.18 843,100 $ 1.18
Granted 6,159,500 0.86 - -
Forfeited (60,000) (1.19) (2,500) (1.19)
Outstanding end of the period 6,940,100 $ 0.90 840,600 $ 1.18
The weighted average trading price of the Corporation’s common shares was $0.67 during the three months ended
September 30, 2017 (September 30, 2016 – $0.77) and $0.72 for the nine months ended September 30, 2017 (September
30, 2016 - $0.67).
The following table summarizes stock options outstanding and exercisable at September 30, 2017:
Options Outstanding
Options Exercisable
Exercise Price per Share
Number of Options
Weighted Avg Exercise Price
Weighted Avg Remaining Life
(years) Number of
Options Weighted Avg Exercise Price
Weighted Avg Remaining Life
(years)
$ 0.66 10,000 $ 0.66 2.35 6,667 $ 0.66 2.35
$ 0.86 6,159,500 $ 0.86 4.69 - $ - -
$ 1.19 770,600 $ 1.19 2.21 513,733 $ 1.19 2.21
6,940,100 $ 0.90 4.41 520,400 $ 1.18 2.21
The fair value of the options granted was estimated using the Black-Scholes option-pricing model with the following
weighted average assumptions.
Nine Months Ended September 30, 2017
Year Ended December 31, 2016
Assumptions
Risk free interest rate (%) 0.94 -
Option life (years) 5.00 -
Forfeiture rate (%) 5.00 -
Volatility (%) 80.00 -
Results
Weighted average fair value of each share option granted $ 0.34 $ -
NOTES TO THE CONDENSED INTERIM FINANCIAL STATEMENTS For the three and nine months ended September 30, 2017 and 2016 (Expressed in thousands of Canadian dollars except per share amounts; unaudited)
Q 3 2 0 1 7 F I N A N C I A L S T A T E M E N T S P a g e | 11
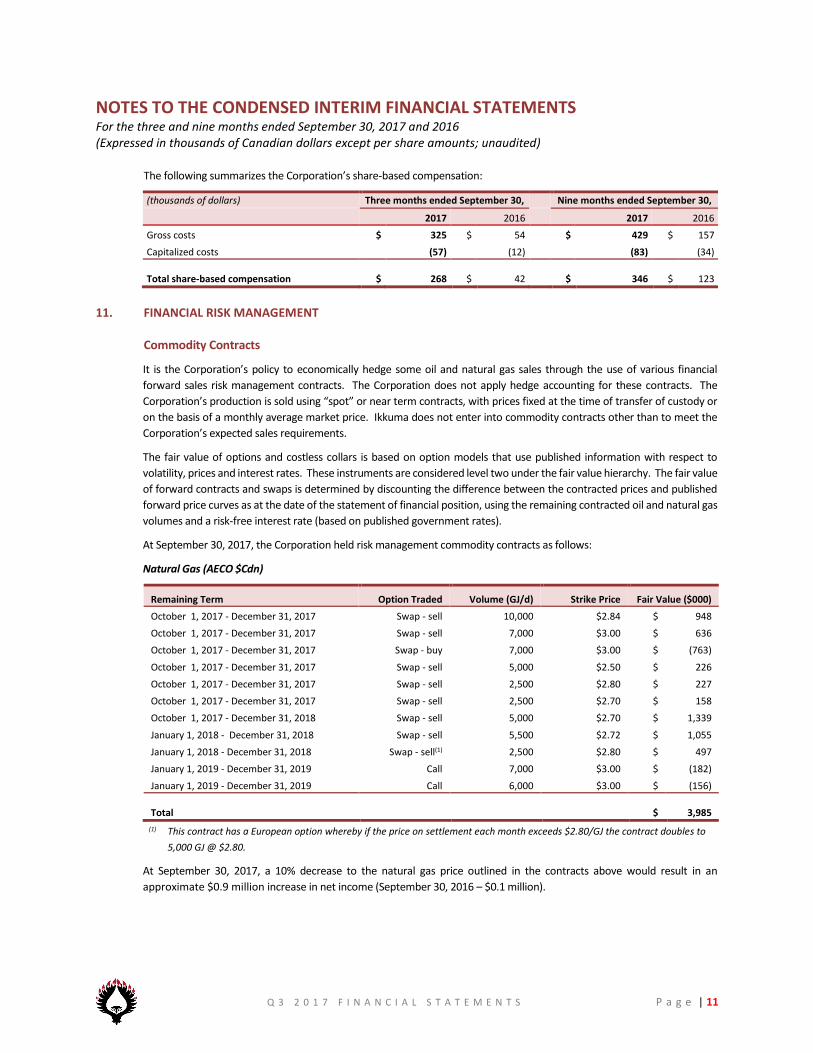
The following summarizes the Corporation’s share-based compensation:
(thousands of dollars) Three months ended September 30, Nine months ended September 30,
2017 2016 2017 2016
Gross costs $ 325 $ 54 $ 429 $ 157
Capitalized costs (57) (12) (83) (34)
Total share-based compensation $ 268 $ 42 $ 346 $ 123
11. FINANCIAL RISK MANAGEMENT Commodity Contracts
It is the Corporation’s policy to economically hedge some oil and natural gas sales through the use of various financial
forward sales risk management contracts. The Corporation does not apply hedge accounting for these contracts. The
Corporation’s production is sold using “spot” or near term contracts, with prices fixed at the time of transfer of custody or
on the basis of a monthly average market price. Ikkuma does not enter into commodity contracts other than to meet the
Corporation’s expected sales requirements.
The fair value of options and costless collars is based on option models that use published information with respect to
volatility, prices and interest rates. These instruments are considered level two under the fair value hierarchy. The fair value
of forward contracts and swaps is determined by discounting the difference between the contracted prices and published
forward price curves as at the date of the statement of financial position, using the remaining contracted oil and natural gas
volumes and a risk-free interest rate (based on published government rates).
At September 30, 2017, the Corporation held risk management commodity contracts as follows:
Natural Gas (AECO $Cdn)
Remaining Term Option Traded Volume (GJ/d) Strike Price Fair Value ($000)
October 1, 2017 - December 31, 2017 Swap - sell 10,000 $2.84 $ 948
October 1, 2017 - December 31, 2017 Swap - sell 7,000 $3.00 $ 636
October 1, 2017 - December 31, 2017 Swap - buy 7,000 $3.00 $ (763)
October 1, 2017 - December 31, 2017 Swap - sell 5,000 $2.50 $ 226
October 1, 2017 - December 31, 2017 Swap - sell 2,500 $2.80 $ 227
October 1, 2017 - December 31, 2017 Swap - sell 2,500 $2.70 $ 158
October 1, 2017 - December 31, 2018 Swap - sell 5,000 $2.70 $ 1,339
January 1, 2018 - December 31, 2018 Swap - sell 5,500 $2.72 $ 1,055
January 1, 2018 - December 31, 2018 Swap - sell(1) 2,500 $2.80 $ 497
January 1, 2019 - December 31, 2019 Call 7,000 $3.00 $ (182)
January 1, 2019 - December 31, 2019 Call 6,000 $3.00 $ (156)
Total $ 3,985
(1) This contract has a European option whereby if the price on settlement each month exceeds $2.80/GJ the contract doubles to
5,000 GJ @ $2.80.
At September 30, 2017, a 10% decrease to the natural gas price outlined in the contracts above would result in an
approximate $0.9 million increase in net income (September 30, 2016 – $0.1 million).

NOTES TO THE CONDENSED INTERIM FINANCIAL STATEMENTS For the three and nine months ended September 30, 2017 and 2016 (Expressed in thousands of Canadian dollars except per share amounts; unaudited)
Q 3 2 0 1 7 F I N A N C I A L S T A T E M E N T S P a g e | 12
Subsequent to September 30, 2017, the Corporation entered into the following risk management commodity contract:
Natural gas (AECO $Cdn)
Remaining Term Option Traded Volume (GJ/d) Strike Price
January 1, 2018 – March 31, 2018 Swap - sell 1,000 $2.36
January 1, 2018 – March 31, 2018 Swap - sell 3,000 $2.41
Liquidity Risk
Liquidity risk is the risk that the Corporation will not be able to meets its financial obligations as they become due. The
Corporation’s approach to managing liquidity is to ensure that they will have sufficient liquidity to meet its short-term and
long-term financial obligations when due, under both normal and unusual conditions, without incurring unacceptable losses
or risking harm to the Corporation’s reputation.
The Corporation’s financial liabilities include accounts payable and accrued liabilities which are due within the next year. The
Corporation also has a Term loan outstanding of $45 million, with a maturity date of March 31, 2022, and a fully undrawn
credit facility of $25 million, which are subject to a debt to EBITDA ratio of 4.0 to 1 being maintained, as described in note
6. At September 30, 2017, the Corporation has a debt to EBITDA ratio of 3.3 to 1 and is forecasting continued compliance
with this covenant over the following twelve month period based on current expected acquisition and disposition
activities. The ability of the Corporation to maintain the 4.0 to 1 covenant is predicated on certain natural gas prices being
maintained and active management of the Corporation’s working capital balances, as the covenant restricts the
Corporation’s ability to draw on the full available credit facility. While the Corporation believes they will be successful in
maintaining the necessary debt to EBITDA ratio, there is uncertainty due to continued natural gas price volatility.
The Corporation will also need to spend $12.4 million of flow-through commitments.
To manage liquidity risk, the Corporation continues to explore all available options including non-core asset disposals,
hedging future revenue, equity issuances and amend, revise or extend the terms of the existing debt.
Capital Management
The Corporation’s objective when managing capital is to maintain a flexible capital structure which will allow it to execute
on its capital expenditure program, which includes expenditures on oil and gas activities which may or may not be successful.
Therefore, the Corporation monitors the level of risk incurred in its capital expenditures to balance the proportion of debt
and equity in its capital structure.
The Corporation considers its capital structure to include working capital, the Bank loan, Term loan and shareholders’ equity.
Ikkuma’s primary capital management objective is to maintain a strong financial position in order to continue the future
growth of the Corporation. Ikkuma monitors its capital structure and makes adjustments on an ongoing basis in order to
maintain the flexibility needed to achieve the Corporation’s long-term objectives. To manage the capital structure, the
Corporation may adjust capital spending, hedge future revenue and costs, issue new equity, issue new debt, amend, revise
or extend the terms of existing debt or repay existing debt through non-core asset sales.
NOTES TO THE CONDENSED INTERIM FINANCIAL STATEMENTS For the three and nine months ended September 30, 2017 and 2016 (Expressed in thousands of Canadian dollars except per share amounts; unaudited)
Q 3 2 0 1 7 F I N A N C I A L S T A T E M E N T S P a g e | 13
12. COMMITMENTS
(thousands of dollars) Remainder 2017 2018 2019 2020 2021 Thereafter
Operating Leases $ 117 $ 126 $ - $ - $ - $ -
Flow-through shares - 12,376 - - - -
Firm transportation 843 4,545 3,225 2,460 2,375 9,648
Total $ 960 $ 17,047 $ 3,225 $ 2,460 $ 2,375 $ 9,648
On May 12, 2016, the Corporation issued 14.1 million flow-through shares at a price of $0.71 per flow-through share.
Pursuant to the provisions in the Income Tax Act (Canada), the Corporation shall incur Canadian exploration expenses
(“Qualifying Expenditures”) after May 12, 2016 and prior to December 31, 2017 in the aggregate amount of not less than
$10 million. At September 30, 2017, the Corporation had incurred the full $10.0 million of Qualifying Expenditures.
Between September 1, 2017 and September 15, 2017, the Corporation issued 15.1 million flow-through shares at a price of
$0.82 per flow-through share. Pursuant to the provisions in the Income Tax Act (Canada), the Corporation shall incur
Canadian exploration expenses (“Qualifying Expenditures”) after the issue dates and prior to December 31, 2018 in the
aggregate amount of not less than $12.4 million. At September 30, 2017, the Corporation did not incur any of Qualifying
Expenditures.
13. SUBSEQUENT EVENTS
Acquisition
As previously disclosed, Ikkuma entered into a purchase and sale agreement to acquire assets located in the Alberta Foothills
and British Columbia Deep Basin (the “Foothills Acquisition”), effective as of July 1, 2017. The Foothills Acquisition closed in
escrow on November 14, 2017, with the final closing expected to occur on or about 30 days from closing in escrow. The
original purchase price of $34.0 million has been amended due to the exercise of right of first refusals (“ROFR”) by third
parties. The revised purchase price of $29.7 million reflects the exercised ROFR value of $4.3 million. The Corporation paid
a $3.4 million deposit in August 2017. The Corporation incurred $0.6 million of costs relating to this acquisition up to
September 30, 2017 which have been expensed and included in transaction costs.
Infrastructure Disposition
On October 23, 2017, the Corporation closed its previously announced disposition of 51% of its trunk line and associated
facilities (the “Infrastructure Disposition”) in its existing northern Alberta Foothills properties for a total cash consideration
of $20.1 million, subject to customary adjustments. The Infrastructure Disposition has an effective date of September 1,
2017 and the proceeds of the sale thereof will be used to partially fund the Foothills Acquisition. The Corporation received
a $1.0 million deposit in August 2017.