management’s discussion and analysis of...
TRANSCRIPT

1
theScore, Inc. MANAGEMENT’S DISCUSSION AND ANALYSIS OF
FINANCIAL CONDITION AND RESULTS OF OPERATIONS
For the Three and Nine Months Ended May 31, 2016 and 2015
The following is Management's Discussion and Analysis ("MD&A") of the financial
condition of theScore, Inc. (“theScore” or the “Company”) and our financial performance
for the three and nine months ended May 31, 2016 and 2015. The MD&A should be read
in conjunction with theScore’s unaudited Condensed Consolidated Interim Financial
Statements for the three and nine months ended May 31, 2016 and 2015 (“Interim
Financial Statements”) and Notes thereto. The financial information presented herein has
been prepared in accordance with International Accounting Standard 34, Interim
Financial Reporting (“IAS 34”) as issued by the International Accounting Standards
Board (“IASB”). The interim MD&A should be read in conjunction with theScore’s
MD&A for the year ended August 31, 2015. All amounts are in Canadian dollars unless
otherwise stated. As a result of the rounding of dollar differences, certain total dollar
amounts in this MD&A may not add exactly to their constituent amounts. Throughout
this MD&A, percentage changes are calculated using numbers rounded as they appear.
Except for the historical information contained herein, this MD&A may contain forward-
looking information based on the best estimates of theScore of the current operating
environment. These forward-looking statements are related to, but not limited to,
theScore’s operations, anticipated financial performance, business prospects and
strategies. Forward looking information typically contains statements with words such as
‘‘anticipate’’, ‘‘believe’’, ‘‘expect’’, ‘‘plan’’, ‘‘estimate’’, ‘intend’’, ‘‘will’’, ‘‘may’’,
‘‘should’’ or similar words suggesting future outcomes. These statements reflect current
assumptions and expectations regarding future events and operating performance as of
the date of this MD&A, July 13, 2016. There is significant risk that theScore’s
predictions and other forward-looking statements will not prove to be accurate. Such
forward-looking statements are subject to risks, uncertainties and other factors, which
could cause actual results to differ materially from future results expressed, projected or
implied by such forward-looking statements. Such factors include, but are not limited to,
economic, competitive and media industry conditions. Readers are cautioned not to place
undue reliance on forward-looking information because it is possible that predictions,
forecasts, projections and other forms of forward-looking information will not be
achieved by theScore. By its nature, theScore’s forward-looking information involves
numerous assumptions, inherent risks and uncertainties including, but not limited to, the
following factors: a new and developing industry, historical losses and negative operating
cash flows, liquidity risk, competition, dependence on key suppliers, mobile device users
choosing not to allow advertising, limited long-term agreements with advertisers,
substantial capital requirements, protection of intellectual property, infringement on
intellectual property, brand development, dependence on key personnel and employees,
rapid technology developments, defects in products, user data, reliance on collaborative
partners, new business areas and geographic markets, risks associated with the Swoopt
acquisition and daily fantasy sports, operational and financial infrastructure, information
technology defects, indemnified liability risk, reliance on third-party owned

2
communication networks, uncertain economic health of the wider economy,
governmental regulation of the Internet, currency fluctuations, changes in taxation,
exposure to taxable presences, risk of litigation, internal controls, credit risk, free and
open source software utilization, potential major shareholder with 100% of the special
voting shares, market price and trading volume of Class A Subordinate Voting shares
(“Class A shares”) and Class A Share Purchase Warrants (“Warrants”), dividend policy,
future sale of class A shares by existing shareholders which are all discussed in the
Company’s Annual Information Form dated November 27, 2015.
The Company
theScore, Inc. ("theScore" or the "Company") is an independent creator of mobile-first
sports experiences, connecting fans to a combination of comprehensive and personalized
real-time news, scores, stats, alerts and fantasy sports contests via its mobile sports
platforms theScore, theScore esports, and QuickDraft. theScore is currently
headquartered at 500 King Street West, 4th floor, Toronto, Ontario, M5V 1L9. Class A
subordinate voting shares are traded on the TSX Venture Exchange ("TSX-V") under the
symbol SCR.TO and Warrants are traded under the symbol SCR.WT. The Company is
organized and operates as one operating segment for the purpose of making operating
decisions and assessing performance. At May 31, 2016 theScore had 5,566 special voting
shares, 295,311,949 Class A shares, 19,780,000 Warrants, and 19,427,502 options
outstanding.
Revenue (in thousands of Canadian dollars)
2016 2015 2016 2015
Advertising 6,125$ 2,984$ 18,930$ 8,749$
Licensing - 177 - 677
Total 6,125$ 3,161$ 18,930$ 9,426$
Three months ended May 31, Nine months ended May 31,
Revenues for the three months ended May 31, 2016 and 2015 were $6.1 million and $3.2
million, respectively, an increase of $2.9 million, or 94%. Advertising revenues for the
three months ended May 31, 2016 and 2015 were $6.1 million and $3.0 million
respectively, an increase of $3.1 million or 105%.
Revenues for the nine months ended May 31, 2016 and 2015 were $18.9 million and $9.4
million, respectively, an increase of $9.5 million, or 101%. Advertising revenues for the
nine months ended May 31, 2016 and 2015 were $18.9 million and $8.7 million
respectively, an increase of $10.2 million or 116%.
Increases in advertising revenues were driven by growth in users and user engagement,
combined with increased advertising inventory utilization and per unit advertising rates.
During the three months ended May 31, 2016 theScore’s mobile applications reached 4.3

3
million1 average monthly active users, an increase of 5% over the three months ended
May 31, 2015. Average monthly user sessions of theScore’s mobile applications reached
358 million, up by 27% compared to the three months ended May 31, 2015.
Licensing revenues were nil and $0.18 million, respectively, for the three months ended
May 31, 2016 and 2015. Licensing revenues were nil and $0.68 million, respectively, for
the nine months ended May 31, 2016 and 2015. The contract related to the licensing
revenues ended in May 2015. The Company does not anticipate any further licensing
revenues.
theScore recognizes advertising revenue based on the sale and delivery of advertising
impressions on its digital media platforms.
theScore is currently expanding its direct sales, programmatic sales and sales operations
teams to drive further revenue growth associated with growth in users and user
engagement.
For the three and nine months ended May 31, 2016 revenue from Canadian sources was
$1.9 million and $5.1 million, respectively (2015 - $1.2 million and $3.3 million), while
revenue from non-Canadian sources (predominately USA) for the same periods was $4.2
million and $13.8 million, respectively (2015 - $1.9 million and $6.2 million).
Operating Expenses (in thousands of Canadian dollars)
2016 2015 2016 2015
Personnel $ 4,558 2,897 $ 13,577 7,732
Content 726 377 1,890 984
Technology 482 531 1,590 1,469
Facilities, administrative, and other 1,619 1,385 5,119 3,387
Marketing 1,383 975 4,430 1,827
Depreciation of equipment 166 146 473 410
Amortization of intangible assets 1,149 605 2,649 1,656
Stock Based Compensation 338 224 896 675
Acquisition costs - - - 397
$ 10,421 $ 7,140 $ 30,624 $ 18,537
Nine months ended May 31,Three months ended May 31,
Operating expenses for the three month period ended May 31, 2016 were $10.4 million
compared to $7.1 million in the same period of the prior year, an increase of $3.3 million.
Operating expenses for the nine month period ended May 31, 2016 were $30.6 million
compared to $18.5 million in the same period of the prior year, an increase of $12.1
million.
1 User and user engagement metrics in the current and comparative periods excludes the following platforms no longer supported by
theScore: (i) theScore app on BlackBerry 7, BlackBerry Playbook, Kindle Fire and Windows Phone 7; and (ii) theScore’s legacy soccer application, ScoreMobile FC.

4
Personnel expenses for the three month period ended May 31, 2016 were $4.6 million
compared to $2.9 million in the same period of the prior year, an increase of $1.7 million.
Personnel expenses for the nine month period ended May 31, 2016 were $13.6 million
compared to $7.7 million in the same period of the prior year, an increase of $5.9 million.
The increases in personnel costs were mainly due to the hiring of additional staff in the
product development and content teams with the addition of theScore, esports and
QuickDraft, combined with lower Ontario Interactive Digital Media Tax Credits
(“OIDMTC”) accruals and a reduction in capitalized salaries compared to the prior year
period.
Full time personnel as at May 31, 2016 were 204 compared to 156 in the same period in
the prior year.
Content expenses for the three month period ended May 31, 2016 were $0.7 million
compared to $0.4 million in the same period of the prior year, an increase of $0.3 million.
Content expenses for the nine month period ended May 31, 2016 were $1.9 million
compared to $1.0 million in the same period of the prior year, an increase of $0.9 million.
Increases were primarily due to additional content costs related to theScore esports
initiatives.
Technology expenses for the three month period ended May 31, 2016 were $0.5 million
compared to $0.5 million in the same period of the prior year. Technology expenses for
the nine month period ended May 31, 2016 were $1.6 million compared to $1.5 million in
the same period of the prior year, an increase of $0.1 million. The increase for the nine
month period was due to higher hosting and mobile infrastructure costs related to the
increasing size and engagement level of the user base.
Facilities, administrative and other expenses for the three month period ended May 31,
2016 were $1.6 million compared to $1.4 million in the same period of the prior year, an
increase of $0.2 million. Facilities, administrative and other expenses for the nine month
period ended May 31, 2016 were $5.1 million compared to $3.4 million in the same
period of the prior year, an increase of $1.7 million. The increases were due to higher
facilities costs due to the expansion of the Company’s premises in Toronto and higher
professional fees in the current period.
Marketing expenses for the three month period ended May 31, 2016 were $1.4 million
compared to $1.0 million in the same period of the prior year, an increase of $0.4 million.
Marketing expenses for the nine month period ended May 31, 2016 were $4.4 million
compared to $1.8 million in the same period of the prior year, an increase of $2.6 million.
The increase was due to higher marketing spend for theScore and theScore esports and
promotional costs related to the launch of QuickDraft.
Acquisition costs incurred during the prior year nine month period ended May 31, 2015
totaled $0.4 million. These costs were comprised of legal and other professional fees
related to the acquisition of Swoopt.

5
Depreciation of property and equipment for the three month period ended May 31, 2016
was $0.2 million compared to $0.1 million in the same period of the prior year, an
increase of $0.1 million. Depreciation of property and equipment for the nine month
period ended May 31, 2016 was $0.5 million compared to $0.4 million in the same period
of the prior year, and increase of $0.1 million.
Amortization expense for the three month period ended May 31, 2016 was $1.1 million
compared to $0.6 million in the same period of the prior year, an increase of $0.5 million.
Amortization expense for the nine month period ended May 31, 2016 was $2.6 million
compared to $1.7 million in the same period of the prior year, an increase of $0.9 million.
The increase in amortization expense was due to accelerated amortization of intangible
assets acquired in the prior year.
Stock based compensation for the three month period ended May 31, 2016 was $0.3
million compared to $0.2 million in the same period of the prior year, an increase of $0.1
million. Stock based compensation for the nine month period ended May 31, 2016 was
$0.9 million compared to $0.7 million in the same period of the prior year, and increase
of $0.2 million. The increase in stock based compensation is due to additional stock
options granted in the current year.
Impact of OIDMTCs
In February 2016, the Company received a certificate of eligibility from the Ontario
Media Development Corporation (“OMDC”), related to tax credits claimed for
expenditures incurred in fiscal 2012, 2013 and 2014. As a result, in the three month
period ended February 28, 2016, theScore accrued an additional $0.4 million in tax
credits recoverable, to adjust the existing accrual to the amount deemed eligible per the
certificate of eligibility. $0.2 million of the accrual was recorded as a reduction of
personnel expenses while $0.2 million was recorded as a reduction of related internal
development costs capitalized as intangible assets. No other adjustments to tax credit
accruals have been recorded in the nine month period ended May 31, 2016.
During the three and nine months ended May 31, 2015, the Company, accrued $0.5
million and $1.4 million, respectively, in tax credits recoverable. $0.2 million was
recorded as a reduction of personnel expenses in the three months ended May 31, 2015
(nine months ended May 31, 2015- $0.9 million), while $0.3 million was recorded as a
reduction of related internal development costs capitalized as intangible assets in the
three months ended May 31, 2015 (nine months ended May 31, 2015- $0.5 million).
Due to proposed amendments to eligibility rules for these tax credits, the Company
ceased recording the benefits of these tax credits for expenditures incurred after April 23,
2015, the date the 2015 Ontario budget was tabled.

6
Adjusted EBITDA and Net and Comprehensive losses
theScore utilizes earnings before interest, taxes, depreciation, amortization and
acquisition costs (“Adjusted EBITDA”) to measure operating performance. theScore’s
definition of Adjusted EBITDA excludes depreciation and amortization, finance income
or expense, income taxes, and acquisition costs which in theScore's view do not
adequately reflect its core operating results. Adjusted EBITDA is used in the
determination of short-term incentive compensation for all senior management personnel.
The Company revised the non-GAAP measure in fiscal 2015 from EBITDA to adjusted
EBITDA, as a result of the acquisition costs incurred related to Swoopt.
Adjusted EBITDA is not a measure of performance under IFRS and should not be
considered in isolation or as a substitute for net and comprehensive income or loss
prepared in accordance with IFRS or as a measure of operating performance or
profitability. Adjusted EBITDA does not have a standardized meaning prescribed by
IFRS and is not necessarily comparable to similar measures presented by other
companies.
The following table reconciles net and comprehensive loss to Adjusted EBITDA:
(in thousands of Canadian dollars)
2016 2015 2016 2015
Net and comprehensive loss for the period (4,446)$ (3,987)$ (11,697)$ (8,847)$
Adjustments:
Depreciation and amortization 1,315 751 3,122 2,066
Finance income 150 8 3 (264)
Acquisition costs - - - 397
Adjusted EBITDA loss (2,981)$ (3,228)$ (8,572)$ (6,648)$
Three months ended May 31, Nine months ended May 31,
Adjusted EBITDA loss for the three month period ended May 31, 2016 was $3.0 million
compared to $3.2 million in the same period in the prior year, a decrease of $0.2 million.
Adjusted EBITDA loss for the nine month period ended May 31, 2016 was $8.6 million
compared to $6.6 million in the same period in the prior year, an increase of $2 million.
Net and comprehensive loss in the three and nine month period ended May 31, 2016 was
$4.4 million and $11.7 million, respectively, compared to $4.0 million and $8.8 million,
respectively, in the same period in the prior year.
The increases in Adjusted EBITDA loss for the nine month period ended May 31, 2016
and net and comprehensive loss for the nine month period ended May 31, 2016 were
primarily due to higher personnel, facilities, marketing and other costs as previously
discussed, partially offset by continued revenue growth.

7
Loss per share for the three month period was $(0.02) compared to $(0.01) in the prior
year. Loss per share for the nine month period was $(0.04) compared to $(0.03) in the
prior year. Increases in loss per share are mainly due to increases in net losses.
Additions to Intangible Assets
Additions to intangible assets for the three and nine months ended May 31, 2016 totaled
$0.6 million and $1.5 million, respectively, compared to $0.9 million and $3.8 million in
the prior year. The significant development projects for the current nine month period
consisted of the continued development of QuickDraft, the development of significant
new features for theScore esports – personalization and localization, the development of
messenger bots, and additional sports sections on theScore application.
The Company capitalized internal product development costs during the three and nine
months ended May 31, 2016 and 2015 for both new development projects and projects
that, in management’s judgement, represent substantial improvements to existing
products. In assessing whether costs can be capitalized for improvements, management
exercises significant judgement when considering the extent of the improvement and
whether it is substantial, whether it is sufficiently separable and whether expected future
economic benefits are derived from the improvement itself. Factors considered in
assessing the extent of the improvement include, but are not limited to, the degree of
change in functionality and the impact of the project on the ability of the Company to
attract users to its products and increase user engagement with its products. Costs, which
do not meet these criteria, such as enhancements and routine maintenance, are expensed
when incurred. Future economic benefits from these capitalized projects include net cash
flows from future advertising sales, which are dependent upon the ability of the Company
to attract users to its products and increase user engagement with its products, and may
also include anticipated cost savings, depending upon the nature of the development
project.
Consolidated Quarterly Results
The following selected consolidated quarterly financial data of the Company relates to
the preceding eight quarters, inclusive of the quarter ended May 31, 2016.
Quarterly Results Revenue
Adjusted
EBITDA loss
Net and
comprehensive
loss
Loss per share –
basic and diluted
($000’s) ($000’s) ($000’s) ($)
May 31, 2016 6,125 (2,981) (4,446) (0.02)
February 29, 2016 5,802 (3,248) (4,193) (0.01)
November 30, 2015 7,003 (2,344) (3,059) (0.01)
August 31, 2015 2,933 (4,020) (4,622) (0.02)
May 31, 2015 3,161 (3,228) (3,987) (0.01)
February 28, 2015 3,219 (1,924) (2,845) (0.01)
November 30, 2014 3,046 (1,496) (2,015) (0.01)
August 31, 2014 1,804 (3,246) (3,933) (0.02)

8
Use of the Company’s applications has historically reflected the general trends for sports
schedules of the major North American sports leagues. As a result, the Company’s first
fiscal quarter is typically the strongest from a revenue perspective.
Quarterly revenue fluctuations are a combination of the seasonality trend of usage
described above and year over year revenue growth.
Adjusted EBITDA loss and net and comprehensive loss fluctuations were due to
increases in personnel and infrastructure costs required to sustain periods of rapid growth
and expansion, partially offset by seasonal revenue fluctuations and reduced OIDMTC
accruals.
Liquidity Risk and Capital Resources
Cash and cash equivalents as of May 31, 2016 were $19.5 million compared to $31.8
million as of fiscal year ended August 31, 2015.
Liquidity
Management prepares budgets and cash flow forecasts to assist in managing liquidity
risk. theScore has a history of operating losses, and can be expected to generate
continued operating losses and negative cash flows in the future while it carries out its
current business plan to further develop and expand its digital media business. While
theScore can utilize its cash and cash equivalents to fund its operating and development
expenditures, it does not have access to committed credit facilities or other committed
sources of funding, and depending upon the level of expenditures and whether profitable
operations can be achieved, may be required to seek additional funding in the future.
theScore does not have any financial instruments, other than its cash and cash
equivalents, accounts receivable, accounts payable and an available-for-sale investment.
Refer to note 8 of theScore’s interim financial statements for additional details.
Operations
Cash flows used in operating activities for the nine months ended May 31, 2016 were
$10.1 million compared to $5.9 million in the same period of the prior year. The increase
in cash flows used in operations was a result of the increase in net and comprehensive
loss, as well as the increased use of cash for changes in non-cash operating assets and
liabilities.
Financing
Cash flows provided by financing activities for the nine months ended May 31, 2016 and
2015 were $0.1 million and $24.9 million, respectively. During the nine months ended
May 31, 2015, the Company issued common shares and warrants for net proceeds of
$24.9 million.
9
Investing
Cash flows used in investing activities for the nine months ended May 31, 2016 and 2015
were $2.3 million and $4.1 million, respectively. The decrease was mainly due to the
Swoopt acquisition in the prior year and a reduction in capitalized salaries in the current
period compared to the same period in the prior year.
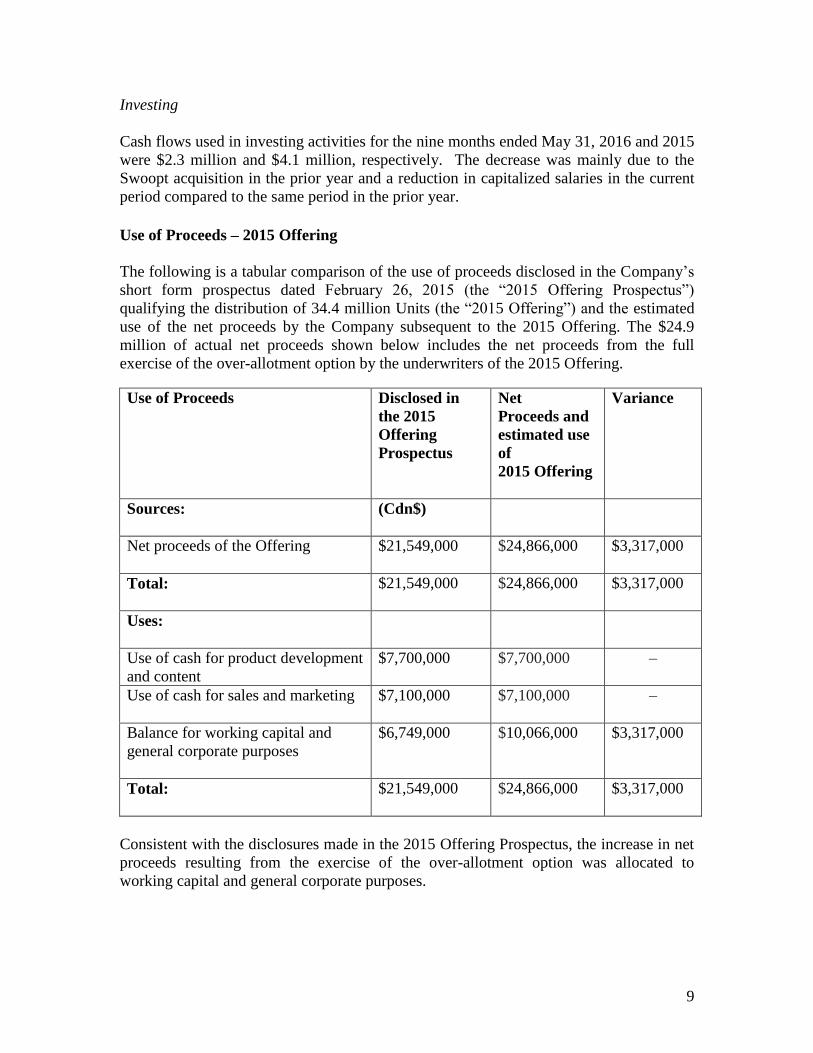
Use of Proceeds – 2015 Offering
The following is a tabular comparison of the use of proceeds disclosed in the Company’s
short form prospectus dated February 26, 2015 (the “2015 Offering Prospectus”)
qualifying the distribution of 34.4 million Units (the “2015 Offering”) and the estimated
use of the net proceeds by the Company subsequent to the 2015 Offering. The $24.9
million of actual net proceeds shown below includes the net proceeds from the full
exercise of the over-allotment option by the underwriters of the 2015 Offering.
Use of Proceeds Disclosed in
the 2015
Offering
Prospectus
Net
Proceeds and
estimated use
of
2015 Offering
Variance
Sources: (Cdn$)
Net proceeds of the Offering $21,549,000 $24,866,000 $3,317,000
Total: $21,549,000 $24,866,000 $3,317,000
Uses:
Use of cash for product development
and content
$7,700,000 $7,700,000 –
Use of cash for sales and marketing $7,100,000 $7,100,000 –
Balance for working capital and
general corporate purposes
$6,749,000 $10,066,000 $3,317,000
Total: $21,549,000 $24,866,000 $3,317,000
Consistent with the disclosures made in the 2015 Offering Prospectus, the increase in net
proceeds resulting from the exercise of the over-allotment option was allocated to
working capital and general corporate purposes.

10
Other than the increased funds for working capital and general corporate purposes
disclosed above, to date, there have been no material variances in the estimated use of
proceeds from the disclosures made in the 2015 Offering Prospectus.
Commitments
The Company has no debt guarantees, off-balance sheet arrangements or long-term
obligations other than the office lease agreement noted below.
theScore has the following firm commitments under agreements:
(in thousands of Canadian dollars)
Not later than one
year
Later than one year and
not later than five years
Later than
five years Total
Content $ 78 - - $ 78
Office lease 849 3,757 1,297 5,903
Total $ 927 $ 3,757 $ 1,297 $ 5,981
Office lease:
theScore’s current lease agreement is for a 30,881 square foot space at its head office in
Toronto, Ontario, and runs until September 30, 2022.
Related Party Transactions
In Fiscal 2013, theScore entered into a lease for a property partially owned by John Levy,
the Chairman and Chief Executive Officer of the Company. The aggregate rent paid
during the three and nine months ended May 31, 2016 amounted to $10,000 and $28,000,
respectively (2015 - $7,000 and $22,000).
The corresponding payable balances as at May 31, 2016 and August 31, 2015 were nil.
These transactions are recorded at the exchange amount, being the amount agreed upon
between the parties. Management believes that the terms of the agreement are at fair
market value.
New standards and amendments not yet effective:
The following new standards and amendments, which are not yet mandatorily effective
and have not been adopted early in these consolidated financial statements, will or may
have an effect on the Company's future financial statements:

11
IAS 1, Presentation of Financial Statements ("IAS 1"):
In December 2014, the IASB issued amendments to IAS 1 as part of its major initiative to
improve presentation and disclosure in financial reports. The amendments relate to
materiality, order of the notes, subtotals, accounting policies, and disaggregation. The
amendments are to be applied prospectively and are effective for periods beginning on or
after January 1, 2016. The Company does not expect the amendments to have a material
impact on its financial statements.
IFRS 9, Financial Instruments ("IFRS 9"):
In July 2014, the IASB issued the final publication of the IFRS 9 standard, which will
supersede IAS 39, Financial Instruments: recognition and measurement (IAS 39). IFRS 9
includes revised guidance on the classification and measurement of financial instruments,
including a new expected credit loss model for calculating impairment on financial
assets, and the new hedge accounting guidance. It also carries forward the guidance on
recognition and derecognition of financial instruments from IAS 39. The standard is
effective for annual periods beginning on or after January 1, 2018, with early adoption
permitted.
The Company intends to adopt IFRS 9 (2014) in its financial statements for the annual
period beginning on September 1, 2018. The extent of the impact of adoption of the
standard has not yet been determined.
Annual Improvements to IFRS:
On September 25, 2014, the International Accounting Standards Board ("IASB") issued
narrow-scope amendments to a total of four standards as part of its annual improvement
process. The amendments will apply for annual periods beginning on or after January 1,
2016. Earlier application is permitted, in which case, the related consequential
amendments to other IFRSs would also apply. The extent of the impact of adoption of
the amendments has not yet been determined.
IFRS 15, Revenue from Contracts with Customers ("IFRS 15"):
In May 2014, the IASB issued IFRS 15, which supersedes existing standards and
interpretations including IAS 18, Revenue, and IFRIC 13, Customer Loyalty
Programmes. IFRS 15 introduces a single model for recognizing revenue from contracts
with customers with the exception of certain contracts under other IFRSs. The standard
requires revenue to be recognised in a manner that depicts the transfer of promised goods
or services to a customer and at an amount that reflects the expected consideration
receivable in exchange for transferring those goods or services. This is achieved by
applying the following five steps:
1. Identify the contract with a customer;
2. Identify the performance obligations in the contract;

12
3. Determine the transaction price;
4. Allocate the transaction price to the performance obligations in the contract; and
5. Recognise revenue when (or as) the entity satisfies a performance obligation.
IFRS 15 also provides guidance relating to the treatment of contract acquisition and
contract fulfilment costs.
The standard is effective for annual periods beginning on or after January 1, 2018. The
Company is assessing the impact of this standard on the consolidated financial
statements.
IFRS 16, Leases ("IFRS 16"):
In January 2016, the IASB issued the final publication of the IFRS 16 standard, which
will supersede the current IAS 17, Leases (IAS 17) standard. IFRS 16 introduces a single
accounting model for lessees and for all leases with a term of more than 12 months,
unless the underlying asset is of low value. A lessee will be required to recognize a right-
of-use asset, representing its right to use the underlying asset, and a lease liability,
representing its obligation to make lease payments. The accounting treatment for lessors
will remain largely the same as under IAS 17.
The standard is effective for annual periods beginning on or after January 1, 2019, with
early adoption permitted, but only if the entity is also applying IFRS 15. The Company
has the option to either apply IFRS 16 with full retrospective effect or recognize the
cumulative effect of initially applying IFRS 16 as an adjustment to opening equity at the
date of initial application.
The Company is assessing the impact of this standard on our consolidated financial
statements.
Financial Instruments and other instruments:
The Company’s financial instruments were comprised of the following as at May 31,
2016: cash and cash equivalents of $19.5 million; accounts receivable of $5.8 million;
investment of $0.8 million; and accounts payable and accrued liabilities of $4.7 million.
The Company invested its cash equivalents in government treasury bills. Accounts
receivable are carried at amortized cost. Accounts payable and accrued liabilities are
carried at amortized cost, and are comprised of short-term obligations owing to suppliers
relative to the Company’s operations.

13
Fair Value
Fair value is the estimated amount that the Company would pay or receive to dispose of
financial instruments in an arm’s length transaction between knowledgeable, willing
parties who are under no compulsion to act. The fair value of financial instruments that
are traded in active markets at each reporting date is determined by reference to quoted
market prices, without any deduction for transaction costs. For financial instruments not
traded in an active market, the fair value is determined using appropriate valuation
techniques that are recognized by market participants. Such techniques may include using
recent arm’s length market transactions, reference to the current fair value of another
instrument that is substantially the same, discounted cash flow analysis or other valuation
models.
The fair values of theScore's financial assets and liabilities, including cash and cash
equivalents, accounts receivable, and accounts payable and accrued liabilities were
deemed to approximate their carrying amounts due to the relative short-term nature of
these financial instruments.
The Company has one financial asset measured on a fair value basis using Level 3 inputs
being an available-for-sale financial asset with a fair value of $760,000 at May 31, 2016
(August 31, 2015 - $760,000), which has been determined by reference to the most recent
external capital financing transaction and consideration of other indicators of fair value as
the entity is not a public company and, therefore, there is no quoted market price at
theScore's reporting date.
Concentration of Accounts Receivable
theScore has customer concentration risk as one customer (a programmatic network)
represented 18% of revenues for the three months ended May 31, 2016 (May 31, 2015 –
no significant customer concentration risk as no customers represented more than 10% of
revenues). During the nine months ended May 31, 2016, one customer (a programmatic
network) represented 24% of revenues (May 31, 2015 – two customers represented 12%
and 15% of revenues, respectively).
As at May 31, 2016 two customers (programmatic networks) represented 12% and 11%,
respectively, of the accounts receivable balance (August 31, 2015 – two customers
represented 12% each).