management’s discussion and analysis of financial...
TRANSCRIPT

1
MANAGEMENT’S DISCUSSION AND ANALYSIS
OF FINANCIAL CONDITION AND RESULTS OF OPERATIONS
You should read the following discussion and analysis of our financial condition and results of operations
as of 31 March 2014 and for the three months then ended (hereinafter referred to as “MD&A”) in conjunction with our unaudited consolidated interim condensed financial information as of and for the
three months ended 31 March 2014 and 2013 (hereinafter referred to as the “consolidated interim
financial information”). The consolidated interim financial information has been prepared in accordance with International Accounting Standard (“IAS”) 34 “Interim Financial Reporting”.
The financial and operational information contained in this MD&A comprises information on
ОAO SIBUR Holding and its consolidated subsidiaries (hereinafter jointly referred to as “we”, “SIBUR” or the “Group”).
SELECTED DATA(1)
Operating Results
The following table presents the Group’s key operational measures for the three months ended 31 March
2014 and 2013: Three months ended 31 March Change
% Tonnes, except as stated 2014 2013
Processing and production volumes
APG processing
(2) (thousand cubic metres) 5,038,650 4,872,095 3.4%
APG processing, SIBUR's share(3)
(thousand cubic metres) 3,632,942 3,428,147 6.0%
Natural gas production(2)
(thousand cubic metres) 4,360,023 4,223,915 3.2%
Natural gas production, SIBUR's share(3)
(thousand cubic metres) 3,030,307 2,863,610 5.8%
Raw NGL production(2)
1,392,966 1,295,491 7.5%
Raw NGL production, SIBUR’s share(3)
1,000,938 920,575 8.7%
Sales volumes
Natural gas sales volumes (thousand cubic metres) 2,898,382 3,523,923 (17.8%)
NGLs sales volumes 1,538,274 1,095,126 40.5%
MTBE, other fuels & fuel additives sales volumes 151,928 181,770 (16.4%)
Petrochemical products sales volumes 496,383 529,203 (6.2%)
Basic polymers 138,898 102,684 35.3%
Synthetic rubbers 91,007 107,200 (15.1%)
Plastics and organic synthesis products 175,184 183,278 (4.4%)
Intermediates and other chemicals 91,294 136,041 (32.9%)
(1)
Please note that in this and other tables of this MD&A, immaterial deviations in the calculation of percentage changes, subtotals and totals are
explained by rounding. (2)
Including Rosneft’s share in the processing / production volumes of OOO Yugragazpererabotka. (3)
Excluding Rosneft’s share in the processing / production volumes of OOO Yugragazpererabotka.

2
Financial Results
The following table presents the Group's key financial measures for the three months ended 31 March
2014 and 2013: Three months ended 31 March Change
% RR millions, except as stated 2014 2013
Income statement highlights
Revenue (net of VAT and export duties) 80,002 66,184 20.9%
EBITDA 22,569 20,505 10.1%
EBITDA margin, % 28.2% 31.0%
Profit for the reporting period 56,774 15,634 263.1%
Profit margin, % 71.0% 23.6%
Adjusted profit(1)
7,901 13,221 (40.2%)
Adjusted profit margin, % 9.9% 20.0%
Cash flow highlights
Net cash from operating activities 16,860 23,105 (27.0%)
Net cash used in investing activities, including (35,627) (22,131) 61.0%
Purchase of property, plant and equipment (13,682) (21,507) (36.4%)
Acquisition of interest in subsidiaries, net of cash acquired (20,547) - n/m
Net cash from financing activities 22,135 3,743 491.3%
As of 31 March 2014 As of 31 December 2013
Key ratios
Debt / EBITDA 1.62x 1.27x
Net debt(2)
/ EBITDA 1.48x 1.17x
EBITDA / Interest(3)
18x 17x
In the first quarter of 2014, our revenue increased by 20.9% to RR 80,002 million compared to
RR 66,184 million in the first quarter of 2013. Our energy product group delivered strong performance
primarily due to higher sales volumes on expanded seaborne sales following the launch of Ust-Luga transshipment facility, which provides for advantaged logistics, in the end of 2013. The healthy
performance of our basic polymers product group was attributable to higher polypropylene production
following the launch of Tobolsk-Polymer plant in the second half of 2013. This was partially offset by
declining revenue from sales of synthetic rubbers, intermediates & other chemicals and processing services. Our synthetic rubber business remained under significant pressure in the negative market
environment. An unscheduled shutdown at our steam cracker in Kstovo resulted in a decrease in
production of certain intermediates and the respective decline in revenue from sales of intermediates & other chemicals. Also, following the deconsolidation of OOO Yugragazpererabotka as of 12 March 2013,
we did not consolidate its revenue until March 2014, when we gained full control over
OOO Yugragazpererabotka, which resulted in a decrease in sales of processing services in the first quarter of 2014. In the first quarter of 2014, we benefited from substantial Russian rouble depreciation
against the US dollar and the euro.
Our EBITDA for the period amounted to RR 22,569 million, a year-on-year growth by 10.1% from RR 20,505 million in the first quarter of 2013. Our EBITDA margin totaled 28.2% compared to 31.0%
reported a year earlier. The year-on-year decrease in EBITDA margin was primarily attributable to a
substantial expansion of trading activities in energy products, as well as tighter spreads between feedstock and end-product prices, particularly in the synthetic rubber product group.
Our profit for the first quarter of 2014 increased almost four times to RR 56,774 million from
RR 15,634 million a year earlier. The increase was mainly attributable to RR 52,773 million non-cash
gain on acquisition of a 49% stake in OOO Yugragazpererabotka related to the revaluation of SIBUR’s
share in the JV accounted for at historical cost before the transaction. This was partially offset by a foreign exchange loss on the revaluation of our USD-denominated debt, a non-cash charge related to the
equity-settled share-based payment plans granted to the Group’s former and current directors and key
management in July 2013, and a non-cash gain on deconsolidation of OOO Yugragazpererabotka in the first quarter of 2013. Our profit margin in the reporting period amounted to 71.0% versus 23.6% in the
first quarter of 2013.
(1)
Profit for the reporting period net of equity-settled share-based payment plans and the non-cash gain on acquisition and deconsolidation of
OOO Yugragazpererabotka. (2)
Net debt represents total debt less cash and cash equivalents. (3)
Interest represents accrued interest, i.e. includes interest expense and capitalised interest.
3
Net of the non-cash charge related to the equity-settled share-based payment plans, non-cash gain on
deconsolidation of OOO Yugragazpererabotka in March 2013 and gain on its acquisition in March 2014,
our profit decreased by 40.2% year-on-year to RR 7,901 million in the first quarter of 2014 from RR 13,221 million a year earlier. The corresponding profit margin totaled 9.9% compared to 20.0% in
the first quarter of 2014 and 2013, respectively. The decrease in profit margin was largely due to a
substantial foreign exchange loss in the first quarter of 2014 attributable to the revaluation of our foreign currency-denominated debt.
Our net cash from operating activities decreased by 27.0% year-on-year to RR 16,860 million from
RR 23,105 million in the first quarter of 2013, as the increase in EBITDA was largely offset by a negative impact from changes in working capital and higher income tax paid.
For a detailed discussion on SIBUR’s operational and financial performance see “Results of Operations” and “Liquidity and Capital Resources”.
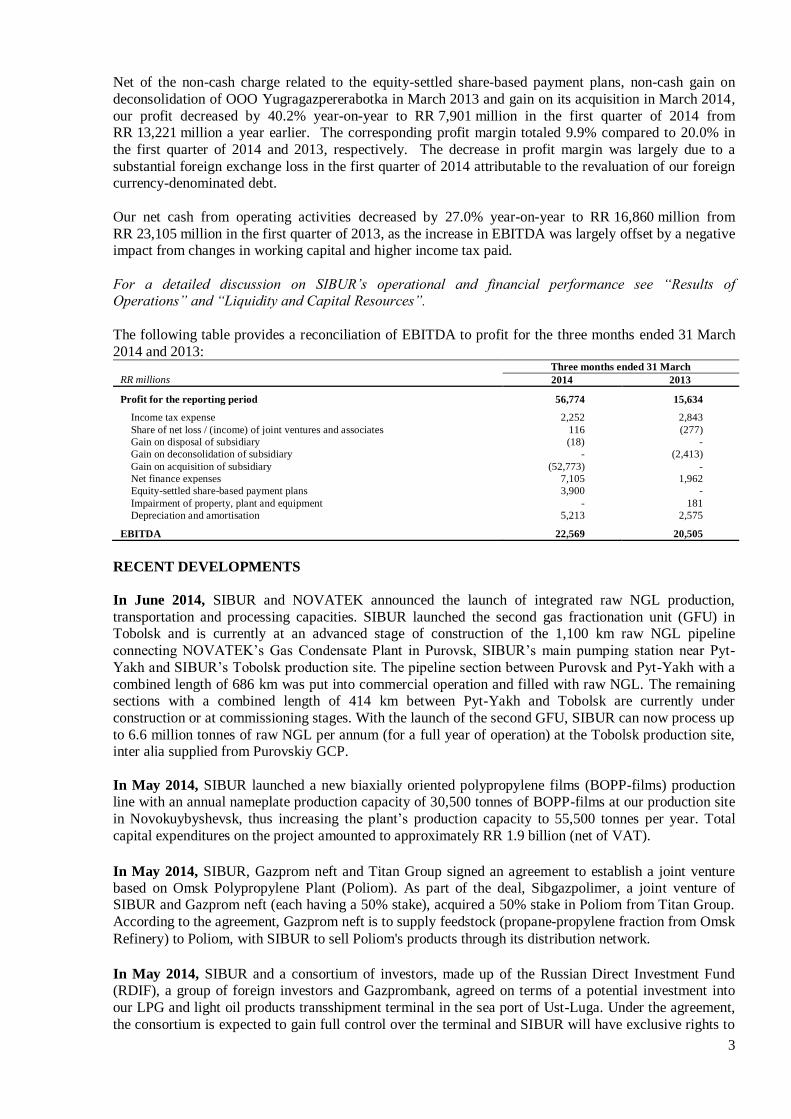
The following table provides a reconciliation of EBITDA to profit for the three months ended 31 March
2014 and 2013: Three months ended 31 March
RR millions 2014 2013
Profit for the reporting period 56,774 15,634
Income tax expense 2,252 2,843
Share of net loss / (income) of joint ventures and associates 116 (277)
Gain on disposal of subsidiary (18) -
Gain on deconsolidation of subsidiary - (2,413)
Gain on acquisition of subsidiary (52,773) -
Net finance expenses 7,105 1,962
Equity-settled share-based payment plans 3,900 -
Impairment of property, plant and equipment - 181
Depreciation and amortisation 5,213 2,575
EBITDA 22,569 20,505
RECENT DEVELOPMENTS
In June 2014, SIBUR and NOVATEK announced the launch of integrated raw NGL production,
transportation and processing capacities. SIBUR launched the second gas fractionation unit (GFU) in Tobolsk and is currently at an advanced stage of construction of the 1,100 km raw NGL pipeline
connecting NOVATEK’s Gas Condensate Plant in Purovsk, SIBUR’s main pumping station near Pyt-
Yakh and SIBUR’s Tobolsk production site. The pipeline section between Purovsk and Pyt-Yakh with a
combined length of 686 km was put into commercial operation and filled with raw NGL. The remaining sections with a combined length of 414 km between Pyt-Yakh and Tobolsk are currently under
construction or at commissioning stages. With the launch of the second GFU, SIBUR can now process up
to 6.6 million tonnes of raw NGL per annum (for a full year of operation) at the Tobolsk production site, inter alia supplied from Purovskiy GCP.
In May 2014, SIBUR launched a new biaxially oriented polypropylene films (BOPP-films) production line with an annual nameplate production capacity of 30,500 tonnes of BOPP-films at our production site
in Novokuybyshevsk, thus increasing the plant’s production capacity to 55,500 tonnes per year. Total
capital expenditures on the project amounted to approximately RR 1.9 billion (net of VAT).
In May 2014, SIBUR, Gazprom neft and Titan Group signed an agreement to establish a joint venture based on Omsk Polypropylene Plant (Poliom). As part of the deal, Sibgazpolimer, a joint venture of SIBUR and Gazprom neft (each having a 50% stake), acquired a 50% stake in Poliom from Titan Group.
According to the agreement, Gazprom neft is to supply feedstock (propane-propylene fraction from Omsk
Refinery) to Poliom, with SIBUR to sell Poliom's products through its distribution network.
In May 2014, SIBUR and a consortium of investors, made up of the Russian Direct Investment Fund (RDIF), a group of foreign investors and Gazprombank, agreed on terms of a potential investment into
our LPG and light oil products transshipment terminal in the sea port of Ust-Luga. Under the agreement,
the consortium is expected to gain full control over the terminal and SIBUR will have exclusive rights to
4
utilise 100% of the LPG transshipment capacity on pre-agreed terms. The transaction amount is expected
to exceed USD 700 million.
In May 2014, SIBUR and SINOPEC INTERNATIONAL (HONG KONG), Co., Limited (“SINOPEC”)
entered into a strategic cooperation agreement involving sharing of expertise and resources. The parties
will consider collaboration opportunities in gas processing and petrochemicals projects and discuss potential expansion of trading operations.
In May 2014, SIBUR and SINOPEC INTERNATIONAL (HONG KONG), Co., Limited (“SINOPEC”)
also signed a contract to establish a JV for the construction of a 50,000 tonnes per annum butadiene nitrile rubber (NBR) plant in the Shanghai Chemical Industry Park. Under the terms of this contract, SINOPEC
will hold 74.9% of shares in the newly formed entity, while SIBUR will hold 25.1% of shares. The parties
also signed a technology license agreement for the use of SIBUR's NBR production technology at the new facility.
In May 2014, SIBUR paid RR 6,383 million in dividends for the second half of 2013 calculated as 25%
of the net profit for the second half of 2013 based on the IFRS consolidated financial statements and adjusted for exceptional non-cash items.
In April 2014, SIBUR completed expansion of its polyethylene terephthalate (PET) capacity at the Polief production site from 140,000 tonnes to 210,000 tonnes per annum. Total capital expenditures on the
project amounted to approximately RR 1.9 billion (net of VAT).
In April 2014, SIBUR divested its PVC cable compounds production, previously operated by SIBUR-
Neftekhim, a SIBUR’s subsidiary. Following the divestment, SIBUR does not carry plastic compounds
in its product portfolio.
In March 2014, SIBUR approved an expansion project of the Vyngapurovskiy GPP to accommodate
APG supplies from Russneft's fields. In 2013, SIBUR and Russneft signed an agreement for supplies of
APG from Varieganneft's fields to SIBUR, with SIBUR accepting and processing the volumes supplied. The project is designed to increase the annual APG processing capacity of Vyngapurovskiy GPP from 2.8
to 4.2 billion cubic metres.
In March 2014, SIBUR and Rosneft agreed on a new format and terms of cooperation. SIBUR acquired
from Rosneft a 49% interest in OOO Yugragazpererabotka, a joint venture that owns the
Nizhnevartovskiy, Belozerniy and Nyagan GPPs, gaining full control over the assets. New contracts with
extended tenor through the end of 2032 were signed for (i) APG supplies from Rosneft's fields to OOO Yugragazpererabotka’s GPPs with guaranteed supply volumes of approximately 10 billion cubic
metres per annum, and (ii) dry gas(1)
sales from Nizhnevartovskiy and Belozerniy GPPs to Rosneft. See
Appendix II for further details.
In February 2014, SIBUR divested its 100% interest in the Oka Polymer industrial park located in
Dzerzhinsk, the Nizhny Novgorod region, as a non-core asset, to Tosol-Sintez, a resident of the park.
Oka Polymer industrial park was established in the process of transformation of the production site of Caprolactam, an obsolete chlorine and caustic soda production facility decommissioned in April 2013.
(1)
Equivalent to natural gas.

5
SELECTED MACROECONOMIC AND MARKET DATA
GDP Growth
The following table contains selected data on year-on-year GDP growth for the three months ended
31 March 2014 and 2013: Three months ended 31 March
2014 2013
European Union (EU-15)
1.3% (0.8%)
United States
2.3% 1.3%
China
7.4% 7.7%
Russia 0.9%(1)
0.8%
Source: Eurostat, U.S. Bureau of Economic Analysis, National Bureau of Statistics of the People's Republic of China, Russian Federal State
Statistics Service
Foreign Exchange Rate Fluctuations
The following table presents selected data on exchange rate movements for the three months ended 31 March 2014 and 2013:
Three months ended 31 March
2014 2013
RR/USD rate at the end of the preceding period 32.7292 30.3727
RR/USD rate at the end of the reporting period 35.6871 31.0834
Average RR/USD rate for the period 34.9591 30.4142
RR/EUR rate at the end of the preceding period 44.9699 40.2286
RR/EUR rate at the end of the reporting period 49.0519 39.8023
Average RR/EUR rate for the period 47.9460 40.1908
Source: CBR
The Russian rouble on average depreciated by 14.9% relative to the US dollar and by 19.3% relative to
the euro in the first quarter of 2014 compared to the average level of the first quarter of 2013, which had a
positive impact on our revenue. At the same time, the Russian rouble as of 31 March 2014 depreciated against the year-end level of 2013 by 9.0% relative to the US dollar and by 9.1% relative to the euro,
resulting in a financial loss reported in SIBUR’s interim condensed financial information, which was
largely attributable to the revaluation of our foreign currency-denominated debt. SIBUR currently does
not employ any financial instruments to hedge against currency fluctuations.
Inflation
The following table presents selected data on Russian inflation rates for the three and twelve months
ended 31 March 2014 and 2013 relative to the three and twelve months ended 31 March 2013 and 2012:
31 March to 31 December(2)
31 March to 31 March(3)
2014/2013 2013/2012 2014/2013 2013/2012
Consumer price index (CPI) 2.3% 1.9%
6.9% 7.0%
Producer price index (PPI) 2.3% 0.8% 5.2% 3.0%
Source: Russian Federal State Statistics Service
(1)
Preliminary data. (2)
Quarterly basis. (3)
Annual basis.

6
Market Prices for Energy Products
The following table presents average benchmark international market prices for crude oil, naphtha and LPG for the three months ended 31 March 2014 and 2013:
Three months ended 31 March Change
USD per tonne, except as stated 2014 2013 %
Brent crude oil (USD per bbl)(1)
107.9 112.6 (4.2%)
Naphtha (CIF NWE)(2)
915.3 945.9 (3.2%)
LPG DAF Brest(2)
753.7 694.0 8.6%
LPG Sonatrach(2)
860.2 880.3 (2.3%)
LPG CIF ARA (large)(2)
833.5 866.1 (3.8%)
Source: (1) Bloomberg (2)
Argus
Export Duties on LPG and Naphtha
The following table presents export duties on LPG and naphtha for the periods and as of the dates
indicated: Three months ended 31 March
Change, % Export duties, USD per tonne 2014 2013
LPG (excl. butane and isobutane)
At the end of the period 169.1 131.4 28.7%
Average for the period 189.3 176.8 7.1%
Naphtha (excl. pentane and isopentane)
At the end of the period 345.9 378.6 (8.6%)
Average for the period 351.4 365.9 (4.0%)
Source: Russian Government
Natural Gas Prices
The following table presents information on regulated natural gas price changes:
Regulated natural gas
price changes
Effective date of increase %
1 January 2009 5.0%
1 April 2009 7.0%
1 July 2009 7.0%
1 October 2009 6.2%
1 January 2010 15.0%
1 January 2011 15.0%
1 July 2012 15.0%
1 April 2013 (3.0%)
1 July 2013 15.0%
1 August 2013 3.1%
1 October 2013 1.9%
1 January 2014 (1.9%)
Electricity and Heat Tariffs
The following table presents volumes purchased and effective average prices for electricity and heat
tariffs for the three months ended 31 March 2014 and 2013: Three months ended 31 March Change
%
2014 2013
Volume
Average
tariff Volume
Average
tariff Volume
Average
tariff
Electricity (millions of kw/hour or RR per kw/hour) 1,635 2.20 2,330 1.97 (29.8%) 11.7%
Heat (thousands of gigacalories or RR per gigacalory) 2,465 762 2,812 737 (12.3%) 3.4%

7
RESULTS OF OPERATIONS FOR THE THREE MONTHS ENDED 31 MARCH 2014 AND 2013
The following table presents selected data on our results of operations for the three months ended
31 March 2014 and 2013: Three months ended 31 March Change
% RR millions, except as stated 2014 % of revenue 2013 % of revenue
Revenue 80,002 100.0% 66,184 100.0% 20.9%
Energy products 49,622 62.0% 34,846 52.7% 42.4%
Petrochemical products 28,233 35.3% 28,326 42.8% (0.3%)
Other 2,147 2.7% 3,012 4.6% (28.7%)
Operating expenses before equity-settled share-based
payment plans (62,646) (78.3%) (48,435) (73.2%) 29.3%
Equity-settled share-based payment plans (3,900) (4.9%) - - n/m
Operating expenses (66,546) (83.2%) (48,435) (73.2%) 37.4%
Operating profit 13,456 16.8% 17,749 26.8% (24.2%)
Net finance expenses (7,105) (8.9%) (1,962) (3.0%) 262.3%
Gain on acquisition of subsidiary 52,773 66.0% - - n/m
Gain on deconsolidation of subsidiary - - 2,413 3.6% (100.0%)
Gain on disposal of subsidiary 18 0.0% - - n/m
Share of net (loss) / income of joint ventures and
associates (116) (0.1%) 277 0.4% n/m
Profit before income tax 59,026 73.8% 18,477 27.9% 219.5%
Income tax expense (2,252) (2.8%) (2,843) (4.3%) (20.8%)
Profit from continuing operations 56,774 71.0% 15,634 23.6% 263.1%
Profit for the reporting period, including attributable to: 56,774 71.0% 15,634 23.6% 263.1%
Non-controlling interest (11) (0.0%) 23 0.0% n/m
Shareholders of SIBUR 56,785 71.0% 15,611 23.6% 263.8%
Revenue
In the first quarter of 2014, our revenue increased by 20.9% to RR 80,002 million as compared to
RR 66,184 million in the respective period of 2013. The dynamics was attributable to the solid
performance of energy products with a 42.4% year-on-year growth, while revenue from sales of petrochemical products remained largely flat, which was partially offset by a decrease in other revenue
that was down 28.7% year-on-year.
The following table presents a breakdown of our revenue by product group for the three months ended
31 March 2014 and 2013: Three months ended 31 March Change
% RR millions, except as stated 2014 % of revenue 2013 % of revenue
Energy products
LPG 18,993 23.7% 13,090 19.8% 45.1%
Naphtha 15,188 19.0% 6,064 9.2% 150.5%
Natural gas 7,095 8.9% 7,230 10.9% (1.9%)
MTBE 4,372 5.5% 5,571 8.4% (21.5%)
Raw NGL 2,859 3.6% 2,093 3.2% 36.6%
Other fuels and fuel additives 1,115 1.4% 798 1.2% 39.7%
Total energy product sales 49,622 62.0% 34,846 52.7% 42.4%
Petrochemical products
Plastics and organic synthesis products 9,781 12.2% 9,563 14.4% 2.3%
Basic polymers 7,396 9.2% 5,004 7.6% 47.8%
Synthetic rubbers 6,739 8.4% 8,566 12.9% (21.3%)
Intermediates and other chemicals 4,317 5.4% 5,193 7.8% (16.8%)
Total petrochemical products sales 28,233 35.3% 28,326 42.8% (0.3%)
Trading and other sales 1,673 2.1% 1,663 2.5% 0.6%
Sales of processing services 474 0.6% 1,349 2.0% (64.9%)
Total other revenue 2,147 2.7% 3,012 4.6% (28.7%)
Total revenue 80,002 100.0% 66,184 100.0% 20.9%

8
Energy Products
In the first quarter of 2014, our revenue from sales of energy products amounted to RR 49,622 million
compared to RR 34,846 million in the first quarter of 2013, an increase of 42.4% year-on-year primarily
due to a substantial increase in sales volumes, as well as due to higher effective average selling prices across the product range, as a moderate decline in market prices was more than compensated by Russian
rouble depreciation. Our sales volumes were largely affected by a significant increase in LPG and
naphtha sales volumes on (i) substantial expansion of trading activities following the launch of Ust-Luga
transshipment facility and (ii) higher production following the launch of the second GFU. In the first quarter of 2014, 34.8% of total external energy product sales was derived from the domestic market
compared to 50.7% in the first three months of 2013, while export sales accounted for 65.2% versus
49.3% in the first quarter of 2014 and 2013, respectively. The increase in export volumes was attributable to higher LPG and naphtha seaborne sales following the launch of Ust-Luga transshipment
facility.
Liquefied Petroleum Gases (LPG)
In the first quarter of 2014, our revenue from LPG sales increased by 45.1% year-on-year to RR 18,993
million from RR 13,090 million in the first quarter of 2013 on a 21.3% increase in sales volumes and a 19.6% increase in the effective average selling price. Our external LPG sales volumes increased on a
5.2% production growth as a result of higher fractionation volumes primarily due to the launch of the
second GFU in Tobolsk. The growth in sales volumes was also largely attributable to expanded trading activities following the launch of Ust-Luga transshipment facility in the end of 2013. Lower internal use,
as well as lower inventory accumulation positively affected our LPG sales volumes. Our effective
average selling price increased by 19.6% in Russian rouble terms or by 4.0% in US dollar terms reflecting the dynamics of international market prices. This was supported by changes in our export geography with
larger share of sales going to relatively more attractive markets and longer delivery basis of seaborne
sales. In the first quarter of 2014, domestic sales accounted for 17.3% of total LPG revenue, while 82.7%
was attributable to export sales.
Naphtha
In the first quarter of 2014, our revenue from naphtha sales surged 150.5% year-on-year to RR 15,188
million from RR 6,064 million in the first quarter of 2013 on a 107.4% increase in sales volumes and a 20.7% growth in the effective average selling price. Our external naphtha sales volumes surged on
substantial expansion of trading activities initiated following the launch of Ust-Luga transshipment
facility. An increase in production volumes of 6.5% was more than offset by lower naphtha feedstock
purchases, which was partially compensated by respective reduction in the intercompany sales to the petrochemical business. Our effective average selling price increased by 20.7% in Russian rouble terms
or by 5.0% in US dollar terms reflecting the dynamics of international market prices. This was supported
by changes in our export geography with larger share of sales going to relatively more attractive markets and longer delivery basis of seaborne sales. In the first quarter of 2014, our share of domestic sales
decreased to 3.3% of total naphtha revenue from 27.4% in the first quarter of 2013, while 96.7% and
72.6%, respectively, were attributable to export sale. The change in the mix was attributable to the expansion of seaborne sales following the launch of Ust-Luga transshipment facility.
Natural Gas
In the first quarter of 2014, our revenue from natural gas sales decreased by 1.9% year-on-year to RR
7,095 million from RR 7,230 million in the first quarter of 2013 on a 17.8% decrease in sales volumes despite a 19.3% increase in the effective average selling price. Natural gas sales volumes decreased
despite a 5.8% increase in production largely due to material decrease in inventories in the first quarter of
2013, as we sold the volumes of natural gas accumulated in the UGSS. The growth in production volumes was attributable to higher volumes of APG processing. The effective average selling price
increased by 19.3% year-on-year reflecting an indexation of the regulated natural gas prices of 14.9%
year-on-year, as well as better terms achieved with one of our large clients. We sell 100% of our natural
gas in Russia.

9
Methyl Tertiary Butyl Ether (MTBE)
In the first quarter of 2014, our revenue from MTBE sales decreased by 21.5% year-on-year to RR 4,372 million in the first quarter of 2014 from RR 5,571 million in the first quarter of 2013 on a 23.0% decrease
in sales volumes despite a 1.9% increase in the effective average selling price. The decrease in sales
volumes despite an 8.1% growth in production was largely attributable to focused inventory accumulation in the first quarter of 2014 versus inventory sale in the first quarter of 2013. In the first quarter of 2013,
inventories decreased as we completed a large export delivery accumulated at the end of 2012. In the first
quarter of 2014, we accumulated inventories pending lengthy planned maintenance shutdowns at our
production facilities. The dynamics of the effective average selling price was attributable to the decrease in international market prices for MTBE, which was more than compensated by the Russian rouble
depreciation. In the first quarter of 2014, we sold 100% of our MTBE in Russia, while in the respective
period of 2013 domestic sales accounted for 77.8% of total MTBE revenue and 22.2% was attributable to export sales.
Raw NGL
In the first quarter of 2014, our revenue from raw NGL sales increased by 36.6% year-on-year to
RR 2,859 million from RR 2,093 million in the first quarter of 2013 due to a 19.1% increase in the
effective average selling price and a 14.7% growth in sales volumes. The effective average selling price increased on higher netbacks mainly due to the Russian rouble depreciation, which compensated a
moderate decline in energy products market prices. Our external sales volumes of raw NGL increased on
an 8.7% production growth and higher third-party purchases. The growth in raw NGL production was attributable to higher volumes of APG processing. Our third-party purchases increased due to higher
purchases of additional raw NGL volumes from an existing supplier due to the growth in gas extraction
from one of their gas fields. Additional available volumes of raw NGL were partially utilised at our
second GFU in Tobolsk following its launch. In the first three months of 2014, domestic sales accounted for 61.8% of total raw NGL revenue, while 38.2% was attributable to export sales.
Petrochemical Products
In the first quarter of 2014, revenue from sales of petrochemical products remained largely flat year-on-
year at RR 28,235 million on higher revenue from sales of basic polymers and plastics & organic synthesis products, which was fully offset by lower revenue from sales of synthetic rubbers and
intermediates & other chemicals. Our revenue from sales of synthetic rubbers substantially decreased in
the negative market environment. Lower revenue from sales of intermediates & other chemicals was
attributable to an unscheduled shutdown at our steam cracker in Kstovo and decommissioning of Caprolactam in the second half of 2013. Our revenue from sales of basic polymers increased on higher
PP production following the launch of Tobolsk-Polymer plant. Primarily positive dynamics in revenue
from sales of plastics & organic synthesis products was attributable to resilient market sentiment for certain products within the group. Russian rouble depreciation additionally supported our sales of
petrochemical products.
Basic Polymers
In the first quarter of 2014, our revenue from sales of basic polymers increased by 47.8% year-on-year to
RR 7,396 million from RR 5,004 million in the first quarter of 2013. The increase was largely attributable to higher PP sales volumes following the launch of Tobolsk-Polymer plant the second half of
2013. In the first quarter of 2014, our share of export sales increased to 44.2% of the total basic polymers
revenue from 29.2% in the first quarter of 2013, while domestic sales decreased to 55.8% of total basic polymers revenue from 70.8% in the first three months of 2013. The change was attributable to higher
export sales due to the growth in PP supply in Russia following the launch of new capacities.
Low density polyethylene (LDPE)
In the first quarter of 2014, our revenue from sales of LDPE increased by 25.0% year-on-year to
RR 3,465 million compared to RR 2,771 million in the first quarter of 2013 on a 17.2% increase in the

10
effective average selling price and a 6.7% growth in sales volumes. The effective average selling price
for LDPE increased on higher market prices. The increase in LDPE sales volumes was due to a 4.3%
growth in production as a result of certain production capacity upgrades during the maintenance shutdown in the end of 2013. Additionally, our inventory build-up in the first three months of 2014 was
substantially lower compared to the first quarter of 2013 due to the lengthy planned shutdowns at third-
party production facilities. In the first three months of 2014, domestic sales accounted for 52.6% of total LDPE revenue, while 47.4% was attributable to export sales.
Polypropylene (PP)
In the first quarter of 2014, our revenue from sales of PP increased by 76.1% year-on-year to RR 3,931
million from RR 2,233 million in the first quarter of 2013 on a 76.2% increase in sales volumes and
largely flat effective average selling price. Our PP sales volumes growth was attributable to an 84.8% increase in PP production following the launch of Tobolsk-Polymer plant (annual nameplate capacity of
500,000 tonnes) in the second half of 2013. We also recorded higher third-party purchases and lower
inventory build-up. The increase in third-party purchases was related to higher purchases for resale from
OOO Poliom, which was launched in February 2013. This was partially offset by higher internal use following the launch of our BOPP-film production in Tomsk in the second half of 2013. The effective
average selling price for PP remained largely flat despite higher international market prices due to (i)
increased PP supply in Russia following the launch of Tobolsk-Polymer plant and OOO Poliom and (ii) an increase in our export sales, with a higher share of sales to China, where prices in the first quarter of
2014 were lower than in the CIS. These factors were partially mitigated by an unscheduled shutdown of a
domestic producer, which supported local prices and demand. In the first three months of 2014, domestic sales accounted for 58.7% of total PP revenue, while 41.3% was attributable to export sales.
Synthetic Rubbers
In the first quarter of 2014, our revenue from synthetic rubber sales decreased by 21.3% year-on-year to
RR 6,739 million from RR 8,566 million in 2013, which was largely due to lower revenue from sales of
commodity rubbers, partially compensated by higher revenue from sales of thermoplastic elastomers and specialty rubbers. In the first three months of 2014, we continued to observe persistent decline in market
prices for our synthetic rubber grades. Our revenue from sales of thermoplastic elastomers and specialty
rubbers was supported by growth in sales volumes as a result of the commercial launch of the new thermoplastic elastomers production facility with an annual nameplate production capacity of 50,000
tonnes in Voronezh and an IIR capacity expansion project at our Togliatti production site in the second
half of 2013. In the first three months of 2014, domestic sales accounted for 32.2% of total synthetic
rubber revenue, while 67.8% was attributable to export sales.
Commodity rubbers
In the first quarter of 2014, our revenue from sales of commodity rubbers decreased by 35.6% year-on-
year to RR 4,025 million from RR 6,248 million in 2013 on a 28.7% decrease in sales volumes and a
9.7% decline in the effective average selling price.
Our sales volumes of commodity rubbers declined on a 35.2% decrease in production. In the first three
months of 2014, we reduced production volumes of commodity rubbers on the back of an unfavorable
market environment. The decrease in sales volumes was also attributable to lower third-party purchases as we reduced product purchases under third-party manufacturing arrangements. These factors were only
partially compensated by lower inventory build-up in the first three months of 2014 as compared to the
respective period of 2013.
The effective average selling price for commodity rubbers declined, following the negative dynamics in
European and Asian market prices. Asian prices for natural rubber, which is a benchmark for
polyisoprene rubber (IR) as they are substitute products, declined on average by more than 30% in US dollar terms year-on-year. European prices for styrene-butadiene rubber (ESBR) were down more than
15% in euro terms year-on-year, while prices for butadiene, a key raw material and a price indicator for
butadiene-based rubbers, declined by almost 30% in euro terms year-on-year. At the same time prices for

11
styrene declined by only 1% US dollar terms year-on-year. The negative dynamics of the international
market prices was partially compensated by the Russian rouble depreciation.
In the first three months of 2014, domestic sales accounted for 37.3% of total commodity rubber revenue,
while 62.7% was attributable to export sales.
Plastics and Organic Synthesis Products
In the first quarter of 2014, our revenue from sales of plastics and organic synthesis products increased by
2.3% year-on-year to RR 9,781 million from RR 9,563 million in the respective period of 2013. The increase was primarily attributable to higher sales volumes of PET, BOPP-films and expandable
polystyrene, as well as positive pricing dynamics for expandable polystyrene and acrylates. This was
partially offset by lower sales of glycols and phase-out of plastic compounds production pending the divestment of PVC cable compounds production site, operated by SIBUR-Neftekhim, in April 2014 (see
“Recent Developments” section above) and divestment of Plastic in December 2013.
Polyethylene terephthalate (PET)
In the first quarter of 2014, our revenue from PET sales increased by 15.6% year-on-year to RR 2,857
million from RR 2,471 million as a result of a 21.3% increase in sales volumes and a 4.7% decline in the effective average selling price. The increase in sales volumes was primarily attributable to a 24.7%
growth in production volumes following the completion of a PET capacity expansion project at our
production site in Blagoveshchensk. The growth in production was offset by higher inventory accumulation in order to mitigate our risks related to the launch after the expansion maintenance
shutdown. The decline in the effective average selling price was due to the negative market price
dynamics. In the first quarter of 2014, domestic sales accounted for 99.7% of total PET revenue, while
0.3% was attributable to export sales.
BOPP-films
In the first quarter of 2014, our revenue from BOPP-film sales increased by 26.0% year-on-year to
RR 2,180 million from RR 1,731 million in the first quarter of 2013 on a 25.4% growth in sales volumes
and a marginal increase in the effective average selling price. Higher sales volumes were largely attributable to a 12.7% increase in production following the launch of a new BOPP-film production in
Tomsk in the second half of 2013. Besides, SIBUR decreased its stock for the period in anticipation of
additional BOPP-film production volumes pending the capacity expansion in Novokuybyshevsk (see
“Recent Developments” section above). In the first quarter of 2014, domestic sales accounted for 79.9% of total BOPP-film revenue, while 20.1% was attributable to export sales.
Expandable polystyrene
In the first quarter of 2014, our revenue from sales of expandable polystyrene rose by 37.3% year-on-year
to RR 1,243 million from RR 906 million in the first quarter of 2013 as a result of a 22.5% increase in
sales volumes and a 12.0% growth in the effective average selling price. The increase in sales volumes was attributable to substantially lower inventory accumulation on higher demand for local polystyrene
due to the Russian rouble depreciation. Our production decreased by 17.2%, which was related to the
divestment of Plastic, an expandable polystyrene producer, as well as to the unscheduled maintenance shutdown at SIBUR-Khimprom. The effective average selling price increased largely in line with market
prices significantly supported by (i) Russian rouble depreciation and (ii) increased share of certain high-
priced grades in our export sales structure. In the first quarter of 2014, domestic sales accounted for 72.8% of total expandable polystyrene revenue, while 27.2% was attributable to export sales.
Glycols
In the first quarter of 2014, our revenue from sales of glycols decreased by 49.2% year-on-year to RR 979
million from RR 1,930 million in the respective period of 2013 as a result of a 50.5% decrease in sales
volumes despite a 2.5% growth in the effective average selling price. The decrease in sales volumes was

12
largely due to (i) a 34.9% decline in production as a result of the unscheduled shutdown of our steam
cracker in Kstovo, and (ii) higher internal use following the PET production capacity expansion. These
factors were only partially compensated by higher third-party purchases to meet contractual obligations during the shutdown in Kstovo. The effective average selling price increased largely in line with
European market prices significantly supported by Russian rouble depreciation. In the first three months
of 2014, domestic sales accounted for 92.7% of total glycols revenue compared to 68.7% in the first quarter of 2013, while 7.3% was attributable to export sales versus 31.3% in the first quarter of 2014 and
2013, respectively.
Plastic compounds (including ABS plastics and PVC cable compounds)
In the first quarter of 2014, our revenue from sales of plastic compounds decreased by 63.0% year-on-
year to RR 157 million from RR 426 million in the first quarter of 2013 as a result of a 50.2% decrease in sales volumes and a 25.8% decrease in the effective average selling price. The substantial decrease in our
sales volumes was related to the divestment of Plastic, ABS plastics producer, in December 2013 as well
as due to the reduction in production of PVC cable compounds pending the divestment of PVC cable
compounds division at SIBUR-Neftekhim. The decrease in the effective average selling price was attributable to the change in the sales mix following the divestment in Plastics and the respective
deconsolidation of ABS plastics volumes, prices for which are higher than prices for PVC cable
compounds. In the first three months of 2014, domestic sales accounted for 97.9% of total revenue from sales of plastic compounds, while 2.1% was attributable to export sales.
Intermediates and Other Chemicals
In the first quarter of 2014, our revenue from sales of intermediates and other chemicals decreased by
16.8% year-on-year to RR 4,317 million from RR 5,193 million in the first quarter of 2013. The decline
was largely attributable to (i) the unscheduled shutdown at our steam cracker in Kstovo, which affected our ethylene oxide and benzene production, and (ii) lower revenue from sales of other chemicals on lower
production due to the decommissioning of Caprolactam – a chlorine and caustic soda and derivatives
production near the city of Dzerzhinsk, the Nizhny Novgorod region. These factors were partially compensated by higher revenue from sales of styrene as a result of lower internal use due to the
divestment of Plastic that consumed styrene for polystyrene production.
Out of 1.1 million tonnes of intermediates and other chemicals produced in the first three months of 2014,
approximately 90.2% were used internally for further intercompany processing compared to 87.9% in the
respective period of 2013.
Other Revenue
In the first quarter of 2014, other revenue decreased by 28.7% year-on-year to RR 2,147 million from RR 3,012 million in the first quarter of 2013. The decline was mainly attributable to lower sales of
processing services due to the deconsolidation of OOO Yugragazpererabotka from the second quarter of
2013 until March 2014, when SIBUR gained full control over OOO Yugragazpererabotka.
For detailed information on revenue from sales, production, purchases and sales volumes please see
“Operational Data” below.

13
Operating Expenses
The following table presents a breakdown of our operating expenses for the three months ended 31 March 2014 and 2013:
Three months ended 31 March
Change
% RR millions, except as stated 2014
% of
revenue 2013
% of
revenue
Feedstock and materials 19,492 24.4% 17,279 26.1% 12.8%
Transportation, logistics and rent 11,578 14.5% 10,897 16.5% 6.2%
Transportation and logistics 9,842 12.3% 9,552 14.4% 3.0%
Rent expenses 1,736 2.2% 1,345 2.0% 29.1%
Goods for resale 10,321 12.9% 1,311 2.0% 687.5%
Energy and utilities 7,092 8.9% 7,761 11.7% (8.6%)
Staff costs 6,424 8.0% 6,978 10.5% (7.9%)
Depreciation and amortisation 5,213 6.5% 2,575 3.9% 102.4%
Repairs and maintenance 1,352 1.7% 1,397 2.1% (3.2%)
Processing services of third parties 1,336 1.7% - - n/m
Services provided by third parties 1,178 1.5% 1,184 1.8% (0.5%)
Taxes other than income tax 322 0.4% 419 0.6% (23.1%)
Charity and sponsorship 222 0.3% 276 0.4% (19.6%)
Marketing and advertising 86 0.1% 50 0.1% 69.9%
Impairment of property, plant and equipment - -% 181 0.3% (100.0%)
(Gain)/loss on disposal of property, plant and equipment (89) (0.1%) (340) (0.5%) (73.8%)
Other 571 0.7% 456 0.7% 25.4%
Change in work-in-progress and refined products balances (2,452) (3.1%) (1,989) (3.0%) 23.3%
Operating expenses before equity-settled share-based
payment plans 62,646 78.3% 48,435 73.2% 29.3%
Equity-settled share-based payment plans 3,900 4.9% - - n/m
Operating expenses 66,546 83.2% 48,435 73.2% 37.4%
In the first quarter of 2014, our operating expenses increased by 37.4% year-on-year to RR 66,546 million
from RR 48,435 million in the first quarter of 2013. As a percentage of total revenue, our operating
expenses increased to 83.2% in the first quarter of 2014 from 73.2% in the first quarter of 2013. The growth in operating expenses was primarily attributable to a material increase in expenses related to
purchases of goods for resale and a non-cash charge related to equity-settled share-based payment plans
for directors and key management in the amount of RR 3,900 million, as the Group started to recognise current and past service costs associated with the respective payment plans as operating expenses together
with a corresponding increase in the shareholders’ equity starting from the third quarter of 2013.
Our operating expenses before equity-settled share-based payment plans (the “Net operating expenses”)
increased by 29.3% year-on-year to RR 62,646 million from RR 48,435 million in the first quarter of
2013. As a percentage of total revenue, our net operating expenses amounted to 78.3% in the first quarter
of 2014 compared to 73.2% in the first quarter of 2013. The growth in net operating expenses was primarily attributable to (i) an increase in expenses related to purchases of goods for resale primarily
driven by expanded trading activities following the launch of Ust-Luga transshipment facility and higher
purchases of polypropylene for resale, (ii) higher depreciation and amortisation costs due to the commissioning of new production facilities in the second half of 2013, (iii) higher feedstock and
materials costs, and (iv) an increase in processing services of third parties on the back of deconsolidation
of OOO Yugragazpererabotka from the second quarter of 2013 until March 2014.
These factors were partially compensated by a decrease in energy & utilities and staff costs, inter alia due
to deconsolidation of OOO Yugragazpererabotka from the second quarter of 2013 until March 2014.
Overall, the deconsolidation of OOO Yugragazpererabotka has resulted in a net decrease in operating expenses, as higher third-party processing services expenses were offset by a decrease in energy and
utilities, repairs and maintenance, staff and other costs.
Feedstock and Materials
In the first quarter of 2014, our feedstock and materials costs increased by 12.8% year-on-year to
RR 19,492 million from RR 17,279 million in the first quarter of 2013. As a percentage of total revenue, feedstock and materials costs decreased to 24.4% in the first quarter of 2014 from 26.1% in the first

14
quarter of 2013. The increase was driven by higher expenses related to hydrocarbon feedstock purchases
as well as growth in other feedstock and materials expenses.
The following table presents information on our costs related to purchasing of feedstock and materials for
the three months ended 31 March 2014 and 2013: Three months ended 31 March
Change
% RR millions, except as stated 2014
% of feedstock
and materials
expenses 2013
% of feedstock
and materials
expenses
NGLs 7,254 37.2% 6,516 37.7% 11.3%
APG 3,006 15.4% 2,300 13.3% 30.7%
Paraxylene 1,268 6.5% 1,506 8.7% (15.8%)
Other feedstock and materials 8,002 41.1% 6,634 38.4% 20.7%
Change of stock (38) (0.2%) 323 1.9% n/m
Feedstock and materials, total 19,492 100.0% 17,279 100.0% 12.8%
The following table presents selected data on our feedstock purchasing volumes for the three months
ended 31 March 2014 and 2013(1)
: Three months ended 31 March Change
% Tonnes, except as stated 2014 2013
NGLs 902,710 901,182 0.2%
APG (thousand cubic metres) 3,632,942 3,428,147 6.0%
Paraxylene 41,581 43,804 (5.1%)
In the first quarter of 2014, our expenses related to purchases of NGLs increased by 11.3% year-on-year to RR 7,254 million from RR 6,516 million in the first quarter of 2013, marginally decreasing as a
percentage of total feedstock and materials to 37.2% from 37.7%. The growth in expenses was
attributable to an 11.1% year-on-year increase in the effective average purchase price on largely flat
purchasing volumes. The increase in the effective average purchase price was attributable to higher export netbacks in the first quarter of 2014 supported by Russian rouble depreciation.
In the first quarter of 2014, our expenses related to purchases of APG increased by 30.7% year-on-year to RR 3,006 million from RR 2,300 million in the first quarter of 2013, increasing as a percentage of total
feedstock and materials expenses to 15.4% from 13.3%. The growth in expenses was attributable to a
23.3% year-on-year increase in the effective average purchase price and a 6.0% increase in purchasing volumes. The increase in the effective average purchase price of APG was primarily attributable to
(i) regular price indexation reflecting changes of the regulated natural gas prices in Russia and (ii)
supplies of additional APG volumes exceeding guaranteed volumes under the existing contracts at higher
prices.
In the first quarter of 2014, our expenses related to purchases of paraxylene decreased by 15.8% year-on-
year to RR 1,268 million from RR 1,506 million in the first quarter of 2013, decreasing as a percentage of total feedstock and materials expenses to 6.5% from 8.7%. The decrease in expenses was attributable to
an 11.3% decline in the effective average purchase price due to lower market prices and a 5.1% decrease
in purchasing volumes.
In the first quarter of 2014, other feedstock and materials expenses increased by 20.7% year-on-year to
RR 8,002 million from RR 6,634 million in the first three months of 2013, increasing as a percentage of
total feedstock and materials expenses to 41.1% from 38.4%. The increase was attributable to higher purchases of certain intermediates as a result of the unscheduled shutdown at our steam cracker facility in
Kstovo and higher PP purchases as feedstock following the launch of new BOPP-film production in
Tomsk.
Transportation, Logistics and Rent
In the first quarter of 2014, our combined expenses related to transportation, logistics and rent increased
by 6.2% year-on-year to RR 11,578 million from RR 10,897 million in the first quarter of 2013,
decreasing as a percentage of total revenue to 14.5% from 16.5%. The increase in transportation and
(1)
Excluding volumes purchased for trading. These volumes are reported as goods for resale.

15
logistics expenses was mainly attributable to longer delivery basis and higher transported volumes of
certain products, primarily due to higher seaborne sales of LPG and naphtha related to expanded trading
activities following the launch of Ust-Luga transshipment facility. The increase in rent expenses was driven by (i) a 34% year-on-year increase in the number of leased rolling stock and (ii) a 7% year-on-year
increase in the average rental rate.
Goods for Resale
In the first quarter of 2014, our expenses related to purchases of goods for resale increased eight times year-on-year to RR 10,321 million from RR 1,311 million in the first quarter of 2013, increasing as a
percentage of total revenue to 12.9% from 2.0%. The growth in expenses was driven by (i) higher third-
party purchases of naphtha and LPG for resale following the launch of Ust-Luga transshipment facility and (ii) higher purchases of polypropylene from a new domestic producer for resale on expanded trading
activities.
Energy and Utilities
In the first quarter of 2014, our energy and utilities expenses decreased by 8.6% year-on-year to RR 7,092
million from RR 7,761 million in the first quarter of 2013, decreasing as a percentage of total revenue to
8.9% from 11.7%. The decline in expenses was primarily attributable to deconsolidation of
OOO Yugragazpererabotka from the second quarter of 2013 until March 2014, when SIBUR gained full control over OOO Yugragazpererabotka. This factor largely compensated for an increase in the effective
average electricity and heat tariffs that were up by 12.0% and 3.4% year-on-year, respectively.
The following table presents data on our energy and utilities costs for the three months ended 31 March
2014 and 2013: Three months ended 31 March
Change
% RR millions, except as stated 2014
% of total energy
and utilities 2013
% of total energy
and utilities
Electricity 3,594 50.7% 4,603 59.3% (21.9%)
Heat 1,827 25.8% 2,026 26.1% (9.8%)
Fuel 1,213 17.1% 934 12.0% 29.9%
Other 458 6.4% 198 2.6% 131.3%
Energy and utilities, total 7,092 100.0% 7,761 100.0% (8.6%)
Staff Costs
In the first quarter of 2014, our staff costs decreased by 7.9% year-on-year to RR 6,424 million from RR 6,978 million in the first quarter of 2013, decreasing as a percentage of total revenue to 8.0% from
10.5%. The decline in expenses was primarily attributable to lower bonus provisions and change in scope
with the deconsolidation of OOO Yugragazpererabotka from the second quarter of 2013 until March 2014, decommissioning of Caprolactam completed in April 2013, as well as divestment of Plastic
in the end of 2013. In the first quarter of 2014, our average headcount totaled 26,479 employees,
decreasing by 12.7% year-on-year as a result of changes in scope and headcount optimisation at our production sites.
Depreciation and Amortisation
In the first quarter of 2014, our depreciation and amortisation expenses increased by 102.4% to RR 5,213
million from RR 2,575 million in the first quarter of 2013, increasing as a percentage of total revenue to
6.5% from 3.9%. The growth in expenses was attributable to the commissioning of new production facilities in the second half of 2013, primarily Tobolsk-Polymer and Ust-Luga transhipment terminal as
well as due to the amortisation of supply contracts for the period through the end of 2032 between SIBUR
and Rosneft (see Appendix II for further details).

16
Processing Services of Third Parties
In the first quarter of 2014, our expenses related to third-party processing services amounted to RR 1,336 million, while they were nil in the first quarter of 2013. As a percentage of total revenue processing
services from third parties totaled 1.7%. The growth in expenses was primarily attributable to
deconsolidation of OOO Yugragazpererabotka from the second quarter of 2013 until March 2014, when SIBUR gained full control over OOO Yugragazpererabotka. During that period we reported our
payments for APG processing to OOO Yugragazpererabotka as third-party processing services expenses,
while before the deconsolidation they were treated as intercompany expenses and were eliminated from
the consolidated interim financial information (see Appendix II for further details).
Operating Profit
In the first quarter of 2014, our operating profit decreased by 24.2% year-on-year to RR 13,456 million
from RR 17,749 million year earlier due to the non-cash charge associated with the share-based equity-settled payment plans discussed above and higher net operating expenses. Our operating margin totaled
16.8% in the first quarter of 2014 compared to 26.8% in the first quarter of 2013.
Net of the non-cash charge related to the equity-settled share-based payment plans, our operating profit decreased by 2.2% year-on-year to RR 17,357 million in the first quarter of 2014 from RR 17,749 million
in the first quarter of 2013. The corresponding operating margin totaled 21.7% and 26.8% in the first
quarter of 2014 and 2013, respectively.
Net Finance Expense
In the first quarter of 2014, we reported a net finance expense of RR 7,105 million compared to a net
finance expense of RR 1,962 million in the first quarter of 2013.
The following table presents data on our finance income and expenses for the three months ended
31 March 2014 and 2013: Three months ended 31 March Change
% RR millions, except as stated 2014 2013
Interest income 121 288 (58.1%)
Interest expenses (517) (416) 24.2%
Foreign exchange loss (6,605) (1,637) 303.5%
Other finance expense (104) (197) (47.2%)
Net finance expense (7,105) (1,962) 262.2%
The finance expense recorded in the first quarter of 2014 was largely attributable to a foreign exchange loss in the amount of RR 6,605 million recorded in the first quarter of 2014 due to the Russian rouble
depreciation and the respective revaluation of our USD-denominated debt, as the RR/USD rate increased
by 9.0% to RR 35.6871 as of 31 March 2014 from RR 32.7292 as of 31 December 2013.
In the first quarter of 2013, we recorded a foreign exchange loss in the amount of RR 1,637 million also
attributable to the Russian rouble appreciation and the respective revaluation of our USD-denominated
debt, as the RR/USD rate increased by 2.3% to RR 31.0834 as of 31 March 2013 from 30.3727 as of 31 December 2012.
Gain on Acquisition of Subsidiary
In the first quarter of 2014, we recognised a non-cash gain on acquisition of subsidiary in the amount of
RR 52,773 million following the acquisition of a 49% stake in OOO Yugragazpererabotka from Rosneft in March 2014. The gain was attributable to the difference between fair value of SIBUR’s interest in JV
and SIBUR’s share in the JV accounted for at historical cost before the transaction (see Appendix II for
further details).

17
Gain on Deconsolidation of Subsidiary
In the first quarter of 2013, we recognised a gain of RR 2,413 million on deconsolidation of OOO Yugragazpererabotka, our joint venture with RN Holding (see Appendix II for further details).
Income Tax Expense
In the first quarter of 2014, our income tax expense decreased by 20.8% year-on-year to RR 2,252 million
from RR 2,843 million year earlier. The decrease was attributable to lower pre-tax profit, adjusted for non-cash charges related to the equity-settled share-based payment plans, non-cash gains on acquisition
and deconsolidation of subsidiary. Our effective income tax rate was 22.2% and 17.7% in the first
quarter of 2014 and 2013, respectively.
Profit for the Reporting Period and Profit Attributable to Shareholders of SIBUR
In the first quarter of 2014, our profit increased by 263.1% year-on-year to RR 56,774 million from
RR 15,634 million in the first quarter of 2013. The increase was largely attributable to a non-cash gain on acquisition of a 49% stake in OOO Yugragazpererabotka discussed above. Our net margin totaled 71.0%
and 23.6% in the first quarter of 2014 and 2013, respectively. In the first quarter of 2014, profit
attributable to shareholders of SIBUR increased by 263.8% year-on-year to RR 56,785 million from
RR 15,611 million in the respective period of 2013.
Net of the non-cash charge related to the equity-settled share-based payment plans and the non-cash gain
on acquisition and deconsolidation of OOO Yugragazpererabotka discussed above, our profit decreased by 40.2% year-on-year to RR 7,901 million in the first quarter of 2014 from RR 13,221 million in the first
quarter of 2013. The corresponding net margin totaled 9.9% in the first quarter of 2014 and 20.0% in the
first quarter of 2013. The decrease was attributable to lower operating profit, as discussed above, and the
material foreign exchange loss due to the Russian rouble depreciation and revaluation of our USD-denominated debt.
LIQUIDITY AND CAPITAL RESOURCES
Cash Flow
The following table presents selected data on our net cash flows for the three months ended 31 March
2014 and 2013: Three months ended 31 March Change
% RR millions, except as stated 2014 2013
Net cash from operating activities of continuing operations 16,860 23,105 (27.0%)
Operating cash flows before working capital changes 23,800 21,803 9.2%
Changes in working capital (3,122) 3,515 n/m
Income tax paid (3,818) (2,213) 72.5%
Net cash used in investing activities, including (35,627) (22,131) 61.0%
Acquisition of interest in subsidiaries, net of cash acquired (20,547) - n/m
Purchase of property, plant and equipment (13,682) (21,507) (36.4%)
Additional contribution to the share capital of joint ventures (1,575) (500) 215.0%
Other 177 (124) n/m
Net cash from financing activities of continuing operations, including 22,135 3,743 491.3%
Effect of exchange rate changes on cash and cash equivalents 152 (93) n/m
Net decrease in cash and cash equivalents 3,520 4,624 (23.9%)
Net Cash from Operating Activities
In the first quarter of 2014, our net cash from operating activities decreased by 27.0% year-on-year to
RR 16,860 million from RR 23,105 million in the respective period of 2013. Operating cash flows before
working capital changes increased by 9.2% year-on-year to RR 23,800 million from RR 21,803 million in the first quarter of 2013 on the back of higher EBITDA that was up by 10.1%. In the first quarter of
2014, changes in working capital had a negative effect on our net cash from operating activities in the
amount of RR 3,122 million, which was largely due to an increase in inventories and a decrease in trade payables. Increase in inventories related to the ongoing thermoplastic elastomers homologation as well as

18
increase in MTBE stock ahead of planned maintenance shutdowns. Our trade payables decreased due to
the launch of trading operations via Ust-Luga transshipment facility and a decrease in advances from
customers prepaid at the end of 2013 for the delivery of products during long holidays in January 2014. In the first quarter of 2013, changes in working capital had a positive impact on our net cash from
operating activities in the amount of RR 3,515 million. Income tax paid increased by 72.5% and totaled
RR 3,818 million as compared to RR 2,213 million a year earlier, which was related to advance tax payments in the first quarter of 2014.
The following table presents data on changes in working capital for the three months ended 31 March
2014 and 2013: Three months ended 31 March
RR millions, except as stated 2014 2013
Decrease in trade and other receivables 1,257 2,273
(Increase)/decrease in prepayments and other current assets (128) 4,547
Increase in inventories (2,303) (1,300)
Decrease in trade and other payables (2,365) (1,941)
(Decrease)/ increase in taxes payable 417 (64)
Changes in working capital (3,122) 3,515
SIBUR’s management monitors its liquidity and operational efficiency on the basis of the adjusted
working capital (see Appendix I for further details). Our adjusted working capital was positive at
RR 31,622 million as of 31 March 2014 and RR 31,277 million as of 31 December 2013.
Our net working capital balance may fluctuate from period to period due to factors within or outside our control, such as market conditions, our tactical marketing initiatives in response to changes in market
conditions, logistical constraints as well as completion of major investment projects, which could require
substantial inventory accumulation. We expect to observe significant movements across our working capital items as a result of expanded trading activity following the launch of Ust-Luga transshipment
terminal due to varying timing of payments and shipments.
Net Cash Used in Investing Activities
In the first quarter of 2014, our net cash used in investing activities increased by 61.0% year-on-year to RR 35,627 million from RR 22,131 million a year earlier, which was largely attributable to (i) the
payment of the first tranche for the acquisition of Rosneft’s 49% stake in OOO Yugragazpererabotka in
the amount of RR 20,547 million, and (ii) an increase in contributions to the share capital of joint ventures to RR 1,575 million in the first quarter of 2014 from RR 500 million in the first quarter of 2013,
inter alia related to the financing of RusVinyl’s investment programme and Yuzhno-Priobskiy GPP
construction. This was compensated by 36.4% decrease in our capital expenditures to RR 13,682 million
in the first quarter of 2014 from RR 21,507 million a year earlier, as we completed several large-scale projects in 2013.
Net Cash From Financing Activities
In the first quarter of 2014, our net cash from financing activities increased six times to
RR 22,135 million from RR 3,743 million in the first quarter of 2013 primarily due to new borrowings to fund the acquisition of a 49% stake in the OOO Yugragazpererabotka. Additionally, in the first quarter of
2014, SIBUR received RR 2,185 million in grants and subsidies from various regional budgets.
Capital Expenditures
In the first quarter of 2014, our capital expenditures decreased by 36.4% year-on-year to
RR 13,682 million compared to RR 21,507 million in the first quarter of 2013 (net of VAT). The decrease was attributable to completion of several large-scale investment projects in 2013.

19
The following table presents data on our key investment projects for the three months ended 31 March
2014 and 2013:
RR millions, except as stated Three months ended
31 March
Completion Location Description 2014 2013
Feedstock and Energy
Transportation infrastructure development
Western Siberia Purovsk – Pyt-Yakh – Tobolsk pipeline 3,808 7,480 2015
Gas fractionation capacity modernisation and expansion
Western Siberia APG processing capacity expansion at Vyngapurovskiy GPP 2,031 - 2015
Tobolsk Second GFU 1,202 1,570 2014
Petrochemicals
Dzerzhinsk Reconstruction of ethylene oxide production capacity 689 21 2014
Kstovo Steam cracker upgrade 516 434 2014
Tobolsk “ZapSib-2” (pending FID) 336 509 2014
Tobolsk Propane purification facility to reduce methanol content 201 38 2014
Novokuybyshevsk Expansion of BOPP-film production 175 154 Completed
Blagoveshchensk Expansion of PET production 128 130 Completed
In the first quarter of 2014, we continued implementation of a number of investment projects in both
feedstock & energy and petrochemicals businesses in line with SIBUR’s strategic objectives. Description
of our key investment projects is presented below.
Feedstock & Energy
Ongoing
Purovsk – Pyt-Yakh – Tobolsk Pipeline
SIBUR is at an advanced stage of construction of a 1,100 km raw NGL pipeline connecting NOVATEK’s
GCP in Purovsk, Pyt-Yakh and Tobolsk, where SIBUR's flagship GFU is located (Purovsk – Pyt-Yakh –
Tobolsk pipeline). The pipeline's throughput capacity between Purovsk and SIBUR's loading rack in Noyabrsk is up to 4 million tonnes per annum, between Noyabrsk and Pyt-Yakh – approximately 5.5
million tonnes per annum, and between Pyt-Yakh and Tobolsk – approximately 8 million tonnes per
annum. The launch of the new pipeline is expected to result in a substantial extension of SIBUR's raw
NGL transportation infrastructure, an increase in its throughput capacity and reliability. The project is aimed at securing our long-term access to abundant raw NGL resources of Western Siberia, and
particularly its northern parts, where projected growth in wet gas production is expected to support rising
supplies of raw NGL. We expect the expansion and upgrade of the infrastructure for transportation of raw NGL to our flagship GFU to create a secure foundation for further development of our
petrochemicals business in Tobolsk. In March 2014, SIBUR launched the section between Purovsk and
Pyt-Yakh. The remaining sections between Pyt-Yakh and Tobolsk are currently under construction or at
commissioning stages. The entire pipeline is scheduled for completion in 2015.
Second Gas Fractionation Unit (GFU) in Tobolsk
In March 2014, SIBUR launched the second gas fractionation unit and certain elements of related
infrastructure in Tobolsk, thus expanding overall raw NGL fractionation capacity at the site to
6.6 million tonnes per annum from 3.8 million tonnes per annum. The project is aimed at handling the growing volumes of raw NGL supplies and the project is synchronised with the launch of certain sections
of the new pipeline. Total capital expenditures on the project amounts to approximately RR 14 billion (net
of VAT).

20
Petrochemicals
Completed
Expansion of BOPP-film production in Novokuybyshevsk
In May 2014, SIBUR launched a new BOPP-film production capacity of 30,500 tonnes per annum at its
existing BOPP-film production site in Novokuybyshevsk, thus increasing SIBUR’s total BOPP-film
production capacity to 180,250 tonnes per annum. Total capital expenditures on the project amounted to
approximately RR 1.9 billion (net of VAT).
Expansion of PET production in Blagoveshchensk
In April 2014, SIBUR completed the expansion of its PET capacity at Polief production site from 140,000
tonnes to 210,000 tonnes per annum, thus increasing overall PET production capacity to 285,950 tonnes
per annum. Total capital expenditures on the project amounted to approximately RR 1.9 billion (net of
VAT).
Ongoing
“ZapSib-2” (pending FID)
SIBUR completed FEED stage of the ZapSib-2 project and plans to make a final investment decision on the project within 2014. ZapSib-2 is a greenfield construction of an integrated light feed cracker/basic
polymers production complex in Tobolsk and is projected to operate a steam cracker with a total annual
capacity of 1.5 million tonnes of ethylene (technology provided by LINDE), four polyethylene production
units with a total annual capacity of 1.5 million tonnes (technology provided by INEOS), and one polypropylene production unit with an annual capacity of 500,000 tonnes (technology provided by
LyondellBasell). In case of a decision to proceed with the project, we believe that it will be the largest
integrated facility for production of basic polymers in Russia.
***
SIBUR's Board of Directors has approved the 2014 capital expenditures budget in the aggregate amount
of RR 52.6 billion (net of VAT). This excludes investments under joint ventures, loans issued to joint
ventures or acquisitions. In addition to projects that have been formally approved by the Group's
Investment Committee and the “ZapSib-2” project described above, a number of other projects have not yet gone through the formal approval process and are at various stages of review by SIBUR's
management. Therefore, the actual amount of capital expenditures that we may incur may alter from the
amounts that have been formally approved.
We expect that we will finance the approved capital expenditures through a combination of cash and cash
equivalents, cash flows from operations as well as new borrowings within the limits of our financial
policy.
Borrowings As of 31 March 2014, our total debt amounted to RR 131,452 million compared to 100,474 million as of
31 December 2013, an increase of 30.8%. The increase was largely attributable to new borrowings to
fund the acquisition of a 49% stake in OOO Yugragazpererabotka. Additionally, the increase in borrowings was due to substantial Russian rouble depreciation against the US dollar and euro and the
respective revaluation of loans denominated in these currencies.
Our net debt(1)
increased by 29.7% to RR 119,984 million as of 31 March 2014 from RR 92,526 million as of 31 December 2013.
(1)
Net debt is calculated as total debt less cash and cash equivalents.

21
The following table presents data on our total debt, cash and cash equivalents and net debt position as of
31 March 2014 and 31 December 2013:
RR millions, except as stated
As of
31 March 2014
As of
31 December 2013
Changе, %
vs 31 Dec 2013
Total debt 131,452 100,474 30.8%
Cash and cash equivalents 11,468 7,948 44.3%
Net debt 119,984 92,526 29.7%
As of 31 March 2014, all of our debt was unsecured with the exception of the USD equivalent of
RR 16,493 million outstanding under the Tobolsk-Polymer Plant project finance facility. The financing is primarily secured by OOO Tobolsk-Polymer shares and property, plant and equipment.
The following table presents detailed information on our borrowings as of 31 March 2014 and
31 December 2013:
RR millions, except as stated Currency Due
As of
31 March 2014
As of
31 December 2013
Variable rate loans
Vnesheconombank USD 2013-2023 16,493 15,729
ING Bank Group USD, EUR 2008-2021 9,609 8,343
Sberbank of Russia RR 2014 9,000 -
UniCredit Bank USD, EUR 2013-2019 8,008 7,417
Nordea Bank USD 2013-2016 7,137 7,359
RaiffeisenBank USD 2014 5,353 4,909
Citibank USD 2014-2023 3,480 3,495
HSBC Bank plc USD 2013-2014 2,294 2,805
KFW IPEX-Bank USD 2013-2014 1,784 1,636
Deutsche Bank EUR 2015-2022 642 -
Fixed rate loans
Eurobonds USD 2018 35,552 32,585
Sberbank of Russia USD, RR 2014 15,781 10,636
Russian Agricultural Bank USD 2014 7,137 3,273
VTB USD 2014 3,569 -
The Royal Bank of Scotland USD 2014 1,784 -
NPP Neftekhimia RR 2015 1,350 1,000
ZAO Sibgazpolimer RR 2014 697 697
OOO Gazprom Mezhregiongaz RR 2011-2014 583 573
RN Holding RR 2008-2014 1,184 -
Other USD 2031 16 15
Total debt 131,452 100,474
SIBUR aims to maintain a diversified debt portfolio with a sound balance of fixed and floating interest
rate instruments. As of 31 March 2014, our debt portfolio was almost evenly split between fixed rate and
variable rate borrowings, largely unchanged from 31 December 2013.
The following table presents scheduled maturities of our outstanding debt as of 31 March 2014 and
December 2013:
RR millions, except as stated As of
31 March 2014 % of total debt
As of
31 December 2013 % of total debt
Change,
%
Due for repayment:
Within one year 68,551 52.1% 42,743 42.5% 60.4%
Between one and two years 8,466 6.4% 6,344 6.3% 33.4%
Between two and five years 45,248 34.4% 42,454 42.3% 6.6%
After five years 9,187 7.0% 8,933 8.9% 2.8%
Total debt 131,452 100.0% 100,474 100.0% 30.8%
As of 31 March 2014, the portion of long-term debt decreased to 47.9% from 57.5% as of
31 December 2013, while the portion of short-term debt increased to 52.1% as of 31 March 2014 from
42.5% as of 31 December 2013. This was attributable to funding the first tranche for the acquisition of a 49% stake in OOO Yugragazpererabotka. In April 2014, SIBUR entered into a two-year credit facility
with a limit of RR 27 billion and refinanced a part of short-term debt accumulated and fully utilised as of
31 March 2014.
The following table presents the currency split of our outstanding debt as of 31 March 2014 and
31 December 2013:

22
As of
31 March 2014 % of total debt
As of
31 December 2013 % of total debt Change, % RR millions, except as stated
Denominated in:
Russian rouble 21,812 16.6% 11,270 11.2% 93.5%
Euro 4,760 3.6% 3,950 3.9% 20.5%
US Dollar 104,880 79.8% 85,254 84.9% 23.0%
Total debt 131,452 100.0% 100,474 100.0% 30.8%
As of 31 March 2014, the Russian rouble-denominated debt as a percentage of total borrowings increased
to 16.6% from 11.2% as of 31 December 2013. The growth in Russian rouble borrowings was mainly attributable to obtaining RR-denominated financing to fund the acquisition of OOO Yugragazpererabtka.
The following table presents our key liquidity and credit ratios as of 31 March 2014 and 31 December 2013:
As of
31 March 2014
As of
31 December 2013
Current ratio 0.53x 0.84x
Debt to equity 0.44x 0.43x
Debt / EBITDA 1.62x 1.27x
Net debt(1)
/ EBITDA 1.48x 1.17x
EBITDA / Interest(2)
18x 17x
As of 31 March 2014, our net debt to EBITDA ratio was 1.48x compared to 1.17x as of
31 December 2013. The EBITDA to interest(2)
ratio increased to 18x as of 31 March 2014 comparing to 17x as of 31 December 2013.
As of 31 March 2014, SIBUR had RR 56,758 million available under its existing credit facilities
denominated in Russian roubles, US dollars and euros, both short- and long-term, of which an equivalent of RR 12,087 million was committed.
Management considers SIBUR to have a strong financial position, supported by robust internal cash generation and sustainable access to external financing. These resources enable us to finance capital
expenditure needs, while meeting our debt and other obligations.
(1)
Net debt is calculated as total debt less cash and cash equivalents. (2)
Interest represents accrued interest, i.e. includes interest expense and capitalised interest.

23
OPERATIONAL DATA
Energy Products
The following table presents a breakdown of our revenue from energy product sales for the three months ended 31 March 2014 and 2013:
Three months ended 31 March Change
% RR millions, except as stated 2014 % of revenue(1)
2013 % of revenue(1)
Energy products
LPG 18,993 23.7% 13,090 19.8% 45.1%
Domestic 3,285 17.3% 2,466 18.8% 33.2%
Export 15,708 82.7% 10,624 81.2% 47.9%
Naphtha 15,188 19.0% 6,064 9.2% 150.5%
Domestic 499 3.3% 1,660 27.4% (69.9%)
Export 14,689 96.7% 4,404 72.6% 233.5%
Natural gas, domestic sales 7,095 8.9% 7,230 10.9% (1.9%)
MTBE 4,372 5.5% 5,571 8.4% (21.5%)
Domestic 4,372 100.0% 4,333 77.8% 0.9%
Export - - 1,238 22.2% (100.0%)
Raw NGL 2,859 3.6% 2,093 3.2% 36.6%
Domestic 1,767 61.8% 1,165 55.7% 51.7%
Export 1,092 38.2% 928 44.3% 17.7%
Other fuels and fuel additives 1,115 1.4% 798 1.2% 39.7%
Domestic 275 24.7% 796 99.8% (65.4%)
Export 840 75.3% 2 0.2% 49,556.7%
Energy products, total 49,622 62.0% 34,846 52.7% 42.4%
Domestic 17,293 34.8% 17,650 50.7% (2.0%)
Export 32,329 65.2% 17,196 49.3% 88.0%
The following table present data on production, purchases and sales volumes of our energy products for
the three months ended 31 March 2014 and 2013: Three months ended 31 March Change
% Tonnes, except as stated 2014 2013
LPG
Production 1,075,757 1,022,776 5.2%
Purchases from third parties, including 83,243 33,031 152.0%
Purchases for resale 50,506 - n/m
Total production and purchases 1,159,000 1,055,808 9.8%
(Internal use)(2)
(122,604) (133,364) (8.1%)
(Increase)/decrease in stock (8,472) (35,808) (76.3%)
Gross sales, including 1,027,924 886,636 15.9%
Intercompany sales to petrochemical business 199,969 204,237 (2.1%)
External sales 827,955 682,399 21.3%
Domestic 205,731 187,877 9.5%
Export 622,224 494,522 25.8%
Naphtha
Production 341,379 320,595 6.5%
Purchases from third parties, including 339,464 115,505 193.9%
Purchases for resale 275,920 - n/m
Total production and purchases 680,843 436,100 56.1%
(Internal use)(2)
(1,730) (1,207) 43.3%
(Increase)/decrease in stock (1,490) (17,426) (91.4%)
Gross sales, including 677,623 417,467 62.3%
Intercompany sales to petrochemical business 147,492 161,897 (8.9%)
External sales 530,131 255,570 107.4%
Domestic 20,491 76,731 (73.3%)
Export 509,640 178,839 185.0%
(1)
Percentages against export and import lines represent percentage of revenue from the respective product sales, while percentages against the
respective total product lines represent percentages of total revenue. (2)
Including internal use at the segment’s production facilities and immaterial natural losses.

24
Three months ended 31 March Change
% Tonnes, except as stated 2014 2013
Natural gas (thousands of cubic metres)
Production(1)
4,360,023 4,223,915 3.2%
Production, SIBUR's share(2)
3,030,307 2,863,610 5.8%
Purchases from third parties 271,039 218,267 24.2%
Total production and purchases 3,301,346 3,081,877 7.1%
(Internal use)(3)
(402,964) (357,954) 12.6%
(Increase)/decrease in stock - 800,000 n/m
External sales 2,898,382 3,523,923 (17.8%)
Domestic 2,898,382 3,523,923 (17.8%)
Export - - n/m
MTBE
Production 123,823 114,529 8.1%
Purchases from third parties - 6,493 (100.0%)
Total production and purchases 123,823 121,022 2.3%
(Internal use)(3)
(204) (94) 116.3%
(Increase)/decrease in stock (16,173) 18,555 n/m
External sales 107,446 139,483 (23.0%)
Domestic 107,446 106,709 0.7%
Export - 32,774 (100.0%)
Raw NGL
Production(1)
1,392,966 1,295,491 7.5%
Production, SIBUR's share(2)
1,000,938 920,575 8.7%
Purchases from third parties, including 806,430 752,646 7.1%
Purchases for resale - - n/m
Total production and purchases 1,807,368 1,673,221 8.0%
(Fractionation) (1,438,128) (1,347,039) 6.8%
(Increase)/decrease in stock (11,044) (1,559) 608.4%
Gross sales, including 358,196 324,623 10.3%
Intercompany sales to petrochemical business 178,008 167,466 6.3%
External sales 180,188 157,157 14.7%
Domestic 116,210 91,152 27.5%
Export 63,978 66,005 (3.1%)
Other fuels and fuel additives
Production 55,453 82,963 (33.2%)
Purchases from third parties 19 8 131.4%
Total production and purchases 55,472 82,971 (33.1%)
(Internal use)(3)
(16,364) (38,111) (57.1%)
(Increase)/decrease in stock 5,374 (2,573) n/m
External sales 44,482 42,287 5.2%
Domestic 15,970 42,163 (62.1%)
Export 28,512 124 22,940.6%
(1)
Including Rosneft’s share in production volumes of OOO Yugragazpererabotka (see “Feedstock Sourcing and Mix” in the “Certain Factors
Affecting Our Results of Operations” section for further details). (2)
Excluding Rosneft’s share in production volumes of OOO Yugragazpererabotka (see “Feedstock Sourcing and Mix” in the “Certain Factors
Affecting Our Results of Operations” section for further details). (3)
Including internal use at the segment’s production facilities and immaterial natural losses.

25
Petrochemicals
Basic Polymers
The following table presents data on our revenue from basic polymer sales for the three months ended
31 March 2014 and 2013: Three months ended 31 March Change
% RR millions, except as stated 2014 % of revenue(1)
2013 % of revenue(1)
PE (LDPE) 3,465 4.3% 2,771 4.2% 25.0%
Domestic 1,823 52.6% 1,682 60.7% 8.3%
Export 1,642 47.4% 1,089 39.3% 50.8%
PP 3,931 4.9% 2,233 3.4% 76.1%
Domestic 2,307 58.7% 1,860 83.3% 24.1%
Export 1,624 41.3% 373 16.7% 335.1%
Basic polymers, total 7,396 9.2% 5,004 7.6% 47.8%
Domestic 4,130 55.8% 3,542 70.8% 16.6%
Export 3,266 44.2% 1,462 29.2% 123.4%
The following table presents data on our basic polymer production, purchases and sales volumes for the
three months ended 31 March 2014 and 2013: Three months ended 31 March Change
% Tonnes, except as stated 2014 2013
Production 133,422 100,290 33.0%
PE (LDPE) 67,266 64,497 4.3%
PP 66,156 35,793 84.8%
Purchases from third parties 38,968 33,197 17.4%
Total production and purchases 172,390 133,487 29.1%
(Internal use)(2)
(30,770) (23,236) 32.4%
(Increase)/decrease in stock (2,722) (7,567) (64.0%)
External sales
PE (LDPE) 64,549 60,478 6.7%
Domestic 35,559 35,620 (0.2%)
Export 28,990 24,858 16.6%
PP 74,349 42,206 76.2%
Domestic 43,474 34,697 25.3%
Export 30,875 7,509 311.2%
External sales 138,898 102,684 35.3%
Domestic 79,033 70,317 12.4%
Export 59,865 32,367 85.0%
(1)
Percentages against export and import lines represent percentage of revenue from the respective product sales, while percentages against the
respective total product lines represent percentages of total revenue. (2)
Including internal use at the segment’s production facilities and immaterial natural losses.

26
Synthetic Rubbers
The following table presents a breakdown of revenue from our synthetic rubber sales for the three months ended 31 March 2014 and 2013:
Three months ended 31 March Change
% RR millions, except as stated 2014 % of revenue(1)
2013 % of revenue(1)
Commodity rubbers 4,025 5.0% 6,248 9.4% (35.6%)
Domestic 1,499 37.3% 2,826 45.2% (46.9%)
Export 2,526 62.7% 3,422 54.8% (26.2%)
Specialty rubbers 1,959 2.4% 1,748 2.6% 12.0%
Domestic 243 12.4% 318 18.2% (23.7%)
Export 1,716 87.6% 1,430 81.8% 20.0%
Thermoplastic elastomers 755 0.9% 570 0.9% 32.5%
Domestic 427 56.5% 509 89.3% (16.1%)
Export 328 43.5% 61 10.7% 438.3%
Synthetic rubbers, total 6,739 8.4% 8,566 12.9% (21.3%)
Domestic 2,169 32.2% 3,653 42.6% (40.6%)
Export 4,570 67.8% 4,913 57.4% (7.0%)
The following table presents data on our synthetic rubber production, purchases and sales volumes for the
three months ended 31 March 2014 and 2013: Three months ended 31 March Change
% Tonnes, except as stated 2014 2013
Production 96,591 119,363 (19.1%)
Commodity rubbers 56,979 87,884 (35.2%)
Specialty rubbers 23,454 24,267 (3.4%)
Thermoplastic elastomers 16,158 7,212 124.1%
Purchases from third parties 2,340 3,390 (31.0%)
Total production and purchases 98,931 122,753 (19.4%)
(Internal use)(2)
(143) (182) (21.7%)
(Increase)/decrease in stock (7,781) (15,371) (49.4%)
External sales
Commodity rubbers 58,165 81,557 (28.7%)
Domestic 21,441 35,124 (39.0%)
Export 36,724 46,433 (20.9%)
Specialty rubbers 23,722 19,324 22.8%
Domestic 2,841 3,121 (9.0%)
Export 20,881 16,203 28.9%
Thermoplastic elastomers 9,120 6,320 44.3%
Domestic 5,318 5,589 (4.8%)
Export 3,802 731 419.8%
External sales 91,007 107,200 (15.1%)
Domestic 29,600 43,833 (32.5%)
Export 61,407 63,367 (3.1%)
(1)
Percentages against export and import lines represent percentage of revenue from the respective product sales, while percentages against the
respective total product lines represent percentages of total revenue. (2)
Including internal use at the segment’s production facilities and immaterial natural losses.

27
Plastics and Organic Synthesis Products
The following table presents a breakdown of revenue from sales of our plastics and organic synthesis products for the three months ended 31 March 2014 and 2013:
Three months ended 31 December Change
% RR millions, except as stated 2014 % of revenue(1)
2013 % of revenue(1)
PET 2,857 3.6% 2,471 3.7% 15.6%
Domestic 2,848 99.7% 2,456 99.4% 16.0%
Export 9 0.3% 15 0.6% (41.0%)
BOPP-films 2,180 2.7% 1,731 2.6% 26.0%
Domestic 1,742 79.9% 1,463 84.5% 19.1%
Export 438 20.1% 268 15.5% 63.5%
Alcohols (including 2-ethylhexanol) 1,530 1.9% 1,458 2.2% 5.0%
Domestic 667 43.6% 608 41.7% 9.7%
Export 863 56.4% 849 58.3% 1.7%
Expandable polystyrene 1,243 1.6% 906 1.4% 37.3%
Domestic 904 72.8% 628 69.3% 44.1%
Export 339 27.2% 278 30.7% 21.9%
Glycols 979 1.2% 1,930 2.9% (49.2%)
Domestic 908 92.7% 1,325 68.7% (31.5%)
Export 71 7.3% 604 31.3% (88.2%)
Acrylates 834 1.0% 642 1.0% 29.8%
Domestic 359 43.0% 147 22.9% 143.5%
Export 475 57.0% 495 77.1% (4.1%)
Plastic compounds(2)
157 0.2% 426 0.6% (63.0%)
Domestic 154 97.9% 380 89.2% (59.4%)
Export 3 2.1% 46 10.8% (92.9%)
Plastics and organic synthesis products, total 9,781 12.2% 9,563 14.4% 2.3%
Domestic 7,583 77.5% 7,008 73.3% 8.2%
Export 2,198 22.5% 2,555 26.7% (14.0%)
(1)
Percentages against export and import lines represent percentage of revenue from the respective product sales, while percentages against the
respective total product lines represent percentages of total revenue. (2)
Including ABS plastics and PVC cable compounds.

28
The following table presents data on our production, purchases and sales volumes in plastics and organic
synthesis products for the three months ended 31 March 2014 and 2013: Three months ended 31 March Change
% Tonnes, except as stated 2014 2013
Production 215,943 236,603 (8.7%)
PET 67,958 54,507 24.7%
BOPP-films 25,334 22,471 12.7%
Alcohols (including 2-ethylhexanol) 40,431 40,429 0.0%
Expandable polystyrene 22,485 27,170 (17.2%)
Glycols 46,110 70,882 (34.9%)
Acrylates 10,967 11,933 (8.1%)
Plastic compounds(1)
2,658 9,211 (71.1%)
Purchases from third parties 7,789 1,388 461.0%
Total production and purchases 223,732 237,991 (6.0%)
(Internal use)(2)
(32,049) (25,637) 25.0%
(Increase)/decrease in stock (16,499) (29,076) (43.3%)
External sales
PET 57,889 47,741 21.3%
Domestic 57,731 47,464 21.6%
Export 158 277 (42.9%)
BOPP-films 25,417 20,267 25.4%
Domestic 19,830 16,919 17.2%
Export 5,587 3,348 66.8%
Alcohols (including 2-ethylhexanol) 33,889 33,984 (0.3%)
Domestic 14,507 13,526 7.3%
Export 19,382 20,458 (5.3%)
Expandable polystyrene 18,533 15,126 22.5%
Domestic 13,576 10,257 32.4%
Export 4,957 4,869 1.8%
Glycols 23,297 47,024 (50.5%)
Domestic 21,541 31,685 (32.0%)
Export 1,756 15,339 (88.6%)
Acrylates 12,203 11,199 9.0%
Domestic 4,980 2,255 120.9%
Export 7,223 8,944 (19.2%)
Plastic compounds(1)
3,956 7,937 (50.2%)
Domestic 3,841 7,227 (46.8%)
Export 115 710 (83.8%)
External sales 175,184 183,278 (4.4%)
Domestic 136,006 129,332 5.2%
Export 39,178 53,946 (27.4%)
(1)
Including ABS plastics and PVC cable compounds. (2)
Including internal use at the segment’s production facilities and immaterial natural losses.

29
Intermediates and Other Chemicals
The following table presents a breakdown of revenue from sales of our intermediates and other chemicals for the three months ended 31 March 2014 and 2013:
Three months ended 31 December
Change
% RR millions, except as stated 2014
% of
revenue(1)
2013
% of
revenue(1)
Benzene 125 0.2% 526 0.8% (76.2%)
Domestic 125 100.0% 526 100.0% (76.2%)
Export - - - - n/m
Styrene 799 1.0% 493 0.7% 61.8%
Domestic 743 93.0% 340 68.9% 118.3%
Export 56 7.0% 153 31.1% (63.6%)
Terephthalic acid 512 0.6% 618 0.9% (17.1%)
Domestic 293 57.3% 618 100.0% (52.5%)
Export 219 42.7% - - n/m
Propylene - - 159 0.2% (100.0%)
Domestic - n/m 80 50.4% (100.0%)
Export - n/m 79 49.6% (100.0%)
Ethylene oxide 551 0.7% 771 1.2% (28.7%)
Domestic 454 82.5% 730 94.7% (37.9%)
Export 97 17.5% 41 5.3% 135.9%
Butadiene 29 0.0% 57 0.1% (49.5%)
Domestic 29 100.0% 57 100.0% (49.5%)
Export - - - - n/m
Isoprene 355 0.4% 242 0.4% 46.8%
Domestic 3 0.9% 4 1.7% (21.3%)
Export 352 99.1% 238 98.3% 48.0%
Isobutylene 140 0.2% 126 0.2% 11.0%
Domestic 140 100.0% 105 83.4% 33.1%
Export - - 21 16.6% (100.0%)
Ethylene - - - - n/m
Other intermediates 585 0.7% 690 1.0% (15.2%)
Domestic 378 64.6% 421 61.0% (10.3%)
Export 207 35.4% 269 39.0% (23.0%)
Total intermediates 3,096 3.9% 3,684 5.6% (16.0%)
Domestic 2,165 69.9% 2,882 78.2% (24.9%)
Export 931 30.1% 802 21.8% 16.1%
Other chemicals 1,223 1.5% 1,509 2.3% (18.9%)
Domestic 1,196 97.8% 1,461 96.8% (18.1%)
Export 27 2.2% 49 3.2% (44.1%)
Intermediate and other chemicals, total 4,317 5.4% 5,193 7.8% (16.8%)
Domestic 3,360 77.8% 4,343 83.6% (22.6%)
Export 957 22.2% 850 16.4% 12.6%
(1)
Percentages against export and import lines represent percentage of revenue from the respective product sales, while percentages against the
respective total product lines represent percentages of total revenue.

30
The following table presents data on our production, purchases and sales volumes in intermediates and
other chemicals for the three months ended 31 March 2014 and 2013: Three months ended 31 March Change
% Tonnes, except as stated 2014 2013
Production 1,061,761 1,102,025 (3.7%)
Intermediates, including 878,804 877,080 0.2%
Benzene 31,921 40,646 (21.5%)
Styrene 46,297 43,149 7.3%
Terephthalic acid 64,094 67,714 (5.3%)
Propylene 124,066 78,559 57.9%
Ethylene oxide 46,226 71,147 (35.0%)
Butadiene 53,753 67,890 (20.8%)
Isoprene 16,012 20,665 (22.5%)
Isobutylene 38,512 32,819 17.3%
Ethylene 130,077 142,027 (8.4%)
Other intermediates 327,848 312,463 4.9%
Other chemicals 182,957 224,945 (18.7%)
Purchases from third parties 3,602 2,497 44.2%
Total production and purchases 1,065,363 1,104,522 (3.5%)
(Internal use)(1)
(958,039) (968,657) (1.1%)
(Increase)/decrease in stock (16,030) 176 n/m
External sales
Benzene 3,603 16,234 (77.8%)
Domestic 3,603 16,234 (77.8%)
Export - - n/m
Styrene 15,537 9,952 56.1%
Domestic 14,619 6,747 116.7%
Export 918 3,205 (71.4%)
Terephthalic acid 14,750 17,504 (15.7%)
Domestic 8,765 17,504 (49.9%)
Export 5,985 - n/m
Propylene - 5,842 (100.0%)
Domestic - 3,910 (100.0%)
Export - 1,932 (100.0%)
Ethylene oxide 13,048 21,356 (38.9%)
Domestic 11,072 20,304 (45.5%)
Export 1,976 1,052 87.9%
Butadiene 543 1,061 (48.8%)
Domestic 543 1,061 (48.8%)
Export - - n/m
Isoprene 4,181 2,350 77.9%
Domestic 37 39 (5.3%)
Export 4,144 2,311 79.3%
Isobutylene 2,295 2,043 12.3%
Domestic 2,295 1,658 38.4%
Export - 386 (100.0%)
Ethylene - - n/m
Other intermediates 15,100 24,139 (37.4%)
Domestic 5,304 9,569 (44.6%)
Export 9,796 14,571 (32.8%)
Total intermediates 69,057 100,480 (31.3%)
Domestic 46,238 77,025 (40.0%)
Export 22,819 23,456 (2.7%)
Other chemicals 22,237 35,561 (37.5%)
Domestic 21,958 34,277 (35.9%)
Export 279 1,283 (78.3%)
External sales 91,294 136,041 (32.9%)
Domestic 68,196 111,302 (38.7%)
Export 23,098 24,739 (6.6%)
Other Revenue
The following table presents a breakdown of our other revenue for the three ended 31 March 2014 and
2013: Three months ended 31 March Change
% RR millions, except as stated 2014 % of revenue 2013 % of revenue
Sales of processing services 474 0.6% 1,349 2.0% (64.9%)
Trading and other sales 1,673 2.1% 1,663 2.5% 0.6%
Other revenue, total 2,147 2.7% 3,012 4.6% (28.7%)
(1)
Including internal use at the segment’s production facilities and immaterial natural losses.

31
DESCRIPTION OF SELECTED OPERATIONAL AND FINANCIAL ITEMS
Revenue
Revenue, unless otherwise stated, represents revenue from sales to third parties, which excludes any inter-
segment transfers. It is reported net of VAT, excise taxes and export duties and includes transportation costs incurred in relation to the delivery of respective refined products to the customers.
Operating Expenses
Feedstock and materials. Feedstock and materials include purchases from third-party suppliers of various
types of feedstock and intermediates, which are used for further processing into higher value-added
products, and materials. Our key raw materials are represented by hydrocarbon feedstock, such as APG and NGLs, which comprise raw NGL, LPG and naphtha, as well as paraxylene, which is used in the
production of terephthalic acid (PTA). We also purchase other feedstock and materials. Other feedstock
includes methanol, which is used in the production of MTBE, polypropylene, which is used in the production of BOPP-films, and certain intermediate chemicals such as butadiene, benzene and others.
We purchase intermediates in addition to our own production of intermediates primarily for further
processing into higher value-added petrochemical products. Materials primarily include supplementary raw materials, spare parts, materials for auxiliary workshops and other operating supplies.
Transportation and logistics. Transportation and logistics comprise expenses related to transportation of
feedstock, materials and refined products by railway, via pipelines that are not owned and operated by SIBUR, by trucks and marine vessels, as well as through multimodal transportation operators. These
costs also include transshipment and storage services, as well as charges for rail cars/tankers used by
SIBUR under short-term transportation contracts. Transportation and logistics costs are related to third-party services and exclude expenses associated with ZAO Sibur-Trans (the Group’s subsidiary) activities
and maintenance of our own gas and product pipelines.
Rent expenses. Rent expenses primarily represent rental of rolling stock for transportation of raw NGL and LPG, as we rent specialised rail cars and tank wagons, as well as general purpose rail cars. Rent
expenses also include lease payments for land plots on which our facilities are located.
Goods for resale. Goods for resale include purchases of products from third parties for further resale
externally, including refined products and intermediates.
Energy and utilities. Energy and utilities costs primarily comprise expenses associated with purchases of
electric power, heat and fuel from third-party suppliers.
Staff costs. Staff costs comprise primarily salaries, bonuses and other personnel incentives, severance payments, pension expenses and related social taxes.
Depreciation and amortisation. Depreciation comprises depreciation of property, plant and equipment calculated on a straight-line basis to allocate the cost of property, plant and equipment to their respective
residual values over their respective estimated useful lives. Amortisation comprises amortisation of
intangible assets calculated using a straight-line method to allocate the cost of relevant intangible assets over their estimated useful lives.
Repairs and maintenance. Repairs and maintenance comprise services for repairs and maintenance of the
Group's production facilities provided by third parties. These expenses include inter alia expenses
incurred in relation to implementation of one-off targeted programmes.
Processing services of third parties. Processing services represent services we obtain from other
manufacturers, including our non-consolidated joint ventures, to process our feedstock / intermediates into higher value-added products. Our decision to use such services depends on existing agreements,
market trends, logistical issues and shortages of our own capacity.

32
Services provided by third parties. Services provided by third parties comprise services related to
environmental and industrial safety, R&D, design and engineering, security expenses as well as legal,
audit, consulting services, etc.
Taxes other than income tax. Taxes other than income tax primarily include land tax and property tax.
Charity and sponsorship. SIBUR places a very high degree of importance on social responsibility. As a
major investor in the economic development of the regions where we operate, we have signed mutually
beneficial agreements with a number of regional authorities, including agreements on social-economic
cooperation. As part of our social initiatives, we implement a range of humanitarian projects and programmes in several regions, including Western Siberia, the Tomsk and the Nizhny Novgorod regions,
St. Petersburg and other areas, where we are implementing our strategic investment projects. This
includes investments in regional infrastructure, improvement of people’s life quality, ecological initiatives, support of sports organisations, promotion of child and youth sports, etc. We also actively
promote Russia’s chemical science and professional education in cooperation with leading chemical
institutions, universities and schools.
Marketing and advertising. Marketing and advertising costs are associated with the promotion of
SIBUR’s corporate brand and are aimed at enhancing SIBUR’s profile among our customers, suppliers,
partners and general public. The majority of our marketing and advertising expenses relate to corporate sponsorships of leading Russian and regional football, hockey, basketball and volleyball teams in
different regions of Russia, including Tyumen, Nizhny Novgorod, and St.Petersburg, which positions us
as an active promoter of Russian sports both nationally and in the regions where we operate.
Additionally, marketing and advertising costs include promotion of SIBUR’s corporate brand and
selected products at industrial exhibitions, conferences and forums, as well as via TV, print media and the
Internet.
Change in work-in-progress and refined products balances. The change in work-in-progress and refined
product balances represents an adjustment to expenses associated with the production of refined products to reflect changes in inventory balances of such products. When inventory balances of refined products
increase at the end of a reporting period compared to the beginning of the respective period, operating
expenses are reduced by an amount, which represents the cost of production of such refined products incurred in the reporting period, while revenue from sale of these products will be recognised in the
future. When inventory balances of refined products decrease at the end of a reporting period compared
to the beginning of the respective period, operating expenses are increased by an amount, which
represents the cost of production of such refined products incurred in the preceding periods, while revenue from the sale of these products is recognised in the reporting period.
Our volumes of refined product balances fluctuate from period to period depending on market conditions, changes in marketing and distribution strategy, as well as logistical constraints. They also tend to
increase in the periods of completion of our major investment projects, which may trigger substantial
inventory accumulation.
Equity-settled share-based payment plans represent respective grants to certain current and former
directors and members of the key management of the Group. In accordance with IFRS 2 “Share-based
Payment”, the Group has to recognise current and past service costs associated with the plans as operating expenses in the statement of profit or loss, and also record the corresponding amounts as an increase in
equity in the statement of changes in equity and the statement of financial position. See Appendix III for
further details.
Net operating expenses represent total operating expenses less operating expenses related to equity-settled
share-based payment plans.

33
Operating Profit
Operating profit represents revenue less operating expenses.
EBITDA
EBITDA represents profit / loss for the reporting period adjusted for income tax expense, finance income
and expenses, share of net income / loss of joint ventures, depreciation and amortisation, impairment of
property, plant and equipment, gain / loss on disposal of investments and exceptional items.
Finance Income and Expenses
Finance income includes primarily interest income on bank deposits and loans issued and foreign exchange gains. Finance expenses include primarily interest expense on debt, bank charges and foreign
exchange losses.
Share of Net Income / (Loss) of Joint Ventures
Share of net income / (loss) of joint ventures represents our share of post-acquisition profit or loss of joint
ventures as recognised under equity accounting method.
Income Tax Expense
We do not pay corporate income tax on a consolidated basis since, for taxation purposes, the members of
the Group are assessed individually. The statutory corporate income tax rate in Russia was set at 20% for
the periods under review. The difference between our effective and statutory tax rates is typically
attributable to certain non-deductible expenses and (or) non-taxable income as well as tax benefits that we may obtain in certain regions where we operate.
Effective Income Tax Rate
Effective income tax rate represents share of income tax expense in the adjusted profit for the period.
Adjusted Profit
Adjusted profit represents net profit for the period adjusted for exceptional non-cash items.

34
APPENDIX I: Net Working Capital
SIBUR’s net working capital position takes into account trade receivables net of advances from customers; inventory balances of refined products, goods for resale, feedstock and materials; VAT
balance; trade payables net of prepayments and advances to suppliers; payables to employees; and other
assets and liabilities listed in the table below.
The following table presents detailed calculation of our net working capital position as of 31 March 2014
and 31 December 2013:
RR millions, except as stated As of
31 March 2014
As of
31 December 2013
Current assets 81,212 74,429
Current liabilities (143,208) (81,480)
Working capital (61,996) (7,051)
Adjustmets to assets, including: (18,752) (16,641)
Loans receivable (667) (1,735)
Cash and cash equivalents (11,468) (7,948)
Restricted cash (933) (1,106)
Assets classified as held for sale (5,715) (5,885)
Recoverable VAT related to assets under construction(1)
31 33
Adjustmets to liabilities, including: 112,370 54,969
Accounts payable to contractors and suppliers of property,
plant and equipment 7,567 10,424
Payables for acquisition of subsidiaries 35,625 819
Short-term promissory notes payable 1 1
Interest payable 626 982
Short-term debt and current portion of long-term borrowings 68,551 42,743
Adjusted working capital 31,622 31,277
(1)
Represents non-current portion.

35
APPENDIX II: OOO Yugragazpererabotka
Establishment of OOO Yugragazpererabotka in 2007
In 2007, SIBUR and TNK-BP Holding (renamed RN Holding as of 30 July 2013 following the
acquisition by Rosneft) established a joint venture (JV) OOO Yugragazpererabotka. SIBUR owned a
51% stake in the JV, while RN Holding’s share was 49%. OOO Yugragazpererabotka owns and operates
three GPPs with total APG processing capacity of 13.4 billion cubic metres per annum (Nizhnevartovskiy GPP, Belozerniy GPP and Nyagan GPP), three compressor stations and APG pipelines from compressor
stations to the GPPs. SIBUR and RN Holding operated within a contractual network, under which
RN Holding supplied APG to OOO Yugragazpererabotka for processing into raw NGL and dry gas(1)
. In
addition to volumes from RN Holding, dominant supplier of APG to the JV, OOO Yugragazpererabotka
also processed APG supplied from other oil companies. SIBUR and RN Holding owned the feedstock
and refined products, while paying a processing fee to OOO Yugragazpererabotka. SIBUR paid for 51%
of the total APG volumes supplied for processing to OOO Yugragazpererabotka and obtained 51% of the
total NGLs and dry gas volumes produced by the JV. RN Holding obtained the remaining volumes.
Subsequently SIBUR purchased RN Holding’s share of NGLs and sold to RN Holding its share of dry
gas.
Deconsolidation of OOO Yugragazpererabotka in 2013
In March 2013, SIBUR’s call options that had entitled the Group to purchase RN Holding’s share in OOO Yugragazpererabotka were terminated, and the term of the JV was extended to indefinite.
Following the termination of the call options, we started accounting for our investment in
OOO Yugragazpererabotka as an investment in joint ventures, while previously
OOO Yugragazpererabotka was consolidated as a wholly owned subsidiary and RN Holding’s contribution was accounted for as interest-bearing long-term loans. As a result of the deconsolidation, we
recognised a gain of RR 2,413 million (post-tax) in the first quarter of 2013, which was attributable to
higher carrying amount of newly recognised balance sheet items of OOO Yugragazpererabotka compared to carrying amount of deconsolidated balance sheet items.
The following table presents calculation of the post-tax gain recognised on deconsolidation of OOO Yugragazpererabotka in the first quarter of 2013 and the year ended 31 December 2013:
Income from derecognition of RN Holding’s share previously recognised as long-term debt 4,949(2)
Share of net assets recognised as investment in joint ventures (based on net assets of RR 5,176 million and a
51% ownership) 2,640
Total income from deconsolidation of a subsidiary 7,589
Less: Net assets deconsolidated (5,176)
Post-tax gain on deconsolidation of a subsidiary 2,413
Acquisition of control in OOO Yugragazpererabotka and new supply and purchase contracts in 2014
On 6 March 2014, SIBUR acquired from Rosneft Group a 49% interest in OOO Yugragazpererabotka,
gaining full control over the three GPPs and related infrastructure, at the same time the parties entered
into new APG supply and natural gas purchase contracts. The deal value totaled USD 1.567 billion in
cash with USD 0.567 billion paid in March 2014 and the remaining amount payable within one year after the acquisition date.
New contracts replace a number of supply and purchase contracts for APG, raw NGL and dry gas supplied to and produced at the GPPs of OOO Yugragazpererabotka, under which the parties previously
operated. The new contracts are effective from 1 April 2014. Tenor of the APG and natural gas contracts
was extended from 2026 to 2032 (inclusive). Rosneft will increase guaranteed volumes of APG to be supplied to the three GPPs to approximately 10 billion cubic metres per annum from 6.6 billion cubic
(1)
Equivalent to natural gas. (2)
Includes principal amounts of debt owed by SIBUR to RN Holding and accrued interest. Excludes debt owed by OOO Yugragazpererabotka
to RN Holding.

36
metres per annum. Under new arrangements, SIBUR will pay for 100% of APG supplied to the GPPs of
OOO Yugragazpererabotka with Rosneft remaining the dominant supplier. The new APG price will be
formula-based and indexed in line with changes in prices for APG derivatives: dry gas and raw NGL. SIBUR will retain 100% of natural gas produced at the GPPs and will has an arrangement to sell all
volumes produced at Nizhnevartovskiy GPP and Belozerniy GPP to Rosneft at a price directly linked to
the regulated domestic gas price. The supply contracts for raw NGL produced at the the GPPs of OOO Yugragazpererabotka were terminated and SIBUR will retain 100% of raw NGL volumes produced
at these GPPs.
SIBUR consolidates OOO Yugragazpererabotka as a wholly owned subsidiary from the acquisition date. The arrangements have the following impact on our operational and financial results:
increase in APG purchasing volumes and costs. SIBUR will be purchasing 100% of APG supplied to
the GPPs of OOO Yugragazpererabotka, while previously we purchased 51% of the volumes.
increase in raw NGL production, decrease in raw NGL purchasing volumes and costs. SIBUR will
consolidate 100% of raw NGL produced by the GPPs of OOO Yugragazpererabotka, while previously we retained 51% of these volumes and purchased the remaining 49% from Rosneft.
increase in production volumes, sales volumes and revenue from sales of natural gas. SIBUR will
consolidate 100% of natural gas produced by the GPPs of OOO Yugragazpererabotka and has a right
to sell all volumes produced at Nizhnevartovskiy GPP and Belozerniy GPP to Rosneft. Previously Rosneft obtained 49% of natural gas produced at the the GPPs of OOO Yugragazpererabotk, while SIBUR
sold the remaining 51% to Rosneft.
increase in operating expenses other than feedstock & materials. SIBUR will consolidate operating
expenses of OOO Yugragazpererabotka, while the related processing fee will be treated as
intercompany. Following the deconsolidation in March 2013, we paid processing fee to the JV and did not consolidate its operating expenses. The change will primarily affect energy & utilities, staff
costs, depreciation & amortisation, repairs & maintenance that are expected to increase, as well as
processing services of third parties that are expected to substantially decline.
increase in the value of PP&E, goodwill and other non-current assets. As a result of the transaction,
the Group recognised intangible assets related to the supply contracts of RR 115,816 million and
goodwill arising on the acquisition of RR 2,479 million as of 31 March 2014.
The following table presents the carrying amounts of assets and liabilities at the acquisition date: Fair values
Property, plant and equipment 23,934 Intangible assets related to the supply contracts 115,816 Deferred income tax liabilities (26,096)
Short-term and long-term debt (2,559) Other (2,414)
Net assets of the acquired subsidiary 108,681
Less: Fair value of interest previously held 55,427 Total purchase consideration 55,733
Goodwill arising on acquisition 2,479
increase in the value of accounts payable and total debt. The increase relates to payables for the
acquisition of OOO Yugragazpererabotka of RR 34,806 million as well as new borrowings for
funding the transaction
non-cash gain on equity interest recorded in our statement of profit or loss in the amount of
RR 52,773. It relates to the difference between fair value of SIBUR’s interest in the JV and the
amount of the deconsolidated net assets, which represent SIBUR’s share in the JV accounted for at
historical cost. For the purpose of dividends calculation SIBUR’s net profit will be adjusted for this charge.
increase in capital expenditures. Following the acquisition of control in OOO Yugragazpererabotka,
SIBUR will consolidate OOO Yugragazpererabotka’s capital expenditures, while previously we paid
51% and reported them as loans issued or contributions to share capital of joint ventures.

37
APPENDIX III: Equity-Settled Share-Based Payment Plans
On 28 June 2013, a company beneficially owned by Mr. Mikhelson and Mr. Timchenko granted equity- settled share-based payment plans to certain current and former Group’s directors and key management.
Consequently, the indirect interest beneficially owned by Mr. Mikhelson and Mr. Timchenko in the
Company's share capital decreased from 94.5% to 82.5%. Furthermore, the total combined equity interest held by the current and former members of the Group’s management increased from 5.5% to 17.5%.
The transactions resulting in this change in ownership were made through companies that are not under
the control of the Group but through a company jointly and beneficially held by the major shareholders. Thus, at the Group level, there are no current or future cash payments or liabilities under two plans, terms
and conditions of which vary for different Participants. However, under IFRS 2 “Share-Based Payment”,
the Group must recognise current and past service costs in its statement of profit or loss with corresponding amounts recorded in a statement on changes in equity.
The final terms of the plans, which cover certain members of the directors and key management (the
"Participants") of the Group, were approved by the Group's shareholders in July 2013.
The First Plan - The plan for one group of Participants (the "First Plan") requires that the Participants
provide services to the Group within a certain time period. If the services are terminated before the vesting date, the First Plan Participants retain their rights under the First Plan pro rata to the period of
service provided. The granted shares are vested to each Participant annually in tranches. Each tranche
comes to 20% of the total shares granted provided that the participant is continuously employed by the Company from the grant date until the applicable vesting date. Each tranche is accounted as a separate
arrangement and expensed, together with a corresponding increase in shareholders’ equity, on a straight–
line basis over the vesting periods.
For the three-month period ended 31 March 2014, the Group recognised RR 3,900 within equity reserves
and a corresponding increase in operating expenses.
The Second Plan - The plan for the other participants (the "Second Plan") was immediately vested and
there are no future charges under this plan.
The equity-settled share awards under the plans are measured at the fair value for the underlying shares
calculated at the grant date using a valuation model.
As of the grant date, the calculation of the Group’s equity value uses pre-tax cash flow projections based on a five-year financial forecast. Cash flows beyond the five-year period are extrapolated based on an
estimated growth rate of 2.35%, which is the long-term average growth rate for the industry in which the
Group operates. The following key assumptions are used in the equity value calculation: a pre-tax discount rate of 16.63%, oil price of USD 89-99 per bbl and Russian Federation Consumer Price Index of
5.0 – 6.5%.