managerial accounting and production ... - iba group
TRANSCRIPT

Managerial Accounting and Production Performance Analysis System
MARINA KAVALIOVAJanuary 2019

Project Overview
IBA developed and implemented a managerial accounting system at the Belarusian Steel Works. The system is based on the methods of managerial accounting and production performance analysis suggested in the Theory of Constraints and Total Productive Maintenance.
Two groups of key performance indicators (KPI) are applied in the system.• Production performance indicators for throughput• Production efficiency rates. The group is developed using Overall Equipment Effectiveness (OEE)
concepts that cover not only individual equipment units but the entire production lifecycle.
Continuous monitoring and analysis of KPIs provides a base for production improvement. The principles of managerial accounting and production performance analysis are applicable to different types of production.

Project Overview
Information support for managerial accounting and production performance analysis is provided using advanced business analysis and data warehousing solutions. Source data are extracted from information systems functioning at the organization, primarily at the shop/department level.
The current approach to performance assessment was tested at Russian and Belarusian enterprises.
As the customer needed to solve a wide range of methodological, organizational, and technical issues, IBA applied an iterative approach to the development and deployment of the managerial accounting and production performance analysis system (MAPPAS).
At the first stage (3–4 months), the solution was customized to meet the specifics of the customer's business processes. As a result, a working prototype was devised and submitted to the customer. In the course of beta testing of the prototype, a decision was made regarding the number of stages and their contents.

Project Stages
1. Purpose
The system is designed to improve production efficiency of the enterprise.
2. Features and Benefits
For business owners and managers• Monitoring and analysis of production
efficiency• Consolidated and detailed reporting. Provision
of performance indicators for organizational subdivisions (holding, companies, departments, shops, divisions), lines of business, products, and product groups
• Accessibility through internet/intranet from any location at any time
• Unified source of operational and analytical information
• Efficiency indicators that help develop a personnel motivation system.
For production specialists:
• Identification of major causes of performance losses• Analysis of performance loss reasons in order to develop and
initiate actions for production improvement• Effectiveness assessment of the implemented actions by
comparing efficiency indicators before and after the actions• Grounded budget formation for technical support and
maintenance based on repairs expense and downtime losses• Strategy formation for technical support and maintenance by
analyzing downtime losses and the equipment's role in the production business processes
• Grounded decision–making on the production modification including modification of technological processes, and modification and replacement of equipment, taking into account current losses and the needed investment.

Project Stages
3. Assessment of Production Efficiency
The methods of managerial accounting and analysis of operational production efficiency defined in the Theory of Constraints and Total Productive Maintenance lie at the heart of the approaches used in the system.
The system utilizes two groups of key performance indicators (KPI):
• Production performance indicators in terms of throughput• Production efficiency rates. The group is developed using Overall Equipment Effectiveness (OEE)
concepts that relate not to individual equipment units but to the entire production lifecycle.

Throughput: KPIs and Related Reports
This group assesses expected marginal profit and throughput. For each indicator, a basic (normative), real and deviation of the real from the basic value are calculated.
Marginal profit from sales of a product (MP)MP = P — TVCP: product priceTVC: total variable direct production costs
ThroughputT = MP/tT: throughput or productivity by cash flow (speed at which a production system generates marginal profit)t: duration of the production cycle.
Throughput is the most universal performance indicator for a production system. It is used to assess not only the production losses (defective products, efficiency losses, downtimes) but the economic effectiveness of production.
Based on the primary values of performance indicators for individual products and product groups in different breakdowns (by shift/team, day, month, product, product group or shop), cumulative performance indicators and reports are generated.

Production Efficiency Indicators
Calendar Time
A Planned work time Idle time
B Real work time Downtime
C Theoretical output
D Real output Speed losses
E Total produced goods
F Quality goods Defective goods
Calculation principles for production efficiency rates and related indicators: Availability, Throughput, and
Quality
Availability rate AR = B/A
Throughput rate TR = D/C
Quality rate QR = F/E
Production efficiency rate PER = AR*TR*QR
Project Stages
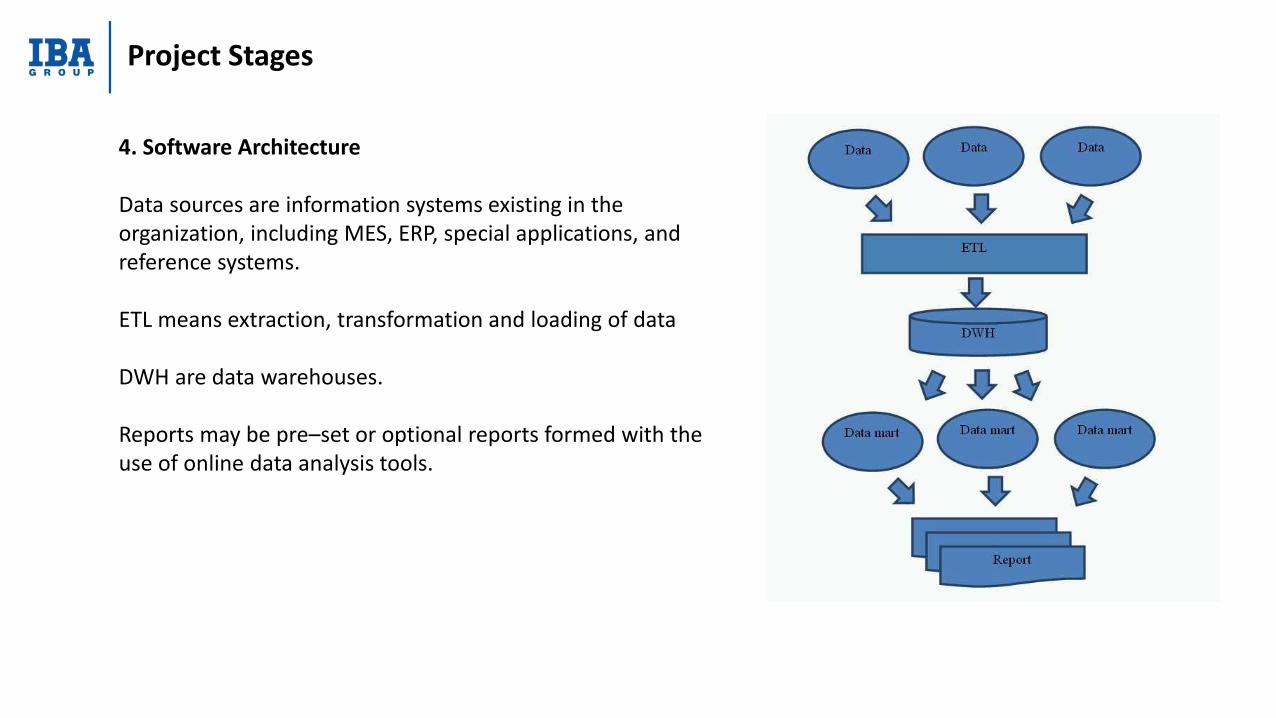
4. Software Architecture
Data sources are information systems existing in the organization, including MES, ERP, special applications, and reference systems.
ETL means extraction, transformation and loading of data
DWH are data warehouses.
Reports may be pre–set or optional reports formed with the use of online data analysis tools.

Project Stages
5. MAPPAS Implemented at Belarusian Steel Works
As the project involves a range of methodological, organizational, and technical issues, IBA suggested an iterative approach for the development and implementation of MAPPAS. IBA has been successfully using the iterative approach in different projects. Each iteration lasts typically 3–4 months and results in the installation of a working system at the customer premises. The number of iterations is not set in advance but determined dynamically depending on customer needs. After completion of each iteration, a decision is made, whether another iteration is needed.
This approach ensures minimization of project risks and guarantees that the system is developed in coordination with the evolution of customer requirements.

Project Stages
5.1. Object of Analysis
IBA analyzed operations of steel melting works that consisted of two electrical steel melting shops. The data source under analysis was a shop–level information management system (Manufacturing Execution System — MES).
IBA applied ETL tools to load information automatically from the MES in line with a schedule to a data warehouse built on Oracle. The analytical part of the system was built on Cognos 8 BI.

Project Stages
5.2. Pre–Set Reports for Selected Time Periods
5.2.1. Report by Production Efficiency Rate and Throughput
5.2.2. Efficiency Rate Report
5.2.3. Production Losses for Relevant Time Periods (broken down by team)
5.3. Pre–Set Reports Broken Down by Melt
5.3.1. Melt Detail Report
5.3.2. Melt Losses Report
5.3.3. Melt Unit Report

Project Stages
6. Optional Reports
The user can generate optional reports online utilizing information stored in the data warehouse. MAPPAS provides a variety of filtering and sorting capabilities. The following are a number of sample reports.
6.1. Report Generation Tools
The report generation tools enable the user to create reports “on the fly” utilizing aggregation, data sorting, and diagram generation features.

Project Results
The customer implement the Managerial Accounting and Production Performance Analysis System successful.

Do you have any questions?
Marina Kavaliova
tel: +375 17 217 33 33mailto:[email protected]
Us.ibagroupit.com