managing capital via internal capital market transactions: the … · managing capital via internal...
TRANSCRIPT

Managing Capital via Internal Capital Market Transactions:
The Case of Life Insurers
Greg Niehaus
Darla Moore School of Business
University of South Carolina
Columbia, SC 29208
803-777-7254
December, 2014
Abstract:
Understanding the movement of capital between insurers and affiliated companies under
common ownership is important for understanding how insurers manage insolvency risk, as well as
the impact of regulatory policies regarding capital standards and group supervision. Aggregate data
indicate that life insurers received substantial internal capital contributions from other entities in
their group and decreased the internal shareholder dividends paid during the financial crisis. Panel
data estimates indicate that, on average, a dollar decrease in performance (net income plus
unrealized capital gains) when performance is negative is associated with a $0.26 increase in capital
contributions to life insurers from other entities in the group, and that a dollar increase in
performance when performance is positive is associated with a $0.56 increase in the amount of
internal shareholder dividends paid by life insurers to other entities in the group. Interestingly, the
sensitivity of internal dividends to positive performance increased during the financial crisis. Also,
insurers with low (high) risk-based capital ratios receive more (less) internal capital contributions
than other insurers, holding other factors constant.
Keywords: capital; insurance; risk management; internal capital market
Acknowledgements: The author appreciates the research assistance of Justin Choma (who was
supported by the Moore School Research Grant Program) and Chia-Chun Chiang. The author also
recognizes the comments and suggestions from D.H. Zhang, Motohire Yogo, Cindy Soo, Daniel
Schwarcz, Richard Rosen, Tom Rietz, Greg Nini,Tanakorn Makaew, Tyler Leverty, Cameron Ellis,
Randy Dumm, seminar participants at the Universities of Georgia, Iowa, and South Carolina, and
conference participants at the 2014 Annual meetings for the Financial Intermediation Research Society,
Western Economic Association, Insurance Risk and Finance Research Conference, and American Risk
and Insurance Association.

1
Managing Capital via Internal Capital Market Transactions:
The Case of Life Insurers
1. Introduction
Despite a large literature on the determinants and regulation of capital held by insurance
companies, there is limited research on how these institutions manage capital internally, i.e., how
they move capital among companies under common ownership.1 Understanding the allocation of
internal capital in financial institutions is important for insolvency risk assessment purposes,
whether this is done by consumers, regulatory authorities, rating agencies, or internal risk
managers. Understanding internal capital flows is also important for the formulation of policies
regarding capital regulation and group versus company level supervision, topics that have
received considerable attention since the financial crisis. 2
The purpose of this paper is to provide a peek inside insurance holding company systems
to see how capital flows among the internal entities. The variables examined are motivated by a
simple framework that views a holding company structure as an arrangement for allocating capital
where it is most productive. The framework predicts that the flow of capital within a group, all
else equal, will be inversely related to an insurer’s performance. That is, when an insurer
performs poorly (well) for exogenous reasons, capital will flow to (away from) the insurer. The
empirical evidence, from both aggregate data and panel data, support this prediction. The
negative relation between performance and internal capital flows may appear contradictory to
intuition and studies in the internal capital markets literature which indicate that capital should
flow to entities that add the most value, which under plausible conditions means to entities that
1 Examples of insurer capital structure studies are Cummins and Nini (2002), Klein et al. (2002), Baranoff and
Sager (2002), Harrington and Niehaus (2003), and Fier et al. (2013). The literature related to insurance groups
will be reviewed below. Papers on internal capital markets in banks include Houston et al. (1997), Houston and
James (1998), Campello (2002), Holod and Peek (2010), de Haas and van Lelyvand (2010), and Cremers et al.
(2011). 2 AIG’s problems during the financial crisis have led to calls for greater group level supervision, federal
regulation of insurance, and greater coordination between regulatory authorities in other countries. See
Harrington (2009) for a discussion of AIG and the financial crisis; also see Committee on Financial Services
(2010). The National Association of Insurance Commissioners (NAIC) identified group regulatory issues as one
of the focus areas of its Solvency Modernization Initiative (See Solvency Modernization Initiative Task Force
(2013)). In 2010 the NAIC modified model laws to enhance the ability of insurance regulators to “look in the
window” of non-insurance affiliates. See Insurance Holding Company System Regulatory Act (Model #440) and
the Insurance Holding Company System Model Regulation with Reporting Forms and Instructions (Model
#450). Also, the task force has stated that it will require a group capital assessment under the Own Risk
Solvency Assessment (ORSA).

2
have performed well. The apparent discrepancy is easily resolved by the institutional context: In
the life insurance industry, deterioration in a firm’s capital, which follows from poor performance,
is likely to be associated with reduced demand for the firm’s products and a negative impact on
franchise value.3 As a consequence, for insurers whose capital is exogenously depleted
(augmented), the marginal impact of additional capital on the insurer’s franchise value is high
(low), and so internal capital is transferred to (away from) these insurers.
There are of course potential costs of shifting additional capital to an insurance company
in a group. For example, adding capital will diminish the value of the option to default on that
entity’s claims. In addition, given regulatory restrictions on the ability to remove capital from
insurance companies, placing capital in an insurance entity potentially diminishes the ability to
reallocate that capital to better uses in future periods. Given these tradeoffs, insurance groups
have an incentive to allocate sufficient capital to their insurance entities to provide assurance to
policyholders (most likely through rating agencies) that it will meet claim payments, but not put
excess capital in the insurance entity. Instead, the group will hold excess capital in non-insurance
entities so that it can be allocated to other projects. This reasoning implies that groups will
transfer capital out of insurers when they are performing well and transfer capital to insurers
following poor performance. This negative relationship between performance and internal capital
transfers is the focus of the paper.
The data are from life insurance companies from 2006-2011. This time period was
selected so that internal capital movements during the financial crisis could be examined. As
discussed by Berry-Stolzle et al. (2014) and Niehaus (2013), the life insurance industry, especially
annuity providers, experienced lower operating income and large losses on their investments
during 2008 and 2009. As a consequence, the capital cushion of many life insurers and annuity
providers would have declined substantially during the crisis if not for actions that replenished
capital (discussed further below), including internal capital market transactions.
I examine insurance company internal capital market transactions in the aggregate over
time and using a panel data set. The aggregate data indicate substantial variation in internal
capital market activity over the six-year sample period. For example, in the two years before
(after) the 2008-2009 financial crisis, life insurers contributed $2.7 billion ($3.0 billion) in capital
3 See e.g., Epermanis and Harrington (2006) for empirical evidence on the response of premiums to ratings and
see Eling (2012) for a review of the literature on market discipline in insurance.

3
to non-life insurance entities in their group, but during the financial crisis these life insurers
received $22.3 billion in capital contributions from non-life insurance entities in their group. This
evidence, along with other evidence using the aggregate time series data, suggests that internal
capital markets act as a risk sharing arrangement for life insurers, where internal capital flows out
of the industry during good times and into the industry during bad times. It also indicates that the
capital of non-insurance entities is used in insurer capital management.
The panel data analysis indicates that internal capital market transfers (capital
contributions and shareholder dividends) are related to the performance and capitalization of
individual insurance companies. When life insurer performance (net income plus unrealized
capital gains) is negative, a dollar decrease in performance is associated with a $0.26 increase on
average in capital contributions received. When life insurer performance is positive, a dollar
increase in performance is associated with a $0.56 increase in internal shareholder dividends paid,
on average. Stated differently, if one just considers internal capital market transactions, life
insurers augment their capital by about $0.44 for each dollar that they earn and their capital is
reduced by about $0.74 for each dollar that they lose, on average. Since performance on average
would be expected to be positive, this asymmetry does not necessarily imply that capital declines
over time. Indeed, if I use these two point estimates to characterize the flow of internal capital to
and from a life insurer and assume a normal distribution for performance with parameters equal to
those from the sample, then I find that the expected change in capital only considering internal
capital flows is zero.
Interestingly, the sensitivity of internal dividends to positive performance increases
significantly during the financial crisis. This finding is consistent with groups extracting
additional capital from life insurers that were performing relatively well during the financial crisis
to shore up the capital of other entities in the group due to greater financial constraints facing
insurance groups during this period. In addition, I find that internal capital contributions are
higher on average for insurers with risk-based capital ratios in the lowest decile and lower for
insurers with risk-based capital ratios above the median. Overall, the sensitivity of internal capital
market transactions to performance and capitalization found in the panel data is also consistent

4
with groups of companies providing an important risk sharing mechanism for life insurance
companies.4
This paper contributes to at least three lines of literature. First, there is a growing
literature on how financial institutions responded to the financial crisis. Regarding life insurers,
there are three recent papers. Berry-Stolzle et al. (2014) report that life insurers raised substantial
amounts of external capital in 2008 and 2009. Koijen and Yogo (2014a) show that insurers sold
policies at substantial discounts relative to actuarial value because under statutory accounting
rules doing so resulted in higher reported capital during this time period. Koijen and Yogo
(2014b) show that annuity providers increased their use of internal reinsurance, which increased
statutory capital, during and after the financial crisis. This paper demonstrates that life insurers
also accessed internal capital markets during the crisis to increase capital.
Second, the analysis is related to the extensive corporate finance literature on internal
capital markets. 5 This literature examines the benefits and costs associated with giving managers
the option to transfer capital across investment projects within a firm. The benefits of an internal
capital market arise when headquarter managers can better allocate capital to investment projects
and lower financing costs that would apply without an internal capital market. On the other hand,
internal capital allocation could allow managers to allocate capital in ways that further their own
interests and/or encourage unproductive lobbying efforts by project managers. This paper
provides evidence that insurance holding company systems have active internal capital markets
and that capital flows to entities that would have otherwise suffered reductions in their capital
base, which I argue is what would be expected if capital flowed to its most productive use. This
evidence suggests that internal capital markets provide an important risk sharing arrangement for
insurance companies. This paper, however, does not address the agency issues associated with
insurance groups.6 Whether the benefits of this risk sharing arrangement are offset by agency
issues in some cases is left for future analysis.
4 These findings are consistent with evidence of banking groups. For example, Cremers et al. (2011) examine a
large banking group and show that funds from the group are provided to member banks that experience deposit
shortfalls. Campello (2002) shows that small banks that are affiliated with large groups are more insulated from
negative shocks compared to unaffiliated banks. 5 See e.g., Gertner, Scharfstein, and Stein (1994), Scharfstein and Stein (2000), and Stein (2007). Examples of
empirical studies include Shin and Stulz (1998), Khanna and Tice (2001), Maksimovic and Phillips (2002),
Gertner, Powers, and Scharfstein (2002), and Billett and Mauer (2003). Maksimovic and Phillips (2007) and
Triantis (2003-2004) provide summaries of the literature. 6 Recent evidence highlights that subsidiary and divisional managers’ connections to managers at headquarters
influence capital allocation (see Glaser et al. (2013) and Duchin and Sosyura (2013)).
5
Third, the paper provides evidence relevant to the debate on how best to regulate
insurance groups. In the U.S., individual insurance companies are regulated primarily by their
domestic regulator, i.e., by the state in which the company is domiciled. In addition, for a group
of insurance companies under common ownership that are domiciled in different states, one of the
domestic regulators is designated as the lead regulator for the purpose of coordinating and
fostering communication among the domestic regulators of the insurers in the group. The U.S.
approach to group supervision is sometimes described as a “windows and walls” approach, i.e.,
regulators have a window to see what is happening within the group of companies and have
erected walls to prevent capital from moving out of insurance companies (DeFrain, 2012). In
contrast, under Solvency II, Europe has adopted group supervision and group capital
requirements. By examining the movement of capital across entities, this paper provides evidence
on the extent to which and the circumstances under which capital flows through the walls.
Regarding regulatory issues, the evidence presented here has at least three implications.
First, capital is moved among entities within a group, which is consistent with insurance capital
being managed at the group level. Moreover, capital from non-insurance entities is used to
manage the capital of insurers. Based on these findings, once can conclude that if capital
supervision and regulation mirrored how capital is managed in practice, then supervision and
regulation would be at the group level. Second, the evidence that capital is shifted to insurers that
perform poorly suggests that groups view the amount of capital held by individual insurance
entities in the group as being important, most likely because rating agencies view the amount of
capital held by individual entities as being important. This in turn suggests that rating agencies
view the insolvency put option as relevant. Third, the evidence that capital flows out of insurers
following good performance suggests that insurance groups are concerned about capital being
“stuck” in an insurance company.
It is worth noting that insurance companies provide a useful venue for examining internal
capital markets issues because insurers are required to disclose a summary of their transactions
with other entities in their group each year. Even though the data has shortcomings (to be
discussed below), the insurance data are from many companies in the same industry and therefore
the sample companies have relatively homogenous investment opportunities.
The paper proceeds as follows. In the next section, background information on insurance
groups is provided. Section three provides a simple conceptual framework for thinking about
internal capital market transactions in insurance groups and for motivating the empirical analysis.

6
Section four describes the data and discusses aggregate internal capital market transactions around
the financial crisis. Sections five through seven present the panel data analysis. The final section
summarizes and discusses implications.
2. Background on Insurance Groups
Figure 1 provides an example of an organizational structure for an insurance group.
Insurance companies in the group are in shaded boxes and non-insurance entities are in un-shaded
boxes. In this example, the company is a stock company traded on the New York Stock
Exchange. However, many of the entities in the analysis are not publicly traded.7 Organizational
charts such as the one presented in Figure 1 can be constructed using data reported by insurance
companies to the NAIC starting in 2011, but not in prior years.
Regulation imposes restrictions on the transactions among companies in insurance groups.
For example, state regulators must approve a change in control and the amount of dividends paid
to entities in a holding company system. In addition, regulators must be notified of plans to
engage in material transactions with affiliates and state regulators have the authority to prevent
such transactions from being conducted. In addition, the lead state regulator is responsible for
assessing the overall financial condition of the group and has access to financial information of all
entities in the group.8
As mentioned above, there is limited empirical research on how insurance groups like the
one depicted in Figure 1 move capital across affiliates. Moreover, most of the existing work
focuses on the use of internal reinsurance and most papers focus on property-casualty insurers.
Powell and Sommer (2007) present evidence that the motivations for internal reinsurance
transactions between affiliates within a group of property-liability insurers differs from the
motivations for the purchase of external reinsurance. Powell, et al. (2008) show that the amount
of internal reinsurance coverage provided to an insurer is positively related to that insurer’s return
on assets relative to the return of other insurers in the group, consistent with an efficient allocation
7 See Erhemjamts and Leverty (2010) for an analysis of ownership structure in the life insurance industry,
including mutual holding company structures. Laux and Muermann (2010) provide a theoretical analysis of the
differences between mutual and stock companies. 8 Aspects of (1) corporate law, (2) securities law, (3) tax law, and (4) debtor-creditor law are all pertinent to the
treatment of affiliates under common ownership. See Triantis (2003-2004) for a summary.

7
of capital.9 Fier, et al. (2013) present evidence that internal reinsurance is used by property-
liability insurers to reduce deviations from target capital ratios. Koijen and Yogo (2014b)
provide an analysis of internal reinsurance transactions by life insurers. In contrast, this paper
focuses on internal capital transfers and internal shareholder dividends of life insurers, which
represent a transfer of cash from one entity to another as opposed to an exchange of cash for
services or assets.
Several papers provide evidence that insolvency risk depends on whether an insurer is part
of a group. Gaver and Pottier (2005) show that group information helps to explain A.M. Best
ratings, and Pottier and Sommer (2011) show that group information improves insolvency
predictions models. Zanjani (2010b) compares the insolvency risk of property-casualty insurers
within insurance groups and finds that companies that have greater association with the flagship
company (e.g., by name or through reinsurance arrangements) are more likely to fail than loosely
affiliated companies.10
There have been a number of theoretical papers that examine capital allocation and pricing
for an insurer writing in different lines of business (e.g., Merton and Perold (1993), Phillips,
Cummins and Allen (1998), Myers and Read (2001), Zanjani (2010a, 2012), Ibragimov, Jaffee,
and Walden (2010)). In this literature, the issue is cost allocation of a common resource – capital
– across different activities. An important assumption in these papers is that capital flows freely
across lines of business; consequently, the “physical” allocation of capital across separate legal
entities is not addressed.11 Stated differently, these papers consider one legal entity and how
capital is “allocated” across projects within that entity. In contrast, this paper examines the
physical movement of capital across separate companies that are part of a group of companies.
Some of the tradeoffs that are examined here are related to those examined by Ibragimov,
Jaffee, and Walden (2013), who provide an explanation for why mono-line insurance companies
exist. In their model, the decision of how much capital to hold and the decision to be a mono-line
9Berry-Stolzle and Liebenberg (2012) extend Powell, et al. (2008) by considering how group characteristics,
such as size and the parent’s organizational form, influence the relation between premiums written and internal
capital market flows. 10 At first glance, this result might seem surprising. As Zanjani (2010b) explains: if the flagship group of
companies is doing well, then the group will not let a loosely affiliated entity in the group fail in fear of the
repercussions to the reputation of the flagship. On the other hand, when the flagship operation is failing, the
loosely affiliated entities often are spun off and survive. 11 Phillips, Cummins, and Allen (1998) also consider insurance groups and note that the option to allow an
affiliate to default will lower the price of insurance for groups relative to a single entity that sells the same
amounts and types of insurance.

8
or a multiline company are endogenous. Their multiline company is organized as a single entity,
which implies that its capital is available to cover all of the lines of business that it sells. The
advantage of a multiline company therefore is the diversification of risk and the resulting
efficiency in the use of capital. The advantage of a mono-line company is that its performance is
“walled off” and therefore cannot affect the other lines of business. In the framework presented
here, the results of one insurance company in a group can be walled off from the other entities in
the group, but the other entities have the option to recapitalize poorly performing insurers. Also, I
take the organizational structure of a firm as given and focus on the movement of capital among
the entities within the group.12
3. Conceptual Framework
3.1 Model with Constrained Capital
I use a simple model to clarify the assumptions and logic that motivate the empirical
analysis. There are two entities in the group, a life insurer and a non-insurance entity, which can
be thought of as a holding company. The group is managed to maximize the value of the group.
The life insurer has a realization of capital equal to CL and the non-insurance entity has a
realization of capital equal to CN. The question is how to allocate the fixed amount of capital CL +
CN between the two entities.13 External capital that was previously raised is exogenous to the
model and is included in CL + CN, which is assumed to be positive. Thus, the only decision is the
amount of capital that is transferred from the non-insurance entity to the life insurer, which is
denoted by T. Positive values of T indicate a flow of capital to the insurer and negative values
indicate a flow of capital out of the insurer.
I assume that the tax and agency costs associated with holding capital internally is the
same for each of the entities, and therefore these costs would influence the total amount of capital,
but not the allocation across the two entities. Insurance regulation restricts the flow of capital out
of the insurer under some circumstances.14 This is modeled by assuming that assets cannot be
12 See Kahn and Winton (2004) for an explanation of why groups of separate companies are formed as opposed
to having one larger entity. 13 The model does not distinguish economic capital from reported statutory capital. Empirically, statutory
accounting numbers are used. 14 See NAIC Model Rule 440, Insurance Holding Company System Regulatory Act, 2011.

9
transferred out of an insolvent insurer, i.e., T ≥ 0 if CL ≤ 0. Other than this restriction, funds can
flow freely to and from the insurance company.
The payoff to the life insurer consists of three components. First, there is the capital
realized assuming unlimited liability, CL, plus the transfer from the non-insurance entity, T.
Second, there is the payoff on the default option arising from limited liability, Max[0, -(CL + T)].
Third, there is the firm’s franchise value, which is the value of the firm over and above the firm’s
tangible assets (financial capital in this model). Franchise value is the present value of expected
rents on future business. I assume franchise value is a function of the amount of capital in the
insurer (CL+T) and a parameter f indicating other factors that affect franchise value, F(CL + T,f).
Franchise value depends on capital because the expected rents and the uncertainty associated with
receiving those rents depend on the likelihood that the insurer will pay its future liabilities, which
in turn depends on the insurer’s capital. Summing the three components gives the value of the life
insurance entity:
CL + T + Max[0, -(CL + T)] + F(CL + T , f),
where F( , ) is zero if CL + T < 0, consistent with a loss of franchise value if the insurer is
insolvent. Let F1 (F2) be the derivative with respect to the first (second) argument, F11 (F22) is the
second derivative with respect to the first (second) argument, and F12 is the second cross
derivative. I assume F1 and F2 are positive, F11 is negative, and F12 is positive.
The non-insurance entity has a payoff that is equal to the realization of its financial capital
less the capital transfer, CN - T, plus the additional value it can create by allocating that capital to
other projects, which is a function of its financial capital and a productivity parameter g: G(CN–
T,g), where G has the same properties as F. Adding the payoff from the non-insurance entity to
the payoff from the insurance entity gives the total payoff to the group, P:
P = CL + T + Max[0, - (CL + T)] + F(CL + T , f) + CN – T + G(CN – T , g).
The group’s objective is to choose T to maximize P.
It will never be optimal for the group to default on the insurer’s liabilities (CL + T < 0) and
simultaneously make a capital contribution to the insurer (T > 0). This is because the group
would be using some of its capital to pay off insurance liabilities when those payments do not
keep the insurer from being insolvent and that capital could create value if invested in other

10
projects. Thus, if CL < 0, then either T* = 0 or T* > -CL, where the star indicates the optimal
value.
Assuming an interior solution, the first order condition is F1( , ) = G1( , ), which states that
capital will be contributed until the marginal benefit from increasing the insurer’s franchise value
equals the marginal cost from decreasing the opportunity to deploy the capital elsewhere in the
group. Intuitively, the group allocates capital across its projects until the marginal value created is
equal across the projects. Comparative static analysis indicates that
(1) dT*/dCL = - F11 / (F11 + G11) < 0,
which implies that all else equal the capital contribution declines as the realization of insurer
capital increases. Intuitively, a decrease in insurer capital (CL), e.g., a drop in net income or a
decrease in unrealized capital gains, causes the marginal return on franchise value to increase,
which induces the group to provide more capital to the insurer. The relationship between the
optimal capital transfer (T*) and the insurer’s capital realization (CL) is illustrated in Figure 2.
Comparative statics with respect to the productivity parameter f yields
(2) dT*/df = - F12 / (F11 + G11) > 0,
which implies that all else equal the capital contribution increases with the productivity parameter.
3.2 Unconstrained Capital
It is useful to consider, as a benchmark case, the allocation of capital within the group in
the absence of capital constraints. Intuitively, without capital constraints, each entity in the group
would obtain capital until the marginal benefit equala the marginal cost of capital. In this model,
where there is no time value of money and no risk, the marginal cost of a dollar of capital is
simply one dollar. Also, if capital is unconstrained, an increase in capital transferred to the
insurer is not constrained to equal the negative of the capital transferred from the non-insurance
entity. Thus, the first order condition for the insurer would be F1( , ) = 1. Totally differentiating
the first order condition with respect to CL yields
F11(CL +T,f ) [ 1+ (dT/dCL) ] = 0 ,
which implies dT* / dCL = -1. That is, a shock to capital of -$1 would be associated with a
transfer of capital of $1. In this setting (with no market imperfections and unconstrained capital),
if an insurer experiences negative (positive) earnings or a decrease (increase) in the value of
assets, there would be a transfer into (out of) that insurer equal to the amount that was lost

11
(gained). In contrast, in the previous setting where capital within the group was constrained, the
sensitivity of internal capital transfers to an insurer would be negative in sign, but less than one in
magnitude (see equation (1)).
3.2 Empirical Implementation
The empirical analysis is directed toward estimating how internal capital market transfers
to and from life insurers, T*, are related to life insurers’ capital, CL, (see expression (1)). Two
types of internal capital market transfers are examined: internal capital contributions and internal
shareholder dividends. Other internal capital market transactions take place between entities in
insurance groups, with internal reinsurance being an important one. However, I focus on the
transactions that transfer funds from one entity to another, as opposed to transactions involving an
exchange of cash for a service, such as reinsurance. See Koijen and Yogo (2014b) for an analysis
of reinsurance transactions within life insurance groups.
While capital could conceivably be contributed from any entity to any other entity in the
group, explicit capital transfers are likely to go through the holding company.15 Of course, the
flow of internal shareholder dividends has to follow ownership interests within the holding
company system. That is, internal shareholder dividends can be the mechanism used by a
subsidiary life insurer to pay out capital to its parent or the mechanism used by a life insurer to
receive capital from its subsidiaries. Note that both internal capital contributions and internal
shareholder dividends are measured as the amount received by the life insurance subsidiaries.
Consequently, the negative of internal shareholder dividends is the amount of internal shareholder
dividends paid by the life insurer.
Shocks to an insurer’s capital are proxied by the annual change in an insurer’s net income
plus unrealized capital gains (hereafter, performance). The remainder of this section discusses
factors outside of the model that could influence internal capital market transfers and/or the
sensitivity of internal capital transfers to performance.
Capital Constraints and the Financial Crisis. The model takes the capital available within
the entire group as being exogenous. When groups have greater access to capital, they would
have more resources to allocate among the entities in the group, and therefore would be expected
to replenish a higher proportion of an insurer’s lost capital than when they are more capital
15 Unfortunately, as will be discussed in the next section, the data do not identify the parties involved in each
capital transfer; instead I just observe the net amount transferred for each entity over the course of a year.

12
constrained, all else equal. As discussed above, in the extreme case of no capital costs or
constraints, the model suggests that the lost capital of an insurer would be fully replenished. To
the extent that groups were more capital constrained during the financial crisis than other years,
the sensitivity of internal capital transfers to an insurer’s bad performance is expected to be lower
during the financial crisis, all else equal.
On the other hand, time periods for which there are greater capital constraints could have
the opposite effect on the sensitivity of internal capital transfers to an insurer’s good performance
if there are multiple insurers in the group (a situation not considered in the model). Suppose that
the capital market environment constrains a group’s ability to raise capital, but that one insurer in
the group has performed well while another has performed poorly. Then, a greater amount of
capital could be removed from the good performer relative to less constrained periods so that it
could be transferred to the poor performer. Thus, to the extent that groups are more capital
constrained during the financial crisis than other years, the sensitivity of internal capital transfers
to an insurer’s good performance is expected to be higher during the financial crisis, all else equal.
Proxies for Franchise Value. The comparative static prediction regarding the parameter f
(see equation 2) implies that variables that proxy for the relative value created from investing in
the life insurance entity compared to other investment opportunities in the group are expected to
be positively related to the amount of internal capital transferred to an insurer. Three proxies are
used in the empirical analysis for the relative value created from a capital investment in a life
insurance subsidiary: (a) its relative size, (b) its past profitability relative to other life insurers in
the group, and (c) whether it has the same name as the group name.
Relative versus Absolute Performance. As just mentioned, I use an insurer’s performance
relative to other life insurers in the group as a proxy for the productivity of capital, which is
consistent with Powell, et al. (2008). If indeed recent relative financial performance measures
productivity, then one would expect capital transfers to be positively related to recent relative
financial performance (see equation (2)). A potential problem is that recent relative performance
is likely to be positively correlated with absolute performance, a variable that is predicted to be
negatively related to capital transfers (see equation (1)). To the extent that relative performance
captures both capital changes and productivity differences across entities in the group, then the
analysis provides evidence on which effect dominates.

13
4. Data Description
4.1 Affiliate Data
The data come from the annual statements filed by life and accident & health insurance
companies (hereafter, Life Insurers) with the National Association of Insurance Commissioners
(NAIC) from 2006-2011.16 The companies in the sample write a combination of life insurance,
annuities, and accident and health insurance. To reduce the likelihood that insurer decisions are
dictated by regulators, I eliminate companies that are inactive, i.e., those that have been or are
being liquidated, combined or merged with another company, or placed in receivership. In
addition, companies that have negative or zero capital and surplus, or negative or zero assets are
dropped from the analysis.
To illustrate insurers’ internal capital market transaction disclosures (under Schedule Y –
Part 2 – Summary of Insurer’s Transactions with Any Affiliates) and some of their limitations, the
hypothetical disclosures for a fictional insurer called LifeCo1 are presented below. The
disclosures provide a summary of the transactions during the year among all of the affiliates
within the holding company system in which the insurer belongs. In this example, there are five
companies in the group: two life insurance companies, a property and casualty insurer (P&CCo),
and two non-insurance companies (NonInsCo1 and NonInsCo2).
Illustration of a Hypothetical Insurer’s Disclosures Under Schedule Y – Part 2
Reporting Co
Name
Affiliate
Name
Affiliate
NAIC Code
Capital Contr.
Received
Shdr. Div.
Received
LifeCo1 LifeCo1 11111 700,000 -200,000
LifeCo1 LifeCo2 11112 300,000 -100,000
LifeCo1 P&CCo 21111 0 -400,000
LifeCo1 NonInsCo1 -500,000 700,000
LifeCo1 NonInsCo2 -500,000 0
Note that only insurance companies have an Affiliate NAIC code. As a result, I am able to
identify the affiliates that are property and casualty insurers or health insurers as those with an
NAIC code that are not in the life insurer data base. However, I am not able to identify in a
systematic way the type of business of the non-insurance affiliates. Also note that if all of the life
16 Property and casualty companies file a different annual statement, as do insurers whose business is almost all
in the health lines, which includes hospital and medical, comprehensive, major medical, and managed care. The
health lines exclude credit, disability, auto medical, workers compensation, accidental death and
dismemberment, and long term care.

14
insurers in the group reported correctly, the data in Table 1 would be replicated in the data base,
because LifeCo2 would report the identical summary of the internal transactions. Of course, only
one of the observations is used in the analysis.
For the panel data analysis, the data illustrated in the exhibit above provide two
observations, one for each of the life insurance companies. The data indicate the net amount each
company received from (positive numbers) or paid (negative numbers) to other entities in the
group in the form of capital contributions and shareholder dividends over the year, but does not
identify which entities transacted with other entities. For example, in the hypothetical example,
LifeCo1 received $700,000 in capital contributions from other internal entities, but I cannot
identify how much each of the other entities contributed to LifeCo1.
For aggregate level analysis, the disclosures in the exhibit above are collapsed into three
categories by aggregating the amounts for the life insurers, the non-life insurers, and the non-
insurance entities in the group. The following exhibit illustrates how the data in the exhibit above
would be aggregated.
Affiliate Type
Capital Contr.
Received
Shdr. Div.
Received
Life Insurers 1,000,000 -300,000
Non-Life Insurers 0 -400,000
Non-Insurance Entities -1,000,000 700,000
The collapsed data reveal that for this hypothetical group, the life insurers in the group received
capital contributions from the other entities in the group equal to $1.0 million and paid $0.3
million in dividends to other entities.
The data require considerable “cleaning,” which is described in more detail in the
Appendix. There are two primary checks that are performed. First, for groups with multiple life
insurers, each of the life insurers should report the same summary of intra-group transactions. I
therefore check for consistency across the life insurer reports within the same group. If an
insurer’s reported numbers are not consistent with the reports of the majority of the life insurers in
the group, I change the numbers to be consistent with the majority. For groups with one life
insurer, I assume the numbers are correct. For groups that do not have consistency for a majority
of the life insurers in the group, I drop the group from the sample. This process implies that all of

15
the groups with two life insurers that have inconsistencies in their reports are dropped from the
sample.
The second data check is that internal capital market transactions should sum to zero
across all affiliates in the group. The exhibits above illustrate this characteristic: the sum of
capital contributions across all of the affiliates equals zero. If capital contributions or shareholder
dividends do not sum to zero, I attempt to identify the error in the reported data and correct it. If I
cannot identify the error, then I drop the group from the sample.
Table 1 provides an overview of the sample selection process, which starts with over 800
life insurance company reports in each year from 2006-2011. The number of groups initially
considered ranges from 436 to 506 over the sample period. After eliminating groups that either
did not report consistent numbers or that reported numbers for internal capital contributions and
shareholder dividends that did not sum to zero across affiliates, the sample has between 544 and
608 life insurance companies and between 290 and 321 groups over the sample period.
The last column of Table 1 indicates that the number of affiliates per group averages
between 10.7 and 12.9 over the sample period. However, the distribution of the number of
affiliates per group is highly skewed. To illustrate, Panel A of Table 2 presents the frequency
distribution for the number of affiliates per group in 2011. Over 50 percent of the groups have
five or fewer affiliates, while less than 20 percent of the groups have more than 15 affiliates. In
2011, the group with greatest number of affiliates had 187 affiliates. A potential shortcoming is
that the sample selection process disproportionately eliminates groups with a large number of
affiliates, as 19.2 percent of the groups in our sample in 2011 have more than 15 affiliates (see
Table 3); whereas, 37.5 percent of the groups in the initial data have more than 15 affiliates (not
tabulated). As reported later in the paper, I examine whether the empirical results differ between
large versus small groups and find that the main results are the same for the two groups. Panel B
of Table 2 reports the frequency distribution for the number of life insurers in a group in 2011.
The majority of groups (63.8 percent) have only one life insurer, 15.9 percent have two life
insurers, and the remaining 20.3 percent of groups have between three and 12 life insurers.
4.2 Analysis of Aggregate Data
Figure 3a and 3b provide an overview of the net amount of internal capital market
transactions between life insurers, non-life insurers, and non-insurance entities from 2006-2011.
The magnitude of capital contributions received by life insurers (Figure 3a) varies dramatically

16
during the sample period. Life insurers in the sample received more than $16.7 billion of internal
capital contributions in 2008 and over $5.5 billion in 2009, mostly from non-insurance entities
within their groups. Figure 3b, which plots internal shareholder dividends, indicates that the
internal dividends paid by life insurers were substantially lower in 2008 and 2009 relative to the
years before and after the financial crisis.
Figures 3a and 3b indicate that internal capital market transactions are substantial and that
their magnitude varies over time based on the financial condition of insurers. More specifically,
during the financial crisis, when life insurers as a group experienced losses on their investment
portfolios, lower operating income, and higher values of liabilities in economic terms, internal
capital contributions to life insurers increased substantially and internal shareholder dividend
payments decreased substantially.
The evidence in Figure 3a augments that presented in Berry-Stolzle et al. (2014), who
examine (among other issues) insurer capital changes around the financial crisis. Their evidence
indicates that the life industry raised a substantial amount of external capital during the financial
crisis. The evidence here indicates that life insurers received a substantial amount of internal
capital from non-insurance entities during the financial crisis. Unfortunately, neither study
provides a complete picture of how much capital life insurers raised externally during the year nor
how much capital they transferred from pre-existing internal sources. Berry-Stolzle et al.’s
measure of “external capital raised” equals the change in paid-in capital and surplus of all the
insurers in a group, which includes capital transferred from non-insurance entities in the group.
Thus, their definition of “external capital” is capital that was supplied by entities outside of the
insurance industry, not necessarily outside of the holding company system. The measure of
internal capital used in this paper is the capital transferred from one entity in the group to another,
which could include capital that was raised externally during the year, say by the parent company.
To shed some light on the amount of capital raised externally versus transferred among
entities within a group, Table 3 compares the aggregate internal capital contributions received by
life insurance companies to their aggregate change in paid-in capital and surplus, where the latter
equals the total amount of capital raised from both internal and external capital markets in the past
year. Aggregate paid-in capital and surplus is positive and ranges from $1.1 billion to $4.6 billion
in each of the non-crisis years (2006, 2007, 2010, 2011). Also, in each of these years, the
aggregate value of internal capital contributions is negative, indicating that life insurers are paying
out capital to other affiliates. In the crisis years (2008 and 2009), however, aggregate paid-in

17
capital increases substantially to over $18 billion in each year, and as noted above, aggregate
internal capital contributions are positive. The internal capital received accounts for a substantial
share of the total paid-in capital and surplus: 75.1 percent in 2008 and 30.5 percent in 2009.
These percentages represent an upper bound on how much of the capital received by insurers was
internal.
Table 3 also compares the aggregate internal shareholder dividends paid by life insurers in
our sample to their shareholder dividend payments to both internal and external shareholders. The
discussion above highlights that internal shareholder dividends dropped during the crisis for life
insurers in aggregate. The data in Table 3 indicate that total shareholder dividends also drops
during 2008 and 2009. The last column of Table 3, however, indicates that the ratio of internal
dividend payments to total dividend payments declines in 2008 and 2009. This result suggests
that internal dividends are more sensitive to poor performance than external dividends.
Overall, the aggregate data on internal capital market transactions between life insurers
and their affiliates suggest that the affiliates provide capital to life insurers when they experience
reductions in capital from operations, both by making capital contributions and by allowing
insurers to reduce dividend payments.
5. Panel Data Analysis
5.1 Base-Line Regressions
The main focus of the panel analysis is to measure the sensitivity of internal capital
market transactions to life insurers’ performance and capitalization. Thus, equations of the
following form are estimated:
(ICM)it = α + β1 (Performance)it + β2 (Capitalization)it-1 + β3 (Controls)it + κi + λt + εit ,
where ICM equals either internal capital contributions or internal shareholder dividends received,
Performance is a vector of variables measuring the insurer’s performance during year t,
Capitalization is a vector of variables measuring the capital of the insurer at the end of the prior
year (beginning of year t), Controls is a vector of control variables, and κ and λ are fixed firm and
year effects. The standard errors in the linear regression models are calculated allowing for
clustering at the group level.

18
Performance is measured by net income plus unrealized capital gains divided by assets.
Net income summarizes the insurer’s operating performance, including realized capital gains, and
unrealized capital gains measures the investment performance of the insurer’s assets, not
incorporated into net income. I allow the responsiveness of the internal capital market
transactions to performance to depend on whether performance is good or bad by defining
Neg_Perf (Pos_Perf) equal to net income plus unrealized capital gains divided by assets if net
income is negative (positive) and zero otherwise. Using the mean or median value instead of zero
as the break point does not change the results.
The capitalization of an insurer is measured using its prior year end risk-based capital
ratio, RBC. The risk-based capital ratio equals the insurer’s total adjusted capital divided by its
“authorized control level risk based capital,” where the latter variable is a measure of capital that
is “needed” given the insurer’s risk. If this ratio falls below two, then regulatory action is
required. Insurer ratings, which in turn affect consumer demand, are sensitive to risk-based
capital (Koijen and Yogo, 2014b). I utilize capitalization measures that are relative to other firms
in the industry. Specifically, LowRBC equals one if the insurer’s RBC is below the 10th
percentile value for the year and zero otherwise, and HighRBC equals one if the insurer’s RBC is
above the median value for the year and zero otherwise. Finally, I control for firm size by
including the natural logarithm of total assets in the equations, LogAssets.
To reduce the influence of outliers, I winsorize each of the variables at the one and 99
percentile levels by year. Table 4 provides descriptive statistics of the main variables used in the
analysis. While the average value for internal capital contributions and internal shareholder
dividends is small (0.9 and -1.5 percent of assets), there is considerable variation in these
variables across companies and time. The overall standard deviations for the ratios of internal
capital contributions to assets and internal shareholder dividends to assets are 5.1 and 6.0 percent;
the between standard deviations are 3.8 and 4.2 percent (unreported); and the within standard
deviations are 3.8 and 4.6 percent (unreported), respectively. A noteworthy aspect about the
internal capital market variables is that the 25th and 75th percentile values for internal capital
contributions are zero in each year and that the 50th and 90th percentile values for internal
shareholder dividends are zero in each year (not reported in the table). I address this issue after
presenting the base line regressions.
Net Income plus unrealized capital gains to assets (Performance) has an average value of
1.4 percent and a standard deviation of 5.6 percent. The distribution of risk–based capital ratios

19
(RBC) is highly skewed as the mean value is 45.8 and the median value is 9.7. Not reported in
the table, the 10th percentile value is 4.7.
Table 5 presents the base-line panel regressions for the internal capital market variables.
The first column presents the results for internal capital contributions (Cap_Contr). The
coefficients on Neg_Perf and Pos_Perf are negative and statistically significant. However, the
estimated sensitivity to negative performance is over three times larger than the sensitivity to
positive performance. Moreover the difference in coefficients is statistically significant at the
0.10 level, indicating that capital contributions are more sensitive to poor performance than good
performance. When performance is negative, a dollar decline in performance is associated with
$0.26 in additional capital contributions received, on average. In contrast, when performance is
positive, a dollar increase in performance is associated with a $0.07 decrease in capital
contributions received, on average. Absent other adjustments in capital, such as raising external
capital (Berry-Stolzle, 2014), selling additional policies (Koijen and Yogo, 2014a), reducing
dividends (see below and Berry-Stolzle, 2014), the results in the first column of Table 5 indicate
that groups replenish capital lost due to poor performance using internal capital transfers at a rate
of about $0.26 per dollar lost, on average.
Capital contributions are also related to the initial capital positions of insurers, as both of
the dichotomous risk-based capital variables have statistically significant coefficients. Holding
other factors constant, the estimates indicate that an insurer with a low risk-based capital ratio
receives 1.23 percent of assets more in internal capital contributions. On the other hand, an
insurer with a high risk-based capital ratio receives 0.61 percent of assets less in internal capital
contributions, all else equal. This is consistent with internal capital contributions being used to
shore-up the capital positions of insurers with low capital. Two of the year effects have
significant coefficients. In years 2008 and 2011, lower capital contributions are provided to life
insurers relative to other years, holding other factors constant.
Column 2 of Table 5 indicates that, in contrast to capital contributions, internal
shareholder dividends received are more sensitive to positive performance than negative
performance. When performance is positive, a dollar increase in performance is associated with a
$0.56 decrease in internal shareholder dividends received (or a $0.56 increase in the dividends
paid). However, when performance is negative, internal shareholder dividends are positively
related to performance and the coefficient is statistically different than the coefficient on the
positive performance variable. The evidence does not indicate that internal shareholder dividends
20
are related to insurers’ risk-based capital ratios. The year fixed effects indicate that, all else equal,
internal shareholder dividends received by life insurers are lower in 2008 and 2011.
A concern with the base-line panel regressions is that many of the insurers never have
some types of internal transactions (e.g., the 25th and 95th percentile values for capital
contributions is zero in each year). A zero value could reflect a choice not to utilize a certain type
of transaction in a particular year, or could reflect a policy of never using a certain type of
transaction. I therefore re-estimate the equations after excluding companies that have a zero value
in all of the years in which they are in the panel. The results are reported in columns 3 and 4 of
Table 5. Not surprisingly, the estimated sensitivities of capital contributions and shareholder
dividends to each of the explanatory variables increases relative to the regressions reported in
columns 1 and 2. Notably, a dollar increase in performance when performance is positive is
associated with a decrease of $0.81in shareholder dividends received (or a $0.81 increase in
dividends paid), on average. Another difference in results between the full versus restricted
samples is that the sensitivity of capital contributions to negative performance is not statistically
different from the sensitivity to positive performance.
I also use logit regression models to examine whether the odds of an insurer receiving
internal capital contributions and the odds that an insurer pays internal shareholder dividends is
related to the performance and capitalization of the insurer. Fixed effects are included in the logit
models, so only companies that had a change over the sample period in the dichotomous
dependent variable are included in the analysis.
The first column of Table 6 presents the results for the odds of having a positive capital
contribution. The overall odds of a positive capital contribution for the sample is 0.57. The
estimated coefficient on Neg_Perf is negative and statistically significant, but the coefficient on
Pos_Perf is not statistically significant. A decrease in Neg_Perf of 0.05 increases the odds of
receiving an internal capital contribution by 33 percent (0.05 x 6.60). The positive and
statistically significant coefficient on the LowRBC variable indicates that an RBC ratio in the
lowest decile increases the odds of a positive internal capital contribution by 59 percent.
The second column gives the results of a fixed effects logit regression for the odds of
internal dividends being negative, i.e., the odds of paying internal dividends. Note that the
coefficient estimates are expected to be opposite in sign of the previous logit equation, where the
odds of receiving capital contributions was examined. As predicted, the coefficient on Pos_Perf is
21
positive and statistically significant. An increase in net income to assets of 0.05, when net income
is positive, is associated with an increase of 52.8 percent (0.05 x 10.55) in the odds of an insurer
paying internal shareholder dividends. In contrast to the regression analysis, the coefficients on
the low and high RBC indicator variables are statistically significant. An RBC ratio above the
median (High_RBC=1) is estimated to increase the odds of paying internal dividends by 102
percent, and an RBC ratio below the 10th percentile is estimated to decrease the odds of paying
internal dividends by 74 percent.
To summarize the base-line regression and logit analysis, (1) the likelihood that life
insurers receive internal capital transfers and amount of internal capital contributions received by
life insurers increases (a) with poor performance and (b) if insurers have low initial risk-based
capital ratios, and (2) the likelihood of paying internal dividends and amount of internal dividends
paid increases with good performance.
5.2 Do Sensitivities Change during the Financial Crisis?
The systematic drop in asset values and the disruptions in capital markets during the
financial crisis could have imposed additional capital constraints on financial holding company
systems. If so, the amount of capital that was available to transfer to poorly performing entities
would have been more constrained than in other periods, in which case, the sensitivity of internal
capital contributions to poor performance would be lower during the financial crisis. On the other
hand, capital constraints could lead to a higher sensitivity of capital transfers to good
performance. The idea is that if capital is more constrained, then the holding company system
could take more capital than normal out of the entities that have performed relatively well. To
investigate these hypothesis, I include in the regression analysis interactions between the
performance variables and a financial crisis dummy variable (FC), which takes the value of one in
years 2008 and 2009, and zero otherwise.
The results are presented in Table 7 for the whole sample (columns 1 and 2) and the
restricted sample of life insurers that have at least one year of non-zero capital contributions
(column 3) or dividends (column 4). For internal capital contributions, the coefficients on the
financial crisis interaction variables are not statistically significant, indicating that the sensitivity
of internal capital contributions to performance was not different during the financial crisis than in
other years. However, for internal shareholder dividends, the negative coefficient on the variable

22
that interacts positive performance with the financial crisis dummy variable is statistically and
economically significant. The results suggest that for the whole sample an increase of a dollar in
performance is associated with a $0.38 increase in internal dividends paid during the non-crisis
period, but an increase of $0.83 during the financial crisis. One interpretation of these results is
that insurance holding company systems were constrained during the financial crisis, but relaxed
the constraint to some extent by increasing the internal dividends paid by the insurers in the group
that had relatively good performance during the crisis.17
6. Insurer Subsidiary Characteristics
All else equal, the amount of internal capital transferred to an insurance subsidiary should
increase with the marginal value of the capital investment. In this section, I examine three
characteristics of insurers that potentially proxy for the relative value of one insurance subsidiary
versus another insurance subsidiary in the same group. Consequently, for this analysis, I only
include groups with two or more life insurers. The three proxy variables are relative operating
performance, relative size, and whether the subsidiary has a name that is the same or close to the
name of the group to which the insurer belongs.
Regarding the impact of relative operating performance, one might expect that the better
performing subsidiaries would be rewarded with additional capital. On the other hand, the
marginal value of shoring up the capital base of poor relative performers may be greater. Relative
operating performance is measured using the difference between the operating performance of the
insurer minus the average performance of all of the life insurers in the group in the prior year (see,
e.g., Powell et al (2008). Operating performance is measured using operating income before taxes
and policyholder dividends divided by total assets. In addition, I also calculate the operating
performance rank of each insurer in the group and then divide the rank by the number of insurers
17 I also investigated whether the sensitivities of capital contributions and shareholder dividends to performance
depend on the insurer’s capitalization by interacting the performance variables with LowRBC and HighRBC. If
a low RBC ratio is associated with a greater return and a high RBC ratio is associated with a lower return on
capital invested in the insurer, then the magnitude of the sensitivity of capital contributions to poor performance
(net income and unrealized capital gains) should be greater when an insurer has a low RBC ratio, and the
magnitude of the sensitivity of shareholder dividends to positive performance should be greater when an insurer
has a high RBC ratio. I tried various specifications due to concerns about interacting the RBC variables with
performance along with having the dichotomous RBC variables in the equation would cause collinearity
problems. Regardless of the specification, the results indicate that the coefficients on the interaction variables
were not statistically significant.

23
in the group to obtain an ordinal performance measure that is between zero and one. The
operating performance variables are called Rel_OpInc and Rank_OpInc.
A potential concern is the correlation between the relative operating performance
variables and the absolute performance variables that are included in the regressions. The
correlation coefficients between performance and the two relative operating performance
variables are 0.34 and 0.23.
Relative size is measured by dividing the insurance subsidiary’s total assets by the sum of
the total assets of all of the life insurance subsidiaries in the group and is called Prop_Grp_Assets.
Larger subsidiaries are likely to be more important to the overall franchise value, which would
suggest that they would receive greater capital transfers. On the other hand, smaller subsidiaries
being less diversified may rely more on capital transfers. The mean and standard deviation of
Prop_Grp_Assets are 31 and 35 percent, respectively.
The third insurer characteristic is a dichotomous variable called Common_Name that
takes a value of one if the insurance subsidiary has a name that is either the same or directly
related to the group name. The motivation for this variable is that having a financially distressed
subsidiary with the same name as the group name would likely be associated with greater
reputational cost than if the insurer had an unrelated name. 41.5 percent of the companies in the
sample have a name that is directly related to the group name.
Table 8 presents the results when the three insurer characteristics are included in the fixed
effects regressions for capital contributions and shareholder dividends. The coefficient estimates
on the relative operating income variables are either insignificantly different from zero or
negative. Thus, it appears that the value associated with adding capital to companies that have
performed poorly dominates the effect of allocating capital to companies that have better relative
operating performance. The coefficient estimates on the relative size variable are negatively and
statistically significant in the capital contribution equations, suggesting capital is more likely to be
transferred to smaller insurance subsidiaries than large ones. None of the coefficients on the
common name variable are statistically significant. The coefficient estimates and statistical
significance of the other variables in the model are similar to those reported above.

24
7. Group Characteristics
As reported earlier, there is considerable variation in the number of affiliates within the
groups in the sample. In addition, there is potential concern that the sample selection process
disproportionately eliminated larger groups. I therefore examine whether internal capital market
transactions depend on the size of the group as measured by the number of affiliates in the group.
One possibility is that small groups, those with only a few affiliates, are less likely to have the
diversification and resources to engage in significant internal capital transactions. On the other
hand, internal capital transfers can be conducted with just two entities, and so a large number of
entities are not necessary for an active internal capital market. To explore whether internal capital
market transactions depend on the number of affiliates, I divide the sample in two categories,
depending on whether the average number of affiliates per year in the group is less than 10.18
The two subsamples have similar values for the mean and standard deviation of the
internal capital market variables. The mean of internal capital contributions divided by assets is
0.010 (0.008) for groups with less than 10 (10 or more) affiliates and the standard deviation of
capital contributions is 0.055 (0.046) for groups with less than 10 (10 or more) affiliates. The
corresponding figures for internal shareholder dividends divided by assets are -0.012 (-0.018) and
0.061 (0.058).
To examine whether the sensitivity of the internal capital market transactions to firm
performance and capitalization varies with group size, I separately estimate the panel regressions
for each of the two categories. Table 9 reports the results. While there are some differences in
the estimated coefficients across the two categories, there is also considerable similarity. One
difference is that a significant relationship between internal capital contributions and risk-based
capital ratios only exists for the groups with 10 or more affiliates. On the other hand, the first two
columns indicate that the estimated sensitivities of internal capital contributions to performance
for companies in smaller groups is similar to that for larger groups. And, the last two columns
indicate that the sensitivity of internal dividends to positive performance for companies in smaller
groups is similar to that for larger groups.19 Thus, the risk sharing behavior of insurance holding
company systems is evident in groups with a large number of affiliates and in groups with a
relatively small number of affiliates. This evidence also suggests that the reported results are not
18 I also tried other cutoffs to divide the sample and found similar results. 19 One difference is that the estimated relationship between internal capital contributions and risk based capital
ratios is concentrated in larger groups.

25
likely to be substantially affected by the sample selection process that disproportionately excluded
groups with a large number of affiliates.
8. Summary and Implications
This paper provides a peek inside the internal capital markets of groups of affiliated
companies that include life insurers. From a capital management perspective, it is important for
life insurance companies within a group to be adequately capitalized so that their products and
services are attractive to potential customers. However, placing too much capital in an insurance
company can cause the capital to be “stuck,” which would prevent the group from reallocating
capital to other more productive uses and reduces the value of the default option. Consequently,
groups are expected to shift capital to insurers when they perform poorly and extract capital from
insurers when they do well.
The empirical evidence supports these predictions. Aggregate data indicate that capital
contributions to insurers from non-insurance affiliates increased substantially during the financial
crisis, and internal shareholder dividends paid by life insurers to non-insurance affiliates declined
during the financial crisis, both in absolute amount and relative to total (internal and external)
dividends.
Panel data estimates indicate that on average individual life insurers receive internal
capital contributions of $0.26 for every dollar decrease in performance (net income plus
unrealized capital gains) when performance is negative, and pay internal dividends of $0.56 for
every dollar increase in performance when performance is positive. In addition, internal capital
contributions are higher for insurers with low risk-based capital ratios and lower for insurers with
high risk-based capital ratios. Overall, the evidence is consistent with the notion that insurance
groups provide a risk sharing mechanism for life insurance companies.
The relatively high sensitivity of internal shareholder dividends to performance when
performance is positive ($0.56 on the dollar) suggests that the “walls” that could potentially cause
capital to be “stuck” in an insurance enterprise are relatively porous when insurers are performing
well. Moreover, this estimated sensitivity increases during the financial crisis, which arguably is
when other entities in the group needed the capital the most and the group was relatively
constrained.

26
The implication of the estimated sensitivities of capital contributions and shareholder
dividends to performance (the 0.26 and 0.56 estimates) for insolvency risk depends on the
probability distribution of performance and other adjustments that insurers make to capital. To
illustrate, suppose for simplicity that insurers operated in accordance with the estimated
sensitivities, i.e., they paid out $0.56 of every dollar of positive performance, and they received
$0.26 for every dollar of negative performance. Further assume that the change in capital over the
course of a year equals net income plus unrealized capital gains plus internal capital contributions
minus internal dividends paid. If performance is normally distributed with a mean of 1.3 percent
and a standard deviation of 5.9 percent (the values for the overall sample from Table 4), then the
mean (median) annual change in the capital to asset ratio would be 0.000 (0.006). Thus, while the
higher payout of internal capital when performance is good relative to the receipt of internal
capital when performance is bad might initially cause concerns, the expected impact on capital is
zero, given the assumptions above.
Finally, the evidence presented here is relevant to the debate over group versus company
level supervision. The results are consistent with insurance groups managing capital and thus
insolvency risk at the group level and also with the capital of non-insurance entities being used in
the management of insolvency risk. Thus, group level capital measurement and supervision of all
of the entities in a holding company system would better mirror how capital is managed in
practice. Taking into account the possibility of capital transfers from other entities in the group
and the diversification benefits of multiple entities in the group would in general lower the
required capital of the entire group. Group level supervision could also help prevent one or more
non-insurance entities in a group from being insufficiently capitalized, which could potentially
cause a financial strain on the insurance entities in the group. On the other hand, group level
capital measurement and group supervision could add complexity, modeling costs, and regulatory
costs.

27
References
Almeida, H., M. Campello, and M. Weisbach, 2004. The Cash Flow Sensitivity of Cash. The Journal of
Finance 59, 1777–1804.
Baronoff, E and T. Sager, 2002, The Relations among Asset Risk, Product Risk, and Capital in the
Life Insurance Industry, Journal of Banking and Finance 26, 1181-1197.
Berger, A., R. DeYoung, M. Flannery, D. Lee, and O. Oztekin, 2008, How Do Large Banking
Organizations Manage Their Capital Ratios? Journal of Financial Services Research 34, 123-
149.
Berry-Stolzle, T., A. Liebenberg, 2012, Determinants of Internal Capital Market Activity in
Insurance Groups, working paper, University of Georgia.
Berry-Stolzle, T., G. Nini, and S. Wende, 2014, External Financing in the Life Insurance Industry:
Evidence from the Financial Crisis, Journal of Risk and Insurance, University of Georgia.
Billet, M. and J. Garfinkel, 2004, Financial Flexibility and the Cost of External Finance for U.S.
Bank Holding Companies, Journal of Money, Credit and Banking 36, 827-852.
Billet, M. and D. Mauer, 2003, Cross Subsidies, External Financing Constraints, and the
Contribution of the Internal Capital Market to Firm Value, Review of Financial Studies 16, 1167-
1201.
Blundell, R. and S. Bond, 1998, Initial Conditions and Moment Restrictions in Dynamic Panel-
Data Models, Journal of Econometrics 87, 115-143.
Campello, M, 2002, Internal Capital Markets in Financial Conglomerates: Evidence from Small
Bank Responses to Monetary Policy, Journal of Finance 57, 2773-2805.
Committee on Financial Services, 2010, Insurance Holding Company Supervision, Hearing before
the Subcommittee on Capital Markets, Insurance, and Government Sponsored Enterprises, US
House of Representatives, March 18.
Cremers, K.J.M., R. Huang, and Z. Sautner, 2011, Internal Capital Markets and Corporate Politics
in a Banking Group, Review of Financial Studies 24, 358-401.
Cummins, J.D. and G. Nini, 2002, Optimal Capital Utilization by Financial Firms: Evidence from
the Property-Liability Insurance Industry, Journal of Financial Services Research 21, 15-53.
DeFrain, Kris, 2012, Insurance Group Supervision, Center for Insurance Policy and Research
Newsletter, April.
de Haas, R. and I. van Lelyveld, 2010, Internal Capital Markets and Lending by Multinational
Bank Subsidiaries, Journal of Financial Intermediation 19, 1-25.

28
Duchin, R. and D. Sosyura, 2013, Divisional Managers and Internal Capital Markets, Journal of
Finance 68, 387-429.
Duchin, R., 2013, Cash Holdings and Corporate Diversification, forthcoming Journal of Finance.
Eling, Martin, 2012, What do we Know about Market Discipline in Insurance, Risk Management
and Insurance Review 15, 185-223.
Epermanis, K and S. Harrington, 2006, Market Discipline in Property/Casualty Insurance:
Evidence from Premium Growth Surrounding Changes in Financial Strength Ratings, Journal of
Money, Credit, and Banking 38, 1515-1544.
Erhemjants, O. and J.T. Leverty, 2010, The Demise of the Mutual Organizational Form: An
Investigation of the U.S. Life Insurance Industry, Journal of Money, Credit, and Banking 42,
1011-1036.
Fier, S., K. McCullough, and J. Carson, 2013, Internal Capital Markets and the Partial Adjustment
of Leverage, Journal of Banking and Finance 37, 1029-1039.
Gaver J. and S. Pottier, 2005, The Role of Holding Company Financial Information in the Insurer-
Rating Process: Evidence from Property-Liability Industry, Journal of Risk and Insurance 72, 77-
103.
Gertner, R., E. Powers, and D. Scharfstein, 2002, Learning about Internal Capital Markets from
Corporate Spinoffs, Journal of Finance 57, 2479-2506.
Gertner, R., D. Scharfstein, and J. Stein, 1994, Internal versus External Capital Markets,
Quarterly Journal of Economics 109, 1211-1230.
Glaser, M. F. Lopez-do-Silanes, and Z. Sautner, 2013, Opening the Black Box: Internal Capital
Markets and Managerial Power, Journal of Finance 68, 1577-1632.
Gropp, R. and F. Heider, 2010, The Determinants of Bank Capital Structure, Review of Finance
14, 587-622.
Harrington, S., 2009, The Financial Crisis, Systemic Risk, and the Future of Insurance Regulation,
Journal of Risk and Insurance 76, 785-819.
Harrington, S. and G. Niehaus, 2003, Capital, Corporate Income Taxes and Catastrophe
Insurance, Journal of Financial Intermediation 12, 365-389.
Holod and J. Peek, 2010, Capital Constraints, Asymmetric Information, and Internal Capital
Markets in Banking: New Evidence, Journal of Money, Credit, and Banking 42, 879-906.
Houston, J and C. James, 1998, Do Bank Internal Capital Markets Promote Lending? Journal of
Banking and Finance 22, 899-918.
Houston, J, C. James, and D. Marcus, 1997, Capital Market Frictions and the Role of Internal
Capital Markets in Banking, Journal of Financial Economics 46, 135-164.

29
Ibramowitz, R., D. Jaffee, and J. Walden, 2010, Pricing and Capital Allocation for Multiline
Insurance Firms, Journal of Risk and Insurance 77, 551-578.
Ibramowitz, R., D. Jaffee, and J. Walden, 2013, Equilibrium with Monoline and Multiline
Insurers, working paper, Harvard University, Department of Economics.
Jensen, M., 1986, Agency Costs of Free Cash Flow, Corporate Finance, and Takeovers, American
Economic Review , 323-329.
Kahn, C. and A. Winton, 2004, Moral Hazard and Optimal Subsidiary Structure for Financial
Institutions, Journal of Finance 59, 2531-2575.
Khanna, N. and S. Tice, 2001, The Bright Side of Internal Capital Markets, Journal of Finance
65, 1489-1528.
Kim, C., D. Mauer, and A. Sherman, The Determinants of Corporate Liquidity: Theory and
Evidence, Journal of Financial and Quantitative Analysis 33, 335-359.
Klein, R., R. Phillips, and W. Shiu, 2002, The capital Structure of Firms subject to Price
Regulation: Evidence from the Insurance Industry, Journal of Financial Services Research 21, 79-
100.
Koijen, R. and M. Yogo, 2014a, The Cost of Financial Frictions for Life Insurers, forthcoming,
American Economic Review.
Koijen, R. and M. Yogo, 2014b, Shadow Insurance, working paper, Federal Reserve Bank of
Minneapolis.
Laux, C. and A. Muermann, 2010, Financing Risk Transfer under Governance Problems: Mutual
versus Stock Insurers, Journal of Financial Intermediation 19, 333-354.
Maksimovic, V. and G. Phillips, 2002, Do Conglomerate Firms Allocate Resources Inefficiently
across Industries? Theories and Evidence, Journal of Finance 57, 721-767.
Maksimovic, V. and G. Phillips, 2007, Conglomerate Firms and Internal Capital Markets, in B.E.
Exkbo, editor, Handbook of Corporate Finance: Empirical Corporate Finance, Elsevier/North-
Holland.
Merton, R. and A. Perold, 1993, Theory of Risk Capital in Financial Firms, Journal of Applied
Corporate Finance 6, 16-32.
Myers, S. and J.A. Read, 2001, Capital Allocation to Insurance Companies, Journal of Risk and
Insurance 68, 545-580.
Niehaus, G. 2013, Life Insurer Balance Sheets: Description and Issues of the Past Decade, 2013,
in Study on the State of the Life Insurance Industry: Implications of Industry Trends, Anne
30
Oberstaedt, ed., Center for Insurance Policy Research, National Association of Insurance
Commissioners.
Opler, T.. L. Pinkowitz, R. Stulz, and R. Williamson, 1999, The Determinants and Implications of
Corporate Cash Holdings, Journal of Financial Economics 52, 3-46.
Phillips, R., D. Cummins, and F. Allen, 1998, Financial Pricing of Insurance in the Multiple-Line
Insurance Company, Journal of Risk and Insurance 65, 597-636.
Pottier, S. and D. Sommer, 2011, Empirical Evidence on the Value of Group –Level Financial
Information, Risk Management and Insurance Review 14, 73-88.
Powell, L. and D. Sommer, 2007, Internal Versus External Capital Markets in the Insurance
Industry: The Role of Reinsurance, Journal of Financial Services Research 31, 173-188.
Powell, L., D. Sommer, and D. Eckles, 2008, The Role of Internal Capital Markets in Financial
Intermediaries: Evidence from Insurer Groups, Journal of Risk and Insurance 75, 439-461.
Scharfstein, D. and J. Stein, 2000, The Dark Side of Internal Capital Markets: Divisional Rent-
seeking and Inefficient Investment, Journal of Finance 55, 2537-2564.
Shin, H. and R. Stulz, 1998, Are Internal Capital Markets Efficient? Quarterly Journal of
Economics 113, 531-552.
Solvency Modernization Initiative Task Force, 2013, The U.S. National State-Based System of
Insurance Financial Regulation and the Solvency Modernization Initiative. NAIC White Paper.
Stein, Jeremy C, 1997, Internal Capital Markets and the Competition for Corporate Resources.
The Journal of Finance 52.1, 111-133.
Triantis, George G., 2003-2004, Organizations as Internal Capital Markets: The Legal Boundaries
of Firms, Collateral, and Trusts in Commercial and Charitable Enterprises, Harvard Law Review
117, 1102-1162.
Zanjani, G., 2010a, An Economic Approach to Capital Allocation, Journal of Risk and Insurance
77, 523-549.
Zanjani, G., 2010b, Bankruptcy in the Core and Periphery of Financial Groups: The Case of the
Property-Casualty Insurance Industry, working paper, Georgia State University.
Zanjani, G. and D. Bauer, 2012, Cost of Risk, Risk Measures, and Capital Allocation, working
paper, Georgia State University.

31
Figure 1
Example of the Organizational Structure of an Insurance Group

32
Figure 2
Illustration of the Optimal Capital Transfer (T*)
as a Function of the Insurer’s Capital Realization (CL)
Capital Transfer (T*)
Insurer Capital
Realization (CL ) 0
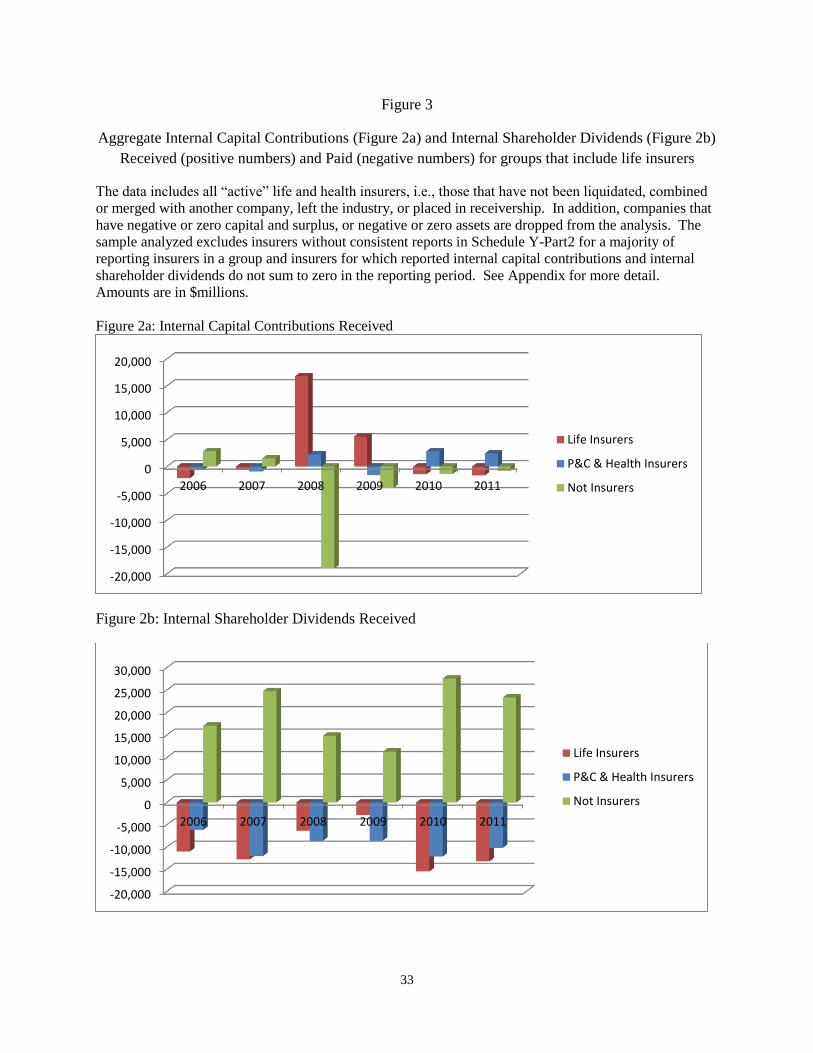
33
Figure 3
Aggregate Internal Capital Contributions (Figure 2a) and Internal Shareholder Dividends (Figure 2b)
Received (positive numbers) and Paid (negative numbers) for groups that include life insurers
The data includes all “active” life and health insurers, i.e., those that have not been liquidated, combined
or merged with another company, left the industry, or placed in receivership. In addition, companies that
have negative or zero capital and surplus, or negative or zero assets are dropped from the analysis. The
sample analyzed excludes insurers without consistent reports in Schedule Y-Part2 for a majority of
reporting insurers in a group and insurers for which reported internal capital contributions and internal
shareholder dividends do not sum to zero in the reporting period. See Appendix for more detail.
Amounts are in $millions.
Figure 2a: Internal Capital Contributions Received
Figure 2b: Internal Shareholder Dividends Received
-20,000
-15,000
-10,000
-5,000
0
5,000
10,000
15,000
20,000
2006 2007 2008 2009 2010 2011
Life Insurers
P&C & Health Insurers
Not Insurers
-20,000
-15,000
-10,000
-5,000
0
5,000
10,000
15,000
20,000
25,000
30,000
2006 2007 2008 2009 2010 2011
Life Insurers
P&C & Health Insurers
Not Insurers

34
Table 1
Sample Description
Data are from annual reports filed by life and accident & health insurers. Initial data includes all
“active” insurers, i.e., those that have not been liquidated, combined or merged with another
company, left the industry, or placed in receivership. In addition, companies that have negative or
zero capital and surplus, or negative or zero assets are dropped from the analysis. The sample
analyzed excludes insurers without consistent reports in Schedule Y-Part2 for a majority of reporting
insurers in a group and insurers for which reported internal capital contributions and internal
shareholder dividends do not sum to zero in the reporting period. See Appendix for more detail.
Initial Data Sample Analyzed
Year
# of Life
Companies
# of
Groups
# of Life
Companies
# of
Groups
# of
Affiliates
Avg # of
Affiliates per group
2006 912 503 593 300 3,356 11.2
2007 907 506 594 316 3,446 10.9
2008 874 481 596 319 3,427 10.7
2009 847 460 599 316 3,736 11.8
2010 822 448 608 321 3,822 11.9
2011 806 436 544 290 3,748 12.9

35
Table 2
Frequency Distribution for the Number of Affiliates (Panel A)
and the Number of Insurers (Panel B) in Groups in 2011
Panel A: Frequency Distribution for the Number of Affiliates in Groups in 2011
Number of Affiliates
In the Group Frequency Percent
2 59 20.3
3 39 13.5
4 28 9.7
5 24 8.3
6 17 5.9
7 14 4.8
8 10 3.5
9 7 2.4
10 10 3.5
11 6 2.1
12 7 2.4
13 3 1.0
14 9 3.1
15 1 0.3
16-25 21 7.2
26-50 20 6.9
51-75 5 1.7
76-100 5 1.7
101-187 5 1.7
Total 290 100.0
Panel B: Frequency Distribution for Number of Life Insurers in a Group in 2011
Number of Life
Insurers
In the Group Frequency Percent
1 185 63.79
2 46 15.86
3 24 8.28
4 14 4.83
5 6 2.07
6 7 2.41
7 5 1.72
10 2 0.69
12 1 0.34
Total 290 100.0

36
Table 3
Comparison of internal capital contributions with the total change in paid-in capital and surplus and
comparison of internal shareholder dividends received with total shareholder dividend payments for
life insurance companies meeting sample requirements described in Table 1.
Year
# of
Companies
Internal
Capital
Contributions
Total Change in
Paid-in Capital
& Surplus
Internal Shdr
Dividends
Received
Total Shdr
Dividends
Received
Internal
Div as %
of Total 2006 593 -2,155 1,761 -10,984 -16,844 65.2%
2007 594 -607 4,609 -12,771 -17,723 72.1%
2008 596 16,761 22,321 -6,315 -12,424 50.8%
2009 599 5,553 18,191 -2,816 -5,884 47.9%
2010 608 -1,425 1,166 -15,473 -20,993 73.7%
2011 544 -1,637 2,919 -13,205 -19,625 67.3%

37
Table 4
Descriptive Statistics for the Variables used in the Panel Data Analysis. Cap_Contr is the value of
internal capital contributions received (negative numbers indicate amount paid) divided by total
assets; Shrd_Div is the value of internal shareholder dividends received (negative numbers indicate
amount paid) divided by total assets; Performance equals net income plus unrealized capital gains
divided by total assets; Neg_Perf (Pos_Perf) equals performance if performance is negative (positive)
and zero otherwise; RBC is the reported total adjusted capital divided by authorized control level risk
based capital. LowRBC equals one if the insurer’s RBC is below the 10th percentile value for the
year and zero otherwise, and HighRBC equals one if the insurer’s RBC is above the median value for
the year and zero otherwise. LogAssets is the natural logarithm of Total Assets. All variables are
winsorized at the one and 99 percentile values by year. The number of observations is 3,330.
Variable Mean Median Std Dev Min Max
Cap_Contr 0.009 0.000 0.051 -0.094 0.485
Shdr_Div -0.015 0.000 0.060 -0.791 0.077
Performance 0.013 0.009 0.059 -0.389 0.275
Neg_Perf -0.011 0.000 0.035 -0.389 0.000
Pos_Perf 0.025 0.009 0.041 0.000 0.275
RBC 45.8 9.7 176.7 1.2 2627.9
LowRBC 0.1 0.0 0.30 0.0 1.0
HighRBC 0.5 1.0 0.5 0.0 1.0
Total Assets ($billion) 6.8 0.2 25.5 0.0003 159
LogAssets 19.318 19.248 2.823 12.797 25.794

38
Table 5
Panel Data Regressions of Internal Capital Market Variables
The dependent variable is either internal capital contributions (Cap_Contr) or internal shareholder
dividends received (Shdr_Div) divided by total assets. Cap_Contr is the value of internal capital
contributions received (paid) divided by total assets; Shrd_Div is the value of internal shareholder
dividends received (paid) divided by total assets; Neg_Perf (Pos_Perf) equals performance if
performance is negative (positive) and zero otherwise, where Performance equals net income plus
unrealized capital gains divided by total assets. LowRBC equals one if the insurer’s RBC is below
the 10th percentile value for the year and zero otherwise, and HighRBC equals one if the insurer’s
RBC is above the median value for the year and zero otherwise. LogAssets is the natural logarithm
of total assets. All variables are winsorized at the one and 99 percentile values by year. The time
period is from 2006-2011. Coefficients are reported with standard errors in parentheses. ***,**,*
indicates statistical significance at the 0.01. 0.05, and 0.10 level.
Dependent Variables
Cap_Contr Shdr_Div Cap_Contr Shdr_Div
Neg_Perf -0.26*** 0.09* -0.33*** 0.16
(0.08) (0.05) (0.11) (0.12)
Pos_Perf -0.07** -0.56*** -0.20*** -0.81***
(0.03) (0.13) (0.07) (0.17)
LowRBC X 100 1.23** 0.23 1.99*** 0.72
(0.49) (0.46) (0.76) (0.96)
HighRBC X 100 -0.61** -0.26 -0.88* -0.31
(0.28) (0.35) (0.46) (0.52)
LogAssets 0.98* 1.56*** 1.69* 2.85***
(0.65) (0.62) (1.14) (1.07)
2007 X 100 0.21 0.01 0.38 -0.11
2008 X 100 -0.56** -1.60*** -1.01*** -2.55***
2009 X 100 -0.19 -0.29 -0.46 -0.48
2010 X 100 -0.28 -0.28 -0.61 -0.37
2011 X 100 -0.55** -0.58* -1.02** -0.88*
Constant -0.18 -0.30** -0.32 -0.56***
Sample All All Cap_Contr ≠ 0
in each yr
Shdr_Divr ≠ 0
in each yr
N 3,330 3,330 1,826 2,022
# of Companies 712 712 384 414
Adj R2 0.30 0.32 0.30 0.34

39
Table 6
Logit Regression of Likelihood of Internal Capital Market Transactions
Dependent Variable is the natural log of the odds of the insurer receiving internal capital
contributions (column 1) and the odds of the insurer paying internal shareholder dividends (column
2). Neg_Perf (Pos_Perf) equals performance if performance is negative (positive) and zero
otherwise, where Performance equals net income plus unrealized capital gains divided by total assets.
LowRBC equals one if the risk based capital ratio is in the below the 10th percentile value for the
year, and zero otherwise. HighRBC equals one if the risk based capital ratio is above the median for
the year, and zero otherwise. LogAssets is the natural logarithm of total assets. Each row gives the
coefficient and the standard error in parentheses for the explanatory variables. Fixed firm and year
effects are included in each regression. The time period is from 2006-2011. ***,**,* indicates
statistical significance at the 0.01. 0.05, and 0.10 level.
Dichotomous Dependent Variable =1 if
Cap_Contr>0 Shdr_Div<0
Overall odds ratio 0.57 0.87
Neg_Perf -6.60*** 2.93
(2.00) (2.98)
Pos_Perf -4.46 10.55***
(3.06) (2.31)
LowRBC X 100 0.59** -0.74**
(0.27) (0.37)
HighRBC X 100 -0.14 1.02***
(0.22) (0.23)
LogAssets X 100 0.63*** 0.29
(0.21) (0.20)
N 1,371 1,378
Number of Companies 281 276
Chi-Sq 53.9 84.7
(p-value) 0.01 0.01

40
Table 7
Panel Data Regressions of Internal Capital Market Variables – Impact of the Financial Crisis
In addition to the variables defined in Table 5, the regressions include Neg_Perf_FC (Pos_Perf_FC)
which equals performance if performance is negative (positive) and zero otherwise times a dummy
variable that takes a value of 1 for the financial crisis period (2008 and 2009) and zero otherwise,
where Performance equals net income plus unrealized capital gains divided by total assets. All
variables are winsorized at the one and 99 percentile values by year. The time period is from 2006-
2011. Coefficients are reported with standard errors in parentheses. ***,**,* indicates statistical
significance at the 0.01. 0.05, and 0.10 level.
Dependent Variables
Cap_Contr Shdr_Div Cap_Contr Shdr_Div
Neg_Perf -0.27** 0.09 -0.32** 0.13
(0.12) (0.06) (0.15) (0.15)
Neg_Perf_FC 0.02 0.02 -0.01 0.11
(0.13 (0.06) (0.16) (0.17)
Pos_Perf -0.06 -0.38*** -0.16** -0.58***
(0.04) (0.09) (0.08) (0.13)
Pos_Perf_FC -0.03 -0.45*** -0.14 -0.51***
(0.04) (0.13) (0.09) (0.15)
LowRBC X 100 1.23*** 0.28 1.99*** 0.68
(0.49) (0.45) (0.75) (0.92)
HighRBC X 100 -0.61** -0.24 -0.90** -0.33
(0.27) (0.34) (0.46) (0.51)
LogAssets 0.98 1.50*** 1.65* 2.71***
(0.65) (0.57) (1.14) (0.84)
2007 X 100 0.21 0.06 0.40 0.00
2008 X 100 -0.48* -0.53* -0.81* -0.99*
2009 X 100 -0.11 0.86** -0.21 1.11**
2010 X 100 -0.28 -0.26 -0.61 -0.35
2011 X 100 -0.55** -0.48* -1.01** -0.73
Constant -0.18 -0.29*** -0.32 -0.54***
Sample All All Cap_Contr ≠ 0
in each yr
Shdr_Divr ≠ 0
in each yr
N 3,330 3,330 1,826 2,022
# of Companies 712 712 384 414
Adj R2 0.30 0.34 0.30 0.36

41
Table 8
Panel Data Regressions with Insurer Subsidiary Characteristics
The dependent variable is either internal capital contributions (Cap_Contr) or internal shareholder
dividends received (Shdr_Div) divided by total assets. Rel_OpInc is the difference between the prior
year’s operating income before policyholder dividends and taxes divided by assets and the average for life
insurers in the group. Rank_OpInc is the rank of the insurer’s operating performance in the group (lowest
equals one) divided by the number of life insurers in the group. Common_Name equals one if the
insurer’s name is closely related to the group name, and zero otherwise. All other variables are defined as
in Tables 5. Fixed firm and year effects are included in each regression. Standard errors are calculated
allowing for clustering at the group level and reported in parentheses. The time period is from 2006-
2011. Only groups with two or more life insurers are included. The number of observations is 2,161 and
the number of companies is 505. ***,**,* indicates statistical significance at the 0.01. 0.05, and 0.10
level.
Dependent Variables
Cap_Contr Cap_Contr Shrd_Div Shdr_Div
Common_Name -0.05 -0.10 0.32 0.37
X 100 (0.99) (0.95) (1.50) (1.50)
Prop_Grp_Assets -0.02* -0.02 0.00 -0.00
(0.01) (0.01) (0.02) (0.02)
Rank_OpIinc 0.00 -0.01
(0.01) (0.01)
Rel_OpInc -0.17*** -0.01
(0.06) (0.08)
Neg_Perf -0.26*** -0.25*** 0.20** 0.20**
(0.09) (0.09) (0.09) (0.09)
Pos_Perf -0.06 -0.03 -0.69*** -0.70***
(0.04) (0.04) (0.20) (0.20)
Low_RBC X 100 1.53** 1.42** -0.12 -0.10
(0.65) (0.66) (0.70) (0.69)
High_RBC X 100 -0.58 -0.48 -0.70 -0.72
(0.36) (0.36) (0.50) (0.50)
Log_Assets X 100 0.31 0.20 1.94*** 1.96***
(0.81) (0.78) (0.77) (0.77)
Constant -0.05 -0.03 -0.38 -0.38
Adj R2 0.31 0.33 0.34 0.34

42
Table 9
Panel Data Regressions of Internal Capital Market Variables:
Impact of the Number of Affiliates in the Group
The dependent variable is either internal capital contributions (Cap_Contr) or internal shareholder
dividends received (Shdr_Div) divided by total assets. Neg_Perf (Pos_Perf) equals performance if
performance is negative (positive) and zero otherwise, where Performance equals net income plus
unrealized capital gains divided by total assets. LowRBC equals one if the risk based capital ratio is
below the 10th percentile value for the year, and zero otherwise. HighRBC equals one if the risk
based capital ratio is above the median for the year, and zero otherwise. LogAssets is the natural
logarithm of total assets. Each row gives the coefficient and the standard error in parentheses for the
explanatory variables. Standard errors are calculated allowing for clustering at the group level. Fixed
firm and year effects are included in each regression. The time period is from 2006-2011. ***,**,*
indicates statistical significance at the 0.01, 0.05, 0.10 level, respectively.
Dependent Variables
Cap_Contr Cap_Contr Shdr_Div Shdr_Div
# of affiliates <10 ≥ 10 <10 ≥ 10
Neg_Perf -0.29*** -0.23** 0.03 0.23**
(0.12) (0.10) (0.05) (0.10)
Pos_Perf -0.06 -0.07 -0.58*** -0.57***
(0.04) (0.05) (0.20) (0.17)
Low_RBC X 100 0.12 2.36*** -0.12 0.68
(0.61) (0.76) (0.67) (0.57)
High_RBC X 100 -0.03 -1.11*** -0.09 -0.49
(0.40) (0.38) (0.52) (0.43)
Log_Assets 1.59** 0.67 0.72 2.11***
(0.82) (0.89) (0.99) (0.79)
2007 X 100 0.23 0.13 0.05 -0.02
2008 X 100 -0.62* -0.55* -2.09*** -1.02**
2009 X 100 -0.35 -0.15 -0.07 -0.50
2010 X 100 -0.26 -0.35 -0.22 -0.33
2011 X 100 -0.24 -0.87*** -1.48 -0.65
Constant -0.27* -0.12 -0.12 -0.43
N 1,597 1,733 1,597 1,733
# of Companies 331 381 331 381
Adj R2 0.34 0.26 0.29 0.35

43
Appendix
Data used in the study are drawn from many of the schedules in the annual report, including data
from Schedule Y- Part 2. The data in this schedule require considerable cleaning and the main
purpose of the appendix is to describe the “cleaning” process and the implications for the sample that
is used. I start with 118,058 year/reporting insurer/affiliate observations reported in Schedule Y by
the active insurers and then take the following steps:
1. Some observations have zero values for all variables and the affiliate is not identified by
either name or federal identification number (fein); these are deleted, leaving 111,208
observations.
2. Some companies aggregate all transactions with an affiliate and others do not. As a result,
some companies have multiple reports of transactions for the same affiliate. I therefore
aggregate data for reported transactions with the same affiliate. After aggregating multiple
reports with the same affiliate, there 102,806 year/reporting insurer/affiliate observations.
3. The data are then divided into two categories: those without an NAIC group code and those
with an NAIC group code.
a. I assign group codes to the observations without one and I check the observations for
errors and inconsistencies. There are initially 2,405 year/reporting insurer/affiliate
observations without a group code. After “cleaning” these data, there are 2,378
year/reporting insurer/affiliate observations.
b.. There are 100,410 year/reporting insurer/affiliate observations with a group code.
These observations are checked to see if reports for the different insurers within the
group are consistent.
(i) There are 32,323 year/reporting insurer/affiliate observations (1,495
year/group observations) that are not consistent within a group and therefore
need to be “cleaned.”
1. If a majority of the reported transactions with an affiliate are consistent,
then the reports of the majority are copied to the cells of the minority,
thus making them all consistent. There are 9,390 year/reporting-
insurer/affiliate observations in this category.
44
These observations are checked to see if the value of capital contributions
and shareholder dividends sum to zero for each cocode. There are 8,888
year/reporting-insurer/affiliate observations that meet the requirement.
There are 502 observations that do not sum to zero, and are deleted.
2. If a majority of the reports within a group are not consistent, then the
group is omitted from the sample.
(ii) There 68,087 year/reporting insurer/affiliate observations that are consistent
within the group code. These are checked to see if capital contributions and
shareholder dividends of all affiliates within a group sum to zero. There is
one group/year for which this was not the case, which was deleted.
4. Observations from steps 3a, 3b(i)1, and 3b(ii) are combined to create the sample.