managing change and unintended consequences mass ratio, and the secondary disinfectant (i.e., free...
TRANSCRIPT

Managing Change and Unintended Consequences: Lead and Copper Rule Corrosion Control Treatment
Advocacy Communications Conferences Education and Training Science and Technology Sections
M
The Authoritative Resource on Safe Water S
Denver, CO 80235-3098
The Authoritative Resource on Safe Water SM
ii
Table of Contents
Table of Contents.........................................................................................................................................iii Acknowledgements....................................................................................................................................... v Executive Summary ....................................................................................................................................vii
Factors Affecting Corrosion Control Treatment .................................................................................viii Identifying The Potential For Unintended Consequences ...................................................................viii Communicating Change With The State Or Primacy Agency .............................................................. ix
Introduction................................................................................................................................................... 1 Lead And Copper Corrosion And LCR Corrosion Control Treatment......................................................... 3
Key Corrosion Control Parameters ........................................................................................................ 3 Control Of Lead And Copper Corrosion ................................................................................................ 3 What Is Optimum Corrosion Control Treatment?.................................................................................. 4 Additional Reading................................................................................................................................. 4
Managing Change And Mitigating Unintended Consequences .................................................................... 7 When Is It Necessary To Re-Establish Optimum CCT? ........................................................................ 7 Identifying The Potential For Unintended Consequences ...................................................................... 9 Expanded Monitoring And Supplemental Tap Water Testing ............................................................. 10 Evaluating The Impacts Of Change On CCT Effectiveness ................................................................ 15 Summary .............................................................................................................................................. 16 Additional Reading............................................................................................................................... 17
Unintended Consequences Of Change Related To Corrosion Control ....................................................... 19 Source Of Supply Changes................................................................................................................... 19 Treatment Changes............................................................................................................................... 21 Distribution System Operations And Maintenance Changes ............................................................... 27
Additional Reading .............................................................................................................................. 30 Communicating Change With State And Primacy Agencies...................................................................... 31
Appendix 1. Key Corrosion Control Parameters ....................................................................................... 35
References................................................................................................................................................... 37
List of Tables
1 Summary of Unintended Consequences Impacting Lead and Copper Corrosion ................................ 12 2 Summary of Potential Secondary Impacts and Unintended Consequences…… ................................. 13
List of Figures
1 Potential Significance of pH Change on CCT Effectiveness ................................................................ 8 2 Potential Significance of Alkalinity Change on CCT Effectiveness ..................................................... 8 3 CCT Re-Optimization Decision Tree................................................................................................... 11 4 Unintended Consequences Assessment Checklist................................................................................ 14 5 Suggested Plan for Communicating with State and Primacy Agencies Regarding Corrosion Issues.................................................................................................................. 34
iii

iv
Acknowledgements Workgroup
Traci Case, American Water Works Association Research Foundation
David Denig-Chakroff, Madison (Wisconsin) Water Utility
Dixie Fanning, Charleston (South Carolina) Commissioners of Public Works
Mike Hotaling, Newport News (Virginia) Waterworks Ron Hunsinger, East Bay Municipal Utility District
(California) Maggie Rodgers, Cleveland (Ohio) Division of Water Jeff Swertfeger, Greater Cincinnati (Ohio) Water
Works Project Team
Malcolm Pirnie: David Schendel Chris Hill Black and Veatch: Kevin Dixon Expert Workshop
A peer review workshop was held on January 27-28, 2005 in Kansas City, Missouri to solicit feedback on the direction of the document and the suggestions contained herein. The authors also wish to thank the workshop participants for significant contributions to this project. In addition to PAC members, the workshop participants included:
Frank Baumann, Independent Consultant Eric Burneson, USEPA Office of Ground Water and
Drinking Water David Cornwell, Environmental Engineering &
Technology, Inc. Jack Dunn, New York State Department of Health Bruce Dvorak, University of Nebraska Marc Edwards, Virginia Polytechnic Institute and State
University James Epp, Kansas City (Kansas) Board of Public
Utilities Rich Giani, District of Columbia Water and Sewer
Authority Lee Harms, Black & Veatch Jeff Kempic, USEPA Office of Ground Water and
Drinking Water Mary Lapin, Kansas City (Missouri) Water Services
Department Bruce Long, Black & Veatch
Christine Owen, Tampa Bay Water (Florida) Steve Randtke, University of Kansas Steve Reiber, HDR Engineering, Inc. Lin-In Rezania, Minnesota Department of Health Matthew Smith, Philadelphia Water Department Vernon Snoeyink, University of Illinois Scott Summers, University of Colorado Water Utility Council
Julius Ciaccia, Cleveland Division of Water-Chair Dennis Diemer, East Bay Municipal Utility District –
Vice Chair Aurel Arndt, Lehigh County Authority Mel Aust, Hidden Valley Lake Community Services--
NRWA/Liaison Hamlet Barry, Denver Water Joseph Bella, Passaic Valley Water Commission--
AMWA/Representative Walter Bishop, Contra Costa Water District Donald Broussard, Lafayette Utilities System Patrick Cairo, United Water New Jersey Paul Demit, CH2M Hill--PAC/Liaison Michael Dimitriou, ITT Industries - Sanitaire--
MAC/Representative Cindy Forbes, California Department of Health
Services Drinking Water Program Michael Hooker, Onondaga County Water Authority Christine Hoover, Pennsylvania Office of Consumer
Advocate-- PIAF/Liaison Joseph Jacangelo, MWH-- TEC/Liaison Carrie Lewis, Milwaukee Water Works Barry MacBride, City of Winnipeg Susan McCormick, City of Ann Arbor Michael Meadows, Brazos River Authority – Standards
Council / Liaison Rosemary Menard, Water Resources Management
Portland Water Bureau Edward Olson, Medford Water Commission Edward Pokorney, Denver Water Department--
NWRA/Representative David Rager, Greater Cincinnati Water Works David Rexing, Southern Nevada Water Authority Terry Roland, Durham Department of Water
Management –AWWA President-Elect John Sullivan, Boston Water & Sewer Commission Kurt Vause, Anchorage Water & Wastewater Utility AWWA Staff
Greg Kail, Sr. Public Affairs Mgr- Communications / Marketing
Steve Via, Regulatory Engineer
v

Project Funding
Funding for this project was provided by the Water Industry Technical Action Fund (WITAF). WITAF is administered by AWWA and is funded through member dues. WITAF funds information collection and analysis and other activities in support of sound and effective legislation, regulation, and drinking water policies and programs.
vi

Managing Change and Unintended Consequences: Lead and Copper Rule Corrosion Control Treatment
Executive Summary Actions intended to improve water quality can produce serious unintended consequences – especially in the areas of corrosion, stability of existing pipe scales, and aesthetics. Preventing corrosion of water supply infrastructure is an important objective for the drinking water community. This goal is formalized in the Lead and Copper Rule (LCR). Deterioration of home plumbing devices and distribution system materials can have serious consequences including elevated lead and copper levels. In 2004 and 2005 the U.S. Environmental Protection Agency (USEPA) reviewed LCR compliance data and found that 96% of the utilities in the U.S. that serve more than 3,300 people were below the lead action level of 15 ppb. The agency also found that most systems that were above the action level when rule was finalized in the early 1990’s are now below it. This analysis and input provided by experts at a series of workshops organized by USEPA in 2004 indicate that optimized corrosion control is a proven technique for controlling lead levels in drinking water that appears to be generally applicable to most waters. However, in some waters, identifying and maintaining optimized corrosion control can be challenging.
“Optimum” corrosion control treatment requires utilities to strike a careful balance among challenging and often conflicting water quality goals for lead and copper solubility, coagulation and softening, disinfection, disinfection byproducts, aesthetic quality, phosphorus, and other water quality parameters. Simultaneous compliance with competing regulatory requirements and water quality constraints has become even more complex in light of the current and proposed Disinfectant and Disinfection Byproduct Rules, and theories about the possible role of chloramines in lead corrosion control problems. Many utilities have changed from free chlorine to chloramines for secondary disinfection to comply with the Stage 1 Disinfectant and Disinfection Byproducts Rule (Stage 1 DBPR). Many more are likely to consider conversion to chloramines to meet the requirements of the future Stage 2 DBPR. This report is intended to assist water systems understand, anticipate, and avoid unintended consequences of water system operational or source water changes particularly as they might affect corrosion control. This report suggests a general framework designed to help utility managers identify areas of potential conflict between competing water quality objectives -- and key factors that can impact corrosion control treatment conditions. This framework is
vii

applicable to a range of treatment and operational changes, including changes in disinfectants, coagulation chemistry, and water sources. While the state of corrosion science is not perfect and any change can have unexpected results, this document describes a process to anticipate and address undesirable water quality impacts. This framework stresses review of existing data and consideration of potential water quality impacts prior to taking actions that may substantially change corrosion chemistry. Managing treatment transitions proactively can help avoid negative impacts on corrosion control treatment and other water quality objectives. Factors Affecting Corrosion Control Treatment
The water quality factors that have the greatest effect on lead and copper corrosion are pH, alkalinity, and orthophosphate concentration (when used). The effectiveness of corrosion control treatment (CCT) will potentially suffer whenever these critical water quality conditions are not consistent in the system. The degree, to which these factors deviate from target CCT conditions, and the frequency or duration of that deviation, will largely determine whether or not LCR action levels are exceeded. Changes in other parameters, such as temperature, buffer intensity, total dissolved solids (TDS) concentration, dissolved oxygen and other gases, and/or chlorine residual can also impact corrosion. Changes in source of supply, treatment, or distribution practices that impact these parameters have the potential to impact lead and copper concentrations at the consumer’s tap. Other factors, such as natural organic matter (NOM) concentration, the chloride-to-sulfate mass ratio, and the secondary disinfectant (i.e., free chlorine vs. chloramines) are suspected to impact corrosion but are less clearly understood.
The LCR requires that large utilities serving more than 50,000 persons maintain optimal CCT. Small and medium utilities must also maintain optimal CCT unless the State deems them to be optimized. Changes in source conditions, treatment practices, and distribution system operation and maintenance (O&M) to achieve non-corrosion-related water quality or supply objectives can result in unintended impacts on existing distribution system scale deposits and other aspects of corrosion control effectiveness. Identifying the Potential for Unintended Consequences
This report includes brief summaries to help utilities identify changes which may have negative impacts on CCT, and provide insight for utilities who are either planning a change or have recently experienced change. This report includes a progression of assessment and diagnostic tools that can be used to evaluate the potential for and impacts of changes which impact corrosion control treatment. These tools include: Unintended consequences assessment checklist,
Expanded baseline monitoring,
Supplemental tap water testing,
Desk-top studies,
Blending analysis,
Treatment simulation, and
Solubility models. If previous changes have already impacted CCT, a program of data collection and analysis is suggested to identify which actions may have led to detrimental effects on water quality. The cost of undertaking these studies is a consideration when planning what evaluations to undertake. Actual costs are very site specific. Considerations include whether there is in-house expertise, how extensively corrosion control issues have been
Finished water pH, alkalinity, and orthophosphate concentration (when used) have the most significant impact on corrosion control effectiveness.
evaluated in the past, the scope of any new sampling, and the number of types of studies that are needed before potential consequences are
viii

adequately assessed given the changes anticipated. The kinds of evaluations described are a routine aspect of drinking water treatment design and as such may already be identified in internal water system operations, design practices, or procurement packages. If not, consideration should be given to their inclusion. A number of examples and case studies are used to illustrate how individual utilities employed these tools in addressing the impacts of changes to treatment, source water, and distribution system operations to minimize negative consequences. Communicating Change with the State or Primacy Agency
This document discusses communicating changes that may impact corrosion with the primacy agency. Identifying potential corrosion impacts prior to discussing a change with the primacy agency, and developing an approach for mitigating those potential consequences is critical to undertaking an effective dialogue. This report outlines this process and steps to consider in preparing for this dialogue.
ix

x

Managing Change and Unintended Consequences: Lead and Copper Rule Corrosion Control Treatment
Introduction Without careful planning and proper implementation, actions intended to improve water quality can produce serious unintended consequences – especially in the areas of corrosion, stability of existing pipe scales, and aesthetics. Corrosion is the gradual deterioration or destruction of metal surfaces by chemical and electrochemical processes. Corrosion of commonly used home plumbing devices and distribution system materials can cause localized increases in corrosion byproducts such as lead and copper. The Lead and Copper Rule (LCR) was promulgated by the United States Environmental Protection Agency (USEPA) to reduce exposure to lead and copper resulting primarily from corrosion of home service lines and plumbing. In general, the LCR requires water systems to implement optimized corrosion control such that lead levels in “first flush” tap samples are reliably below an “action level” set at 0.015 mg/L (15 µg/L). If more than 10 percent of samples exceed 0.015 mg/L, the utility must take additional actions including public education and potentially lead service line replacement. It is important to recognize that the 0.015 mg/L action level for lead is not a health-based standard – it is a statistically-
derived criterion intended to prompt utility actions related to optimizing corrosion control treatment. The LCR tap sample locations and sample collection protocols are intentionally designed to capture worst case conditions by using only first flush samples collected from “high risk” homes with known lead sources. High lead levels recently discovered in homes and schools served by several community water systems highlight the complexity of maintaining compliance with the LCR, in particular, the potential for corrosion-related water quality conditions to change as a result of changes in treatment. Identifying and maintaining “optimum” corrosion control treatment requires striking a balance between challenging and often conflicting water quality goals -- within Safe Drinking Water Act (SDWA) and Clean Water Act (CWA)
Identifying and maintaining “optimum”corrosion control treatment requires striking a careful balance between challenging and often conflicting water quality goalsAMERICAN WATER WORKS ASSOCIATION 1
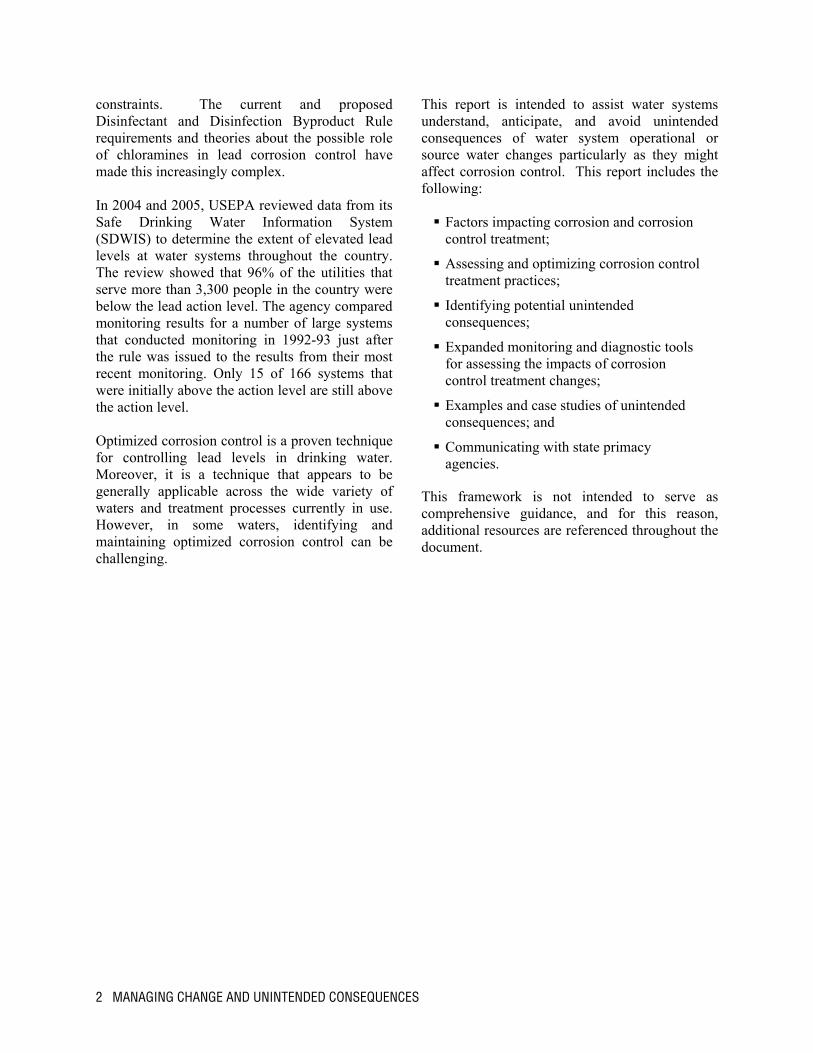
constraints. The current and proposed Disinfectant and Disinfection Byproduct Rule requirements and theories about the possible role of chloramines in lead corrosion control have made this increasingly complex. In 2004 and 2005, USEPA reviewed data from its Safe Drinking Water Information System (SDWIS) to determine the extent of elevated lead levels at water systems throughout the country. The review showed that 96% of the utilities that serve more than 3,300 people in the country were below the lead action level. The agency compared monitoring results for a number of large systems that conducted monitoring in 1992-93 just after the rule was issued to the results from their most recent monitoring. Only 15 of 166 systems that were initially above the action level are still above the action level. Optimized corrosion control is a proven technique for controlling lead levels in drinking water. Moreover, it is a technique that appears to be generally applicable across the wide variety of waters and treatment processes currently in use. However, in some waters, identifying and maintaining optimized corrosion control can be challenging.
This report is intended to assist water systems understand, anticipate, and avoid unintended consequences of water system operational or source water changes particularly as they might affect corrosion control. This report includes the following: Factors impacting corrosion and corrosion control treatment;
Assessing and optimizing corrosion control treatment practices;
Identifying potential unintended consequences;
Expanded monitoring and diagnostic tools for assessing the impacts of corrosion control treatment changes;
Examples and case studies of unintended consequences; and
Communicating with state primacy agencies.
This framework is not intended to serve as comprehensive guidance, and for this reason, additional resources are referenced throughout the document.
2 MANAGING CHANGE AND UNINTENDED CONSEQUENCES

Lead and Copper Corrosion and LCR Corrosion Control Treatment
Key Corrosion Control Parameters
Lead and copper entering drinking water from household plumbing materials such as pipes, lead solder, and faucets containing brass or bronze, can almost always be controlled by altering specific water quality parameters. The water quality parameters that have the greatest effect on lead and copper corrosion are pH, alkalinity or dissolved inorganic carbonate (DIC) concentration, and orthophosphate concentration (if used). Other parameters, such as temperature, buffer intensity, total dissolved solids (TDS) concentration, the concentrations of dissolved oxygen and other gases, and chlorine residual can also be important. There are many other factors, such as NOM concentration, and the chloride-to-sulfate mass ratio that may impact corrosion. Appendix 1 discusses parameters that are known to most directly impact lead and copper corrosion and can be most easily controlled at a typical water treatment plant.
C
Whach
corrosion control practices were typically designed to improve aesthetics, protect hydraulic capacity, limit head loss in the system, and/or reduce long-term pipeline maintenance. These objectives continue to be important to utilities. Optimizing corrosion control treatment (CCT) under the LCR is defined as minimizing dissolution of lead and copper into drinking water without compromising other health-related water quality goals. CCT can be characterized by two general approaches to inhibiting lead and copper dissolution: (1) forming a precipitate in the potable water supply which deposits onto the pipe wall to create a protective coating; and (2) causing the distribution system pipe material and the water supply to interact and form metal complexes on the pipe surface (USEPA, 1992). The latter mechanism is often called “passivation,” where pipe material and existing scale deposits are used to form a barrier film of less soluble metal carbonates or phosphate compounds on the inner pipe surface. This barrier layer of metal complex isolates the lead or copper plumbing materials from the water supply and minimizes dissolution.
Factors which have the greatest effect on lead and copper corrosion are pH, alkalinity, and orthophosphate concentration (when present).
ontrol of Lead and Copper Corrosion
ater quality objectives for "corrosion control" ve changed over time and water treatment has anged to meet these shifting objectives. Earlier
In general, the available corrosion control treatment technologies are listed below: Precipitation, which refers to the adjustment of the pH, alkalinity and/or calcium-carbonate system equilibrium such that calcium carbonate precipitation results. This method of corrosion
AMERICAN WATER WORKS ASSOCIATION 3
control depends upon precipitation as the means of protecting piping systems.
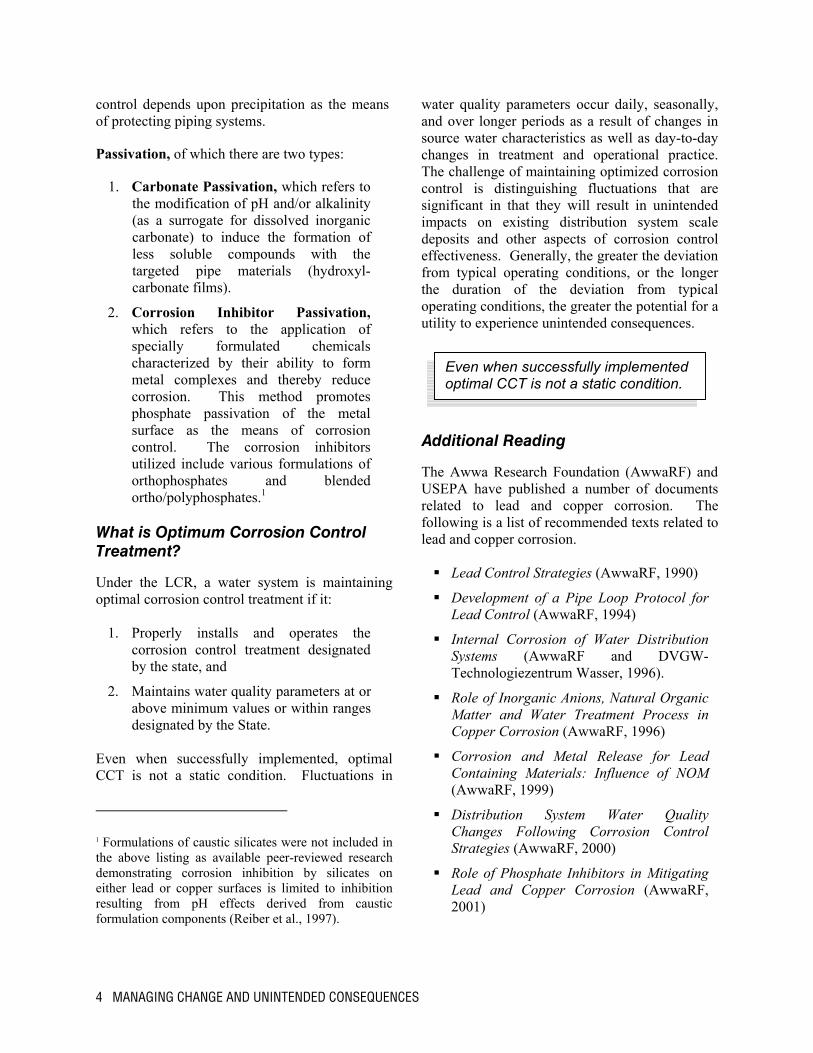
Passivation, of which there are two types:
1. Carbonate Passivation, which refers to the modification of pH and/or alkalinity (as a surrogate for dissolved inorganic carbonate) to induce the formation of less soluble compounds with the targeted pipe materials (hydroxyl-carbonate films).
2. Corrosion Inhibitor Passivation, which refers to the application of specially formulated chemicals characterized by their ability to form metal complexes and thereby reduce corrosion. This method promotes phosphate passivation of the metal surface as the means of corrosion control. The corrosion inhibitors utilized include various formulations of orthophosphates and blended ortho/polyphosphates.1
What is Optimum Corrosion Control Treatment?
Under the LCR, a water system is maintaining optimal corrosion control treatment if it:
1. Properly installs and operates the corrosion control treatment designated by the state, and
2. Maintains water quality parameters at or above minimum values or within ranges designated by the State.
Even when successfully implemented, optimal CCT is not a static condition. Fluctuations in
water quality parameters occur daily, seasonally, and over longer periods as a result of changes in source water characteristics as well as day-to-day changes in treatment and operational practice. The challenge of maintaining optimized corrosion control is distinguishing fluctuations that are significant in that they will result in unintended impacts on existing distribution system scale deposits and other aspects of corrosion control effectiveness. Generally, the greater the deviation from typical operating conditions, or the longer the duration of the deviation from typical operating conditions, the greater the potential for a utility to experience unintended consequences.
1 Formulations of caustic silicates were not included in the above listing as available peer-reviewed research demonstrating corrosion inhibition by silicates on either lead or copper surfaces is limited to inhibition resulting from pH effects derived from caustic formulation components (Reiber et al., 1997).
Ad
ThUSrelfollea
4 MANAGING CHANGE AND UNINTENDED CONSEQUENCES
Even when successfully implemented optimal CCT is not a static condition.
ditional Reading
e Awwa Research Foundation (AwwaRF) and EPA have published a number of documents ated to lead and copper corrosion. The lowing is a list of recommended texts related to d and copper corrosion.
Lead Control Strategies (AwwaRF, 1990)
Development of a Pipe Loop Protocol for Lead Control (AwwaRF, 1994)
Internal Corrosion of Water Distribution Systems (AwwaRF and DVGW-Technologiezentrum Wasser, 1996).
Role of Inorganic Anions, Natural Organic Matter and Water Treatment Process in Copper Corrosion (AwwaRF, 1996)
Corrosion and Metal Release for Lead Containing Materials: Influence of NOM (AwwaRF, 1999)
Distribution System Water Quality Changes Following Corrosion Control Strategies (AwwaRF, 2000)
Role of Phosphate Inhibitors in Mitigating Lead and Copper Corrosion (AwwaRF, 2001)

Post Optimization of Lead and Copper Control Monitoring Strategies (AwwaRF, 2004)
Optimizing Chloramine Treatment – Second Edition (AwwaRF, 2004)
Distribution System Corrosion and the Lead and Copper Rule: An Overview of AwwaRF Research (AwwaRF, 2004)
Final Revised Guidance Manual for Selecting Lead and Copper Control Strategies (EPA 816-R-03-001 March 2003)
AMERICAN WATER WORKS ASSOCIATION 5

6 MANAGING CHANGE AND UNINTENDED CONSEQUENCES

Managing Change and Mitigating Unintended Consequences
Changes in source conditions, treatment practices, and distribution system operation and maintenance (O&M) can produce unintended impacts on existing distribution system pipe-scale deposits, and other aspects of corrosion control effectiveness. Such shifts in CCT may impact tap water concentrations of lead and copper. When is it Necessary to Re-Establish Optimum CCT?
All large water systems (serving 50,000 or more people) plus small and medium systems that exceeded an LCR action level during initial monitoring were required to identify and implement optimum CCT under the LCR. Utilities may find it necessary to re-optimize CCT whenever changes are encountered, or when they are contemplating changes for which previously established corrosion control criteria are no longer applicable. One or more of the following factors could significantly impact the effectiveness of CCT practices: Finished water pH,
Finished water alkalinity,
Phosphate type or concentration (if used),
Secondary disinfectant and/or oxidant strength (which can shift equilibrium and lead solubility – and change the stability or permeability of existing pipe-scale deposits),
Chloride or chloride-to-sulfate ratio (Cl-
:SO42-),
Dissolved oxygen,
Natural organic matter (NOM), and
Temperature. The effectiveness of CCT will potentially suffer when these critical water quality conditions are inconsistent in the system. The degree to which these factors deviate from target CCT conditions, and the frequency or duration of that deviation will largely determine whether or not LCR action levels are exceeded. While the impact of changes in these factors are very site-specific, Figures 1 and 2 illustrate two areas of agreement among the corrosion control experts in recent workshops regarding current LCR implementation. Figure 1 shows ranges of change in finished water pH relative to current pH levels that are typically significant with respect to corrosion control. Likewise, Figure 2 provides a similar review of change in finished water alkalinity relative to current alkalinity.
Even in these generalized figures there are broad bands of conditions where the impact of change may or many not be significant.
AMERICAN WATER WORKS ASSOCIATION 7

0
0.1
0.2
0.3
0.4
0.5
0.6
0.7
0.8
7.0 7.5 8.0 8.5 9.0
Current System pH
Pote
ntia
l Dec
reas
e in
pH
FREQUENTLY SIGNIFICANTFOR CORROSION CONTROL
USUALLY INSIGNIFICANTFOR CORROSION CONTROL
0
2
4
6
8
10
12
14
16
18
20
0 20 40 60 80 100 120
Current System Alkalinity (mg/L as CaCO3)
Pote
ntia
l Dec
reas
e in
Alk
alin
ity (m
g/L
as C
aCO 3
)
FREQUENTLY SIGNIFICANTFOR CORROSION CONTROL
USUALLY INSIGNIFICANTFOR CORROSION CONTROL
If alkalinity < 15 mg/L as CaCO3, system is highly vulnerable to lead problems
8 MANAGING CHANGE AND UNINTENDED CONSEQUENCES
Figure 2: Potential Significance of Alkalinity Change on Corrosion
Control Effectiveness
May or may not be significant fcorrosion control.
or
May or may not be significant fcorrosion control.
or
Figure 1: Potential Significance of pH Change on Corrosion Control Effectiveness

These graphs represent broad generalizations, setting aside the specific impacts of the other factors listed. Moreover, even in these generalized figures, there are broad bands of conditions where the impact of change may or may not be significant. Figure 3 outlines a process for determining if and when if may be necessary to re-establish optimum CCT following a change. Identifying the Potential for Unintended Consequences
Routine daily fluctuations in finished water pH and/or alkalinity and their impact on CCT were likely considered in initial CCT strategy selection and optimization. Nevertheless, understanding normal variability will be an important aspect of evaluating the potential any changes may have for reducing the effectiveness of an ongoing CCT program. Unintended consequences, which potentially can result from changes in source water, treatment, or distribution system O&M practices, are illustrated in Tables 1 and 2. While the listing is lengthy, it is by no means exhaustive. These summaries were developed primarily to help utility managers identify changes which may have negative impacts on CCT and LCR compliance, and can provide insight when either planning a change or determining the probable causes of changes in water quality parameters. Some utilities will implement changes, which are not anticipated to impact CCT, but which nonetheless result in changes in the effectiveness of ongoing CCT and increases in tap water lead and/or copper concentrations. Data collection and analysis will then become necessary to identify detrimental effects on water quality, understand its cause, and identify potential solutions. The following diagnostic approach (see Figure 4) can help a utility that suspects CCT is compromised or LCR action levels are exceeded, as follows: Review existing LCR monitoring data. Subtle trends can be hidden within existing monitoring data. A comparison of 50th and 75th percentile tap water lead concentrations
could reveal corrosion changes not reflected in the reported 90th percentile levels. If such trends or changes are found, it can provide insight into how and when chemistry changes or O&M first began impacting CCT.
Assess optimum corrosion control treatment. If finished water quality conditions are not consistent with CCT, it is possible the corrosion control strategy employed may not be effective. If chemistry targets are not being consistently met, then CCT may also be ineffective.
Assess system corrosion inhibitor. The effectiveness of corrosion inhibitors largely depends on finished water chemistry. Failure to maintain finished water pH in the range determined for optimum CCT may negate any potential benefit of inhibitor use. In addition, the formulation of phosphate corrosion inhibitors (e.g., orthophosphate v. ortho/polyphosphate blends) can impact effectiveness.
Physical factors and changes. Metal filings and scale from replacement of lead service lines, meters, and other in-line devices can result in particulate lead and copper being deposited in piping systems. It is also suspected that partial lead service line replacement can result in galvanic corrosion in which Pb0 species become a sacrificial anode.
Pinhole Leaks. Pinhole leaks in household plumbing represent a serious corrosion problem and can also be an indicator of other corrosion phenomena.
Has there been a change in secondary disinfectant? Secondary disinfectant and/or oxidant strength changes (redox potential) can shift equilibrium and lead solubility – and change the stability or permeability of existing pipe-scale deposits. Accordingly, changes in lead or copper concentrations may result from conversion from free chlorine to chloramines. In addition, chloramines may be more corrosive to brass fixtures than free chlorine.
AMERICAN WATER WORKS ASSOCIATION 9

Other aesthetic issues, such as dirty water, color, taste and odor. Changes in aesthetic parameters, as indicated by monitoring or increases in customer complaints, may indicate conditions are such that CCT has been compromised. For example, customers may notice a change in taste or odor in old or stagnant water. It has been demonstrated that some chemicals added to prevent iron release and red water problems (e.g., polyphosphates) are not effective for control of lead and copper corrosion, particularly in newer homes.
If the diagnostic checklist and assessment of existing water quality data indicates there has been a change resulting in decreased CCT effectiveness, it will likely be necessary to collect supplemental data to determine the extent of the problem. This is the case because data routinely collected under the LCR are to warn if CCT is not being maintained, not to understand the degree to which conditions may have changed.
Expanded Monitoring and Supplemental Tap Water Testing
If change is suspected to have impacted CCT effectiveness, the next evaluation steps are generally the same for most systems: Conduct a desktop evaluation to determine if optimum CCT is still being employed, or to establish new water quality criteria for optimum CCT.
Determine ability to maintain finished water quality within identified target ranges.
Conduct expanded baseline monitoring of CCT parameters and/or supplemental tap water testing (lead and copper).
Required LCR monitoring targets homes with lead service lines and/or containing copper piping with lead solder installed after 1982. When insufficient single- family homes are available to meet this requirement, other buildings, including multi-family dwellings, may be sampled. Lead and copper problems can also occur in new homes and plumbing compared with older homes and plumbing. Cantor, et al., (2000) demonstrated that new copper plumbing may, in fact, be more susceptible to corrosion than older copper plumbing. Homes with new or replaced meters and/or lead service lines may also be more susceptible to lead and copper problems. Meter and line replacement can result in particulate lead and copper in service lines. Partial replacement of lead service lines can result in galvanic corrosion, where lead in the lead service line becomes the sacrificial anode.
Steps for Desktop Corrosion Control Evaluation
Document extent, magnitude and possible causes of corrosion
Develop and assess CCT options Evaluate effectiveness, costs and
feasibility Identify constraints, simultaneous
compliance and potential unintended consequences
Develop/recommend water quality criteria for Optimal CCT
Document findings in Report to Primacy Agency.
Implement approved corrosion control treatment.
It is important to consider these factors and select sampling locations in the distribution system that are representative for these and other conditions that may help diagnose observed tap sample values. When expanding sampling to include conditions that represent homes with new copper plumbing, brass faucets, new or replaced meters, and/or replaced or partially replaced lead service lines choosing new locations where the homes or other building locations are under the utility’s direct control can greatly facilitate sampling.
10 MANAGING CHANGE AND UNINTENDED CONSEQUENCES

Figure 3. CCT Re-Optimization Decision Tree
Re-optimize CCT
S
Addition of a new source?
S
S
Water quality parameters utside ideal range for
optimum CCT?
o
O
O
O
YE
N
S
YENO
CAsse
(s
SS Desktop study / more detailed investigation (see pages – 17) 9
Consideri g a change that may impact CC (see
Table 1)?
n
T
YE
Exceacti
ed LCR
on level?
N
Consider Unintended onsequences ssment Checklistee Figure 4)
O
NSTO
N
YE
P
A
YE
YE
MERICAN WATER WORKS ASSOCIATION 11

Table 1 Summary of Unintended Consequences
Which May Impact Lead and Copper Corrosion
Change Possible changes in corrosion-related water quality parameters
Potential impacts on existing scale Other corrosion-related impacts
Chan
ge in
finish
ed w
ater p
H
Chan
ge in
finish
ed w
ater
alkali
nity
Chan
ge in
Cl:S
O 4
Chan
ge in
finish
ed w
ater
NOM
Ch
ange
in fin
ished
wate
r TD
S Ch
ange
in D
O or
othe
r dis
solve
d gas
conc
entra
tion
Chan
ge in
stab
ility/s
olubil
ity
Chan
ge in
red-
ox po
tentia
l/ ox
idatio
n stat
e
Phys
ical d
isrup
tion
Inter
feren
ce w
/ cor
rosio
n inh
ibitor
effec
tiven
ess
Galva
nic co
rrosio
n
Pinh
ole le
aks
Incre
ased
poten
tial fo
r bio
corro
sion
Intro
ducti
on of
partic
ulate
lead i
nto sy
stem
piping
Source of Supply Changes
Addition of a new source of supply ● ● ● ● ● ● ●
Blending of different source waters ● ● ● ● ● ● ●
Treatment Changes (Change – Divide in Minor and Major Process Changes)
Change in free chlorine dose ● ● ● ● Change from chlorine gas to hypochlorite ● ● ● ●
Addition of other oxidants/disinfectants (O3, KMnO4, ClO2) ● ● ●
Conversion from free chlorine to chloramines ● ● ● ●
Enhanced coagulation for NOM removal ● ● ● ● ●
Change coagulant type or dose ● ● ● ● ● ●
Change in finished water pH ● ● ● ● ● ●
Change in finished water alkalinity ● ● ● ● ● ●
Addition of a corrosion inhibitor ● ● ●
Change in inhibitor type or dose ● ● ●
Addition/discontinuation of softening ● ● ● ● ● ● ● ●
Addition of NF/RO ● ● ● ● ● ● ● ●
Addition of GAC ● ●
Use of bio-filtration ● ● ●
Distribution Operations and Maintenance Activities
Lead service line replacement ● ● ●
Meter and other device replacement ● ●
Change in source water quality ● ● ● ● ● ● ●
Blending of different finished waters ● ● ● ● ●
Flushing ●
Storage tank/reservoir maintenance ●
12 MANAGING CHANGE AND UNINTENDED CONSEQUENCES

Table 2 Summary of Potential Secondary Impacts and Unintended Consequences
Aesthetic impact Other Impacts Distribution system impacts
Red w
ater o
r othe
r colo
r iss
ues
Taste
and o
dor
Biolo
gical
regr
owth
Dirty
wate
r
Incre
ased
Zn i
n wa
stewa
ter di
scha
rges
Incre
ased
phos
phate
loa
ding i
n was
tewate
r dis
char
ges
Chan
ges i
n DBP
sp
eciat
ion
Incre
ased
wate
r age
Chan
ges i
n flow
, dire
ction
, an
d pre
ssur
e
Nitrif
icatio
n
Source of Supply Changes
Change in source water quality ● ● ● ●
Addition of a new source of supply ● ● ● ●
Blending of different source waters ● ● ● ●
Treatment Changes
Change in free chlorine dose Change from chlorine gas to hypochlorite ●
Addition of other oxidants/disinfectants (O3, KMnO4, ClO2) ● ● ●
Conversion from free chlorine to chloramines ● ● ●
Enhanced coagulation for NOM removal ●
Change coagulant type or dose
Change in finished water pH ● ● ●
Change in finished water alkalinity ●
Addition of a corrosion inhibitor ● ● ● ● ●
Change in inhibitor type or dose ● ● ● ●
Addition/discontinuation of softening ● ● ●
Addition of NF/RO ● ●
Addition of granular activated carbon
Use of biofiltration
Distribution Operations and Maintenance Activities
Lead service line replacement ●
Meter and other device replacement
Blending of different finished waters ● ●
Flushing ● ● ● ●
Storage tank/reservoir cleaning ● ● ● ● ● ● System and tank inspection and maintenance ● ● ● ● ● ●
AMERICAN WATER WORKS ASSOCIATION 13
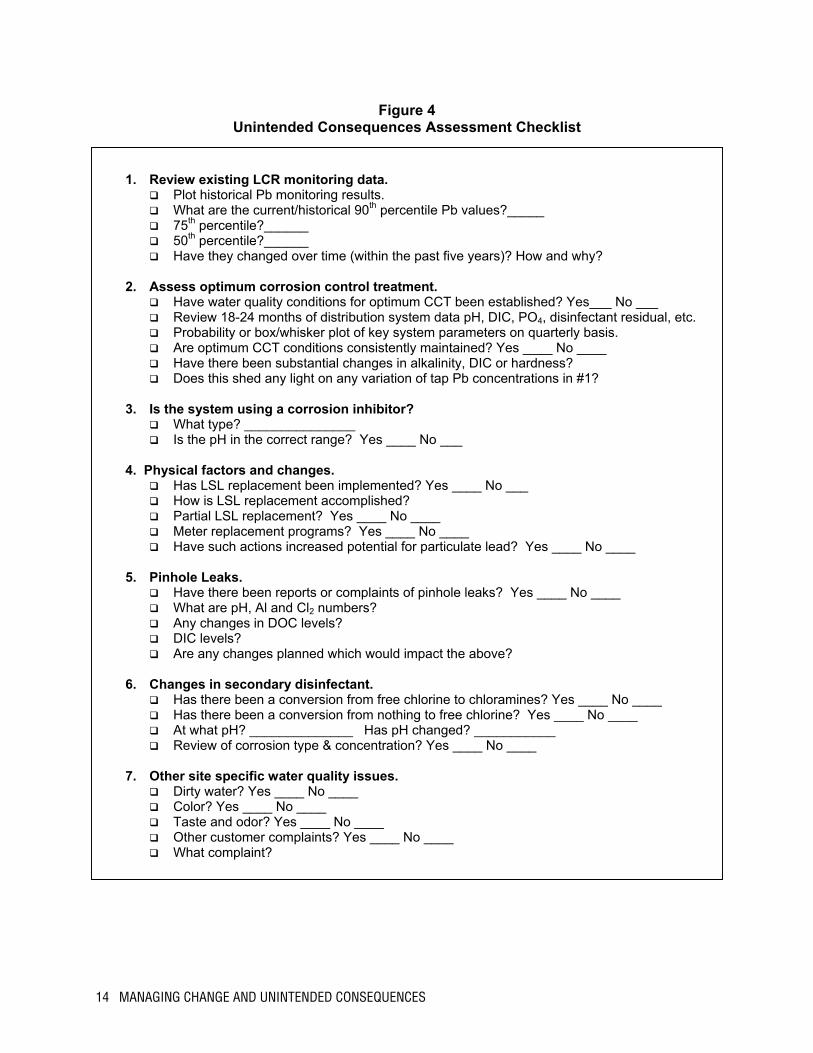
Figure 4 Unintended Consequences Assessment Checklist
1. Review existing LCR monitoring data.
Plot historical Pb monitoring results. What are the current/historical 90th percentile Pb values?_____ 75th percentile?______ 50th percentile?______ Have they changed over time (within the past five years)? How and why?
2. Assess optimum corrosion control treatment.
Have water quality conditions for optimum CCT been established? Yes___ No ___ Review 18-24 months of distribution system data pH, DIC, PO4, disinfectant residual, etc. Probability or box/whisker plot of key system parameters on quarterly basis. Are optimum CCT conditions consistently maintained? Yes ____ No ____ Have there been substantial changes in alkalinity, DIC or hardness? Does this shed any light on any variation of tap Pb concentrations in #1?
3. Is the system using a corrosion inhibitor?
What type? _______________ Is the pH in the correct range? Yes ____ No ___
4. Physical factors and changes.
Has LSL replacement been implemented? Yes ____ No ___ How is LSL replacement accomplished? Partial LSL replacement? Yes ____ No ____ Meter replacement programs? Yes ____ No ____ Have such actions increased potential for particulate lead? Yes ____ No ____
5. Pinhole Leaks.
Have there been reports or complaints of pinhole leaks? Yes ____ No ____ What are pH, Al and Cl2 numbers? Any changes in DOC levels? DIC levels? Are any changes planned which would impact the above?
6. Changes in secondary disinfectant.
Has there been a conversion from free chlorine to chloramines? Yes ____ No ____ Has there been a conversion from nothing to free chlorine? Yes ____ No ____ At what pH? ______________ Has pH changed? ___________ Review of corrosion type & concentration? Yes ____ No ____
7. Other site specific water quality issues.
Dirty water? Yes ____ No ____ Color? Yes ____ No ____ Taste and odor? Yes ____ No ____ Other customer complaints? Yes ____ No ____ What complaint?
14 MANAGING CHANGE AND UNINTENDED CONSEQUENCES

Codrthfirsasafoinafesmtakvoplso UnsuavDiimsa
levreinpusupa
2 UClanUSUn20
Evaluating the Impacts of Change on CCT Effectiveness
Once desktop studies have been updated, and baseline monitoring and/or supplemental tap water testing has been conducted, a utility may
Collection of supplemental tap water samples should be carefully reviewed in advance with the primacy agency, in order to distinguish between re-optimization efforts and samples collected for LCR compliance.
mpliance with the LCR is based on the first aw sample (i.e., 1st liter of water flushed from e tap). This is based on the assumption that the st draw sample represents the worst-case mple. Sample collection for supplemental mpling can be done in multiple 1-liter samples, r example, first liter, second liter, third liter, itial temperature change, or based on time (e.g., ter five minutes or in 5-minute intervals). By timating the pipe volume between the water ain and the faucet from which samples are en, it is possible to analyze sub-samples of this lume to gain insight into where in the umbing lead is entering the water (i.e., faucet, lder in home plumbing, lead service line, etc.).
der existing EPA guidance, the collection of pplemental tap water samples must be made ailable to the state or federal primacy agency.2 scussing supplemental data in advance will be portant to appropriately distinguish between mples collected for LCR compliance and action
-o bpr
adEd0
choose to employ other diagnostic tools to evaluate the effectiveness of CCT practices – and the impact of change. Several additional techniques can be used for this purpose. This is not meant to suggest that every one of the diagnostic tools identified below is necessary or appropriate in each case. When employed effectively, however, these tools can provide important insight into how source, treatment and distribution system O&M changes will interact with LCR corrosion control priorities. Available tools include:
Blending Analysis. Blending analysis can make use of either physical batch tests or computational models to determine the impact of blending waters of different character and quality. For many key parameters (hardness, alkalinity, TDS, etc.) this is simply a mass balance of the blended waters. Other parameters, such as pH, cannot be calculated as easily and may require laboratory batch tests or use of computational software.
Solubility Models. Solubility models have considerable value in showing trends in metals release and are useful in examining the mechanisms of passivation and corrosion scale accumulation. However, while such
Be prepared to communicate with customers about supplemental tap sampling for lead and copper.
el comparison, and those efforts designed for ptimization of CCT. Another consideration
taking supplemental samples is the utility’s lic communication policies and how results of plemental sampling will be communicated to ticipants in the study.
SEPA, Memorandum, “Lead and Copper Rule – rification of Requirements for Collecting Samples Calculating Compliance,” November 2004, PA, Memorandum, “Compliance Calculations er the Lead and Copper Rule to Region 1,” May, 4.
modeling efforts may accurately reflect equilibrium conditions, they do not take into account important aspects of kinetics, uneven plumbing surfaces, and particulate metal release. Useful computational software models include CORRODE (AwwaRF, 1997), Rothberg, Tamburini & Winsor (RTW) Modeltm and/or PHREEQCI (United States Geological Survey).
Treatment Simulation. Jar tests may also be warranted when desktop evaluations are insufficient to determine the effect of certain actions on other treatment processes and key corrosion parameters. Treatment simulation models can also be of limited use in making
AMERICAN WATER WORKS ASSOCIATION 15
such predictions, or at least the relative magnitude of water quality trends.
Loop Studies. When prior evaluations indicate a change is likely to have a negative impact on CCT, or there is sufficient concern that conditions in the system may not be accurately reflected by other methods, loop testing using actual piping harvested from the distribution system or customers’ homes may be warranted. Pipe loop studies can yield very useful information on metal release when conducted with proper care; however, such study requires substantial time and resources. Loop studies designed to determine the most effective CCT typically incorporate, to the extent necessary and possible, the following elements:
Use of carefully preserved pipes or pipe segments which reflect the actual distribution system scale conditions.
■
■
■
■
■
Leaching from new materials (copper pipes, brass devices, fixtures): this is important for areas with physical changes where protective scales may not have developed.
Leaching from old lead pipes coupled with new copper pipe. This is important for areas where LSL replacement programs have been implemented.
Effect of different corrosion control strategies.
Key corrosion water quality parameters.
Increased Baseline Analyses. Sometimes a period of more frequent and targeted monitoring in the distribution system may be the only practical method of gathering data on in-situ materials and conditions. Such is the premise behind “partial system tests.” Increased baseline testing in conjunction with other tools outlined above can reduce the uncertainty often associated with less rigorous methods. As discussed previously, careful consideration should be given to understanding how the state will view
diagostic monitoring and what data should be submitted to the state.
Coupon studies. Some utilities have found coupon studies using coupons prepared from preserved pipe sections helpful in maintaining CCT. Traditional coupon studies can yield insight into the relative corrosion rates of various infrastructure materials. However, traditional coupon studies are unlikely to be informative when a utility is evaluating the potential effect of changes on CCT or how to return to optimum CCT conditions.
Summary
Changes in source of supply, treatment practices, and distribution system O&M can compromise optimized CCT conditions and jeopardize LCR compliance if not properly managed. Preventing negative impacts of changes on CCT requires an evaluation of a change before it is implemented. This includes establishing water quality criteria for optimum CCT and evaluating how anticipated changes in finished water quality will impact those criteria. If a change results in finished water quality outside the established criteria, then it will become necessary to re-optimize CCT. Review of readily available information will often be adequate to understand potential impacts of changes on CCT and the potential for those changes to affect LCR compliance. In some cases, a desktop study and baseline monitoring may be inconclusive or there will be system-specific conditions (e.g., unlined cast iron pipe, particulates, changes in secondary disinfectant) that warrant additional study to determine the impact of changes on CCT effectiveness. In such cases the use of blending analysis, treatment simulation, loop studies and increased baseline analysis may be needed to establish optimum water quality and CCT conditions. In instances where CCT has already been compromised, yet the cause of the increase in lead and/or copper corrosion is unknown, increased baseline analysis and supplemental data collection can be useful in identifying the cause.
16 MANAGING CHANGE AND UNINTENDED CONSEQUENCES
The cost of undertaking these studies is a consideration when planning what evaluations to undertake. Actual costs are very site specific. Considerations include whether there is in-house expertise, how extensively corrosion control issues have been evaluated in the past, the scope of any new sampling, and the number of types of studies that are needed before potential consequences are adequately assessed given the changes anticipated. The kinds of evaluations described are a routine aspect of drinking water treatment design and as such may already be identified in internal water system operations, design practices, or procurement packages. If not, consideration should be given to their inclusion. Additional Reading
Lead and Copper Rule Guidance Manual, Vol. II: Corrosion Control Treatment. USEPA, prepared by Malcolm Pirnie, Inc. & Black & Veatch. September 1992.
Internal Corrosion of Water Distribution Systems (AwwaRF and DVGW-Technologiezentrum Wasser, 1996).
A General Framework for Corrosion Control Based on Utility Experience (AwwaRF, 1997.)
Control of Pb & Cu Corrosion By-Products using CORRODE Software (AwwaRF, 1997).
Post Optimization of Lead and Copper Control Monitoring Strategies (AwwaRF, 2004)
AMERICAN WATER WORKS ASSOCIATION 17

18 MANAGING CHANGE AND UNINTENDED CONSEQUENCES

Unintended Consequences of Change Related to Corrosion Control
This section focuses specifically on changes in source, treatment, and distribution system operations and maintenance that can have unintended consequences affecting CCT effectiveness. It includes case studies showing both the impacts of these changes on CCT and LCR compliance, as well as examples of how changes were successfully implemented to minimize any potential negative consequences. Source of Supply Changes
Source water characteristics often have a significant influence on finished water corrosivity. Effective CCT is more easily accomplished with a consistent source of supply and raw water quality or with adequate treatment to address variations in raw water quality. Changes in source water that impact pH and alkalinity will likely impact CCT effectiveness. Changes in source water NOM may also impact CCT. Changes in source water quality most expected to impact CCT effectiveness include:
■
■
■
Addition of a high alkalinity groundwater supply to a system designed for conventional surface water (low alkalinity) treatment.
Addition of a low alkalinity surface water supply in a system using carbonate precipitation for CCT.
Droughts, flooding, or other natural events that result in a significant deviation from baseline pH and alkalinity and NOM.
GrothanseasgenhavsignSurlowHowto vchaaddappplan Chahavwheopebrothatsurfdist
Source of supply changes that impact finished water pH and/or alkalinity are most likely to impact corrosion.
undwater quality is generally more consistent surface water quality and less prone to onal variations. Groundwater sources are also erally “harder” which implies they will likely e higher alkalinity and may require more ificant chemical additions to optimize CCT.
face water supplies are usually softer and have er alkalinity than groundwater sources. ever, surface water supplies are also known
ary seasonally, sometimes considerably. These nges in surface water quality are generally ressed during development of a utility’s roach to CCT and design of the treatment t.
nges in source water quality are expected to e the most significant impact on corrosivity n new sources, for which the treatment and rational scheme were not designed, are ught on-line. For example, there are utilities routinely blend groundwater with their ace water supplies to dilute NOM and reduce ribution system disinfection byproducts
AMERICAN WATER WORKS ASSOCIATION 19
(DBPs). Depending on the blending ratio (groundwater to surface water) and surface water quality, this may cause a significant increase in raw water alkalinity – which is not removed in a conventional surface water treatment plant. When this effect is not addressed through CCT, there is the potential for it to result in increases in corrosivity and tap water lead and copper concentrations. Similar situations can exist when blending groundwaters to manage arsenic concentrations in distributed water. Changes in source water quality that reduce alkalinity can also have impacts on corrosion. Lower alkalinity waters have less buffer capacity
than higher alkalinity waters. In poorly buffered waters, coagulation may cause greater depression of pH and alkalinity, increasing the corrosivity of the water. Lower alkalinity also impacts the calcium carbonate precipitation potential. If the calcium carbonate precipitation potential goes sufficiently negative, the existing carbonate scale, which provides the corrosion control, may begin to dissolve, effectively un-coating distribution piping. Edwards et al. (1994) demonstrated that NOM could influence copper corrosion. Subsequent work by Rehring et al. (1996) identified treatment effects on NOM as an influence on copper
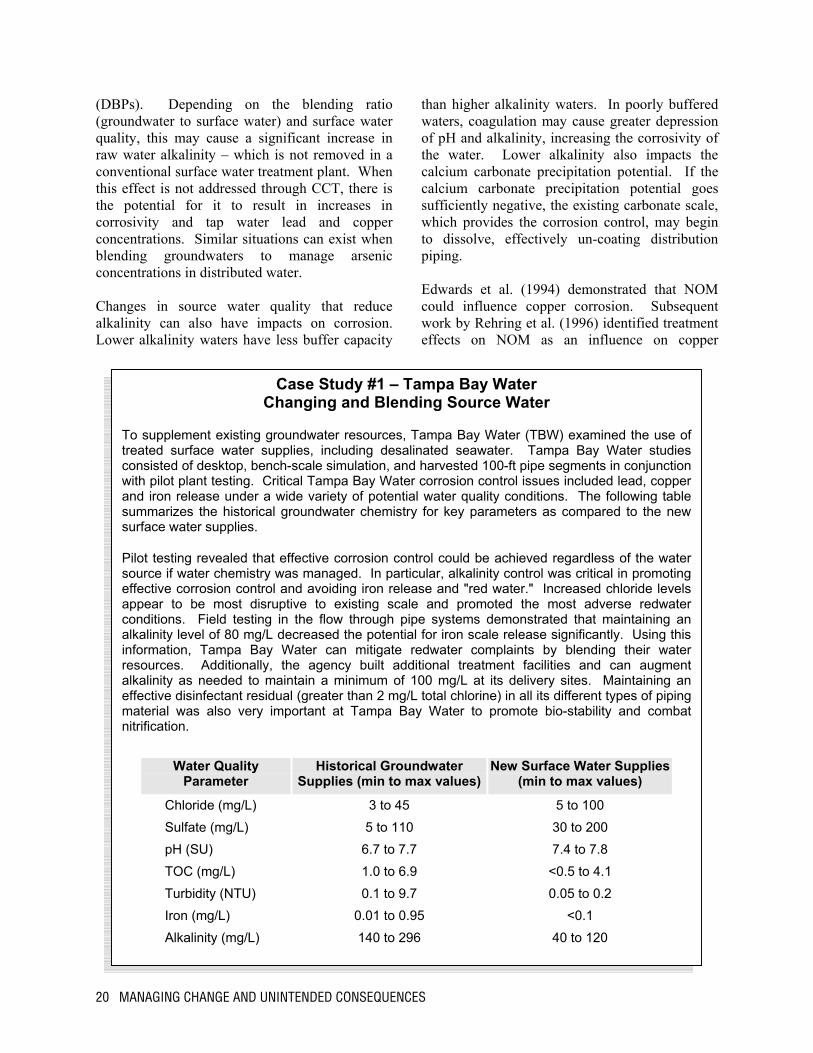
Case Study #1 – Tampa Bay Water Changing and Blending Source Water
To supplement existing groundwater resources, Tampa Bay Water (TBW) examined the use of treated surface water supplies, including desalinated seawater. Tampa Bay Water studies consisted of desktop, bench-scale simulation, and harvested 100-ft pipe segments in conjunction with pilot plant testing. Critical Tampa Bay Water corrosion control issues included lead, copper and iron release under a wide variety of potential water quality conditions. The following table summarizes the historical groundwater chemistry for key parameters as compared to the new surface water supplies.
Pilot testing revealed that effective corrosion control could be achieved regardless of the water source if water chemistry was managed. In particular, alkalinity control was critical in promoting effective corrosion control and avoiding iron release and "red water." Increased chloride levels appear to be most disruptive to existing scale and promoted the most adverse redwater conditions. Field testing in the flow through pipe systems demonstrated that maintaining an alkalinity level of 80 mg/L decreased the potential for iron scale release significantly. Using this information, Tampa Bay Water can mitigate redwater complaints by blending their water resources. Additionally, the agency built additional treatment facilities and can augment alkalinity as needed to maintain a minimum of 100 mg/L at its delivery sites. Maintaining an effective disinfectant residual (greater than 2 mg/L total chlorine) in all its different types of piping material was also very important at Tampa Bay Water to promote bio-stability and combat nitrification.
Water Quality
Parameter Historical Groundwater
Supplies (min to max values)New Surface Water Supplies
(min to max values)
Chloride (mg/L) 3 to 45 5 to 100 Sulfate (mg/L) 5 to 110 30 to 200 pH (SU) 6.7 to 7.7 7.4 to 7.8 TOC (mg/L) 1.0 to 6.9 <0.5 to 4.1 Turbidity (NTU) 0.1 to 9.7 0.05 to 0.2 Iron (mg/L) 0.01 to 0.95 <0.1 Alkalinity (mg/L) 140 to 296 40 to 120
20 MANAGING CHANGE AND UNINTENDED CONSEQUENCES
leaching. Schock et al. (1996) reported varied impacts of NOM on lead and copper solubility. In some instances, NOM was observed to form soluble organic complexes with lead resulting in an increase in dissolved lead concentrations. In other cases, NOM adsorbed or otherwise adhered to the inside of lead pipes, decreasing lead solubility. Similar results have been reported for copper. Ferguson et al. (1996) reported that copper can form complexes with organic material resulting in lower dissolved copper concentrations. Others have noted that NOM increases copper corrosion, particularly following when water stagnates over night (Broo et al., 1999). While the interdependency of NOM and lead solubility is not well understood, it seems clear that any changes which impact finished water NOM concentrations may impact lead and copper concentrations. The extent of the impacts of NOM on corrosion is system-specific and dependent upon the characteristics of the NOM itself. There is the potential for normal seasonal variation in source water quality to impact corrosion. Seasonal variations in source water quality, including temperature, may require seasonal adjustment of CCT parameters and are an aspect of developing a successful CCT program. However, there may also be unplanned changes in source water quality that can have negative impacts on CCT. Droughts or flooding can have significant impacts on source water TDS, alkalinity, and other parameters. Consequently, it may be necessary to adjust CCT during such periods to prevent or minimize corrosion impacts in the distribution system. Treatment Changes
Changes in water treatment practices can have negative impacts on CCT and LCR compliance. This section focuses on the unintended consequences related to changes in treatment, including: ■
■
■
■
■
■
■
■
■
■
Changes in oxidants or disinfectants,
Enhanced or modified coagulation,
Modified CCT, and
Major unit process modifications. Changes in Oxidants/Disinfectants
Oxidants are used in water treatment to accomplish a variety of objectives, most notably disinfection. Free chlorine is the most common oxidant chemical employed in water treatment, although the use of ozone, chloramines, chlorine dioxide, and potassium permanganate is also very common. Alternatives to primary and secondary disinfection using free chlorine have become increasingly common since the 1980s to combat the formation of DBPs, and for other goals. Oxidant/disinfectant changes which water utilities commonly make use of include:
Modified free chlorine dosages or application point. Increases or decreases in chlorine dosage and/or relocation of chlorine application points, including booster chlorination.
Switch from chlorine gas to sodium hypochlorite because of health and safety concerns and risk management requirements related to the storage of chlorine gas.
Conversion from free chlorine to chloramines for secondary disinfection to avoid further formation of DBPs within the distribution system.
Ozonation to inactivate chlorine-resistant pathogens such as Cryptosporidium, conversion of NOM, taste and odor control, to reduce formation of chlorinated DBPs, or to promote biological treatment.
Chlorine dioxide to mitigate DBP formation, combat taste and odor, or replace free chlorine.
Ultraviolet disinfection to inactivate target pathogens, such as Cryptosporidium.
Unintended consequences resulting from changes in oxidants/disinfectants are summarized in Tables 1 and 2 and are discussed below. Free chlorine residuals can impact the metal oxidation rates and the nature of scales that form on the interior of distribution system piping. Chlorine addition to soft waters has been observed to both increase and decrease corrosion rates for
AMERICAN WATER WORKS ASSOCIATION 21
copper (Sprague and Edwards, 2000). Several researchers (Edwards, 2004; Schock, 1999) report that elemental chlorine promotes formation of lead oxides that contribute to creation of passivation layers inside distribution system piping. Modifications to free chlorine dosages and/or application points have the potential to alter metal oxidation rates and the nature of existing scale deposits, which has implications for water utilities that practice carbonate passivation for corrosion control. U.S. water utilities have been employing chloramines to maintain a disinfectant residual in their distribution systems (secondary disinfection) since the early 1900s. Chloramines are more stable and persist longer in the distribution system, and many consumers prefer the taste and smell of chloramines to chlorine. Some utilities have reported that chloramination was the only way to maintain secondary disinfection while controlling biological regrowth in their systems. The primary reason utilities are considering chloramines today is the associated reduction in DBPs – specifically trihalomethanes (THMs) and haloacetic acids (HAAs). Many utilities have changed from free chlorine to chloramines for secondary disinfection to comply with the Stage 1 DBPR. More are considering conversion to chloramines to meet the requirements of the proposed Stage 2 DBPR. Chloramines are considered by many utilities to be de facto best available technology (BAT) for systems that cannot meet proposed new maximum contaminant levels for HAAs and THMs using free chlorine. In fact, the proposed Stage 2 DBPR identifies hydraulic management (managing flow patterns to reduce water age) and chloramination as best available technologies for consecutive systems needing to comply with the rule. Changes from free chlorine to chloramines for secondary disinfection can, under certain conditions, also result in an increase in lead and/or copper solubility. Reiber (2004) reported that a change in disinfectant could impact the redox potential of the service line surface. The redox potential determines the primary mineral species of metal that will be present. Changes in redox potential that cause a shift in mineral species from
a less soluble to a more soluble species, from Pb4+ to Pb2+ for example, can increase lead solubility. The use of ozonation and chlorine dioxide as alternatives to free chlorine has increased as water quality objectives for DBPs and taste/odor control have become more stringent. As with other oxidant changes, such changes may alter the nature of existing passivation scales and associated corrosion rates for lead and copper. Enhanced or Modified Coagulation
Coagulation is primarily used for the removal of particulate and microbial contaminants, although NOM removal is also an important benefit of coagulation. In fact, as drinking water DBP regulations become more stringent, removal of organic matter and other precursor materials by coagulation is of even greater importance. Unintended consequences resulting from changes in coagulation practices impacting CCT are summarized in Tables 1 and 2. This section discusses several of the more common consequences, including changes in finished water pH, changes in the finished water Cl-:SO4
2-, and reduction in other contaminants (e.g., NOM). Utilities are required by the Stage 1 DBPR to practice enhanced coagulation, with limited exceptions. Enhanced coagulation generally involves a reduction in pH, increased coagulant dose, and/or change in coagulant type to improve NOM removal and reduce subsequent DBP formation. The reduction in pH may be accompanied by a reduction in THM concentrations; however, reductions in pH have also been shown to cause increases in HAA concentrations. Reduction in pH may also reduce calcium carbonate precipitation potential and increase lead and copper solubility. The hydrolysis reactions that occur when metal salt coagulants (alum, ferric chloride, and ferric sulfate) are added to water consume alkalinity and will depress the process pH. This pH drop will be more significant in low alkalinity waters. Failing to account for the decrease in pH, which typically accompanies enhanced coagulation, by adjusting the finished water pH or modifying CCT can have negative impacts on corrosion. In poorly
22 MANAGING CHANGE AND UNINTENDED CONSEQUENCES

buffered (i.e., low alkalinity) waters, the use of partially-neutralized, pre-hydrolyzed polyelectro-lytes, such as polyaluminum chloride (PACl), can help to minimize the pH reduction, which may result from conventional metal salt coagulants, and still achieve significant NOM removal (Exall et al., 2000; States et al., 2002). Changes in coagulant to improve removal of DBP precursor material can also cause shifts in lead and copper leaching to water, depending on the type of CCT employed. It has been reported that the finished water Cl-:SO4
2- mass ratio has an impact on lead corrosion. Edwards et al. (1999) reported that in a survey of 24 utilities whose 90th percentile lead concentrations were anomalously high based on pH and alkalinity, the Cl-:SO4
2- appeared to be a distinguishing factor. Among those 24 utilities, 100% with Cl-:SO4
2- ratios less than 0.58 met the 0.015 mg/L Pb action level. However, of those with Cl-:SO4
2- ratios greater than 0.58, only 36% met the action level. On the basis of this information, several utilities have been able to meet the lead action limit by simply
switching from ferric chloride or PACl coagulant to a ferric sulfate or aluminum sulfate (alum) coagulant. These changes decrease the Cl-:SO4
2- ratio. Conversely, some utilities meeting the lead action limit have suddenly failed by implementing coagulant changes that increase the Cl-:SO4
2- ratio. Researchers have reported varied results regarding the impacts of NOM on lead and copper corrosion. Under certain conditions, NOM has been shown to form complexes with lead and copper, form protective coatings on pipe surfaces, and reduce dissolved lead and copper concentrations. In other instances, NOM has been demonstrated to have a negative impact on lead and copper corrosion, particularly in stagnant pipes. What is known is that the impact of NOM on lead and copper corrosion in any given system is largely dependent upon water chemistry, characteristics of the NOM present, and other system hydraulic conditions. Changes in coagulation that impact finished water NOM concentrations or characteristics can, therefore, have an impact on CCT effectiveness.
The City of Columbus, Ohplants, two surface water aGreater Columbus area. improve NOM removal at system DBP concentrationcorrosion control. The avethe average system pH is a
Prior to the switch to ferricaverage system Cl-:SO4
2- raverage system Cl-:SO4
2-
concentration increased to
DOW immediately returnedFollowing the switch back monitoring indicated the 90
DOW entered into an agrethe system Cl-:SO4
2- ratio percentile lead concentratiratio has remained below th
The DOW experience servmodifications to coagulatio
Case Study #2 – Columbus, OH Change in Coagulant
io, Division of Water (DOW) operates three drinking water treatmentnd one ground water, and serves nearly one million customers in theBeginning in 1995, DOW switched from alum to ferric chloride toboth of their surface water treatment plants and reduce distributions. DOW adds zinc orthophosphate at all three treatment plants forrage system alkalinity is approximately 30 to 45 mg/L (as CaCO3) andpproximately 7.7 to 7.9.
chloride, the 90th percentile lead concentration was 7.3 µg/L and theatio was less than 0.50. Following the switch to ferric chloride, the
ratio increased to as high as 0.87 and the 90th percentile lead33 µg/L in 1997.
to alum coagulation at both of their surface water treatment plants.to alum, the system Cl-:SO4
2- ratio dropped to 0.31 and follow-up leadth percentile lead concentration had dropped to 3 µg/L.
ement with the Ohio Environmental Protection Agency under whichmust remain below 0.58. Since the return to alum coagulation, 90th
ons have remained well below the lead action level and the Cl-:SO42-
e maximum of 0.58.
es as an example of unintended consequences that can result fromn practices for the purpose of complying with DBP regulations.
AMERICAN WATER WORKS ASSOCIATION 23

Modified CCT
As previously mentioned, corrosion control technologies can generally be described in three ways: 1) Carbonate precipitation, 2) carbonate passivation, and 3) corrosion inhibitor addition. In many cases, changes in source water quality and/or treatment practices may necessitate changes in CCT. However, utilities may also modify CCT for other reasons, including:
■
■
■
■
Changes in pH/alkalinity to improve carbonate passivation.
The pH required for carbonate precipitation is prohibitive. The calcium carbonate precipitation potential may be such that precipitation requires too high of a pH, resulting in the need to use a phosphate-based inhibitor.
National Pollutant Discharge Elimination System (NPDES) permit limits. NPDES limits on zinc and phosphate discharges by wastewater facilities may pose a constraint on the use of zinc or phosphate-based corrosion inhibitors.
Change corrosion inhibitor to control other water quality problems, such as turbid or discolored water, microbiological activity, or nitrification.
Each of these changes can result in conflicts between CCT and other water quality goals. Changing the pH and/or alkalinity to improve carbonate passivation can have a significant impact on other simultaneous compliance issues. As discussed throughout this document, pH and alkalinity are the water quality parameters that most influence lead and copper solubility, and/or the nature of passivation scales, which provide corrosion control. Increasing pH to improve CCT effectiveness may also affect DBP speciation or formation kinetics (i.e., decrease HAA formation but increase THM formation). Further, increasing the pH may affect the efficacy of the secondary disinfectant. Generally speaking, both free chlorine and chloramines are more effective at lower pH values. However, chloramine residual stability increases as pH increases. Nitrification control requires a stable chloramine residual; thus these water quality goals are in conflict.
Case Study #3 – Indiana-American Water Company Change in Corrosion Control Treatment
A system operated by the Indiana-American Water Company (IAWC), which was supplied solelyby groundwater, experienced elevated levels of copper during routine monitoring for the LCR.The 90th percentile value was 3.37 mg/L with two-thirds of the samples exceeding the copperaction level of 1.3 mg/L. Upon conducting a desktop corrosion control study, IAWC determinedthat the application of a zinc orthophosphate inhibitor (at a zinc to phosphate ratio of 1:3) couldeffectively control copper corrosion. Monitoring conducted subsequent to full-scaleimplementation of the inhibitor feed yielded a 90th percentile value of 1.1 mg/L of copper or areduction of 67 percent from the initial monitoring results.
In time, IAWC experienced two simultaneous unintended consequences as a result of the use ofthe zinc orthophosphate – biofilm regrowth in the distribution system and excessive zinc levels inthe sludge generated at the community’s sewage treatment plant. The latter was of significantconcern because the ultimate disposal method for the sewage sludge was land application andthe elevated levels of zinc could have potentially prohibited applying the sludge to the land.
IAWC dealt with the biofilm issue by instituting an aggressive flushing program that was effectivein retarding the establishment of a biofilm layer in the piping of the distribution system. A switchfrom zinc orthophosphate to phosphoric acid eliminated the zinc issue while maintainingadequate control over copper corrosion rates.
The IAWC experience serves as an example of the unintended consequences that can resultfrom a change in corrosion control treatment.
24 MANAGING CHANGE AND UNINTENDED CONSEQUENCES

Using carbonate precipitation as a CCT may also result in unintended consequences that can impact system operation. Raising the pH to improve corrosion control by carbonate passivation or carbonate precipitation can cause a shift in DBP speciation and result in increased THM formation. In some waters, such an increase may jeopardize compliance with the Stage 1 or Stage 2 DBPR. Similarly, a positive Langlier Index may result in excessive precipitation of magnesium silicates, increase headloss in the distribution network, limiting the hydraulic capacity of the system and increasing operational (pumping) costs. Changing corrosion inhibitors to meet wastewater treatment plant discharge limits for zinc, phosphorus or other water quality goals can also create potential CCT constraints. Addition of phosphate-based inhibitors may also increase aluminum phosphate (AlPO4) precipitation in the distribution system, reducing hydraulic capacity of the system and resulting in an increase in system headloss and operational costs. Polyphosphates and sodium hexametaphosphate are sequestering agents and may be effective for the control of iron and manganese, but are not recommended for the control of lead and copper (Schock, 1999; Edwards et al., 2002). Orthophosphates combine with lead and copper in plumbing materials to form a wide variety of insoluble compounds and are an effective corrosion control strategy (Vik et al., 1996). Polyphosphate blends can be used to control both iron and lead corrosion and may offer other benefits, such as increases in disinfectant residuals, decreases in heterotrophic bacteria, and reductions in customer complaints (Cohen et al., 2003). However, Edwards et al. (2002) found lead solubility in stagnant pipes was directly proportional to the polyphosphate dose. So, when polyphosphate is required for iron corrosion control, identifying the minimum effective dose may avoid undesirable lead levels. Major Unit Process Modifications
Utilities add or remove major unit processes for a variety of reasons, including: ■
■
■
■
■
Changes in source water quality.
Improved cost-effectiveness of existing treatment.
New or more stringent regulatory requirements.
Need to meet or exceed customer expectations (e.g., industrial water user requirements).
Aesthetic parameters, such as hardness, color, and taste and odor.
The addition or deletion of a major unit process can have a significant effect on finished water quality parameters that impact corrosion. Treatment processes that impact the treated water pH and/or alkalinity are most likely to cause changes in corrosion chemistry. Lime softening, membrane processes, and ion exchange are three processes likely to impact these parameters. Other processes, which may have negative corrosion impacts, include ozonation, granular activated carbon, and biofiltration.
Enhanincrearemov10.3 oon alkthan 1alkalinenhancoppemay naccouensureGivenon alenhanapprecconcemajorNOMdiscus
Major unit process modifications that impact finished water pH and/or alkalinity are most likely to impact corrosion.
ced or modified softening involves sing the lime dose and pH to improve NOM al. For utilities that already soften at pH r higher, this will have no appreciable effect alinity. Utilities that “soften” at pH less 0.3 may see some incremental reduction in ity. The increase in pH that accompanies
ced softening is beneficial from a lead and r solubility perspective; however, utilities eed to increase the carbon dioxide dose to
nt for this increase prior to distribution to the finished water pH is not too high. the minimal impact of enhanced softening kalinity and the increase in process pH, ced softening is expected to have no iable effect on lead and copper
ntrations provided NOM does not play a role in corrosion control. The impacts of on CCT effectiveness have been previously sed in this report.
AMERICAN WATER WORKS ASSOCIATION 25

Case Study #4 – Scottsdale, AZ Implementation of Membrane Treatment
The City of Scottsdale, AZ planned to construct an RO facility to treat a portion of the waterfrom its Centralized Groundwater Treatment Facility (CGTF) with the goal of reducing the levelof TDS and total hardness in the blended water. The use of RO would also yield a beneficialreduction in the levels of arsenic and nitrate in the blended supply.
Scottsdale conducted detailed pilot tests that determined the amount of RO required to achievethe treatment goals. Additionally, the utility had the foresight to evaluate the potential impactsof the blended water on the distribution system. This was accomplished utilizing 18 pipe loopexperiments that exposed the pipe loops to CGTF/RO-treated blended water under a variety ofpH and phosphate concentration conditions.
The pilot tests indicated that a blend of CGTF/RO-treated water with a TDS concentration inthe range of 550 to 600 mg/L and a pH in the range of 8.0 – 8.5 would result in stable waterwith minimal corrosion and scale-forming characteristics. Further, the pilot tests indicated thatphosphate addition was not necessary.
By virtue of the aforementioned pilot tests, the City of Scottsdale was able to avoid unintendedconsequences such as accelerated corrosion, discolored water and potential complianceissues with the Lead and Copper Rule resulting from a major change in its treatment process.
Addition of nanofiltration (NF), reverse osmosis (RO), or electrodialysis reversal (EDR) for softening, to remove NOM, or remove other dissolved contaminants (e.g., arsenic or radionuclides) may impact corrosion control. NF/RO and EDR remove alkalinity resulting in low pH and increases in dissolved carbon dioxide. Treated water generally requires de-carbonation (air stripping to remove dissolved CO2) and pH/alkalinity adjustment with caustic soda prior to distribution. Ion exchange softening is a cation exchange process generally involving the exchange of dissolved calcium and magnesium for sodium ions. Sorg et al. (1999) noted that cation exchange has no appreciable effect on lead and copper solubility because it results in no significant change in those parameters that most directly impact lead and copper corrosion – pH and alkalinity. However, based on the exchange stoichiometry and respective molecular weights of calcium, magnesium, and sodium, the process will result in an increase in finished water TDS concentrations, which may have negative impacts on corrosion. Cation exchange softening may result in slight (0.2-0.3 unit) increases in pH
which may have a slightly beneficial impact on lead and copper concentrations (Sorg et al., 1999). Anion exchange or demineralization (combined anion and cation exchange) may have a considerable effect on corrosion. Anion exchange can be beneficial or challenging depending on site-specific water quality parameters. Anion exchange can be used to remove or reduce alkalinity. Demineralization will remove both dissolved cations (calcium, magnesium) and anions (carbonate, sulfate, silicate). Completely demineralized water is extremely corrosive. Blending may be an appropriate solution to minimize the corrosivity of finished water. Where possible, determine the blending ratio with key corrosion parameters (alkalinity and pH) in mind. When other water quality parameters, such as arsenic, require a significant portion of the flow to be treated to meet the MCL and result in treated water that is likely to be corrosive, the finished water chemistry can be adjusted to compensate. Ion exchange treatment may also require consideration of orthophosphate or other corrosion inhibitor addition, rather than carbonate precipitation, as a corrosion control technology.
26 MANAGING CHANGE AND UNINTENDED CONSEQUENCES

Ozonation and other processes that impact the concentration of dissolved oxygen or other dissolved gases can impact corrosion. If not followed by biofiltration, ozonation may also impact the fraction of biodegradable NOM present in the distribution system resulting in increased nutrient loading and increased potential for biological regrowth and biocorrosion. Granular activated carbon (GAC) and biofiltration for enhanced NOM removal may also release biodegradable NOM into the distribution system. The effects of introducing biodegradable NOM into the distribution system are a function of a number of local parameters, like disinfectant residual (Najm et. al., 2000) and are best evaluated on a site-specific basis. Crozes (2000) provides guidance on how to assess local conditions for evaluating biological regrowth in distribution systems. Distribution System Operations and Maintenance Changes
This section identifies unintended consequences related to distribution system operational and maintenance changes that can impact CCT effectiveness and jeopardize compliance with the LCR, including:
■
■
■
■
■
■
■
Operational changes impacting direction of flow, pressure, and water age.
Maintenance activities, such as flushing, pipe and reservoir cleaning, and inspections.
Lead service line and/or meter replacement.
Operational changes to prevent or control nitrification.
Operational Changes
Changes in distribution system operation practices can impact water quality and the effectiveness of CCT. The operational issues most significant to maintaining water quality and effective corrosion control are:
Water age.
Blending finished waters of different quality.
System pressure, direction and flow of water.
Water quality decay in a distribution system is often closely associated with water age within the distribution system. Changes in distribution system operations that result in significantly higher water age can have negative impacts on corrosion-related parameters, such as pH (Kirmeyer et al., 2000). Most systems have been designed to provide adequate quantities of water while maintaining pressures under fire flow conditions, resulting in oversized systems with stagnant zones that increase water age within the system. Although the primary concerns with water age include loss of residual disinfectant, nitrification and DBP formation, excessive water age can result in changes in water chemistry and increased metal solubility. For example, biofilm or sediment accumulation in the pipeline can impact water pH and phosphate levels and pipe wall interactions can result in a decrease in dissolved oxygen and chlorine residual concentrations, all of which have been demonstrated to have an impact on corrosion. Proper operation of storage facilities can also aid in reducing or correcting water quality problems related to water age (Kirmeyer et al., 1999; Grayman et al., 2000). As occurs in distribution piping, biofilms or sediments can accumulate in storage facilities, and in conjunction with long detention times, can result in pH instability problems that can increase metal solubility. Operating storage facilities to increase water turnover rates, in conjunction with cleaning activities, can aid in minimizing corrosion potential throughout the distribution system. Blending finished water from multiple sources with varying water quality needs to be coordinated with CCT practices in the distribution system to assure that a water quality consistent with the practiced CCT is maintained. When possible, it is preferred to blend finished waters with similar pH and alkalinity and from comparable CCT programs in the distribution system.
AMERICAN WATER WORKS ASSOCIATION 27

Conducting a blending analysis prior to blending different sources will determine the chemical compatibility of the sources, predict blended water quality characteristics, and assess the impacts on corrosion control treatment. As discussed previously, this can be done by mass balance and use of available shareware programs (such as PHREEQC, USGS, 2005). Utilities with calibrated hydraulic models can also use model results to better characterize the blended water ratios throughout the impacted areas of the system. Changes in water flow (i.e., velocity) and direction can also indirectly impact the effectiveness of corrosion control by causing re-suspension of silt and sediment and scouring passivating films from pipe walls. Re-suspended sediments and scouring can potentially exacerbate corrosion by creating unstable pH conditions and high flows, which in turn can hinder development and maintenance of corrosion control passivation layers. Maintenance Activities
Maintenance activities, which can directly or indirectly impact corrosion control, include: ■
■
Flushing, and
Pipeline and storage facility maintenance.
Flushing programs are an important maintenance activity that can aid in avoiding water quality deterioration and corrosion control problems (Kirmeyer et al., 2000). Flushing is used to remove accumulated silt/sediment, accumulated biofilms, stagnant or contaminated water, and prevent or respond to nitrification episodes (for chloraminated systems). These changes can indirectly improve corrosion control treatment by stabilizing the water quality (i.e., optimum and stable pH, alkalinity, temperature, ammonia levels, and water age). However, proper flushing program strategies are necessary to ensure that water quality goals are met while minimizing costs and the potential for undesirable secondary impacts. For example, flushing can remove encrustation or tuberculation in old, un-lined cast iron pipes. In such cases, the encrustation or tuberculation may serve as a protective layer,
masking severe internal corrosion and minimizing water quality deterioration. Removing that protective layer may result in short-term, or in more extreme cases protracted deterioration in water quality until a protective coating is applied, protective film established, or the pipe is replaced. The more aggressive the cleaning process (e.g., pigging versus flushing) employed the more particular attention should be given to potential unintended impacts. Pipelines and storage facilities require periodic cleaning to remove accumulated deposits and biofilms (Kirmeyer et al., 1999). Deposits and biofilms can potentially impact water pH stability, increasing corrosion and lead levels at the tap. Re-suspension of sediments caused by rapid changes in flow and direction can also increase contaminant concentrations; however, most of these contaminants will be flushed from the system if proper flushing techniques are employed. An effective maintenance program includes periodic pipeline and storage facility cleaning to prevent the deterioration of water quality and maintain CCT effectiveness.
Cacwa
28 MANAGING CHANGE AND UNINTENDED CONSEQUENCES
Lead Service Line Replacements
ommunicating with customersbout lead service line replacementan be particularly challenging andarrants specific attention. Keyreas to consider include:
• Alerting households to replacement activities in advance in order to achieve complete lead service line replacement;
• Explaining flushing instructions when the replacement occurs;
Obtaining samples to test leadlevels post-replacem
• ent in a
• pling results to the customer.
timely manner; and
Communicating lead sam

Service Line and/or Meter Replacement
Utility distribution system maintenance programs include replacing lead service lines, meters, and other inline devices. Lead service line and meter replacement actions have, in some cases, increased lead levels at the tap primarily due to disruption of the existing pipe scales, deposition of lead filings, and galvanic-cell corrosion.
Replacement of lead service lines and meters can increase lead concentrations at the tap by introducing particulate lead, in the form of pipe scale and metal filings, into home plumbing. Lead service line replacement can also contribute lead particulates. Additional precautions can be taken during lead service line replacement to
Case Study #5 – Madison, WI Lead Service Line Replacement
Madison Water Utility exceeded the action level for lead in 1992 with a 90th percentile value of 16µg/L. The utility conducted a series of studies of standard corrosion inhibitors in an attempt toidentify an appropriate corrosion control strategy. It found orthophosphate to be the onlycompound effective in lowering lead levels sufficient to comply with EPA standards. The utilityfound that adding orthophosphate to drinking water also would result in (1) exceeding the capacityof the wastewater treatment system for phosphorus removal, and (2) significantly increasing thenutrient loading of area lakes from drinking water that enters the storm water system. An alternateapproach was needed, and the decision was made to replace all remaining lead service lines inMadison over a ten-year period.
In 2001, the city adopted an ordinance requiring replacement of all lead service lines by 2011. Theordinance specified that the customer-owned segment of the lead service line had to be replacedat the same time as the utility segment of the service lines. Customers are required to pay forreplacement of their service lines, but can apply for reimbursement from the city for half the cost ofreplacement, up to $1,000.
By the end of 2004, about 4,300 of an estimated 6,500 lead service lines had been replaced.Service line replacement included both flushing of the service line after the replacement andprovision of flushing instructions to homeowners. In order to evaluate the effectiveness of theprogram, first-draw samples were collected from 60 homes at which lead service line replacementhad been completed from between 16 days and 27 years prior to sampling. Surprisingly, the 90th
percentile value of these samples for total lead was 22 µg/L or an increase of 6 µg/L over the pre-lead service line replacement value. However, the 90th percentile value of the samples fordissolved lead was just 5 µg/L, leading the utility to conclude that particulate lead was the sourceof elevated lead levels.
Even before lead service line replacement, the utility noticed that lead levels at customers’ tapsfluctuated greatly from sample to sample, and this pattern continued following lead service linereplacement. The utility determined that this fluctuation was caused by random release ofparticulate lead both before and after lead service line replacement. Further analysis of the datasuggests that the appearance of particulate lead is less likely to occur as time increases from thedate of lead service line replacement. Once the lead service lines are removed, it appears thatlead particles present elsewhere in the plumbing continue to be flushed over time, until lead levelsreach an acceptable level.
The utility is continuing its sampling program to determine the likely timeframe required for leadlevels to fall to within drinking water standards following lead service line replacement. It is alsolooking at options for accelerating the removal of lead particles from plumbing following leadservice line replacement. The utility is notifying customers whose lead service line have beenreplaced to continue flushing at the tap prior to drawing water for drinking and cooking until it isdetermined how long it is likely to take, following replacement, for lead levels to reach EPAstandards.
AMERICAN WATER WORKS ASSOCIATION 29
minimize particulate lead deposition into the water. For example, Greater Cincinnati Water Works used a cutting tool, rather than a hacksaw, to cut lead service lines during replacement to minimize disruption of scale from the surface of the lines and minimize lead-containing particles in customers’ tap water (USEPA, 2004). At present, carefully flushing the service line after a lead service line replacement appears to be the most reliable means of reducing short-term increases in lead concentrations after service line replacement. Operational Changes to Prevent or Control Nitrification
Nitrification can result in loss of disinfectant residual and a reduction in pH in low alkalinity waters, which has the potential to have negative impacts on CCT and lead and copper corrosion. A study conducted by the City of Willmar, MN indicated that nitrification and copper corrosion occurred simultaneously (Murphy et al., 1997). Based on these results and the potential water quality impacts of nitrification (i.e., reduced pH in low alkalinity waters), there is a sound basis for assuming that nitrification might have contributed to the increased copper corrosion. There are a number of routine operational strategies and maintenance activities used by
chloraminated systems to prevent or respond to nitrification. In fact, AWWA and the AwwaRF have published a number of reference materials related to nitrification response. These include: Additional Reading
AWWA Manual of Practice, Fundamentals and Control of Nitrification in Chloraminated Drinking Water Distribution Systems (AWWA, 2005)
■
■
■
■
Nitrification Occurrence and Control in Chloraminated Water Systems (AwwaRF, 1995)
A Guide for the Implementation and Use of Chloramines (AwwaRF, 2004)
Optimizing Chloramine Treatment, Second Edition (AwwaRF, 2004)
30 MANAGING CHANGE AND UNINTENDED CONSEQUENCES
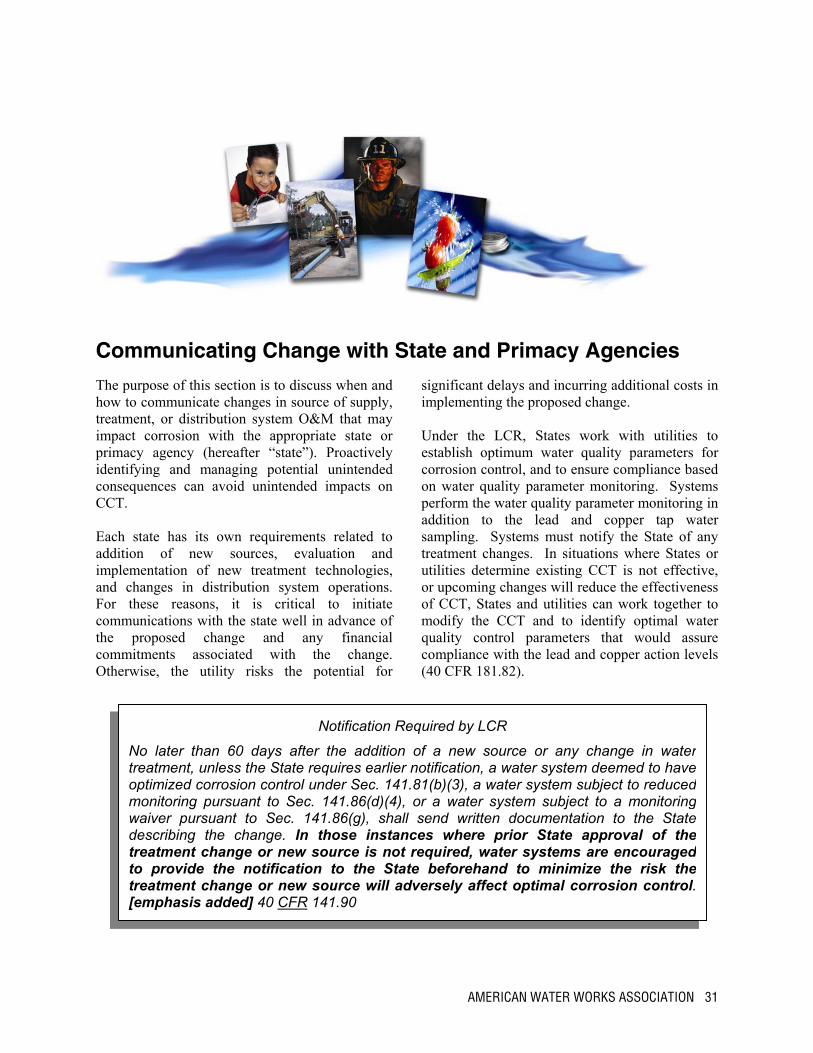
Communicating Change with State and Primacy Agencies The purpose of this section is to discuss when and how to communicate changes in source of supply, treatment, or distribution system O&M that may impact corrosion with the appropriate state or primacy agency (hereafter “state”). Proactively identifying and managing potential unintended consequences can avoid unintended impacts on CCT. Each state has its own requirements related to addition of new sources, evaluation and implementation of new treatment technologies, and changes in distribution system operations. For these reasons, it is critical to initiate communications with the state well in advance of the proposed change and any financial commitments associated with the change. Otherwise, the utility risks the potential for
significant delays and incurring additional costs in implementing the proposed change. Under the LCR, States work with utilities to establish optimum water quality parameters for corrosion control, and to ensure compliance based on water quality parameter monitoring. Systems perform the water quality parameter monitoring in addition to the lead and copper tap water sampling. Systems must notify the State of any treatment changes. In situations where States or utilities determine existing CCT is not effective, or upcoming changes will reduce the effectiveness of CCT, States and utilities can work together to modify the CCT and to identify optimal water quality control parameters that would assure compliance with the lead and copper action levels (40 CFR 181.82).
No later than 60 days aftetreatment, unless the State roptimized corrosion control umonitoring pursuant to Secwaiver pursuant to Sec. 1describing the change. In treatment change or new to provide the notificatiotreatment change or new [emphasis added] 40 CFR
Notification Required by LCR
r the addition of a new source or any change in waterequires earlier notification, a water system deemed to havender Sec. 141.81(b)(3), a water system subject to reduced
. 141.86(d)(4), or a water system subject to a monitoring41.86(g), shall send written documentation to the Statethose instances where prior State approval of the
source is not required, water systems are encouragedn to the State beforehand to minimize the risk thesource will adversely affect optimal corrosion control.141.90
AMERICAN WATER WORKS ASSOCIATION 31
When referring to a “new source of supply,” this document is referring to the addition of new raw water supplies. While the introduction of new sources of finished water to a distribution system can impact CCT, it is expected that the utility providing that source has optimized CCT. That being said, coordinating CCT of multiple finished water supplies is important to ensure compatibility and minimize the potential for unintended consequences impacting corrosion. Most states require detailed characterization of new sources of supply to ensure that adequate treatment is provided to address any contaminants of concern and compliance with existing MCLs. However, such characterization may not require identification of the impacts of that source on corrosion. Regardless, the utility has the opportunity to identify any potential unintended consequences related to CCT, and to implement the appropriate mitigation strategy when a conflict is found. All states have plan review procedures that must be followed before utilities implement significant changes in treatment. The state may also require that the utility address the impact of such changes on corrosion parameters, such as pH, alkalinity, etc. In many cases, states will require pilot-scale or demonstration testing to establish operating criteria for a change in treatment. This is particularly common for high-rate filtration, changes in disinfection practice, installation of new treatment processes (e.g., membranes, ion exchange, etc.). Such new treatment demonstrations include consideration of the impact of the proposed process changes on corrosion parameters. In general, states do not require review and approval of plans for “routine operation and maintenance changes.” Thus, it is possible that a utility may implement changes at the treatment plant or in distribution O&M that will not require approval by the state, yet may still have an impact on corrosion. Again, in these instances, the utility has the opportunity to identify any potential unintended consequences of the O&M practices on corrosion and implement the appropriate control strategy where a conflict exists.
Protocols for conducting corrosion control studies and establishing optimal water quality control parameters are identified in 40 CFR 141.82(c). The authority of the state to approve or designate optimal CCT is granted in 40 CFR 141(d). Utilities implementing changes that necessitate re-optimization of CCT can consult 40 CFR 141 prior to determining optimal water quality control parameters to assure all regulatory requirements are met. Figure 5 presents a suggested plan for communicating with the state regarding changes in source, treatment, or distribution that may impact corrosion. Recognizing that most of the changes that have the potential to significantly affect CCT will be large enough to require competitive bidding, and because state requirements can vary significantly, Figure 5 assumes at least one year prior to the anticipated bid date. If the utility intends to implement the change using utility staff only, the state can be contacted as soon as the potential change is identified and sufficiently developed that it can be discussed with the state. Entering this discussion with a sufficient lead time is important; in some instances, a period of a year or more prior to implementation may be necessary. If demonstration testing is anticipated, it may be necessary to begin the process two or more years in advance of the proposed change or bidding or procurement related to the proposed change. In most cases, one year should be sufficient time to address any concerns the state may have regarding corrosion control and will help to prevent project delays as the implementation/bid date nears. As shown in Figure 5, an evaluation to identify potential corrosion impacts of the proposed change should be conducted prior to initiating communications with the state. The desktop evaluation serves as the basis for discussion with the state and allows the utility to address any corrosion-related concerns the state may have during the preliminary meeting. During the preliminary meeting, the utility and state can then discuss the results of the desktop evaluation, including any potential CCT conflicts identified. If the desktop evaluation reveals potential CCT conflicts, the utility has the opportunity to be prepared to discuss how those conflicts will be
32 MANAGING CHANGE AND UNINTENDED CONSEQUENCES
addressed (e.g., modified CCT or demonstration testing). It is also during this meeting that the state can identify any testing or demonstration requirements it has related to the proposed change. It is important to keep in mind that states may have testing or demonstration requirements unrelated to corrosion control, particularly where addition of new or innovative technologies are concerned. While this testing may not specifically be required to address corrosion impacts, it nevertheless may impact the implementation schedule and can be accounted for in the planning process. If the state requires demonstration testing, or if the results of the desktop evaluation indicate the potential for CCT conflicts, demonstration testing can be conducted to confirm any conflicts and identify appropriate modifications to CCT practices. Water systems should see appropriate professional expertise prior to demonstration testing if the utility does not have the relevant in-house training or experience.
When demonstration testing is required for reasons other than corrosion control, inclusion of corrosion-related parameters as a part of the testing process maybe a cost-effective means of obtaining additional data to support maintaining an effective CCT program. Upon completion of the demonstration-testing program, a follow-up meeting with the state provides an opportunity to discuss the test results and any warranted modifications to current CCT practices. If the desktop evaluation and the preliminary meeting did not warrant demonstration testing or CCT approach is approved by the state, utilities can proceed with bidding and procurement of any services or equipment related to the proposed change with a clear understanding of the state’s expectations. Changes to CCT practices can be implemented and optimal CCT conditions maintained until future changes warrant additional modifications. Incorporating follow-up monitoring for a reasonable period of time post-change / post-CCT modification is a useful tool to assure there have not been negative consequences on corrosion control and to re-establish baseline system conditions.
AMERICAN WATER WORKS ASSOCIATION 33
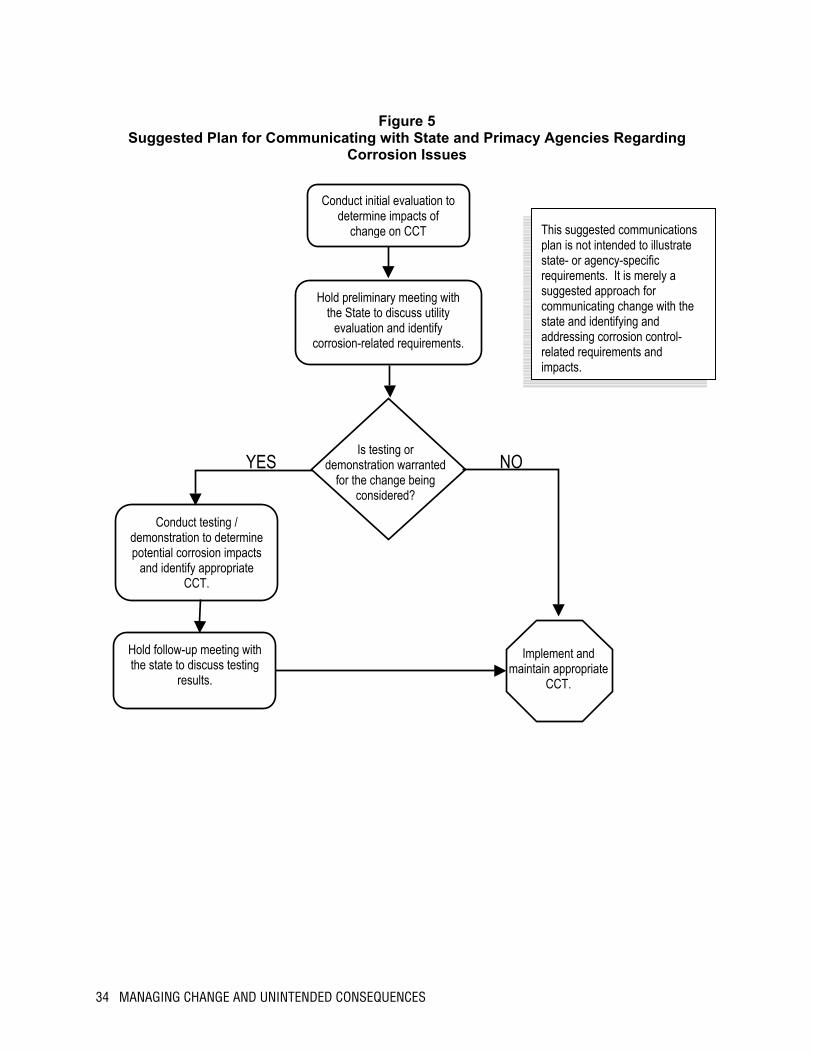
Figure 5 Suggested Plan for Communicating with State and Primacy Agencies Regarding
Corrosion Issues
impacts.
Hold follow-up meeting withthe state to discuss testing
results.
Conduct testing / demonstration to determinepotential corrosion impacts
and identify appropriate CCT.
NO YES Is testing or
demonstration warranted for the change being
considered?
This suggested communications plan is not intended to illustrate state- or agency-specific requirements. It is merely a suggested approach for communicating change with the state and identifying and addressing corrosion control-related requirements and
Conduct initial evaluation to determine impacts of
change on CCT
Hold preliminary meeting with the State to discuss utility
evaluation and identify corrosion-related requirements.
Implement and maintain appropriate
CCT.
34 MANAGING CHANGE AND UNINTENDED CONSEQUENCES

Appendix 1. Key Corrosion Control Parameters
pH The pH of a water is a measure of the strength of the hydrogen ion concentration (H+ or H3O+) and is generally considered to be an indicator of the corrosiveness of a solution. The pH scale ranges from 0 to 14 – values less than 7 are considered acidic, values greater than 7 are considered alkaline or basic, and 7 is considered neutral. Drinking water pH values typically range from 6 to 10. At higher pHs there is less tendency for lead and copper in contact with drinking water to dissolve and dissociate, which is why pH adjustment is such a common corrosion control treatment strategy. Maintaining a consistent target pH throughout the distribution system is always critical to minimizing lead and copper levels at the tap, even if other corrosion control methods are employed. Alkalinity Alkalinity is the capacity of water to neutralize acid, or more specifically, the ability of water to accept protons. High alkalinity waters generally have high buffering capacities, or a strong ability to resist changes in pH. In contrast, low alkalinity waters are less able to resist changes in pH. Alkalinity is the sum of carbonate, bicarbonate and hydroxide anions, and is typically reported as mg/L "as calcium carbonate" (CaCO3). The bicarbonate and carbonate species present affect many corrosion reactions, including the ability of a water to form protective carbonate scale or passivating films, such as CaCO3, FeCO3, Cu2CO3(OH)2) or Pb3(CO3)2(OH)2. On the other hand, the formation of strong soluble carbonate complexes with metals, such as lead and copper, can accelerate corrosion given the right pH/alkalinity conditions (Schock, 1999). Dissolved Inorganic Carbonate (DIC) DIC is the sum of all dissolved inorganic carbonate-containing species, including dissolved aqueous carbon dioxide gas (CO2 or H2CO3), bicarbonate ion (HCO3-), and carbonate ion (CO3
2-) in a particular water. It is usually expressed as milligrams of carbon per liter (mg C/L) and varies according to water temperature and ionic strength. DIC concentrations significantly impact lead and copper solubility and the stability of the pH. Although DIC and alkalinity are similar, they are not the same water quality parameter. DIC is a function of pH and alkalinity. However, the two terms are frequently used interchangeably when discussing corrosion. Because the term “alkalinity” is more commonly used in the water treatment industry, in this document, “alkalinity” is to refer to both DIC and alkalinity. Phosphate-Based Corrosion Inhibitors Orthophosphate (PO4) added as a corrosion control treatment chemical can combine with lead and copper in plumbing materials to form a wide variety of insoluble compounds, which is an effective corrosion control strategy known as “passivation.” The predominant phosphate species in corrosion inhibitor chemicals can also have a significant impact on lead and copper solubility. Holm and Schock (1991) have noted that polyphosphates may be effective for sequestration of iron and manganese but have potential to increase lead solubility under some conditions. To the extent that soluble metals are the cause for higher lead and copper at the consumers tap then, use of polyphosphates has the potential to increase lead and copper home plumbing. While this hypothesis is controversial and has been debated for over a decade, there is a significant body of data which suggests at least some merit to the concerns (Edwards and McNeill, 2001). Like polyphosphate, sodium hexametaphosphate is a sequestering agent, particularly for calcium, and is not typically effective as a lead corrosion inhibitor. Edwards et al. (2002) observed under controlled
AMERICAN WATER WORKS ASSOCIATION 35
laboratory conditions that soluble lead concentration increased by approximately 1.6 mg/L for each 1 mg/L increase in sodium hexametaphosphate. Buffer Intensity or Buffer Capacity Buffer intensity is a measure of the ability of a water to provide buffering against a change in pH caused by a corrosion process or treatment chemical addition, and is closely related to the alkalinity and pH of the water. Bicarbonate and carbonate ions are the most important buffering species in most drinking water supplies. At pH ≥ 9, silicate ions also provide some buffering. Buffer intensity is impacted by temperature is normally greatest at pH values of approximately 6.3 and above 9.0, and lowest in the range of pH 8.0 to 8.5 at 25° C. At 5° C, buffer intensity is lowest over the pH range of 8.3 to 8.7. Hardness Hardness is a characteristic, which primarily represents the presence of dissolved calcium and magnesium in water, and is reported as an equivalent quantity of calcium carbonate (CaCO3). When sufficient calcium and alkalinity are present at a given pH, a protective scale of CaCO3 may form on the inside of distribution piping. In fact, this is a common method of corrosion control, referred to as “carbonate precipitation.” In contrast, the formation of carbonate scale can interfere with corrosion control when other methods are employed. It has also been reported that significant carbonate scales do not form on lead, galvanized, or copper cold water pipes, so this may not offer the level of protection anticipated (Schock, 1999). Hardness must be taken into consideration when corrosion control is selected and implemented because it can create scaling problems within treatment plant and distribution system infrastructure. For example, higher dosages of orthophosphate inhibitors will generally be needed as finished water hardness levels increase. Total Dissolved Solids (TDS) In conjunction with pH and alkalinity, TDS can have a significant impact on corrosion. High TDS concentrations are generally associated with high concentrations of ions (e.g., Na+, Ca2+, Mg2+, Cl-, CO3
2-, SO4
2-) that increase the conductivity of the water. The increased conductivity increases the ability of the water to complete the electrochemical circuit and conduct a corrosive current. If sulfate and chloride are major anionic contributors to the TDS, it is likely to show increased corrosivity towards iron-based materials. If the TDS is composed primarily of bicarbonate and hardness ions, the water may not be corrosive towards iron-based or cementitious materials, but may be highly corrosive towards copper (Schock, 1999). Low TDS waters can also be corrosive and increase lead solubility. Low TDS waters often have a strong tendency to dissolve (corrode) materials with which they are in contact in an attempt to reach equilibrium. Dissolved Oxygen The presence of any dissolved gas (e.g., CO2) has the potential to impact corrosion. However, dissolved oxygen has the most significant and direct impacts. Oxygen is only slightly soluble in water, seldom reaching concentrations exceeding 15 mg/L. Increases in dissolved oxygen can have a profound effect on the solubility of iron, manganese, lead and copper. Dissolved oxygen can react with ferrous (Fe2+) ions in water and convert them to ferric (Fe3+) ions, which can form ferric hydroxide and result in red water complaints (Schock, 1999). Dissolved oxygen may also increase pipe tuberculation and pitting corrosion. On the other hand, substantial dissolved oxygen concentrations may also result in the formation of more protective metal oxides and reduce corrosion.
36 MANAGING CHANGE AND UNINTENDED CONSEQUENCES
References
Bell-Ajy, K., M. Abbaszadegan, E. Ibrahim, D. Verges and M. LeChevallier (2000). “Conventional and Optimized Coagulation for NOM Removal,” J. AWWA, 92:10:44-58.
Bremer, P.J., B.J. Webster and D.B. Wells (2001). “Biocorrosion of Copper in Potable Water,” J. AWWA, 93:8:82-91.
Boulay, N. and M. Edwards (2001). “Role of Temperature, Chlorine and Organic Matter on Copper Corrosion Byproduct Release in Soft Waters.” Water Research, 35:3:683-690.
Broo, A.E., B. Berghult and T. Hedberg (1999). “Drinking Water Distribution – The Effect of Natural Organic Matter (NOM) on the Corrosion of Iron and Copper,” Water Sci. Tech., 40:9:17-24.
Cantor, A.F., D. Denig-Chakroff, R.R. Vela, M.G. Oleinik and D.L. Lynch (2000). “Use of Polyphosphates in Corrosion Control,” J. AWWA, 92:2:95-102.
Carlson, K., S. Via, B. Bellamy and M. Carlson (2000). “Secondary Effects of Enhanced Coagulation and Softening,” J. AWWA, 92:6:63-75.
Cohen, Y.K., C.G. Abernathy and C.P. Hill (2003). “Corrosion Control Aids Residuals,” Opflow, 29:1:1.
Crozes, G. (2002). Evaluating Biological Regrowth in Distribution Systems, American Water Works Association Research Foundation, Denver, CO.
Economic and Engineering Services, Inc. and Illinois State Water Survey (1990). Lead Control Strategies, American Water Works Association Research Foundation, Denver, CO.
Edwards, M., J.F. Ferguson and S. Reiber. “The Pitting Corrosion of Copper,” J. AWWA, 86:7:74-90.
Edwards, M., S. Jacobs and D. Dodrill (1999). “Desktop Guidance for Mitigating Pb and Cu Corrosion Byproducts,” J. AWWA, 91:5:66-77.
Edwards, M. and L.S. McNeill (2002). “Effect of Phosphate Inhibitors on Lead Release from Pipes,” J. AWWA, 94:1:79-90.
Edwards, M. and A. Dudi (2004). “Role of Chlorine and Chloramine in Corrosion of Lead-Bearing Plumbing Materials,” J. AWWA, 96:10:69-81.
Exall, K.N. and G.W. Vanloon (2000). “Using Coagulants to Remove Organic Matter,” J. AWWA, 92:11:93-102.
Ferguson, J.F., O. van Franque and M.R. Schock (1996). “Corrosion of Copper in Potable Water Systems,” Chapter in Internal Corrosion of Water Distribution Systems, American Water Works Association Research Foundation and DVGW-Technologiezentrum Wasser, AwwaRF, Denver, CO.
Grayman, W.M., L.A. Rossman, C. Arnold, R.A. Deininger, C. Smith, J.F. Smith and R. Schnipke (2000). Water Quality Modeling of Distribution System Storage Facilities, American Water Works Association Research Foundation and UK Water Industry Research Limited, AwwaRF, Denver, CO.
Holm, T.R. and M.R. Schock (1991). “Potential Effects of Polyphosphate Products on Lead Solubility in Plumbing Systems,” J. AWWA, 83:7:76.
Kirmeyer, G.J., L. Kirby, B.M. Murphy, P.F. Noran, K.D. Martel, T.W. Lund, J.L. Anderson and R. Medhurst (1999). Maintaining Water Quality in Finished Water Storage Facilities, American Water Works Association Research Foundation and UK Water Industry Research Limited, AwwaRF, Denver, CO.
AMERICAN WATER WORKS ASSOCIATION 37

Kirmeyer, G.J., M. Friedman, J. Clement, A. Sandvig, P.F. Noran, K.D. Martel, D. Smith, M. LeChevallier, C. Volk, J. Dyksen and R. Cushing (2000). Guidance Manual for Maintaining Distribution System Water Quality, American Water Works Association Research Foundation, Denver, CO.
Kommineni, S., W. Vernon, J. Clune, M. Edwards and A. Groendyk (2003). “Introducing Membrane Treated Water into Distribution System Without Upsetting Existing Pipe Scale – Scottsdale’s Approach,” Proceedings, Annual Conference of the American Water Works Association, Anaheim CA, June 15-19, 2003.
LeChevallier, M.W., M. Karim and R.W. Gullick (2001). “The Potential for Pathogen Intrusion in Distribution Systems,” Association of State Drinking Water Administrators, 16th Annual Conference, Baltimore, MD.
Lytle, D.A. and V.L. Snoeyink (2002). “Effect of Ortho- and Polyphosphates on the Properties of Iron Particles and Suspensions,” J. AWWA, 94:10:87-99.
McNeill, L.S. and M. Edwards (2002). “Phosphate Inhibitor Use at US Utilities,” J. AWWA, 94:7:57-63.
Najm, I., M. LeChevallier, A. Randall, L. Kiene (2000). Case Studies of the Impacts of Treatment Changes on Biostability in Full-Scale Distribution Systems, American Water Works Association Research Foundation, Denver, CO.
Rehring, J.P., M. Edwards, “Copper Corrosion in Potable Water Systems: Impacts of Natural Organic Matter and Water Treatment Processes,” Corrosion, 52:4:307-317.
Reiber, S., S. Poulsom, S.A.L. Perry, M. Edwards, S. Patel, and D.M. Dodrill (1997). “A General Framework for Corrosion Control based on Utility Experience.” American Water Works Association Research Foundation, Denver, CO.
Reiber, S. (2004). “Disinfection Byproducts vs. Corrosion Control: A Case Study on the DC WASA Lead Experience,” presented at the Water Quality and Technology Conference of the American Water Works Association, San Antonio, TX.
Schock, M.R., I. Wagner and R.J. Oliphant (1996). “Corrosion and Solubility of Lead in Drinking Water,” Chapter in Internal Corrosion of Water Distribution Systems, American Water Works Association Research Foundation and DVGW-Technologiezentrum Wasser, AwwaRF, Denver, CO.
Schock, M.R. (1999). “Internal Corrosion and Deposition Control,” Chapter in Water Quality and Treatment: A Handbook of Community Water Supplies, Fifth Edition, American Water Works Association, McGraw Hill, New York, NY.
Sorg, T.J., M.R. Schock and D.A. Lytle (1999). “Ion Exchange Softening: Effects on Metal Concentrations,” J. AWWA, 91:8:85-97.
States, S., R. Tomko, M. Scheuring and L. Casson (2002). “Enhanced Coagulation and Removal of Cryptosporidium,” J. AWWA, 94:11:67-77.
USEPA (1991) Lead and Copper Rule, United States Environmental Protection Agency, 56 Federal Register 26460.
USEPA (1992). Lead and Copper Rule Guidance Manual, Volume II: Corrosion Control Treatment, United States Environmental Protection Agency, Office of Ground Water and Drinking Water, Washington DC.
USEPA (2000). Lead and Copper Rule Minor Revisions, United States Environmental Protection Agency, 65 Federal Register 1949.
38 MANAGING CHANGE AND UNINTENDED CONSEQUENCES

USEPA (2003). Revised Guidance Manual for Selecting Lead and Copper Control Strategies, EPA-816-R-03-001, United States Environmental Protection Agency, Office of Water, Washington, D.C.
USEPA (2004). Compliance Calculations Under the Lead and Copper Rule to Region 1, United States Environmental Protection Agency, Office of Groundwater and Drinking Water, Washington, D.C.
USEPA (2004). Lead and Copper Rule Workshop 1: Simultaneous Compliance, Summary, Meeting minutes from Lead and Copper Rule Workshop, May 11-12, 2004, St. Louis, MO.
USEPA (2004). Lead and Copper Rule – Clarification of Requirements for Collecting Samples and Calculating Compliance, United States Environmental Protection Agency, Office of Water, Washington, D.C.
USGS (2005). PHREEQC (Version 2): A Computer Program for Speciation, Batch-Reaction, One-Dimensional Transport, and Inverse Geochemical Calculations, http://wwwbrr.cr.usgs.gov/projects/GWC_coupled/phreeqc.
Vik, E.A., R.A. Ryder, I. Wagner and J. Ferguson (1996). “Mitigation of Corrosion Effects,” Chapter in Internal Corrosion of Water Distribution Systems, American Water Works Association Research Foundation and DVGW-Technologiezentrum Wasser, AwwaRF, Denver, CO.
AMERICAN WATER WORKS ASSOCIATION 39