managing environmental flows in an agricultural landscape ...€¦ · managing environmental flows...
TRANSCRIPT

Managing environmental flows in an agricultural landscape: the Lower Gwydir floodplain Final Report to the Australian Government Department of the Environment, Water, Heritage and the Arts
September 2009
G. Glenn Wilson Tobias O. Bickel Peter J. Berney Julia L. Sisson

Cover photos Top: Copeton Dam (Photo: N. Foster); second: Gingham Watercourse at “Willowlee” (Photo: G. Wilson); third: Gingham Watercourse at “ Boyanga Waterhole” (Photo: G. Wilson); bottom: Gingham floodplain at “Crinolyn” (Photo: P. Berney).
Managing environmental flows in an agricultural landscape: the Lower Gwydir floodplain Final Report to the Australian Government Department of the Environment, Water, Heritage and the Arts
September 2009 G. Glenn Wilson Tobias O. Bickel Peter J. Berney Julia L. Sisson Ecosystem Management School of Environmental and Rural Science University of New England Armidale


i
This report should be cited as: Wilson, G.G., Bickel, T.O., Berney, P.J. & Sisson, J.L. 2009. Managing environmental flows in an agricultural landscape: the Lower Gwydir floodplain. Final Report to the Australian Government Department of the Environment, Water, Heritage and the Arts. University of New England and Cotton Catchment Communities Cooperative Research Centre, Armidale, New South Wales. 173pp © University of New England All rights reserved. This publication is copyright and may not be resold or reproduced in any manner (except parts thereof for bona fide study purposes in accordance with the Copyright Act) without prior consent of the publisher. Dr Glenn Wilson Ecosystem Management School of Environmental and Rural Science University of New England Ph: 02 6773 3078 Fax: 02 6773 2769 Email: [email protected] Disclaimer: The views and opinions expressed in this publication are those of the authors and do not necessarily reflect those of the Australian Government or the Minister for the Environment, Heritage and the Arts or the Minister for Climate Change and Water or the Administrative Authority for Ramsar in Australia. While reasonable efforts have been made to ensure that the contents of this publication are factually correct, the Commonwealth does not accept responsibility for the accuracy or completeness of the contents, and shall not be liable for any loss or damage that may be occasioned directly or indirectly through the use of, or reliance on, the contents of this publication.
Inundated wetland on “Bunnor” in December 2007, Gingham Watercourse floodplain. Photo: P. Berney.

Contents
Managing Lower Gwydir environmental flows ii
Table of Contents Acknowledgements vi Executive summary vii Part 1 Introduction, scoping review, conceptual model and field 1
program design
Chapter 1 General Introduction 2
Chapter 2. Review of existing ecological knowledge of the Lower 4 Gwydir aquatic ecology
2.1 Introduction 4
2.2 Hydrology and water quality 4 Rainfall seasonality and hydrology 4 Water quality 5 Water chemistry 6 Turbidity and sediments 7 Nutrients 7 Pesticides 8
2.3 Algae and in-stream vegetation 8
2.4 Floodplain vegetation 9 Vegetation patterns 9 Impacts of flooding and altered flow regime on 10 wetland vegetation Impacts of grazing 12
2.5 Zooplankton and microinvertebrates 13
2.6 Macroinvertebrates 14
2.7 Fish, amphibians and aquatic reptiles 14 Fish 14 Fish barriers and passage 16 Amphibians 17 Aquatic reptiles 18
Chapter 3. Conceptual models of ecological response to flow 20 variability in Lower Gwydir floodplain aquatic habitats
3.1 Introduction 20
3.2 In-stream responses 22 Channel structure 22 Macrophytes 23 Invertebrates 24 Fish 24
3.3 Floodplain responses 24 Physical patch structure 24 Floodplain vegetation 25
Contents
Managing Lower Gwydir environmental flows iii
Chapter 3 continued Macrophytes 26 Invertebrates 26 Fish 26
Chapter 4. Design of field sampling program 27
4.1 Introduction 27
4.2 Choice of study watercourses and spatial sampling design 28
4.3 Temporal sampling design – sampling specific flow events 30
4.4 Choice of response variables 31 Water chemistry, water quality, algae 34 Invertebrates 34 Fish 34 Wetland plants 34
Part 2 Responses of Lower Gwydir wetland and in-stream 36
environments to flow variability
Chapter 5 Long-term analysis of the effects of inundation and 37 grazing on vegetation communities in the Gwydir wetlands
5.1 Introduction 37
5.2 Materials and methods 38 Study sites and inundation history 38 Vegetation monitoring 40 Data analyses 41
5.3 Results 43
5.4 Discussion 51
Chapter 6 Wetland vegetation responses to recent Environmental 54 Contingency Allowance releases
6.1 Introduction 54
6.2 Materials and methods 55 ECA hydrology and study sites 55 Vegetation monitoring 56 Data analyses 57
6.3 Results 59 April 2007 ECA release 59 Inundation levels 59 Species richness 60 Lippia responses to inundation 61 Water couch responses to inundation 61 Functional group responses at each site 63 November 2007 ECA release 68 Inundation levels 68 Vegetation response 68
6.4 Discussion 71
Contents
Managing Lower Gwydir environmental flows iv
Chapter 7 Responses of water chemistry, fish and aquatic 74 invertebrates to flow variability in Lower Gwydir channels and floodplain waterholes
7.1 Introduction 75
7.2 Materials and methods 76 Sampling sites and timing 76 Water chemistry 76 Fish assemblages 76 Invertebrate assemblages 79
7.3 Results 79 Hydrology 79 Water chemistry – general and spatial patterns 79 Water chemistry – temporal patterns 82 Fish – assemblage composition 87
Fish – temporal variation in abundances 87 Fish – spatio-temporal patterns in assemblage 93
structure Fish – small-scale assemblage variability 93 Fish – population size structure 98 Invertebrates 104 Temporal variation in macrocrustacean abundances 106 Spatial variation in macrocrustacean abundances 106 Benthic microinvertebrates – community composition 106 Benthic microinvertebrates – spatial and temporal 106
variation in abundances
7.4 Discussion 111 Part 3 Communication, and Management implications 117
Chapter 8 Communication of project findings 118
8.1 Introduction 118
8.2 Industry and community stakeholders 118
8.3 Scientific and management audiences 119
8.4 Lower Gwydir Community Forum 120
Chapter 9 Environmental flow management and monitoring 122 in the Lower Gwydir floodplain
9.1 Introduction 123
9.2 Environmental flow design and management 123 Management tools 126
9.3 Monitoring 127 Spatial and temporal design 127 Variables 128 Institutional arrangements 130
9.4 Key areas for future research 130 Soil ecology 130 Fish population ecology 131 Effect of in-stream barriers 131 Effect of habitat structure on fish assemblages 131
References 132

Contents
Managing Lower Gwydir environmental flows v
Appendices 140
Appendix 1 Project presentations 141
Appendix 2 Project outputs and conference abstracts 145

Acknowledgements
Managing Lower Gwydir environmental flows vi
Acknowledgements The present study was funded by the Australian Government, with additional support provided by the Cotton Catchment Communities Cooperative Research Centre and the University of New England. The authors particularly thank Gayle Stewart, Bruce Gray and Ian Krebs from the Australian Government Department of the Environment, Water, Heritage and the Arts (DEWHA), and Lynda George and Kym Orman from the Cotton CRC, for their assistance with project administration and reporting, and Ian Krebs and Jennifer Martin (DEWHA) for editorial comments. No project of this nature can function successfully without the support of landholders on whose property the field sites are located. We were strongly encouraged by the cheerful willingness of Lower Gwydir landholders to allow site access, the occasional quad bike loan, assistance with use of the grazing exclosure sites, accommodation and even the occasional assistance with processing fish catches:
Bruce and Jen Southeron, “Old Dromana”; Lloyd and Bryce Wood, “Bullarah”; Sam Kirby, “Westholme” ; Howard Blackburn, “Crinolyn”; Jon Greer, ‘Birrah”; Shane Murphy, “Munwonga”; Guy Murphy, Baroona Waterhole; Rod Fulton-Kennedy, “Willowlee”; Vourn Houlahan, “Talmoi”; Joe Robinson, “Telleraga”; Stuart Boydell, “Weematong”; Fred Barlow, “Currigundi”; Gerry and John Carrigan, “Allambie”; and Phil Flemming and the Murphy family,
“Old Boyanga”. Numerous colleagues provided invaluable assistance with fieldwork, including Liz Savage and Jane Humphries (Border Rivers – Gwydir Catchment Management Authority), Jeff Kelleway, Yoshi Kobayashi and Jennifer Spencer (NSW Department of Environment, Climate Change and Water). Rob McCosker and John Duggin from Ecosystem Management at the University of New England, allowed access to past data and information about their wetland vegetation study sites, and Ian Telford from the Beadle Herbarium at the University of New England provided herbarium space and materials and assistance with plant identification. Daryl Albertson, NSW Department of Environment, Climate Change and Water, provided advice on sites, ECA flows and numerous aerial photos. Members of the Gwydir ECA Operations Advisory Committee also provided useful advice and helped frame the study in the critical management context. We also received strong support from colleagues and their organisations with funding and organising the July 2008 Lower Gwydir Community Forum, particularly Janelle Montgomery and Lauryn Hanna (NSW Department of Primary Industries), Sara Foot, Ian Schwartz, Tariful Islam, Louise McMahon and Liz Savage (Border Rivers – Gwydir Catchment Management Authority), Neil Saintilan (NSW Department of Environment, Climate Change and Water) , Richard Moxham and Donna Ironfield (Murray-Darling Basin Authority), David Aber and Mike Montgomery (Moree Plains Shire Council), Paula Jones (Cotton Catchment Communities CRC), and James Houlahan and Michael Murray (Gwydir Valley Irrigators Association). The various steering committee members and their organisations are also thanked for their support of the study, attendance at committee meetings, and feedback on project progress and outputs:
Gayle Stewart, Bruce Gray and Ian Krebs, DEWHA; Michael Murray, Gwydir Valley Irrigators Association; Jim Southeron, Lower Gwydir Water Users; Paula Jones, Cotton Catchment Communities Cooperative Research Centre; Liz Savage, Border Rivers – Gwydir Catchment Management Authority; David Ward, NSW Department of Primary Industries; Yoshi Kobayashi, NSW Department of Environment, Climate Change and Water; Neal Foster, NSW Department of Water and Energy; and Darren Ryder, University of New England.
Executive summary
Managing Lower Gwydir environmental flows vii
Executive summary The Lower Gwydir floodplain is recognised for its high-conservation value as aquatic plant and wildlife habitat. This, along with the significance of the terminal wetland areas for water bird breeding, has resulted in parts of the floodplain being included, in the late 1990s, on the List of Wetlands of International Importance under the Ramsar Convention on Wetlands. However, construction of Copeton Dam upstream in the mid 1970s and subsequent changes to the region’s irrigation, grazing and cropping industries has altered flow patterns into the wetlands and placed other pressures on the wetlands and their biodiversity values. The Gwydir Regulated River Water Sharing Plan was developed in the early 2000s, in part to counter further wetland degradation and to establish an allocation balance between consumptive and environmental needs. A broad stakeholder committee (the Gwydir Environmental Contingency Allowance Operations Advisory Committee; ECAOAC), currently administered through the NSW Department of Environment, Climate Change and Water, is the primary mechanism by which the subsequent flow allowance is used for environmental benefit. It is the overarching aim of the present study to determine the ecological responses to flow variability in the Lower Gwydir aquatic ecosystem, and to provide the ECAOAC with a model to guide the effective management of flows to maximise ecological responses in this system. The listing of wetlands on “Old Dromana”, “Crinolyn”, “Goddard’s Lease” and “Windella” with the Ramsar Convention will continue to be a major driver of delivering environmental flows into the Lower Gwydir floodplain. Objective 1. To determine the flow requirements of streams and terminal wetlands on the Lower Gwydir floodplain A review of the availability of existing aquatic ecological knowledge on the Lower Gwydir floodplain revealed relatively few data specific to this ecosystem. Most available information focused on water quality and chemical parameters, the fish and macroinvertebrate assemblages and the responses of floodplain wetland vegetation to inundation and grazing. The construction of Copeton Dam was identified as having had profound impacts on hydrological patterns in the Gwydir floodplain, with a significant reduction in flood frequency, duration and extent. Even though water quality parameters have improved considerably over the last decade, ANZECC guidelines are still frequently breached. Increases in water turbidity and nutrient levels are linked to flow events. There is little knowledge on algal and in-stream vegetation along Lower Gwydir watercourses. The high turbidity probably restricts algal and macrophyte growth to shallow areas and suitable substrate. However, the Lower Gwydir floodplain wetlands are a highly significant wetland habitat for NSW and the northern Murray-Darling Basin. Their vegetation communities are closely linked to inundation patterns, with distinct plant communities being associated with the area’s flood history. Nevertheless, the floodplain vegetation has changed profoundly since development of Copeton Dam, and additional grazing pressure also impacts the response of native wetland vegetation following inundation. Core wetland areal extent is thought to have declined by around 90%.

Executive summary
Managing Lower Gwydir environmental flows viii
Micro- and macroinvertebrates are an important component of aquatic ecosystems, although most available knowledge of these assemblages for the Lower Gwydir is limited to a comparison with similar river systems in the Murray-Darling system and several egg-bank emergence experiments. Gwydir wetlands support up to 500 macroinvertebrate species and the microinvertebrate community is comparable to other temporal wetlands in the Murray-Darling basin. The Lower Gwydir watercourses also contain at least nine native fishes, some of which are rare or endangered and of strong angling interest, and three exotic species. Changes in flow regime are thought to have been detrimental to the region’s native fishes but may have favoured the exotic species. Additionally, weirs and rock crossings are a common feature in the Lower Gwydir catchment and are thought to restrict the movement of native fish, particularly upstream. The Lower Gwydir wetlands are also home to a species-rich frog community and aquatic reptiles such as turtles and the Murray-Darling carpet snake. Conceptual models are important tools for scientific ecological studies, assisting with the development of research questions and guiding the choice of ecosystem components that need to be monitored. We constructed two separate conceptual models for in-stream and floodplain responses to flow variability to help better predict the ecological responses to flow events in the study system and to assist in the choice of ecological response variables in the field component of the study. Three ECA releases occurred during the project interval, in December 2006, April 2007 and November 2007, with the objective of wetting core wetland areas. All fieldwork from October 2006 to February 2009 was timed to allow sampling before and after these releases. In-stream ecosystem components were sampled on eleven occasions, from October 2006 to February 2009, in the Gingham Watercourse and Gwydir and Mehi rivers, while monitoring of the response of vegetation in nearby floodplain wetlands to ECA events was undertaken on seven occasions from March 2007 to April 2008. Other analyses of long-term vegetation responses to flows and herbivore grazing utilised data from a series of grazing exclosure sites, established in 1994. Some monitoring was also undertaken in a series of floodplain lagoons to the north of the Gingham Watercourse. The responses of wetland vegetation to inundation were first examined alongside the effects of herbivore grazing using data collected from May 1994 to March 2008. Inundation was found to have the greater influence on the dynamics of the wetland plant communities, and grazing was found to affect plant communities in different ways depending on the dominant plant species and antecedent soil-moisture conditions. In marsh club-rush communities, grazing resulted in a break-down of the dense canopy formed by this tall species. As a consequence, more light reached the ground and a range of other native species such as swamp buttercup and knotweeds could grow. However, in water-couch communities, grazing helped to maintain the dominance of this species by removing taller herbaceous species that shade the water-couch. The response of vegetation to flooding from individual ECA releases varied markedly depending on the season of release. The vigour of the response was far higher in summer, the time of the year when native perennial species are growing actively. Native species then successfully competed with the invasive weed lippia, leading to a reduction in lippia cover following the flow. Following an autumn release, the initial growth of key species such as water couch was halted with the onset of winter frosts. Seasonal conditions, combined with grazing of the previously flooded sites, meant that few benefits of the ECA release were evident at the beginning of the following spring.
Executive summary
Managing Lower Gwydir environmental flows ix
We measured a range of water chemistry parameters in the Lower Gwydir waterways. Our samples showed that the overall water quality was poor in the three waterways, with high nutrient and sediment loads. Flow releases for both ECA and other purposes either reduced nutrient concentrations through a dilution effect or increased concentrations. Additionally, given the higher discharge levels during releases, actual nutrient and sediment loads increased during flow events even when apparent nutrient concentrations were diluted by higher discharge. We found a total of twelve freshwater fishes in the Lower Gwydir watercourses, 3 of which were exotic species. The fish community was dominated by only a few species (bony bream, spangled perch and carp gudgeon), while most other species were only caught in low numbers. European carp was the most common exotic species, dominating the fish assemblage from a biomass perspective. There was a change in fish assemblages along an upstream-downstream gradient, with many of the less-common native species occurring predominantly in upstream sites on the three watercourses. This pattern was especially pronounced in the Gingham Watercourse. The variable hydrograph and the timing of multiple flow events in each season made it difficult to distinguish flow responses from seasonal variability in fish communities. Recruitment was observed in spangled perch, bony bream, carp gudgeon, and carp, while smaller numbers of juvenile smelt, un-specked hardyhead, and goldfish were also observed. Juveniles of other taxa such as golden perch, eel-tailed catfish, and Murray cod were present only in low abundances. Pulsed flow events (including ECA releases) did not result in a consistent response of fish assemblages, and responses varied between rivers and seasons. The lack of a clear response of fishes to flow releases suggests that factors other than recent hydrology may be determining fish assemblages in Lower Gwydir waterways. The lack of a clear response of Lower Gwydir fish assemblages to the ECA flow events may reflect a less important role of minor flow events on fish recruitment in these river systems or may in part reflect the hydrological characteristics of recent ECA releases. The benthic invertebrate community comprised over 70 taxa, with rotifers and microcrustacea being the most speciose groups. At the temporal scale of our sampling, flow variability appeared to only explain part of the variation in the invertebrate community composition of the Lower Gwydir River. Similar to fish, we could not detect a consistent response to flow releases in macrocrustacean (shrimp and yabby) abundances, and both temporal and spatial abundances did vary widely between the three study channels. Management recommendations
Delay grazing or maintain low stocking rates during the initial stage of wetland flooding to allow fragile plant species in the amphibious responder functional group to flower and set seed.
Maintain conservative cattle stocking rates (0.3-0.5 animals per hectare) to protect key native species from over grazing.
The spatial extent of impact of an ECA flow on wetland vegetation and the duration of flooding are likely to be maximised when ECA releases follow a natural flood event.
Continue to include event-based vegetation monitoring in any reporting of ecological outcomes from Lower Gwydir ECA releases. Include the four sets of grazing-exclosure plots in this schedule. Future monitoring of vegetation responses to ECA flows should include quantifying changes in biomass as well as percent foliar cover.
Include event-based in-stream monitoring in relation to reporting ecological outcomes from future Lower Gwydir ECA releases.
Executive summary
Managing Lower Gwydir environmental flows x
Recognise that ecological responses to flow events will likely differ seasonally. Although significant flood events have occurred in winter in the Lower Gwydir floodplain, the region has a summer-dominant rainfall pattern and the timing of future ECA events should match this whenever possible.
Objective 2. To develop recommendations for future flow management, monitoring indicators, and institutional arrangements for the Lower Gwydir aquatic ecosystem ECA releases throughout the study period were of a limited and relatively stable stage height, designed to deliver the volume anticipated necessary to inundate the core wetland and to minimise losses onto the floodplain upstream of the target area(s). This may have limited the in-channel responses of some water chemistry parameters and faunal assemblages. Expectations of what ecological responses might be achieved by future ECA releases into the Lower Gwydir floodplain will need to be realistic. It may be necessary to consider a multi-release program to satisfy as many ecological objectives as possible. ‘Piggy-backing’ ECA flows on transfers for stock and domestic or irrigation purposes might be an effective strategy for facilitating multiple releases of differing stage height. Where an ECA release is made to benefit core wetland areas, attempts should be made to maximise the duration of floodplain inundation. Again, the best means of achieving this in the Lower Gwydir appears to be through piggy-backing releases onto natural flow events. The variable nature of dryland river ecology means that data sets longer than the present 3-year study will be essential if we are to fully appreciate the responses of the Lower Gwydir ecosystem to managed releases or flow variability more generally. Future monitoring should include measurement of responses to individual ECA events, but also provide data from a longer sequence of varying seasonal and discharge conditions. Such a program should be structured in an event-based way but also allow for monitoring of low-flow and winter periods away from the usual spring-summer interval of higher flows. It will be critical that any future monitoring program be able to account for likely differences in temporal scale of response among biotic or other variables, as not all responses will be adequately detected by a single monitoring sequence. It may be necessary to monitor different variables at varying temporal scales, from days to weeks or months following the onset of a flow event. It will also be necessary to include a careful array of reference/control sites away from the target of any future ECA flows. It is recommended that monitoring of the present suite of water chemistry parameters be continued. As wetland vegetation seems likely to remain a key ecological objective for ECA releases, future Lower Gwydir monitoring should include these assemblages and the series of UNE grazing-exclusion plots. In addition, it is recommended that further investigations examine the impact of flooding frequency on soil condition and the response of floodplain soils to wetting and drying, and to establish monitoring protocols for soil chemistry and biology. While we also recommend monitoring of fish be continued in Lower Gwydir channels, it is vital that this facilitate a stronger understanding of the lifehistory of key fishes within the Lower Gwydir ecosystem and we suggest that monitoring include responses such as spawning activity. The effect of in-stream barriers on Lower Gwydir fish assemblages also needs to be established. In order to maintain the current momentum of research on the Lower Gwydir aquatic ecology, and to meet the invariable longer-term requirements of any monitoring program, we recommended that formal collaborative partnership arrangements be established between

Executive summary
Managing Lower Gwydir environmental flows xi
research organisations and management agencies. There also remains a clear need to establish a repository of long-term ecological data on the Lower Gwydir aquatic ecosystem. Management recommendations
Expectations of what ecological responses might be achieved by a particular release need to be realistic. Any one release is unlikely to satisfy the hydrological requirements of all aquatic biota or ecosystem components.
It may be necessary to establish a more variable hydrograph for ECA releases, in order to satisfy as many ecological objectives as possible.
‘Piggy-backing’ ECA flows on bulk releases for stock and domestic or irrigation purposes may be an effective strategy for facilitating multiple releases of differing stage height. However, the delivery point(s) for these flows and the channel reaches where the ecological outcomes are desired would need to match. Moreover, it will be necessary to establish whether there is significant loss of ecological responses (e.g. larval fish) through abstraction of the associated consumptive flows.
Recognise that ecological responses to flow events will likely differ seasonally. Although significant flood events have occurred in winter in the Lower Gwydir floodplain, the region has a summer-dominant rainfall pattern and the timing of future ECA events should match this whenever possible.
ECA events should also maximise the duration of wetland inundation. The best means of achieving this in the Lower Gwydir appears to be through piggy-backing releases onto natural flow events.
Continue to include event-based monitoring of both in-stream and floodplain wetland environments in relation to reporting ecological outcomes from Lower Gwydir ECA releases. Long-term data sets will be necessary to adequately determine the extent to which Lower Gwydir aquatic populations fluctuate in response to seasonal, hydrological and structural habitat factors. Prioritise the collection of data on water chemistry, fish populations, wetland vegetation and waterbird assemblages.
Continue monitoring of the grazing exclosures, and promote their protection and benefits to relevant landholders.
Ensure that future monitoring be undertaken at a temporal scale relevant to the monitored parameters, and that it includes independent control areas.
Ensure close communication between the ECAOAC and any research or agency staff directly involved in future monitoring and research activities.
Establish a central repository of long-term ecological data on the Lower Gwydir wetlands ecosystem.
Ensure that data and other scientific information is made available in a timely manner to inform management plans and adaptive management processes. This may include, for example, incorporation into decision support tools such as ecosystem response models, modification of spatial and temporal monitoring and data collection techniques, or improved management practices to support species such as fish and waterbirds.
Support future research on the response of wetland soils to inundation and their role in supporting wetland condition and function.
Support future research on the population ecology of fish, particularly the effect of flow variability on early growth and body condition.
Establish the effects of in-stream barriers on Lower Gwydir fish assemblages.
Establish whether Lower Gwydir fish assemblages vary with structural habitat within and between channels.

Executive summary
Managing Lower Gwydir environmental flows xii
Objective 3. To provide managers of the Gwydir Regulated River ECA and other river flows into floodplain terminal wetlands with a model guiding the effective management of flows to maximise environmental outcomes During the study interval, ECA releases were made during spring-summer and late autumn, and we summarised anticipated responses of fish and wetland/floodplain vegetation to releases in these two broad periods. Spring-summer releases are expected to generally produce greater cover of amphibious plants and flowering and seed setting, although reduced cover of terrestrial species. Some amphibious species may partially outcompete weed species such as lippia. Releases during this time would be expected to produce a moderate to strong recruitment response in a range of fish species, although this may include European carp. By contrast, releases during autumn to early winter are expected to produced more limited increases in the cover of amphibious plants although without significant flowering or seed setting. Fish recruitment responses are also likely to be limited at this time of year. Terrestrial plant species are likely to benefit more from releases in autumn-winter than in spring-summer. This information should be considered in the finalisation and implementation of the Gwydir Wetlands Adaptive Environmental Management Plan and Gwydir Wetlands Decision Support System. Management recommendations
Take seasonal differences in ecological response to flow events into account when planning annual ECA release schedules.
Ensure that the Gwydir Environmental Management Plan and the Gwydir Wetlands Decision Support System software both incorporate the latest scientific findings on Lower Gwydir aquatic ecological responses to flow variability.

Managing Lower Gwydir environmental flows 1
Part 1 Introduction, scoping review, conceptual model and field program design

General introduction
Managing Lower Gwydir environmental flows 2
Chapter 1 General introduction Agricultural floodplain landscapes across the Murray-Darling Basin are increasingly being recognised for their biodiversity potential (e.g. Morton et al., 2002; Smith & Pritchard, 2003). One such region, the Lower Gwydir valley, comprises an extensive floodplain with multiple distributary stream channels and terminal wetlands of national importance. These wetlands include four ‘sub-sites’ listed under the Ramsar Convention, and are noted as critical waterbird breeding areas for eastern Australia (Kingsford, 2000). The development of irrigated agriculture in the Gwydir Valley over the past 30 years (Keyte, 1994; McCosker et al., 1999) has significantly affected flow patterns into these key wetlands. The Gwydir Valley is one of the largest cotton-growing regions in Australia, and also contains extensive development of grazing and dryland cropping enterprises. Regulation of flows to the Lower Gwydir floodplain began in 1972 and has continued with the subsequent completion of Copeton Dam on the Gwydir River in 1976. A major driver for this was securing the supply of water for floodplain irrigation, stock and domestic uses downstream. Today, prominent industries on the Lower Gwydir floodplain include irrigated cropping, cattle and sheep grazing, and the farming of grain crops such as wheat, barley and sorghum. Water resources development in the lower catchment, and associated construction of levees and numerous supply or diversion channels, has caused major challenges with supplying water to downstream floodplain areas, including the various channel systems, floodplain waterholes and wetlands.
The Water Sharing Plan (WSP) for the Gwydir Regulated River Water Source established a planned environmental water rule that sets aside an Environmental Contingency Allowance (ECA) of up to 45,000 ML in Copeton Dam. This allows for environmental flow releases into the Lower Gwydir floodplain. A stakeholder operations advisory committee, comprising industry, scientific, conservation, agency and Catchment Management Authority representation, provides advice to the NSW Department of Environment, Climate Change and Water on the timing, rate and duration of ECA releases. Such releases are implemented to achieve a set of nine ecological objectives (NSW DIPNR, 2005a), namely:
1. To support a colonially nesting native bird breeding event that has been initiated in the Gwydir wetlands following natural flood inundation;
2. To provide additional inundation in the Gingham and Lower Gwydir Wetlands during or following periods of extended dry climatic conditions;
3. To provide inundation of higher level benches in the river reaches between Copeton Dam and the Gwydir river at Gravesend;
4. To provide short-term inundation of the wetlands to promote germination of Hyacinth as part of a weed management strategy involving a wetting and drying cycle;
5. to provide environmental flows along downstream effluent streams; 6. to support native fish populations and habitats;

General introduction
Managing Lower Gwydir environmental flows 3
7. to support invertebrates and other aquatic species; 8. to support threatened species; and 9. to maintain aquatic ecosystem health.
In order for ECA releases to occur in a scientifically defensible manner, the ECA committee requires sound information on the downstream aquatic responses to flow variability in this ecosystem. While preliminary work has assessed macroinvertebrate and vegetation responses to flows within the wetland ecosystem, there is no concise model that can be used to predict the likely outcome of ECA releases for a broader range of ecosystem components and processes. Very little information is currently available on ecological responses to flow variability within channels such as the Lower Gwydir River, Mehi River or Gingham Watercourse. While industries across this landscape continue to grapple with incorporating environmental values into on-farm planning, extensive debate about the water sharing arrangements in the valley has highlighted the lack of research on the aquatic ecosystems of the region. To this end, the present project was initiated to guide industry, managers and the community on how to maximise environmental flow benefits on the Lower Gwydir floodplain. The objectives of this project are:
1) To determine the flow requirements of streams and terminal wetlands on the Lower Gwydir floodplain (chapters 2–7);
2) To develop recommendations for future flow management, monitoring indicators, and institutional arrangements for the Lower Gwydir aquatic ecosystem (chapter 9); and
3) To provide managers of the Gwydir Regulated River ECA and other river flows into floodplain terminal wetlands with a model guiding the effective management of flows to maximise environmental outcomes (chapter 9). The project was structured into four discrete stages, namely (1) review of existing knowledge and development of a communication plan, (2) conceptual model development and design of field sampling program, (3) field program, and (4) final reporting. Wherever possible, we took the approach of examining ecological responses to flows at two temporal scales. Analyses of responses by wetland vegetation, fish and in-stream water chemistry are all examined in relation to individual ECA releases as well as over longer timeframes from months (fish, water chemistry) to years (vegetation). While much of our focus was on responses to ECA releases, we acknowledge that a thorough understanding of aquatic ecological responses to flows in this valley will require similar analyses of natural flood events.

Existing ecological knowledge
Managing Lower Gwydir environmental flows 4
Chapter 2 Review of existing ecological knowledge of the Lower Gwydir aquatic ecology
2.1 Introduction The Lower Gwydir floodplain wetlands are a high conservation-value aquatic ecosystem in north-western New South Wales (Kingsford, 2000). However, despite the number of past studies on various aspects of these wetlands, there are few qualitative or quantitative scientific data available, including relationships between ecosystem function or biotic integrity and flow variability. Past reports focus mainly on three aspects of the wetland ecology, namely water quality issues, wetland flora and water birds. Apart from fishes, there is little information on other faunal components. Other important components of the ecosystem that form the base of most aquatic food webs (algae, micro- and macroinvertebrates) are hardly described at all, probably either due to reasons of taxonomic or technical difficulties or a general lack of interest in these groups. Furthermore, there is little knowledge on possible impacts of the extensive hydrological alteration that the Gwydir River ecosystem has experienced, with the exception of changes in plant and water bird communities. This chapter provides an overview of the current knowledge of the ecology of the Lower Gwydir wetlands. We are aware that this review is by no ways exhaustive and does not contain all available information on the Lower Gwydir wetlands. The large amount of ‘grey literature’ is often difficult to locate, often due to organisational changes in stakeholder groups or agencies. However, we provide a representative overview of what is known (and especially what is not known) of the Lower Gwydir wetlands and their ecological components.
2.2 Hydrology and water quality Rainfall seasonality and Hydrology. The Gwydir valley experiences a summer-dominant rainfall pattern, with more than 60% of the annual rainfall received between November and March (ANRA, 1995; McCosker et al., 1999). During this time, rainfall is received from summer thunderstorms while the southward movement of tropical rain depressions from Queensland can result in heavy rainfalls and cause significant floods. A shorter wet period may also occur in June and July, when approximately 15% of the annual rainfall is received (McCosker et al., 1999). This winter rainfall can also cause flooding such as in 1998 (McCosker, 1999). However, flooding at this time of the year occurs less frequently than in summer. Spatial patterns of mean annual rainfall vary throughout the Gwydir catchment, increasing towards western end of the wetlands (BOM, 2007; Keyte, 1994), and so flooding of the Lower Gwydir floodplain is dependent upon flows from middle and upper regions of the catchment.

Existing ecological knowledge
Managing Lower Gwydir environmental flows 5
Across the Lower Gwydir floodplain, mean annual rainfall varies from less than 450 mm to the west to 585 mm around Moree to the east. However, construction of the 1,364,000 ML Copeton Dam in 1976 and the subsequent expansion of irrigated agriculture downstream has considerably altered flow and hydrological patterns into most Lower Gwydir channels (Mawhinney, 2003; Schalk, 2006). Copeton Dam regulates approximately 55% of inflow into the Gwydir River (Keyte, 1994), and re-regulating structures at Tareelaroi, Boolooroo and Tyreel divert flows from the Gwydir River into the Mehi River, Carole Creek and Lower Gwydir River/Gingham Watercourse, respectively. Recent analyses of observed and modelled daily flow data have shown the Gwydir to be one of the most flow-altered rivers in the northern Murray-Darling region (Sheldon et al. 2000; Growns 2008). There has been a decrease in the frequency and magnitude of flooding in the wetlands (Keyte, 1994). The frequency of moderate and large (and zero flow) events has decreased, while the percentage of flows of <100 GL per annum has more than doubled (Sheldon et al. 2000). Mean annual flow at the Yarraman bridge gauging station has fallen from 610 GL in an unregulated situation to 116 GL in 1993/94 (McCosker et al., 1999). River regulation has also altered patterns of flow seasonality in the Gwydir River. For example, rises in winter flow have disappeared (McCosker et al., 1999). Under pre-development conditions, the core wetland areas were flooded 17% of the time over 93 years, but now flooding occurs only 5% of the time due to diversions and a 70% reduction in flows large enough to reach the Gwydir wetlands (Keyte, 1994; Kingsford, 2000). Furthermore, since the development of irrigated agriculture in the region, the amount of water harvested from unregulated flows (off allocation access) has also risen. The main impact of Copeton Dam has been the reduction in major flood events that would otherwise inundate extensive areas of the Lower Gwydir floodplain, a reduction in river flows during non irrigation times and a higher than usual flow in times of irrigation water delivery (Bennett & Green, 1993; Montgomery & Faulkner; Schalk, 2006). Small unseasonal floods are typical for regulated rivers in the Murray-Darling catchment (Chong & Ladson, 2003). Water quality. Water quality data available for the Gwydir River catchment have mainly been summarised in two recent reports by the NSW Department of Infrastructure, Planning and Natural Resources (NSW DIPNR, 2002; Mawhinney, 2005). Research has also examined the impact of the irrigation industry on water quality in Gwydir watercourses (Montgomery & Faulkner, 2002). There are also data scattered through a multitude of reports on various aspects of the Gwydir catchment. All these are summarised in the following sections of this document. As there is only anecdotal information available on the water quality in the Gwydir catchment prior to intensification of agriculture, we can only speculate on the overall changes in water quality in a historical context. Data from the above-mentioned reports date back to the early 1990s, and so temporal analyses of water quality focus on the past 15 years. The NSW Department of Water and Energy and its predecessors monitored water quality parameters in 20 sites within the Gwydir catchment. As this review focuses on the Lower Gwydir floodplain and associated wetlands we will concentrate on four selected sampling stations, namely the Gwydir River at Gravesend (above major irrigation abstraction), the Gwydir River at Yarraman, the Mehi River at Moree (main area of irrigation), and the Mehi River at Bronte as a comparison site at the end of the catchment. Water quality guidelines for healthy water for the environment, domestic and irrigation use are laid down by the Australian and New Zealand guidelines for fresh and marine water quality (ANZECC & ARMCANZ, 2000). Since construction of Copeton Dam in the upper reaches of the Gwydir River, the
Existing ecological knowledge
Managing Lower Gwydir environmental flows 6
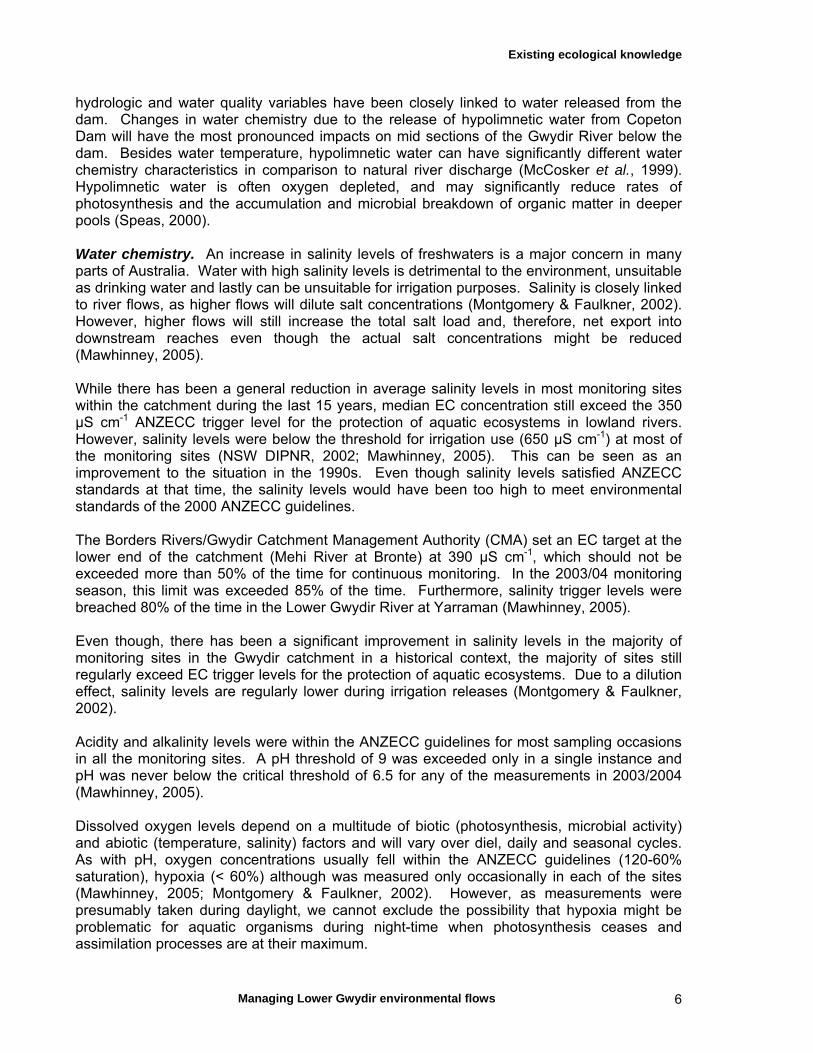
hydrologic and water quality variables have been closely linked to water released from the dam. Changes in water chemistry due to the release of hypolimnetic water from Copeton Dam will have the most pronounced impacts on mid sections of the Gwydir River below the dam. Besides water temperature, hypolimnetic water can have significantly different water chemistry characteristics in comparison to natural river discharge (McCosker et al., 1999). Hypolimnetic water is often oxygen depleted, and may significantly reduce rates of photosynthesis and the accumulation and microbial breakdown of organic matter in deeper pools (Speas, 2000). Water chemistry. An increase in salinity levels of freshwaters is a major concern in many parts of Australia. Water with high salinity levels is detrimental to the environment, unsuitable as drinking water and lastly can be unsuitable for irrigation purposes. Salinity is closely linked to river flows, as higher flows will dilute salt concentrations (Montgomery & Faulkner, 2002). However, higher flows will still increase the total salt load and, therefore, net export into downstream reaches even though the actual salt concentrations might be reduced (Mawhinney, 2005). While there has been a general reduction in average salinity levels in most monitoring sites within the catchment during the last 15 years, median EC concentration still exceed the 350 μS cm-1 ANZECC trigger level for the protection of aquatic ecosystems in lowland rivers. However, salinity levels were below the threshold for irrigation use (650 μS cm-1) at most of the monitoring sites (NSW DIPNR, 2002; Mawhinney, 2005). This can be seen as an improvement to the situation in the 1990s. Even though salinity levels satisfied ANZECC standards at that time, the salinity levels would have been too high to meet environmental standards of the 2000 ANZECC guidelines. The Borders Rivers/Gwydir Catchment Management Authority (CMA) set an EC target at the lower end of the catchment (Mehi River at Bronte) at 390 μS cm-1, which should not be exceeded more than 50% of the time for continuous monitoring. In the 2003/04 monitoring season, this limit was exceeded 85% of the time. Furthermore, salinity trigger levels were breached 80% of the time in the Lower Gwydir River at Yarraman (Mawhinney, 2005). Even though, there has been a significant improvement in salinity levels in the majority of monitoring sites in the Gwydir catchment in a historical context, the majority of sites still regularly exceed EC trigger levels for the protection of aquatic ecosystems. Due to a dilution effect, salinity levels are regularly lower during irrigation releases (Montgomery & Faulkner, 2002). Acidity and alkalinity levels were within the ANZECC guidelines for most sampling occasions in all the monitoring sites. A pH threshold of 9 was exceeded only in a single instance and pH was never below the critical threshold of 6.5 for any of the measurements in 2003/2004 (Mawhinney, 2005). Dissolved oxygen levels depend on a multitude of biotic (photosynthesis, microbial activity) and abiotic (temperature, salinity) factors and will vary over diel, daily and seasonal cycles. As with pH, oxygen concentrations usually fell within the ANZECC guidelines (120-60% saturation), hypoxia (< 60%) although was measured only occasionally in each of the sites (Mawhinney, 2005; Montgomery & Faulkner, 2002). However, as measurements were presumably taken during daylight, we cannot exclude the possibility that hypoxia might be problematic for aquatic organisms during night-time when photosynthesis ceases and assimilation processes are at their maximum.
Existing ecological knowledge
Managing Lower Gwydir environmental flows 7
Turbidity and sediments. The probable increase in turbidity due to changes in land management practices since European settlement, and subsequent flow regulation following construction of Copeton Dam is likely to have had a pronounced effect on sedimentation rates in the Lower Gwydir wetlands. Keyte (1994) reported extensive trapping of sediments in the dam in 1972 and pointed out that the generally high sediment loads delivered to the wetlands might be responsible for the low incidence of open water in the Gwydir floodplains (Keyte, 1994). Nevertheless, it is likely that Copeton Dam has also trapped a significant sediment load that would have otherwise been transported into at least the middle reaches of the catchment. As in most Australian lowland rivers, turbidity is a natural feature of the Lower Gwydir River system, caused by suspended clay particles. There tends to be a downstream increase in turbidity due to cumulative effects of soil erosion in the catchment and localized riverbank and channel erosion (McCosker et al., 1999). Irrigation releases from Copeton Dam can have steep ascending and descending limbs of their hydrograph, potentially intensifying channel erosion, destabilising riverbanks, and increasing water turbidity. Moreover, higher sediment loads can alter sedimentation rates in areas of sediment deposition. The increase in turbidity can have multiple environmental effects, including a decrease in water temperature, changes in water chemistry and nutrient loads (Guy & Ferguson, 1970), loss in primary production due to shading, reduction in foraging success of fish (decrease in visibility) (Miner & Stein, 1993), and interference of suspended material with the respiratory organs of fish and invertebrates (Berkman & Rabeni, 1987; Ryan, 1991). McCosker (1998) identified erosion issues in the Gingham Watercourse, with landholders recognising this as a priority management issue. The steeper gradient in the eastern part of the Gingham Watercourse seems to result in greater erosion rates and a deepening of the channel. This, in turn, prevents spill-over of water at flows that would previously have been sufficient to produce overland flows and provide wetlands with vital water (McCosker, 1998). Some of the problems have been remedied since construction work on the Gingham Watercourse. Similar to salinity, turbidity is closely linked to river flow. For most of the measuring stations, there was a pronounced reduction in median turbidity levels between 2001-2004, as compared to the 1990s (Mawhinney, 2005). Besides interannual fluctuations in turbidity levels, there are rises in turbidity levels during irrigation periods (Montgomery & Faulkner, 2002). Furthermore, turbidity levels seem highest during times of pre-watering of irrigation fields. Turbidity levels frequently breach ANZECC guidelines during the irrigation and pre-watering season. During low-flow periods outside the irrigation season, turbidity is usually below ANZECC trigger levels (Montgomery & Faulkner, 2002). Turbidity levels varied between monitoring sites, with turbidity levels remaining below the ANZECC trigger levels for the Gwydir River at Gravesend and Yarraman, and the Mehi River at Moree. However, at the downstream end of the system, turbidity levels frequently exceed ANZECC guidelines for lowland rivers at the Mehi River site at Bronte (Mawhinney, 2005). Anecdotal evidence suggest that turbidity levels may have been considerably lower in most parts of the Gwydir River system prior to agricultural intensification as witnesses recall being able to see the bottom of even deep waterholes in the Gwydir River and being able to observe fish behaviour in the clear water (Copeland et al., 2003). An increase in turbidity and sediment load with land use and climate change is a well documented phenomenon in other Australian systems (Leahy et al., 2005; Lu, 2005). Nutrients. High nutrient loads in Copeton Dam potentially affect nutrient concentrations in water in the Lower Gwydir channels. Bennett (1996) reported elevated phosphorus levels in

Existing ecological knowledge
Managing Lower Gwydir environmental flows 8
Copeton Dam and points out a correlation between phosphorus levels in the Gwydir and discharge events from Copeton Dam (Bennett, 1996; McCosker et al., 1999). Increased nutrient loads are often associated with blooms of blue-green algae and changes in species composition of plankton and macrophyte communities (Dent et al., 2002). There was no major change in nutrient concentrations in the majority of sites between the 1990s and the 2003/2004 monitoring season (Mawhinney, 2005). Most median phosphorus concentrations at sampling stations were close to or exceeded the ANZECC trigger value in lowland rivers (0.05 mg L-1) and were not limiting to algal growth (Mawhinney, 2005). Total phosphorus and nitrogen concentration exceeded ANZECC guidelines in the majority of sampling occasions. Nutrient loads are frequently higher during irrigation and pre-watering times (Montgomery & Faulkner, 2002) while meeting ANZECC standards in the non irrigation seasons. This increased nutrient load during the irrigation season is presumably a result of higher flow events associated with increased runoff and probably intensified fertilizer use during the growing season. This could also reflect the release of nutrient enriched water from Copeton Dam during irrigation season as concentrations of total nitrogen are also elevated in the Gwydir River upstream of the main irrigation areas (Montgomery & Faulkner, 2002). There was, however, a pronounced increase in the phosphorus loading downstream of the irrigation areas. Phosphorus is frequently the limiting factor preventing algal growth, and this could potentially generate future problems with algal blooms in the system. The Lower Gwydir floodplain wetlands function as a natural nitrogen sink, as nitrogen loads decrease towards the lower end of the floodplain (Montgomery & Faulkner, 2002). Wetlands are often seen as effective natural nutrient sinks (Mitsch & Gosselink, 2000). Pesticides. Overall, the incidence and concentration of pesticides appears to have decreased in Lower Gwydir water samples over the last 10-15 years (Mawhinney, 2005). No pesticides were detected in the Gwydir River at Gravesend in 2001/2002, although herbicides were detected at the Gwydir River at Yarraman (NSW DIPNR, 2002). Insecticides and excessive levels of atrazine were encountered in all three monitoring sites at the end of the catchment, including the Mehi River at Bronte. Several pesticides were common in samples in 1991/92 as reported by Keyte (1994). Furthermore, during storm events, extremely high pesticide concentrations were observed (Keyte, 1994), with endosulfan reaching toxicity levels for fish. Concern was raised at the possibility of an accumulation of pesticides in the terminal wetlands that act as a sediment sink. Sampling at Brageen Crossing in 1992/93 detected two insecticides and five herbicides, with endosulfan being the most frequently detected pesticide (60% of all samples) (Keyte, 1994). The number of samples contaminated with pesticides decreased significantly between 1991 and 2004, possibly result of improved management practices. However, all the monitored pesticides are still occasionally detected (Mawhinney, 2005). Furthermore, even though median atrazine levels are well below ANZECC levels, occasionally there are excessive levels. These high concentrations of atrazine are still of concern and might negatively affect the aquatic ecosystem.
2.3 Algae and in-stream vegetation We are not aware of scientific information regarding algal growth and instream vegetation in the Lower Gwydir channels. Considering the turbidity of the rivers and the shading by

Existing ecological knowledge
Managing Lower Gwydir environmental flows 9
riparian vegetation by eucalypt and river cooba trees, submerged macrophytes are unlikely to be abundant and will be restricted to the edges of river channels. Species such as Valisneria, Ludwigia and Typha are known to occur in some channel areas such as the downstream reaches of the Gingham Channel. Additionally, the floating macrophyte water hyacinth (Eichhornia crassipes) is common in the open sections of the Gingham Watercourse and associated water holes. There is no information available on the phytoplankton community in the Lower Gwydir streams, although it might be similar to the Murray River that is characterised by cyanobacteria blooms in summer and diatoms in winter and spring (Shiel et al., 1982). Phytoplankton biomass is sparse, as a result of the high turbidity. Attached algal growth in the Lower Gwydir floodplain will be restricted to suitable substrates such as coarse woody debris or areas of consolidated bank and again by light availability within the photic zone (Burns & Walker, 2000; Sheldon & Walker, 1997). We would expect that heterotrophic biofilms would predominate in large parts of the Lower Gwydir catchment due to turbidity and, thereby, low light availability for photosynthesis (Burns & Ryder, 2001). In the Murrumbidgee floodplain, high flow events affect species diversity and biomass of biofilm, and environmental flow releases have direct impacts on instream productivity (Ryder et al., 2006). Autotrophic biofilm production is an important energy source for higher trophic levels in floodplain rivers (Thorp & Delong, 2002). Water velocity directly affects biofilms through scour, and hence shapes benthic algal communities and functions (Peterson & Stevenson, 1992). Disturbance by flooding is one of the most important regulators of spatio-temporal variability in benthic communities in streams (Davis & Barmuta, 1989). As velocity and scour increase with increased flow, environmental flows should attempt to maximise biofilm productivity and biodiversity. Additionally, biofilms are ideal bioindicators to assess effectiveness of management due to the short generation time, sessile nature and responsiveness to environmental conditions and standardised methodologies for monitoring biofilms (Burns & Ryder, 2001).
2.4 Floodplain vegetation The Lower Gwydir Valley floodplain comprises 220,000 ha of wetland and floodplain woodlands (Bennett & Green, 1993). Approximately 82% of this area is dominated by coolibah woodlands. The remaining area, due to its flat terrain and comparatively low elevation is subject to extensive shallow flooding. The period of inundation in these areas may last for several weeks or even months. These intermittent and semi-permanent wetlands occupy an area of approximately 24 000 ha. The dominant vegetation type is water couch (Paspalum distichum) in association with various species of rushes (Eleocharis sp.). In the wettest parts of the floodplain, marsh club rush (Bulboshoenus fluviatilis) occurs in large stands (Bennett & Green, 1993). The largest stand of 600 ha is believed to be the largest stand in New South Wales (Keyte, 1994). Vegetation patterns. A baseline vegetation survey conducted by the University of New England established that the extent, floristic composition and community structure of vegetation on the Lower Gwydir floodplain is strongly linked to the elevation and pattern of inundation over time (McCosker et al., 1993). As part of this survey, seven land units were identified across the floodplain, and these were then grouped into three main classes based on their elevation and associated pattern of inundation. The main classes were:
Watercourse: Core wetland and watercourse land units;
Existing ecological knowledge
Managing Lower Gwydir environmental flows 10
Low floodplain: Flood channel, sand monkeys and floodplain land units; and High Floodplain: High floodplain and ridge land units.
The “watercourse” lies in close proximity to the end of the Lower Gwydir River channel and traditionally this area was inundated on an almost annual basis (Table 2.1). On grey clay soils, water couch (Paspalum distichum), tussock rush (Juncus aridicola) and ribbed spike rush (Eleocharis plana) are the dominant species. On black soils at the end of the Lower Gwydir sediment delta, marsh club rush (Bulbshoenus fluviatilis) is found in two large stands, the largest being 600 ha on “Old Dromana” (Keyte, 1994). Dead coolibahs (Eucalyptus coolabah) are a feature of these low lying sections of the floodplain. Their death has been linked to prolonged inundation following floods in 1955 and the 1970s, and compounded in the 1970s by major water releases from Copeton Dam during modifications to the spillway (Keyte, 1994). The “low floodplain” is slightly higher in elevation and experiences less frequent inundation than the watercourse area (Table 2.1). Water flows into this area during moderate floods, usually about one in every four years. Soils tend to be predominantly heavy, self-mulching, cracking grey clays. Coolibah woodlands are the dominant vegetation community with a sparse understorey of lignum (Muehlenbeckia florulenta) and a groundcover of Warrego summer-grass (Paspalidium jubilflorum). In the water channels that cut across the low floodplain river cooba (Acacia stenophylla) and lignum grow along the banks (McCosker & Duggin, 1992). The “high floodplain”, due to its elevation is infrequently inundated (Table 2.1). Because inundation in these plant communities is so rare, they are not considered as a floodplain ecosystem (Keyte, 1994). The vegetation occurring in these areas appears to be strongly associated with soil type. Red duplex soils occur at the highest elevation and poplar box (Eucalyptus populnea) is the dominant overstorey species, with a mixed sub-stratum of wilga (Geijera parviflora), white cypress pine (Callitris glaucophylla), leopard wood (Flindersia maculosa), with whitewood (Atalaya hemiglauca) and rosewood (Heterodendrum oleifolium) occurring on soils with slightly finer texture. Ground flora is normally sparse and comprises spear grass (Stipa sp.), windmill grass (Chloris truncata) and annual forbs (McCosker & Duggin, 1992). In areas with grey clay soils, coolibah, myall (Acacia pendula) and briar (Acacia farnesiana) occur forming open woodland communities. Belah (Casuarina cristata) is commonly found interspersed with coolibah. Ground cover comprises Queensland blue-grass (Dichanthium service) and curly windmill-grass (Enteropogon acicularis) though increasingly these perennial grasses are being replaced by annuals and naturalised Medicago species (Keyte, 1994). Impacts of flooding and altered flow regime on wetland vegetation. The changes to the natural hydrological regime are thought to have placed considerable pressure on plant communities of the Lower Gwydir wetlands that have evolved under a regime of more frequent and longer lasting periods of inundation. Changes in the flow regime are believed to have two major impacts on these wetlands. Firstly, the abundance of plants more commonly found in true terrestrial assemblages is increasing in many wetland plant communities; and secondly, some introduced plant species such as lippia (Phyla canescens) are spreading at an alarming rate as they appear to cope more successfully than native species under environmental conditions associated with the altered flow regime.
Existing ecological knowledge
Managing Lower Gwydir environmental flows 11
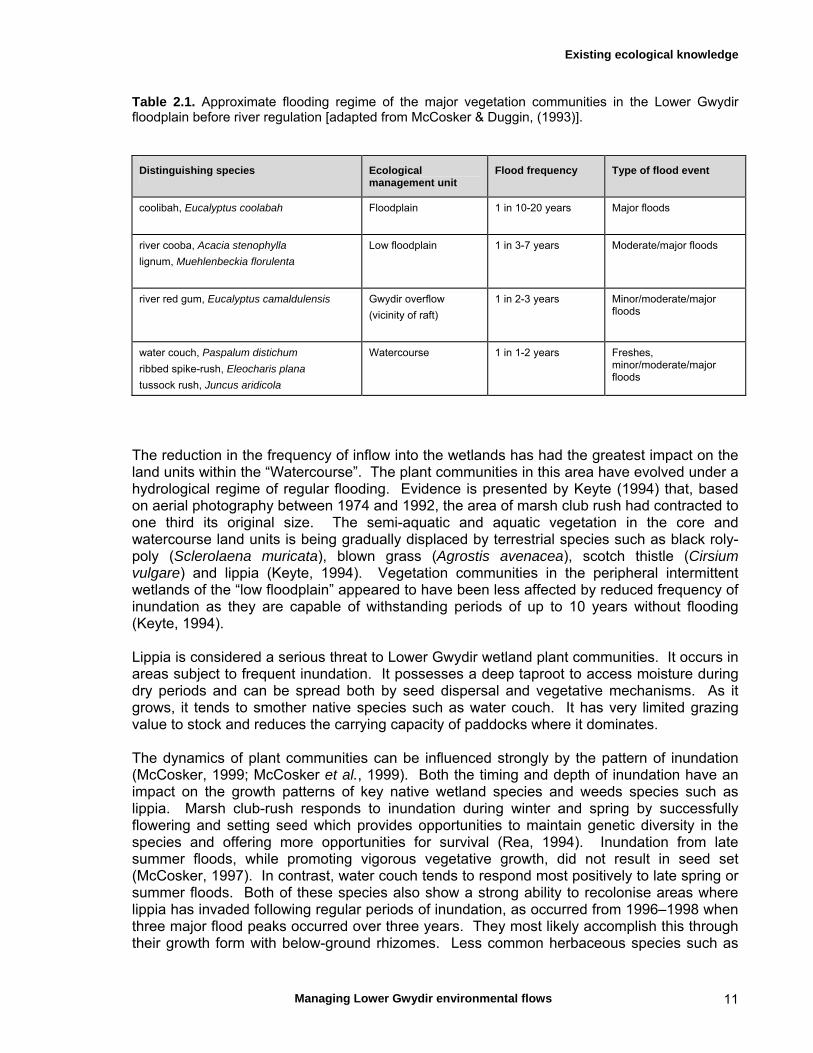
Table 2.1. Approximate flooding regime of the major vegetation communities in the Lower Gwydir floodplain before river regulation [adapted from McCosker & Duggin, (1993)].
Distinguishing species Ecological management unit
Flood frequency Type of flood event
coolibah, Eucalyptus coolabah
Floodplain
1 in 10-20 years Major floods
river cooba, Acacia stenophylla
lignum, Muehlenbeckia florulenta
Low floodplain
1 in 3-7 years Moderate/major floods
river red gum, Eucalyptus camaldulensis Gwydir overflow
(vicinity of raft)
1 in 2-3 years Minor/moderate/major floods
water couch, Paspalum distichum
ribbed spike-rush, Eleocharis plana
tussock rush, Juncus aridicola
Watercourse 1 in 1-2 years Freshes, minor/moderate/major floods
The reduction in the frequency of inflow into the wetlands has had the greatest impact on the land units within the “Watercourse”. The plant communities in this area have evolved under a hydrological regime of regular flooding. Evidence is presented by Keyte (1994) that, based on aerial photography between 1974 and 1992, the area of marsh club rush had contracted to one third its original size. The semi-aquatic and aquatic vegetation in the core and watercourse land units is being gradually displaced by terrestrial species such as black roly-poly (Sclerolaena muricata), blown grass (Agrostis avenacea), scotch thistle (Cirsium vulgare) and lippia (Keyte, 1994). Vegetation communities in the peripheral intermittent wetlands of the “low floodplain” appeared to have been less affected by reduced frequency of inundation as they are capable of withstanding periods of up to 10 years without flooding (Keyte, 1994). Lippia is considered a serious threat to Lower Gwydir wetland plant communities. It occurs in areas subject to frequent inundation. It possesses a deep taproot to access moisture during dry periods and can be spread both by seed dispersal and vegetative mechanisms. As it grows, it tends to smother native species such as water couch. It has very limited grazing value to stock and reduces the carrying capacity of paddocks where it dominates. The dynamics of plant communities can be influenced strongly by the pattern of inundation (McCosker, 1999; McCosker et al., 1999). Both the timing and depth of inundation have an impact on the growth patterns of key native wetland species and weeds species such as lippia. Marsh club-rush responds to inundation during winter and spring by successfully flowering and setting seed which provides opportunities to maintain genetic diversity in the species and offering more opportunities for survival (Rea, 1994). Inundation from late summer floods, while promoting vigorous vegetative growth, did not result in seed set (McCosker, 1997). In contrast, water couch tends to respond most positively to late spring or summer floods. Both of these species also show a strong ability to recolonise areas where lippia has invaded following regular periods of inundation, as occurred from 1996–1998 when three major flood peaks occurred over three years. They most likely accomplish this through their growth form with below-ground rhizomes. Less common herbaceous species such as

Existing ecological knowledge
Managing Lower Gwydir environmental flows 12
swamp buttercup (Ranunculus undosus) and water primrose (Ludwigia peploides) possess stolons and these species will die without water (Rea, 1994). Their ability to return after flooding is dependent upon stolon fragments remaining or recruitment from the seed bank, although as the length of time between floods increases, the viability of both vegetative propagules and seed banks declines. (Rea, 1994) also suggested that the longer an area remains dry, the more likely it will respond to flooding with fewer species, reduced vigour and gaps into which weeds can invade. In addition, the longer the dry period persists, the more important but less reliable the seed bank becomes in the revegetation process. Depth of inundation is also an important factor in influencing the dominance of invasive species or native species. McCosker (1998) examined the depth tolerances of lippia, and concluded that when inundation is less than 20 cm, lippia can grow to the water surface and continue to successfully photosynthesise. However, at water depths of around 30 cm, lippia could not reach the surface and was subsequently covered in algal growth which limited photosynthesis and resulted in plant deaths. This appeared to provide an opportunity for water couch to recolonise areas where lippia had previously been the dominant species. Another notable aquatic weed in the Lower Gwydir wetlands is water hyacinth (Eichornia crassipes). This species thrives in warm shallow waters and has progressively spread westward over time, particularly through dispersal by flows along the Gingham Watercourse. While regular and deeper inundation favours native species over lippia, these same conditions can lead to a proliferation of water hyacinth which requires considerable effort and expense to control. The general trend of reduced flows to the wetlands in recent decades has resulted in large areas drying down which can act to reduce the spread of water hyacinth. The floristic structure and vegetation community structure is closely linked with the water regime (McCosker & Duggin, 1993). Wetland plants have evolved under a highly variable water regime. This provides variation in the environmental conditions that individuals of various species become established in, and greatly influences the chances of successful establishment. The result of this variability is a patchy and heterogeneous distribution of wetland vegetation (Rea, 1994). Species diversity, habitat complexity and genetic diversity depend upon this variability in flow regime. Impacts of grazing. Periods of inundation of the landscape following flooding result in a nutrient pulse being released which promotes vigorous plant growth. This surge in pasture productivity is a bonus for grazing enterprises. Therefore, the impact of the reduced flows into the Lower Gwydir wetlands has been a reduction in the carrying capacity of the wetland pastures. Grazing has taken place on the Lower Gwydir floodplains since the mid 1800s. While many enterprises initially grazed sheep, there has since been a progressive switch to grazing cattle. The presence of hard-hoofed herbivores has had impacts on wetland plant communities (Keyte, 1994). Reduced water levels in wetland areas have allowed cattle to graze deep into the heart of many wetlands (Rea, 1994). The impact of cattle grazing on wetland plant species is not yet well understood. On the “low floodplain”, the structure of lignum communities has become degraded in many areas, with grazing and trampling by sheep and cattle, particularly during dry periods believed to be the cause (Keyte, 1994). Intensive grazing is also believed to be responsible for an observed shift away from perennial pasture species towards annual exotics such as burr medic (Medicago polymorpha) and barley grass (Hordeum leoporinum) (Keyte, 1994; McCosker & Duggin, 1992). Evidence from elsewhere in the Murray-Darling Basin of the impact of cattle on wetland vegetation includes:
Existing ecological knowledge
Managing Lower Gwydir environmental flows 13
compaction of wet soils leading to lower water infiltration rates, reduced soil water storage, inhibition of root penetration and slowing in seedling establishment;
changes in nutrient distribution in ecosystems where stock graze in wet areas and return to dry areas to rest with nutrients being deposited in these dry areas in their excreta; and
removal of biomass from wetlands which can influence wetland based food chains. For example, midges are a major food supply for waterbirds after flooding, and are detritivores. Their populations rapidly increase as a response to the breakdown of plant detritus once wetlands are re-flooded. Reduced biomass may limit midge population growth and reduce an important food source for water birds (Bacon et al., 1992 in Keyte, 1994).
Grazing damages plant tissue, and the plant responds by producing new shoots from meristematic tissue. If grazing pressure is intense and the rate of shoot recruitment exceeds the rate of meristem production, then this ‘bud-bank’ can be depleted gradually over time. Grazing and a lack of water, may act together to drain the plant of resources and reduce its ability to compete with other species in its environment (Rea, 1994). The dynamics of the vegetation communities in the Lower Gwydir wetlands have been significantly affected as a result of river regulation which has altered the conditions under which the native plant communities have evolved. The reduced water regime has actually favoured the exotic species lippia and also seen an increase in the occurrence in many terrestrial weed species in areas once considered to be semi-permanent wetlands. The particular impacts of grazing on wetland plant communities have not been quantified and are not well understood at present. Based on evidence from elsewhere in the Murray-Darling Basin it may be a case that river regulation is increasing the impacts of grazing on sensitive wetland plant communities. These questions are yet to be thoroughly investigated.
2.5 Zooplankton and microinvertebrates There is only minimal published information available on the zooplankton or microinvertebrate communities of the Lower Gwydir floodplain. However, there is some general information available on zooplankton communities from the Murray-Darling Basin, and on microinvertebrate communities in dryland river systems comparable to the Gwydir River. Murray River zooplankton is often dominated by endemic microcrustaceans originating from upstream reservoirs, whereas Darling River waters comprise mainly rotifers (Shiel et al., 1982). A total of 133 zooplankton species was identified in the lower Murray River (SA) and mean zooplankton density was 199 individuals per litre (Shiel et al., 1982). Similar numbers of zooplankton species were observed in a NSW coastal river (116 taxa), although zooplankton density was much higher (~1000 individuals per litre; Kobayashi et al., 1998). A certain density of zooplankton is required for successful rearing of fish larvae (King, 2004). Emergence of zooplankton from Gwydir floodplain sediment samples yielded similar abundances (~100,000 individuals per sample) and species richness (~8 species) as compared to samples collected from other wetland sites in the Murray-Darling Basin (e.g. Macquarie Marshes) (Brock et al., 2005). A total of 29 plankton taxa were identified from Gwydir Wetland sediment samples as compared to 26 from the Macquarie Marshes and 29
Existing ecological knowledge
Managing Lower Gwydir environmental flows 14
from the Narran Lakes (Nielsen et al., 2007). The emerging zooplankton community in Gwydir Wetland sediment samples was dominated by rotifer species and chydorids (Nielsen et al., 2007).
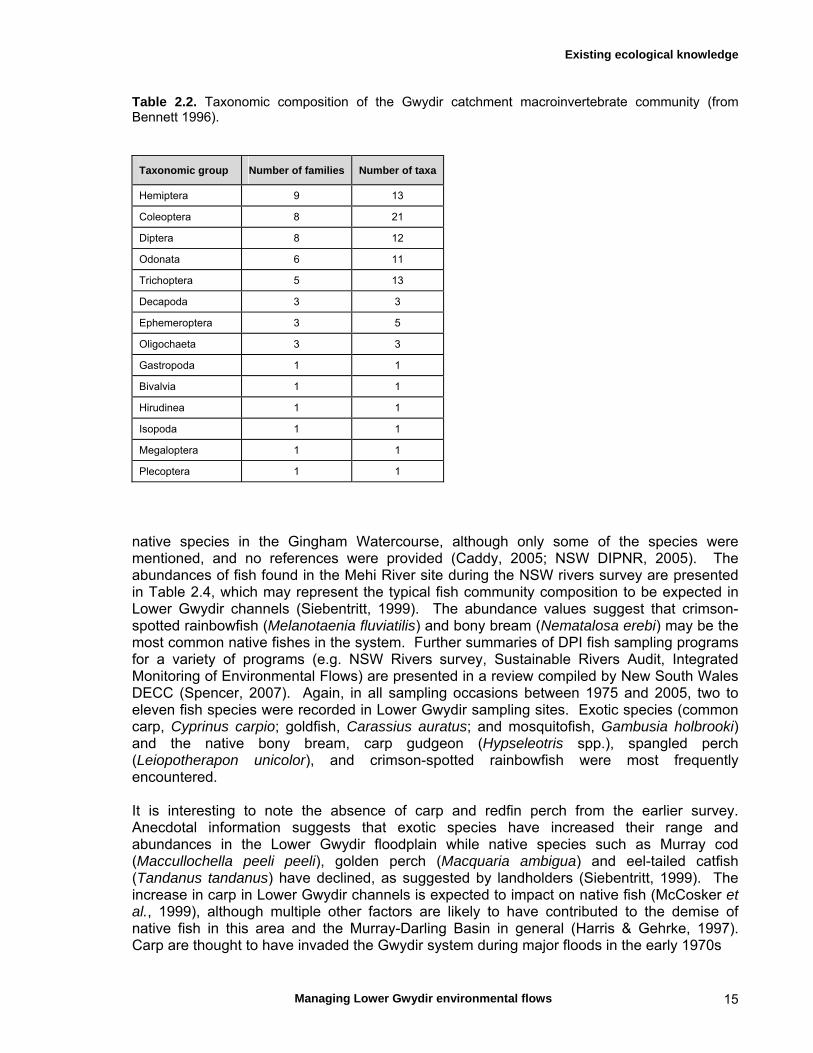
2.6 Macroinvertebrates Reported knowledge of the macroinvertebrate fauna of the Gwydir catchment is sparse, apart from a student report (Bennett, 1996) and an inventory compiled by NSW DECCW (Neal Foster, pers. communication). Bennett (1996) found 87 macroinvertebrate taxa in multiple sites located throughout the Gwydir catchment, from headwaters down to about Moree and, additionally, in the Horton River (Table 2.2). Floodplains and wetlands were not sampled as the study concentrated on riffle habitats. Coleoptera was the most diverse group in terms of species numbers, and Hemiptera in terms of families. However, Chironomidae were not identified to species level and so this group is likely to have been more diverse than estimated. Several groups were represented by only a single taxon, and Plecoptera were represented by a single specimen only. Some taxa were common and widespread throughout the catchment (Ephemeroptera, Hemiptera, Tricoptera and Chironomidae taxa) (Bennett, 1996). No strong differentiation in macroinvertebrate communities was evident between upstream and downstream sites, i.e. invertebrate taxa spread evenly over the catchment, although this could simply have reflected the fact that sampling was restricted to riffle habitats. Monitoring of macroinvertebrates in the Gwydir catchment undertaken by NSW DNR (Neal Foster, pers. communication) yielded a much higher species count (in excess of 500 species) than the previous study. However, the DNR program ran over several years and all taxa were identified to species level, which probably explains the discrepancy in species numbers recorded.
2.7 Fish, amphibians and aquatic reptiles Fish. A total of 26 fish species occur, or potentially may occur, in the Gwydir catchment (Table 2.3) (Siebentritt, 1999). Three of these species are rare or vulnerable and six are exotic species. Exotic salmonids (brown trout, Salmo trutta, and rainbow trout, Oncorhynchus mykiss) are absent from the Lower Gwydir River due to temperature and oxygen requirements. River blackfish (Gadopsis marmoratus) and mountain galaxies (Galaxias olidus) are similarly restricted to the upland sections of the catchment due to their temperature and habitat requirements. Furthermore, a large portion of this potential fish fauna was not sampled during the NSW rivers survey, and Siebentritt (1999) concluded that the basic fish community in the Gwydir wetlands more likely comprises only nine taxa (Table 2.3). Two fish surveys undertaken in four sites of the Gwydir catchment (Gwydir River at Yarraman, the Gwydir River at Bingara, Horton River at Upper Horton and Mehi River at Moree) recorded 12 species in the 1983 survey (Llewellyn, 1983) and 14 species in the 1996 NSW rivers survey, respectively (Harris & Gehrke, 1997) (Table 2.4). A report by the NSW Department of Infrastructure, Planning and Natural Resources mentions the occurrence of 14
Existing ecological knowledge
Managing Lower Gwydir environmental flows 15
Table 2.2. Taxonomic composition of the Gwydir catchment macroinvertebrate community (from Bennett 1996).
Taxonomic group Number of families Number of taxa
Hemiptera 9 13
Coleoptera 8 21
Diptera 8 12
Odonata 6 11
Trichoptera 5 13
Decapoda 3 3
Ephemeroptera 3 5
Oligochaeta 3 3
Gastropoda 1 1
Bivalvia 1 1
Hirudinea 1 1
Isopoda 1 1
Megaloptera 1 1
Plecoptera 1 1
native species in the Gingham Watercourse, although only some of the species were mentioned, and no references were provided (Caddy, 2005; NSW DIPNR, 2005). The abundances of fish found in the Mehi River site during the NSW rivers survey are presented in Table 2.4, which may represent the typical fish community composition to be expected in Lower Gwydir channels (Siebentritt, 1999). The abundance values suggest that crimson-spotted rainbowfish (Melanotaenia fluviatilis) and bony bream (Nematalosa erebi) may be the most common native fishes in the system. Further summaries of DPI fish sampling programs for a variety of programs (e.g. NSW Rivers survey, Sustainable Rivers Audit, Integrated Monitoring of Environmental Flows) are presented in a review compiled by New South Wales DECC (Spencer, 2007). Again, in all sampling occasions between 1975 and 2005, two to eleven fish species were recorded in Lower Gwydir sampling sites. Exotic species (common carp, Cyprinus carpio; goldfish, Carassius auratus; and mosquitofish, Gambusia holbrooki) and the native bony bream, carp gudgeon (Hypseleotris spp.), spangled perch (Leiopotherapon unicolor), and crimson-spotted rainbowfish were most frequently encountered. It is interesting to note the absence of carp and redfin perch from the earlier survey. Anecdotal information suggests that exotic species have increased their range and abundances in the Lower Gwydir floodplain while native species such as Murray cod (Maccullochella peeli peeli), golden perch (Macquaria ambigua) and eel-tailed catfish (Tandanus tandanus) have declined, as suggested by landholders (Siebentritt, 1999). The increase in carp in Lower Gwydir channels is expected to impact on native fish (McCosker et al., 1999), although multiple other factors are likely to have contributed to the demise of native fish in this area and the Murray-Darling Basin in general (Harris & Gehrke, 1997). Carp are thought to have invaded the Gwydir system during major floods in the early 1970s

Existing ecological knowledge
Managing Lower Gwydir environmental flows 16
Table 2.3. List of fish species recorded or distributed within the Gwydir River catchment. V = vulnerable, R = rare, EX = exotic species. Species suspected of occurring in the Lower Gwydir streams are indicated with an *. Source: (Siebentritt, 1999).
Common name Scientific name Common name Scientific name
olive perchlet Ambassis afassizii Lake’s carp gudgeon Hypseleotris sp.5*
silver perch Bidyanus bidyanus (V)* spangled perch Leioptherapon unicolor*
Goldfish Carrasius auratus (EX)* Murray cod Maccullochella peelii*
common carp Cyprinus carpio (EX)* golden perch Macquaria ambigua*
Darling River hardyhead
Craterocephalus amniculus (R) crimson spotted rainbowfish
Melanotaenia fluviatilis*
un-specked hardyhead Craterocephalus stercusmuscarum fulvus* bony bream Nematalosa erebi*
river blackfish Gadopsis marmoratus rainbow trout Oncorhynchus mykiss (EX)
mountain galaxies Galaxias olidus redfin perch Perca fluviatilis (EX)
Murray jollytail Galaxias rostratus flathead gudgeon Philypnodon grandiceps
mosquito fish Gambusia holbrooki (EX)* Australian smelt Retropinna semoni*
western carp gudgeon Hypseleotris klunzingeri* brown trout Salmo trutta (EX)
Midgley’s carp gudgeon Hypseleotris sp.4* freshwater catfish Tandanus tandanus*
chequered rainbowfish Nematocentris maculata lesser salmon catfish Hexanematicthys leptasis
(Copeland et al., 2003) and there has been a general decline in native fish populations over the last 30 years (Mallen-Cooper, 2000). Of the native fish species occurring in the Gwydir floodplain, only four were recently detected in pool refuge habitats of the floodplain. Exotic species now dominate the floodplain habitats, especially carp and mosquitofish (Mallen-Cooper, 2000). However, most of the fish species still occur in the middle Gwydir catchment, so there is hope for reestablishment once habitat is restored (i.e. restoration of fish passage and flow regime) (Harris & Gehrke, 1997; Mallen-Cooper, 2000). The overall change in riverine ecosystems (e.g. altered hydrology patterns and habitat degradation) seem to benefit invasive species, especially carp, while native fish are thought to be more dependent on natural flood cycles for their recruitment (Driver et al., 2005; Gehrke & Harris, 2001; Harris & Gehrke, 1997). The majority of native fish species in the Lower Gwydir spawn during the spring and summer season, with rises in water temperature and or water levels associated with floods being identified as important spawning triggers (Lintermans, 2007; McCosker et al., 1999). Currently, flow rises in summer due to irrigation releases from Copeton Dam are considered inferior as a spawning stimulus for native fish due to the low temperature of releases from the dam’s hypolimnion (Preece & Jones, 2002). Fish barriers and passage. By 2002, there was a total of 84 weirs or barriers accounted for in the NSW Fisheries weir review (NSW Fisheries and NSW DLWC, 2002) of the Gwydir catchment, none of which had fishways. Weirs can have a significant impact on riverine ecosystems, for they alter hydraulic conditions, impact on water quality, and impede fish

Existing ecological knowledge
Managing Lower Gwydir environmental flows 17
Table 2.4. Fish species recorded in the Gwydir catchment during surveys of 1983 and 1996 (table modified from (Harris & Gehrke, 1997). EX = exotic species.
Species 1983 survey 1996 survey 1996 Mehi only
Bidyanus bidyanus - 1
Carassius auratus (EX) 1 1 14
Cyprinus carpio (EX) - 1 46
Gadopsis marmoratus 1 1
Galaxias olidus 1 -
Gambusia holbrooki (EX) 1 1
Hypseleotris sp. 1 1 71
Leiopotherapon unicolor 1 1 2
Maccullochella peelii 1 1 5
Macquaria ambigua 1 1 2
Melanotaenia fluviatilis 1 1 105
Nematalosa erebi 1 1 286
Perca fluviatilis (EX) - 1
Retropinna semoni 1 1 8
Tandanus tandanus 1 1
Total 12 14 9
No exotic sp. 2 4 2
migration (Gehrke & Harris, 2001; NSW Fisheries and NSW DLWC, 2002). Furthermore, the changes induced by in-stream barriers seem to favour introduced species like carp and, therefore, have a significant impact on fish community composition (Gehrke & Harris, 2001; Harris & Gherke, 1997). Barriers affect native fish in multiple ways by disrupting life cycles and migratory behaviour, alter population genetics and create environmental conditions unfavourable to them (Gehrke & Harris, 2001; MDBC, 2003; NSW Fisheries and NSW DLWC, 2002). Most native fish undertake migration, often over considerable distance, during various life stages and, therefore, free passage between habitats is required for them to complete their lifehistory (Lintermans, 2007; MDBC, 2003; NSW Fisheries and NSW Department of Land and Water Conservation, 2002). Fishways can aid fish past artificial barriers if constructed properly and aimed at the specific target species. Unfortunately, many of the fishways constructed in the Murray-Darling Basin were designed for Northern Hemisphere salmonids and function less effectively for native fishes (Mallen-Cooper, 1994). As a result of the weir review in 2002, calls have been made for the construction of suitable fishways or the removal of redundant barriers. Amphibians. A variety of frog species were reported during the 1998 and 2000–2001 floods (Table 2.5) (McCosker, 1998; McCosker, 2001), and additional information on frog species for 1995 and 1996 was recoded by Courtney (1997; in McCosker 1998). Courtney described a higher frog diversity during the summer flooding of 1995, although no species names were given (McCosker, 1998). Frogs were reported to be very abundant during most breeding

Existing ecological knowledge
Managing Lower Gwydir environmental flows 18
Table 2.5. Presence of frog species during 1995–1996, 1996–1997, 1998 and 2000–2001 flood events compiled from the following documents (Courtney, 1997; McCosker, 1998; McCosker, 2001). Question marks in the table (?) indicate that reports (Courtney, 1997) did not provide specific dates on which frogs were observed.
Species 1995–1996 1996–1997 1998 2000–2001
spotted marsh frog Limnodynastes tasmaniensis 1 (?) 1(?) 1 1
barking marsh frog Limnodynastes fletcheri 1 (?) 1 (?) 1 1
salmon striped marsh frog Limnodynastes salmini 1 (?) 1 (?) 1
beeping froglet Crinia parinsignifera 1 (?) 1 (?) 1 -
Suddel’s frog Neobatrachus sudelli 1 (?) 1 (?) 1 -
red tree frog Litoria rubella 1 (?) 1 (?) 1 -
broad-palmed frog Litoria latopalmata 1 (?) 1 (?) 1 -
Peron’s tree frog Litoria peronii 1 (?) 1 (?) 1 -
quacking frog Litoria alboguttata 1 (?) 1 (?)
green tree frog Litoria caerulea 1 (?) 1 (?)
rough toadlet Uperoleia rugosa 1 -
crucifix frog Notaden bennetti 1 (?) 1 (?)
warty water-holding frog Cyclorama verrucosa 1 (?) 1 (?)
flat-headed water-holding frog
Cyclorana platycephala 1 (?) 1 (?)
events, especially the spotted marsh frog. All frog data were produced by analysis of frog calls. Unfortunately, there are no quantitative abundance data for either period besides qualifiers such as whether species were abundant or not. Additionally, there is some uncertainty about the extent of sampling in different years, and the low number of species in 2000-2001 could have resulted from either low sampling effort, a general lack of information in the report (frog information was very sparse, with rarer species not having been included), or simply that frogs were genuinely less abundant that year. A higher number of frog species was reported by McCosker (1998). However, the main text did not make any reference as to whether these species were absent in later occasions or not, or if their occurrence was simply not reported (McCosker, 1998). Courtney concluded that the Gwydir wetlands were an important frog habitat as several rare or unusual species occurred here (Courtney, 1997). The New South Wales Department of Infrastructure, Planning and Natural Resources noted that the Gingham floodplain was a habitat for frogs, although no species lists or references were provided (NSW DIPNR, 2005b). A report on the Gingham Floodplain management cited the record of 18 amphibians from this area, which is considerably more than the list of species in Table 2.5 (14 species). Again, no species names or references were provided (Caddy, 2005). Aquatic reptiles. The occurrence of reptile species in the Gingham Watercourse floodplain is noted in a report by the Department of Infrastructure, Planning and Natural Resources, although no species names or references are provided (NSW DIPNR, 2005b). A further

Existing ecological knowledge
Managing Lower Gwydir environmental flows 19
report from the same agency cited the occurrence of 20 reptile species on the Gingham Floodplain, although again no species names or references were presented (Caddy, 2005). Keyte (1994) reported a decline in red-bellied black snakes (Pseudechis porphyriacus) in the Lower Gwydir Wetlands (Keyte, 1994). The threatened Murray-Darling carpet snake is also known to occur in Lower Gwydir riparian areas, and at least three turtle species (Chelodina longicolis, C. expansa, Emydura macquarii) are likely to occur in ephemeral and permanent pools and lagoons (Wilson & Swan, 2003). However, no information on flow responses or flooding requirements in these species is available from this catchment.

Conceptual models
Managing Lower Gwydir environmental flows 20
Chapter 3 Conceptual models of ecological response to flow variability in Lower Gwydir floodplain aquatic habitats
3.1 Introduction Conceptual models are an integral step in undertaking any ecological study, and help in developing the final research questions, sampling designs and choice of ecosystem components or population/life history variables to be monitored (e.g. Jackson et al., 2000). For environmental flow determinations, conceptual models may be an invaluable tool for communicating key messages of probable ecosystem response(s) to management interventions (Acreman, 2005; Fitz et al., 1996). Two conceptual models were constructed for the Lower Gwydir floodplain study area and its aquatic ecological responses to flow variability. Separate models were developed for in-stream patterns and processes and those occurring in aquatic patches on the floodplain itself (wetland areas). Both models focus on ecosystem components that the project team anticipated having the capacity for monitoring in the present study. As such, these models ignore (for instance) the contribution of basal components such bacteria to the functioning of this ecosystem. Similarly, they do not explicitly include carbon variables such as dissolved organic carbon, although do include nutrient mobilisation as a more general process. Nevertheless, data on dissolved organic carbon (and other nutrients) were collected during the present study. Three broad flow-event categories were considered based on recent hydrological data (Fig. 3.1) and the current uses for water in the study ecosystem: (A) large, overbank flows resulting from unregulated, natural flooding; (B) flows of smaller duration and height, largely remaining in-channel, resulting from either regulated (principally Environmental Contingency Allocation releases) or unregulated flows; and (C) low-level managed releases of limited stage variability and longer duration, such as for the purposes of bulk irrigation transfers or stock and domestic supply. Each of these flow types is likely to occur along any of the main Lower Gwydir watercourses (Mehi River, Gwydir River/Big Leather Watercourse, Gingham Watercourse, Carole Creek) and so provide a useful framework for understanding the likely ecological responses to flow variability beyond specific study sites. The conceptual models were constructed in a ‘bottom-up’ fashion, with a primary focus on the response (positive or negative) of consecutive food-web components to shifts in the state of lower trophic levels. They consider flow variability to have an overarching influence on ecosystem function through various life history adaptations of the native fauna and flora (Bunn & Arthington, 2002; Lytle & Poff, 2004; Poff & Ward, 1989; Puckridge et al., 1998) and the opportunities for exploiting vacant niches by invasive species, particularly plants. The influence of flows on the Lower Gwydir floodplain is firstly tracked in-stream through physical
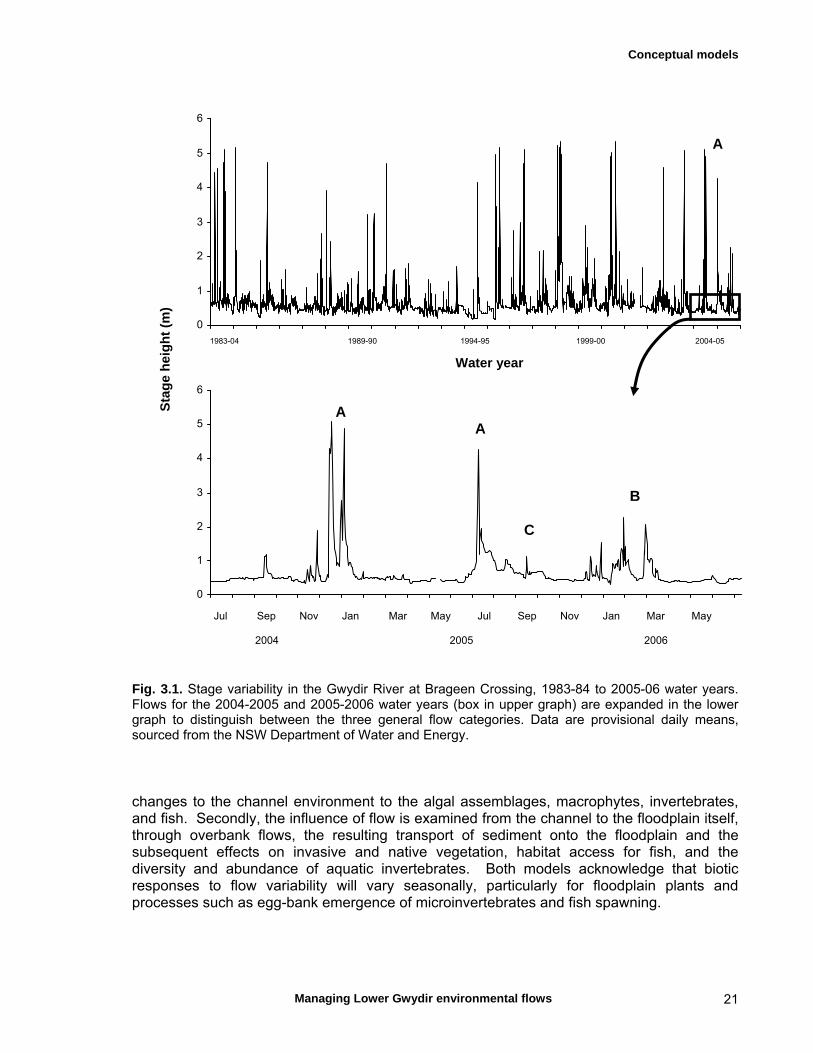
Conceptual models
Managing Lower Gwydir environmental flows 21
0
1
2
3
4
5
6
0
1
2
3
4
5
6
Fig. 3.1. Stage variability in the Gwydir River at Brageen Crossing, 1983-84 to 2005-06 water years. Flows for the 2004-2005 and 2005-2006 water years (box in upper graph) are expanded in the lower graph to distinguish between the three general flow categories. Data are provisional daily means, sourced from the NSW Department of Water and Energy. changes to the channel environment to the algal assemblages, macrophytes, invertebrates, and fish. Secondly, the influence of flow is examined from the channel to the floodplain itself, through overbank flows, the resulting transport of sediment onto the floodplain and the subsequent effects on invasive and native vegetation, habitat access for fish, and the diversity and abundance of aquatic invertebrates. Both models acknowledge that biotic responses to flow variability will vary seasonally, particularly for floodplain plants and processes such as egg-bank emergence of microinvertebrates and fish spawning.
1983-04 1989-90 1994-95 1999-00 2004-05
Water year
Sta
ge
hei
gh
t (m
)
Jul Sep Nov Jan Mar May Jul Sep Nov Jan Mar May 2004 2005 2006
A
A A B C
Conceptual models
Managing Lower Gwydir environmental flows 22
Flow variability and its alteration may be characterised over a hierarchy of temporal and spatial scales, with concomitant effects on different aspects of the lifehistory of aquatic species and the structuring their assemblages (Bunn & Arthington, 2002; Lytle & Poff, 2004; Poff & Ward, 1989; Puckridge et al., 1998; Thoms & Parsons, 2003). In this way, flow regime is viewed as representing flow conditions over 100s to 1000s of years and the regional scale. Flow history describes variability operating over 10s to 100 yrs and the catchment scale, while the flow pulse depicts changes in stage height or discharge over the temporal scales of days to weeks and spatial scale of patches to reaches within a catchment. The present conceptual models have been developed primarily at the latter spatial (patch, reach) and temporal (flow pulse; days to weeks) scales, in line with the levels at which field-based components of the research were conducted. For example, flow pulses of sufficient stage height are proposed as allowing channel — floodplain connections that fish might utilise for accessing floodplain waterholes or other inundated patches. This would conceivably allow short-term opportunities for foraging, spawning or habitat recolonisation.
3.2 In-stream responses The conceptual model for this portion of the Lower Gwydir aquatic ecosystem is shown in Fig. 3.2. Responses of different physical and biotic components to flow variability are discussed individually below. Channel structure. Flow pulses of most sizes will impact the physical structure of the stream channel, through the transport and (in the case of finer particles) resuspension of sediment. This would be expected to temporarily raise in-stream turbidity levels and potentially lead to mobilisation of particulate carbon and available nutrients such as dissolved organic carbon or nitrogen and phosphorus. Flows remaining largely in-channel and of limited stage variability would be expected to lead to a loss of channel bed complexity as sediment is shifted off banks, bars and benches and into deeper parts of the ‘thalweg’. Alternatively, flows of this nature could potentially increase the leveeing of channels through their deposition of sediment along the bank crest, thus reducing future floodplain connectivity at a given level of discharge. However, during larger, overbank flow events, sediment resuspension and transport would be expected to enhance channel bed complexity as unconsolidated sediment is shifted from all parts of the channel including the scouring of deeper holes. At the same time, however, overbank flows along an agricultural landscape, and following the current period of drought, would be expected to return a quantity of sediment off the floodplain into adjacent channel and wetland patches. Shifts in channel bed complexity would be expected to have parallel influences on the diversity and abundance of most floral and faunal biotic components. Similarly, nutrient mobilisation from the channel sediment or bed would likely increase rates of primary production and the diversity/abundance of algal and macrophyte assemblages. By contrast, parallel rises in turbidity would reduce the channel’s photosynthetic depth, potentially impacting algal and macrophyte assemblages to varying degrees. Seasonal, temperature-related modification of the effects of flows on the channel would be expected to result primarily from reduced rates of nutrient processing by bacteria during cooler months and any associated shifts in nutrient bioavailability.

Conceptual models
Managing Lower Gwydir environmental flows 23
Fig. 3.2. Conceptual model of in-stream aquatic ecological responses to flow variability on the Lower Gwydir floodplain. Black arrows indicate linkages between ecosystem components and processes; shorter red arrows indicate the proposed direction of any effect. Macrophytes. These are a limited ecosystem component in most parts of Lower Gwydir watercourses, but are nonetheless likely to be important in sites where they do occur. In some areas, their proliferation is likely to have resulted from reductions in flow variability and longer flow duration from stock and domestic supplies in particular. Prominent species include Persicaria, Ludwigia and Typha. Flow variability is likely to promote the growth and seed production of a range of macrophyte species, and shifts in sediment transport, channel complexity and nutrient availability will also promote diversity and abundances. Increased low- or no-flow periods of a more natural duration, frequency and timing would be expected to reduce the areal extent and diversity of some beds. However, larger events would be expected to act as a pulse disturbance and cause major disruption to beds of more delicate species such as Ludwigia. Recovery from these events would depend on the flow duration and associated settling of suspended sediments and drops in turbidity. By contrast, critical recolonisation of sites downstream may also occur during such flows, either through dislodged plants setting root or the germination of dispersed seed. Similarly to algae, macrophytes would also be expected to respond more
Flows
Fish: survival and
Fish: spawning
Fish: habitat access
Pelagic algae diversity/abundance
Pelagic algal transport/flushing
Attached algal/biofilmdiversity/abundance
Microinvertebratediversity/abundance
MacroinvertebrateDiversity/abundance
Sedimenttransport /
resuspension
Channel complexity
Nutrient mobilisation
turbidity
Floodplain deposition
(sediment loss
Variable seasonal response
Fish:
Macrophytediversity/abundance
gain loss
Egg-bank emergence

Conceptual models
Managing Lower Gwydir environmental flows 24
rapidly to flow pulses during the warmer months when reductions in the photosynthetic depth or the destruction of beds would be offset to a greater degree by higher growth rates. Invertebrates. Microinvertebrates and macroinvertebrates are considered separately here, particularly due to the greater capacity of microinvertebrates for desiccation resistance and subsequent egg-bank emergence, and the different positioning of the two groups in aquatic food web structures. Microinvertebrate diversity and abundances would be expected to increase during and following flow pulses, and over any subsequent low-flow period with concomitant rises in pelagic algal cell densities. Wetting of the bank and structures such as in-channel benches or bars may also boost microinvertebrate densities through egg-bank emergence, although the importance of this process would vary with flow height, duration and temperature seasonality. Subsequent local boosts in algal productivity and the transport of particulate carbon may also benefit microinvertebrate densities. Increased macroinvertebrate diversity and abundances would also result from increased flow variability, initially through changes in algal or microinvertebrate prey levels, adult emergences and their subsequent breeding. Shifts in macroinvertebrates would be slower to occur than that of microinvertebrates, partially as a ‘trophic cascade’ effect, but also due to differences in reproductive mode between the two groups. However, the diversity of both invertebrate groups would be enhanced through the creation of a range of microhabitat types during periods of greater flow variability. These would include macrophyte beds, woody debris (‘snags’) transported by raised channel flow velocities, and a greater diversity of channel bed structures. Fish. Fish will be influenced by flows through both physiological (e.g. gonad maturation, growth rates) and behavioural (e.g. spawning, habitat access) mechanisms and a mix of direct and indirect effects. Growth and survival of all lifehistory stages will be enhanced by the generation of food resources during and following flow events, as discussed above for invertebrates and algae. Changes in macrophyte beds and channel structure will have parallel effects on the survivorship, diversity and/or abundance of fish assemblages through changes in habitat access. In addition, flows would be expected to have a direct influence on the initiation of spawning activity in numerous native species, although the rate of gonad maturation and subsequent larval survivorship would be expected to be lower over winter. Flows with low stage variability would also be expected to produce a lesser spawning response.
3.3 Floodplain responses The conceptual model for this portion of the Lower Gwydir aquatic ecosystem is shown in Fig. 3.3. Responses of different physical and biotic components to flow variability are discussed individually below. Physical patch structure. The transport of sediment and finer silt, and associated nutrients and organic matter, onto the floodplain is a key benefit of flooding along lowland rivers (McGinness, 2007). Such materials will be deposited in low-lying areas such as in-channel benches, anabranch channels (a key transport pathway in their own right: McGinness et al., 2002) and other wetland types. In a physical sense, the invariably uneven spatial patterns of deposition would increase the patch complexity of the floodplain, with subsequent benefits for a variety of floral and faunal assemblages. Overbank flows may also redistribute any

Conceptual models
Managing Lower Gwydir environmental flows 25
Fig. 3.3. Conceptual model of floodplain / wetland aquatic ecological responses to flow variability on the Lower Gwydir floodplain. Black arrows indicate linkages between ecosystem components and processes; shorter red arrows indicate the proposed direction of any effect. sediment deposits from previous floods and soils from agricultural areas, some of which would end up in aquatic areas including the nearby channel. In a chemical sense, deposited aterials would add significant nutrient and coarser particulate carbon loads to the floodplain and, in turn, help boost rates of vegetation and algal productivity. At the same time, overbank flows would return significant quantities of finer silt and dissolved organic carbon back to the river channel from features such as anabranches (Thoms et al., 2005; McGinness, 2007). The actual process of floodplain inundation would also lead to a release of carbon, nitrogen and phosphorous from leaf litter and soils (Robertson et al., 1999; Baldwin & Mitchell, 2000). Floodplain vegetation. Sediment deposition during overbank flows, and the associated nutrient and organic-matter content, would promote the germination and/or growth of a range of floodplain plants. The actual movement of water across the floodplain would also disperse floating species such as Azolla and the highly invasive water hyacinth. Floods of relatively low depth (< 200 mm inundation) and duration may enhance lippia (Phyla canescens) growth and its subsequent dispersal through dislodged leaves and stem fragments (McCosker, 1999). This would potentially reduce native plant assemblages. Managed floods outside of the spring and summer reproductive season of native species may also differentially benefit lippia at the expense of species like Bolboschoenus or Eleocharis (B. Southeron, pers.
Channel complexity
Invasive floodplain
species
Seed-bank/rhizome germination
Canopy germination
Fish: survival and growth
Fish: habitat access
Sedimenttransport /
resuspension
Nutrient mobilisation
turbidity
Floodplain deposition (sediment loss from
channel)
Variable seasonal response
Native plant diversity/abundance
Seed-bank diversity/abundance
Macroinvertebratediversity/abundance
Egg-bankemergence
Microinvertebrate diversity/abundance
Overbank flows
Fish: diversity/abundance
Fish: spawning
gain loss
Floodplain physical
patch diversity
Pelagic and attached algae
diversity/abundance

Conceptual models
Managing Lower Gwydir environmental flows 26
comm.). Similarly, as lentic areas dry out again, terrestrial weeds such as noogoora burr (Xanthium occidentale) would germinate from the seed-bank, absorbing nitrogen and phosphorus from the sediments in the process. Macrophytes. Lentic populations of emergent species such as Persicaria would respond to overbank flows through the germination of new plants from either seed-banks or rhizomes. In turn, these beds would provide refuge and a food source for aquatic invertebrates and fishes. Unlike in channel environments, flows over most floodplain areas would not be expected to cause significant damage to existing beds. Similarly, increases in turbidity would not be expected to have a significant effect on emergent species. As lentic areas dry out following flood recession, the release of nitrogen into the soil from decaying macrophytes (e.g. Azolla, Lemmna, water hyacinth, emergents) would potentially boost the recolonisation of these areas by terrestrial plants. Invertebrates Overbank flows will promote the emergence of microinvertebrates and some aquatic macroinvertebrate groups from the sediment, either from egg-banks or other sources such as soil cracks or vegetation. Overbank flows would also be expected to transport invertebrates onto the floodplain from upstream areas, although this response would increase with distance downstream. Both supply mechanisms would enhance lentic and in-stream populations as well as replenishing the soil egg-bank following recession of the flows. Invertebrates would further benefit from the generation of algae on the floodplain as a key food source during flooding. Fish. Northern Murray-Darling Basin floodplain lentic environments (billabongs, lagoons, waterholes etc) appear to be a preferred habitat for species such as the olive perchlet (Ambassis agassizii), and generally contain more species than adjacent river channels (Wilson & Wright, 2005). Overbank flows will provide such species with opportunities for recolonising floodplain areas (lotic to lentic, lentic to lentic), shifts back to the adjacent channel, and for foraging or spawning on the floodplain itself. Overbank events would also promote the growth and survival of floodplain populations through increased prey abundances, and the return of nutrient and prey-enriched water back into the adjacent channel would similarly benefit in-stream species.

Field sampling design
Managing Lower Gwydir environmental flows 27
Chapter 4 Design of field sampling program
4.1 Introduction Flowing aquatic ecosystems provide a host of unique challenges and considerations for the design of monitoring programs to detect responses to management interventions (Downes et al., 2002). They face a complex array of direct and indirect stresses, operating over a range of temporal or spatial scales, resulting from man’s growing use of water resources. In the Murray-Darling Basin, most rivers are flow-regulated (Sheldon et al., 2000) and are subject to a range of management actions aimed at maintaining or improving their ecological condition (Likens et al., 2009). Management decisions for these river systems are increasingly being made in an adaptive framework, whereby future interventions are based on outcomes from previous ones. This approach provides one of the best mechanisms for ensuring that decisions are defensible and based on best-available knowledge, yet must be underpinned by well-designed monitoring programs if it is to succeed. Impacts or interventions at an upstream point in a river system will potentially influence downstream reaches over a considerable distance. Yet, in dryland areas, riverine ecosystems tend to behave less in a unidirectional, longitudinal fashion (e.g. Vannote et al., 1980; Cummins et al., 1995) than in a highly temporally-variable manner driven both by the prevailing flow regime and lateral connections between channels and their surrounding floodplain (Young & Kingsford, 2006). This adds further complexity to the monitoring requirements for detecting responses to flow or other events which may be short-lived or whose influence may be highly patchy or occur over an uncertain area or timeframe. Robust monitoring programs for environmental flow events in dryland river systems need to carefully consider the range of ecosystem components and how each might respond to the anticipated hydrology. Understanding the temporal and spatial scales over which these biota and physico-chemical process function, as well as the likely scales of the ‘impact’ of interest, is particularly important, and allows a critical matching of indicator variables to the specific study objectives or questions. This information can be derived from prior ecological data on the ecosystem, species, populations or assemblages of interest, or through existing stakeholder knowledge of how the ecosystem may respond. The natural heterogeneity or patch dynamics is also critical, and will assist in the location of study sites, choice of sampling methods, and the scale of sampling units. In this chapter, we outline the broad principles used in the design of our field sampling program, both in a spatial and temporal sense. We also summarise the rationale behind our choice of ecological parameters in both the in-stream and floodplain wetland components.
Field sampling design
Managing Lower Gwydir environmental flows 28
4.2 Choice of study watercourses and spatial sampling design Channels across the Lower Gwydir floodplain comprise a number of westerly-flowing streams, all derived from the Gwydir River within 50 km of Moree. They form a considerable delta system of channels of varying sinuosity, and end in either terminal wetlands (e.g. Gwydir River, Gingham Watercourse) or confluences with the adjacent Border Rivers and Barwon-Darling catchments (e.g. Mehi River, Carole Creek). Aquatic habitat in some older channels is now restricted to isolated floodplain lagoons of varying permanence (e.g. Baroona Waterhole) which connect during significant local rainfall or flooding events. Choice of study channels for the present study was primarily governed by four criteria, namely study objectives, flow regulation, current water use, and access for sampling. These characteristics were reviewed for five Lower Gwydir channels as well as the floodplain lagoons to the north of the Gingham Watercourse (Table 4.1). As the overarching aim of the study was to provide a stronger understanding of aquatic responses to environmental flow releases, we concentrated our study sites around the Gwydir River and Gingham Watercourse where ECA flows are currently released. They also provided numerous suitable reaches for the study’s in-stream component, although access to some areas was anticipated to be difficult following overbank flooding or heavy local rainfall. Despite the presence of numerous in-stream regulating structures in both channels, potential study reaches could still be identified away from their direct influence. There was also a choice of telemetered flow gauges in each channel for access to data on recent hydrological history. The prior history of research on Lower Gwydir wetland vegetation also influenced our decision to focus on the Gingham Watercourse and Gwydir River portions of the floodplain. Research on the responses of floodplain vegetation to flow variability using a series of grazing exclosures established by the University of New England in 1994, was a key factor in site selection. The four sets of exclosures were split evenly between wetlands along the two channels, and provided a unique opportunity to extend the existing 12-year data set. The remainder of our investigation of vegetation responses examined individual ECA events into the Gingham Watercourse and Gwydir River from 2007 to 2008. In studies of this nature, the strongest causal inferences of ecological response to a particular environmental signal are possible when ‘impact’ sites are compared with unimpacted ‘control’ sites. We wished to be able to characterise responses to flow events in the Gwydir River and Gingham Watercourse through comparison with control sites where similar species or assemblages hadn’t been subject to comparable flow conditions. As ECA flows or any in-stream responses to these were likely to be transmitted along much of the two ‘impact’ channels, our control sites needed to be selected in parallel channels or floodplain lagoons. Accordingly, our choice of control channels and wetland areas was largely governed by whether or not they were likely to receive managed flow events at the same time as ECA events in either the Gingham Watercourse or Gwydir River. Options included the Carole and Moomin creeks, the Mehi River and floodplain lagoons. These three channels are all subject to managed flow releases although largely just for irrigation and stock and domestic flow purposes, and were likely to be broadly similar to the two impact channels in their geology, elevation, slope, water chemistry and aquatic species. The Carole Creek and Mehi River were deemed the most suitable of these for reasons of riparian condition and site access. For logistical convenience, the Mehi River was chosen due to its closer proximity to the Gwydir River and Gingham Watercourse sites.
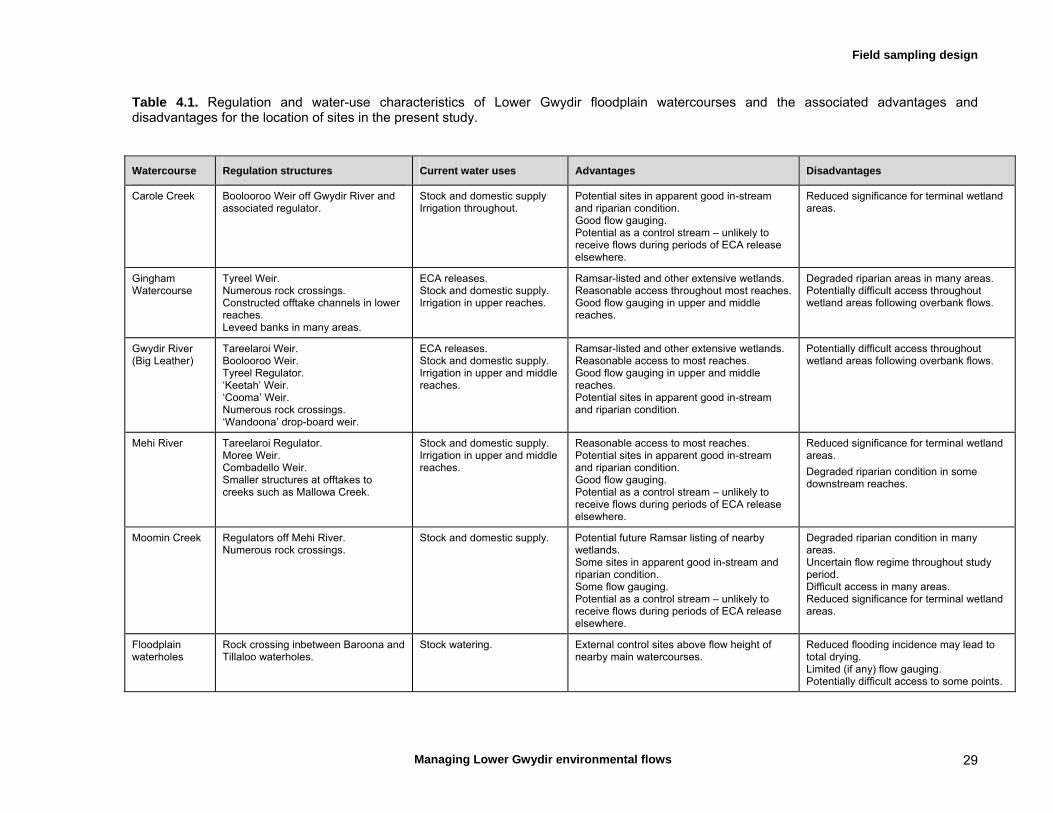
Field sampling design
Managing Lower Gwydir environmental flows 29
Table 4.1. Regulation and water-use characteristics of Lower Gwydir floodplain watercourses and the associated advantages and disadvantages for the location of sites in the present study.
Watercourse Regulation structures Current water uses Advantages Disadvantages
Carole Creek Boolooroo Weir off Gwydir River and associated regulator.
Stock and domestic supply Irrigation throughout.
Potential sites in apparent good in-stream and riparian condition. Good flow gauging. Potential as a control stream – unlikely to receive flows during periods of ECA release elsewhere.
Reduced significance for terminal wetland areas.
Gingham Watercourse
Tyreel Weir. Numerous rock crossings. Constructed offtake channels in lower reaches. Leveed banks in many areas.
ECA releases. Stock and domestic supply. Irrigation in upper reaches.
Ramsar-listed and other extensive wetlands. Reasonable access throughout most reaches. Good flow gauging in upper and middle reaches.
Degraded riparian areas in many areas. Potentially difficult access throughout wetland areas following overbank flows.
Gwydir River (Big Leather)
Tareelaroi Weir. Boolooroo Weir. Tyreel Regulator. ‘Keetah’ Weir. ‘Cooma’ Weir. Numerous rock crossings. ‘Wandoona’ drop-board weir.
ECA releases. Stock and domestic supply. Irrigation in upper and middle reaches.
Ramsar-listed and other extensive wetlands. Reasonable access to most reaches. Good flow gauging in upper and middle reaches. Potential sites in apparent good in-stream and riparian condition.
Potentially difficult access throughout wetland areas following overbank flows.
Mehi River Tareelaroi Regulator. Moree Weir. Combadello Weir. Smaller structures at offtakes to creeks such as Mallowa Creek.
Stock and domestic supply. Irrigation in upper and middle reaches.
Reasonable access to most reaches. Potential sites in apparent good in-stream and riparian condition. Good flow gauging. Potential as a control stream – unlikely to receive flows during periods of ECA release elsewhere.
Reduced significance for terminal wetland areas.
Degraded riparian condition in some downstream reaches.
Moomin Creek Regulators off Mehi River. Numerous rock crossings.
Stock and domestic supply. Potential future Ramsar listing of nearby wetlands. Some sites in apparent good in-stream and riparian condition. Some flow gauging. Potential as a control stream – unlikely to receive flows during periods of ECA release elsewhere.
Degraded riparian condition in many areas. Uncertain flow regime throughout study period. Difficult access in many areas. Reduced significance for terminal wetland areas.
Floodplain waterholes
Rock crossing inbetween Baroona and Tillaloo waterholes.
Stock watering. External control sites above flow height of nearby main watercourses.
Reduced flooding incidence may lead to total drying. Limited (if any) flow gauging. Potentially difficult access to some points.
Field sampling design
Managing Lower Gwydir environmental flows 30
The floodplain lagoons to the north of the Gingham Watercourse connect during significant overland flows, either from flooding from Carole Creek and/or the Gingham Watercourse or from heavy local rainfall events, and offered a further set of control sites. These were also unlikely to receive flows at the same time of ECA events and were also selected for their proximity to the Gingham/ Gwydir study channels. In early 2006, these waterholes were filled beyond their sill height by rainfall-generated overland flow. They did, however, have the disadvantage of not being the subject of any direct flow gauging and their potential to dry out entirely during the study interval without further inflows. For monitoring the responses of wetland vegetation to ECA events, ‘impact’ sites were selected in areas where it was anticipated that inundation would occur from an ECA flow. Control sites were selected outside this influence, either beyond the inundation in the same wetland complex or else in another Lower Gwydir wetland complex nearby. In both ECA events monitored in this way, it was anticipated that ECA flows would not reach all parts of the target wetland complex for a variety of reasons including insufficient flow volume, the presence of diversion structures or upstream ‘losses’ onto the floodplain. We countered this likelihood by selecting sites in an east—west gradient along the channel(s) where ECA flows were to be delivered, to ensure that at least some impact sites would be inundated. In the case of the grazing-exclosure vegetation monitoring sites, control sites where grazing was unrestricted had already been built into the experimental design in 1994. Other details of the spatial arrangement of vegetation sampling units (transects, quadrats) are given in chapters 5 and 6. For the in-stream study component, we also established sampling over an east—west gradient, particularly to ensure that any downstream shifts in water chemical load or assemblage structure could be characterised. Three sites were selected over the accessible length of the Gwydir River and Gingham Watercourse and a comparable length of the Mehi River. Further details of the positioning of these sites and the spatial arrangement of sampling units are given in chapter 7.
4.3 Temporal design – sampling specific flow events The Lower Gwydir floodplain receives surface flow from both regulated and unregulated flow events as well as local rainfall, all of which may have a significant local influence on the ecology of the various channels or floodplain wetlands. Nevertheless, each of these water sources will invariably result in differing hydrograph characteristics in the Lower Gwydir channels, including parameters such as the timing, height, velocity, duration and rates of rise and fall of individual pulses. They will also differ in their availability for abstractive use and so both hydrology and human use will determine the extent to which individual events are likely to reach the western end of the channels and wetland areas. Given our overarching objective of characterising ecological responses to environmental water releases, we focussed our sampling schedule around a series of planned ECA events, from December 2006 to November 2007. In isolation, these flows are less likely to be lost to agricultural use than natural flows which may still be subject to off-allocation access. As such, these releases are also unlikely to be subject to loss of any ecological response (e.g. nutrient release, drifting larval fish or zooplankton) from the channels. The hydrological characteristics of these releases (e.g. timing, velocity, duration) are also more predictable, which facilitates the planning of associated field work. Nevertheless, ECA releases can be

Field sampling design
Managing Lower Gwydir environmental flows 31
made to partially compensate for the loss of volume from off-allocation harvesting of natural flows. In these cases, it may be difficult to discriminate any ecological responses to the ECA release from those due to the prior natural flows. The intent of this study was to include monitoring before and after ECA releases at both ‘impact’ sites exposed to these events and control sites either not subject to ECA flows or unlikely to receive other flows at the same time as the Gwydir River or Gingham Watercourse. This allowed us to reference any responses to an event against the conditions in the channel or wetland that existed prior to the release as well as against nearby comparable areas or populations. For in-stream work, we aimed to sample sites at the beginning of each field season, prior to a release, and then following the release. However, sampling at the beginning of the season was delayed in 2007 and 2008 due to rainfall and local flooding, and our first sampling was either prior to the ECA release (November 2007) or shortly after a natural flow (December 2008). For the monitoring of floodplain vegetation, sampling was also structured around ECA releases, both within the grazing exclusion sites and in other parts of the study. For each ECA release monitored for vegetation responses, fieldwork was undertaken shortly before the release and twice following the release over a 3–4 month interval.
4.4 Choice of response variables Dryland river ecosystems such as the lowland portion of the Gwydir catchment comprise a wide range of biotic components, all with specific lifehistory adaptations to flow variability over a range of spatial and temporal scales (Walker et al., 1995; Puckridge et al., 1998; Bunn & Arthington, 2002; Downes et al., 2002). In geomorphological terms, they include ‘aquatic patches’ from the river channel itself, to features such as in-channel benches or anabranches and various floodplain wetland types. Biotically, they include components such as bacteria, fungi and algae that form the basis of aquatic food webs and undertake critical nutrient processing (Finlay et al., 1997), macrophytes and riparian plants (e.g. Blanch & Walker, 1997), various invertebrate groups (Marshall et al., 2006), fish (Gehrke et al., 1995; Humphries et al., 1999; Arthington et al., 2005; Wilson & Wright, 2005; Balcombe et al., 2006; Growns et al., 2006; Growns, 2008) and waterbirds (Roshier et al., 2002). For some of these, relationships between population abundances or community structure and the extreme levels of flow variability within these catchments remain complex and incompletely understood. By contrast, other biota or specific population processes are known to provide useful and measurable insights into the ecological functioning of varying flows for these river systems. Choice of response variables in any ecological study should be based on a range of criteria, from logistical and technical points to issues concerning the specific ecological or taxonomic objectives. The key aim of the present study, to determine ecological responses to environmental flows into the Lower Gwydir floodplain, meant that parameters needed to be capable of demonstrating responses at the temporal scale of individual flow pulses and spatial scales smaller than individual channels as well as between channels. The range of potential biotic variables and parameters is summarised in Table 4.2. In distilling this list down into a suite of variables and parameters for the present study, we considered a range of factors including:
stakeholder views; technical issues in relation to field sampling and/or laboratory processing;
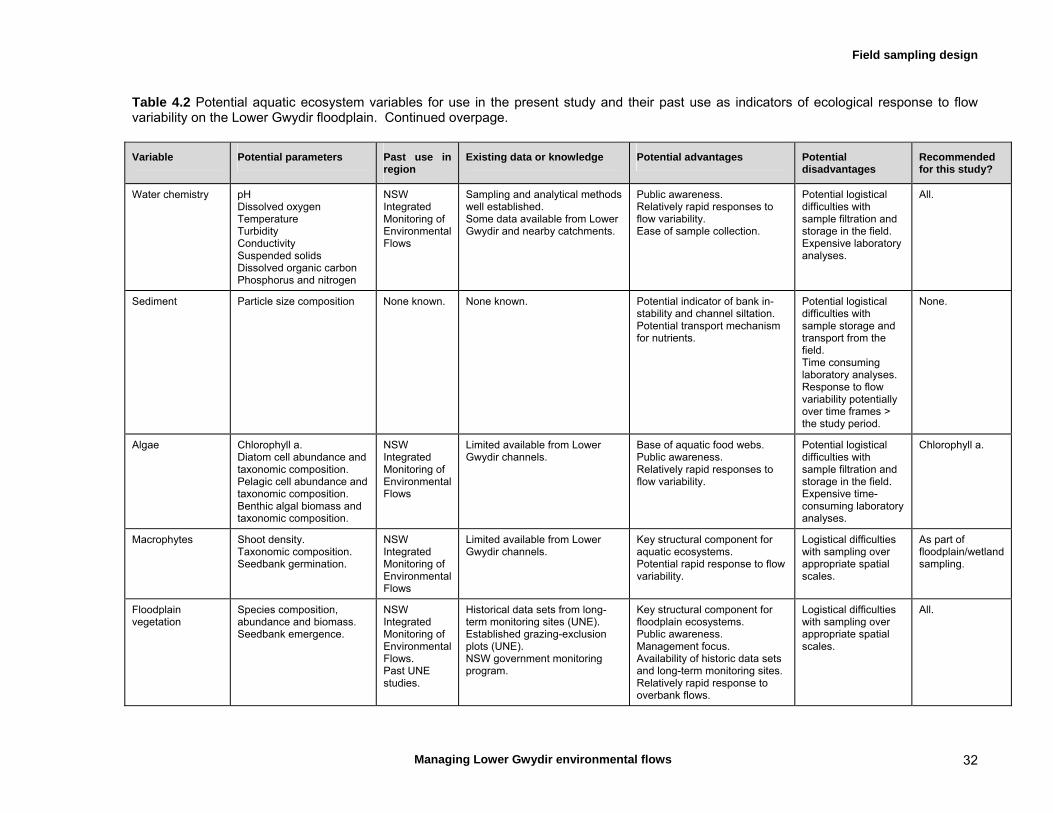
Field sampling design
Managing Lower Gwydir environmental flows 32
Table 4.2 Potential aquatic ecosystem variables for use in the present study and their past use as indicators of ecological response to flow variability on the Lower Gwydir floodplain. Continued overpage.
Variable Potential parameters Past use in region
Existing data or knowledge Potential advantages Potential disadvantages
Recommended for this study?
Water chemistry pH Dissolved oxygen Temperature Turbidity Conductivity Suspended solids Dissolved organic carbon Phosphorus and nitrogen
NSW Integrated Monitoring of Environmental Flows
Sampling and analytical methods well established. Some data available from Lower Gwydir and nearby catchments.
Public awareness. Relatively rapid responses to flow variability. Ease of sample collection.
Potential logistical difficulties with sample filtration and storage in the field. Expensive laboratory analyses.
All.
Sediment Particle size composition None known. None known. Potential indicator of bank in-stability and channel siltation. Potential transport mechanism for nutrients.
Potential logistical difficulties with sample storage and transport from the field. Time consuming laboratory analyses. Response to flow variability potentially over time frames > the study period.
None.
Algae Chlorophyll a. Diatom cell abundance and taxonomic composition. Pelagic cell abundance and taxonomic composition. Benthic algal biomass and taxonomic composition.
NSW Integrated Monitoring of Environmental Flows
Limited available from Lower Gwydir channels.
Base of aquatic food webs. Public awareness. Relatively rapid responses to flow variability.
Potential logistical difficulties with sample filtration and storage in the field. Expensive time-consuming laboratory analyses.
Chlorophyll a.
Macrophytes Shoot density. Taxonomic composition. Seedbank germination.
NSW Integrated Monitoring of Environmental Flows
Limited available from Lower Gwydir channels.
Key structural component for aquatic ecosystems. Potential rapid response to flow variability.
Logistical difficulties with sampling over appropriate spatial scales.
As part of floodplain/wetland sampling.
Floodplain vegetation
Species composition, abundance and biomass. Seedbank emergence.
NSW Integrated Monitoring of Environmental Flows. Past UNE studies.
Historical data sets from long-term monitoring sites (UNE). Established grazing-exclusion plots (UNE). NSW government monitoring program.
Key structural component for floodplain ecosystems. Public awareness. Management focus. Availability of historic data sets and long-term monitoring sites. Relatively rapid response to overbank flows.
Logistical difficulties with sampling over appropriate spatial scales.
All.
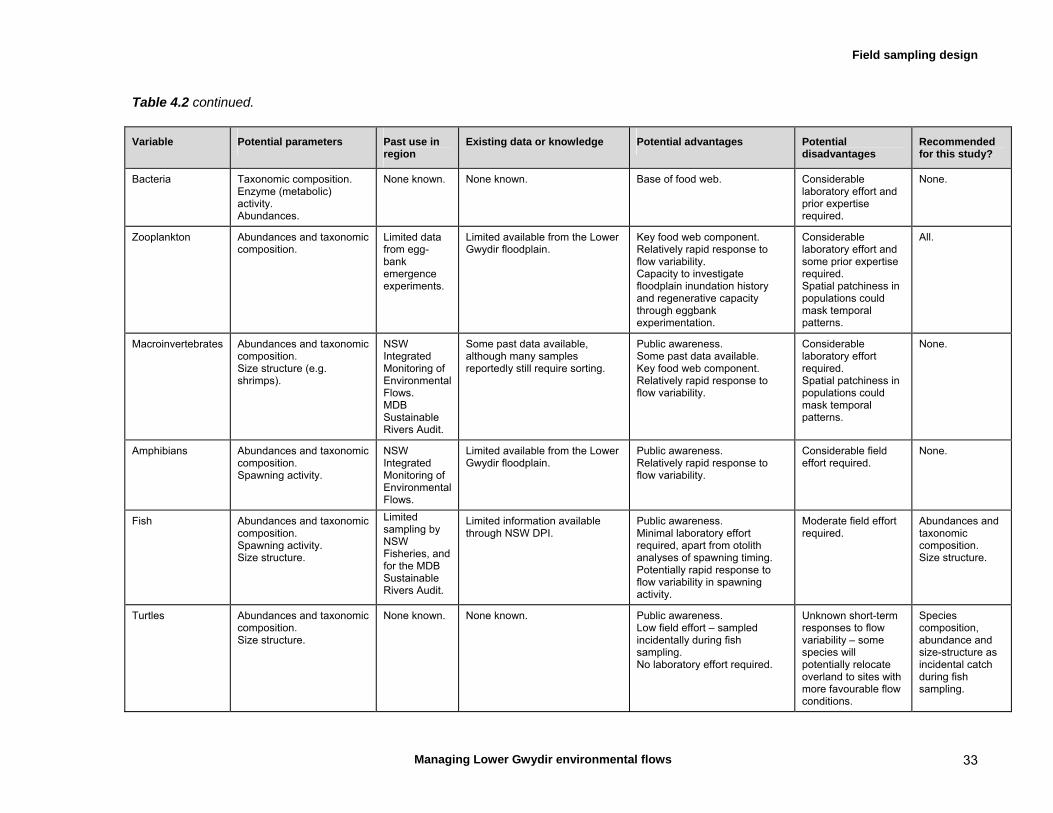
Field sampling design
Managing Lower Gwydir environmental flows 33
Table 4.2 continued.
Variable Potential parameters Past use in region
Existing data or knowledge Potential advantages Potential disadvantages
Recommended for this study?
Bacteria Taxonomic composition. Enzyme (metabolic) activity. Abundances.
None known. None known. Base of food web. Considerable laboratory effort and prior expertise required.
None.
Zooplankton Abundances and taxonomic composition.
Limited data from egg-bank emergence experiments.
Limited available from the Lower Gwydir floodplain.
Key food web component. Relatively rapid response to flow variability. Capacity to investigate floodplain inundation history and regenerative capacity through eggbank experimentation.
Considerable laboratory effort and some prior expertise required. Spatial patchiness in populations could mask temporal patterns.
All.
Macroinvertebrates Abundances and taxonomic composition. Size structure (e.g. shrimps).
NSW Integrated Monitoring of Environmental Flows. MDB Sustainable Rivers Audit.
Some past data available, although many samples reportedly still require sorting.
Public awareness. Some past data available. Key food web component. Relatively rapid response to flow variability.
Considerable laboratory effort required. Spatial patchiness in populations could mask temporal patterns.
None.
Amphibians Abundances and taxonomic composition. Spawning activity.
NSW Integrated Monitoring of Environmental Flows.
Limited available from the Lower Gwydir floodplain.
Public awareness. Relatively rapid response to flow variability.
Considerable field effort required.
None.
Fish Abundances and taxonomic composition. Spawning activity. Size structure.
Limited sampling by NSW Fisheries, and for the MDB Sustainable Rivers Audit.
Limited information available through NSW DPI.
Public awareness. Minimal laboratory effort required, apart from otolith analyses of spawning timing. Potentially rapid response to flow variability in spawning activity.
Moderate field effort required.
Abundances and taxonomic composition. Size structure.
Turtles Abundances and taxonomic composition. Size structure.
None known. None known. Public awareness. Low field effort – sampled incidentally during fish sampling. No laboratory effort required.
Unknown short-term responses to flow variability – some species will potentially relocate overland to sites with more favourable flow conditions.
Species composition, abundance and size-structure as incidental catch during fish sampling.

Field sampling design
Managing Lower Gwydir environmental flows 34
whether the parameter was likely to show a response to flow events at realistic temporal and spatial scales;
whether there was already sufficient understanding of the nature of any link with flow variability in the Lower Gwydir; and
availability of long-term data sets upon which we could build. We also used our conceptual model as a guide to the likely response of particular variables or parameters. Water chemistry, water quality, algae. We included a range of physico-chemical parameters in our monitoring, ranging from those typically measured by hand-held meters, as well as other parameters such as suspended solid load, nitrogen, phosphorous, and dissolved organic carbon. Along with chlorophyll a concentration, the latter parameters provide an indication of the short-term availability of nutrients and pelagic primary productivity. Data on some of these parameters have previously been collected in the Lower Gwydir in relation to flow variability by programs such as the NSW Integrated Monitoring of Environmental Flows. However, they are simple to collect in the field and we had good access to laboratory capacity for processing the appropriate field samples. Invertebrates. The NSW integrated Monitoring of Environmental Flows program has a 2–3 year series of aquatic macroinvertebrate samples, collected to analyse Lower Gwydir wetland responses to flow variability (N. Foster, pers. comm.). At the outset of our study, these samples were still being processed. Aquatic macroinvertebrate samples can also be time consuming to process. For these reasons, we decided not to collect further data on these assemblages. However, data on microinvertebrate responses to flow variability in the Lower Gwydir are unavailable, although the techniques for their field collection and subsequent laboratory processing are comparatively simple. For this reason, we included monitoring of these assemblages in the present study. Any responses to flow variability by microinvertebrates were also anticipated to occur at the temporal scale of our fieldwork. Our sampling method for fish (fyke nets, chapter 7) also incidentally sampled macrocrustcea such as Cherax destructor yabbies and Macrobrachium shrimps, and so we included their abundances as further invertebrate parameters. Fish. Although some data are available on the fish assemblages in the Gwydir catchment, few data were available on the Lower Gwydir channels and no responses to flow variability have been reported. Sampling methods for fish in these dryland river systems are well established (e.g. Arthington et al., 2005; Balcombe et al., 2006), and samples are relatively easy to process in the field. Moreover, any responses to flow variability are likely to be detectable at the spatial and temporal scales at which we could monitor. For these reasons, we included monitoring of fish abundance, species diversity, and size-structure. This complemented parallel studies of the influence of flow variability on fish early growth and condition in Lower Gwydir channels (Heagney et al., 2008; Wilson et al., submitted). Wetland plants. The NSW integrated Monitoring of Environmental Flows program has also collected data on wetland plant assemblages in the Lower Gwydir wetlands, and maintenance of the core terminal wetland areas is one of the key objectives for which Lower Gwydir ECA releases have been made (NSW DIPNR, 2005a; NSW DECC, 2008). One of the key drivers for these releases is also maintenance of the ecological character of the four privately-managed Ramsar wetland sites. Given these management priorities, we included wetland vegetation in the present study. Furthermore, UNE researchers commenced a
Field sampling design
Managing Lower Gwydir environmental flows 35
monitoring program on Lower Gwydir wetland plants in 1994, and this provided an opportunity for us to extend an existing data set to gain a unique medium-term perspective on responses to flow variability. These data were collected from a mix of fixed monitoring points and a series of grazing-exclosure sites spread between the Gwydir and Gingham wetland areas. Field methods are also well established for floodplain vegetation (e.g. Reid & Quinn, 2006; Alexander et al., 2008), and any responses are likely to be detectable at the spatial and temporal scales at which we could monitor. We included variables such as the percent cover of species, species composition, and germinant abundance, complementing a parallel study on the Lower Gwydir wetland soil chemistry and seed-bank emergence (Wilson et al., 2008).

Managing Lower Gwydir environmental flows 36
Part 2 Responses of Lower Gwydir wetland and in-stream environments to flow variability
Wetland vegetation – flooding vs grazing
Managing Lower Gwydir environmental flows 37
Chapter 5 Long-term analysis of the effects of inundation and grazing on vegetation communities in the Gwydir wetlands Key findings
Vegetation cover in all wetland plant communities is strongly correlated with river flows in the preceding three month period.
Vegetation cover in the Gwydir Wetlands is dominated by native perennial species.
Grazing impacts on wetland plant communities are influenced by plant morphological traits. In locations where tall herbaceous species dominate grazing breaks up canopy cover leading to an increase in light at ground level which promotes an increase in plant diversity at the local scale.
Plants belonging to the amphibious responder functional group are most vulnerable to the impacts of livestock grazing.
Recommendations
Delay grazing or maintain low stocking rates during the initial stage of wetland flooding to allow fragile plant species in the amphibious responder functional group to flower and set seed.
Maintain conservative stocking rates (0.3-0.5 animals per hectare) to protect key native species from over grazing.
Continue monitoring of the Lower Gwydir grazing-exclosure sites on an event-based basis.
Prioritise research on the response of wetland soils to inundation and their role in supporting wetland condition and function.
5.1 Introduction Grazing domestic livestock on inland river floodplains In Australia has occurred for over 150 years (Robertson, 1997). Livestock congregate in wetland areas particularly during low-rainfall conditions. The impacts of this behaviour on vegetation may include the direct loss of floodplain primary production, changes in plant community composition and introduction of exotic plant species (Robertson, 1998). Such impacts are a cause for concern for those charged with managing such areas and for members of the general population concerned with their conservation. In recent decades there has been a heightened awareness of the ecological value of these wetland systems (Williams, 1998; Jenkins et al., 2005). In particular, the role wetlands play as bird breeding sites for migratory bird species and their biodiversity value in a largely altered agricultural landscape (Alexander et al., 2008). River regulation has resulted in profound changes to the hydrological regime of many floodplain wetlands. In the Gwydir catchment the frequency and duration of inundation has decreased resulting in a reduction in floodplain productivity (Kingsford, 2000). The ecological purpose of environmental flows has been to help re-establish linkages between the river and its floodplain wetlands but grazing has been identified as one factor that may limit the

Wetland vegetation – flooding vs grazing
Managing Lower Gwydir environmental flows 38
recovery of ecological functioning in these systems (Robertson et al., 1996). Given the current situation in Australia in relation to the availability of water for consumptive uses, there is pressure from all stakeholders in the water debate for environmental water to deliver maximum ecological benefit. Therefore, it is necessary to understand the nature of the disturbance caused by livestock grazing in wetlands and the resilience of these systems to such disturbance. This study investigates the response in terms of changes in community composition of vegetation communities exposed to varying grazing pressure and inundation patterns. It takes advantage of a series of grazing exclosures established in 1994 to examine how grazing and an altered flooding regime are impacting on the Lower Gwydir wetlands and to gauge how resilient these wetlands are to such disturbances. Through understanding the impacts of the disturbance regime and monitoring the effect of measures implemented to sustain wetland vegetation, the subsequent findings can help guide future management decisions by agency staff and landholders.
5.2 Materials and methods Study sites and inundation history. Data were collected from four Lower Gwydir floodplain sites with differing plant communities, to assess the impacts of grazing by livestock, feral species and macropods (Fig. 5.1): “Old Dromana” – Bolboschoenus fluviatilis (marsh club-rush) reed bed near the downstream
end of the Gwydir River system (29° 20' 46" S, 149° 17' 38" E);
“Westholme” – Paspalum distichum (water couch) open meadow mid-way along the Gingham Watercourse (29° 15' 45" S, 149° 23' 19" E);
“Crinolyn” – degraded Paspalum distichum community, partially invaded by Phyla canescens (lippia) near the downstream end of the Gingham Watercourse (29° 12' 53" S, 149° 08' 13" E); and
“Birrah” – Paspalidium jubiflorum (Warrego summer grass) grasslands, also near the downstream end of the Gwydir River system (29° 20' 24" S, 149° 21' 14" E).
These sites were originally established by University of New England researchers in 1994, and follow a randomised complete block design. At each site, there are four replicate blocks, with the three treatments randomly allocated once to a plot within each block (Fig. 5.2). The three treatments were: GRAZED open plots that remained unfenced and unmarked;
PARTIAL partial grazing pressure, surrounded by cattle-proof fences to only exclude cattle while allowing access by macropods and feral pigs; and
UNGRAZED total exclusion of all mammal herbivores. All PARTIAL plots were fenced with 0.9 m high 6 line mesh (BHP Waratah ‘hinged joint’) suspended 0.5 m above the ground. High tensile plain wire (2.5 mm) was used to support the top and bottom of the mesh. Wooden corner posts, stays and stay blocks were used in all plots, with 1.8 m BHP star pickets carrying the wire and mesh. UNGRAZED plots were
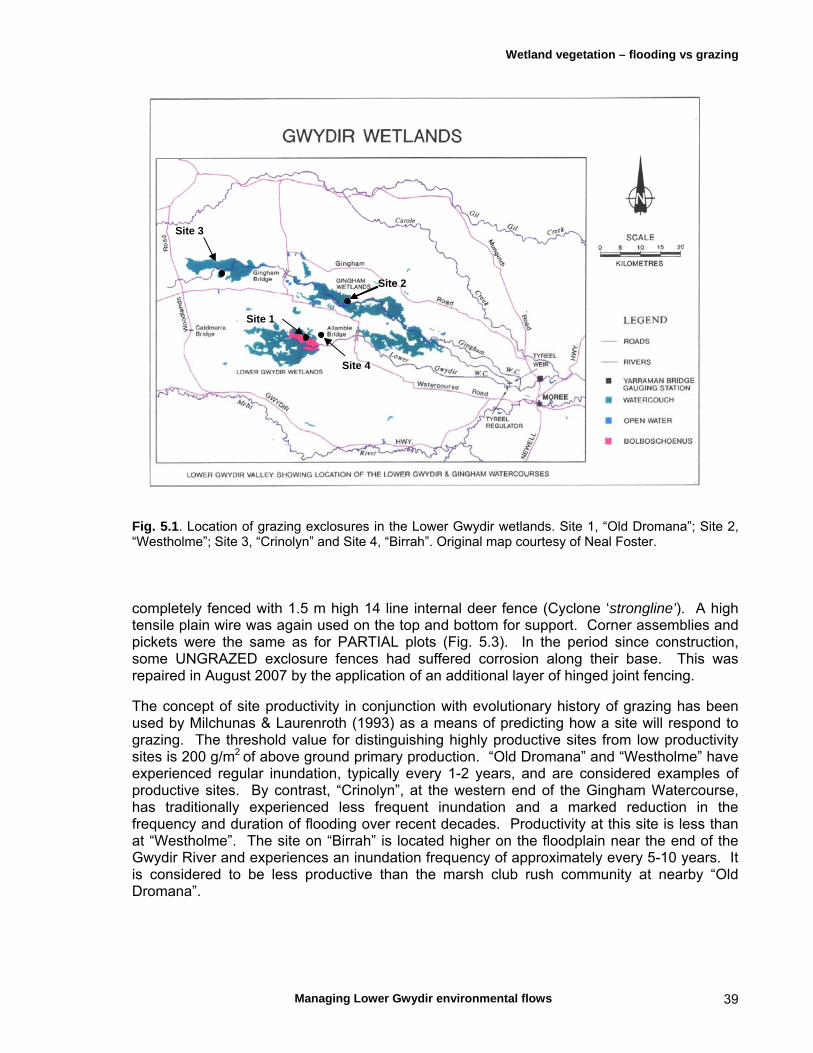
Wetland vegetation – flooding vs grazing
Managing Lower Gwydir environmental flows 39
Fig. 5.1. Location of grazing exclosures in the Lower Gwydir wetlands. Site 1, “Old Dromana”; Site 2, “Westholme”; Site 3, “Crinolyn” and Site 4, “Birrah”. Original map courtesy of Neal Foster. completely fenced with 1.5 m high 14 line internal deer fence (Cyclone ‘strongline’). A high tensile plain wire was again used on the top and bottom for support. Corner assemblies and pickets were the same as for PARTIAL plots (Fig. 5.3). In the period since construction, some UNGRAZED exclosure fences had suffered corrosion along their base. This was repaired in August 2007 by the application of an additional layer of hinged joint fencing. The concept of site productivity in conjunction with evolutionary history of grazing has been used by Milchunas & Laurenroth (1993) as a means of predicting how a site will respond to grazing. The threshold value for distinguishing highly productive sites from low productivity sites is 200 g/m2 of above ground primary production. “Old Dromana” and “Westholme” have experienced regular inundation, typically every 1-2 years, and are considered examples of productive sites. By contrast, “Crinolyn”, at the western end of the Gingham Watercourse, has traditionally experienced less frequent inundation and a marked reduction in the frequency and duration of flooding over recent decades. Productivity at this site is less than at “Westholme”. The site on “Birrah” is located higher on the floodplain near the end of the Gwydir River and experiences an inundation frequency of approximately every 5-10 years. It is considered to be less productive than the marsh club rush community at nearby “Old Dromana”.
Site 3
Site 1
Site 4
Site 2

Wetland vegetation – flooding vs grazing
Managing Lower Gwydir environmental flows 40
BLOCK A
T3 T1 T2
BLOCK B
T3 T2 T1
BLOCK C
T2 T1 T3
BLOCK D
T1 T3 T2
T1 = GRAZED - unfenced; T2 = PARTIAL - exclusion of cattle while allowing free access to kangaroos, feral pigs and foxes; and T3 = UNGRAZED - exclusion of cattle, kangaroos, feral pigs and foxes
Fig. 5.2. Layout of experimental grazing exclusion plots at four sites in the Gwydir wetlands.
Fig. 5.3. A PARTIAL grazing exclosure on “Crinolyn” (left) and an UNGRAZED exclosure at “Birrah” (right). Photos: P. Berney. Vegetation monitoring. Vegetation monitoring was conducted initially on an annual basis following the summer growth period but from 1995 to1998, sampling became more intensive to monitor vegetation responses to flooding. From 2007 onwards, monitoring was conducted both before and after environmental flows. At all monitoring times for each treatment plot, 10 1 m2 quadrats were randomly placed, and the presence of all vascular plants was recorded, as well as projected foliar cover data using a modified Braun-Blanquet scale (Mueller-Dombois & Ellenberg, 1974). This used a scale from 0 to 7 to estimate projected foliage
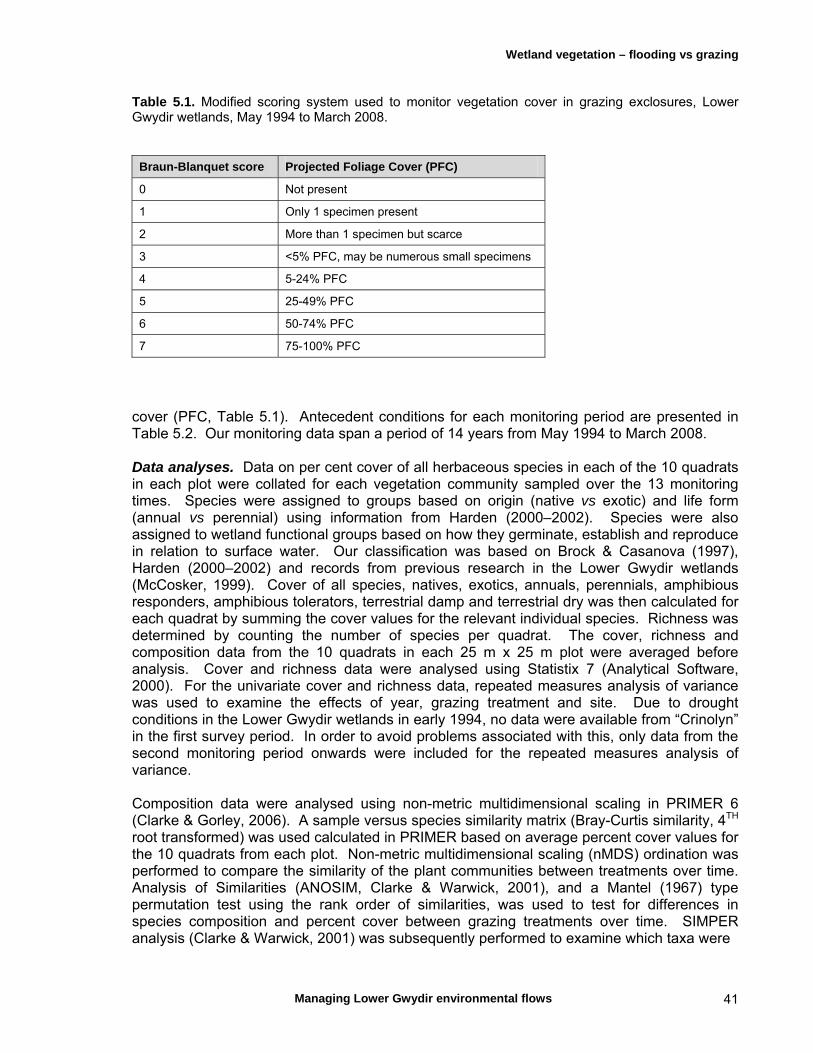
Wetland vegetation – flooding vs grazing
Managing Lower Gwydir environmental flows 41
Table 5.1. Modified scoring system used to monitor vegetation cover in grazing exclosures, Lower Gwydir wetlands, May 1994 to March 2008.
Braun-Blanquet score Projected Foliage Cover (PFC)
0 Not present
1 Only 1 specimen present
2 More than 1 specimen but scarce
3 <5% PFC, may be numerous small specimens
4 5-24% PFC
5 25-49% PFC
6 50-74% PFC
7 75-100% PFC
cover (PFC, Table 5.1). Antecedent conditions for each monitoring period are presented in Table 5.2. Our monitoring data span a period of 14 years from May 1994 to March 2008. Data analyses. Data on per cent cover of all herbaceous species in each of the 10 quadrats in each plot were collated for each vegetation community sampled over the 13 monitoring times. Species were assigned to groups based on origin (native vs exotic) and life form (annual vs perennial) using information from Harden (2000–2002). Species were also assigned to wetland functional groups based on how they germinate, establish and reproduce in relation to surface water. Our classification was based on Brock & Casanova (1997), Harden (2000–2002) and records from previous research in the Lower Gwydir wetlands (McCosker, 1999). Cover of all species, natives, exotics, annuals, perennials, amphibious responders, amphibious tolerators, terrestrial damp and terrestrial dry was then calculated for each quadrat by summing the cover values for the relevant individual species. Richness was determined by counting the number of species per quadrat. The cover, richness and composition data from the 10 quadrats in each 25 m x 25 m plot were averaged before analysis. Cover and richness data were analysed using Statistix 7 (Analytical Software, 2000). For the univariate cover and richness data, repeated measures analysis of variance was used to examine the effects of year, grazing treatment and site. Due to drought conditions in the Lower Gwydir wetlands in early 1994, no data were available from “Crinolyn” in the first survey period. In order to avoid problems associated with this, only data from the second monitoring period onwards were included for the repeated measures analysis of variance. Composition data were analysed using non-metric multidimensional scaling in PRIMER 6 (Clarke & Gorley, 2006). A sample versus species similarity matrix (Bray-Curtis similarity, 4TH root transformed) was used calculated in PRIMER based on average percent cover values for the 10 quadrats from each plot. Non-metric multidimensional scaling (nMDS) ordination was performed to compare the similarity of the plant communities between treatments over time. Analysis of Similarities (ANOSIM, Clarke & Warwick, 2001), and a Mantel (1967) type permutation test using the rank order of similarities, was used to test for differences in species composition and percent cover between grazing treatments over time. SIMPER analysis (Clarke & Warwick, 2001) was subsequently performed to examine which taxa were

Wetland vegetation – flooding vs grazing
Managing Lower Gwydir environmental flows 42
Table 5.2. Timing of grazing-exclosure monitoring in the Lower Gwydir wetlands, 1994 to 2008, and prevailing inundation conditions.
Monitoring trip Sites monitored Inundation conditions Comments
May 1994 “Old Dromana”, “Birrah”, “Westholme”
Dry; wetlands in draw down. Sampling not possible at “Crinolyn” due to drought conditions
May 1995 All Dry wetlands had last inundation during January 1995
January 1996 All Wetlands inundated following recent flooding
July 1996 All Wetlands inundated following significant flooding
October 1996 All Wetlands inundated following additional minor flooding
May 1997 All Still wet from summer flooding
September 1997 All Old Dromana wet, other sites drying out after 1-6 months of inundation
March 1998 All Old Dromana and Westholme experienced shallow inundation, Crinolyn and Birrah dry
December 1998 All All sites had experienced inundation in the previous five months
Inundation was deepest and longest at Old Dromana and Westholme.
May 2007 All Dry, wetlands in drawdown “Westholme had experienced minor flooding in a recent environmental flow
September 2007 All Dry, wetlands in draw down Good winter rainfall
January 2008 All Old Dromana and Westholme inundated from a recent environmental flow. Crinolyn and Birrah both were dry, receiving only seasonal rainfall
Good summer rainfall received at all sites
March 2008 All Old Dromana and Westholme still wet, Crinolyn and Birrah now dry
contributing most to the dissimilarity in species composition between treatments at different times.

Wetland vegetation – flooding vs grazing
Managing Lower Gwydir environmental flows 43
5.3 Results A total of 147 species of herbaceous plants was recorded within the grazing exclosures between May 1994 and March 2008, with native and introduced species comprising 69% and 31% of taxa, respectively. Perennial species accounted for 49% of the species described, with annuals making up 45%, biennial species 3% and species described as annuals or short-lived perennials comprised a further 3%. Total cover averaged 61% across all sites and years. However, the pattern of total cover when averaged across all sites varied markedly between monitoring periods (Fig. 5.4). The pattern in perennial cover mirrored changes in the total cover across all sites, indicating that patterns in total cover were driven by temporal changes in this functional group (Fig. 5.4 a). Many of the key perennial species also belong to the native functional group, therefore this group follows a similar pattern to the perennials (Fig. 5.4 c). Annual cover is generally less than perennial cover. Annual cover tends to peak in sampling periods following floods, May 1995, July 1996 or environmental flows January 2008 and March 2008. It also peaks during spring sampling times, October 1996 and September 2007 (Fig. 5.4 b). Inter-annual variation in total cover of ungrazed plots correlated with Gwydir River flows at the Yarraman Bridge gauging station for the three months prior to each survey period (Pearson r = 0.7002, P = 0.0357) (Fig. 5.5). During periods of high flow, water spills from channels through the wetlands and inundates the floodplain and stimulates growth in the floodplain vegetation. Accordingly, cover of amphibious plants also varied with patterns in inundation (Fig. 5.6), and responded differently to terrestrial; species. For example, amphibious responders reached their highest percent cover during the periods when the sites were inundated (January–October 1996), while terrestrial damp species showed the opposite pattern with their percent cover highest in the drier periods (May 1995, May 2007 and September 2007). Patterns of temporal change in plant community composition were generally similar between sites and at each monitoring time. With few exceptions, there tended to be little difference between treatments, indicating that factors other than grazing were exerting a greater influence on observed changes in community composition (Fig. 5.6). By contrast, ordination of community composition at the site level did indicate significant differences in species composition (Fig. 5.7). “Birrah”, as the driest of the sites, was separated from the wetter sites at “Old Dromana” and “Westholme”, with “Crinolyn” appearing to represent an intermediate state. Due to these differences, each site will be discussed individually. “Old Dromana” – Percent cover of the dominant Bolboschoenus fluviatilis peaked following periods of flooding (Fig. 5.8), although does not grow as vigorously on rainfall alone. When it does grow vigorously it forms a dense canopy that shades competitors and reduces local species richness. Grazing causes disturbance to the canopy as the plants are trampled and eventually consumed. This allows other species to grow under the modified environmental conditions. ANOSIM analyses showed that in May 2007, significant differences existed between the GRAZED and UNGRAZED treatments (R = 0.771, P = 0.029) and between the GRAZED and PARTIAL treatments (R = 0.521, P = 0.029). However, there was no significant difference between the PARTIAL treatment and the UNGRAZED treatment. Similarly, in September 2007, there were significant differences between the GRAZED and UNGRAZED treatments (R = 1, P = 0.029) and between the GRAZED and PARTIAL treatments (R = 1, P = 0.029).

Wetland vegetation – flooding vs grazing
Managing Lower Gwydir environmental flows 44
Total % Cover - Combined sites
Monitoring time
May
94
May
95
Jan
96Ju
l 96
Oct
96
May
97
Sep
97
Mar
98
Dec
98
May
07
Sep
07
Jan
08M
ar 0
8
% C
over
0
20
40
60
80
100
Grazed Partial Ungrazed
Perennial cover
Monitoring time
May
94
May
95
Jan
96
Jul 9
6O
ct 9
6M
ay 9
7S
ep 9
7M
ar 9
8D
ec 9
8M
ay 0
7S
ep 0
7Ja
n 08
Mar
08
% C
ove
r
0
20
40
60
80
100
Grazed
Partial
Ungrazed
Annual cover
Monitoring time
May
94
May
95
Jan
96
Jul 9
6O
ct 9
6M
ay 9
7S
ep 9
7M
ar 9
8D
ec 9
8M
ay 0
7S
ep 0
7Ja
n 08
Mar
08
% C
over
0
20
40
60
80
100
Grazed
Partial
Ungrazed
Native cover
Monitoring time
May
94
May
95
Jan
96
Jul 9
6
Oct
96
May
97
Sep
97
Mar
98
Dec
98
May
07
Sep
07
Jan
08M
ar 0
8
% C
over
0
20
40
60
80
100Grazed
Partial
Ungrazed
Introduced species cover
Monitoring time
May
94
May
95
Jan
96
Jul 9
6O
ct 9
6M
ay 9
7S
ep 9
7M
ar 9
8D
ec 9
8M
ay 0
7S
ep 0
7Ja
n 08
Mar
08
% C
ove
r
0
20
40
60
80
100
Grazed
Partial
Ungrazed
Fig. 5.4. Temporal variation in mean percent cover (±1 SE) of herbaceous plants between grazing treatments in the Lower Gwydir wetlands, 1994 to 2008. Data were averaged across the four sites.

Wetland vegetation – flooding vs grazing
Managing Lower Gwydir environmental flows 45
0
10
20
30
40
50
60
70
80
90
100
May
-94
May
-95
Jan-
96
Sep-9
6
Oct-96
May
-97
Sep-9
7
Mar
-98
Dec-98
May
-07
Sep-0
7
Jan-
08
Mar
-08
Monitoring Time
% C
ove
r
0.00
0.50
1.00
1.50
2.00
2.50
3.00
3.50
4.00
Lo
g A
v. f
low
in
pre
vio
us
12 w
ks
Av % Cover
Log Flow
Fig. 5.5. Temporal variation in mean total percent cover of vegetation across the four wetland sites, May 1994 to March 2008, and log of average daily discharge in the Gwydir River at Yarraman Bridge over previous 12 weeks.
Amphibious responder cover
Monitoring time
May
94
May
95
Jan
96
Jul 9
6O
ct 9
6M
ay 9
7S
ep 9
7M
ar 9
8D
ec 9
8M
ay 0
7S
ep 0
7Ja
n 08
Mar
08
% C
ove
r
0
20
40
60
80
100
Amphibious tolerator cover
Monitoring time
May
94
May
95
Jan
96
Jul 9
6O
ct 9
6M
ay 9
7S
ep 9
7M
ar 9
8D
ec 9
8M
ay 0
7S
ep 0
7Ja
n 08
Mar
08
% C
over
0
20
40
60
80
100
Terrestrial damp cover
Monitoring time
May
94
May
95
Jan
96
Jul 9
6
Oct
96
May
97
Sep
97
Mar
98
Dec
98
May
07
Sep
07
Jan
08
Mar
08
% C
ove
r
0
20
40
60
80
100Terrestrial dry cover
Monitoring time
May
94
May
95
Jan
96
Jul 9
6
Oct
96
May
97
Sep
97
Mar
98
Dec
98
May
07
Sep
07
Jan
08
Mar
08
% C
ove
r
0
20
40
60
80
100
Fig. 5.6. Temporal variation in mean percent cover of herbaceous species arranged in wetland functional groups between grazing treatments in the Lower Gwydir wetlands, May 1994 to March 2008. Error bars are ±1 standard error, and are averaged across the four sites.
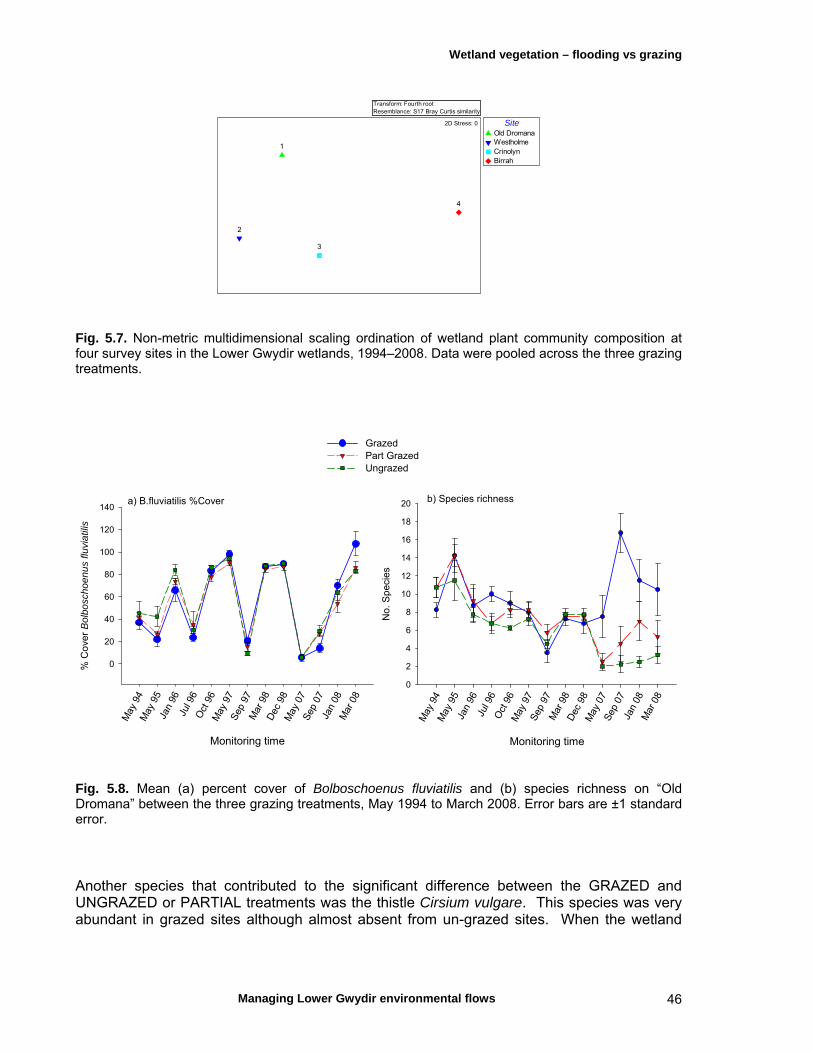
Wetland vegetation – flooding vs grazing
Managing Lower Gwydir environmental flows 46
Transform: Fourth rootResemblance: S17 Bray Curtis similarity
SiteOld DromanaWestholmeCrinolynBirrah
1
2
3
4
2D Stress: 0
Fig. 5.7. Non-metric multidimensional scaling ordination of wetland plant community composition at four survey sites in the Lower Gwydir wetlands, 1994–2008. Data were pooled across the three grazing treatments.
a) B.fluviatilis %Cover
Monitoring time
May
94
May
95
Jan
96Ju
l 96
Oct
96
May
97
Sep
97
Mar
98
Dec
98
May
07
Sep
07
Jan
08M
ar 0
8
% C
ove
r B
olb
osc
ho
en
us
fluvi
atil
is
0
20
40
60
80
100
120
140
Grazed Part Grazed Ungrazed
b) Species richness
Monitoring time
May
94
May
95
Jan
96Ju
l 96
Oct
96
May
97
Sep
97
Mar
98
Dec
98
May
07
Sep
07
Jan
08M
ar 0
8
No.
Sp
ecie
s
0
2
4
6
8
10
12
14
16
18
20
Fig. 5.8. Mean (a) percent cover of Bolboschoenus fluviatilis and (b) species richness on “Old Dromana” between the three grazing treatments, May 1994 to March 2008. Error bars are ±1 standard error. Another species that contributed to the significant difference between the GRAZED and UNGRAZED or PARTIAL treatments was the thistle Cirsium vulgare. This species was very abundant in grazed sites although almost absent from un-grazed sites. When the wetland

Wetland vegetation – flooding vs grazing
Managing Lower Gwydir environmental flows 47
was flooded again in late November 2007, B. fluviatilis grew vigorously and reformed a dense canopy and species richness began to fall again. Many of the species at the “Old Dromana” GRAZED sites were amphibious species. During flood periods, cover of taxa in all functional groups generally increased, although the extent of the increase for amphibious responder taxa in grazed sites was less (Fig. 5.9). Plants belonging to this functional group are often more delicate and appear to be negatively impacted by the presence of grazing. “Westholme” – During initial survey periods, there were no significant differences in species composition between treatments, although significant differences were detected during 2007 (Fig. 5.10). In May 2007, ANOSIM detected a significant difference between the GRAZED and the UNGRAZED treatments (R = 0.885, P = 0.029), and between the GRAZED and PARTIAL treatments (R = 0.656, P = 0.029). The vegetation community at this site was dominated by water couch, Paspalum distichum, and it was this species that contributed most to the observed treatment effect on plant cover (Fig. 5.10). This species had reduced cover in UNGRAZED plots, while other species such as Persicaria decipiens, Persicaria orientalis and Rumex tenax exhibited an opposite pattern. Once grazing is excluded, it appears to allow grazing-sensitive herbaceous species to grow more successfully, and these species end up shading out the Paspalum distichum to and reduce its dominance. Grazing at this site appears to aid in maintaining the dominance of Paspalum distichum. The impact of wetland water regime on shaping plant community composition is evident at this site. Percent cover of the amphibious responder taxa which are adapted to surviving extended periods of inundation increased following floods in 1996, 1997, 1998 and environmental flows in 2007 (Fig. 5.11a). By contrast, the percent cover of terrestrial damp taxa was low throughout the mid 1990s period of regular flooding (Fig. 5.11b.). Prior to monitoring of the site in 2007, it had been several years since the site was flooded, and terrestrial taxa had become well established in the wetland. However, following inundation from the environmental flow in November 2007, percent cover of plants in this functional group fell substantially. Similarly for Phyla canescens, percent cover remained low while the site experienced regular floods but increased during the dry period prior to the November 2007 ECA release (Fig. 5.12). By the March 2008 monitoring period, P. canescens cover had decreased in all treatments. These impacts on the plant community composition probably occur because the duration of inundation at this site can last for several months. This provides an extended period of favourable growth conditions for established natives such as P. distichum. At sites where duration of flooding is less prolonged, such compositional changes were not observed. “Crinolyn” – This site has traditionally experienced a lower frequency and duration of flooding than sites such as “Westholme” closer to the eastern end of the wetlands. Like “Westholme”, it had extensive meadows of P. distichum, although a substantial change in plant community composition has occurred since monitoring of this site began. In particular, the percent cover of P. distichum has decreased while the cover of P. canescens has increased (Fig. 5.13). During 2007 and 2008, two ECA releases were made into the Gingham Watercourse. On both occasions, while the grazing exclosure sites at “Westholme were inundated, those on “Crinolyn” remained dry. At present, the main source of moisture sustaining the plant
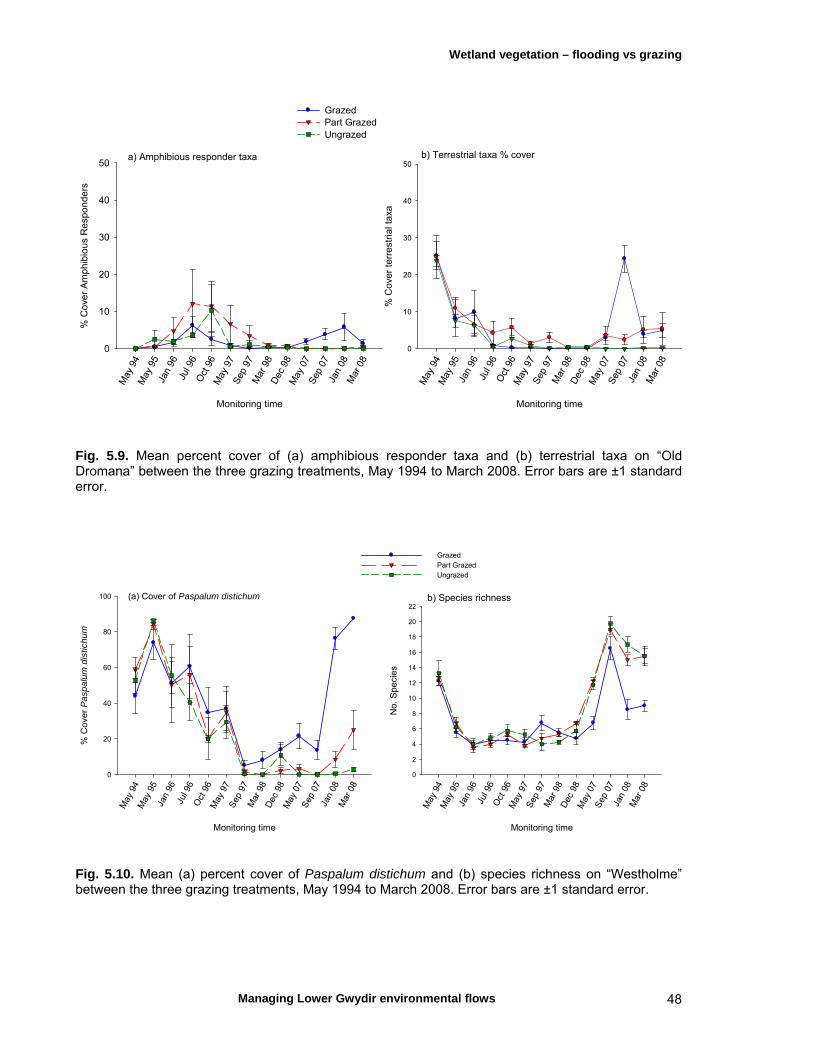
Wetland vegetation – flooding vs grazing
Managing Lower Gwydir environmental flows 48
a) Amphibious responder taxa
Monitoring time
May
94
May
95
Jan
96Ju
l 96
Oct
96
May
97
Sep
97
Mar
98
Dec
98
May
07
Sep
07
Jan
08M
ar 0
8
% C
ove
r A
mph
ibio
us R
esp
on
ders
0
10
20
30
40
50
Grazed Part Grazed Ungrazed
b) Terrestrial taxa % cover
Monitoring time
May
94
May
95
Jan
96Ju
l 96
Oct
96
May
97
Sep
97
Mar
98
Dec
98
May
07
Sep
07
Jan
08M
ar 0
8
% C
ove
r te
rre
stri
al t
axa
0
10
20
30
40
50
Fig. 5.9. Mean percent cover of (a) amphibious responder taxa and (b) terrestrial taxa on “Old Dromana” between the three grazing treatments, May 1994 to March 2008. Error bars are ±1 standard error.
(a) Cover of Paspalum distichum
Monitoring time
May
94
May
95
Jan
96Ju
l 96
Oct
96
May
97
Sep
97
Mar
98
Dec
98
May
07
Sep
07
Jan
08M
ar 0
8
% C
ove
r P
asp
alu
m d
istic
hu
m
0
20
40
60
80
100
Grazed Part Grazed Ungrazed
b) Species richness
Monitoring time
May
94
May
95
Jan
96Ju
l 96
Oct
96
May
97
Sep
97
Mar
98
Dec
98
May
07
Sep
07
Jan
08M
ar 0
8
No
. S
pe
cies
0
2
4
6
8
10
12
14
16
18
20
22
Fig. 5.10. Mean (a) percent cover of Paspalum distichum and (b) species richness on “Westholme” between the three grazing treatments, May 1994 to March 2008. Error bars are ±1 standard error.
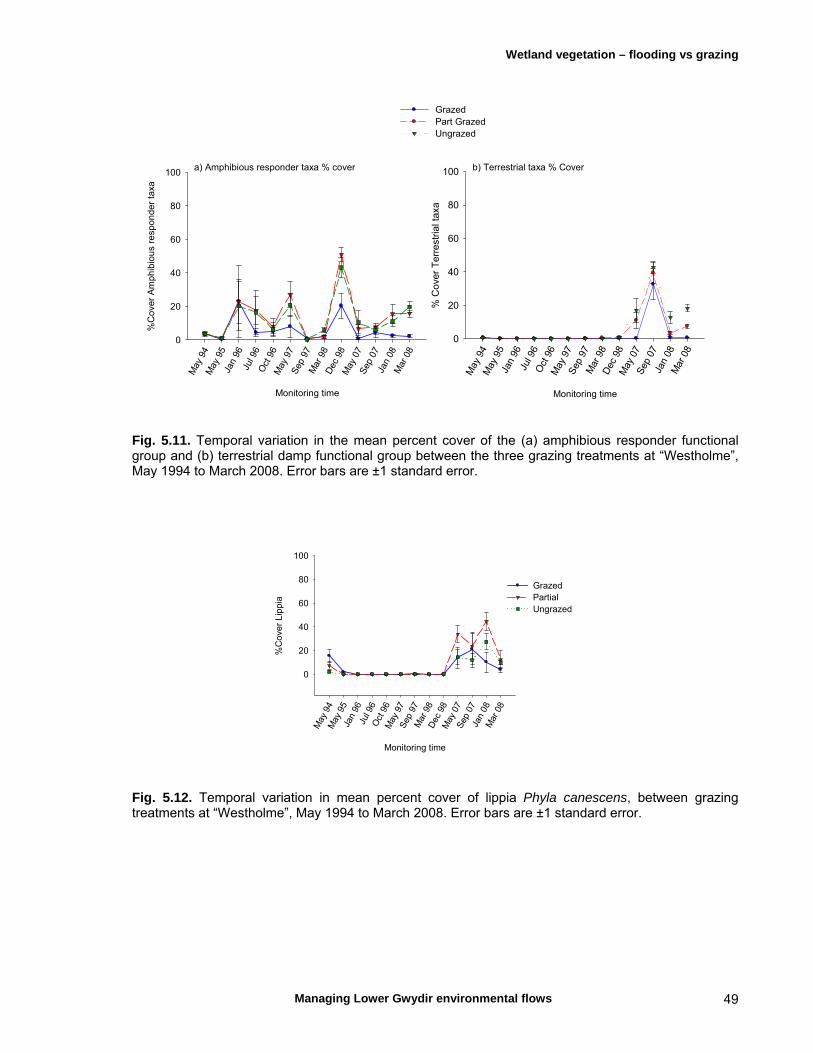
Wetland vegetation – flooding vs grazing
Managing Lower Gwydir environmental flows 49
a) Amphibious responder taxa % cover
Monitoring time
May
94
May
95
Jan
96Ju
l 96
Oct
96
May
97
Sep
97
Mar
98
Dec
98
May
07
Sep
07
Jan
08M
ar 0
8
%C
ove
r A
mph
ibio
us
resp
onde
r ta
xa
0
20
40
60
80
100b) Terrestrial taxa % Cover
Monitoring time
May
94
May
95
Jan
96Ju
l 96
Oct
96
May
97
Sep
97
Mar
98
Dec
98
May
07
Sep
07
Jan
08M
ar 0
8
% C
over
Te
rres
tria
l tax
a
0
20
40
60
80
100
Grazed Part Grazed Ungrazed
Fig. 5.11. Temporal variation in the mean percent cover of the (a) amphibious responder functional group and (b) terrestrial damp functional group between the three grazing treatments at “Westholme”, May 1994 to March 2008. Error bars are ±1 standard error.
Monitoring time
May
94
May
95
Jan
96Ju
l 96
Oct
96
May
97
Sep
97
Mar
98
Dec
98
May
07
Sep
07
Jan
08M
ar 0
8
%C
ove
r L
ipp
ia
0
20
40
60
80
100
Grazed PartialUngrazed
Fig. 5.12. Temporal variation in mean percent cover of lippia Phyla canescens, between grazing treatments at “Westholme”, May 1994 to March 2008. Error bars are ±1 standard error.

Wetland vegetation – flooding vs grazing
Managing Lower Gwydir environmental flows 50
a) Paspalum distichum % cover
Monitoring time
May
94
May
95
Jan
96Ju
l 96
Oct
96
May
97
Sep
97
Mar
98
Dec
98
May
07
Sep
07
Jan
08M
ar 0
8
%C
ove
r P
asp
alu
m d
istic
hu
m
0
20
40
60
80
100
Grazed Part Grazed Ungrazed
b) Phyla canescens % cover
Monitoring timeM
ay 9
4M
ay 9
5Ja
n 96
Jul 9
6O
ct 9
6M
ay 9
7S
ep 9
7M
ar 9
8D
ec 9
8M
ay 0
7S
ep 0
7Ja
n 08
Mar
08
%C
ove
r L
ipp
ia
0
20
40
60
80
100
Fig. 5.13. Temporal variation in mean percent cover of Paspalum distichum and Phyla canescens between grazing treatments on “Crinolyn”, May 1995 to March 2008. Error bars are ±1 standard error. community on “Crinolyn” appears to be rainfall. Plants belonging to the amphibious functional groups tend to occur around depressions where small ephemeral pools form. The lack of prolonged inundation and the limited amount of moisture provided by rainfall appears to have created conditions ideal for the expansion of P. canescens. GRAZED sites at “Crinolyn” had a lower cover of P. distichum in the three monitoring periods in 1996 and May 1997. By September 1997, the cover of P. distichum had dropped to almost zero. Flooding of the site in 1998 occurred in winter and there was no substantial response by water couch to this event. Apart from these times, there were no apparent differences between grazing treatments at this site. “Birrah” – The location of the grazing exclosures on “Birrah” is higher on the floodplain than at the other three study sites. Here, the frequency of flooding is now approximately once every 5-10 years, and the plant community is characterised by taxa capable of tolerating inundation for short periods rather than true wetland taxa. The dominant grass at the site is Warrego summer grass (Paspalidium jubiflorum). Trends in percent cover across grazing treatments were not consistent. Paspalidium jubiflorum showed significantly higher cover at GRAZED sites on some occasions, indicating that it may be tolerant to grazing. These peaks occurred when rainfall or flooding coincided with the growing season in summer (Fig. 5.14a). Cover of Panicum decompositum was high in May 1995 and through 1996 when the site was flooded for brief periods (Fig. 5.14b). Cover of this species has remained relatively low in recent years while the site has only received moisture from rainfall. Other grass species such as Queensland blue grass (Dicantheum sericeum), curly windmill grass and silky brown top (Eulalia aurea) have been
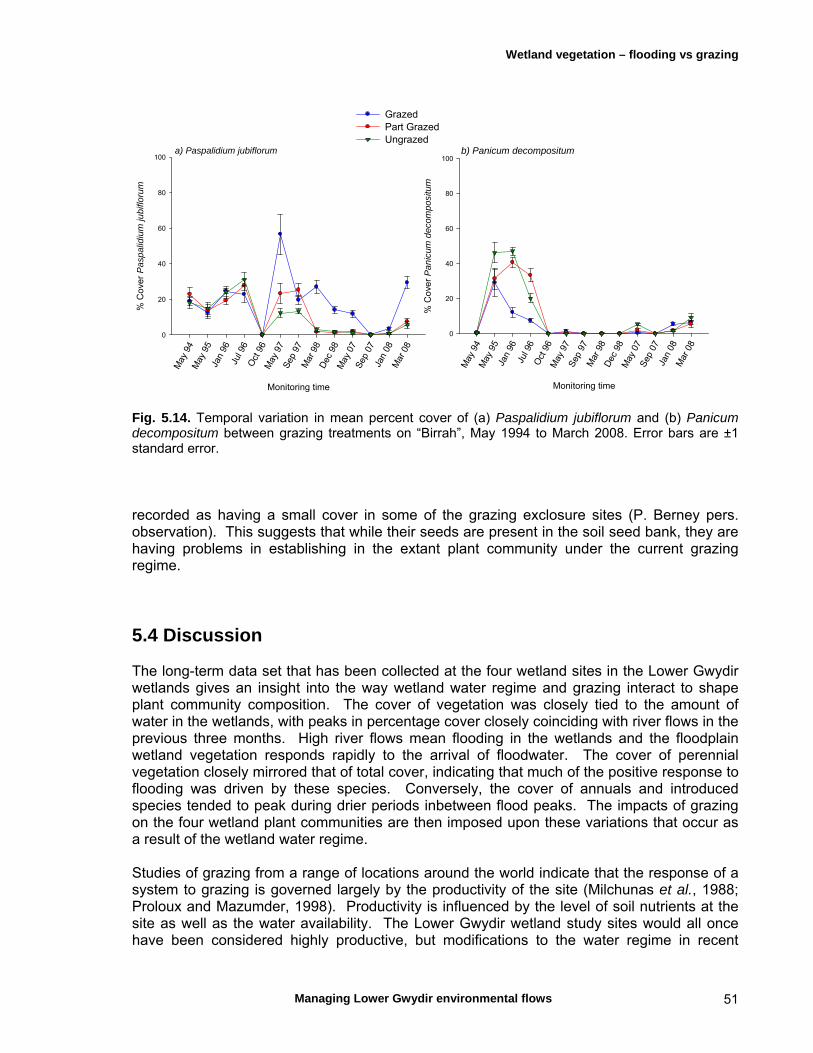
Wetland vegetation – flooding vs grazing
Managing Lower Gwydir environmental flows 51
a) Paspalidium jubiflorum
Monitoring time
May
94
May
95
Jan
96Ju
l 96
Oct
96
May
97
Sep
97
Mar
98
Dec
98
May
07
Sep
07
Jan
08M
ar 0
8
% C
over
Pa
spal
idiu
m ju
bifl
oru
m
0
20
40
60
80
100
Grazed Part Grazed Ungrazed
b) Panicum decompositum
Monitoring time
May
94
May
95
Jan
96Ju
l 96
Oct
96
May
97
Sep
97
Mar
98
Dec
98
May
07
Sep
07
Jan
08M
ar 0
8
% C
ove
r P
an
icum
dec
omp
ositu
m
0
20
40
60
80
100
Fig. 5.14. Temporal variation in mean percent cover of (a) Paspalidium jubiflorum and (b) Panicum decompositum between grazing treatments on “Birrah”, May 1994 to March 2008. Error bars are ±1 standard error. recorded as having a small cover in some of the grazing exclosure sites (P. Berney pers. observation). This suggests that while their seeds are present in the soil seed bank, they are having problems in establishing in the extant plant community under the current grazing regime.
5.4 Discussion The long-term data set that has been collected at the four wetland sites in the Lower Gwydir wetlands gives an insight into the way wetland water regime and grazing interact to shape plant community composition. The cover of vegetation was closely tied to the amount of water in the wetlands, with peaks in percentage cover closely coinciding with river flows in the previous three months. High river flows mean flooding in the wetlands and the floodplain wetland vegetation responds rapidly to the arrival of floodwater. The cover of perennial vegetation closely mirrored that of total cover, indicating that much of the positive response to flooding was driven by these species. Conversely, the cover of annuals and introduced species tended to peak during drier periods inbetween flood peaks. The impacts of grazing on the four wetland plant communities are then imposed upon these variations that occur as a result of the wetland water regime. Studies of grazing from a range of locations around the world indicate that the response of a system to grazing is governed largely by the productivity of the site (Milchunas et al., 1988; Proloux and Mazumder, 1998). Productivity is influenced by the level of soil nutrients at the site as well as the water availability. The Lower Gwydir wetland study sites would all once have been considered highly productive, but modifications to the water regime in recent
Wetland vegetation – flooding vs grazing
Managing Lower Gwydir environmental flows 52
decades have reduced the productivity at sites such as “Crinolyn” and “Birrah”. In particular, “Crinolyn” has experienced an increase in the presence of lippia, and this has tended to outcompete the native species. At “Birrah”, the frequency of flooding has decreased but lippia is not so dominant at this site. The predicted response to the removal of grazing at productive sites is that there will be an increase in the biomass of tall grazing-sensitive plants which may result in a local-scale decrease in species richness through these species competitively excluding smaller ones. At less productive sites, removal of grazing may not lead to any major increase in biomass but usually results in an increase in species richness as there is an increase in the cover of small grazing-sensitive plants (Lunt et al., 2007). The impacts of grazing detected in the grazing exclosures were generally consistent with what models of grazing predict. There are some inconsistencies associated with the sites and the morphological form of the dominant species. These differences in response can be seen when comparing the two most frequently flooded sites, “Old Dromana” and “Westholme”. At “Old Dromana”, the dominant plant species is marsh club-rush, Bolboschoenus fluviatilis. Cattle grazing at this site leads to an increase in local species richness as the shading effect of the marsh club-rush is lost and other taxa such as swamp buttercup (Ranunculus undosus) and slender knotweed (Persicaria decipiens) can flourish under the reduced competition. However, the situation at “Westholme’ was different where Paspalum distichum was the dominant species and grazing appeared to favour its dominance. At sites without cattle grazing, a range of tall herbaceous species were common and these shaded out the P. distichum. The morphological shape of this plant is more tolerant to grazing than tall herbaceous species with their apical nodes near the top of the plant. Plants in the amphibious responder functional group were present during periods of flooding, although the cover of this functional group was frequently less at sites grazed by livestock in comparison to un-grazed sites. Plants in this functional group are delicate, often using water to support their stems while their leaves float on the water surface. Species in this functional group would, therefore, be susceptible to both grazing and the impacts of cattle moving through the wetlands. In contrast, amphibious tolerator plants are structurally more solid and appear better able to stand the impacts of cattle moving through the wetland and standing on them. Encouraging landholders to restrain from grazing their cattle in wetlands while there is water has merit as a means of reducing the impact of grazing animals on both fragile plants and the soil while it is in a soft condition. Overall, the impact of grazing on wetland plant communities detected through this grazing exclosure experiment was small. Grazing has resulted in some changes to plant community composition, but in general the wetland ecosystem tends to be showing considerable resilience to the impacts of this disturbance process. In contrast, the changes in community composition associated with altered flow regime are considerably larger. It appears that flow regime is the most significant factor shaping plant communities in the Lower Gwydir wetlands. There are several possible reasons for the high level of resilience to grazing. Firstly, stocking rates are low (0.5-1.0 cattle per hectare) in comparison to figures reported from other parts of the Murray-Darling Basin (e.g. Robertson, 1988) where stocking rates as high as 12 cows per hectare were recorded. Secondly, soil type may be important in resisting some of the detrimental impacts associated with wetland grazing. Soils in the Lower Gwydir wetlands are usually grey cracking clays. These soils crack readily as they dry out, and are considered to be self-mulching due to surface soil and organic matter falling into cracks. Upon wetting, they swell and regenerate their structure which helps reduce the impact of pugging. These features also mean that seeds can successfully germinate and re-establish their species in
Wetland vegetation – flooding vs grazing
Managing Lower Gwydir environmental flows 53
the extant plant community following periods of good rainfall or flooding. A third factor that is also relevant to the study wetland areas is that the topography of the landscape is very flat and water spreads across the floodplain during floods. This results in there being few low points around which cattle can congregate and concentrate any possible impacts. Any grazing pressure is spread more evenly over the floodplain. Grazing will continue to be a major land use in the Lower Gwydir wetlands in the future and wetland paddocks will continue to play a key role in the grazing management scheme on many properties. Measures currently in use to protect the wetlands need to be promoted. Strategies that provide greater management control over stock movements, such as fencing of large wetland paddocks into smaller management units and strategic positioning of watering points, can help control the timing and the focus of grazing disturbance in wetland paddocks. Conservative stocking rates and protection from stocking following inundation and during flowering and seed-set are strategies that will also assist in minimising the impact of grazing cattle. These measures ensure a precautionary approach to wetland grazing is adopted. Further research, particularly on the impact of grazing on soil condition and the response of soil to wetting and drying, is warranted as soil condition is the slowest response variable to the impact of grazing in wetlands, but also the slowest to recover if allowed to deteriorate.
Wetland vegetation – ECA releases
Managing Lower Gwydir environmental flows 54
Chapter 6 Wetland vegetation responses to recent Environmental Contingency Allowance releases Key findings
Ecological responses to flow events differ seasonally. Delivery of environmental water in spring or early summer will produce a more vigorous and longer lasting response in wetland vegetation than an autumn flow.
The spatial extent of the influence of ECA flows on vegetation in the Lower Gwydir wetlands may be limited. Recent ECA flow volumes were insufficient to wet all Ramsar wetland sites in the Gwydir Wetlands.
All wetland sites monitored following ECA releases had resilient plant communities in the face of a modified water regime. Key wetland taxa emerged at all sites monitored.
Management recommendations
Continue to include event-based vegetation monitoring in relation to reporting ecological outcomes from Lower Gwydir ECA releases.
Future monitoring of vegetation responses to ECA flows should include quantifying changes in biomass as well as percent foliar cover.
The spatial extent of impact from an ECA flow and the duration of flooding are likely to be maximised when ECA releases follow a natural flood event.
Recognise that ecological responses to flow events will likely differ seasonally. Although significant flood events have occurred in winter in the Lower Gwydir floodplain, the region has a summer-dominant rainfall pattern and the timing of future ECA events should match this whenever possible.
6.1 Introduction The provision of extra water to wetlands is a key ecological objective for the current management of ECA releases into the Lower Gwydir wetlands (NSW DIPNR, 2005a). Inundation of these wetlands is believed to achieve two main goals. Firstly, it helps to maintain diversity in the soil seed bank as plant species get the opportunity to set seed more often with increased flooding frequency, thus reducing the risk of seeds becoming non-viable in the soil due to lack of germination opportunities (Brock, 1998). Secondly, it helps maintain the growth vigour of existing native species which had previously been reported as declining in areas with reduced frequency and duration of inundation (McCosker, 1996). Vigorous growth is important for native species, especially grasses, in order for them to compete effectively with introduced invasive species such as lippia (Hobson, 1999; Roberts & Marston, 2000). The extent to which these desired outcomes are achieved will be influenced by the volume and timing of environmental water delivered. In order to manage future releases for vegetation objectives in an adaptive framework, robust before-after-reference-impact monitoring will be necessary to document the spatial and (particularly) temporal responses to recent releases.

Wetland vegetation – ECA releases
Managing Lower Gwydir environmental flows 55
The present study describes changes in wetland plant communities following two ECA flows into the Lower Gwydir wetlands in 2007. Each of these flow events was aimed at supporting the health of wetland plant communities in the core terminal wetland areas. The first flow occurred only in the Gingham Watercourse in April 2007, while the second in November 2007 was directed into both the Gingham Watercourse and Gwydir River.
6.2 Materials and methods ECA hydrology and study sites. We monitored responses of wetland vegetation to two ECA releases in 2007 (Fig. 6.1). The first of these passed the Yarraman Bridge flow gauge from the 4th April to the 2nd of May, and was released solely into the Gingham Watercourse. Its average discharge at Yarraman Bridge was 265 ML per day, with a peak of 355 ML per day. Further downstream in the Gingham Watercourse at the Teralba gauge, flows averaged 196 ML per day and peaked briefly at 294 ML per day. The second ECA event was released into both the Gingham Watercourse and Gwydir River. It passed the Yarraman Bridge gauge from the 19th November to the 15th December, at an average rate of 514 ML per day and a peak of 651 ML per day. Downstream at the Teralba gauge, flows averaged 246 ML per day and peaked at 299 ML per day. Similarly, at the Millewa gauge near the end of the natural Gwydir River channel, flows averaged 253 ML per day and peaked at 315 ML per day. For the April-May release, a series of monitoring sites was established along the Gingham Watercourse at “Joanville”, “Westholme”, Goddard’s Lease, “Munwonga” and “Crinolyn” (Fig. 6.2). In addition, two control sites were selected at “Allambie” and “Currigundi Station” on the Lower Gwydir River floodplain. The sites “Joanville” and “Westholme” were primarily water couch (Paspalum distichum) – spike rush (Eleocharis plana) meadows. “Goddard’s Lease” and “Munwonga” sites were dominated by cumbungi (Typha domingensis) close to the channel which gives way to water couch as elevation increases away from the channel. The “Crinolyn” site was once a water couch – spike rush meadow but now is dominated by lippia (Phyla canescens). The first control site, “Allambie”, was a grassy woodland site. The understorey was dominated by lippia, but also contained a number of aquatic species such as nardoo (Marsilea drummondii) and the sedge dirty dora (Cyperus difformis). The second control site, at “Currigundi” was on the floodplain of the Gwydir River. The site contained a significant amount of lippia, together with a range of native grasses such as Warrego summer grass (Paspalidium jubiflorum), terrestrial forb species (Einardia nutans), and aquatic species such as nardoo and dirty dora. For the November release, two impact sites were selected on “Old Dromana” near the end of the Gwydir River channel and on “Bunnor” on the Gingham Watercourse. The vegetation on “Old Dromana” was dominated by water couch and lippia, while several other aquatic species such as water primrose (Ludwigia peploides) and water milfoil (Myriophyllum variifolium) were also present. By contrast, “Bunnor” was dominated by cumbungi (Typha domingensis) and water couch, and so this design allowed a comparison of the influence of ECA releases on two assemblage types. Both sites experience flooding every one to two years. Control sites for the November release were both located on “Munwonga” and did not receive any inundation from the environmental flow. The first of these was located in a water couch dominated meadow and the second was located on the edge of the Gingham Waterhole in an area of cumbungi, lignum (Muehlenbeckia florulenta) and water couch.
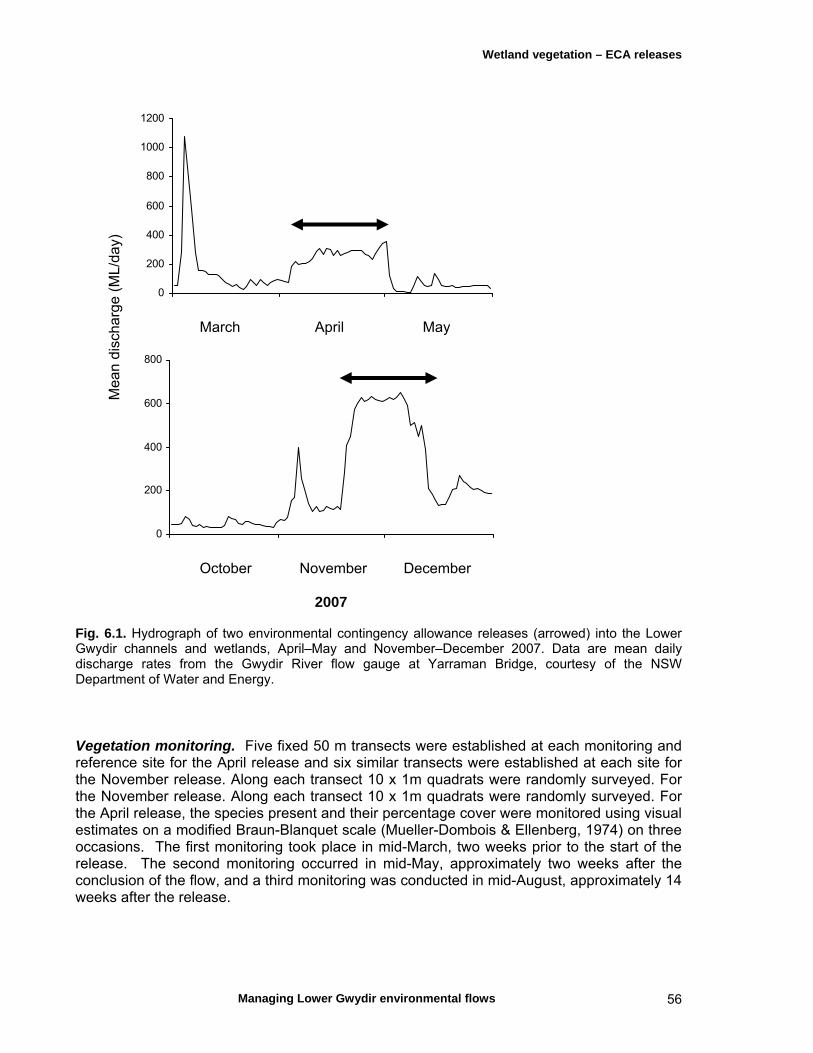
Wetland vegetation – ECA releases
Managing Lower Gwydir environmental flows 56
0
200
400
600
800
1000
1200
March April May
0
200
400
600
800
October November December
2007 Fig. 6.1. Hydrograph of two environmental contingency allowance releases (arrowed) into the Lower Gwydir channels and wetlands, April–May and November–December 2007. Data are mean daily discharge rates from the Gwydir River flow gauge at Yarraman Bridge, courtesy of the NSW Department of Water and Energy. Vegetation monitoring. Five fixed 50 m transects were established at each monitoring and reference site for the April release and six similar transects were established at each site for the November release. Along each transect 10 x 1m quadrats were randomly surveyed. For the November release. Along each transect 10 x 1m quadrats were randomly surveyed. For the April release, the species present and their percentage cover were monitored using visual estimates on a modified Braun-Blanquet scale (Mueller-Dombois & Ellenberg, 1974) on three occasions. The first monitoring took place in mid-March, two weeks prior to the start of the release. The second monitoring occurred in mid-May, approximately two weeks after the conclusion of the flow, and a third monitoring was conducted in mid-August, approximately 14 weeks after the release.
Mea
n di
scha
rge
(ML/
day)
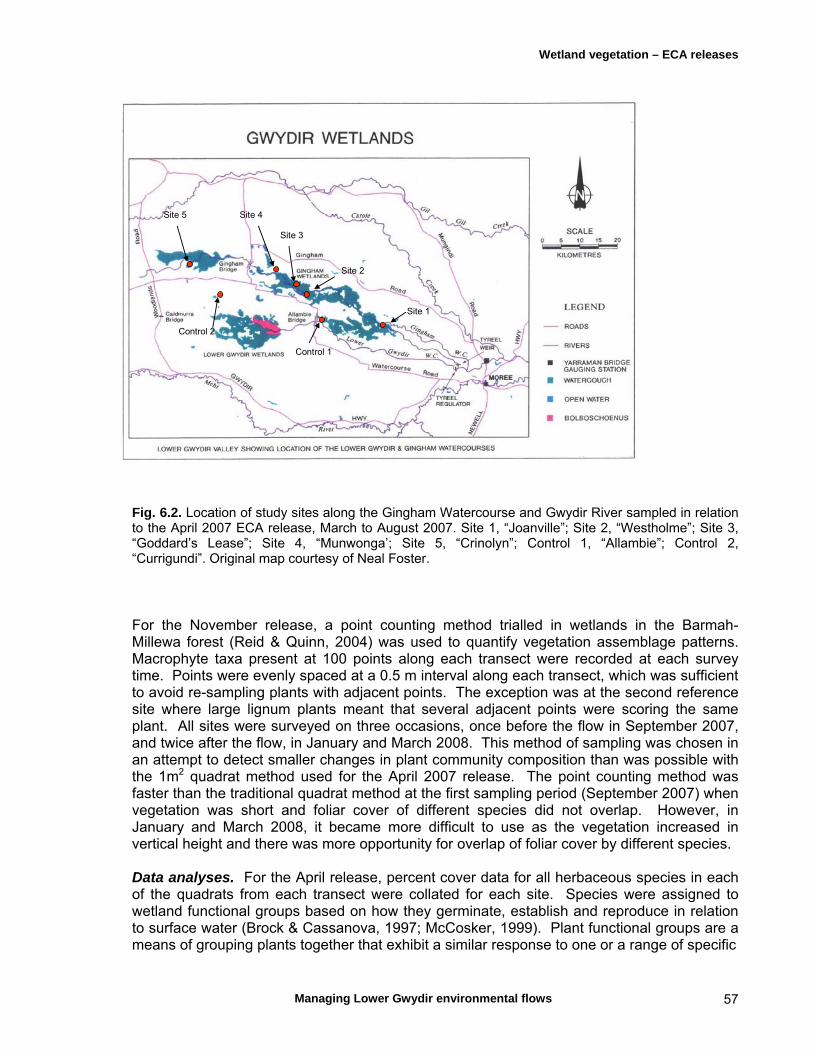
Wetland vegetation – ECA releases
Managing Lower Gwydir environmental flows 57
Fig. 6.2. Location of study sites along the Gingham Watercourse and Gwydir River sampled in relation to the April 2007 ECA release, March to August 2007. Site 1, “Joanville”; Site 2, “Westholme”; Site 3, “Goddard’s Lease”; Site 4, “Munwonga’; Site 5, “Crinolyn”; Control 1, “Allambie”; Control 2, “Currigundi”. Original map courtesy of Neal Foster. For the November release, a point counting method trialled in wetlands in the Barmah-Millewa forest (Reid & Quinn, 2004) was used to quantify vegetation assemblage patterns. Macrophyte taxa present at 100 points along each transect were recorded at each survey time. Points were evenly spaced at a 0.5 m interval along each transect, which was sufficient to avoid re-sampling plants with adjacent points. The exception was at the second reference site where large lignum plants meant that several adjacent points were scoring the same plant. All sites were surveyed on three occasions, once before the flow in September 2007, and twice after the flow, in January and March 2008. This method of sampling was chosen in an attempt to detect smaller changes in plant community composition than was possible with the 1m2 quadrat method used for the April 2007 release. The point counting method was faster than the traditional quadrat method at the first sampling period (September 2007) when vegetation was short and foliar cover of different species did not overlap. However, in January and March 2008, it became more difficult to use as the vegetation increased in vertical height and there was more opportunity for overlap of foliar cover by different species. Data analyses. For the April release, percent cover data for all herbaceous species in each of the quadrats from each transect were collated for each site. Species were assigned to wetland functional groups based on how they germinate, establish and reproduce in relation to surface water (Brock & Cassanova, 1997; McCosker, 1999). Plant functional groups are a means of grouping plants together that exhibit a similar response to one or a range of specific
Site 1
Control 1
Site 2
Site 3
Site 4Site 5
Control 2
Site 1
Control 1
Site 2
Site 3
Site 4Site 5
Control 2

Wetland vegetation – ECA releases
Managing Lower Gwydir environmental flows 58
Fig. 6.3. Location of impact and reference study sites for monitoring vegetation responses to the November 2007 ECA release into the Lower Gwydir wetlands, September 2007 to March 2008. Impact site 1, “Old Dromana”; Impact site 2, “Westholme”; Control site 1, “Munwonga” A; Control site 2, “Munwonga” B. Original map courtesy of Neal Foster. environmental conditions such as water regime (Roberts et al., 2000). Following the work of Brock & Cassanova (1997), wetland species can be grouped based on where they grow in a wetland and their life cycle traits in response to inundation. Four functional groups were used here, namely: Amphibious responders (AmR) – plants which change their growth form in response
to flooding and drying cycles; Amphibious tolerators (AmT) – plants which tolerate flooding patterns without
changing their growth form; Terrestrial damp plants (Tda) – plants which are terrestrial species but tend to grow
close to the water margin on damp soils; and Terrestrial dry plants (Tdr) - those which are terrestrial species which don’t normally
grow in wetlands but may be encroaching into the area due to prolonged drying. Cover, species richness and compositional data from the five transects were averaged before analysis. Cover and richness data were analysed using Statistix 7 (Analytical Software, 2000). For species richness data, analysis of variance was used on log transformed counts to examine the effects of timing and site on vegetation communities. Composition data were analysed using non-metric multidimensional (nMDS) scaling in PRIMER 6 (Clarke & Gorley,
Control Site 1 Control Site 2
Impact Site 2
Impact Site 1
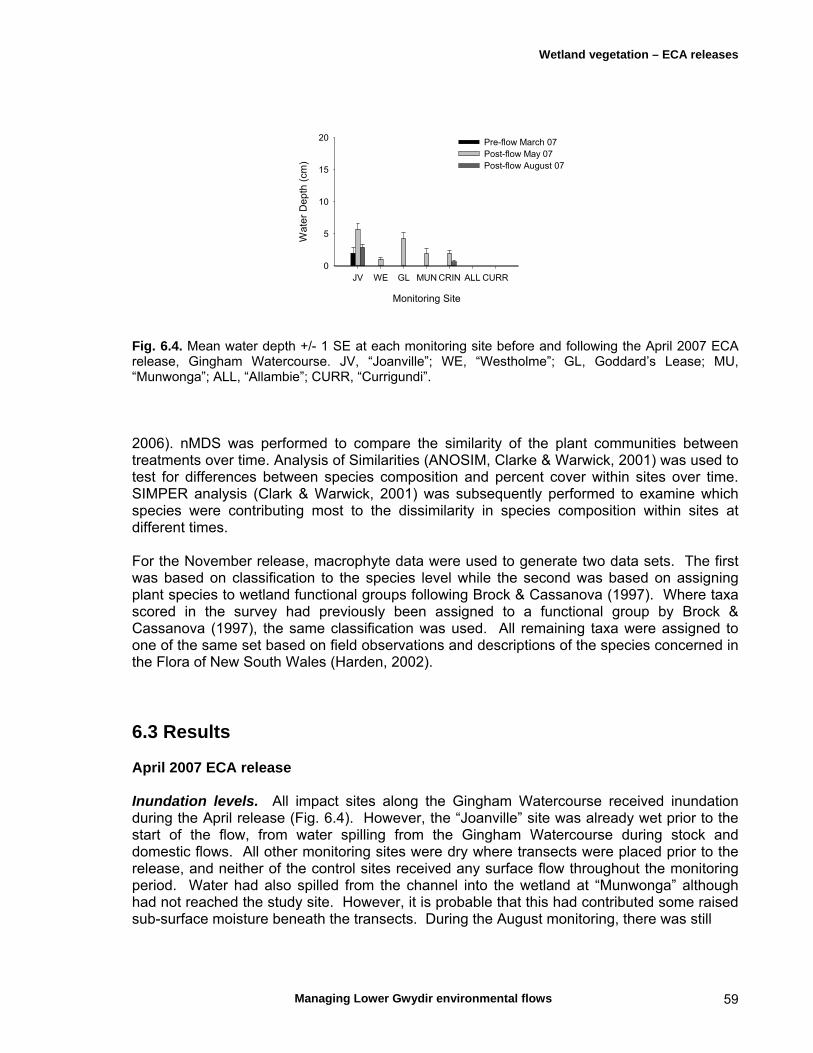
Wetland vegetation – ECA releases
Managing Lower Gwydir environmental flows 59
Monitoring Site
JV WE GL MUN CRIN ALL CURR
Wa
ter
De
pth
(cm
)
0
5
10
15
20 Pre-flow March 07 Post-flow May 07 Post-flow August 07
Fig. 6.4. Mean water depth +/- 1 SE at each monitoring site before and following the April 2007 ECA release, Gingham Watercourse. JV, “Joanville”; WE, “Westholme”; GL, Goddard’s Lease; MU, “Munwonga”; ALL, “Allambie”; CURR, “Currigundi”. 2006). nMDS was performed to compare the similarity of the plant communities between treatments over time. Analysis of Similarities (ANOSIM, Clarke & Warwick, 2001) was used to test for differences between species composition and percent cover within sites over time. SIMPER analysis (Clark & Warwick, 2001) was subsequently performed to examine which species were contributing most to the dissimilarity in species composition within sites at different times. For the November release, macrophyte data were used to generate two data sets. The first was based on classification to the species level while the second was based on assigning plant species to wetland functional groups following Brock & Cassanova (1997). Where taxa scored in the survey had previously been assigned to a functional group by Brock & Cassanova (1997), the same classification was used. All remaining taxa were assigned to one of the same set based on field observations and descriptions of the species concerned in the Flora of New South Wales (Harden, 2002).
6.3 Results April 2007 ECA release Inundation levels. All impact sites along the Gingham Watercourse received inundation during the April release (Fig. 6.4). However, the “Joanville” site was already wet prior to the start of the flow, from water spilling from the Gingham Watercourse during stock and domestic flows. All other monitoring sites were dry where transects were placed prior to the release, and neither of the control sites received any surface flow throughout the monitoring period. Water had also spilled from the channel into the wetland at “Munwonga” although had not reached the study site. However, it is probable that this had contributed some raised sub-surface moisture beneath the transects. During the August monitoring, there was still

Wetland vegetation – ECA releases
Managing Lower Gwydir environmental flows 60
Monitoring site
JV WE GL MUN CRIN ALL CURR
Nu
mb
er
of
spe
cie
s
0
5
10
15
20
25
Pre-flow March 07Post-flow May 07 Post-flow August 07
Fig. 6.5. Mean number of species +/- 1 SE at each monitoring site before and after the April 2007 release along the Gingham Watercourse, March to August 2007. See Fig. 6.4 for site codes. Table 6.2 Analysis of variance of species richness responses to the April 2007 ECA release into the Gingham Watercourse. Data were log transformed prior to analysis.
Factor d.f. SS MS F P
Site 6 1.154 0.192 22.65 < 0.001
Time 2 1.034 0.577 60.88 < 0.001
Site x Time 12 1.169 0.097 11.47 < 0.001
Residual 84 0.714 0.009
water covering some transects on both “Joanville” and “Crinolyn”, although surface moisture at “Westholme”, “Goddard’s Lease” and “Munwonga” had since receded. Species richness. Following the release of the environmental flow in April, three sites (“Westholme”, “Goddard’s Lease”, “Crinolyn”) experienced a significant increase in species richness (Fig. 6.5; Table 6.2). “Westholme” showed a significant increase between March and May, as did “Goddard’s Lease”. However, both sites also experienced a significant decline between May and August, a period when conditions were cold and generally dry. “Crinolyn“ was the driest of the sites prior to the release, with much of the land surface devoid of vegetation. This site experienced a major increase in the number of species as numerous taxa germinated from the soil seed bank. At “Joanville”, some of the transects were inundated prior to the ECA release due to spillage from the channel, and the response to the flow in terms of germination and establishment of new species was weaker than at the drier sites further down the channel. At both control sites, small but not significant increases were detected due to the germination of a number of annual taxa.
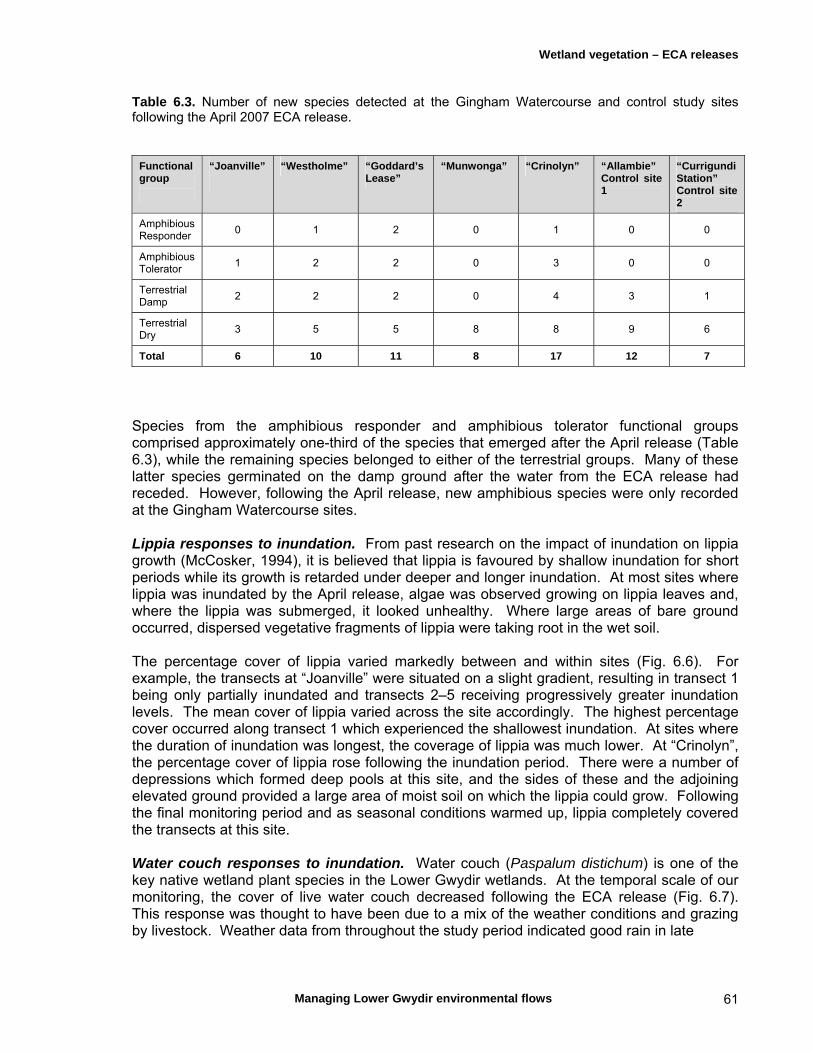
Wetland vegetation – ECA releases
Managing Lower Gwydir environmental flows 61
Table 6.3. Number of new species detected at the Gingham Watercourse and control study sites following the April 2007 ECA release.
Functional group
“Joanville”
“Westholme” “Goddard’s Lease”
“Munwonga” “Crinolyn” “Allambie” Control site 1
“Currigundi Station” Control site 2
Amphibious Responder
0 1 2 0 1 0 0
Amphibious Tolerator
1 2 2 0 3 0 0
Terrestrial Damp
2 2 2 0 4 3 1
Terrestrial Dry
3 5 5 8 8 9 6
Total 6 10 11 8 17 12 7
Species from the amphibious responder and amphibious tolerator functional groups comprised approximately one-third of the species that emerged after the April release (Table 6.3), while the remaining species belonged to either of the terrestrial groups. Many of these latter species germinated on the damp ground after the water from the ECA release had receded. However, following the April release, new amphibious species were only recorded at the Gingham Watercourse sites. Lippia responses to inundation. From past research on the impact of inundation on lippia growth (McCosker, 1994), it is believed that lippia is favoured by shallow inundation for short periods while its growth is retarded under deeper and longer inundation. At most sites where lippia was inundated by the April release, algae was observed growing on lippia leaves and, where the lippia was submerged, it looked unhealthy. Where large areas of bare ground occurred, dispersed vegetative fragments of lippia were taking root in the wet soil. The percentage cover of lippia varied markedly between and within sites (Fig. 6.6). For example, the transects at “Joanville” were situated on a slight gradient, resulting in transect 1 being only partially inundated and transects 2–5 receiving progressively greater inundation levels. The mean cover of lippia varied across the site accordingly. The highest percentage cover occurred along transect 1 which experienced the shallowest inundation. At sites where the duration of inundation was longest, the coverage of lippia was much lower. At “Crinolyn”, the percentage cover of lippia rose following the inundation period. There were a number of depressions which formed deep pools at this site, and the sides of these and the adjoining elevated ground provided a large area of moist soil on which the lippia could grow. Following the final monitoring period and as seasonal conditions warmed up, lippia completely covered the transects at this site. Water couch responses to inundation. Water couch (Paspalum distichum) is one of the key native wetland plant species in the Lower Gwydir wetlands. At the temporal scale of our monitoring, the cover of live water couch decreased following the ECA release (Fig. 6.7). This response was thought to have been due to a mix of the weather conditions and grazing by livestock. Weather data from throughout the study period indicated good rain in late
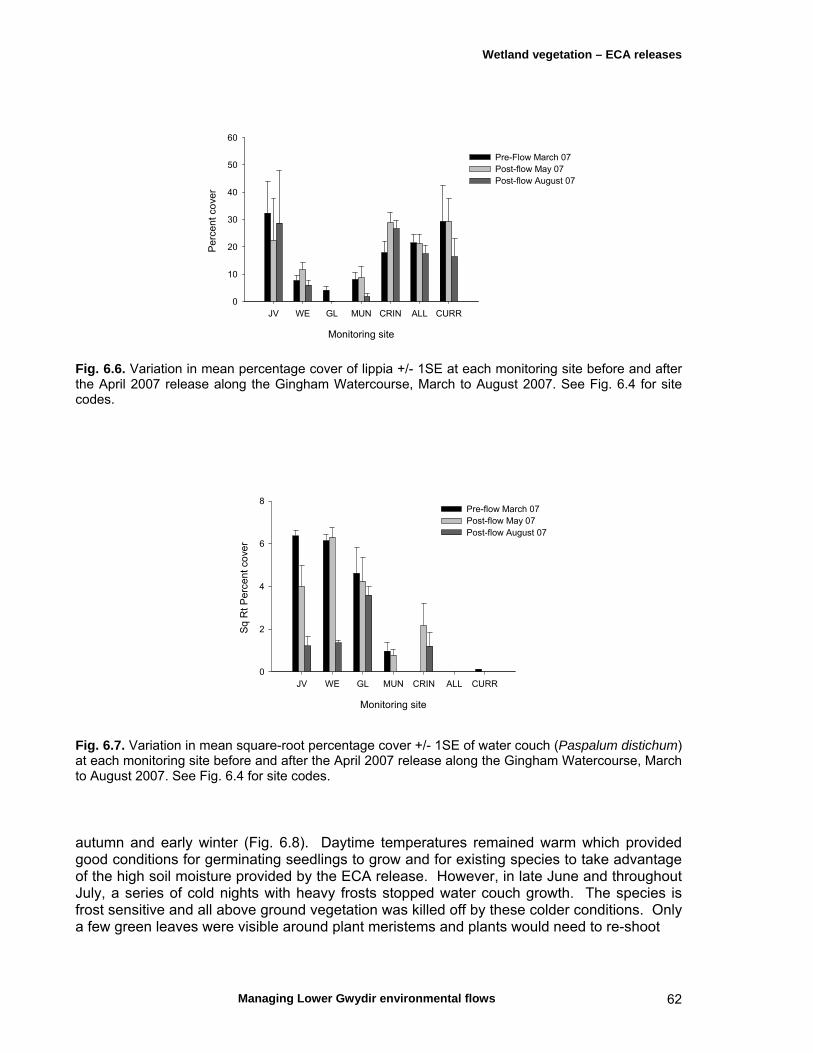
Wetland vegetation – ECA releases
Managing Lower Gwydir environmental flows 62
Monitoring site
JV WE GL MUN CRIN ALL CURR
Pe
rce
nt c
ove
r
0
10
20
30
40
50
60
Pre-Flow March 07 Post-flow May 07 Post-flow August 07
Fig. 6.6. Variation in mean percentage cover of lippia +/- 1SE at each monitoring site before and after the April 2007 release along the Gingham Watercourse, March to August 2007. See Fig. 6.4 for site codes.
Monitoring site
JV WE GL MUN CRIN ALL CURR
Sq
Rt
Per
cent
co
ver
0
2
4
6
8Pre-flow March 07Post-flow May 07Post-flow August 07
Fig. 6.7. Variation in mean square-root percentage cover +/- 1SE of water couch (Paspalum distichum) at each monitoring site before and after the April 2007 release along the Gingham Watercourse, March to August 2007. See Fig. 6.4 for site codes. autumn and early winter (Fig. 6.8). Daytime temperatures remained warm which provided good conditions for germinating seedlings to grow and for existing species to take advantage of the high soil moisture provided by the ECA release. However, in late June and throughout July, a series of cold nights with heavy frosts stopped water couch growth. The species is frost sensitive and all above ground vegetation was killed off by these colder conditions. Only a few green leaves were visible around plant meristems and plants would need to re-shoot

Wetland vegetation – ECA releases
Managing Lower Gwydir environmental flows 63
Fig. 6.8. Variation in rainfall, and maximum and minimum temperature at Moree, April to August 2007. once warmer conditions arrived in spring. During the study period, water couch was not observed to flower or set seed. Functional group responses at each site. We examined the response of individual plant functional groups at each site flooded by the April ECA release. At “Joanville”, much of our study site was inundated prior to the ECA release and there was not a noticeable expansion in percentage cover of either the terrestrial or amphibious tolerator functional groups (Fig. 6.9). However, amphibious responders did increase in percentage cover over the survey period, most likely due to the prolonged period of inundation (Fig 6.4). The dominant species in this functional group at “Joanville” were nardoo (Marsilea drummondii) and water milfoil (Myriophyllum variifolium). At ‘Westholme”, the transects were placed at a site that received only a shallow inundation and for a short period. The increase in biomass at this site was negligible, although the plant assemblages were dominated by the amphibious tolerator group (Fig. 6.10). These dropped substantially in their percent cover between May and August, due primarily to the impact of frost on water couch. In contrast, there was an increase in cover of terrestrial damp taxa as the damp soil in autumn encouraged the germination of annual plants or short term perennials. These plants grew slowly over winter before maturing and flowering in the following spring. At “Goddard’s Lease”, the transects passed through water couch meadows and cumbungi (Typha domingensis) stands. The areas between the Typha were usually bare ground while around the Typha there was considerable vegetative litter. Following inundation, amphibious tolerator species such as water couch germinated and grew in bare areas but had been grazed out by the August monitoring period (Fig. 6.11). The amphibious responder water primrose (Ludwigia peploides) also increased in cover but was lying desiccated on the ground by the August monitoring as most pools of water on the site had disappeared.
-5
0
5
10
15
20
25
30
35
Te
mp
era
ture
°C
Maximum temperature(°C)
Minimum temperature(°C)
-5
0
5
10
15
20
25
30
35
-5
0
5
10
15
20
25
30
35
Te
mp
era
ture
°C
Maximum temperature(°C)
Minimum temperature(°C)
0
10
• 20
• 30
40
50
April May June July August
Month
Rai
nfa
ll (m
m)
0
10
• 20
• 30
40
50
0
10
• 20
• 30
40
50
April May June July August
Month
Rai
nfa
ll (m
m)
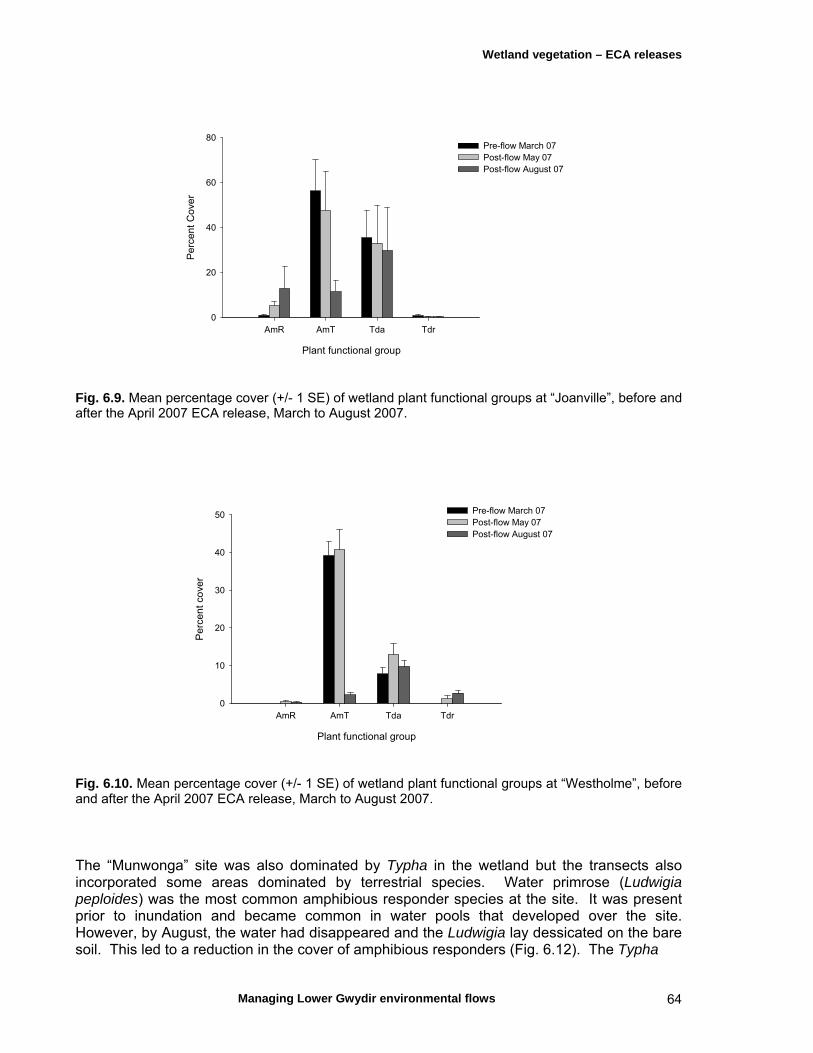
Wetland vegetation – ECA releases
Managing Lower Gwydir environmental flows 64
Plant functional group
AmR AmT Tda Tdr
Pe
rce
nt
Co
ver
0
20
40
60
80Pre-flow March 07Post-flow May 07Post-flow August 07
Fig. 6.9. Mean percentage cover (+/- 1 SE) of wetland plant functional groups at “Joanville”, before and after the April 2007 ECA release, March to August 2007.
Plant functional group
AmR AmT Tda Tdr
Pe
rce
nt c
ove
r
0
10
20
30
40
50 Pre-flow March 07Post-flow May 07 Post-flow August 07
Fig. 6.10. Mean percentage cover (+/- 1 SE) of wetland plant functional groups at “Westholme”, before and after the April 2007 ECA release, March to August 2007. The “Munwonga” site was also dominated by Typha in the wetland but the transects also incorporated some areas dominated by terrestrial species. Water primrose (Ludwigia peploides) was the most common amphibious responder species at the site. It was present prior to inundation and became common in water pools that developed over the site. However, by August, the water had disappeared and the Ludwigia lay dessicated on the bare soil. This led to a reduction in the cover of amphibious responders (Fig. 6.12). The Typha
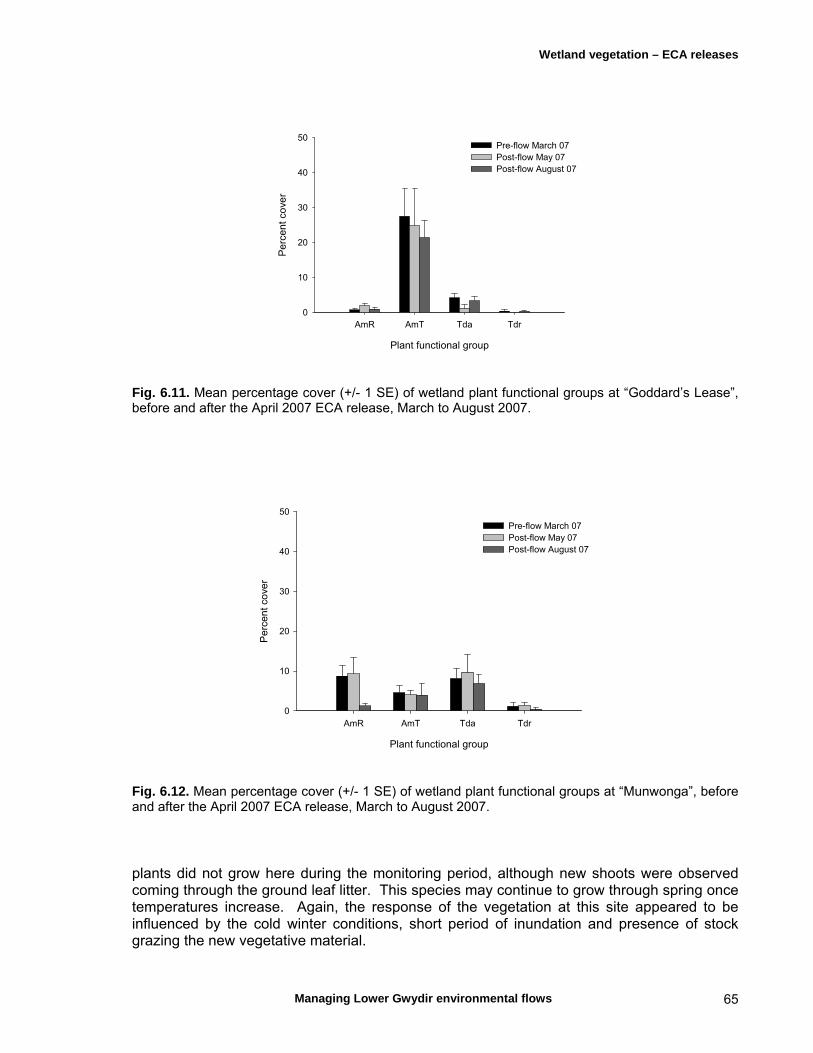
Wetland vegetation – ECA releases
Managing Lower Gwydir environmental flows 65
Plant functional group
AmR AmT Tda Tdr
Pe
rce
nt c
ove
r
0
10
20
30
40
50Pre-flow March 07Post-flow May 07 Post-flow August 07
Fig. 6.11. Mean percentage cover (+/- 1 SE) of wetland plant functional groups at “Goddard’s Lease”, before and after the April 2007 ECA release, March to August 2007.
Plant functional group
AmR AmT Tda Tdr
Pe
rce
nt c
ove
r
0
10
20
30
40
50
Pre-flow March 07Post-flow May 07Post-flow August 07
Fig. 6.12. Mean percentage cover (+/- 1 SE) of wetland plant functional groups at “Munwonga”, before and after the April 2007 ECA release, March to August 2007. plants did not grow here during the monitoring period, although new shoots were observed coming through the ground leaf litter. This species may continue to grow through spring once temperatures increase. Again, the response of the vegetation at this site appeared to be influenced by the cold winter conditions, short period of inundation and presence of stock grazing the new vegetative material.
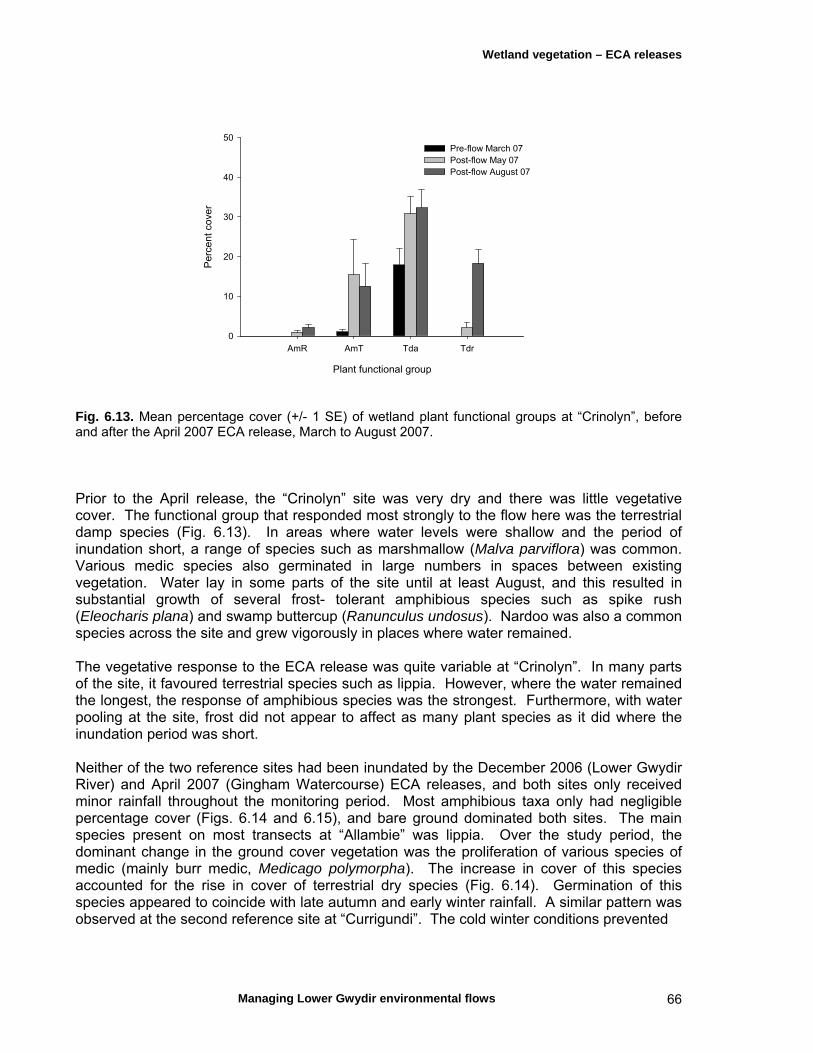
Wetland vegetation – ECA releases
Managing Lower Gwydir environmental flows 66
Plant functional group
AmR AmT Tda Tdr
Per
cen
t co
ver
0
10
20
30
40
50Pre-flow March 07 Post-flow May 07Post-flow August 07
Fig. 6.13. Mean percentage cover (+/- 1 SE) of wetland plant functional groups at “Crinolyn”, before and after the April 2007 ECA release, March to August 2007. Prior to the April release, the “Crinolyn” site was very dry and there was little vegetative cover. The functional group that responded most strongly to the flow here was the terrestrial damp species (Fig. 6.13). In areas where water levels were shallow and the period of inundation short, a range of species such as marshmallow (Malva parviflora) was common. Various medic species also germinated in large numbers in spaces between existing vegetation. Water lay in some parts of the site until at least August, and this resulted in substantial growth of several frost- tolerant amphibious species such as spike rush (Eleocharis plana) and swamp buttercup (Ranunculus undosus). Nardoo was also a common species across the site and grew vigorously in places where water remained. The vegetative response to the ECA release was quite variable at “Crinolyn”. In many parts of the site, it favoured terrestrial species such as lippia. However, where the water remained the longest, the response of amphibious species was the strongest. Furthermore, with water pooling at the site, frost did not appear to affect as many plant species as it did where the inundation period was short. Neither of the two reference sites had been inundated by the December 2006 (Lower Gwydir River) and April 2007 (Gingham Watercourse) ECA releases, and both sites only received minor rainfall throughout the monitoring period. Most amphibious taxa only had negligible percentage cover (Figs. 6.14 and 6.15), and bare ground dominated both sites. The main species present on most transects at “Allambie” was lippia. Over the study period, the dominant change in the ground cover vegetation was the proliferation of various species of medic (mainly burr medic, Medicago polymorpha). The increase in cover of this species accounted for the rise in cover of terrestrial dry species (Fig. 6.14). Germination of this species appeared to coincide with late autumn and early winter rainfall. A similar pattern was observed at the second reference site at “Currigundi”. The cold winter conditions prevented

Wetland vegetation – ECA releases
Managing Lower Gwydir environmental flows 67
Plant functional group
AmR AmT Tda Tdr
Pe
rce
nt
cove
r
0
10
20
30
40
50
Pre-flow March 07Post-flow May 07Post-flow August 07
Fig. 6.14. Mean percentage cover (+/- 1 SE) of wetland plant functional groups at “Allambie”, before and after the April 2007 ECA release, March to August 2007.
Plant functional group
AmR AmT Tda Tdr
Pe
rce
nt
cove
r
0
10
20
30
40
50
Pre-flow March 07 Post-flow May 07 Post-flow August 07
Fig. 6.15. Mean percentage cover (+/- 1 SE) of wetland plant functional groups at “Currigundi”, before and after the April 2007 ECA release, March to August 2007. growth of most perennial grass species and the major change in vegetative composition in the plant community was caused by the increase in cover of burr medic.
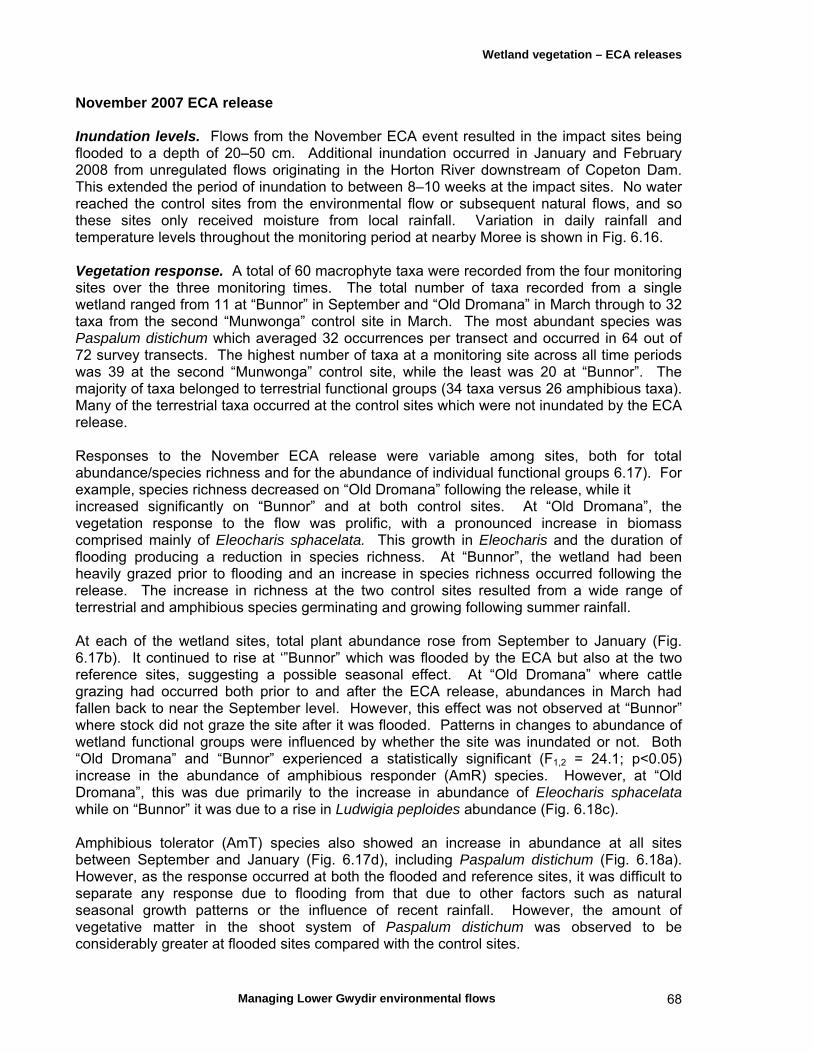
Wetland vegetation – ECA releases
Managing Lower Gwydir environmental flows 68
November 2007 ECA release Inundation levels. Flows from the November ECA event resulted in the impact sites being flooded to a depth of 20–50 cm. Additional inundation occurred in January and February 2008 from unregulated flows originating in the Horton River downstream of Copeton Dam. This extended the period of inundation to between 8–10 weeks at the impact sites. No water reached the control sites from the environmental flow or subsequent natural flows, and so these sites only received moisture from local rainfall. Variation in daily rainfall and temperature levels throughout the monitoring period at nearby Moree is shown in Fig. 6.16. Vegetation response. A total of 60 macrophyte taxa were recorded from the four monitoring sites over the three monitoring times. The total number of taxa recorded from a single wetland ranged from 11 at “Bunnor” in September and “Old Dromana” in March through to 32 taxa from the second “Munwonga” control site in March. The most abundant species was Paspalum distichum which averaged 32 occurrences per transect and occurred in 64 out of 72 survey transects. The highest number of taxa at a monitoring site across all time periods was 39 at the second “Munwonga” control site, while the least was 20 at “Bunnor”. The majority of taxa belonged to terrestrial functional groups (34 taxa versus 26 amphibious taxa). Many of the terrestrial taxa occurred at the control sites which were not inundated by the ECA release. Responses to the November ECA release were variable among sites, both for total abundance/species richness and for the abundance of individual functional groups 6.17). For example, species richness decreased on “Old Dromana” following the release, while it increased significantly on “Bunnor” and at both control sites. At “Old Dromana”, the vegetation response to the flow was prolific, with a pronounced increase in biomass comprised mainly of Eleocharis sphacelata. This growth in Eleocharis and the duration of flooding producing a reduction in species richness. At “Bunnor”, the wetland had been heavily grazed prior to flooding and an increase in species richness occurred following the release. The increase in richness at the two control sites resulted from a wide range of terrestrial and amphibious species germinating and growing following summer rainfall. At each of the wetland sites, total plant abundance rose from September to January (Fig. 6.17b). It continued to rise at ‘”Bunnor” which was flooded by the ECA but also at the two reference sites, suggesting a possible seasonal effect. At “Old Dromana” where cattle grazing had occurred both prior to and after the ECA release, abundances in March had fallen back to near the September level. However, this effect was not observed at “Bunnor” where stock did not graze the site after it was flooded. Patterns in changes to abundance of wetland functional groups were influenced by whether the site was inundated or not. Both “Old Dromana” and “Bunnor” experienced a statistically significant (F1,2 = 24.1; p<0.05) increase in the abundance of amphibious responder (AmR) species. However, at “Old Dromana”, this was due primarily to the increase in abundance of Eleocharis sphacelata while on “Bunnor” it was due to a rise in Ludwigia peploides abundance (Fig. 6.18c). Amphibious tolerator (AmT) species also showed an increase in abundance at all sites between September and January (Fig. 6.17d), including Paspalum distichum (Fig. 6.18a). However, as the response occurred at both the flooded and reference sites, it was difficult to separate any response due to flooding from that due to other factors such as natural seasonal growth patterns or the influence of recent rainfall. However, the amount of vegetative matter in the shoot system of Paspalum distichum was observed to be considerably greater at flooded sites compared with the control sites.
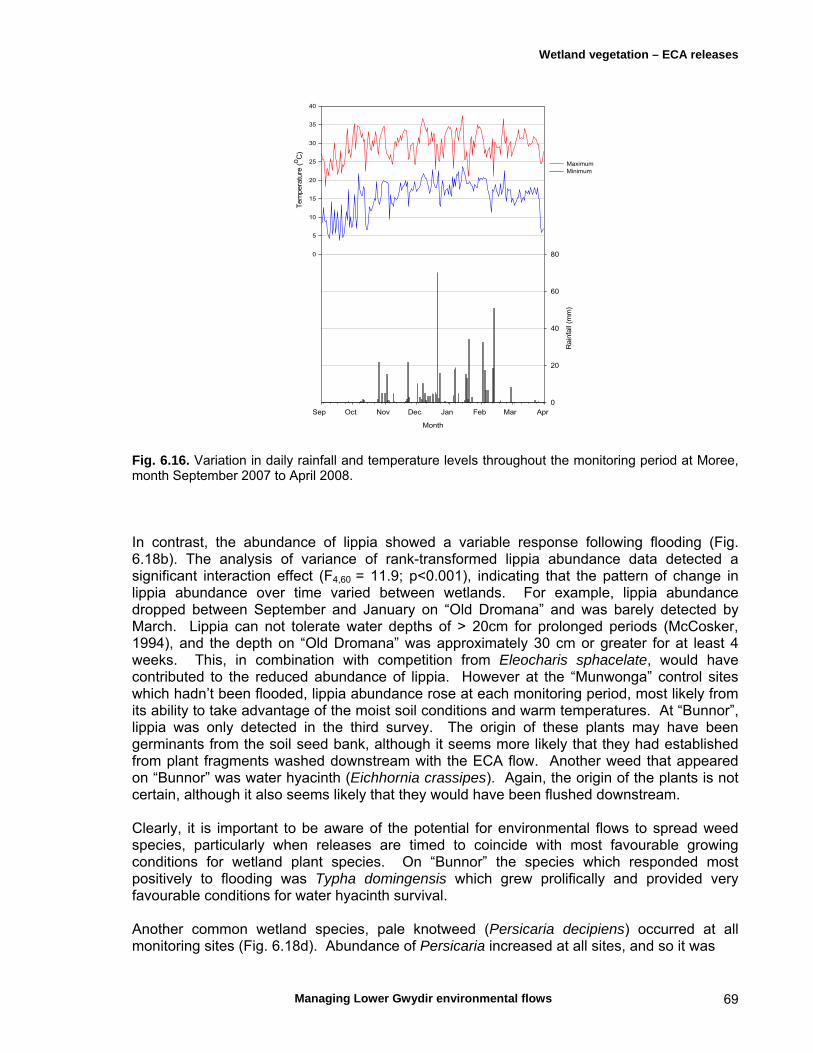
Wetland vegetation – ECA releases
Managing Lower Gwydir environmental flows 69
Fig. 6.16. Variation in daily rainfall and temperature levels throughout the monitoring period at Moree, month September 2007 to April 2008. In contrast, the abundance of lippia showed a variable response following flooding (Fig. 6.18b). The analysis of variance of rank-transformed lippia abundance data detected a significant interaction effect (F4,60 = 11.9; p<0.001), indicating that the pattern of change in lippia abundance over time varied between wetlands. For example, lippia abundance dropped between September and January on “Old Dromana” and was barely detected by March. Lippia can not tolerate water depths of > 20cm for prolonged periods (McCosker, 1994), and the depth on “Old Dromana” was approximately 30 cm or greater for at least 4 weeks. This, in combination with competition from Eleocharis sphacelate, would have contributed to the reduced abundance of lippia. However at the “Munwonga” control sites which hadn’t been flooded, lippia abundance rose at each monitoring period, most likely from its ability to take advantage of the moist soil conditions and warm temperatures. At “Bunnor”, lippia was only detected in the third survey. The origin of these plants may have been germinants from the soil seed bank, although it seems more likely that they had established from plant fragments washed downstream with the ECA flow. Another weed that appeared on “Bunnor” was water hyacinth (Eichhornia crassipes). Again, the origin of the plants is not certain, although it also seems likely that they would have been flushed downstream. Clearly, it is important to be aware of the potential for environmental flows to spread weed species, particularly when releases are timed to coincide with most favourable growing conditions for wetland plant species. On “Bunnor” the species which responded most positively to flooding was Typha domingensis which grew prolifically and provided very favourable conditions for water hyacinth survival. Another common wetland species, pale knotweed (Persicaria decipiens) occurred at all monitoring sites (Fig. 6.18d). Abundance of Persicaria increased at all sites, and so it was
Month
Sep Oct Nov Dec Jan Feb Mar Apr
Rain
fall
(mm
)
0
20
40
60
80
Tem
pera
ture
(oC
)
0
5
10
15
20
25
30
35
40
MaximumMinimum
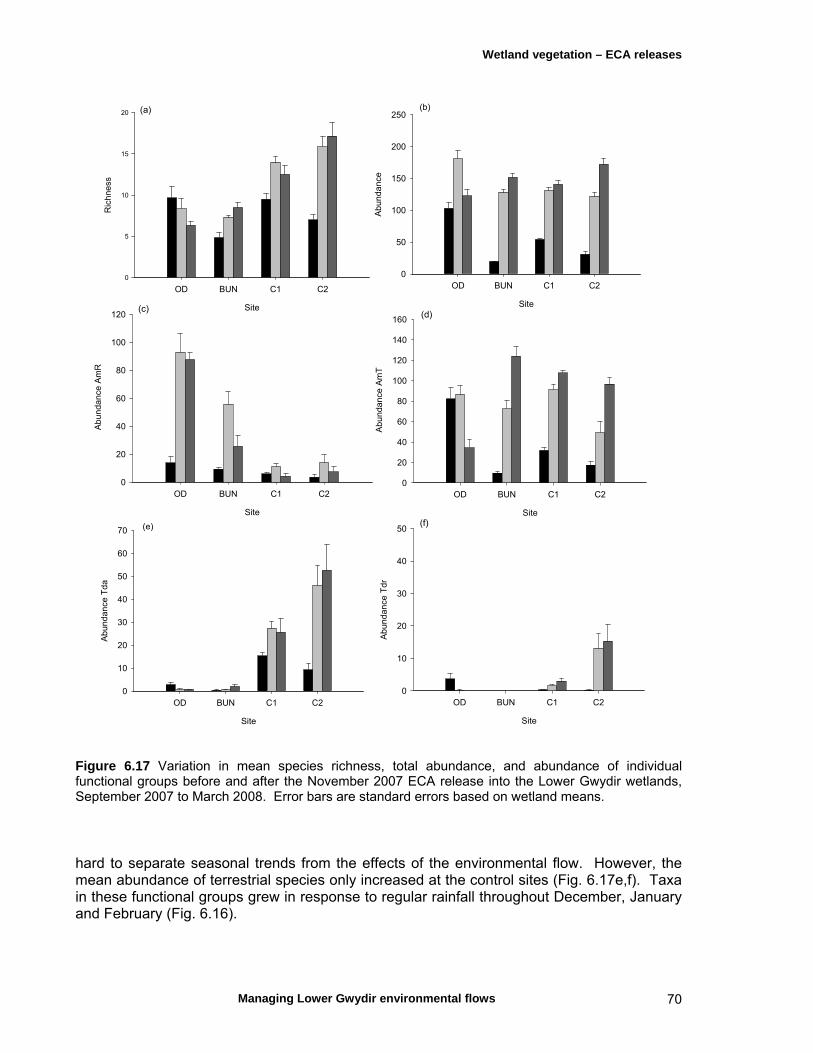
Wetland vegetation – ECA releases
Managing Lower Gwydir environmental flows 70
(a)
Site
OD BUN C1 C2
Ric
hn
ess
0
5
10
15
20(b)
Site
OD BUN C1 C2
Ab
un
da
nce
0
50
100
150
200
250
(c)
Site
OD BUN C1 C2
Ab
un
da
nce
Am
R
0
20
40
60
80
100
120 (d)
Site
OD BUN C1 C2
Ab
un
da
nce
Am
T
0
20
40
60
80
100
120
140
160
(e)
Site
OD BUN C1 C2
Ab
un
da
nce
Td
a
0
10
20
30
40
50
60
70(f)
Site
OD BUN C1 C2
Ab
un
da
nce
Td
r
0
10
20
30
40
50
Figure 6.17 Variation in mean species richness, total abundance, and abundance of individual functional groups before and after the November 2007 ECA release into the Lower Gwydir wetlands, September 2007 to March 2008. Error bars are standard errors based on wetland means. hard to separate seasonal trends from the effects of the environmental flow. However, the mean abundance of terrestrial species only increased at the control sites (Fig. 6.17e,f). Taxa in these functional groups grew in response to regular rainfall throughout December, January and February (Fig. 6.16).
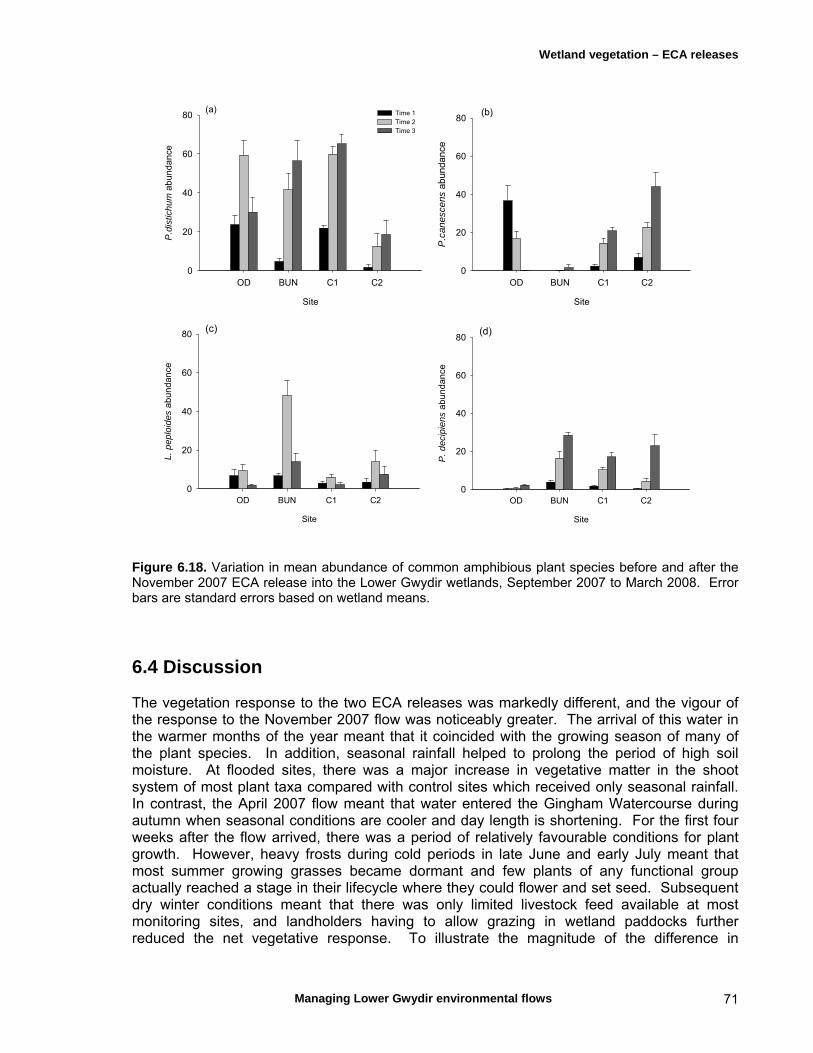
Wetland vegetation – ECA releases
Managing Lower Gwydir environmental flows 71
(b)
Site
OD BUN C1 C2
P.c
anes
cens
abu
ndan
ce
0
20
40
60
80(a)
Site
OD BUN C1 C2
P.d
istic
hu
m a
bu
nd
an
ce
0
20
40
60
80 Time 1 Time 2 Time 3
(d)
Site
OD BUN C1 C2
P.
de
cip
iens
ab
un
dan
ce
0
20
40
60
80(c)
Site
OD BUN C1 C2
L.
pe
plo
ides
ab
un
dan
ce
0
20
40
60
80
Figure 6.18. Variation in mean abundance of common amphibious plant species before and after the November 2007 ECA release into the Lower Gwydir wetlands, September 2007 to March 2008. Error bars are standard errors based on wetland means.
6.4 Discussion The vegetation response to the two ECA releases was markedly different, and the vigour of the response to the November 2007 flow was noticeably greater. The arrival of this water in the warmer months of the year meant that it coincided with the growing season of many of the plant species. In addition, seasonal rainfall helped to prolong the period of high soil moisture. At flooded sites, there was a major increase in vegetative matter in the shoot system of most plant taxa compared with control sites which received only seasonal rainfall. In contrast, the April 2007 flow meant that water entered the Gingham Watercourse during autumn when seasonal conditions are cooler and day length is shortening. For the first four weeks after the flow arrived, there was a period of relatively favourable conditions for plant growth. However, heavy frosts during cold periods in late June and early July meant that most summer growing grasses became dormant and few plants of any functional group actually reached a stage in their lifecycle where they could flower and set seed. Subsequent dry winter conditions meant that there was only limited livestock feed available at most monitoring sites, and landholders having to allow grazing in wetland paddocks further reduced the net vegetative response. To illustrate the magnitude of the difference in
Wetland vegetation – ECA releases
Managing Lower Gwydir environmental flows 72
response between seasons, it would be worth including monitoring of biomass in all future ECA monitoring activities. The main reason for suggesting this alternative approach is that with prostrate taxa, percent cover is often relatively high, even under moderate grazing pressure. It is the volume of the shoot material that changes most with increased growth vigour. This response is better detected through monitoring biomass changes rather than percent foliar cover alone. Timing of flow also had an influence on lippia cover. In the November 2007, flow growth of perennial grasses such as native panic (Panicum decompositum) and water couch (Paspalum distichum) was vigorous. At “Old Dromana”, water couch cover increased in response to the arrival of water into the wetland and lippia cover decreased over time. By comparison, at the control sites there was an increase in cover of water couch but no decrease in lippia cover. The control sites were responding to seasonal rainfall alone. At the flooded sites, the combination of water depth and the large biomass of water couch appeared to create conditions unfavourable for lippia, resulting in it not being detected at the third monitoring period in March 2008. However, the outcome was not so successful in the April 2007 flow in the Gingham Watercourse. Lippia showed greater frost tolerance and entered a period of more rapid growth earlier in spring compared with native grasses. In particular, at “Crinolyn”, lippia expanded in cover considerably over the monitoring period (Fig. 6.4) and low-lying parts of the landscape became almost totally covered in this species. It, therefore, appears that if an objective of an ECA release is to promote growth of native grasses over lippia, it would be better to time the release for late spring or early summer to give native grasses the maximum time to exert a competitive advantage. At any point in time, the plant community that exists in a wetland is a reflection of the water regime in the preceding weeks and months. Each plant species in the species pool for a wetland has particular conditions which assist its germination and establishment. When moisture conditions change, either with the introduction of water into a dry wetland or from the gradual recession of existing surface water, some species are able to tolerate the change while others cannot. The arrival of water in a wetland is a particularly important cue for the germination and establishment of aquatic plant species, and a reduced flooding frequency may result in a gradual loss of aquatic species as their seeds become less abundant in the soil seed bank. This may occur either through an inability of germinants to set seed before the wetland dries out or from seeds losing viability in the soil before appropriate germination cues occur. Environmental water allocations are intended to reinstate attributes of the wetland water regime lost through river regulation, such as increasing the frequency of inundation or extending the duration of flood events. The goal of this strategy is, therefore, to create conditions that are favourable for the germination and establishment of key wetland taxa. The main difficulty currently faced by water managers and committees responsible for the delivery of environmental water is that there are only limited data on the ecological requirements of many wetland species (Roberts, 2002). This knowledge gap is a constraint on implementing flow requirements for floodplain wetland systems. Species richness of the amphibious responder and amphibious tolerator groups increased at most sites following each of the ECA flows monitored here. However, the winter flow was followed by a period of drawdown almost straight after the flow concluded, and there was little additional moisture from either flooding or rainfall to maintain soil moisture. In conditions where drawdown occurs relatively quickly, it has been observed to promote the germination and establishment of species known collectively as ‘mud flat annuals’ (Harris & Marshall, 1963; Salisbury, 1970; ter Heerdt & Drost, 1994). The observed response to the autumn flow showed that the majority of new species belonged to the terrestrial functional groups which

Wetland vegetation – ECA releases
Managing Lower Gwydir environmental flows 73
established in the autumn and flowered in the following spring. Following the summer environmental flow, new species at the monitoring sites were mainly amphibious taxa. However, while some amphibious tolerator taxa seedlings were recorded at reference sites in January and March, the majority of new species were from the terrestrial functional groups (Table 6.2). These data illustrate the influence of water regime on plant community composition. The extended duration of inundation did not provide the conditions for terrestrial species to germinate in large numbers at flooded sites, and resulted in a noticeably different plant community. Having established a mechanism, through the ECA Operations Advisory Committee, for increasing the frequency of environmental flows into the Lower Gwydir wetlands, managers of these events should also consider the timing of releases so as to maximise the duration of inundation. The best means of extending duration appears to be through backing flows onto natural events. When the soil is already wet, the spatial extent and duration of ECA inundation increases markedly as less surface water is lost into the soil profile. This was evident when comparing the area of inundation at sites such as Westholme in the April and November flow events. The November flow covered a much larger area to a greater depth. Nevertheless, the present study has illustrated that the objectives of promoting the health of wetland plant communities and providing conditions favourable for native species to compete with introduced species is achievable. The main issue that remains a concern is the spatial extent of influence. In recent ECA releases, the Ramsar sites at “Old Dromana” and “Goddard’s Lease” have been partially or fully inundated, although less flow has reached “Crinolyn” and “Windella” further down the Gingham Watercourse. If these two downstream Gingham sites are to remain as target sites for environmental flows, it may be necessary to develop technical solutions to allow water to travel through the wetland system to reach the bottom without spilling at the top of the system. This study has illustrated that the vegetation communities throughout the whole of the Lower Gwydir wetland system have a high level of resilience to a variable water regime and, given the return of a more favourable hydrologic regime, have the capacity to develop a wet-phase plant community containing a variety of true aquatic taxa.
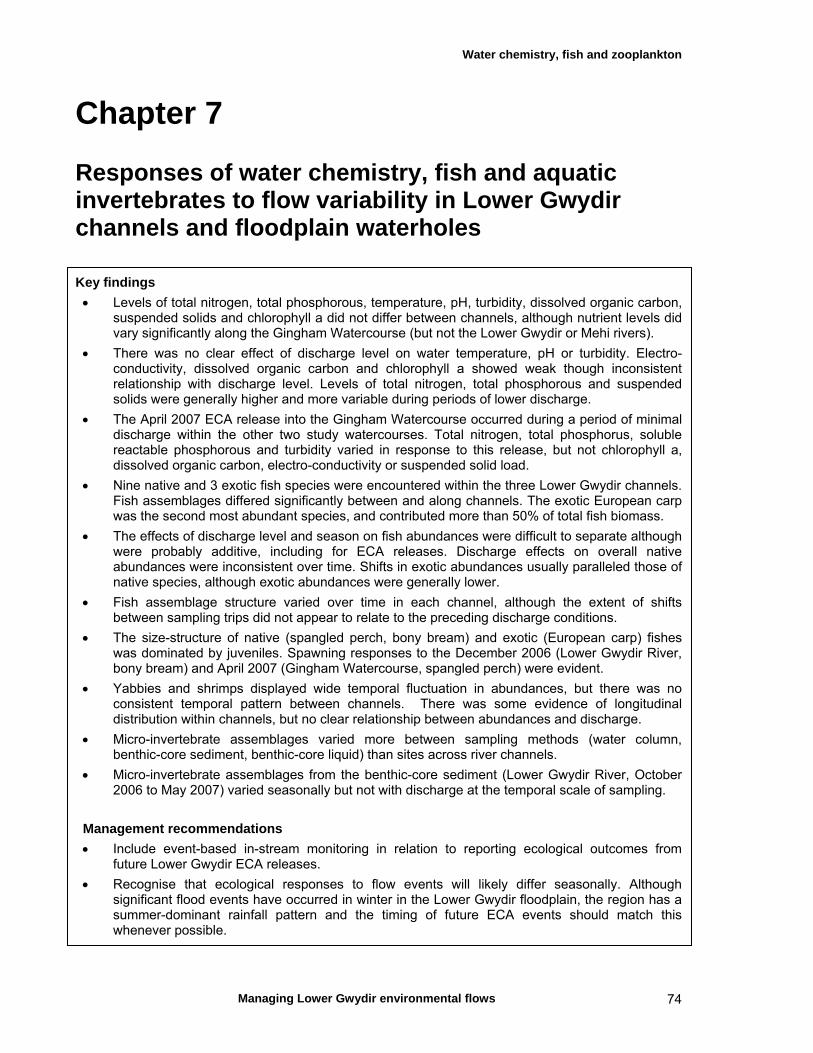
Water chemistry, fish and zooplankton
Managing Lower Gwydir environmental flows 74
Chapter 7 Responses of water chemistry, fish and aquatic invertebrates to flow variability in Lower Gwydir channels and floodplain waterholes Key findings
Levels of total nitrogen, total phosphorous, temperature, pH, turbidity, dissolved organic carbon, suspended solids and chlorophyll a did not differ between channels, although nutrient levels did vary significantly along the Gingham Watercourse (but not the Lower Gwydir or Mehi rivers).
There was no clear effect of discharge level on water temperature, pH or turbidity. Electro-conductivity, dissolved organic carbon and chlorophyll a showed weak though inconsistent relationship with discharge level. Levels of total nitrogen, total phosphorous and suspended solids were generally higher and more variable during periods of lower discharge.
The April 2007 ECA release into the Gingham Watercourse occurred during a period of minimal discharge within the other two study watercourses. Total nitrogen, total phosphorus, soluble reactable phosphorous and turbidity varied in response to this release, but not chlorophyll a, dissolved organic carbon, electro-conductivity or suspended solid load.
Nine native and 3 exotic fish species were encountered within the three Lower Gwydir channels. Fish assemblages differed significantly between and along channels. The exotic European carp was the second most abundant species, and contributed more than 50% of total fish biomass.
The effects of discharge level and season on fish abundances were difficult to separate although were probably additive, including for ECA releases. Discharge effects on overall native abundances were inconsistent over time. Shifts in exotic abundances usually paralleled those of native species, although exotic abundances were generally lower.
Fish assemblage structure varied over time in each channel, although the extent of shifts between sampling trips did not appear to relate to the preceding discharge conditions.
The size-structure of native (spangled perch, bony bream) and exotic (European carp) fishes was dominated by juveniles. Spawning responses to the December 2006 (Lower Gwydir River, bony bream) and April 2007 (Gingham Watercourse, spangled perch) were evident.
Yabbies and shrimps displayed wide temporal fluctuation in abundances, but there was no consistent temporal pattern between channels. There was some evidence of longitudinal distribution within channels, but no clear relationship between abundances and discharge.
Micro-invertebrate assemblages varied more between sampling methods (water column, benthic-core sediment, benthic-core liquid) than sites across river channels.
Micro-invertebrate assemblages from the benthic-core sediment (Lower Gwydir River, October 2006 to May 2007) varied seasonally but not with discharge at the temporal scale of sampling.
Management recommendations
Include event-based in-stream monitoring in relation to reporting ecological outcomes from future Lower Gwydir ECA releases.
Recognise that ecological responses to flow events will likely differ seasonally. Although significant flood events have occurred in winter in the Lower Gwydir floodplain, the region has a summer-dominant rainfall pattern and the timing of future ECA events should match this whenever possible.
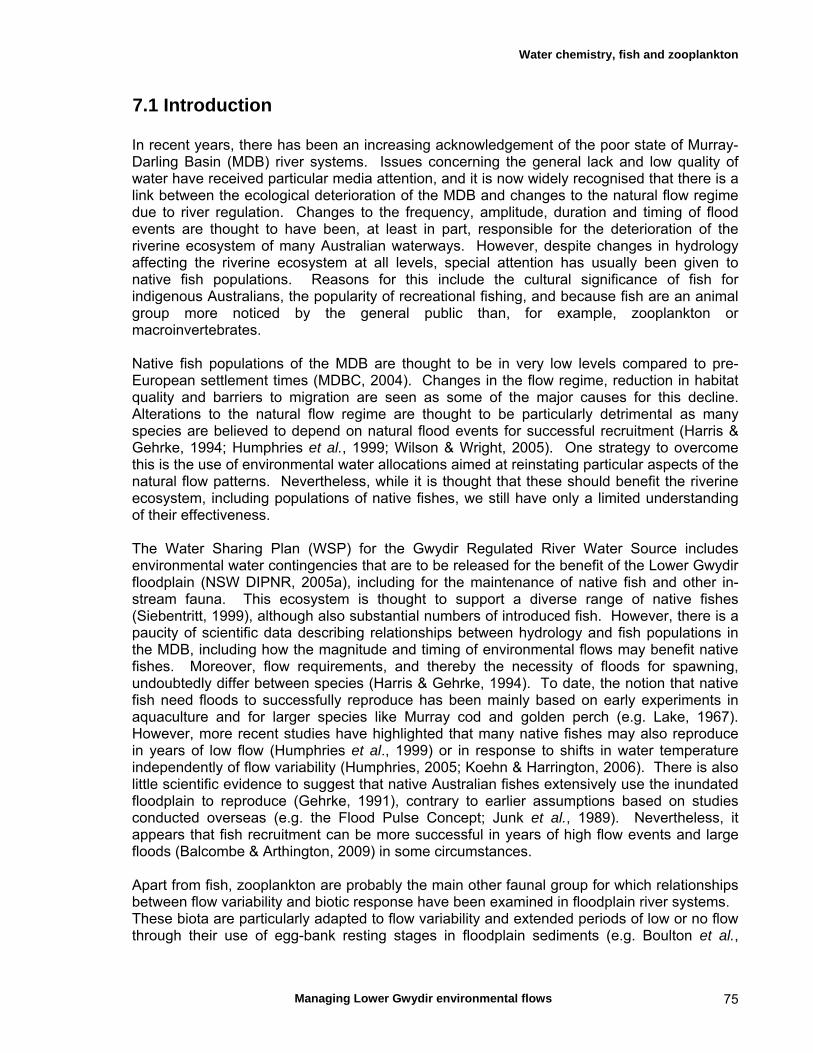
Water chemistry, fish and zooplankton
Managing Lower Gwydir environmental flows 75
7.1 Introduction In recent years, there has been an increasing acknowledgement of the poor state of Murray-Darling Basin (MDB) river systems. Issues concerning the general lack and low quality of water have received particular media attention, and it is now widely recognised that there is a link between the ecological deterioration of the MDB and changes to the natural flow regime due to river regulation. Changes to the frequency, amplitude, duration and timing of flood events are thought to have been, at least in part, responsible for the deterioration of the riverine ecosystem of many Australian waterways. However, despite changes in hydrology affecting the riverine ecosystem at all levels, special attention has usually been given to native fish populations. Reasons for this include the cultural significance of fish for indigenous Australians, the popularity of recreational fishing, and because fish are an animal group more noticed by the general public than, for example, zooplankton or macroinvertebrates. Native fish populations of the MDB are thought to be in very low levels compared to pre-European settlement times (MDBC, 2004). Changes in the flow regime, reduction in habitat quality and barriers to migration are seen as some of the major causes for this decline. Alterations to the natural flow regime are thought to be particularly detrimental as many species are believed to depend on natural flood events for successful recruitment (Harris & Gehrke, 1994; Humphries et al., 1999; Wilson & Wright, 2005). One strategy to overcome this is the use of environmental water allocations aimed at reinstating particular aspects of the natural flow patterns. Nevertheless, while it is thought that these should benefit the riverine ecosystem, including populations of native fishes, we still have only a limited understanding of their effectiveness. The Water Sharing Plan (WSP) for the Gwydir Regulated River Water Source includes environmental water contingencies that are to be released for the benefit of the Lower Gwydir floodplain (NSW DIPNR, 2005a), including for the maintenance of native fish and other in-stream fauna. This ecosystem is thought to support a diverse range of native fishes (Siebentritt, 1999), although also substantial numbers of introduced fish. However, there is a paucity of scientific data describing relationships between hydrology and fish populations in the MDB, including how the magnitude and timing of environmental flows may benefit native fishes. Moreover, flow requirements, and thereby the necessity of floods for spawning, undoubtedly differ between species (Harris & Gehrke, 1994). To date, the notion that native fish need floods to successfully reproduce has been mainly based on early experiments in aquaculture and for larger species like Murray cod and golden perch (e.g. Lake, 1967). However, more recent studies have highlighted that many native fishes may also reproduce in years of low flow (Humphries et al., 1999) or in response to shifts in water temperature independently of flow variability (Humphries, 2005; Koehn & Harrington, 2006). There is also little scientific evidence to suggest that native Australian fishes extensively use the inundated floodplain to reproduce (Gehrke, 1991), contrary to earlier assumptions based on studies conducted overseas (e.g. the Flood Pulse Concept; Junk et al., 1989). Nevertheless, it appears that fish recruitment can be more successful in years of high flow events and large floods (Balcombe & Arthington, 2009) in some circumstances. Apart from fish, zooplankton are probably the main other faunal group for which relationships between flow variability and biotic response have been examined in floodplain river systems. These biota are particularly adapted to flow variability and extended periods of low or no flow through their use of egg-bank resting stages in floodplain sediments (e.g. Boulton et al.,

Water chemistry, fish and zooplankton
Managing Lower Gwydir environmental flows 76
2006). Yet, this lifehistory strategy highlights the dependence of these ecosystems on hydrological connectivity between channels and their floodplain (e.g. Jenkins and Boulton, 2003), either to allow for critical ontogenetic shifts or for fluxes in prey items and other materials between the two environments. In order to successfully manage and maximise positive ecological outcomes of environmental water, we clearly need more knowledge on the flow responses of fish and other aquatic fauna in the MDB. Here, we describe responses of water chemistry, invertebrate and fish parameters to flow variability and ECA releases in Lower Gwydir aquatic habitats, from October 2006 to February 2009.
7.2 Materials and methods Sampling sites and timing. The core objective of this research is to provide information to underpin future environmental flow decisions for the Lower Gwydir floodplain. Accordingly, study sites were selected along the Lower Gwydir River and Gingham Watercourse, the current primary focus of ECA releases in the catchment (Table 7.1; Fig. 7.1). A further set of sites were selected along the Mehi River to act as a control for any responses to flows along the former two watercourses. Three sites were selected along each watercourse, spaced from approximately 3 to 54 km apart in channel distance. This layout was chosen to represent the range in available riverine habitat along an upstream-downstream gradient, and to allow for the detection of parallel patterns in any response to individual flow events. Sites along the Mehi River were generally spaced more widely than those along other watercourses due to the greater sinuosity of the channel. Three sites were also selected in floodplain waterholes to the north of the Gingham Watercourse. These lie above the usual flood limits of flows along the three study watercourses and were included to act as a second level of control for any observed flow responses along the Gingham or Gwydir channels. Water physico-chemical parameters, invertebrates and fish were sampled on ten occasions between October 2006 and February 2009 which comprises three sampling seasons (2006/07, 2007/08, 2008/09) (Table 7.2). Additional sampling of water chemistry only was undertaken towards the end of an ECA release in April 2007. Sampling dates were chosen to allow before and after monitoring of ecological responses to ECA releases along the Gwydir River and Gingham Watercourse and to capture any seasonal variation in riverine communities. Water chemistry. Three replicate water samples were collected in acid-washed bottles from each site and retained unfiltered and frozen for later laboratory analyses of total nitrogen and total phosphorus, or as filtered samples for analysis of nitrate/nitrite (NOx), soluble reactable Phosphorus, dissolved organic carbon (DOC), chlorophyll a (Chla), and suspended solids. Additionally, we measured pH, turbidity, electric conductivity (EC), water temperature and dissolved oxygen (DO) in the field using a Horiba portable water analysis instrument. Fish assemblages. A set of four fyke nets (two large – 12 mm stretched mesh, 1.1 m diameter, 7.5 m wings; two small – 2 mm mesh, 0.4 m diameter, 1.2 m wings) were set overnight (18 - 20 hours) and collected the next morning. The width at which each fyke’s wings were set was recorded and, along with the set time, was used in calculations of
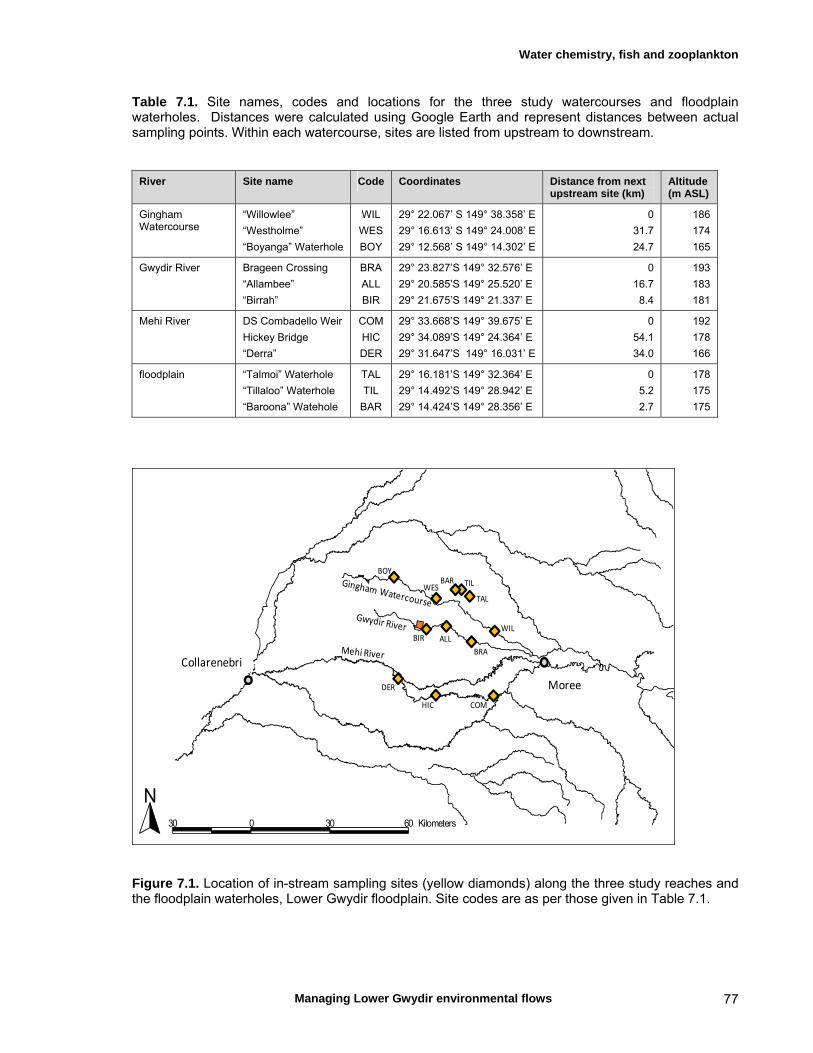
Water chemistry, fish and zooplankton
Managing Lower Gwydir environmental flows 77
Table 7.1. Site names, codes and locations for the three study watercourses and floodplain waterholes. Distances were calculated using Google Earth and represent distances between actual sampling points. Within each watercourse, sites are listed from upstream to downstream.
River Site name Code Coordinates Distance from next upstream site (km)
Altitude (m ASL)
Gingham Watercourse
“Willowlee”
“Westholme”
“Boyanga” Waterhole
WIL
WES
BOY
29° 22.067’ S 149° 38.358’ E
29° 16.613’ S 149° 24.008’ E
29° 12.568’ S 149° 14.302’ E
0
31.7
24.7
186
174
165
Gwydir River Brageen Crossing
“Allambee”
“Birrah”
BRA
ALL
BIR
29° 23.827’S 149° 32.576’ E
29° 20.585’S 149° 25.520’ E
29° 21.675’S 149° 21.337’ E
0
16.7
8.4
193
183
181
Mehi River DS Combadello Weir
Hickey Bridge
“Derra”
COM
HIC
DER
29° 33.668’S 149° 39.675’ E
29° 34.089’S 149° 24.364’ E
29° 31.647’S 149° 16.031’ E
0
54.1
34.0
192
178
166
floodplain “Talmoi” Waterhole
“Tillaloo” Waterhole
“Baroona” Watehole
TAL
TIL
BAR
29° 16.181’S 149° 32.364’ E
29° 14.492’S 149° 28.942’ E
29° 14.424’S 149° 28.356’ E
0
5.2
2.7
178
175
175
Moree
WIL
WES
BOY
BRA
COMHIC
DER
ALLBIR
Collarenebri
30 0 30 60 Kilometers
N
TAL
BAR TIL
Figure 7.1. Location of in-stream sampling sites (yellow diamonds) along the three study reaches and the floodplain waterholes, Lower Gwydir floodplain. Site codes are as per those given in Table 7.1.
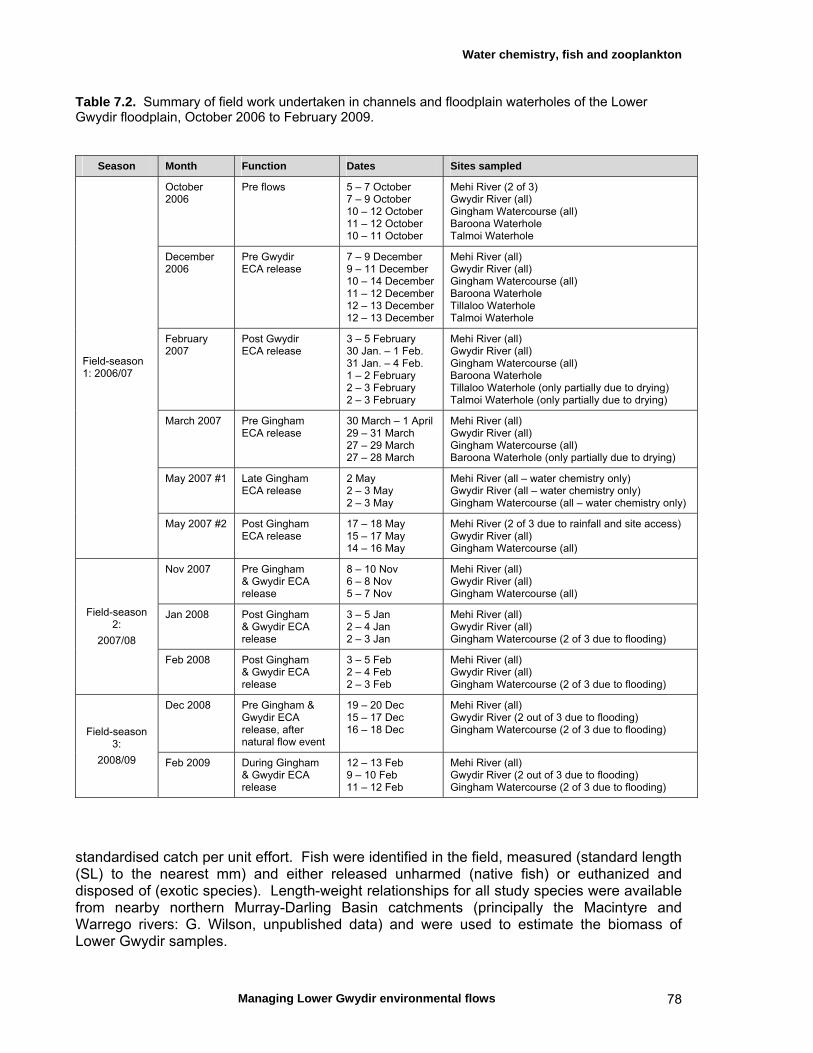
Water chemistry, fish and zooplankton
Managing Lower Gwydir environmental flows 78
Table 7.2. Summary of field work undertaken in channels and floodplain waterholes of the Lower Gwydir floodplain, October 2006 to February 2009.
Season Month Function Dates Sites sampled
October 2006
Pre flows 5 – 7 October 7 – 9 October 10 – 12 October 11 – 12 October 10 – 11 October
Mehi River (2 of 3) Gwydir River (all) Gingham Watercourse (all) Baroona Waterhole Talmoi Waterhole
December 2006
Pre Gwydir ECA release
7 – 9 December 9 – 11 December 10 – 14 December 11 – 12 December 12 – 13 December 12 – 13 December
Mehi River (all) Gwydir River (all) Gingham Watercourse (all) Baroona Waterhole Tillaloo Waterhole Talmoi Waterhole
February 2007
Post Gwydir ECA release
3 – 5 February 30 Jan. – 1 Feb. 31 Jan. – 4 Feb. 1 – 2 February 2 – 3 February 2 – 3 February
Mehi River (all) Gwydir River (all) Gingham Watercourse (all) Baroona Waterhole Tillaloo Waterhole (only partially due to drying) Talmoi Waterhole (only partially due to drying)
March 2007 Pre Gingham ECA release
30 March – 1 April 29 – 31 March 27 – 29 March 27 – 28 March
Mehi River (all) Gwydir River (all) Gingham Watercourse (all) Baroona Waterhole (only partially due to drying)
May 2007 #1 Late Gingham ECA release
2 May 2 – 3 May 2 – 3 May
Mehi River (all – water chemistry only) Gwydir River (all – water chemistry only) Gingham Watercourse (all – water chemistry only)
Field-season 1: 2006/07
May 2007 #2 Post Gingham ECA release
17 – 18 May 15 – 17 May 14 – 16 May
Mehi River (2 of 3 due to rainfall and site access) Gwydir River (all) Gingham Watercourse (all)
Nov 2007 Pre Gingham & Gwydir ECA release
8 – 10 Nov 6 – 8 Nov 5 – 7 Nov
Mehi River (all) Gwydir River (all) Gingham Watercourse (all)
Jan 2008 Post Gingham & Gwydir ECA release
3 – 5 Jan 2 – 4 Jan 2 – 3 Jan
Mehi River (all) Gwydir River (all) Gingham Watercourse (2 of 3 due to flooding)
Field-season 2:
2007/08
Feb 2008 Post Gingham & Gwydir ECA release
3 – 5 Feb 2 – 4 Feb 2 – 3 Feb
Mehi River (all) Gwydir River (all) Gingham Watercourse (2 of 3 due to flooding)
Dec 2008 Pre Gingham & Gwydir ECA release, after natural flow event
19 – 20 Dec 15 – 17 Dec 16 – 18 Dec
Mehi River (all) Gwydir River (2 out of 3 due to flooding) Gingham Watercourse (2 of 3 due to flooding) Field-season
3:
2008/09 Feb 2009 During Gingham & Gwydir ECA release
12 – 13 Feb 9 – 10 Feb 11 – 12 Feb
Mehi River (all) Gwydir River (2 out of 3 due to flooding) Gingham Watercourse (2 of 3 due to flooding)
standardised catch per unit effort. Fish were identified in the field, measured (standard length (SL) to the nearest mm) and either released unharmed (native fish) or euthanized and disposed of (exotic species). Length-weight relationships for all study species were available from nearby northern Murray-Darling Basin catchments (principally the Macintyre and Warrego rivers: G. Wilson, unpublished data) and were used to estimate the biomass of Lower Gwydir samples.

Water chemistry, fish and zooplankton
Managing Lower Gwydir environmental flows 79
Crustaceans (Cherax destructor yabbies, Macrobrachium freshwater shrimps) and three turtle species were also trapped in the fyke nets. Yabbies were counted in the field and released. Macrobrachium australiense shrimp were counted and a random sample of 100–150 was retained in 70% ethanol from the small fyke nets for laboratory measurement of their carapace lengths (0.1 mm) to determine population size structure. Turtles were identified to species, their carapace length measured (mm), and then released. Invertebrate assemblages. Five random sediment core samples were collected at each site on each sampling trip. A corer (50 mm diameter, 110 mm depth) was inserted into the sediment to a depth of 10 mm and the enclosed sediment and overstanding liquid was transferred to a 250 mL container. Samples were allowed to settle and then the liquid was decanted from the sediment and both sub-samples preserved in 70% ethanol for later sorting. In the laboratory, these samples were sorted under a dissecting microscope to count and identify taxa. Invertebrate taxa were identified to lowest practical level (family or genus). Benthic samples were collected in Season 1 and 2. Additionally, we collected five replicate pelagic samples by pumping 5 L of water from the water column using a small boat bilge pump. Samples were filtered through a 56 ųm net and retained in a 200 mL jar in 70% ethanol for laboratory processing.
7.3 Results Hydrology. The watercourses of the Lower Gwydir floodplain showed a highly variable hydrograph throughout the study period (Fig. 7.2). Flow releases occurred regularly in all three study watercourses, and there was considerable inter-annual variability between the three seasons. There was a particularly pronounced difference in discharge during the main spring-summer fish-breeding period of each season (Table 7.3). For example, total discharge more than doubled in the Gingham in the second season and doubled again in the third season. Total flows were similar in the first two Gwydir seasons, but there was a significant increase in the third. Contrary to that, the Mehi experienced the highest total discharge in the first season. Other changes were observed in median flows, with a doubling in median flows in the second and third season in the Gingham and Gwydir, but an approximately 50% reduction of median flows in the Mehi in the second season and a return to similar levels in the third season. Water chemistry – general and spatial patterns. A range of physico-chemical water parameters was measured in the Lower Gwydir waterways (Table 7.4.). Values were averaged over all the measurements taken in the three watercourses for each of the three field seasons (October 2006–February 2009). Levels of total phosphorus (TP) were high even for a lowland river, especially in the first (2006/07) season. Similarly, total nitrogen (TN) was excessively high on most occasions. These measurements show that nutrient concentrations have the potential to lead to nuisance algae problems in the Lower Gwydir catchment. Turbidity levels were high as well. There was minimal fluctuation in values between seasons. There were only limited differences in physico-chemical water parameters between the three Lower Gwydir watercourses (Fig. 7.3). Mean nutrient concentrations and turbidity were excessive in all three rivers, and there was some evidence of increasing nutrient concentration from upstream to downstream in the Gingham Watercourse (Fig. 7.4).

Water chemistry, fish and zooplankton
Managing Lower Gwydir environmental flows 80
Fig. 7.2. Discharge variability in the Gingham Watercourse and Gwydir and Mehi rivers, over the study timeframe. Red bars indicate time of sampling, and the timing of ECA releases is indicated by blue arrows.
0
1000
2000
3000
4000
5000
6000
Aug-06 Nov-06 Feb-07 May-07 Aug-07 Nov-07 Feb-08 May-08 Aug-08 Nov-08 Feb-09
Dis
cha
rge
(M
L/d
)
Gingham
0
200
400
600
800
1000
1200
1400
1600
1800
2000
Aug-06 Nov-06 Feb-07 May-07 Aug-07 Nov-07 Feb-08 May-08 Aug-08 Nov-08 Feb-09
Dis
cha
rge
(M
L d
-1)
Gwydir
0
500
1000
1500
2000
2500
3000
3500
4000
4500
5000
Aug-06 Nov-06 Feb-07 May-07 Aug-07 Nov-07 Feb-08 May-08 Aug-08 Nov-08 Feb-09
Dis
cha
rge
(M
L/d
)
Mehi
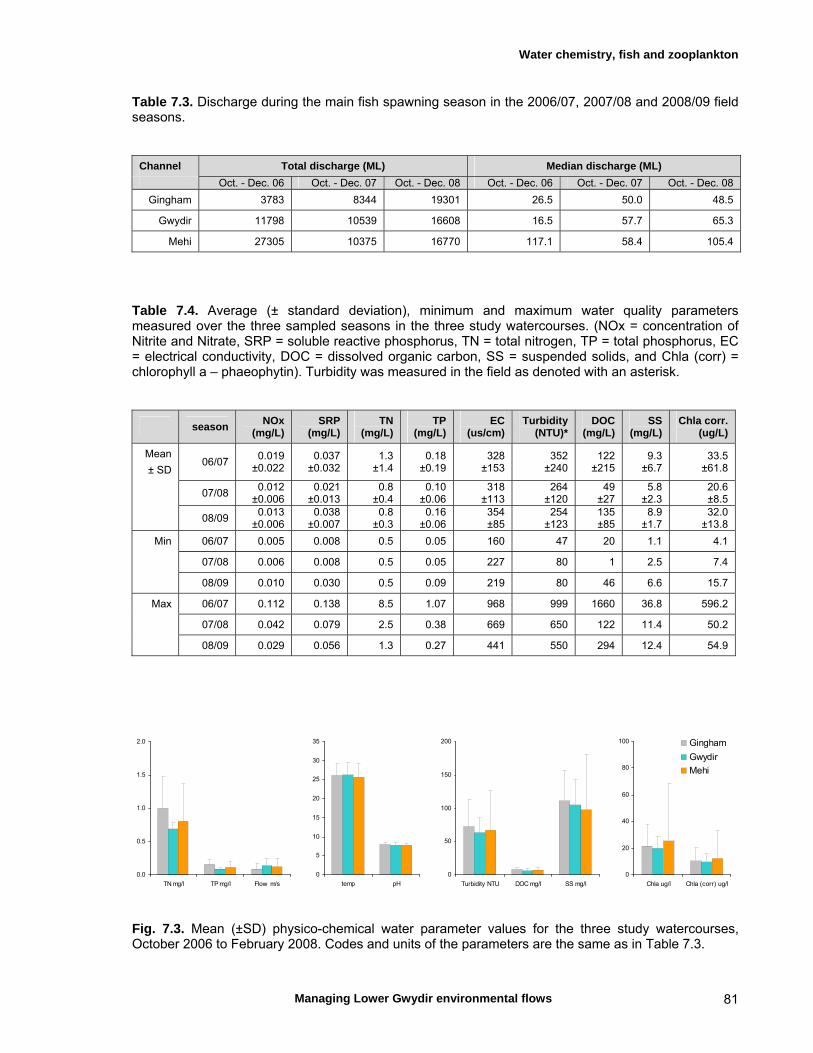
Water chemistry, fish and zooplankton
Managing Lower Gwydir environmental flows 81
Table 7.3. Discharge during the main fish spawning season in the 2006/07, 2007/08 and 2008/09 field seasons.
Channel Total discharge (ML) Median discharge (ML)
Oct. - Dec. 06 Oct. - Dec. 07 Oct. - Dec. 08 Oct. - Dec. 06 Oct. - Dec. 07 Oct. - Dec. 08
Gingham 3783 8344 19301 26.5 50.0 48.5
Gwydir 11798 10539 16608 16.5 57.7 65.3
Mehi 27305 10375 16770 117.1 58.4 105.4
Table 7.4. Average (± standard deviation), minimum and maximum water quality parameters measured over the three sampled seasons in the three study watercourses. (NOx = concentration of Nitrite and Nitrate, SRP = soluble reactive phosphorus, TN = total nitrogen, TP = total phosphorus, EC = electrical conductivity, DOC = dissolved organic carbon, SS = suspended solids, and Chla (corr) = chlorophyll a – phaeophytin). Turbidity was measured in the field as denoted with an asterisk.
season NOx
(mg/L) SRP
(mg/L) TN
(mg/L) TP
(mg/L) EC
(us/cm) Turbidity
(NTU)* DOC
(mg/L) SS
(mg/L) Chla corr.
(ug/L)
Mean
± SD 06/07
0.019 ±0.022
0.037 ±0.032
1.3 ±1.4
0.18 ±0.19
328 ±153
352 ±240
122 ±215
9.3 ±6.7
33.5 ±61.8
07/08 0.012
±0.006 0.021
±0.013 0.8
±0.4 0.10
±0.06 318
±113 264
±120 49
±27 5.8
±2.3 20.6 ±8.5
08/09 0.013
±0.006 0.038
±0.007 0.8
±0.3 0.16
±0.06 354 ±85
254 ±123
135 ±85
8.9 ±1.7
32.0 ±13.8
Min 06/07 0.005 0.008 0.5 0.05 160 47 20 1.1 4.1
07/08 0.006 0.008 0.5 0.05 227 80 1 2.5 7.4
08/09 0.010 0.030 0.5 0.09 219 80 46 6.6 15.7
Max 06/07 0.112 0.138 8.5 1.07 968 999 1660 36.8 596.2
07/08 0.042 0.079 2.5 0.38 669 650 122 11.4 50.2
08/09 0.029 0.056 1.3 0.27 441 550 294 12.4 54.9
Fig. 7.3. Mean (±SD) physico-chemical water parameter values for the three study watercourses, October 2006 to February 2008. Codes and units of the parameters are the same as in Table 7.3.
0
5
10
15
20
25
30
35
temp pH
0.0
0.5
1.0
1.5
2.0
TN mg/l TP mg/l Flow m/s
0
50
100
150
200
Turbidity NTU DOC mg/l SS mg/l
0
20
40
60
80
100
Chla ug/l Chla (corr) ug/l
Gingham
Gwydir
Mehi

Water chemistry, fish and zooplankton
Managing Lower Gwydir environmental flows 82
Fig. 7.4. Variability in total nitrogen and phosphorus concentration(TN, TP), electro-conductivity (EC) and turbidity (NTU) along the upstream-downstream gradient in the three study watercourses, October 2006 to February 2009. Error bars indicate the standard deviation. Water chemistry – temporal patterns. Parameters displayed differing temporal patterns in relation to flow variability. Water temperature and pH – Water temperature varied is a predicable seasonal manner, and showed little response to flows within the study watercourses (Fig. 7.6a). Similarly, pH varied little throughout the study period (Fig. 7.6a). Turbidity and electro-conductivity – Turbidity was particularly variable between sites in all watercourses, but particularly in the Gingham Watercourse (Fig. 7.6ab) where there was no clear effect of discharge. There was also an unclear relationship between flows and turbidity in the Lower Gwydir River, where peaks occurred during periods of both high (December 2006, January 2007) and low (May 2007) discharge. Electro-conductivity was generally lower
Gingham
0
0.5 1
1.5 2
WIL WES BOY Gwydir
0
0.2 0.4 0.6 0.8
1
BRA ALL BIR
Total Nitrogen (mg/L) Total Phosphorous (mg/L)
Mehi
0
0.5 1
1.5 2
COM HIC DER
Gingham
0
10
20
30
40
50
WIL WES BOY
Electro‐conductivity Turbidity (NTU)
Gwydir
0
10
20
30
40
BRA ALL BIR Mehi
0
10
20
30
40
COM HIC DER
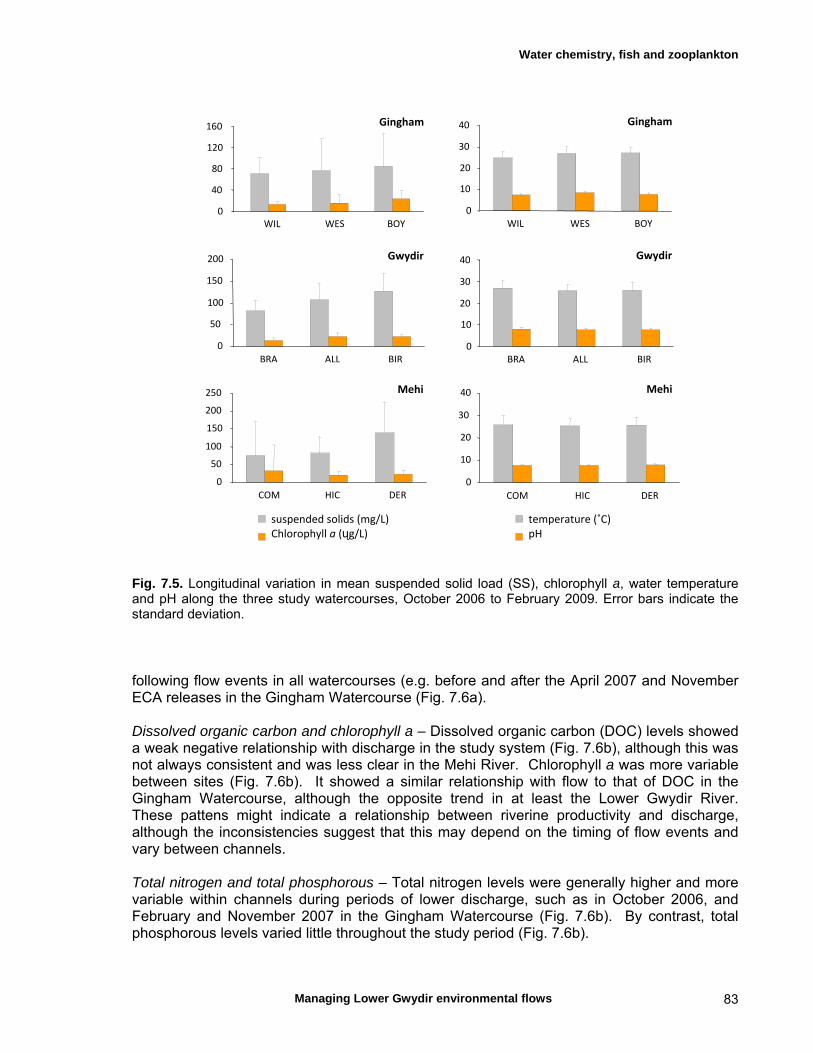
Water chemistry, fish and zooplankton
Managing Lower Gwydir environmental flows 83
Fig. 7.5. Longitudinal variation in mean suspended solid load (SS), chlorophyll a, water temperature and pH along the three study watercourses, October 2006 to February 2009. Error bars indicate the standard deviation. following flow events in all watercourses (e.g. before and after the April 2007 and November ECA releases in the Gingham Watercourse (Fig. 7.6a). Dissolved organic carbon and chlorophyll a – Dissolved organic carbon (DOC) levels showed a weak negative relationship with discharge in the study system (Fig. 7.6b), although this was not always consistent and was less clear in the Mehi River. Chlorophyll a was more variable between sites (Fig. 7.6b). It showed a similar relationship with flow to that of DOC in the Gingham Watercourse, although the opposite trend in at least the Lower Gwydir River. These pattens might indicate a relationship between riverine productivity and discharge, although the inconsistencies suggest that this may depend on the timing of flow events and vary between channels. Total nitrogen and total phosphorous – Total nitrogen levels were generally higher and more variable within channels during periods of lower discharge, such as in October 2006, and February and November 2007 in the Gingham Watercourse (Fig. 7.6b). By contrast, total phosphorous levels varied little throughout the study period (Fig. 7.6b).
0
40
80
120
160 Gingham
WIL WES BOY
Gwydir
0
50
100
150
200
BRA ALL BIR
Mehi
0
50
100
150
200
250
COM HIC DER
suspended solids (mg/L)Chlorophyll a (ųg/L)
temperature (˚C) pH
Gingham
0
10
20
30
40
WIL WES BOY
Gwydir
0
10
20
30
40
BRA ALL BIR
Mehi
0
10
20
30
40
COM HIC DER
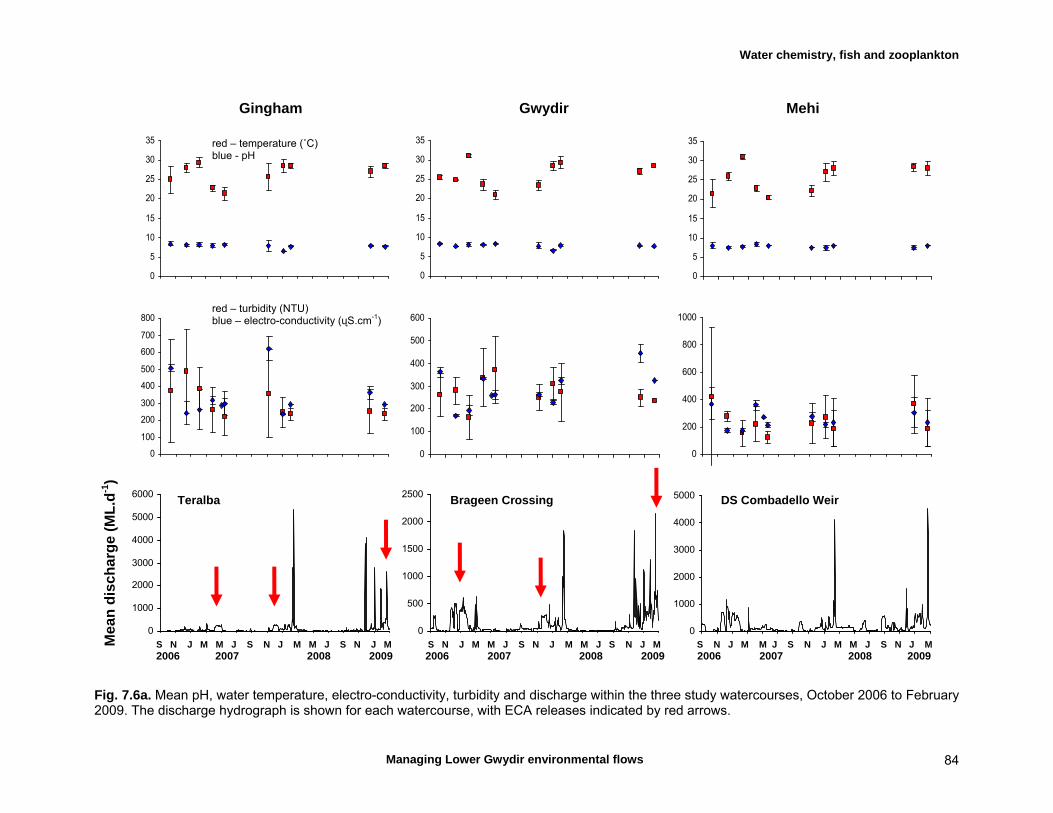
Water chemistry, fish and zooplankton
Managing Lower Gwydir environmental flows 84
Fig. 7.6a. Mean pH, water temperature, electro-conductivity, turbidity and discharge within the three study watercourses, October 2006 to February 2009. The discharge hydrograph is shown for each watercourse, with ECA releases indicated by red arrows.
0
500
1000
1500
2000
2500
0
5
10
15
20
25
30
35
0
5
10
15
20
25
30
35
0
5
10
15
20
25
30
35
0
100
200
300
400
500
600
700
800
0
100
200
300
400
500
600
0
200
400
600
800
1000
0
1000
2000
3000
4000
5000
6000
0
1000
2000
3000
4000
5000
S N J M M J S N J M M J S N J M S N J M M J S N J M M J S N J M S N J M M J S N J M M J S N J M 2006 2007 2008 2009 2006 2007 2008 2009 2006 2007 2008 2009
red – temperature (˚C) blue - pH
red – turbidity (NTU) blue – electro-conductivity (ųS.cm-1)
Teralba Brageen Crossing DS Combadello Weir
Gingham Gwydir Mehi M
ean
dis
char
ge
(ML
.d-1
)

Water chemistry, fish and zooplankton
Managing Lower Gwydir environmental flows 85
Fig. 7.6b. Mean concentration of dissolved organic carbon, chlorophyll a (phaeophytin corrected), total nitrogen, total phosphorous and discharge within the three study watercourses, October 2006 to February 2009. The discharge hydrograph is shown for each watercourse, with ECA releases indicated by red arrows.
0.0
0.2
0.4
0.6
0.8
1.0
0
10
20
30
40
50
0
10
20
30
0
20
40
60
80
100
0
500
1000
1500
2000
2500
0
1000
2000
3000
4000
5000
6000
0
1000
2000
3000
4000
5000
0
1
2
3
0
1
2
3
4
S N J M M J S N J M M J S N J M S N J M M J S N J M M J S N J M S N J M M J S N J M M J S N J M 2006 2007 2008 2009 2006 2007 2008 2009 2006 2007 2008 2009
Mea
n d
isch
arg
e (M
L.d
-1)
Teralba Brageen Crossing DS Combadello Weir
Gingham Gwydir Mehi
red – dissolved organic carbon (mg.L-1) blue – chlorophyll a (ųg.L-1)
red – Total nitrogen (mg.L-1) blue – Total phosphorous (mg.L-1)
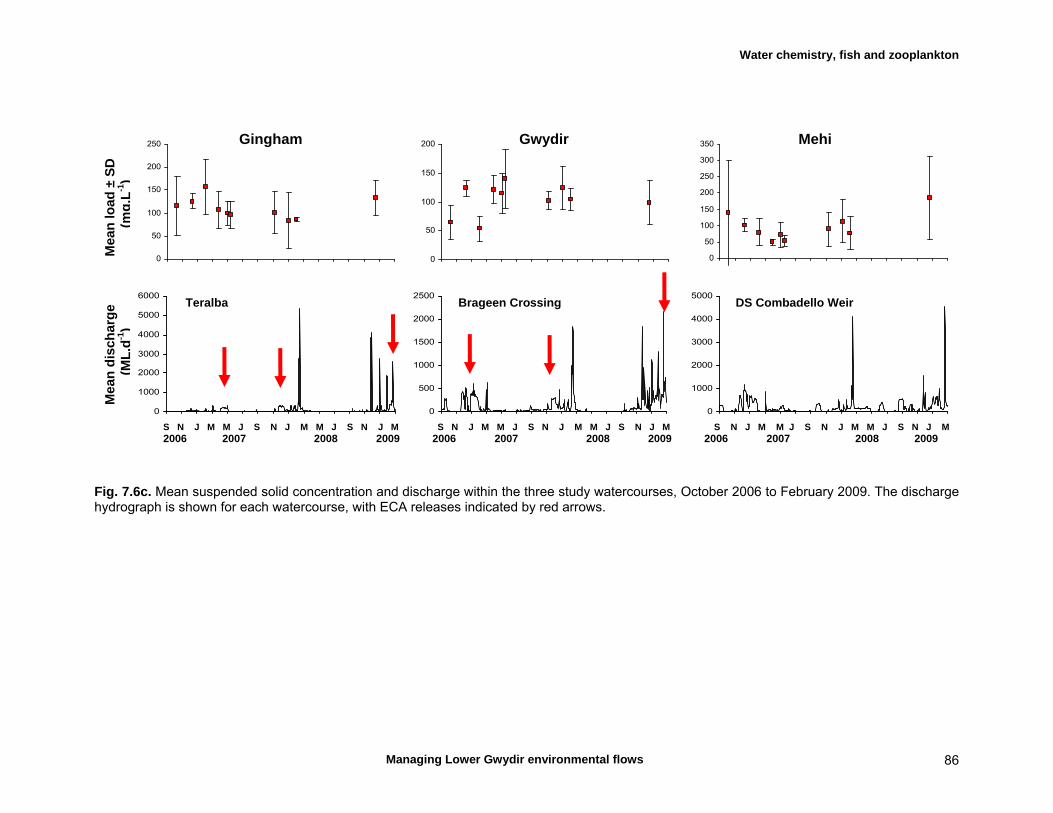
Water chemistry, fish and zooplankton
Managing Lower Gwydir environmental flows 86
Fig. 7.6c. Mean suspended solid concentration and discharge within the three study watercourses, October 2006 to February 2009. The discharge hydrograph is shown for each watercourse, with ECA releases indicated by red arrows.
0
50
100
150
200
250
0
50
100
150
200
0
500
1000
1500
2000
2500
0
1000
2000
3000
4000
5000
6000
0
1000
2000
3000
4000
5000
0
50
100
150
200
250
300
350
S N J M M J S N J M M J S N J M S N J M M J S N J M M J S N J M S N J M M J S N J M M J S N J M 2006 2007 2008 2009 2006 2007 2008 2009 2006 2007 2008 2009
Teralba Brageen Crossing DS Combadello Weir
Gingham Gwydir Mehi
Mea
n d
isch
arg
e
M
ean
load
± S
D
(M
L.d
-1)
(m
g.L
-1)

Water chemistry, fish and zooplankton
Managing Lower Gwydir environmental flows 87
Suspended solid load – Similar to total nitrogen, suspended solid load was generally lower during low discharge conditions, although there were inconsistencies in this trend (Fig. 7.6c). Fish – assemblage composition. We collected a total of 12,138 fish (8646 natives, 3492 exotics) from 12 taxa throughout the study (Table 7.5). Nine species were native fish, while three were exotic. However, the Lower Gwydir fish community was numerically dominated overall by only three native fish species. Bony bream was by far the most abundant species, accounting for nearly 50% of all specimens caught and present in 90% of samples. Carp gudgeon and spangled perch were the other abundant native fishes. Murray cod and golden perch were relatively uncommon (each less than 1% abundance). The exotic pest species carp and goldfish were widely dispersed throughout the study sites and carp was the second most abundant species. In terms of biomass, carp was the most important species, responsible for more than 50% of the total fish biomass in Lower Gwydir waterways. The larger native fish (Murray cod and golden perch) also accounted for a significant portion of the total biomass due to their average large size. There was a marked and consistent difference in fish community composition between the three studied waterways (Fig. 7.7), with each of the watercourses numerically dominated by a different native fish species. While carp gudgeon was the most common native fish in the Mehi River, bony bream dominated the Lower Gwydir River fish community. In the Gingham Watercourse, spangled perch and bony bream were jointly the most abundant native species. Other native fish were generally uncommon. A higher percentage of exotic fishes (carp and goldfish) occurred in the Lower Gwydir River and Gingham Watercourse than the Mehi River. In terms of biomass, exotics were especially dominant in the Gingham Watercourse, with carp comprising about 80% total fish biomass. This difference in fish community composition between the rivers could have been due to differences in habitat quality in the three rivers, with the Gingham Watercourse being the most degraded channel, largely lacking riparian cover and in-stream structure (coarse woody debris), both important habitat features for native fish. There was a general increase in the relative abundance of exotic species from upstream to downstream in the Mehi River (Fig. 7.8), but no longitudinal trend was evident in either the Gingham Watercourse or Lower Gwydir River. However, longitudinal patterns were apparent in most native species (Fig. 7.8). For example, bony bream increased downstream in all watercourses, as did spangled perch in the Lower Gwydir and Mehi rivers. Conversely, the ‘miscellaneous native’ species peaked at the upstream site in each watercourse and declined downstream. Carp gudgeon mirrored this trend in the Lower Gwydir and Mehi rivers, but displayed an opposite pattern in the Gingham Watercourse. Fish – temporal variation in abundances. The variable hydrograph made it difficult to interpret temporal changes in fish abundance, and numbers fluctuated widely between months and waterways (Fig.7.9). While the effect of ECA releases on native fish abundances was difficult to separate from that of seasonal factors, the influence of these was probably additive. For example, the lack of any significant shift in native fish abundances following the April 2007 ECA release in the Gingham Watercourse contrasted with a strong response following the November 2007 release in the same channel. A similar effect of discharge was also apparent in the Mehi River. However, discharge effects on overall abundances were inconsistent over time. For example, discharge responses differed considerably in both the Gingham Watercourse
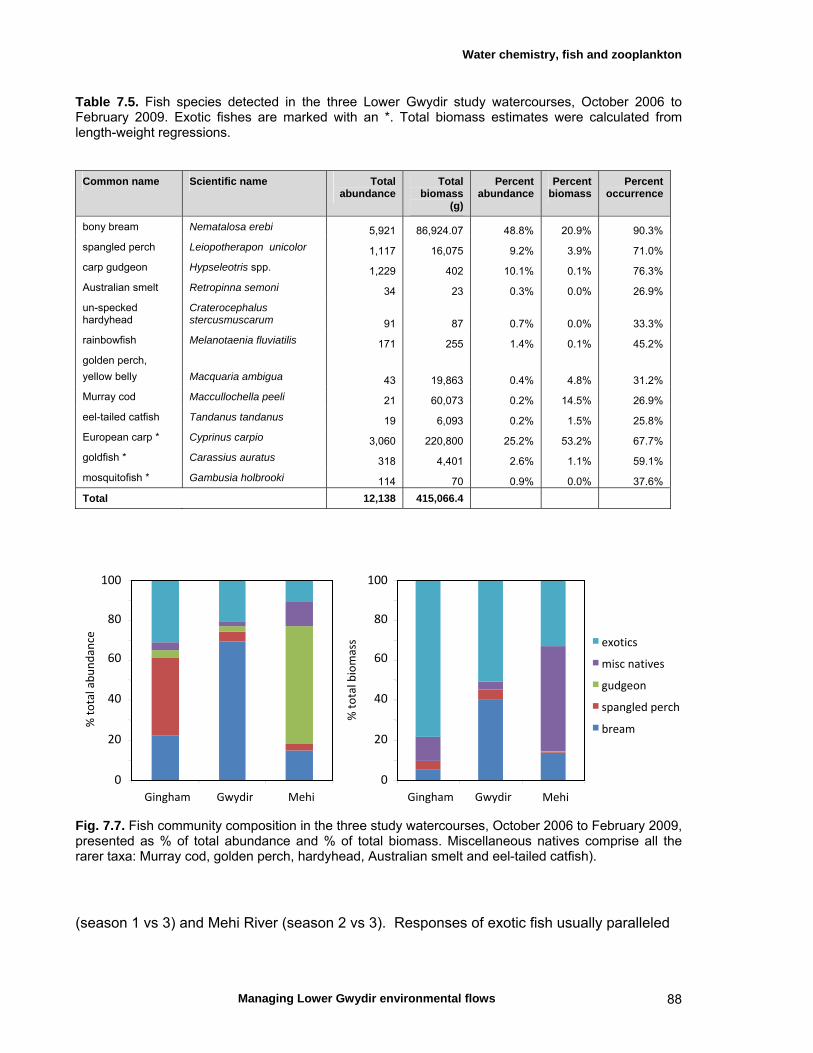
Water chemistry, fish and zooplankton
Managing Lower Gwydir environmental flows 88
Table 7.5. Fish species detected in the three Lower Gwydir study watercourses, October 2006 to February 2009. Exotic fishes are marked with an *. Total biomass estimates were calculated from length-weight regressions.
Common name Scientific name Total abundance
Total biomass
(g)
Percent abundance
Percent biomass
Percent occurrence
bony bream Nematalosa erebi 5,921 86,924.07 48.8% 20.9% 90.3%
spangled perch Leiopotherapon unicolor 1,117 16,075 9.2% 3.9% 71.0%
carp gudgeon Hypseleotris spp. 1,229 402 10.1% 0.1% 76.3%
Australian smelt Retropinna semoni 34 23 0.3% 0.0% 26.9%
un-specked hardyhead
Craterocephalus stercusmuscarum 91 87 0.7% 0.0% 33.3%
rainbowfish Melanotaenia fluviatilis 171 255 1.4% 0.1% 45.2%
golden perch,
yellow belly Macquaria ambigua 43 19,863 0.4% 4.8% 31.2%
Murray cod Maccullochella peeli 21 60,073 0.2% 14.5% 26.9%
eel-tailed catfish Tandanus tandanus 19 6,093 0.2% 1.5% 25.8%
European carp * Cyprinus carpio 3,060 220,800 25.2% 53.2% 67.7%
goldfish * Carassius auratus 318 4,401 2.6% 1.1% 59.1%
mosquitofish * Gambusia holbrooki 114 70 0.9% 0.0% 37.6%
Total 12,138 415,066.4
Fig. 7.7. Fish community composition in the three study watercourses, October 2006 to February 2009, presented as % of total abundance and % of total biomass. Miscellaneous natives comprise all the rarer taxa: Murray cod, golden perch, hardyhead, Australian smelt and eel-tailed catfish). (season 1 vs 3) and Mehi River (season 2 vs 3). Responses of exotic fish usually paralleled
Gingham Gwydir Mehi
% total abundance
Gingham Gwydir Mehi
% total biomass exotics
misc natives
gudgeon spangled perch
bream
100
80
60
40
20
0
100
80
60
40
20
0
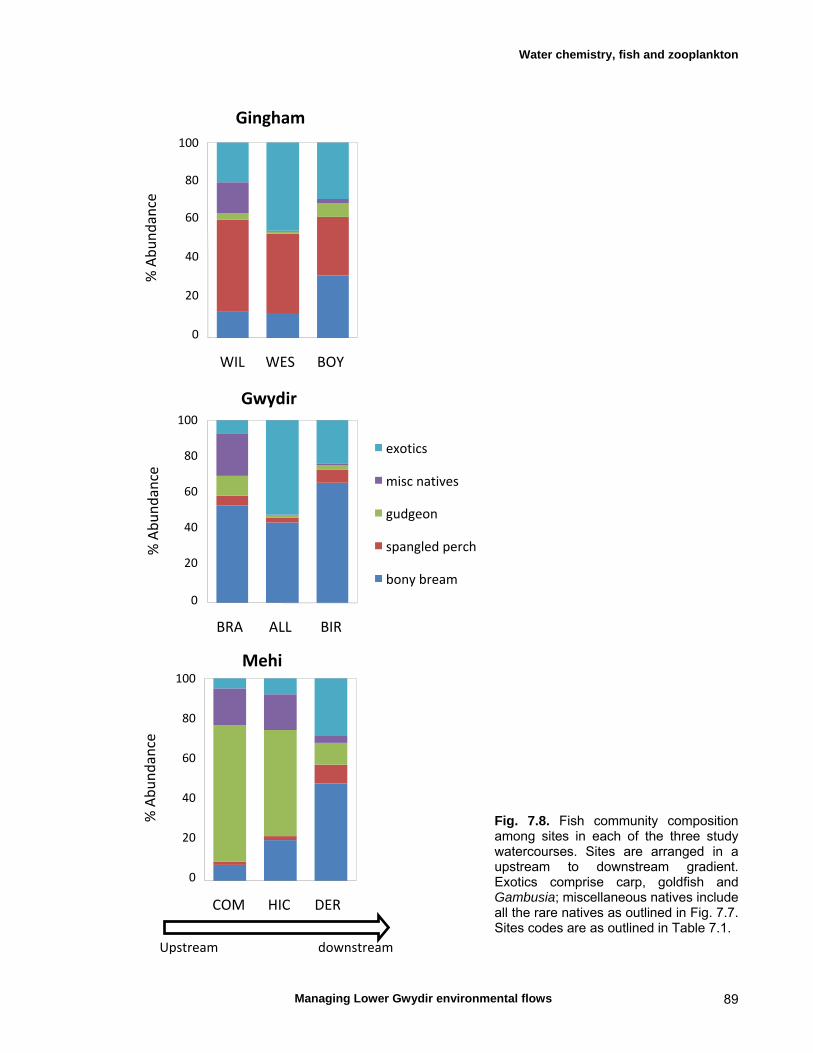
Water chemistry, fish and zooplankton
Managing Lower Gwydir environmental flows 89
Fig. 7.8. Fish community composition among sites in each of the three study watercourses. Sites are arranged in a upstream to downstream gradient. Exotics comprise carp, goldfish and Gambusia; miscellaneous natives include all the rare natives as outlined in Fig. 7.7. Sites codes are as outlined in Table 7.1.
Gwydir
BRA ALL BIR
% Abundance
exotics
misc natives
gudgeon
spangled perch
bony bream
Gingham
WIL WES BOY
% Abundance
Mehi
COM HIC DER
% Abundance
100
80
60
40
20
0
100
80
60
40
20
0
100
80
60
40
20
0
Upstream downstream
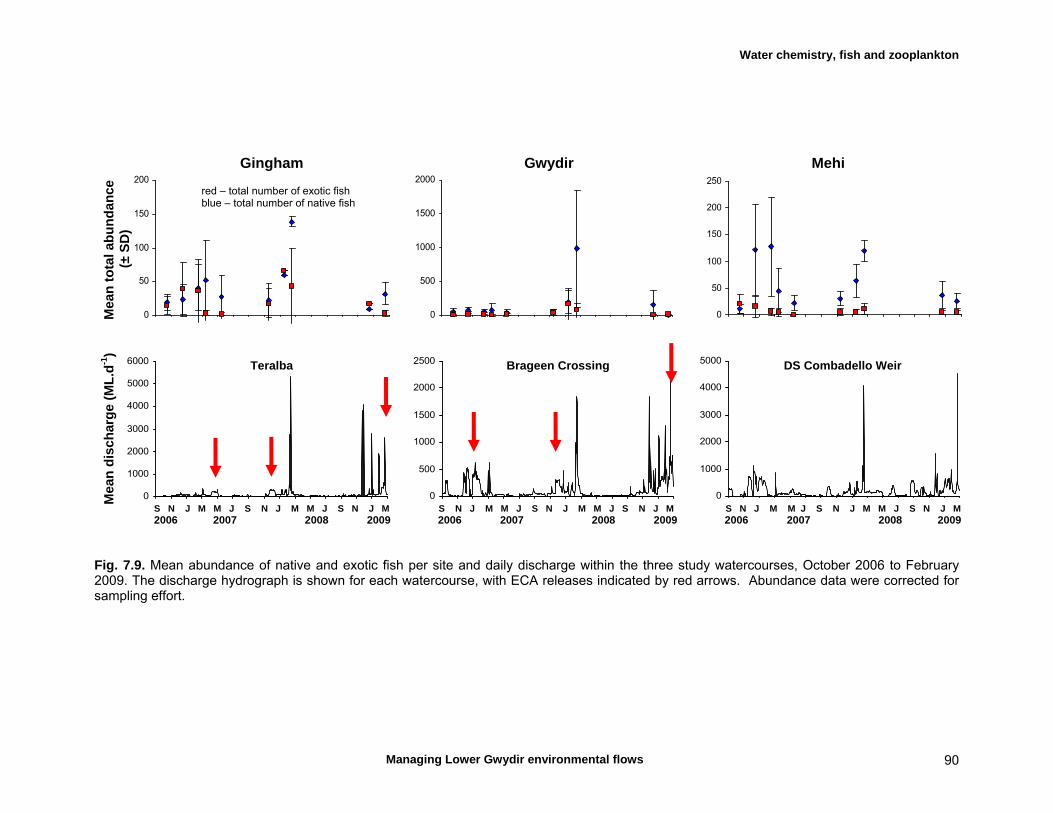
Water chemistry, fish and zooplankton
Managing Lower Gwydir environmental flows 90
Fig. 7.9. Mean abundance of native and exotic fish per site and daily discharge within the three study watercourses, October 2006 to February 2009. The discharge hydrograph is shown for each watercourse, with ECA releases indicated by red arrows. Abundance data were corrected for sampling effort.
0
500
1000
1500
2000
0
1000
2000
3000
4000
5000
0
500
1000
1500
2000
2500
0
1000
2000
3000
4000
5000
6000
0
50
100
150
200
0
50
100
150
200
250
S N J M M J S N J M M J S N J M S N J M M J S N J M M J S N J M S N J M M J S N J M M J S N J M 2006 2007 2008 2009 2006 2007 2008 2009 2006 2007 2008 2009
Gingham Gwydir Mehi
red – total number of exotic fish blue – total number of native fish
Mea
n d
isch
arg
e (M
L.d
-1)
Mea
n t
ota
l ab
un
dan
ce
(
± S
D)
Teralba Brageen Crossing DS Combadello Weir

Water chemistry, fish and zooplankton
Managing Lower Gwydir environmental flows 91
Fig. 7.10a. Mean abundance of (A) bony bream (Nematolosa erebi) and (B) spangled perch (Leiopotherapon unicolor) per site and daily discharge within the three study watercourses, October 2006 to February 2009. The discharge hydrograph is shown for each watercourse, with ECA releases indicated by red arrows. Abundance data were corrected for sampling effort.
0
1000
2000
3000
4000
5000
0
500
1000
1500
2000
2500
0
1000
2000
3000
4000
5000
6000
0
20
40
60
80
100
120
140
0
500
1000
1500
2000
0
10
20
30
40
0
20
40
60
80
100
120
140
0
20
40
60
80
0
10
20
30
40
Gingham Gwydir Mehi
Mea
n d
isch
arg
e (M
L.d
-1)
M
ean
to
tal a
bu
nd
ance
(±
SD
)
S N J M M J S N J M M J S N J M S N J M M J S N J M M J S N J M S N J M M J S N J M M J S N J M 2006 2007 2008 2009 2006 2007 2008 2009 2006 2007 2008 2009
A
B
Teralba Brageen Crossing DS Combadello Weir
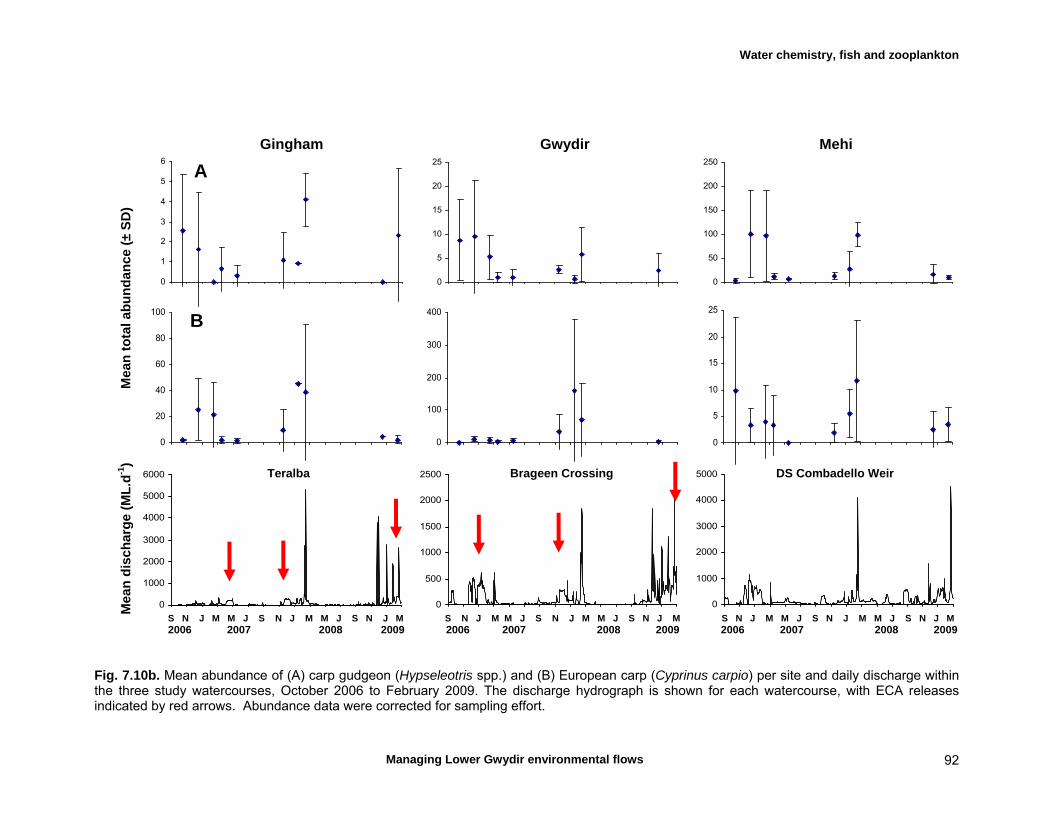
Water chemistry, fish and zooplankton
Managing Lower Gwydir environmental flows 92
Fig. 7.10b. Mean abundance of (A) carp gudgeon (Hypseleotris spp.) and (B) European carp (Cyprinus carpio) per site and daily discharge within the three study watercourses, October 2006 to February 2009. The discharge hydrograph is shown for each watercourse, with ECA releases indicated by red arrows. Abundance data were corrected for sampling effort.
0
1000
2000
3000
4000
5000
0
500
1000
1500
2000
2500
0
1000
2000
3000
4000
5000
6000
0
5
10
15
20
25
0
1
2
3
4
5
6
0
50
100
150
200
250
0
5
10
15
20
25
0
20
40
60
80
100
0
100
200
300
400
S N J M M J S N J M M J S N J M S N J M M J S N J M M J S N J M S N J M M J S N J M M J S N J M 2006 2007 2008 2009 2006 2007 2008 2009 2006 2007 2008 2009
Gingham Gwydir Mehi M
ean
dis
char
ge
(ML
.d-1
)
M
ean
to
tal a
bu
nd
ance
(±
SD
)
A
B
Teralba Brageen Crossing DS Combadello Weir

Water chemistry, fish and zooplankton
Managing Lower Gwydir environmental flows 93
that of native fish (e.g., Mehi River, season 2), although their abundances were generally much lower than that of native species. In the Gingham Watercourse and Lower Gwydir River, abundances of bony bream, spangled perch, carp gudgeon and European carp were higher in the second field season than the first (Fig. 7.10a,b). While this mirrored overall discharge volumes at the seasonal scale in these channels, a similar response was not evident in the third field season. Whether increases in fish numbers were a result of localised spawning in the Lower Gwydir system or from having been flushed in from upstream is unclear. This point is discussed in more detail in Population size structure below. Fish – spatio-temporal variation in assemblage structure. To analyse possible spatio-temporal patterns in fish assemblages, we performed ordinations on the fish abundance data. These plots display samples according to their similarities in species composition, reflecting both species richness and abundance. Samples similar in species composition are grouped closely together, and dissimilar samples are spaced more widely in the plot. At the larger watercourse scale, data averaged over the three respective sites in each river revealed a distinct fish assemblage in each waterway (Fig. 7.11). The Lower Gwydir River fish assemblage appeared to vary the most between trips. We excluded one outlier (Lower Gwydir River, February 2009) from the grouping as this sampling point was grouped very far from the remaining samples from this river, probably due to the unusually low number of fish (especially bony bream – 3 fish instead of usually several hundred) at this time. When samples from consecutive trips are connected by arrows, the nature of changes in fish assemblages over time becomes clearer (Fig. 7.12). Fish communities appeared to vary over time in different ways between the three watercourses. However, temporal variation appeared lower than the spatial variability, suggesting that structural characteristics or related hydrological differences between study reaches were explaining more of the differences between fish communities than seasonal fluctuations. This implies that any influence of flow variability on the Lower Gwydir fish fauna differed between watercourses, and that in-stream habitat may also have had a significant interactive effect. The strong change in the Lower Gwydir River community is clearly visible as a deviation in the ordination plot for the last four sampling trips (seasons 2 and 3), due to large fluctuations in fish numbers during those sampling trips. Fish communities in the other two channels remained more stable over time. Fish – small-scale assemblage variability. At the smaller, within-watercourse scale, fish assemblage patterns were organized in a slightly different way. Sites within watercourses tended to group together (Fig. 7.13), although there was also a strong overlap between sites from different watercourses. However, there were also significant within-watercourse patterns that appeared to represent a longitudinal trend. The Gingham Watercourse at “Willowlee” was separated from the two downstream sites, while the two upstream sites differed from the downstream site at “Birrah” and “Derra” in the Gwydir and Mehi rivers, respectively. To further investigate the possible impacts of flows and hydrological variables on fish assemblage composition, we conducted ordinations for all three rivers separately, connected consecutive months and indicated the timing of flow events (Fig. 7.14). Additionally we created a plot that shows the median discharge in the preceding 30 days prior to fish sampling (Fig. 7.15). In the Mehi River and Gingham Watercourse, the fish community seems to change in a seasonal fashion. These trajectories reflected a circular pattern, with the May 2007 samples grouped close to those from October 2006. However, this pattern was less pronounced in the Lower Gwydir River, and the fish community changed dramatically in

Water chemistry, fish and zooplankton
Managing Lower Gwydir environmental flows 94
RIVERGinghamGwydirMehi
2D Stress: 0.12 RIVERGinghamGwydirMehi
2D Stress: 0.12
Fig. 7.11. Spatial variation in fish assemblages between the three study watercourses. Each point indicates the fish community at a given sample date in each river (average of the three sites). There are three distinct fish assemblages in the three rivers. Outlines indicate the spread of the data. One outlier of the Gwydir River samples (February 2009) was not included in the outlines.
RIVERGinghamGwydirMehi
2D Stress: 0.12
Feb09
Oct06
Oct06
Oct06
Feb09
Feb09
RIVERGinghamGwydirMehi
2D Stress: 0.12
Feb09
Oct06
Oct06
Oct06
Feb09
Feb09
Fig. 7.12. Temporal changes in fish assemblages in the three study watercourses. Arrows connect consecutive sample dates, from October 2006 to February 2009. Note the strong deviation in the last four samples of the Gwydir samples.

Water chemistry, fish and zooplankton
Managing Lower Gwydir environmental flows 95
Gingham
Gwydir
Mehi SiteWILWESBOYBRAALLBIRCOMHICDER
2D Stress: 0.19
SiteWILWESBOYBRAALLBIRCOMHICDER
2D Stress: 0.19
SiteWILWESBOYBRAALLBIRCOMHICDER
2D Stress: 0.19
Gingham
Gwydir
Mehi SiteWILWESBOYBRAALLBIRCOMHICDER
2D Stress: 0.19
SiteWILWESBOYBRAALLBIRCOMHICDER
2D Stress: 0.19
SiteWILWESBOYBRAALLBIRCOMHICDER
2D Stress: 0.19
Gingham
Gwydir
Mehi SiteWILWESBOYBRAALLBIRCOMHICDER
2D Stress: 0.19
SiteWILWESBOYBRAALLBIRCOMHICDER
2D Stress: 0.19
SiteWILWESBOYBRAALLBIRCOMHICDER
2D Stress: 0.19
SiteWILWESBOYBRAALLBIRCOMHICDER
2D Stress: 0.19 SiteWILWESBOYBRAALLBIRCOMHICDER
2D Stress: 0.19
SiteWILWESBOYBRAALLBIRCOMHICDER
2D Stress: 0.19 SiteWILWESBOYBRAALLBIRCOMHICDER
2D Stress: 0.19
SiteWILWESBOYBRAALLBIRCOMHICDER
2D Stress: 0.19 SiteWILWESBOYBRAALLBIRCOMHICDER
2D Stress: 0.19
Fig. 7.13. Small spatial scale variability in fish communities between Lower Gwydir sample sites, October 2006 to February 2009.
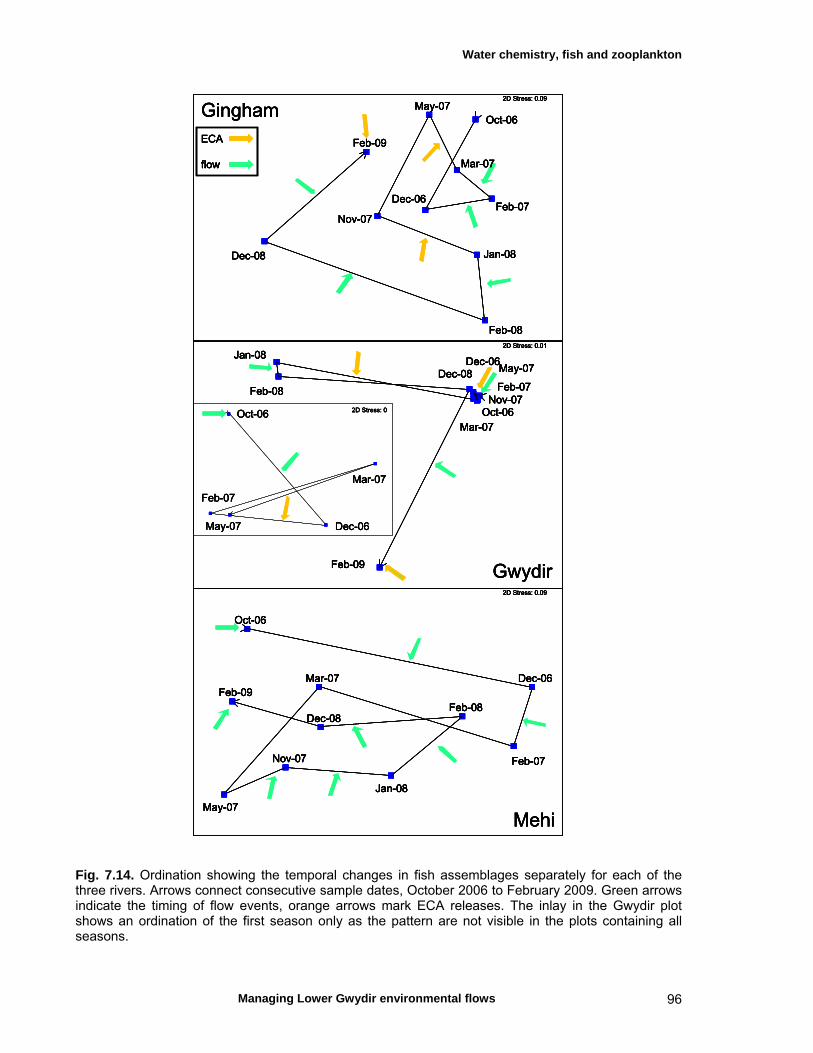
Water chemistry, fish and zooplankton
Managing Lower Gwydir environmental flows 96
ECA
flow
Oct-06
Dec-06Feb-07
Mar-07
May-07
Nov-07
Jan-08
Feb-08
Dec-08
Feb-09
2D Stress: 0.09
Gingham
Oct-06
Dec-06
Feb-07
Mar-07
May-07
Nov-07
Jan-08
Feb-08
Dec-08
Feb-09
2D Stress: 0.01
Gwydir
Oct-06
Dec-06
Feb-07
Mar-07
May-07
Nov-07
Jan-08
Feb-08Dec-08
Feb-09
2D Stress: 0.09
Mehi
Oct-06
Dec-06
Feb-07
Mar-07
May-07
2D Stress: 0
ECA
flow
ECA
flow
ECA
flow
Oct-06
Dec-06Feb-07
Mar-07
May-07
Nov-07
Jan-08
Feb-08
Dec-08
Feb-09
2D Stress: 0.09
GinghamOct-06
Dec-06Feb-07
Mar-07
May-07
Nov-07
Jan-08
Feb-08
Dec-08
Feb-09
2D Stress: 0.09
Oct-06
Dec-06Feb-07
Mar-07
May-07
Nov-07
Jan-08
Feb-08
Dec-08
Feb-09
2D Stress: 0.09
Gingham
Oct-06
Dec-06
Feb-07
Mar-07
May-07
Nov-07
Jan-08
Feb-08
Dec-08
Feb-09
2D Stress: 0.01
Gwydir
Oct-06
Dec-06
Feb-07
Mar-07
May-07
Nov-07
Jan-08
Feb-08
Dec-08
Feb-09
2D Stress: 0.01
Oct-06
Dec-06
Feb-07
Mar-07
May-07
Nov-07
Jan-08
Feb-08
Dec-08
Feb-09
2D Stress: 0.01
Gwydir
Oct-06
Dec-06
Feb-07
Mar-07
May-07
Nov-07
Jan-08
Feb-08Dec-08
Feb-09
2D Stress: 0.09
Mehi
Oct-06
Dec-06
Feb-07
Mar-07
May-07
Nov-07
Jan-08
Feb-08Dec-08
Feb-09
2D Stress: 0.09
Oct-06
Dec-06
Feb-07
Mar-07
May-07
Nov-07
Jan-08
Feb-08Dec-08
Feb-09
2D Stress: 0.09
Mehi
Oct-06
Dec-06
Feb-07
Mar-07
May-07
2D Stress: 0Oct-06
Dec-06
Feb-07
Mar-07
May-07
2D Stress: 0
Fig. 7.14. Ordination showing the temporal changes in fish assemblages separately for each of the three rivers. Arrows connect consecutive sample dates, October 2006 to February 2009. Green arrows indicate the timing of flow events, orange arrows mark ECA releases. The inlay in the Gwydir plot shows an ordination of the first season only as the pattern are not visible in the plots containing all seasons.

Water chemistry, fish and zooplankton
Managing Lower Gwydir environmental flows 97
median prec. flow ML/30d
50
200
350
500
Oct-06
Dec-06
Feb-07
Mar-07
May-07
Nov-07Jan-08
Feb-08
Dec-08
Feb-09
2D Stress: 0.09
median prec. flow ML/30d
40
160
280
400
Jan-08
Feb-08
Feb-09
2D Stress: 0.01
median prec. flow ML/30d
30
120
210
300
Oct-06
Dec-06
Feb-07
Mar-07
May-07
Nov-07
Jan-08
Feb-08
Dec-08
Feb-09
2D Stress: 0.09
Oct-06
Dec-06
Feb-07
Mar-07
May-07
2D Stress: 0
Oct-06
Dec-06
Feb-07
Mar-07
May-07
2D Stress: 0
median prec. flow ML/30d
50
200
350
500
Oct-06
Dec-06
Feb-07
Mar-07
May-07
Nov-07Jan-08
Feb-08
Dec-08
Feb-09
2D Stress: 0.09 median prec. flow ML/30d
50
200
350
500
Oct-06
Dec-06
Feb-07
Mar-07
May-07
Nov-07Jan-08
Feb-08
Dec-08
Feb-09
2D Stress: 0.09
median prec. flow ML/30d
40
160
280
400
Jan-08
Feb-08
Feb-09
2D Stress: 0.01 median prec. flow ML/30d
40
160
280
400
Jan-08
Feb-08
Feb-09
2D Stress: 0.01
median prec. flow ML/30d
30
120
210
300
Oct-06
Dec-06
Feb-07
Mar-07
May-07
Nov-07
Jan-08
Feb-08
Dec-08
Feb-09
2D Stress: 0.09 median prec. flow ML/30d
30
120
210
300
Oct-06
Dec-06
Feb-07
Mar-07
May-07
Nov-07
Jan-08
Feb-08
Dec-08
Feb-09
2D Stress: 0.09
Oct-06
Dec-06
Feb-07
Mar-07
May-07
2D Stress: 0
Oct-06
Dec-06
Feb-07
Mar-07
May-07
2D Stress: 0
Fig. 7.15. Temporal shifts in fish assemblage structure in each of the three study watercourses. Arrows connect consecutive sample dates, from October 2006 to February 2009. Orange arrows mark ECA releases. The green balloons indicate the median discharge in the previous 30 days before sampling.

Water chemistry, fish and zooplankton
Managing Lower Gwydir environmental flows 98
the last four sampling occasions, particularly due to the high fluctuation in carp and bony bream numbers (high in season 2, very low in season 3). The timing of flows and the median discharge level seemed to explain less in the observed patterns. Sometimes there were big differences in fish assemblages of consecutive months, even though there was minimal flow in the preceding 30 days. In particular, strong changes in season 2 (January and February 2008) in the Lower Gwydir River did not appear to have been associated with any exceptionally high flow events prior to our sampling. Fish – population size structure. We analysed length frequency distributions of bony bream, spangled perch, carp gudgeon and the exotic European carp and for the three study watercourses to identify the timing of recruitment in these species. Data on Murray cod, golden perch and un-specked hardyhead are also presented for the Mehi River. Bony bream. Up to three bony bream cohorts were evident in each season throughout the study period (e.g. Gingham Watercourse, February 2008, Fig. 7.16). For the first season, abundances were limited in the Gingham Watercourse and Mehi River, although recent spawning activity/recruitment was still apparent at least in March and May 2007 (Gingham) and December 2006 and March 2007 (Mehi). Size structure in the Gingham Watercourse in May 2007 suggested a possible link between spawning activity and the April ECA release, although the Gwydir May size structure also provided some evidence of recent spawning in the absence of ECA flows. The Lower Gwydir River population also provided some evidence of a spawning response to the December 2006 – January 2007 ECA release (Fig. 7.17). Bony bream size-structure in both the Lower Gwydir River and the floodplain waterholes prior to this flow event was dominated by fish of around 40–60 mm and 90–110 mm in length. Following the ECA flow, fish in the floodplain waterholes still largely reflected the pre-release size-structure, while the appearance of new individuals became progressively clearer in the Lower Gwydir River over the two months following the release. Fish in this younger cohort were around 20–39 and 40–79 mm in February and March, respectively. Preliminary knowledge of size-at-age relationships in this species (Heagney et al., 2008), suggests that these fish were largely derived from spawning during the ECA flow. In the second season, recent spawning activity was apparent in all populations (Gingham: November, January; Gwydir: January, February; Mehi: January, February), although it was unclear whether any had been initiated by the December ECA release into both the Lower Gwydir River and Gingham Watercourse. It is interesting to note that while the number of mature bony bream was very limited in both the Lower Gwydir River and the Gingham Watercourse throughout the study period, there were a number of large specimens in the Mehi River despite the relatively low abundance of this population. This lack of mature fish may have important implications for local recruitment, and suggests that there is limited suitable habitat for mature bony bream in the system, that mortality is high, or that fish emigrate away from our study sites before reaching maturity. Spangled perch. Recruitment of spangled perch occurred throughout the study period, although with considerable variability between channels (Fig. 7.18). In the first season, recent spawning activity was particularly apparent in the Gingham Watercourse (December, March and May), Gwydir (December and possibly May) and Mehi (February). Along with previous size-at-age data from the nearby Macintyre River, this suggests that the ECA release may have initiated spawning activity in the Gingham Watercourse, but not the Lower
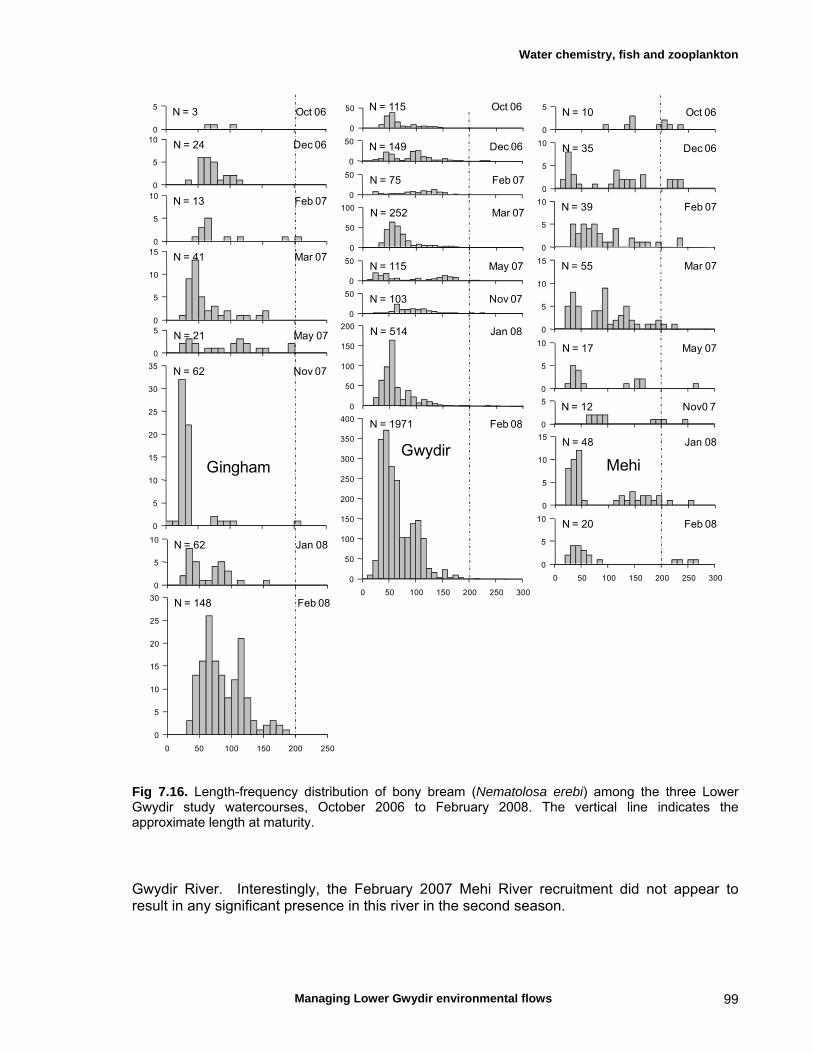
Water chemistry, fish and zooplankton
Managing Lower Gwydir environmental flows 99
N = 3
0
5 Oct 06
Dec 06N = 24
0
5
10
N = 13 Feb 07
0
5
10
N = 41 Mar 07
0
5
10
15
N = 21 May 07
0
5
Jan 08N = 62
0
5
10
N = 62 Nov 07
0
5
10
15
20
25
30
35
0 50 100 150 200 250
N = 148 Feb 08
0
5
10
15
20
25
30
Gingham Mehi
0
5 N = 10 Oct 06
Dec 06N = 35
0
5
10
N = 39 Feb 07
0
5
10
N = 55 Mar 07
0
5
10
15
N = 17 May 07
0
5
10
N = 12 Nov0 7
0
5
N = 20 Feb 08
0
5
10
0 50 100 150 200 250 300
0
N = 48 Jan 08
5
10
15
Gwydir
N = 115 Oct 06
0
50
Dec 06N = 1490
50
N = 75 Feb 070
50
N = 252 Mar 07
0
50
100
N = 115 May 070
50
N = 103 Nov 070
50
N = 1971 Feb 08
0
50
100
150
200
250
300
350
400
0 50 100 150 200 250 300
N = 514 Jan 08
0
50
100
150
200
Fig 7.16. Length-frequency distribution of bony bream (Nematolosa erebi) among the three Lower Gwydir study watercourses, October 2006 to February 2008. The vertical line indicates the approximate length at maturity. Gwydir River. Interestingly, the February 2007 Mehi River recruitment did not appear to result in any significant presence in this river in the second season.
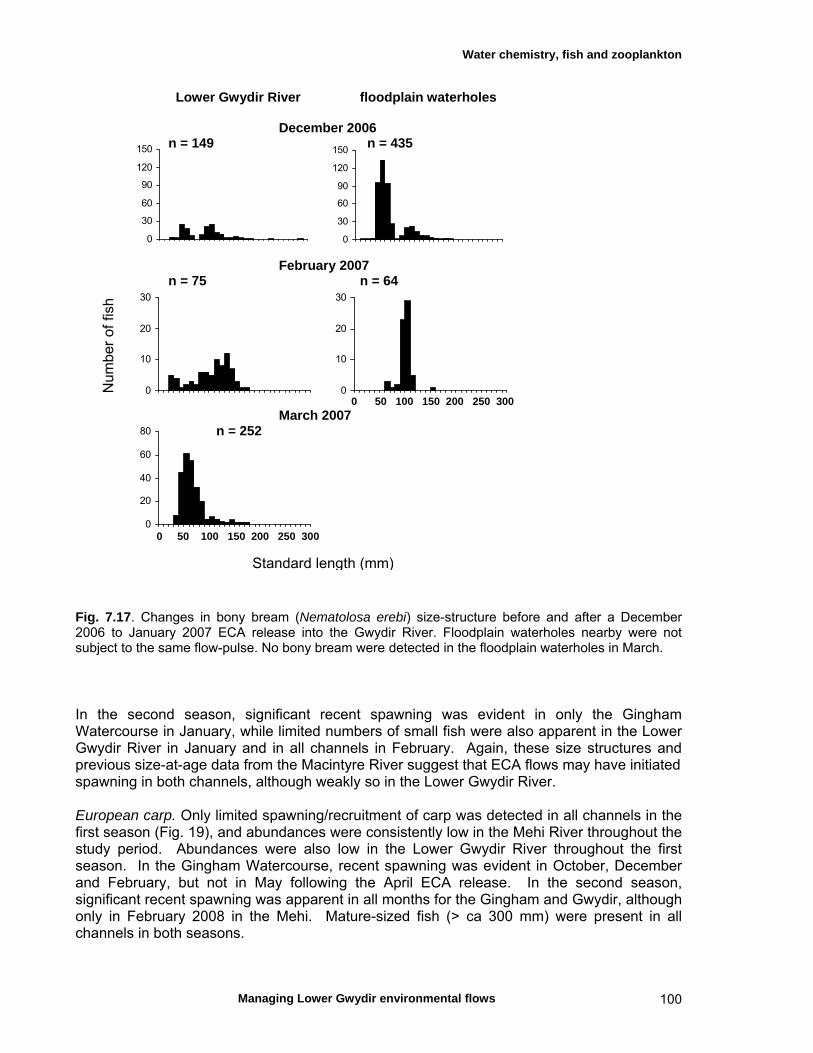
Water chemistry, fish and zooplankton
Managing Lower Gwydir environmental flows 100
0
30
60
90
120
150
0
30
60
90
120
150
0
10
20
30
0
10
20
30
0
20
40
60
80
Fig. 7.17. Changes in bony bream (Nematolosa erebi) size-structure before and after a December 2006 to January 2007 ECA release into the Gwydir River. Floodplain waterholes nearby were not subject to the same flow-pulse. No bony bream were detected in the floodplain waterholes in March. In the second season, significant recent spawning was evident in only the Gingham Watercourse in January, while limited numbers of small fish were also apparent in the Lower Gwydir River in January and in all channels in February. Again, these size structures and previous size-at-age data from the Macintyre River suggest that ECA flows may have initiated spawning in both channels, although weakly so in the Lower Gwydir River. European carp. Only limited spawning/recruitment of carp was detected in all channels in the first season (Fig. 19), and abundances were consistently low in the Mehi River throughout the study period. Abundances were also low in the Lower Gwydir River throughout the first season. In the Gingham Watercourse, recent spawning was evident in October, December and February, but not in May following the April ECA release. In the second season, significant recent spawning was apparent in all months for the Gingham and Gwydir, although only in February 2008 in the Mehi. Mature-sized fish (> ca 300 mm) were present in all channels in both seasons.
Lower Gwydir River floodplain waterholes
December 2006 n = 149 n = 435
February 2007 n = 75 n = 64
0 50 100 150 200 250 300
March 2007 n = 252
Num
ber
of fi
sh
0 50 100 150 200 250 300
Standard length (mm)
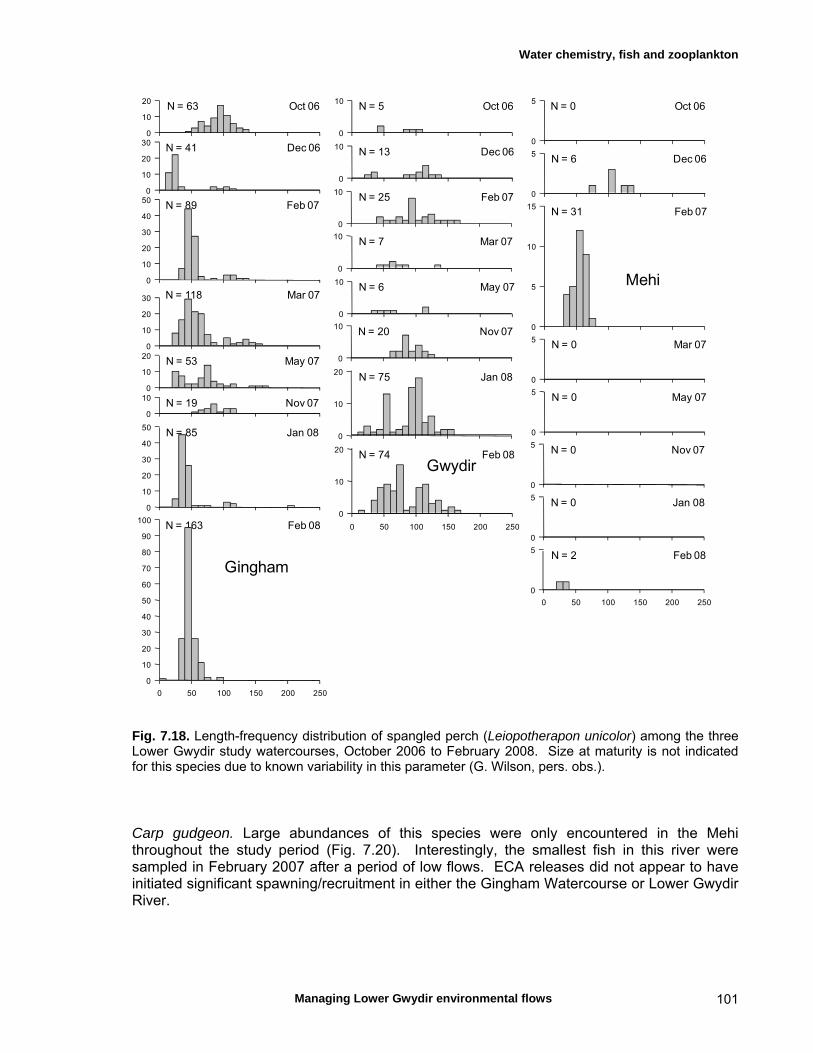
Water chemistry, fish and zooplankton
Managing Lower Gwydir environmental flows 101
N = 63 Oct 06
0
10
20
Dec 06N = 41
0
10
20
30
N = 89 Feb 07
0
10
20
30
40
50
N = 118 Mar 07
0
10
20
30
N = 53 May 07
0
10
20
N = 19 Nov 070
10
N = 163 Feb 08
0
10
20
30
40
50
60
70
80
90
100
0 50 100 150 200 250
N = 85 Jan 08
0
10
20
30
40
50
Gingham
N = 5 Oct 06
0
10
Dec 06N = 13
0
10
N = 25 Feb 07
0
10
N = 7 Mar 07
0
10
N = 6 May 07
0
10
N = 20 Nov 07
0
10
N = 75 Jan 08
0
10
20
N = 74 Feb 08
0 50 100 150 200 250
0
10
20
Gwydir
N = 0 Oct 06
0
5
N = 0 Mar 07
0
5
N = 0 May 07
0
5
N = 0 Nov 07
0
5
N = 0 Jan 08
0
5
Dec 06N = 6
0
5
N = 31 Feb 07
0
5
10
15
N = 2 Feb 08
0 50 100 150 200 250
0
5
Mehi
Fig. 7.18. Length-frequency distribution of spangled perch (Leiopotherapon unicolor) among the three Lower Gwydir study watercourses, October 2006 to February 2008. Size at maturity is not indicated for this species due to known variability in this parameter (G. Wilson, pers. obs.). Carp gudgeon. Large abundances of this species were only encountered in the Mehi throughout the study period (Fig. 7.20). Interestingly, the smallest fish in this river were sampled in February 2007 after a period of low flows. ECA releases did not appear to have initiated significant spawning/recruitment in either the Gingham Watercourse or Lower Gwydir River.
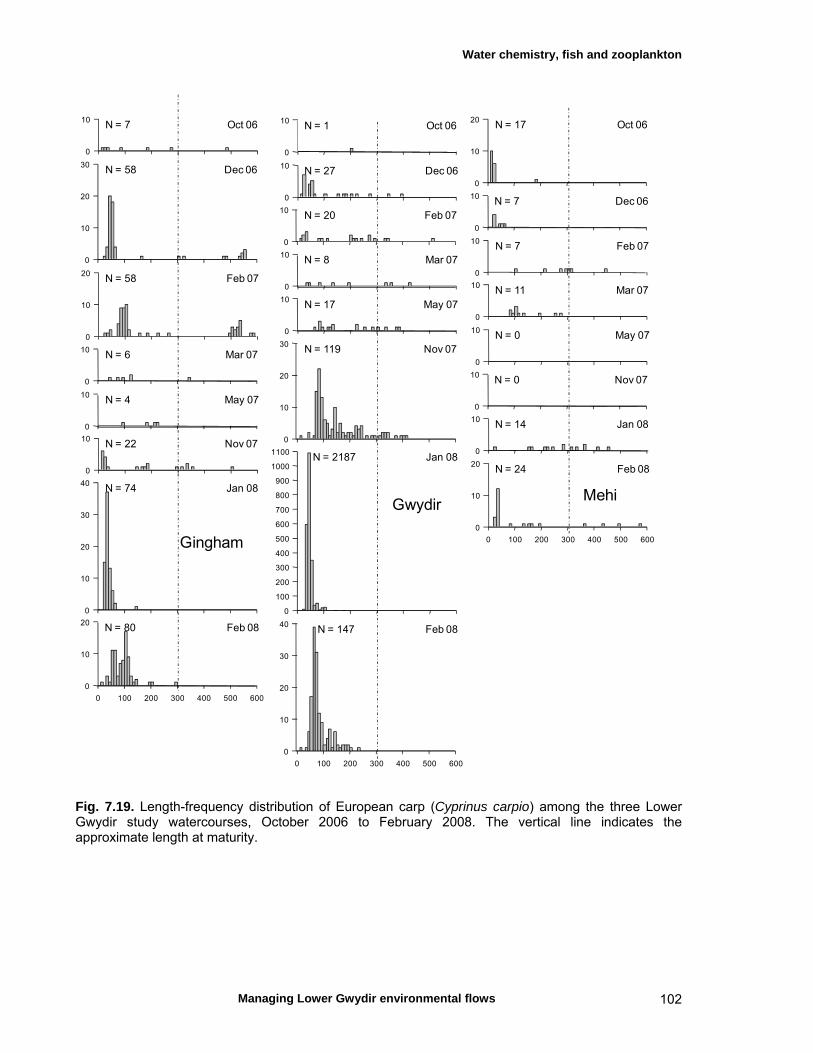
Water chemistry, fish and zooplankton
Managing Lower Gwydir environmental flows 102
N = 7 Oct 06
0
10
Dec 06N = 58
0
10
20
30
N = 58 Feb 07
0
10
20
N = 6 Mar 07
0
10
N = 4 May 07
0
10
N = 22 Nov 07
0
10
N = 74 Jan 08
0
10
20
30
40
N = 80 Feb 08
0 100 200 300 400 500 600
0
10
20
Gingham
N = 1 Oct 06
0
10
Dec 06N = 27
0
10
N = 20 Feb 07
0
10
N = 8 Mar 07
0
10
N = 17 May 07
0
10
N = 119 Nov 07
0
10
20
30
N = 2187 Jan 08
0
100
200
300
400
500
600
700
800
900
1000
1100
N = 147 Feb 08
0 100 200 300 400 500 600
0
10
20
30
40
Gwydir
N = 17 Oct 06
0
10
20
Dec 06N = 7
0
10
N = 7 Feb 07
0
10
N = 11 Mar 07
0
10
N = 0 May 07
0
10
N = 0 Nov 07
0
10
N = 14 Jan 08
0
10
N = 24 Feb 08
0 100 200 300 400 500 600
0
10
20
Mehi
Fig. 7.19. Length-frequency distribution of European carp (Cyprinus carpio) among the three Lower Gwydir study watercourses, October 2006 to February 2008. The vertical line indicates the approximate length at maturity.
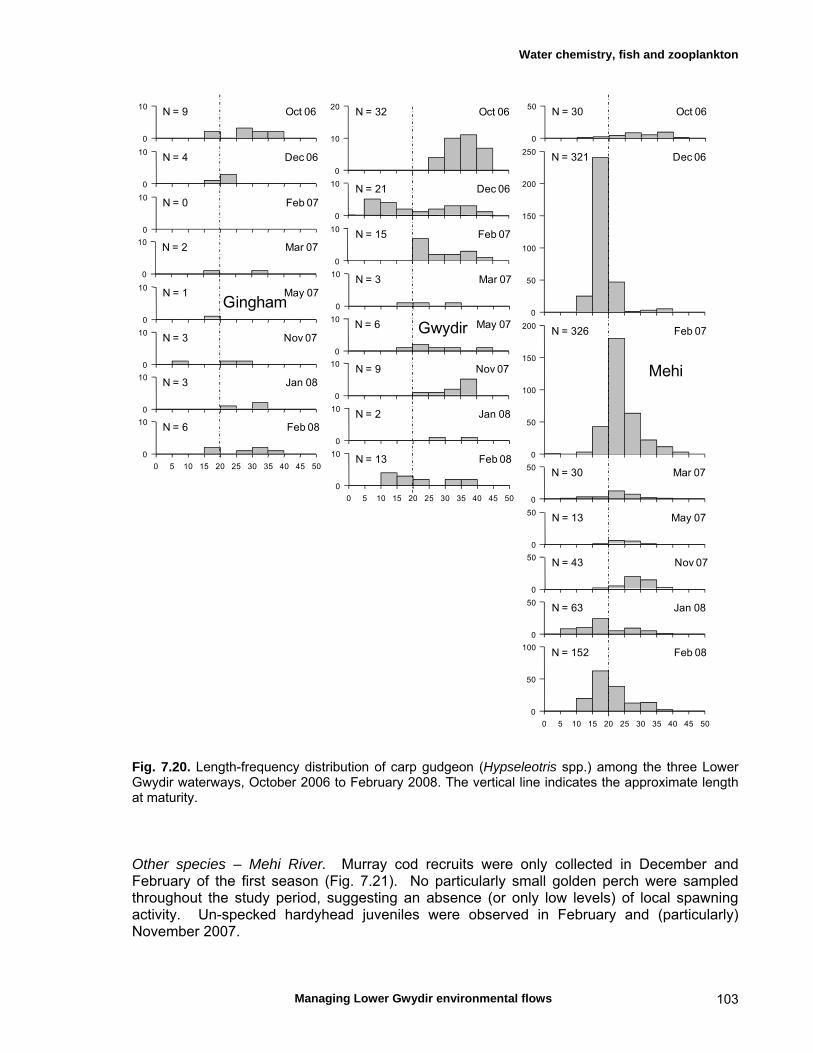
Water chemistry, fish and zooplankton
Managing Lower Gwydir environmental flows 103
N = 30 Oct 06
0
50
Dec 06N = 321
0
50
100
150
200
250
N = 326 Feb 07
0
50
100
150
200
N = 30 Mar 07
0
50
N = 13 May 07
0
50
N = 43 Nov 07
0
50
N = 63 Jan 08
0
50
N = 152 Feb 08
0 5 10 15 20 25 30 35 40 45 50
0
50
100
Mehi
N = 32 Oct 06
0
10
20
Dec 06N = 21
0
10
N = 15 Feb 07
0
10
N = 3 Mar 07
0
10
N = 6 May 07
0
10
N = 9 Nov 07
0
10
N = 2 Jan 08
0
10
N = 13 Feb 08
0 5 10 15 20 25 30 35 40 45 50
0
10
Gwydir
N = 9 Oct 06
0
10
Dec 06N = 4
0
10
N = 0 Feb 07
0
10
N = 2 Mar 07
0
10
N = 1 May 07
0
10
N = 3 Nov 07
0
10
N = 3 Jan 08
0
10
N = 6 Feb 08
0 5 10 15 20 25 30 35 40 45 50
0
10
Gingham
Fig. 7.20. Length-frequency distribution of carp gudgeon (Hypseleotris spp.) among the three Lower Gwydir waterways, October 2006 to February 2008. The vertical line indicates the approximate length at maturity. Other species – Mehi River. Murray cod recruits were only collected in December and February of the first season (Fig. 7.21). No particularly small golden perch were sampled throughout the study period, suggesting an absence (or only low levels) of local spawning activity. Un-specked hardyhead juveniles were observed in February and (particularly) November 2007.
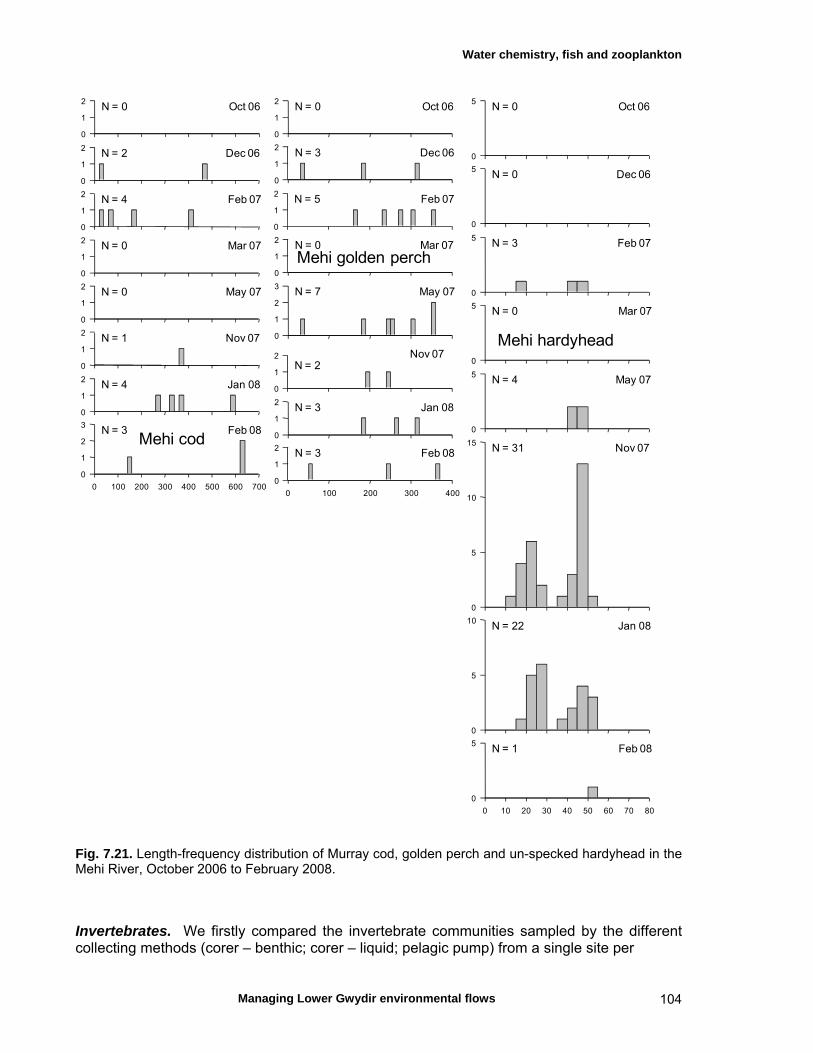
Water chemistry, fish and zooplankton
Managing Lower Gwydir environmental flows 104
N = 0 Oct 06
0
1
2
N = 0 Mar 07
0
1
2
N = 0 May 07
0
1
2
Dec 06N = 2
0
1
2
N = 4 Feb 07
0
1
2
N = 1 Nov 07
0
1
2
N = 4 Jan 08
0
1
2
N = 3 Feb 08
0 100 200 300 400 500 600 700
0
1
2
3
Mehi cod
N = 0 Oct 06
0
1
2
N = 0 Mar 07
0
1
2
Dec 06N = 3
0
1
2
N = 5 Feb 07
0
1
2
N = 7 May 07
0
1
2
3
N = 2Nov 07
0
1
2
N = 3 Jan 08
0
1
2
N = 3 Feb 08
0 100 200 300 400
0
1
2
Mehi golden perch
N = 0 Oct 06
0
5
N = 0 Mar 07
0
5
N = 0 Dec 06
0
5
N = 3 Feb 07
0
5
N = 4 May 07
0
5
N = 31 Nov 07
0
5
10
15
N = 22 Jan 08
0
5
10
N = 1 Feb 08
0 10 20 30 40 50 60 70 80
0
5
Mehi hardyhead
Fig. 7.21. Length-frequency distribution of Murray cod, golden perch and un-specked hardyhead in the Mehi River, October 2006 to February 2008. Invertebrates. We firstly compared the invertebrate communities sampled by the different collecting methods (corer – benthic; corer – liquid; pelagic pump) from a single site per

Water chemistry, fish and zooplankton
Managing Lower Gwydir environmental flows 105
pelagic
liquid
benthic
Mehi
Gwydir
Gingham
Mehi
Gwydir
Gingham
Mehi
GwydirGingham
2D Stress: 0.08
Fig. 7.22. Ordination (MDS) of the sampled invertebrate community (averaged over samples) from one site of each river in October 2006. Sediment core samples yield the benthic (sediment) sample itself and the decanted liquid. Pump samples yield the pelagic invertebrate community.
MehiGwydirGingham
MehiGwydirGingham
MehiGwydirGingham
2D Stress: 0.15 pelagic
liquid
benthic
pelagic
liquid benthic
Fig. 7.23. Ordination of the invertebrate community of individual samples collected in October 2006 in one site from each of the three Lower Gwydir study watercourses. watercourse from the first sampling trip (October 2006). The invertebrate communities of these sample fractions differed considerably (Fig.7.22), and variability between methods was higher than that between the three watercourses. When the invertebrate abundance data were analysed through ordination, the similarity between individual samples became clearer (Fig. 7.23). Again, the highest degree of
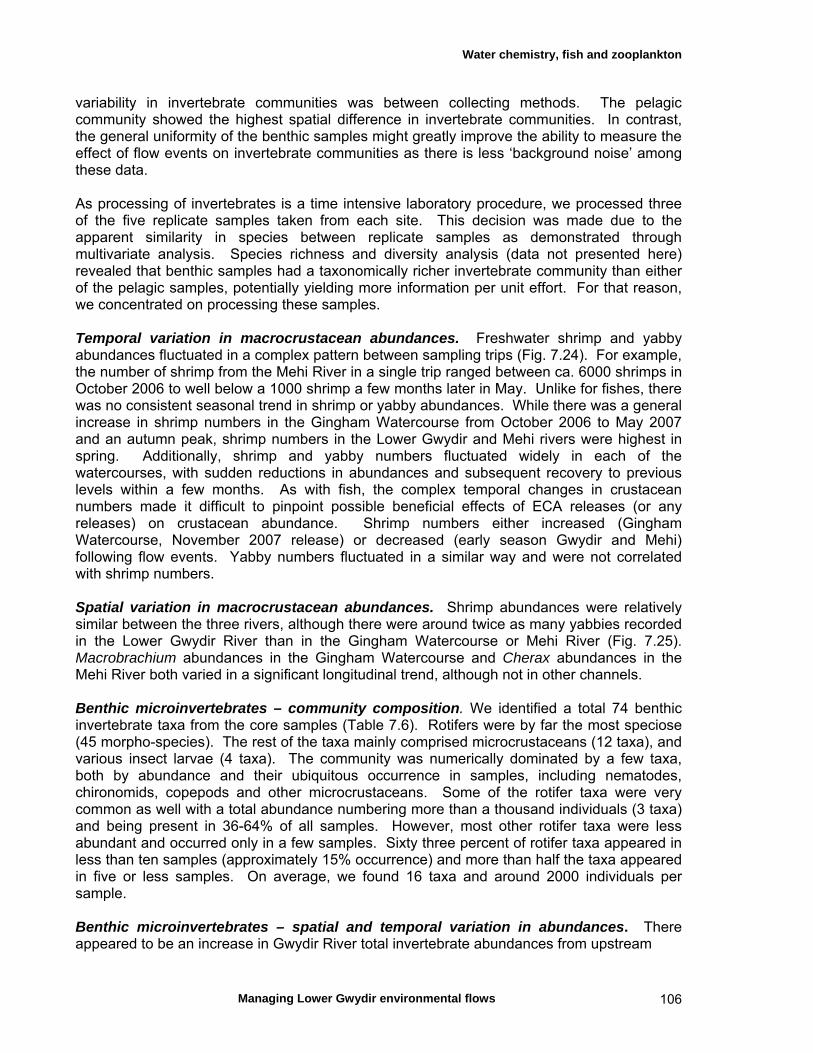
Water chemistry, fish and zooplankton
Managing Lower Gwydir environmental flows 106
variability in invertebrate communities was between collecting methods. The pelagic community showed the highest spatial difference in invertebrate communities. In contrast, the general uniformity of the benthic samples might greatly improve the ability to measure the effect of flow events on invertebrate communities as there is less ‘background noise’ among these data. As processing of invertebrates is a time intensive laboratory procedure, we processed three of the five replicate samples taken from each site. This decision was made due to the apparent similarity in species between replicate samples as demonstrated through multivariate analysis. Species richness and diversity analysis (data not presented here) revealed that benthic samples had a taxonomically richer invertebrate community than either of the pelagic samples, potentially yielding more information per unit effort. For that reason, we concentrated on processing these samples. Temporal variation in macrocrustacean abundances. Freshwater shrimp and yabby abundances fluctuated in a complex pattern between sampling trips (Fig. 7.24). For example, the number of shrimp from the Mehi River in a single trip ranged between ca. 6000 shrimps in October 2006 to well below a 1000 shrimp a few months later in May. Unlike for fishes, there was no consistent seasonal trend in shrimp or yabby abundances. While there was a general increase in shrimp numbers in the Gingham Watercourse from October 2006 to May 2007 and an autumn peak, shrimp numbers in the Lower Gwydir and Mehi rivers were highest in spring. Additionally, shrimp and yabby numbers fluctuated widely in each of the watercourses, with sudden reductions in abundances and subsequent recovery to previous levels within a few months. As with fish, the complex temporal changes in crustacean numbers made it difficult to pinpoint possible beneficial effects of ECA releases (or any releases) on crustacean abundance. Shrimp numbers either increased (Gingham Watercourse, November 2007 release) or decreased (early season Gwydir and Mehi) following flow events. Yabby numbers fluctuated in a similar way and were not correlated with shrimp numbers. Spatial variation in macrocrustacean abundances. Shrimp abundances were relatively similar between the three rivers, although there were around twice as many yabbies recorded in the Lower Gwydir River than in the Gingham Watercourse or Mehi River (Fig. 7.25). Macrobrachium abundances in the Gingham Watercourse and Cherax abundances in the Mehi River both varied in a significant longitudinal trend, although not in other channels. Benthic microinvertebrates – community composition. We identified a total 74 benthic invertebrate taxa from the core samples (Table 7.6). Rotifers were by far the most speciose (45 morpho-species). The rest of the taxa mainly comprised microcrustaceans (12 taxa), and various insect larvae (4 taxa). The community was numerically dominated by a few taxa, both by abundance and their ubiquitous occurrence in samples, including nematodes, chironomids, copepods and other microcrustaceans. Some of the rotifer taxa were very common as well with a total abundance numbering more than a thousand individuals (3 taxa) and being present in 36-64% of all samples. However, most other rotifer taxa were less abundant and occurred only in a few samples. Sixty three percent of rotifer taxa appeared in less than ten samples (approximately 15% occurrence) and more than half the taxa appeared in five or less samples. On average, we found 16 taxa and around 2000 individuals per sample. Benthic microinvertebrates – spatial and temporal variation in abundances. There appeared to be an increase in Gwydir River total invertebrate abundances from upstream

Water chemistry, fish and zooplankton
Managing Lower Gwydir environmental flows 107
Fig. 7.24. Mean (A) freshwater shrimp (Macrobrachium sp.) and (B) yabby (Cherax destructor) abundance within the three study watercourses, October 2006 to February 2009. The discharge hydrograph is shown for each watercourse, with ECA releases indicated by red arrows.
0
1000
2000
3000
4000
5000
6000
0
10
20
30
40
50
0
1000
2000
3000
4000
5000
6000
0
1000
2000
3000
0
20
40
60
80
100
120
0
10
20
30
40
0
1000
2000
3000
4000
5000
0
500
1000
1500
2000
2500
0
1000
2000
3000
4000
5000
A
B
S N J M M J S N J M M J S N J M S N J M M J S N J M M J S N J M S N J M M J S N J M M J S N J M 2006 2007 2008 2009 2006 2007 2008 2009 2006 2007 2008 2009
Mea
n d
isch
arg
e (M
L.d
-1)
Mea
n a
bu
nd
ance
± S
D
Teralba Brageen Crossing DS Combadello Weir
Gingham Gwydir Mehi

Water chemistry, fish and zooplankton
Managing Lower Gwydir environmental flows 108
Figure 7.25. Spatial variability in freshwater shrimp (left, Macrobrachium sp.) and yabby (right, Cherax destructor) abundance within each of the three study watercourses, from the upstream to the downstream site, October 2006 to February 2009. (Brageen Crossing) to downstream (“Birrah”) (Fig. 7.26). The distribution of most of the more abundant invertebrate groups (nematodes, rotifers and micro crustaceans) also showed a similar pattern, with the exception of chironomids which did not differ between sites. In contrast, species richness did not vary significantly over the same gradient. Differences in substrate structure might explain these patterns. The substrate at Brageen Crossing is dominated by coarse sand and sedimentary rock, while “Allambie” has a mixture of sand and clay substrates and “Birrah” has a finer sand-silt mixture. Temporal variation in microinvertebrate abundances was high. When averaged across the three Lower Gwydir River sites, abundances appeared unrelated to prior discharge conditions at the scale of our sampling (Fig. 7.27), with low abundances occurring in both periods of high and low discharge. However, when sites were examined separately, temporal fluctuations
0
10
20
30
0
20
40
60
80
0
10
20
30
40
0
1000
2000
3000
0
500
1000
1500
2000
0
500
1000
1500 Gingham Gwydir Mehi
Mea
n (
±SE
) n
um
ber
of
shri
mp
s p
er m
on
th
Mea
n (
±SE
) n
um
ber
of
yab
bie
s p
er m
on
th
Up Mid Down Up Mid Down
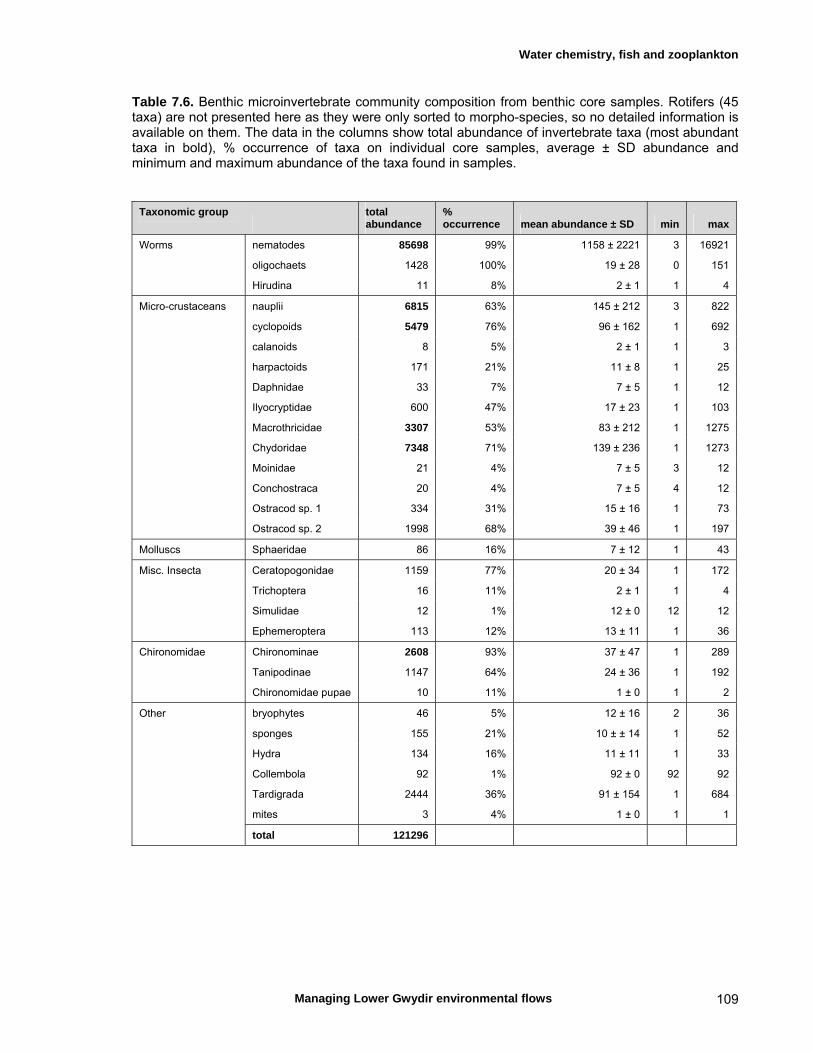
Water chemistry, fish and zooplankton
Managing Lower Gwydir environmental flows 109
Table 7.6. Benthic microinvertebrate community composition from benthic core samples. Rotifers (45 taxa) are not presented here as they were only sorted to morpho-species, so no detailed information is available on them. The data in the columns show total abundance of invertebrate taxa (most abundant taxa in bold), % occurrence of taxa on individual core samples, average ± SD abundance and minimum and maximum abundance of the taxa found in samples.
Taxonomic group
total abundance
% occurrence mean abundance ± SD min max
Worms nematodes 85698 99% 1158 ± 2221 3 16921
oligochaets 1428 100% 19 ± 28 0 151
Hirudina 11 8% 2 ± 1 1 4
Micro-crustaceans nauplii 6815 63% 145 ± 212 3 822
cyclopoids 5479 76% 96 ± 162 1 692
calanoids 8 5% 2 ± 1 1 3
harpactoids 171 21% 11 ± 8 1 25
Daphnidae 33 7% 7 ± 5 1 12
Ilyocryptidae 600 47% 17 ± 23 1 103
Macrothricidae 3307 53% 83 ± 212 1 1275
Chydoridae 7348 71% 139 ± 236 1 1273
Moinidae 21 4% 7 ± 5 3 12
Conchostraca 20 4% 7 ± 5 4 12
Ostracod sp. 1 334 31% 15 ± 16 1 73
Ostracod sp. 2 1998 68% 39 ± 46 1 197
Molluscs Sphaeridae 86 16% 7 ± 12 1 43
Misc. Insecta Ceratopogonidae 1159 77% 20 ± 34 1 172
Trichoptera 16 11% 2 ± 1 1 4
Simulidae 12 1% 12 ± 0 12 12
Ephemeroptera 113 12% 13 ± 11 1 36
Chironomidae Chironominae 2608 93% 37 ± 47 1 289
Tanipodinae 1147 64% 24 ± 36 1 192
Chironomidae pupae 10 11% 1 ± 0 1 2
Other bryophytes 46 5% 12 ± 16 2 36
sponges 155 21% 10 ± ± 14 1 52
Hydra 134 16% 11 ± 11 1 33
Collembola 92 1% 92 ± 0 92 92
Tardigrada 2444 36% 91 ± 154 1 684
mites 3 4% 1 ± 0 1 1
total 121296
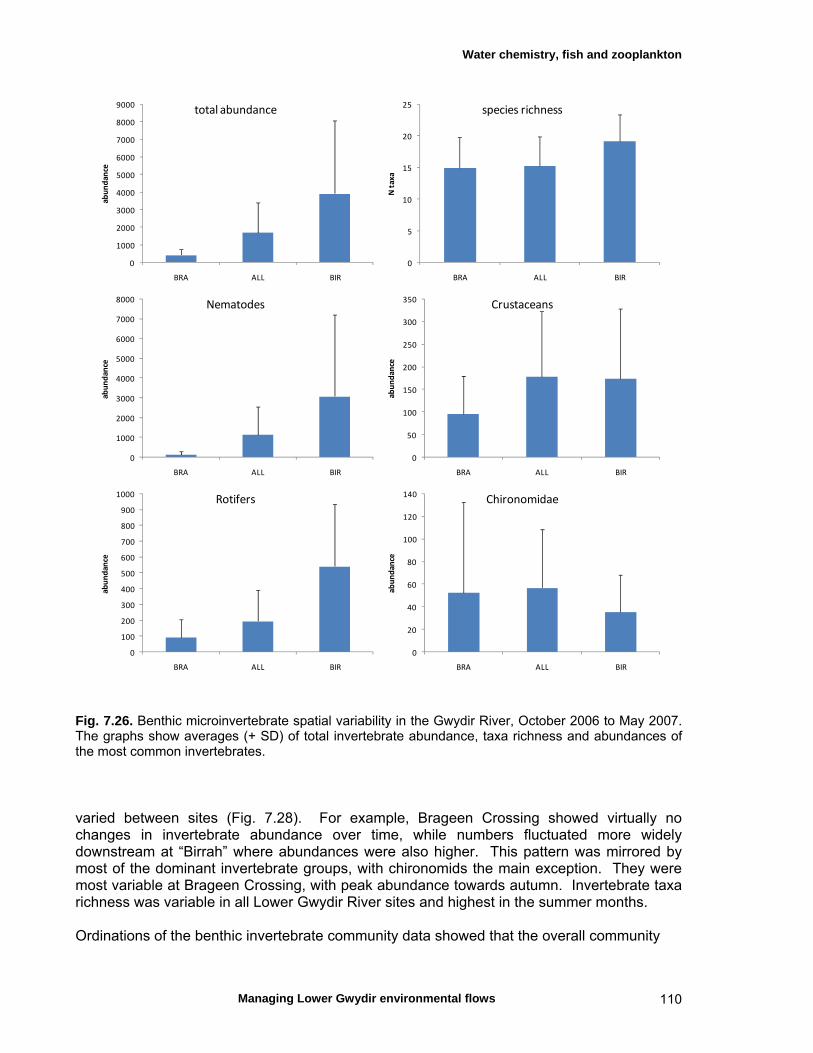
Water chemistry, fish and zooplankton
Managing Lower Gwydir environmental flows 110
0
1000
2000
3000
4000
5000
6000
7000
8000
9000
BRA ALL BIR
abundance
total abundance
0
5
10
15
20
25
BRA ALL BIR
N taxa
species richness
0
1000
2000
3000
4000
5000
6000
7000
8000
BRA ALL BIR
abundance
Nematodes
0
50
100
150
200
250
300
350
BRA ALL BIR
abundance
Crustaceans
0
100
200
300
400
500
600
700
800
900
1000
BRA ALL BIR
abundance
Rotifers
0
20
40
60
80
100
120
140
BRA ALL BIR
abundance
Chironomidae
Fig. 7.26. Benthic microinvertebrate spatial variability in the Gwydir River, October 2006 to May 2007. The graphs show averages (+ SD) of total invertebrate abundance, taxa richness and abundances of the most common invertebrates. varied between sites (Fig. 7.28). For example, Brageen Crossing showed virtually no changes in invertebrate abundance over time, while numbers fluctuated more widely downstream at “Birrah” where abundances were also higher. This pattern was mirrored by most of the dominant invertebrate groups, with chironomids the main exception. They were most variable at Brageen Crossing, with peak abundance towards autumn. Invertebrate taxa richness was variable in all Lower Gwydir River sites and highest in the summer months. Ordinations of the benthic invertebrate community data showed that the overall community
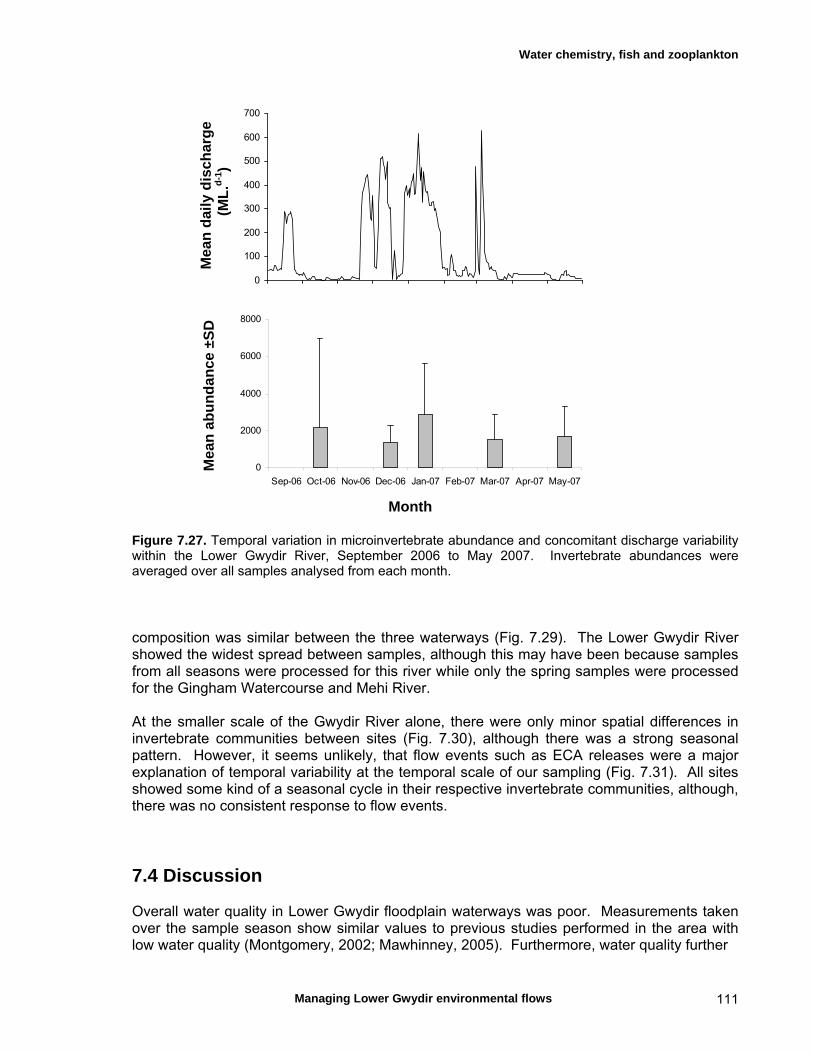
Water chemistry, fish and zooplankton
Managing Lower Gwydir environmental flows 111
0
100
200
300
400
500
600
700
0
2000
4000
6000
8000
Sep-06 Oct-06 Nov-06 Dec-06 Jan-07 Feb-07 Mar-07 Apr-07 May-07
Figure 7.27. Temporal variation in microinvertebrate abundance and concomitant discharge variability within the Lower Gwydir River, September 2006 to May 2007. Invertebrate abundances were averaged over all samples analysed from each month. composition was similar between the three waterways (Fig. 7.29). The Lower Gwydir River showed the widest spread between samples, although this may have been because samples from all seasons were processed for this river while only the spring samples were processed for the Gingham Watercourse and Mehi River. At the smaller scale of the Gwydir River alone, there were only minor spatial differences in invertebrate communities between sites (Fig. 7.30), although there was a strong seasonal pattern. However, it seems unlikely, that flow events such as ECA releases were a major explanation of temporal variability at the temporal scale of our sampling (Fig. 7.31). All sites showed some kind of a seasonal cycle in their respective invertebrate communities, although, there was no consistent response to flow events.
7.4 Discussion Overall water quality in Lower Gwydir floodplain waterways was poor. Measurements taken over the sample season show similar values to previous studies performed in the area with low water quality (Montgomery, 2002; Mawhinney, 2005). Furthermore, water quality further
Mea
n a
bu
nd
ance
±S
D
Mea
n d
aily
dis
char
ge
(ML
.d-1
)
Month
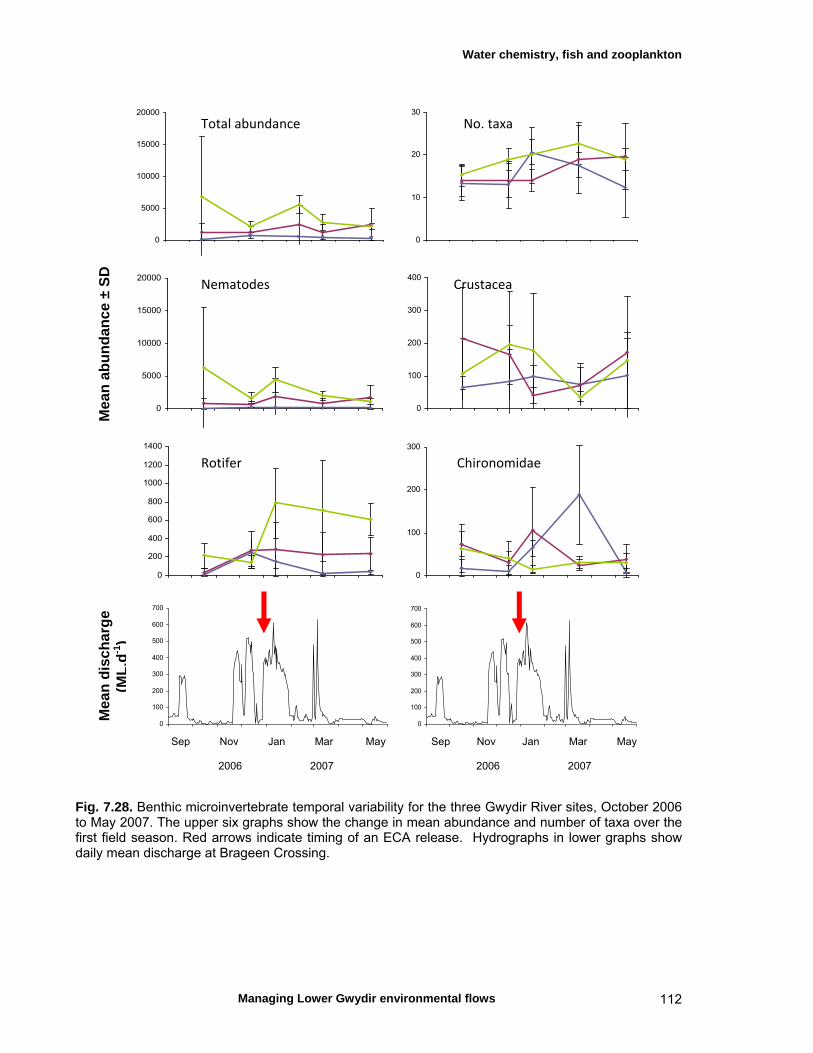
Water chemistry, fish and zooplankton
Managing Lower Gwydir environmental flows 112
0
5000
10000
15000
20000
0
10
20
30
0
5000
10000
15000
20000
0
100
200
300
400
0
200
400
600
800
1000
1200
1400
0
100
200
300
0
100
200
300
400
500
600
700
0
100
200
300
400
500
600
700
Fig. 7.28. Benthic microinvertebrate temporal variability for the three Gwydir River sites, October 2006 to May 2007. The upper six graphs show the change in mean abundance and number of taxa over the first field season. Red arrows indicate timing of an ECA release. Hydrographs in lower graphs show daily mean discharge at Brageen Crossing.
Sep Nov Jan Mar May Sep Nov Jan Mar May 2006 2007 2006 2007
Total abundance No. taxa Nematodes Crustacea Rotifer Chironomidae
Mea
n d
isch
arg
e
M
ean
ab
un
dan
ce ±
SD
(M
L.d
-1)
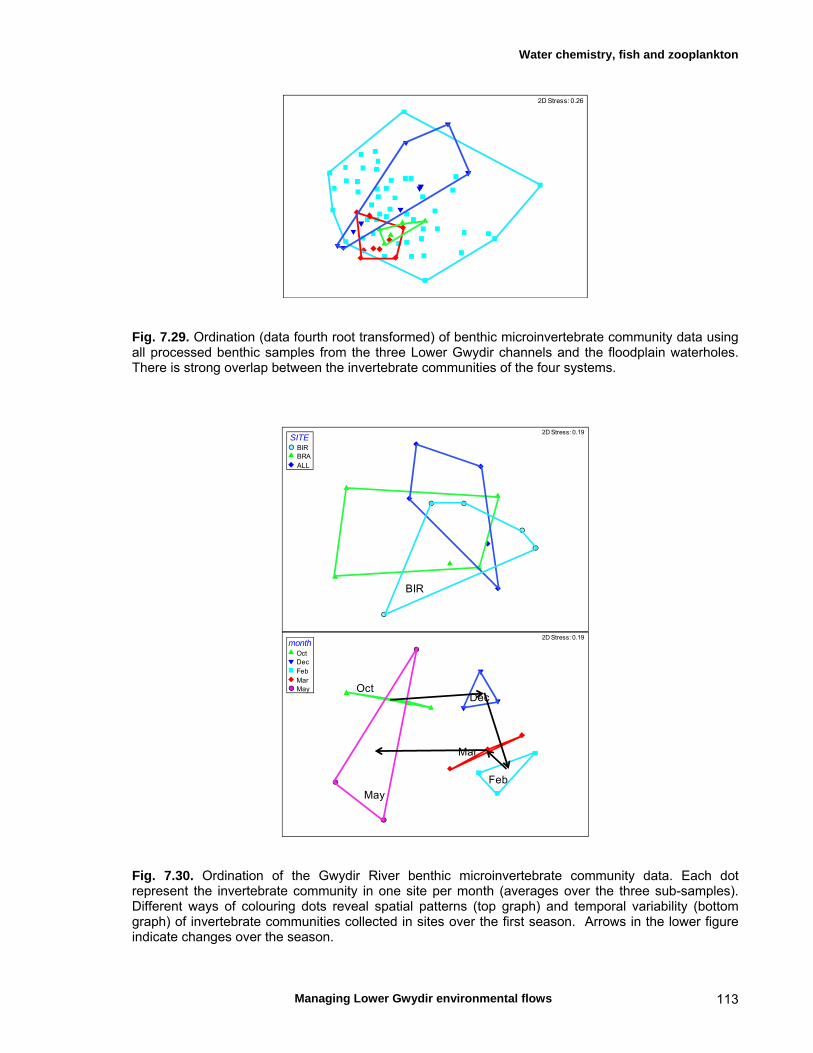
Water chemistry, fish and zooplankton
Managing Lower Gwydir environmental flows 113
2D Stress: 0.26
Fig. 7.29. Ordination (data fourth root transformed) of benthic microinvertebrate community data using all processed benthic samples from the three Lower Gwydir channels and the floodplain waterholes. There is strong overlap between the invertebrate communities of the four systems.
BIR
SITEBIRBRAALL
2D Stress: 0.19
DecOct
May
Feb
Mar
monthOctDecFebMarMay
2D Stress: 0.19
Fig. 7.30. Ordination of the Gwydir River benthic microinvertebrate community data. Each dot represent the invertebrate community in one site per month (averages over the three sub-samples). Different ways of colouring dots reveal spatial patterns (top graph) and temporal variability (bottom graph) of invertebrate communities collected in sites over the first season. Arrows in the lower figure indicate changes over the season.
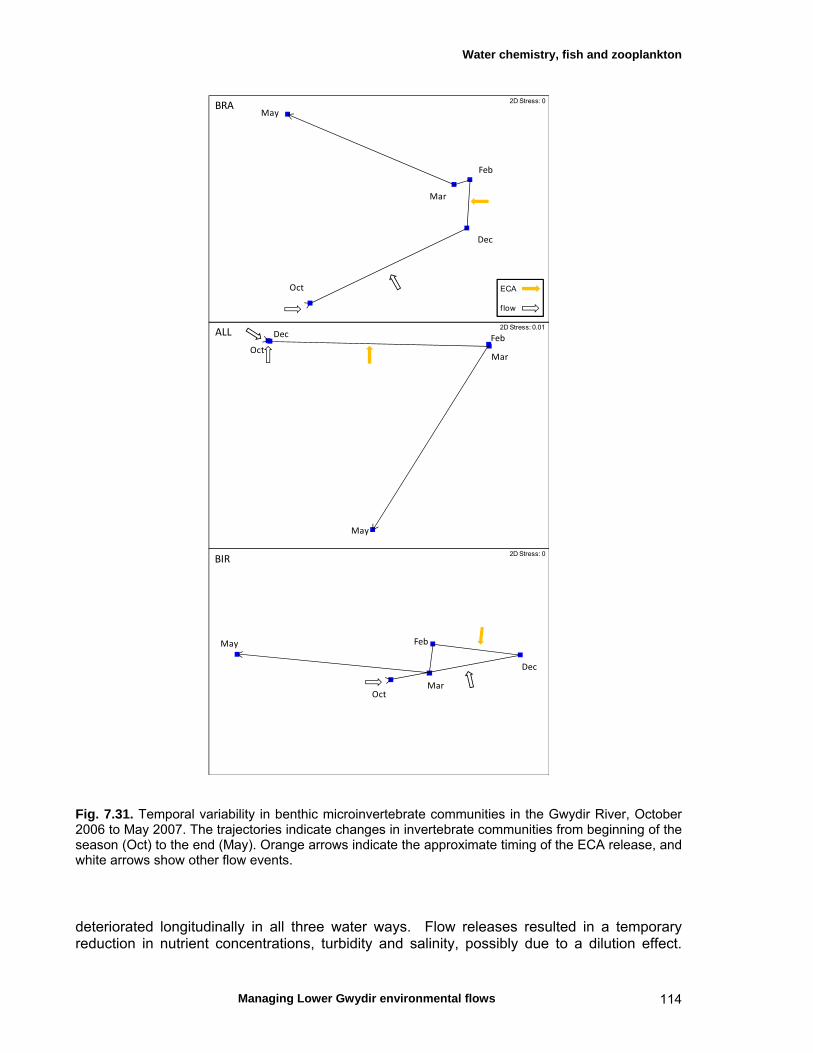
Water chemistry, fish and zooplankton
Managing Lower Gwydir environmental flows 114
ECA
flow
Oct
Dec
May
Feb
Mar
2D Stress: 0BRA
Dec
May
Feb
MarOct
ALL2D Stress: 0.01
Feb
Mar
Dec
May
Oct
BIR2D Stress: 0
Fig. 7.31. Temporal variability in benthic microinvertebrate communities in the Gwydir River, October 2006 to May 2007. The trajectories indicate changes in invertebrate communities from beginning of the season (Oct) to the end (May). Orange arrows indicate the approximate timing of the ECA release, and white arrows show other flow events. deteriorated longitudinally in all three water ways. Flow releases resulted in a temporary reduction in nutrient concentrations, turbidity and salinity, possibly due to a dilution effect.
Water chemistry, fish and zooplankton
Managing Lower Gwydir environmental flows 115
However, due to the proportionally higher discharge, total nutrient, sediment and salt loads still appeared to increase during flow events. The high sediment load has the potential to alter habitat in the floodplain (e.g. filling pool habitat) and high nutrient concentration could lead to algal blooms in the future. The lower Murray-Darling has frequent blooms of blue green algae (Shiel, 1982) and the nutrient levels there are very similar to values found by us in Lower Gwydir watercourses. The fish community sampled during this project was similar to that of previous surveys in the region. We found 12 fish taxa which is slightly higher than a recent estimate of nine species (Siebentritt, 1999). However, we did not catch silver perch, which were found in the system in previous studies, albeit in low numbers. The range of species detected in Lower Gwydir channels is typical for a lowland northern Murray-Darling catchment (Siebentritt, 1999; Lintermans, 2007). The fish communities were numerically dominated by a single native species in each of the study channels, with other species generally rare and infrequently encountered. Nevertheless, exotic fish species comprised around 25% of the total numerical catch. However, European carp was the dominant fish species in terms of biomass (~50%). The low abundance of some native fish species may indicate the patchy distribution of suitable habitat qualities in the study area, or that flow conditions have not been fully suitable to the maintenance or recruitment of their populations. Our use of a single sampling technique (fyke nets) may also have biased our samples away from several species, including Murray cod. Rarer native species appeared restricted to areas with better habitat conditions, including riparian cover and in-stream structure. In general, there was a trend of less native fish species at downstream sites, and a parallel increase in the abundance of exotic fishes. This may have been partially due to the reduction in flows at downstream sites and a decrease in water quality. It is possible that the habitat and water quality conditions primarily favour the recruitment of generalist and exotic species in this area. Overall, it appeared that the conditions for spawning or recruitment were more favourable for a range of species during the second season of sampling. Peaks in the abundance of bony bream, spangled perch and especially European carp were observed in the Lower Gwydir River and Gingham Watercourse, but not the Mehi River. The total discharge volume was higher in the Gingham in this season, but was more similar between seasons in the Lower Gwydir River. Nevertheless, it appeared that the wetter 2007 season included higher base-flows which might have benefited fish recruitment. In the Mehi, where there was a reduction in total and median discharge, recruitment was far lower than in the other waterways. This is further supported by the fact that there was good recruitment in carp gudgeon in the Mehi in the first season, when flows were high, but greatly reduced juvenile abundances in the second year when overall discharge was lower. Peaks in the abundance of new recruits during the second season were apparent in all months, both before and after the ECA release: November (bony bream, Gingham), January (European carp, Gwydir and Gingham; spangled perch, Gingham) and February (spangled perch, Gingham). In the first season, it is possible that bony bream were spawned during the Gingham ECA release, although similarly-sized fish were also present in May in the Gwydir and Mehi (no ECA release). Similarly, small spangled perch in the Gingham Watercourse in May appeared to have originated from the April ECA release, although a parallel response was less clear in the Gwydir following the late 2006 release in this channel. Nevertheless, size at age relationships will need to be generated for these species in the Lower Gwydir channels before accurate links between the appearance of juveniles and particular flow
Water chemistry, fish and zooplankton
Managing Lower Gwydir environmental flows 116
events can be established. This should be a priority for further work on fish-flow relationships in this system. The variable flow conditions within and among the study channels made it difficult to assess the impact of specific flow releases on fish communities. We observed an increase in the more abundant fish species (spangled perch, bony bream, carp gudgeon) in summer, coinciding with recent flow releases, although this pattern was not always consistent between watercourses. For example, spangled perch appeared to respond to the early 2007 ECA release in the Gingham Watercourse but not in the Lower Gwydir River. It was also difficult to separate possible seasonal effects from flow responses over a shorter study of this nature. Most of the other fish species were not in high enough abundance for us to detect any marked response at all, with European carp being the main exception. At the smaller scale of individual sites, fish communities overlapped between the rivers. However, fish communities varied along a longitudinal gradient, possibly reflecting changes in the availability and quality of downstream. Therefore, fish communities were organized according to differences in habitat (or its local modification of flow signals) on this smaller scale. The generalist species that can survive in degraded habitats (bony bream, spangled perch and European carp) were most common in downstream habitats, while the rarer native species were more common upstream. This further supported the idea that habitat requirements are a major factor in shaping fish communities. Contrary to fish, the benthic invertebrate community structure was similar between the three waterways. However, there was a gradient with increasing invertebrate abundance towards the downstream sites. Reasons for this possibly relate to parallel patterns in the sediment structure along the river. The uppermost site had coarser sediment than the silty-sandy sediment matrix downstream. There was a seasonal cycle visible, both in invertebrate community composition and abundance patterns although, at the temporal scale of our sampling, flow conditions seemed to have been of only of minor importance in shaping invertebrate communities in the Lower Gwydir River. This may have been partially explained by the absence of major flood events in this channel during the study interval, which are known to have a significant disturbance effect on riverine sediments and to flush individuals from the floodplain egg-bank into channels. Crustacean abundance varied considerably between seasons and river systems. For example, Macrobrachium abundances varied from very high abundance to a near absence over just a few months. There was no consistent seasonal response in abundances of shrimps and yabbies in the three rivers. Similar to fish, the response of crustaceans to flow releases was hard to pinpoint because of the inherent variability in the hydrographs and the complex distribution of crustaceans over the seasons and rivers. Furthermore, we did not detect any general pattern in crustacean distribution along a longitudinal gradient, suggesting that crustaceans may be less limited by habitat quality than fishes, and that other factors may be affecting their distribution.
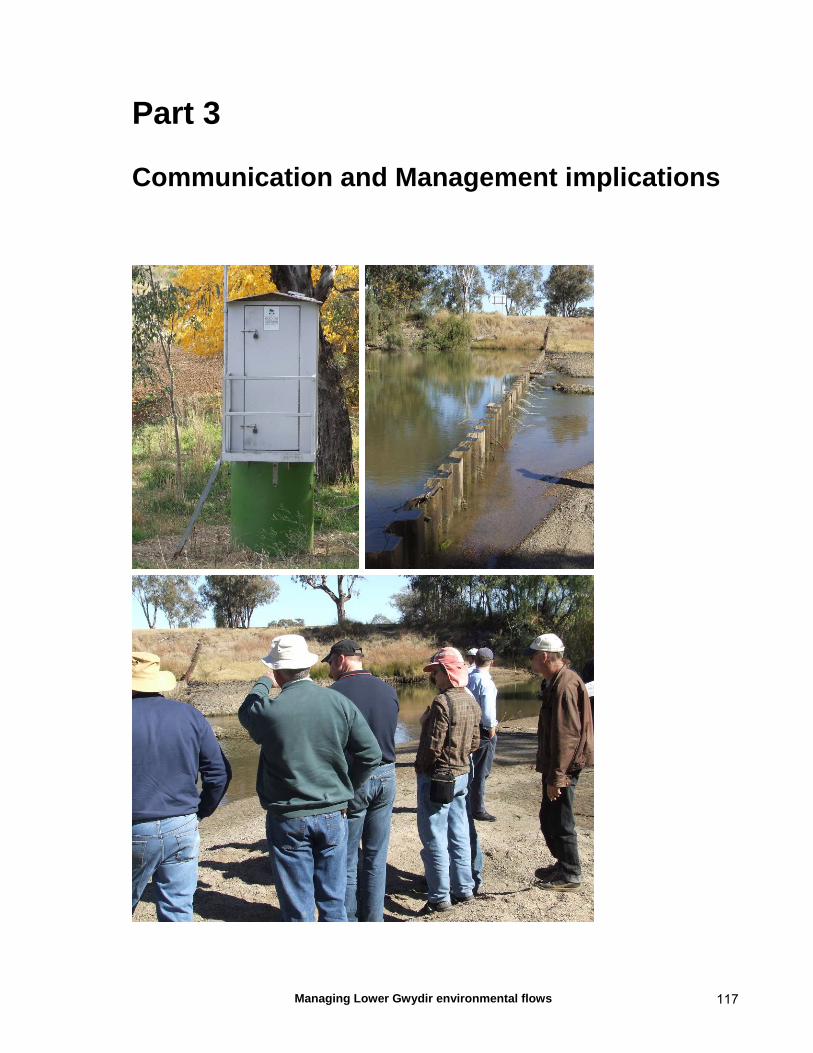
Managing Lower Gwydir environmental flows 117
Part 3 Communication and Management implications
Communication
Managing Lower Gwydir environmental flows 118
Chapter 8 Communication of project findings
8.1 Introduction Communication is a key step in gaining stakeholder trust for any management-focused ecological research project and maximising the acceptance of its recommendations. The condition and functioning of floodplain wetland ecosystems like the Lower Gwydir has a complex mix of stakeholders that incudes the general public, wetland landholders, management committee members, research colleagues and state and Commonwealth environment agencies. However, each stakeholder group will have a different level of ‘buy-in’ to the ecology of such ecosystems, ranging from the general public’s broad interest, to the business concerns of upstream irrigators and wetland landholders, and the legislated oversight of state and commonwealth managers. Scientific colleagues will also have an interest in the implications of methods and findings for their own parallel research. This diversity in local knowledge, ecological technical expertise, and concern means that any communication strategy needs to include a range of products and methods tailored to the specific audience(s). The project team in this study placed considerable emphasis on communicating its activities and findings to as broad a range of audiences as possible. This chapter summarises the communication activities completed by team members from early 2006 through to mid 2009. A complete listing of project presentations is given in Appendix 1, and details of outputs and, where relevant, their abstracts are given in Appendix 2.
8.2 Industry and community stakeholders
General public Australian Cotton Conference Cotton Catchment Communities Cooperative Research Centre Community Advisory Committee of the Murray-Darling Basin Authority’s Native Fish
Strategy Three project newsletters were produced (summer 2006/2007, winter/spring 2007, winter 2009) to highlight the project and recent findings to a range of stakeholders. These were distributed to state and Commonwealth agency staff, wetland landholders, and the general public. Newsletters were distributed to the general public through the Border Rivers – Gwydir Catchment Management Authority office and displays at the July 2008 community forum in Moree. Presentations were also given to community and agricultural industry audiences on a number of occasions. These included the Australian Cotton Conference on the Gold Coast (August
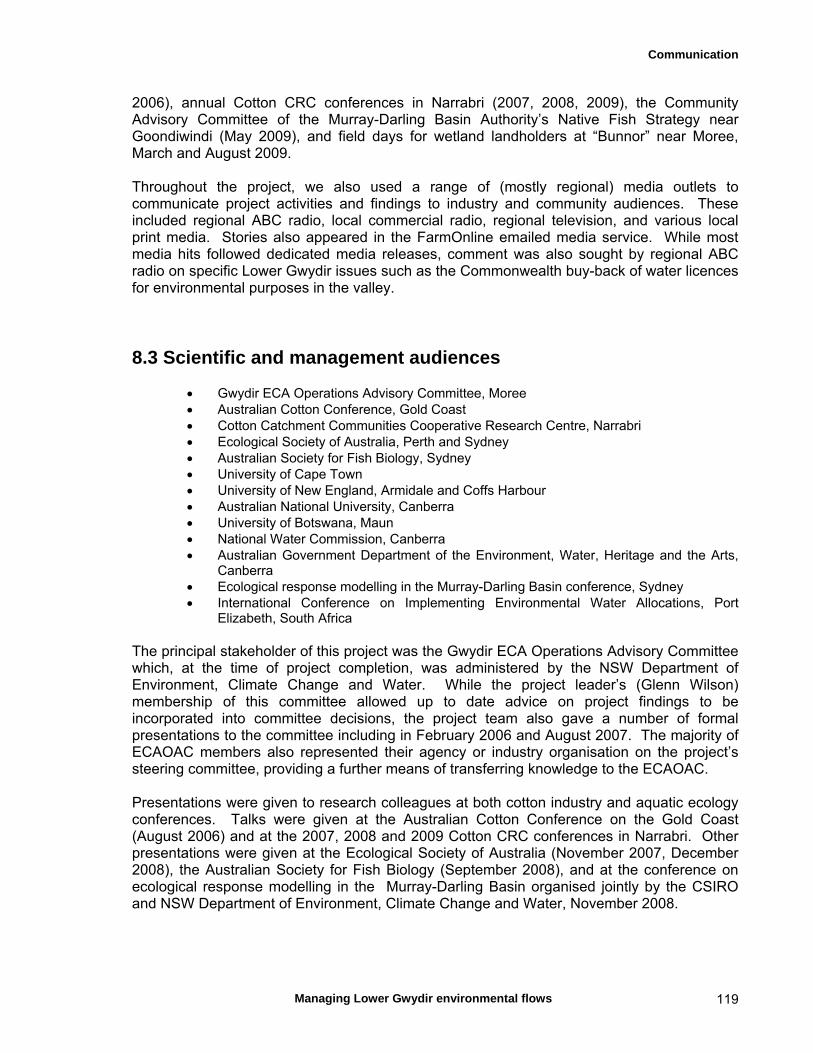
Communication
Managing Lower Gwydir environmental flows 119
2006), annual Cotton CRC conferences in Narrabri (2007, 2008, 2009), the Community Advisory Committee of the Murray-Darling Basin Authority’s Native Fish Strategy near Goondiwindi (May 2009), and field days for wetland landholders at “Bunnor” near Moree, March and August 2009. Throughout the project, we also used a range of (mostly regional) media outlets to communicate project activities and findings to industry and community audiences. These included regional ABC radio, local commercial radio, regional television, and various local print media. Stories also appeared in the FarmOnline emailed media service. While most media hits followed dedicated media releases, comment was also sought by regional ABC radio on specific Lower Gwydir issues such as the Commonwealth buy-back of water licences for environmental purposes in the valley.
8.3 Scientific and management audiences
Gwydir ECA Operations Advisory Committee, Moree Australian Cotton Conference, Gold Coast Cotton Catchment Communities Cooperative Research Centre, Narrabri Ecological Society of Australia, Perth and Sydney Australian Society for Fish Biology, Sydney University of Cape Town University of New England, Armidale and Coffs Harbour Australian National University, Canberra University of Botswana, Maun National Water Commission, Canberra Australian Government Department of the Environment, Water, Heritage and the Arts,
Canberra Ecological response modelling in the Murray-Darling Basin conference, Sydney International Conference on Implementing Environmental Water Allocations, Port
Elizabeth, South Africa The principal stakeholder of this project was the Gwydir ECA Operations Advisory Committee which, at the time of project completion, was administered by the NSW Department of Environment, Climate Change and Water. While the project leader’s (Glenn Wilson) membership of this committee allowed up to date advice on project findings to be incorporated into committee decisions, the project team also gave a number of formal presentations to the committee including in February 2006 and August 2007. The majority of ECAOAC members also represented their agency or industry organisation on the project’s steering committee, providing a further means of transferring knowledge to the ECAOAC. Presentations were given to research colleagues at both cotton industry and aquatic ecology conferences. Talks were given at the Australian Cotton Conference on the Gold Coast (August 2006) and at the 2007, 2008 and 2009 Cotton CRC conferences in Narrabri. Other presentations were given at the Ecological Society of Australia (November 2007, December 2008), the Australian Society for Fish Biology (September 2008), and at the conference on ecological response modelling in the Murray-Darling Basin organised jointly by the CSIRO and NSW Department of Environment, Climate Change and Water, November 2008.
Communication
Managing Lower Gwydir environmental flows 120
Presentations were also given to ecological and catchment management research groups at a number of universities. These included the University of Cape Town (Freshwater Research Unit, Cape Town, November 2006), University of New England (School of Environmental and Rural Science, Armidale, April 2007 and June 2008), the Australian National University (Integrated Catchment Assessment and Management Centre, Canberra, August 2008), and the University of Botswana (Harry Oppenheimer Okavango Research Centre, Maun, November 2008). Two talks were also given at an international conference on implementing environmental water allocation programs, held in Port Elizabeth South Africa in February 2009. Notably, these were some of only a few presentations during the 4-day event that highlighted the need for rigorous ecological data to underpin environmental flow decisions, and audience comment was made to that effect. Presentations were also made to key national management bodies. In June 2006, a brief presentation was made to staff at the National Water Commission on the design and rationale of the project at its outset, while a more extensive talk on project findings was given to the Water Group of the Australian Government Department of the Environment, Water, Heritage and the Arts in August 2008.
8.4 The Lower Gwydir: Surface Flows and the Ecology of Streams and Wetlands: A Forum to Inform the Local Community and Guide Management. Moree, NSW, July 2008
State and Commonwealth catchment managers Agricultural industry representatives Landholders General public, including the local indigenous community
In July 2008, a two-day community forum on the flow ecology of the Lower Gwydir wetlands was held in Moree. It was convened by the project team, and organised jointly with staff from the Border Rivers – Gwydir CMA and the NSW Department of Primary Industries. The forum’s objectives were to (1) provide an opportunity for researchers to extend their work to the Moree Community, (2) give the Moree Community the opportunity to hear about what research is taking place on the surface flow ecology of the mid to lower Gwydir, and (3) demonstrate how findings from the different research projects mesh together to guide management of the catchment’s rivers and wetlands. The forum attracted wide media attention in regional television, radio and newspapers. The first day of the forum comprised a series of invited presentations and discussions on recent research findings and management initiatives in the Lower Gwydir wetlands, while the second day was a bus tour of key wetland sites and included brief talks from landholders and researchers. Project team members were involved in five of the 13 presentations on day 1, as well as a number of the field talks on day 2. The forum attracted a diverse audience of approximately 80 participants, including interested members of the public (indigenous and non-indigenous), wetland landholders, CMAs, the Cotton CRC, agricultural industries, Moree Plains Shire Council, universities and state (Primary Industries; Environment and Climate Change; Water and Energy) and Australian Government natural resource management

Communication
Managing Lower Gwydir environmental flows 121
agencies (Department of the Environment, Water, Heritage and the Arts; Murray-Darling Basin Commission).

ECA management and monitoring
Managing Lower Gwydir environmental flows 122
Chapter 9 Environmental flow management and monitoring in the Lower Gwydir floodplain
Management recommendations
Expectations of what ecological responses might be achieved by a particular release need to be realistic. Any one release is unlikely to satisfy the hydrological requirements of all aquatic biota or ecosystem components.
It may be necessary to establish a more variable hydrograph for future ECA releases, in order to satisfy as many ecological objectives as possible.
‘Piggy-backing’ ECA flows on bulk stock and domestic or irrigation releases may be an effective strategy for facilitating multiple releases of differing stage height. However, the delivery point(s) for these flows and the channel reaches where the ecological outcomes are desired would need to match, and it will be necessary to establish whether there is significant loss of ecological response (e.g. larval fish) from abstraction of the associated consumptive flows.
Recognise that ecological responses to flow events will likely differ seasonally. Although significant flood events have occurred in winter in the Lower Gwydir floodplain, the region has a summer-dominant rainfall pattern and the timing of future ECA events should match this whenever possible.
ECA events should also maximise the duration of wetland inundation. The best means of achieving this in the Lower Gwydir appears to be through piggy-backing releases onto natural flow events.
Ensure that the Gwydir Environmental Management Plan and the Gwydir Wetlands Decision Support System software both incorporate the latest scientific findings on Lower Gwydir aquatic ecological responses to flow variability.
Include event-based monitoring of both in-stream and floodplain wetland environments in reporting ecological outcomes from Lower Gwydir ECA releases. Long-term data sets will be necessary to adequately determine the extent to which Lower Gwydir aquatic populations fluctuate in response to seasonal, hydrological and structural habitat factors. Prioritise the collection of data on water chemistry, fish populations, wetland vegetation and waterbirds.
Continue monitoring of the grazing exclosures. Ensure their future protection, and promote their benefits to relevant landholders.
Ensure that future monitoring be undertaken at a temporal scale relevant to the monitored parameters, and that it includes independent control/reference areas.
Maintain a close communication link between the ECAOAC and any research or agency staff directly involved in future monitoring and research activities.
Establish a central repository of long-term ecological data on the Lower Gwydir wetlands ecosystem.
Ensure that data and other scientific information are made available in a timely manner to inform management plans and adaptive management processes. These may include, for example, incorporation into decision support tools such as ecosystem response models, modification of spatial and temporal monitoring and data collection techniques, or improved management practices to support species such as fish and waterbirds.
Support future research on the response of wetland soils to inundation and their role in supporting wetland condition and function.
ECA management and monitoring
Managing Lower Gwydir environmental flows 123
Support future research on the population ecology of fish, particularly the effect of flow variability on early growth and body condition.
Establish the effects of in-stream barriers on Lower Gwydir fish assemblages.
Establish whether Lower Gwydir fish assemblages vary with structural habitat within and between channels.
9.1 Introduction The present study provides the first integrated assessment of aquatic ecological responses to flow variability in the Lower Gwydir wetlands ecosystem. This work particularly builds on earlier studies by Rob McCosker on the responses of wetland vegetation to floodplain inundation, and confirmed some of the initial interpretations of how flow structures the ecology of this floodplain. However, it also includes information on a suite of in-stream parameters including fish, microinvertebrates and water chemistry for which there has been little or no prior knowledge available on Lower Gwydir flow responses. While it focused on the before—after monitoring of individual environmental flow events, it also allowed an assessment of how discharge may influence variables such as fish assemblage structure in a more general manner. This chapter uses these outcomes to recommend how best to continue building the information base on responses to flow variability in this ecosystem.
9.2 Environmental flow design and management Aquatic ecological responses to ECA releases are likely to vary between the two seasonal periods in which such events are likely to occur (Table 9.1), and these differences should be considered when deciding on their timing. However, within any one season, release responses are also likely to vary between events of differing hydrological characteristics. ECA releases throughout the study period were of a limited and relatively stable stage height, designed to deliver the volume anticipated to be necessary to inundate the core wetland and to minimise losses onto the floodplain upstream of the target area(s). Minimising the upstream floodplain inundation may have limited the in-channel responses of some water chemistry parameters and faunal assemblages. If so, there are two key management implications that future ECA management should consider. Firstly, expectations of what ecological responses might be achieved by a particular release will need to be realistic. Any one release is unlikely to satisfy the hydrological requirements of all aquatic biota, particularly in cases like the 2006–2007 releases where the overriding objective was to retain as much water as possible in the channel upstream of the core wetland target. Similarly, there are also likely to be differences in the response time among ecological parameters and assemblages that need to be accounted for. For example, while we detected changes in nutrient availability within the Gingham Watercourse following the largely in-channel April 2007 ECA, shifts in parameters such as dissolved organic carbon and the various physico-chemical parameters were less evident at the temporal scale of our sampling. If the Lower Gwydir ECA program is to operate in an adaptive management framework, it will need to be borne in mind that past releases may have been designed for a narrow set of ecological objectives. Responses of other ecosystem components to previous
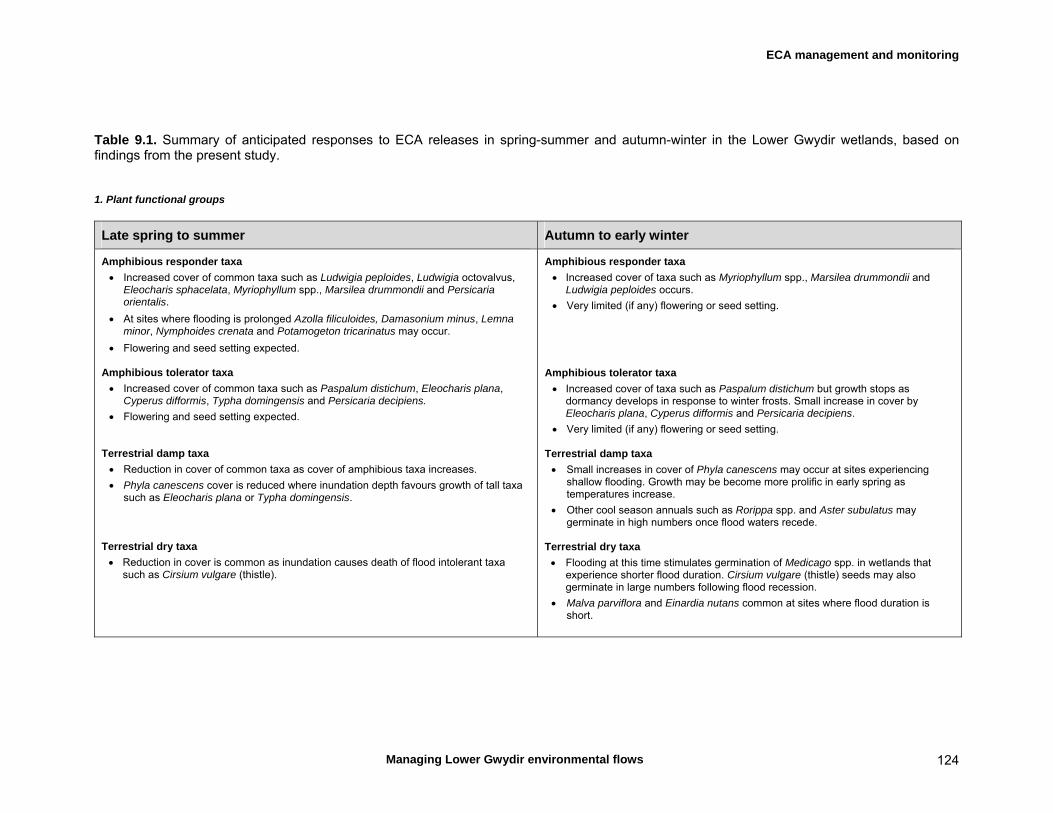
ECA management and monitoring
Managing Lower Gwydir environmental flows 124
Table 9.1. Summary of anticipated responses to ECA releases in spring-summer and autumn-winter in the Lower Gwydir wetlands, based on findings from the present study. 1. Plant functional groups
Late spring to summer Autumn to early winter
Amphibious responder taxa
Increased cover of common taxa such as Ludwigia peploides, Ludwigia octovalvus, Eleocharis sphacelata, Myriophyllum spp., Marsilea drummondii and Persicaria orientalis.
At sites where flooding is prolonged Azolla filiculoides, Damasonium minus, Lemna minor, Nymphoides crenata and Potamogeton tricarinatus may occur.
Flowering and seed setting expected. Amphibious tolerator taxa
Increased cover of common taxa such as Paspalum distichum, Eleocharis plana, Cyperus difformis, Typha domingensis and Persicaria decipiens.
Flowering and seed setting expected. Terrestrial damp taxa
Reduction in cover of common taxa as cover of amphibious taxa increases.
Phyla canescens cover is reduced where inundation depth favours growth of tall taxa such as Eleocharis plana or Typha domingensis.
Terrestrial dry taxa
Reduction in cover is common as inundation causes death of flood intolerant taxa such as Cirsium vulgare (thistle).
Amphibious responder taxa
Increased cover of taxa such as Myriophyllum spp., Marsilea drummondii and Ludwigia peploides occurs.
Very limited (if any) flowering or seed setting.
Amphibious tolerator taxa
Increased cover of taxa such as Paspalum distichum but growth stops as dormancy develops in response to winter frosts. Small increase in cover by Eleocharis plana, Cyperus difformis and Persicaria decipiens.
Very limited (if any) flowering or seed setting. Terrestrial damp taxa
Small increases in cover of Phyla canescens may occur at sites experiencing shallow flooding. Growth may be become more prolific in early spring as temperatures increase.
Other cool season annuals such as Rorippa spp. and Aster subulatus may germinate in high numbers once flood waters recede.
Terrestrial dry taxa
Flooding at this time stimulates germination of Medicago spp. in wetlands that experience shorter flood duration. Cirsium vulgare (thistle) seeds may also germinate in large numbers following flood recession.
Malva parviflora and Einardia nutans common at sites where flood duration is short.

ECA management and monitoring
Managing Lower Gwydir environmental flows 125
Table 9.1 continued. 2. Key native and alien plants
Late spring to summer Autumn to early winter
Extended vigorous growth of native wetland species; flow would coincide with peak growth period of key native wetland plants such as Paspalum distichum, Eleocharis sphacelata, Bolboschoenus fluviatilis and Typha domingensis.
Phyla canescens cover may decrease at sites where inundation is 15-20 cm or greater. Cover may increase along margins of wetted sites where inundation depth is shallow.
Germination of weed species such as water hyacinth (Eichhornia crassipes) may occur.
Alien grass species such as Echinochloa sp. may occur along margins of wetted sites.
Poison pratia (Pratia concolor) may increase in pastures where it is established.
Growth period for native perennial grasses is short as dormancy is induced by cold winter temperatures.
Growth period of C4 perennial species such as Paspalum distichum is limited by cold temperatures in winter months.
Limited short-term growth response by Typha domingensis and Bolboschoenus fluviatilis. Main growth response most likely to occur in spring.
Phyla canescens cover may increase rapidly in early spring as this species resumes growth prior to the native species Paspalum distichum and can take advantage of the moisture in the soil profile following flooding.
3. Native and alien fish species
Late spring to summer Autumn to early winter
Moderate to high recruitment response likely in both native and alien (European carp, goldfish) species.
Recruitment is likely to be enhanced when flows coincide with peak spawning periods (September – October) in temperature-cued species such as Murray cod and eel-tailed catfish.
Low recruitment response likely in both native and alien species.
4. Timing of flow in relation to natural hydrological seasonality
Late spring to summer Autumn to early winter
High likelihood of natural flows from unregulated tributaries for ‘piggy-backing’ ECA releases.
Flow timing coincides with peak in annual rainfall.
Low likelihood of natural flows from unregulated tributaries for ‘piggy-backing’ ECA releases.
Seasonal rainfall is likely to be low at this time.
ECA management and monitoring
Managing Lower Gwydir environmental flows 126
releases may not reflect the potential of alternative ECA hydrographs to achieve a broader suite of ecological outcomes. Secondly, it may be necessary to establish a more variable hydrograph for ECA releases, in order to satisfy as many ecological objectives as possible. For example, if a release is made to inundate core wetland area, it may be worth considering a preceding release with greater upstream spillage, and a shorter duration and more gradual descending limb. Wetting of the bank profile by the initial flow might also help reduce upstream losses from the second release. The current operational rules for the ECA account are legislated by the Gwydir River water sharing plan, including rates of accrual and the maximum volumes allowed to be held at any one time. Under these existing rules, and with the limited account volumes under the current drought conditions, multiple releases may be difficult to achieve from ECA water alone. ‘Piggy-backing’ ECA flows on bulk releases for stock and domestic or irrigation purposes might be an effective strategy for facilitating multiple releases of differing stage height. However, the delivery point(s) for these flows and the channel reaches where the ecological outcomes are desired would need to match. Furthermore, releases for abstractive purposes may also be characterised by the significant loss of any ecological response (e.g. zooplankton, fish larvae, or nutrients) from the channel (Baumgartner et al., 2007). Nevertheless, amalgamating abstractive and environmental releases from Copeton Dam would be expected to reduce the overall level of transmission loss and such a strategy may be worth considering further. Significant flood events have occurred in winter in the Lower Gwydir floodplain, although the region has a largely summer-dominant rainfall pattern and the timing of future ECA events should match this whenever possible. While the ECA release from December 2006 to January 2007 along the Lower Gwydir River occurred in the natural period of peak flows, the April 2007 release into the Gingham Watercourse was at the end of this period and was followed by cold winter conditions. Although both releases triggered a vegetation response (chapter 6), few species were able to set significant quantities of seed following the April release as subsequent cold conditions appeared to kill off much of their above-ground reproductive biomass. Although our in-stream monitoring wasn’t specifically structured to examine this issue, the late timing of this release may also have influenced the apparent low recruitment response in spangled perch. Rates of most aquatic ecological processes are at least partially driven by temperature (Boulton & Brock, 1999), and ECA releases made under warmer conditions are likely to achieve the greatest ecological benefit (Table 9.1). Managers of ECA events should also attempt to maximise the duration of inundation. The best means of achieving this in the Lower Gwydir appears to be through piggy-backing releases onto natural flow events. When the soil is already wet, the spatial extent and duration of ECA inundation increases markedly as less surface water is lost into the soil profile. Such releases may also have reduced transmission losses, and will assist in synchronising ECA flows with the natural hydrology. This strategy also allows for the partial compensation of any natural flow abstracted through current supplementary access rules. However, the invariable time delay between confirmation of supplementary access to an event and the arrival of ECA water from Copeton Dam means that this practice will usually result in two separate flow pulses. Management tools. Managing any future ECA release program for the Lower Gwydir should be made within a framework of the Gwydir Wetlands Adaptive Environmental Management

ECA management and monitoring
Managing Lower Gwydir environmental flows 127
Plan, and be guided by the Gwydir Wetlands Decision Support System (DSS) software product. Moreover, the Gwydir Wetlands Adaptive Environmental Management Plan will establish benchmarks of ecological condition for a number of aquatic ecosystem components, against which any future shifts in ecological condition should be considered. Both of these tools are currently being finalised through the New South Wales Department of Environment, Climate Change and Water.
9.3 Monitoring Determining the ongoing Lower Gwydir flow requirements will require a mix of ongoing monitoring, incorporation of the findings into the Gwydir Wetlands DSS, and utilisation of this tool by relevant flow managers . It should be recognised that ecological responses to ECA releases will invariably differ from those due to natural flood events which typically have a greater stage height and total level of discharge. We recommend that future monitoring (and research) focus on responses to each of these flow types in order to establish a thorough picture of both trend and condition. Spatial and temporal design. The variable nature of dryland river ecology means that data sets longer than the present 3-year study will be essential if we are to fully appreciate the responses of the Lower Gwydir ecosystem to managed releases or flow variability more generally. This should include measurement of responses to individual ECA events, but also provide data from a longer sequence of varying seasonal and discharge conditions. Such a program should be structured in an event-based way but also allow for monitoring of low-flow and winter periods away from the usual spring-summer interval of higher flows. The ‘boom-bust’ dynamics of biota in dryland floodplain rivers must be acknowledged in any monitoring program of ecological responses to flow variability in this ecosystem. Long-term reference data sets will be necessary to understand the extent to which aquatic populations fluctuate in response to seasonal and hydrological cycles and structural habitat factors. Such data would allow a better understanding of the trade-offs or ecological costs of water resources developments that dampen the natural flow variability, as well as providing a reference against which to measure any gains from environmental flow programs. However, shorter-term monitoring sequences will still be necessary to delineate responses to specific flow events. Nevertheless, the difficulties in tracking responses to specific flow events should not be underestimated in flow-managed river systems like those on the Lower Gwydir floodplain where releases are being made for a variety of consumptive and environmental purposes. Clearly, ECA managers need to prioritise which ecological parameters they wish to promote with a particular release, especially in circumstances where releases may be recommended for a narrow set of ecological criteria. Future monitoring programs will need to make the final choice of ecological variables, sampling sites and timing with such management decisions in mind. However, it will also be necessary to maintain a close communication link between the ECAOAC and any research or agency staff directly involved in the associated monitoring activities. In particular, it will be critical that any future monitoring program be able to account for likely differences in temporal scale of response among biotic or other variables, as not all responses will be adequately detected by a single monitoring sequence. For example, while
ECA management and monitoring
Managing Lower Gwydir environmental flows 128
responses of wetland vegetation and some fish species were still evident 1–2 months after the April 2007 ECA event, elevated nutrient levels were already diminishing a week after cessation of the release. Although a multi-indicator monitoring program can provide an integrated picture of ecosystem responses to an environmental flow event, it will invariably be necessary to monitor different variables at varying temporal scales, from days to weeks or months following the onset of a flow event. Any future monitoring program for the Lower Gwydir floodplain will need to include a careful array of reference/control sites away from the target of any future ECA flows. In the present study, we incorporated both floodplain waterholes and the Mehi River into our design, neither of which currently receives ECA flows. The floodplain waterholes provide reference/control sites in the absence of all but the largest flow events, although they are likely to dry out after 12–18 months of no inflow. The likelihood of longitudinal variation will also need to be borne in mind. We recommend that at least three sites be included per channel along a similar positioning to that used here, although it may not be necessary to monitor all variables at each site. However, the choice of which sites to monitor for any suite of variables should be made carefully, and not necessarily based on patterns in local species richness. For example, while fish assemblage composition was generally more diverse in our upstream sites, environmental flow releases also need to supply appropriate flow conditions to reaches at the end of channels. Rigorous monitoring will need the capacity to establish the nature of any ecological responses to flow releases in these lower reaches as well. Variables. The findings from the present study provide some guidance on which variables and parameters to consider in future aquatic monitoring of the Lower Gwydir floodplain. These should also be selected with the factors discussed in chapter 4 in mind (Table 4.2). However, consideration also needs to be given to the resources available for monitoring (cost differences among variables, number of sites, temporal replication), and comparison of the spatial and temporal scale of response to flow events with the characteristics of the imminent release or question that requires answering. It is recommended that monitoring of the present suite of water chemistry parameters be continued. These samples/measurements are generally easy to process in the field and appropriate laboratory facilities are locally accessible. They generally also provide indications of short-term response to flow events and may provide additional evidence for mechanisms underpinning recruitment responses in fish or other in-stream fauna. However, while we detected short-term nutrient responses to ECA flows, it would be useful to include direct measures of benthic productivity in future monitoring. Although not undertaken in this study, such monitoring would provide an indication of the incorporation of nutrients and carbon into the aquatic food chain (Fellows et al., 2007). Zooplankton abundances in dryland river systems can fluctuate over brief time frames (Jenkins & Boulton, 2003, 2007) and, similar to water chemistry parameters, may provide insights into how other food-chain components are sustained by a particular flow event. Microinvertebrates may also be important in identifying ecosystem thresholds and resilience. However, zooplankton assemblages also tend to be highly patchy in space and over seasonal cycles (Shiel et al., 2006), which may make it difficult to detect ECA responses without considerable sampling and laboratory effort. Increasing the frequency of floodplain wetland inundation along dryland rivers will benefit zooplankton assemblages (Jenkins & Boulton, 2007) and there is scope to use zooplankton emergence from egg-banks as an indicator of ECA response in the Lower Gwydir.

ECA management and monitoring
Managing Lower Gwydir environmental flows 129
Until further details are available from the NSW Integrated Monitoring of Environmental Flows program, it is difficult to judge whether monitoring macroinvertebrates should be continued or not. Nevertheless, refined techniques have been developed for identifying and grouping macroinvertebrates responsive to changes in hydrology (Choy et al., 2000; Marshall et al. 2001), and these will assist in making more defensible links between hydrology and ecology and in identifying river stress. Macroinvertebrates are also fundamental components of river health assessments, and long-term data sets can provide a valuable resource. Generating responses in wetland vegetation has been a key ecological objective for past ECA releases, and future monitoring of these assemblages in relation to ECA releases will need to continue. Fortunately, vegetation is one suite of ecological parameters for which we have Lower Gwydir data sets longer than the usual 2-3 years of ecological monitoring. These provide a unique opportunity to establish a long-term picture of ecological responses to a variety of flow types in this ecosystem. It is recommended that the range of fixed monitoring points established by UNE in the mid 1990s continue to be used, including the four sets of grazing exclosures on “Birrah”, ”Old Dromana”, “Westholme”, and “Crinolyn”. These can also continue to provide information on the conditions under which grazing may alter the effects of inundation. It is critical that these exclosures be maintained and their protection promoted to relevant landholders. The usefulness of data obtained from these to date and the relatively low set-up costs of these structures suggests that similar exclosures and their monitoring should be considered for other wetland systems such as the Macquarie Marshes. For a variety of reasons, we recommend that monitoring of fish be continued in Lower Gwydir channels. Fish are a key dietary component of a number of key waterbirds in the Lower Gwydir (e.g. Marchant & Higgins, 1990; Scott, 1997; Roshier et al., 2002; Olsen et al., 2006), and understanding the local responses of fish to flow variability will be an important consideration in managing any inland wetland ecosystem for waterbird outcomes. Fish also attract considerable public attention, and knowledge of their responses to a particular flow event can be a useful means of garnering support for aquatic management decisions. Responses of fish species and assemblages to flow variability are generally evident over spatial and temporal scales relevant to management of the Lower Gwydir wetlands ecosystem, and can be easily sampled with sufficient rigour to produce statistically meaningful information. Suitable data sets from fish sampling programs at an appropriate spatial and temporal scale of monitoring can be produced after days of effort rather than months as is the case for other aquatic faunal assemblages such as macroinvertebrates. It will be vital that future fish monitoring facilitate a stronger understanding of the lifehistory of key fishes within the Lower Gwydir ecosystem. For example, the availability of an age-at-size relationship in bony bream and spangled perch allowed a preliminary match between the appearance of small fish and the timing of recent ECA flows. Although these were derived from sampling undertaken in the Macintyre River and other parts of the Lower Gwydir to the present sampling sites, they nonetheless allowed hypotheses of links between ECA releases and spawning activity in these species. Data are particularly needed on age-at-size, growth rate, spawning-timing, and migrations. It seems likely that it may be profitable to examine the effects of flow variability through lifehistory traits such as early growth and body condition in key species (cf. Heagney et al., 2008). Although not examined as part of this study, the waterbird assemblages and their breeding success are further ecological parameters that should be considered for ongoing monitoring in the Lower Gwydir wetlands. NSW DECCW has some historical data from the Lower
ECA management and monitoring
Managing Lower Gwydir environmental flows 130
Gwydir (Spencer, 2009; Wilson et al., in press) which, similar to wetland vegetation, provide a medium to long-term picture of flow responses. Institutional arrangements. A concerted research effort on the flow ecology and management of the Lower Gwydir floodplain commenced in the mid 2000s, involving Commonwealth and New South Wales state funding, agency staff, and several universities. In order to maintain this momentum and to meet the invariable requirement for a longer-term monitoring program (‘Spatial and temporal design’ above), it is recommended that formal collaborative partnership arrangements be established between research organisations and management agencies. This would not only ensure that appropriate ecological monitoring is continued, but also help guide the analysis and reporting of data in a timely and tailored manner. It would also boost the interdisciplinary nature of any monitoring activity, promote the cost-effective use of resources, and provide a necessary quality-assurance mechanism for any data collection. Such an arrangement could be engaged by agencies directly or brokered through bodies such as the Border Rivers – Gwydir Catchment Management Authority, the Murray-Darling Basin Authority, or the National Water Commission. It could include university-based postgraduate students whose research can represent an extremely cost-effective means of examining ecological responses to flow over short to medium time scales (Likens et al., 2009) and can add components to a longer-term research program. However, irrespective of the organisational structure, any future monitoring program should include careful networking of Lower Gwydir managers, researchers and the ECAOAC to ensure appropriate ownership and use of any findings. There also remains a clear need to establish a repository of long-term ecological data on the Lower Gwydir aquatic ecosystem. Some long-term data sets already exist on Lower Gwydir vegetation from earlier work through the University of New England, and the present analyses of how vegetation has responded to inundation and grazing (Chapter 5) greatly benefited from this. Some flow and water quality data also exist in state agencies. There is a number of ways in which this could be established, but records and biological reference collections may be best housed in research organisations where laboratory and other facilities offer the best chance of long-term protection and access. This should be governed by appropriate ‘Memorandum of Understanding’ agreements that identify the original sources of information and specify clear data-sharing mechanisms.
9.4 Key areas for future research Soil ecology. Recent research by Wilson et al. (2008) found preliminary indications that critical soil chemistry parameters (nitrogen, phosphorous, organic matter content) vary with inundation history in the Lower Gwydir. This study also compared germinant emergence from the soil seed-bank among the same Lower Gwydir sites, and found that while germinant abundance may vary with inundation history, species diversity was similar between sites. In other words, soil chemistry and the soil seed-bank may provide a key mechanism for wetland recovery if flooding patterns are reinstated. We recommend that further investigations be undertaken of the impact of flooding frequency on soil condition and the response of floodplain soils to wetting and drying. This should be undertaken with the explicit goal of determining how best to incorporate monitoring of soil parameters into future ECA monitoring programs.
ECA management and monitoring
Managing Lower Gwydir environmental flows 131
Fish population ecology. We also recommend expanding the current fish monitoring to establish a greater focus on the population ecology of individual species within the Lower Gwydir channels. In particular, a better understanding of how the early life history of individual species differs under varying flow conditions and among channels will boost our capacity to predict outcomes from alternative flow management scenarios. Parameters such as early growth rate and body condition are thought to be key drivers of recruitment success in fish (e.g. McCormick & Molony, 1992) and, in turn, may be important for population strength in lowland river systems (Mallen-Cooper & Stuart, 2003). Some research has established preliminary relationships between flow variability and spawning-timing and early growth in species such as Australian smelt and spangled perch, either in the Lower Gwydir (Heagney et al., 2008; Wilson et al., in press) or nearby (Wilson & Wright, 2005). However, more work is needed to confirm the consistency of these patterns over broader spatial and temporal scales. Firstly, it will be necessary to validate the periodicity of otolith increment formation in most Lower Gwydir native fishes, ideally through oxytetracycline trials, to support sound descriptions of growth and spawning-timing. Body condition should also be examined in relation to flow variability, and quantified in terms of the water, protein, lipid and carbohydrate levels before and after managed and natural flooding. Effect of in-stream barriers. Numerous in-stream structures exist along the Lower Gwydir River and Gingham Watercourse (Mallen-Cooper, 2000). Determining the influence of these on local fish assemblage structure and movement will be critical if outcomes for fish from ECA releases are to be fully realised. A number of structures have a head-loss of around one metre (e.g. Tyreel Weir, Keytah Weir), and this will likely have a significant effect on upstream migration and possibly also survivorship and distance travelled during downstream larval drift. More stable flow conditions upstream of in-stream structures may also promote the survivorship of exotic species such as carp or goldfish. We recommend that dedicated monitoring examine differences in assemblage structure between upstream and downstream of key structures, and whether accumulation of individuals occurs downstream of structures during high and low flow conditions. Where impacts are detected, installation of fishways would be expected to have substantial benefits. Effect of habitat structure on fish assemblages. We detected consistent differences in fish assemblage structure between and along the three study channels, possibly due to spatial differences in water quality or structural habitat. We recommend research to establish the extent to which structural habitat, in particular, is responsible for in-stream ecological condition in the Lower Gwydir. This should include relationships with riparian structure as well as channel parameters such as depth diversity, sediment composition and the extent of woody debris. Examining concomitant relationships with flow velocity would be a logical extension of this research. Rehabilitation of key structural habitat features such as riparian cover may prove a cost effective means of improving in-stream outcomes from ECA releases.
References
Managing Lower Gwydir environmental flows 132
References Acreman, M. 2005. Linking science and decision-making: features and experience from environmental flow setting. Environmental Modelling and Software 20: 99–109
Alexander, P., Nielsen, D.L. & Bias, D. 2008. Response of wetland plant communities to inundation within floodplain landscapes. Ecological Management and Restoration 9: 187–195
Analytical Software. 2000. Statistix 7. Analytical Software, Tallahassee.
ANRA. 1995. Australian Natural Resources Atlas. Water Resources - Availability - Surface Water Measurement Station: GWYDIR RIVER D/S COPETON DAM - DWR (ID: 418026). Sourced from: www.anra.gov.au/topics/water/availability/swms/swms-418026.html
ANZECC & ARMCANZ 2000. Australian and New Zealand guidelines for fresh and marine water quality, Australian and New Zealand environment and conservation council: Agricultural and Resource Management Council of Australia and New Zealand.
Arthington, A.H., Balcombe, S.R., Wilson, G.G., Thoms, M.C. & Marshall, J. 2005. Spatial and temporal variation in fish assemblage structure in isolated waterholes during the 2001 dry season of an arid-zone floodplain river, Cooper Creek, Australia. Marine and Freshwater Research 56: 23–35
Bacon, P.K., Ward, P., Craven, B., Bone, M., Harper, M., Maher, H., Tane & Briggs, S. 1992. Floodplain Land Use Issues in the Murray-Darling Basin. Paper presented at the Murray-Darling Basin Floodplain Wetlands Management Workshop – Discussion Papers, Albury, New South Wales.
Balcombe, S.R. & Arthington, A.H. 2009. Temporal changes in fish abundance in response to hydrological variability in a dryland floodplain river. Marine and Freshwater Research 60:146–59
Balcombe, S. R., Arthington, A. H., Foster, N. D., Thoms, M. C., Wilson, G.G. & Bunn, S. E. 2006. Fish assemblages of an Australian dryland river: abundance, assemblage structure and recruitment patterns in the Warego River, Murray-Darling Basin. Marine and Freshwater Research 57: 619–633
Baldwin, D.S. & Mitchell, A. 2000. The effects of drying and re-flooding on the sediment or soil nutrient dynamics of lowland flood plain systems: synthesis. Regulated Rivers: Research and Management 16: 457–468
Baumgartner, L., Reynoldson, N., Cameron, L. & Stanger, J. 2007. The effects of selected irrigation practices on fish of the Murray-Darling Basin. New South Wales Department of Primary Industries, Narrandera, New South Wales.
Bennett, M. & Green, J. 1993. Preliminary assessment of Gwydir Wetland water needs. NSW Department of Water Resources, Technical Services Division, Sydney, New South Wales.
Bennett, R.L. 1996. Macroinvertebrates of the Gwydir River, Northern NSW. School of Natural Resources, University of New England, Armidale, New South Wales.
Berkman, H.E. & Rabeni, C.F. 1987. Effects of siltation on fish communities. Environmental Biology of Fishes 18: 286–294
Blanch, S. J. & Walker, K. F. 1997. Littoral plant life history strategies and water regime gradients in the Lower River Murray, South Australia. Internationale Vereinigung für Theoretische und Angewandte Limnologie 26: 1814–1820.
Boedeltie, G., ter Heerdt, G. N. J. & Bakker, J.P. 2002. Applying the seedling-emergence method under waterlogged conditions to detect the seed bank of aquatic plants in submerged sediments. Aquatic Botany 72: 121–128
References
Managing Lower Gwydir environmental flows 133
BOM. 2007. Climate records for Moree weather stations. Supplied by the Commonwealth of Australia Bureau of Meteorology.
Boulton, A.J., Sheldon, F. & Jenkins, K.M. 2006. Natural disturbance and aquatic invertebrates in desert rivers. Pp. 133–153 In: Kingsford, R.T. (ed). Ecology of Desert Rivers, Cambridge University Press, Cambridge, UK.
Boulton, A.J. & Brock, M.A. 1999. Australian freshwater ecology: Processes and management. Gleneagles Publishing, Glen Osmond, South Australia.
Brock, M. 1998. Are temporary wetlands resilient? Evidence from seed banks of Australian and South African wetlands. Pp 193–206 In Wetlands for the future. Eds A.J. McComb and J. A. Davis. Gleneagles Publishing.
Brock, M. & Casanova, M. 1997. Plant life at the edge of wetlands: ecological responses to wetting and drying patterns. Pp 182–192 In: Klomp, N. & Lunt, I. (eds) Frontiers in Ecology: Building the Links. Elsevier Science, Oxford.
Brock, M.A., Nielsen, D.L. & Crosslé, K. 2005. Changes in biotic communities developing from freshwater wetland sediments under experimental salinity and water regimes. Freshwater Biology 50: 1376-1390
Bunn, S.E. & Arthington, A.H. 2002. Basic principles and ecological consequences of altered flow regimes for aquatic biodiversity. Environmental Management 30: 492–507
Burns, A. & Ryder, D.S. 2001. Potential for biofilms as biological indicators in Australian riverine systems. Ecological Management & Restoration 2: 53–63
Burns, A. & Walker, K.F. 2000. Effects of water level regulation on algal biofilms in the River Murray, South Australia. Regulated Rivers: Research & Management 16: 433–444
Caddy, H. 2005. Lower Gingham Watercourse Floodplain management study: New South Wales Department of Infrastructure, Planning and Natural Resources, Sydney, New South Wales.
Chong, J. & Ladson, A. R. 2003. Analysis and management of unseasonal flooding in the Barmah-Millewa Forest, Australia. River Research and Applications 19: 161–180
Choy, S.C., Marshall, J.C. & Conrick, D.L. 2000. Chapter 8. Flow requirements of Aquatic Invertebrates. Pp 219–263 In: Arthington, A.H., Brizga, S.O., Choy, S.C., Kennard, M.J., Mackay, S.J., McCosker, R.O., Ruffini, J.L. & Zalucki, J.M. Environmental flow requirements of the Brisbane River downstream from Wivenhoe Dam. Southeast Queensland Water Corporation Ltd. and Centre for Catchment and In-stream Research, Griffith University, Brisbane.
Copeland, C., Schooneveldt-Reid, E. & Neller, S. 2003. Fish Everywhere: An oral history of fish and their habitats in the Gwydir River. New South Wales Fisheries. Ballina, New South Wales.
Courtney, J. 1997. An annotated list of the species of frogs (Amphibia: Anura) recorded from the Gwydir Wetlands, Moree. Swan Vale, Glen Innes, New South Wales.
Clarke, K.R. & Gorley, R.N. 2006. PRIMER v6: User Manual/Tutorial PRIMER-E, Plymouth.
Clarke, K.R. & Warwick, R. M. 2001. Change in marine communities: an approach to statistical analysis and interpretation, 2nd edition. PRIMER-E: Plymouth.
Cummins, K.W., Cushing, C.E. & Minshall, G.W. 1995. Introduction: an overview of stream ecosystems. Pp 1–8 In Cushing, C.E., Cummins, K.W. & Minshall, G.W. (eds) Ecosystems of the World, vol. 22, River and Stream Ecosystems. Elsevier, Amsterdam.
Davis, J.A. & Barmuta, L.J. 1989. An ecologically useful classification of mean and near-bed flows in streams and rivers. Freshwater Biology 21: 271-282
Dent, L.C., Cumming, G.S. & Carpenter, S.R. 2002. Multiple states in river and lake ecosystems. Philosophical Transactions of the Royal Society of London, Series B: Biological Sciences 357: 635–645
References
Managing Lower Gwydir environmental flows 134
Doupé, R.G. & Pettit, N.E. 2002. Ecological perspectives on regulation and water allocation for the Ord River, Western Australia. River Research and Applications 18: 307–320
Downes, B.J., Barmuta, L.A., Fairweather, P.G., Faith, D.P., Keough, M.J., Lake, P.S., Mapstone, B.D. & Quinn, G.P. 2002. Monitoring ecological impacts. Concepts and practise in flowing waters. Cambridge University Press, Cambridge, UK.
Driver, P.D., Harris, J.H., Closs, G.P. & Koehn, T.B. 2005. Effects of flow regulation on carp (Cyprinus carpio L.) recruitment in the Murray-Darling Basin, Australia. River Research and Applications 21: 327–335
Fellows, C. S., Wos, M. L., Pollard, P. C. & Bunn S. E. 2007. Ecosystem metabolism in a dryland river waterhole. Marine and Freshwater Research 58: 250–262
Finlay, B.J., Maberly, S.C. & Cooper, J.I. 1997. Microbial diversity and ecosystem function. Oikos 80: 209–213
Fitz, H.C., DeBellevue, E.B., Costanza, R., Boumans, R., Maxwell, T., Wainger, L. & Skar, F.H. 1996. Development of a general ecosystem model for a range of scales and ecosystems. Ecological Modelling 88: 263–295
Gehrke, P.C. 1991. Avoidance of inundated floodplain habitat by larvae of golden perch (Macquaria ambigua Richardson): influence of water quality or food distribution? Australian Journal of Marine and Freshwater Research 42: 707–719
Gehrke, P.C. & Harris, J.H. 2001. Regional-scale effects of flow regulation on lowland riverine fish communities in New South Wales, Australia. Regulated Rivers: Research & Management 17: 369–391
Gehrke, P.C., Brown, P., Schiller, C.B., Moffat, D.B. & Bruce, A.M. 1995. River regulation and fish communities in the Murray-Darling River system, Australia. Regulated Rivers: Research and Management 11: 363–375
Growns, I. 2008. The influence of changes to river hydrology on freshwater fish in regulated rivers of the Murray-Darling Basin. Hydrobiologia 596: 203–211
Growns, I., Astles, K. & Gehrke, P.C. 2006. Multiscale spatial and small-scale temporal variation in the composition of riverine fish communities. Environmental Monitoring and Assessment 114: 553–571
Guy, H.P. & Ferguson, G.E. 1970. Stream sediment: an environmental problem. Journal of Soil and Water Conservation 25: 217–221
Harden, G.J. 2000–2002. Flora of New South Wales, Vols. 1–4, revised edition. University of New South Wales Press, Kensington, New South Wales.
Harris, J.H. & Gehrke, P.C. 1994. Modelling the relationship between streamflow and population recruitment to manage freshwater fisheries. Australian Fisheries 6: 28–30
Harris, J.H. & Gehrke, P.C. 1997. Fish and Rivers in Stress: The NSW Rivers Survey. Fisheries Office of Conservation and the CRC for Freshwater Ecology, Cronulla, New South Wales.
Harris, W. & Marshall, W.H. 1963. Ecology of water-level manipulation on a northern marsh. Ecology 44: 331–343
Heagney, E.C., Fowler, A.M. & Allman, R.P. 2008. Growth and condition of juvenile Australian smelt and bony bream in the Gwydir wetlands: an otolith-based analysis. Final report to the NSW Department of Environment and Climate Change. Heagney Consulting, Lismore, New South Wales.
Hobson, A. 1999. Invasive weeds: a threat to wetland ecosystems. Unpublished Honours Thesis, University of New England, Armidale, New South Wales.
Humphries, P. 2005. Spawning time and early life history of Murray cod, Maccullochella peelii peelii (Mitchell) in an Australia river. Environmental Biology of Fishes 72: 393–407

References
Managing Lower Gwydir environmental flows 135
Humphries, P., King, A.J. & Koehn, J.D. 1999. Fish, flows and flood plain: links between freshwater fishes and their environment in the Murray-Darling River system, Australia. Environmental Biology of Fishes 56: 129–151
Jackson, L.J., Trebitz, A.S. & Cottingham, K.L. 2000. An introduction to the practice of ecological modelling. BioScience 50: 694–706
Jenkins, K.M. & Boulton, A.J. 2003. Connectivity in a dryland river: short-term aquatic microinvertebrate recruitment following floodplain inundation. Ecology 84: 2708–2723
Jenkins, K.M. & Boulton, A.J. 2007. Detecting impacts and setting restoration targets in arid-zone rivers: aquatic micro-invertebrate responses to reduced floodplain inundation. Journal of Applied Ecology 44: 823–832
Jenkins, K.M., Boulton, A.J. & Ryder, D.S. 2005. A Common Parched Future? Research and Management of Australian Arid-zone Floodplain Wetlands. Hydrobiologia 552: 57–73
Junk,W.J., Bayley, P.B. & Sparks, R.E. 1989. The flood pulse concept in river-floodplain systems. Pp. 110–127 In: Dodge, D.P. (ed.) Proceedings of the International Large River Symposium. Canadian Special Publications in Fisheries and Aquatic Sciences 106.
Keyte, P. 1994. Lower Gwydir wetland - plan of management 1994-97. New South Wales Department of Water Resources Report for the Gwydir Wetland Steering Committee. Sydney, New South Wales.
King, A. J. 2004. Density and distribution of potential prey for larval fish in the main channel of a floodplain river: pelagic versus epibenthic meiofauna. River Research and Applications 25: 883–897
Kingsford, R. T. 2000. Ecological impacts of dams, water diversions and river management on floodplain wetlands in Australia. Austral Ecology 25: 109–127
Kobayashi, T., Shiel, R.J., Gibbs, P. & Dixon, P.I. 1998. Freshwater zooplankton in the Hawkesbury-Nepean River: comparison of community structure with other rivers. Hydrobiologia 377: 133–145
Koehn, J.D. & Harrington, D.J. 2006. Environmental conditions and timing for the spawning of Murray cod (Maccullochella peelii peelii) and the endangered trout cod (M. macquariensis) in southeastern Australian rivers. River Research and Applications 22: 327–342
Lake, J.S. 1967. Rearing experiments with five species of Australian freshwater fishes. I. Inducement to spawning. Australian Journal of Marine and Freshwater Research 18: 137–153
Leahy, P.J., Tibby, J., Kershaw, A.P., Heijnis, H. & Kershaw, J.S. 2005. The impact of European settlement on Bolin Billabong, a Yarra River floodplain lake, Melbourne, Australia. River Research and Applications 21: 131–149
Lintermans, M. 2007. Fishes of the Murray-Darling Basin: An introductory guide. Murray-Darling Basin Commission. Canberra, Australian Capital Territory.
Llewellyn, L.C. 1983. The distribution of fish in New South Wales. Australian Society for Limnology.
Lu, X.X. 2005. Spatial variability and temporal change of water discharge and sediment flux in the Lower Jinsha tributary: Impact of environmental changes. River Research and Applications 21: 229–243
Lunt, I.D., Jansen, A., Binns, D.L. & Kenny, S.A. 2007. Long-term effects of exclusion of grazing stock on degraded herbaceous plant communities in a riparian Eucalyptus camaldulensis forest in south-eastern Australia. Austral Ecology 32: 937–949
Lytle, D. A. & Poff, N. L. 2004. Adaptation to natural flow regimes. Trends in Ecology & Evolution 19: 94–100
Mallen-Cooper, M. 1994. Swimming ability of adult golden perch, Macquaria ambigua (Percichthyidae), adult silver perch, Bidyanus bidyanus (Teraponidae), in an experimental vertical slot fish way. Australian Journal of Marine and Freshwater Research 45: 191–198
References
Managing Lower Gwydir environmental flows 136
Mallen-Cooper, M. 2000. Review of barriers to fish passage in the Lower Gwydir Floodplain. Fishway Consulting Services, St Ives Chase, New South Wales.
Mallen-Cooper, M. & Stuart, I.G. 2003. Age, growth and non-flood recruitment of two potamodromous fishes in a large semi-arid/temperate river system. River Research and Applications 19: 697–719
Marchant, S. & Higgins, P.J. 1993. Handbook of Australian, New Zealand and Antarctic Birds. Volume 2: Raptors to Lapwings. Oxford University Press, Melbourne.
Marshall, C.M., Negus, P. & Choy, S.C. 2001. An assessment of current flow-related ecological condition of the Pioneer River and nearby catchments based on aquatic macroinvertebrates. In: Brizga, S.O., Arthington, A.H., Choy, S.C., Craigie, N.M., Mackay, SJ., Poplawski, W., Pusey, B. & Werren, G. 2001. Pioneer Valley Water Resource Plan: Environmental Flow Report. 2 Volumes. Department of Natural Resources and Mines, Brisbane.
Marshall, J.C., Sheldon, F., Thoms, M.C. & Choy, S. 2006. The macroinvertebrate fauna of an Australian dryland river: spatial and temporal patterns and environmental relationships. Marine and Freshwater Research 57: 61–74
Mawhinney, W.A. 2003. Restoring biodiversity in the Gwydir wetlands through environmental flows. Water Science and Technology 48: 73–81
Mawhinney, W.A. 2005. Water quality in the Gwydir Catchment 2003-2004. Department of Natural Resources, Tamworth, NSW Government.
McCormick, M.I. & Molony, B.W. 1992. Effects of feeding history on the growth characteristics of a reef fish at settlement. Marine Biology 114: 165–173
McCosker, R.O. 1994. Lippia (Phyla nodiflora): An invasive plant of floodplain ecosystems in the Murray-Darling Basin. University of New England, Armidale, New South Wales.
McCosker, R.O. 1996. Gwydir wetlands: Ecological response to flooding 1995-96. Landmax Pty Ltd, Kangaroo Point, Queensland.
McCosker, R.O. 1997. Gwydir Wetlands: Ecological response to flooding 1997. Landmax Pty ltd. Kangaroo Point, Queensland.
McCosker, R.O. 1998. Gwydir Wetlands: Ecological response to flooding 1998. Report prepared for NSW National Parks and Wildlife Service by Landmax Pty Ltd. Landmax Pty ltd. Kangaroo Point, Queensland.
McCosker, R.O. 1999. Gwydir Wetlands – Ecological Response to Flooding 1998. A report prepared for the NSW National Parks and Wildlife Service, NSW Department of Land and Water Conservation and Gwydir River Management Committee. Landmax Pty Ltd, Kangaroo Point, Queensland.
McCosker, R.O. 2001. Gwydir Wetlands ecological response to flooding 2000-2001. Landmax Pty ltd. Kangaroo Point, Queensland.
McCosker, R.O., Blanch, S.J., Smith, F.J., Duggin, J.A. & Brock, M.A. 1993. Lower Gwydir Watercourse Vegetation Survey Report. Department of Ecosystem Management and Department of Botany, University of New England, Armidale, New South Wales.
McCosker, R.O., Brizga, S.O., Arthington, A. A. & Macfarlane, W. 1999. Gwydir environmental scan. Other publication details unavailable.
McCosker, R.O. & Duggin, J.A. 1992. Gingham Watercourse-Resource Management Issues. Department of Ecosystem Management, University of New England, Armidale, New South Wales.
McCosker, R.O. & Duggin, J.A. 1993. Gingham Watercourse-Resource Management Options. Department of Ecosystem Management, University of New England, Armidale, New South Wales.
McFarlane, J. 2002. Wetland grazing-impact on soil seed banks of four communities in the Lower Gwydir, New South Wales, Australia. Unpublished Honours Thesis, University of New England, Armidale, New South Wales.
References
Managing Lower Gwydir environmental flows 137
McGinness, H.M. 2007. Spatial heterogeneity and hydrological connectivity in a dryland, anabranching floodplain river system. Unpublished PhD thesis, University of Canberra, Canberra, Australian Capital Territory.
McGinness, H.M., Thoms, M.C. & Southwell, M.R. 2002. Connectivity and fragmentation of flood plain–river exchanges in a semiarid, anabranching river system: IAHS Publication 276: 19–26
MDBC 2004. Native fish strategy for the Murray-Darling Basin 2003–2013. Murray-Darling Basin Ministerial Council, Canberra, Australian Capital Territory.
Milchunas, D.G. & Lauenroth, W.K. 1993. Quantitative effects of grazing on vegetation and soils over a global range of environments. Ecological Monographs 63: 327–366
Milchunas, D.G., Sala, O.E. & Laurenroth, W.K. 1988. A generalized model of the effects of grazing by large herbivores on grassland community structure. American Naturalist 132: 87–106
Miner, J.G. & Stein, R.A. 1993. Interactive influence of turbidity and light on larval bluegill (Lepomis macrochirus) foraging. Canadian Journal of Fisheries and Aquatic Sciences 50: 781–788
Mitsch, W.J. & Gosselink, J.G. 2000. Wetlands (4th ed.). John Wiley & Sons, New York.
Montgomery, J.F. & Faulkner, R. 2002. Water quality in the Gwydir valley watercourses. Report for Gwydir Valley Irrigators Association. Australian Cotton CRC and the Division of Environmental Engineering, University of New England, Armidale, New South Wales.
Morton, S., Bourne, G., Cristofani, P., Cullen, P., Possingham, H. & Young, M. 2002. Sustaining our natural systems and biodiversity: an independent report to the Prime Minister’s Science, Engineering and Innovation Council. CSIRO and Environment Australia, Canberra, Australian Capital Territory.
Mueller-Dombois, D. & Ellenberg, H. 1974. Aims and Methods of Vegetation Ecology. John Wiley and Sons, Sydney, New South Wales.
Nielsen, D.L., Brock, M.A., Petrie, R. & Crossle, K. 2007. The impact of salinity pulses on the emergence of plant and zooplankton from wetland seed and egg banks. Freshwater Biology 52: 784–795
NSW DIPNR. 2002. Water quality in the Gwydir catchment 2001–2002. New South Wales Department of Infrastructure, Planning and Natural Resources, Tamworth, New South Wales.
NSW DIPNR. 2005a. Environmental contingency allowance operations advisory Committee: Operating guidelines. May 2005. Department of Infrastructure, Planning and Natural Resources, Armidale, New South Wales.
NSW DIPNR. 2005b. Lower Gingham Watercourse Floodplain management plan. New South Wales Department of Infrastructure, Planning and Natural Resources, Sydney, New South Wales.
NSW DECC. 2008. Gwydir Environmental Contingency Allowance Annual Flow Plan 2008–2009. New South Wales Government, Armidale, Australia.
NSW Fisheries and NSW DLWC. 2002. Initial weir review summary: Gwydir catchment. NSW Government, Sydney, New South Wales.
Olsen, J., Fuentes, E. & Rose A.B. 2006. Trophic relationships between neighbouring White-bellied (Haliaeetus leucogaster) and Wedge-tailed Eagles (Aquila) breeding on rivers and dams near Canberra. Emu 106: 193–201
Peterson, C.G. & Stevenson, R.J. 1992. Resistance and resilience of lotic algal communities: importance of disturbance timing and current. Ecology 73: 1445–1461
Poff, N.L. & Ward, J.V. 1989. Implications of streamflow variability and predictability for lotic community structure: A regional analysis of streamflow patterns. Canadian Journal of Fisheries and Aquatic Sciences 46: 1805–1818
Preece, R.M. & Jones, H.A. 2002. The effect of Keepit Dam on the temperature regime of the Namoi River, Australia. River Research and Applications 18: 397–414

References
Managing Lower Gwydir environmental flows 138
Proulx, M. & Mazumder, A. 1998. Reversal of grazing impact on plant species richness in nutrient-poor vs. nutrient-rich ecosystems. Ecology 79: 2581–2592
Puckridge, J.T., Sheldon, F., Walker, K.F. & Boulton, A.J. 1998. Flow variability and the ecology of large rivers. Marine & Freshwater Research 49: 55–72
Rea, N. 1994. Water requirements of the Gwydir Valley wetlands – an assessment and consolidation of prior studies. NSW Department of Water Resources, Environmental Studies Unit, Parramatta, New South Wales.
Reid, M.A., & Quinn, G.P. 2004. Hydrologic regime and macrophyte assemblages in temporary floodplain wetlands: implications for detecting responses to environmental water allocations. Wetlands 24: 586–599
Roberts, J. 2002. Species-level knowledge of riverine and riparian plants: a constraint in determining flow requirements in the future. Australian Journal of Water Resources 5: 21–31
Roberts, J. & Marston, F. 2000. Water regime of wetland and floodplain plants in the Murray-Darling Basin: A source book of ecological knowledge. CSIRO Land and Water Technical Report 30/00, Canberra, Australian Capital Territory.
Roberts, J., Young, W. & Marston, F. 2000. Estimating the Water Requirements for Plants of Floodplain Wetlands: a Guide. Land and Water Resources Research and Development Corporation, Canberra, Australian Capital Territory.
Robertson, A.I. 1997. Land-water linkages in floodplain river systems: the influence of domestic stock. Pp 207–218 In: Klomp, N. & Lunt, I. (Eds). Frontiers in ecology: building the links. Elsevier Science Ltd, Oxford.
Robertson, A.I. 1998. The effect of livestock on wetlands. Pp 195–201 In: Williams, W.D. (ed) Wetlands in a dry land: Understanding for management. Environment Australia, Canberra.
Robertson, A.I., Boon, P.I., Bunn, S.E., Ganf, G., Herzceg, A., Hillman, T. & Walker, K.F. 1996. A scoping study into the role, importance, sources, transformation and cycling of carbon in the riverine environment. Consultancy report to the Murray-Darling Basin Commission. Charles Sturt University, Wagga Wagga, New South Wales.
Roshier, D.A., Robertson, A.I. & Kingsford, R.T. 2002. Responses of waterbirds to flooding in an arid region of Australia and implications for conservation. Biological Conservation 106: 399–411
Ryder, D.S., Watts, R.J., Nye, E. & Burns, A. 2006. Can flow velocity regulate epixylic biofilm structure in a regulated floodplain river? Marine and Freshwater Research 57: 29–36
Salisbury, E. 1970. The pioneer vegetation of exposed muds and its biological features. Philosophical Transactions of the Royal Society London Biological Sciences 259: 207–255
Schalk, T. 2006. The environmental contingency allowance history of use in the Gwydir. Department of Natural Resources, Armidale, New South Wales.
Scott, A. 1997. Relationships between waterbird ecology and river flows in the Murray-Darling Basin. CSIRO Land and Water. Technical Report No. 5/97.
Sheldon, F., Thoms, M.C., Berry, O. & Puckridge, J. 2000. Using disaster to prevent catastrophe: Referencing the impacts of flow changes in large dryland rivers. Regulated Rivers: Research and Management 16: 403–420
Sheldon, F. & Walker, K.F. 1997. Changes in biofilms induced by flow regulation could explain extinctions of aquatic snails in the lower River Murray, Australia. Hydrobiologia 347: 97–708
Shiel, R.J., Costelloe, J.F., Reid, J.R.W., Hudson, P. & Powling, J. 2006. Zooplankton diversity and assemblages in arid zone rivers of the Lake Eyre Basin, Australia. Marine and Freshwater Research 57: 49–60
Shiel, R.J., Walker, K.F. & Williams, W.D. 1982. Plankton of the lower River Murray, South Australia. Marine and Freshwater Research 33: 301–327
References
Managing Lower Gwydir environmental flows 139
Siebentritt, M.A. 1999. Fish and the lower Gwydir Floodplain. Wetland Care Australia, Berri, South Australia.
Smith, G. & Pritchard, P. 2003. Biodiversity opportunities in Australian agriculture: a national view. Paper presented at the Proceedings of the Conference on Rural Land Use Change, Victoria.
Speas, D.W. 2000. Zooplankton density and community composition following an experimental flood in the Colorado River, Grand Canyon, Arizona. Regulated Rivers: Research & Management 16: 73–81.
Spencer, J.A. 2009. Historical records of waterbirds and fish populations in the Gwydir wetlands. Final report for the NSW Wetland Recovery Program. Rivers and Wetlands Unit, NSW Department of Environment and Climate Change, Sydney, New South Wales.
Ter Heerdt, G.N.J. & Drost, H.J. 1994 The potential for the development of marsh vegetation from the seed bank after a drawdown. Biological Conservation 67: 1–11
Ter Heerdt, G.N.J., Schutter, A. & Bakker, J.P. 1999. The effect of water supply on seed-bank analysis using the seedling-emergence method. Functional Ecology 13: 428–430
Thoms, M.C. & Parsons, M. 2003. Identifying spatial and temporal patterns in the hydrological character of the Condamine–Balonne River, Australia, using multivariate statistics. River Research and Applications 19: 443–457
Thoms, M.C., Southwell, M.R. & McGinness, H.M. 2005. Floodplain-river ecosystems: Fragmentation and water resources development. Geomorphology 71: 126–138
Thorp, J.H. & Delong, M.D. 2002. Dominance of autochthonous autotrophic carbon in food webs of heterotrophic rivers. Oikos, 96: 543–550
Vannote, R.L., Minshall, G.W., Cummins, K.W., Sedell, J.R. & Cushing, C.E. 1980. The river continuum concept. Canadian Journal of Fisheries and Aquatic Sciences 37: 130–137
Walker, K.F., Puckridge, J.T. & Blanch, S.J. 1995. A perspective on dryland river ecosystems. Regulated Rivers: Research & Management 11: 85–104
Williams, W. D. 1998. Wetlands in a Dry Land: Understanding for Management. Environment Australia Biodiversity Group, Canberra, Australian Capital Territory.
Wilson, G.G., Berney, P.J., Ryder, D.S. & Price, J.N. 2008. Stage 2: Grazing/Landuse in the Macquarie Marshes and Gwydir Wetlands. Final report to the New South Wales Department of Environment and Climate Change. University of New England, Armidale, New South Wales.
Wilson, G.G., Spencer, J.A. & Heagney, E.C. In press. Responses of fish and waterbirds to flow variability in the Lower Gwydir wetlands. Ecosystem Response Modelling in the Murray-Darling Basin. CSIRO Press, Melbourne, Australia.
Wilson, G. & Wright, A. 2005. Fish recruitment in the Border Rivers and Moonie River catchments. Northern Basin Laboratory, Murray-Darling Freshwater Research Centre, Goondiwindi, Queensland.
Wilson, G.G. & Sisson, J.L. 2006. Managing environmental flows in an agricultural landscape: the Lower Gwydir floodplain. Report No. 1 – Communication Plan. Cotton Catchment Communities CRC and University of New England, Armidale, New South Wales.
Wilson, S. & Swan, G. 2003. A complete guide to reptiles of Australia. Reed New Holland, Sydney.
Young, W.J. & Kingsford, R.T. 2006. Flow variability in large unregulated dryland rivers. Pp 11–46 In Kingsford, R.T. (ed) Ecology of Desert Rivers.(Cambridge University Press, Cambridge.
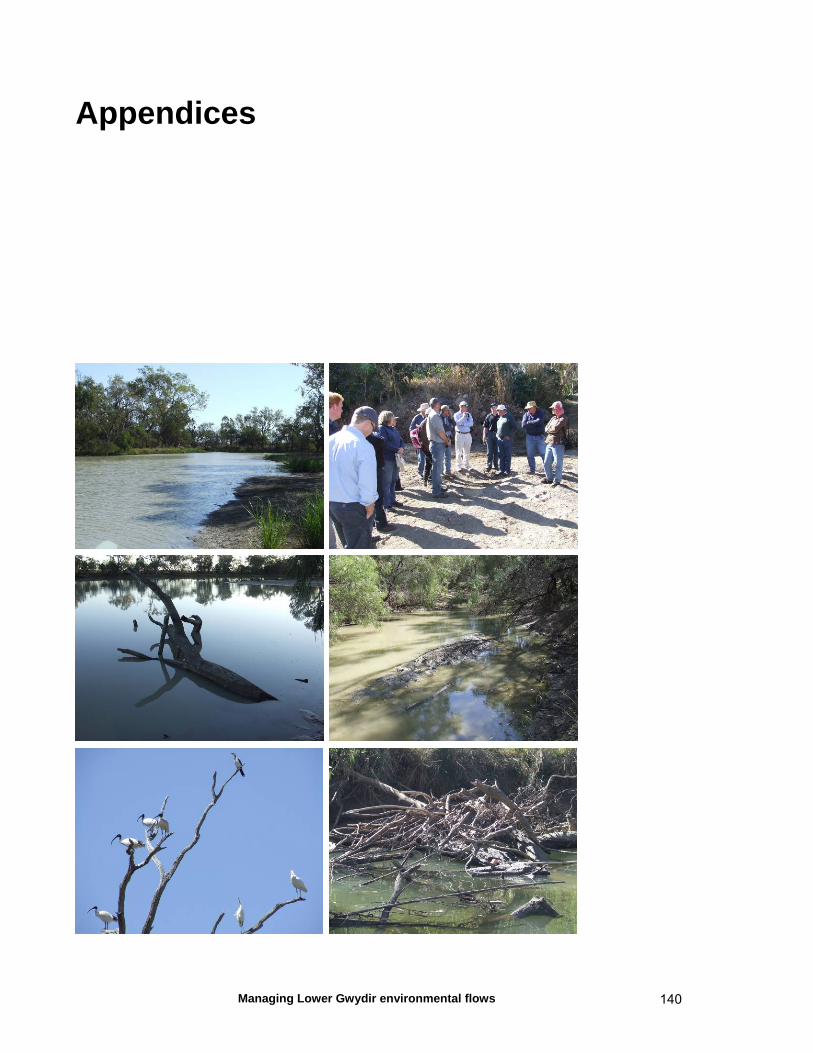
Managing Lower Gwydir environmental flows 140
Appendices

Project presentations
Managing Lower Gwydir environmental flows 141
Appendix 1 Project presentations Underlined names refer to speaker of multi-author talks
2006 Glenn Wilson. Managing environmental flows in an agricultural landscape: the Lower Gwydir floodplain. Cotton Catchment Communities CRC Environment Program meeting, Tamworth, NSW. (January) Glenn Wilson. Research to underpin environmental flow decisions for the Lower Gwydir floodplain. Environmental Contingency Allowance Operations Advisory Committee, Moree, NSW. (February) Glenn Wilson. Research to underpin environmental flow decisions for northern floodplain rivers. Condamine Alliance, Toowoomba, Qld. (March) Glenn Wilson. Managing environmental flows in an agricultural landscape: the Lower Gwydir floodplain. Project Steering Committee meeting 1, Moree, NSW. (June) Glenn Wilson. Research to underpin environmental flow decisions for the Lower Gwydir floodplain. National Water Commission, Canberra, ACT (July) Paul Frazier & Glenn Wilson. Research to underpin environmental flow decisions for northern floodplain rivers. Australian Cotton Conference, Gold Coast, Qld. (August) Glenn Wilson. Managing environmental water delivery to floodplain aquatic habitats of Australia’s northern Murray-Darling Basin. Freshwater Research Unit, University of Cape Town, Cape Town, South Africa. (November)
2007 Peter Berney. Vegetation dynamics in response to the wetting regime and grazing in the Lower Gwydir Wetlands. Department of Ecosystem Management, University of New England, Armidale, NSW. (April) Glenn Wilson, Tobias Bickel, Julia Sisson & Peter Berney. Managing environmental flows in the Lower Gwydir. Gwydir Environmental Contingency Allowance Operations Advisory Committee, Moree, NSW. (August)
Project presentations
Managing Lower Gwydir environmental flows 142
Peter Berney, Glenn Wilson & Darren Ryder. Investigating the impacts of an altered flow regime on the floodplain vegetation of the Lower Gwydir Wetlands. 2007 School of Environmental and Rural Science Post-graduate student conference, Coffs Harbour, NSW. (July) Peter Berney, Glenn Wilson & Darren Ryder. Gwydir Wetlands: Environmental flows, grazing and biodiversity. 2007 Cotton CRC Conference, Narrabri, NSW. (August) Peter Berney, Glenn Wilson & Darren Ryder. Vegetation response to an environmental flow in the Lower Gwydir Wetlands, NSW. 2007 Ecological Society of Australia conference, Perth, WA. (November)
2008 Peter Berney. Managing environmental flows in an agricultural landscape: the Lower Gwydir floodplain. Vegetation dynamics in response to the wetting regime and grazing. Project Steering Committee meeting 2, Moree, NSW. (February) Tobias Bickel, Glenn Wilson & Julia Sisson. Managing environmental flows in an agricultural landscape: the Lower Gwydir floodplain. Water chemistry, invertebrates and fish. Project Steering Committee meeting 2, Moree, NSW. (February) Glenn Wilson. Fish, river flows and floodplain wetlands in the northern Murray-Darling Basin. University of New England School of Environmental and Rural Science, Armidale, NSW. (June) Glenn Wilson. Introduction to the Forum. The Lower Gwydir: Surface Flows and the Ecology of Streams and Wetlands. A Forum to Inform the Local Community and Guide Management. Moree, NSW. (July) Peter Berney, Glenn Wilson & Darren Ryder. Vegetation in the Lower Gwydir Wetlands: the relative influence of flooding and grazing. The Lower Gwydir: Surface Flows and the Ecology of Streams and Wetlands. A Forum to Inform the Local Community and Guide Management. Moree, NSW. (July) Tobias Bickel, Glenn Wilson & Julia Sisson. Managing environmental flows in the Lower Gwydir: invertebrates, fish and water quality. The Lower Gwydir: Surface Flows and the Ecology of Streams and Wetlands. A Forum to Inform the Local Community and Guide Management. Moree, NSW. (July) Wendy Merritt*, Sue Powell* & Glenn Wilson. Vegetation in the Lower Gwydir Wetlands: the relative influence of flooding and grazing. The Lower Gwydir: Surface Flows and the Ecology of Streams and Wetlands. A Forum to Inform the Local Community and Guide Management. Moree, NSW. (July) *Australian National University. Jeff Kelleway*, Debashish Mazumder**, Yoshi Kobayashi*, Lisa Knowles*, Neil Saintilan* & Glenn Wilson. Using stable isotopes to construct aquatic food webs of the Lower Gwydir Wetlands. The Lower Gwydir: Surface Flows and the Ecology of Streams and Wetlands. A Forum to Inform the Local Community and Guide Management. Moree, NSW. (July) *NSW
Project presentations
Managing Lower Gwydir environmental flows 143
Department of Environment and Climate Change. **Australian Nuclear Science and Technology Organisation. Glenn Wilson, Tobias Bickel, Peter Berney & Julia Sisson. Managing environmental flows in an agricultural landscape: The Lower Gwydir floodplain. The Water Group, Australian Government Department of the Environment, Water, Heritage and the Arts, Canberra, ACT. (August) Glenn Wilson, Tobias Bickel, Peter Berney & Julia Sisson. Managing environmental flows in an agricultural landscape: The Lower Gwydir floodplain. The Fenner School of Environment and Society, The Australian National University, Canberra, ACT. (August) Glenn Wilson, Tobias Bickel & Julia Sisson. Environmental Flow Releases – effects on the Lower Gwydir fish community. Australian Society of Fish Biology Conference and Workshop, Sydney, NSW. (September) Tobias Bickel, Glenn Wilson & Julia Sisson. Managing environmental flows in an agricultural landscape: The Lower Gwydir floodplain. Cotton Catchment Communities CRC Science Forum, Narrabri, NSW. (October) Peter Berney, Glenn Wilson & Darren Ryder. The impact of flows and grazing on plant communities in the Gwydir Wetlands. Cotton CRC 2008 Conference, Narrabri, NSW. (October) Glenn Wilson, Jennifer Spencer and Elizabeth Heagney. Responses of fish and waterbirds to flow variability in the Gwydir wetlands. Conference on Ecological Response Modelling in the Murray-Darling Basin, Sydney, NSW. (November) Glenn Wilson, Tobias Bickel, Peter Berney & Julia Sisson. Ecological responses to flow variability in the Lower Gwydir terminal wetland system, Australia’s northern Murray-Darling Basin. Harry Oppenheimer Okavango Research Centre, Maun, Botswana. (November) Peter Berney, Glenn Wilson & Darren Ryder. The impact of flooding and grazing on plant communities in the Gwydir wetlands. 2008 Ecological Society of Australia conference, Sydney, NSW. (December)
2009 Peter Berney. Recent research on the impacts of grazing in wetlands. Wetland grazing field day, Moree, NSW. (February) Peter Berney, Glenn Wilson & Darren Ryder. A temporal comparison of the influence of flows and grazing on vegetation communities in the Gwydir Wetlands, NSW, Australia. International Conference on Implementing Environmental Water Allocations, Port Elizabeth, South Africa. (February) Glenn Wilson & Peter Berney. Delivering multi-objective environmental flows into terminal floodplain wetlands, northern Murray-Darling Basin, Australia. International Conference on Implementing Environmental Water Allocations, Port Elizabeth, South Africa. (February)
Project presentations
Managing Lower Gwydir environmental flows 144
Glenn Wilson. Recent research on responses to flow variability and environmental-flows in the Lower Gwydir wetlands, 2006 – 2009. Murray-Darling Basin Authority – Native Fish Strategy Community Reference Panel, Glenlyon Dam, NSW. (May) Peter Berney. Influence of flooding and competition on the dominance of water couch and lippia in floodplain wetland communities. Cotton CRC Science Forum, Narrabri, NSW. (August) Peter Berney. Responses of wetland plant communities to grazing. A summary of long-term grazing exclosures in the Gwydir Wetlands. NSW DPI wetland plants/grazing field day, “Bunnor”, NSW. (August)
Project outputs and conference abstracts
Managing Lower Gwydir environmental flows 145
Appendix 2 Project outputs and conference abstracts Underlined names refer to speaker of multi-author talks. Some presentations were from other projects but that used substantial samples or information from the present study and, accordingly, included staff from the present project as co-authors. In such cases, the names of staff from the present study have been bold-font highlighted.
Project Newsletter No. 1
Project outputs and conference abstracts
Managing Lower Gwydir environmental flows 146
Project Newsletter No. 2

Project outputs and conference abstracts
Managing Lower Gwydir environmental flows 147
University of New England School of Environmental and Rural Science ‘UNTAMED 2007’ Postgraduate Student conference, Coffs Harbour, NSW, July 2007 Investigating the impacts of an altered flow regime on the floodplain vegetation of the Lower Gwydir wetlands Peter Berney, Glenn Wilson & Darren Ryder Ecosystem Management, University of New England, Armidale NSW 2351 The Lower Gwydir Wetlands are a series of terminal wetlands on the Gwydir River in northern New South Wales. The wetlands have traditionally been renowned for their large bird breeding colonies. Since the completion of Copeton Dam in 1976, flows in the Gwydir River have been regulated. The storage of water to meet the needs of the irrigated agriculture industry that has developed has resulted in greatly reduced flows into the wetlands. An environmental contingency allowance (ECA) has now been set aside in the water sharing plan to help support and maintain key ecological processes in the wetlands. A major challenge facing pastoralists and environmental managers in the Lower Gwydir Wetlands is to understand how the altered hydrologic regime has impacted on wetland vegetation. In addition there are questions about how to effectively use the ECA water allowance to enhance wetland values. My PhD focuses on three issues in an attempt to provide answers to questions about long-term changes in the floodplain plant communities and how flow regime and grazing influence vegetation dynamics. To investigate temporal and spatial changes in plant community structure a series of permanent transects initially set up in 1992 will be re-monitored on a seasonal basis and current data will be analysed in conjunction with past unpublished data from these sites. Temporal grazing impacts have been similarly monitored over an extended period using a series of grazing exclosures located in plant communities experiencing differing inundation regimes. These will also be monitored to investigate how grazing intensity influences plant community assemblages. Vegetation response to various inundation regimes will be investigated using detailed gradient analysis to determine how key native and exotic species respond to varying depth and duration of inundation along the moisture gradient between the core wetland and terrestrial plant communities on the floodplain.
Project outputs and conference abstracts
Managing Lower Gwydir environmental flows 148
2007 Cotton CRC Conference, Narrabri, NSW, August 2007 Gwydir wetlands: Environmental flows, grazing and biodiversity Peter Berney, Glenn Wilson & Darren Ryder Ecosystem Management, University of New England, Armidale NSW 2351 The construction of Copeton Dam has facilitated the development of irrigated agriculture on the floodplain of the Lower Gwydir River, west of Moree. While diverting water to agriculture has produced substantial economic benefits in the region, it has resulted in significant alterations to the hydrological regime in the Gwydir wetlands, an important colonial bird breeding site in the area. The reduced water flow into the wetlands has resulted in a decline in both their extent and condition. In addition there have been negative impacts on the grazing enterprises in the area that have traditionally relied on floodplain inundation to enhance feed quality. Another issue of concern is the Gwydir wetlands have four RAMSAR listed sites located on private holdings and these need to be maintained for the values for which they were listed. Part of the response to ameliorating the impacts of the altered flow regime in the wetlands has been the release of water in environmental flows in order to sustain a range of wetland ecosystem processes and thereby maintain biodiversity. This project aims to enhance our understanding of the vegetation dynamics of the Gwydir wetlands by studying how vegetation responds to environmental flows and flooding regimes and how grazing influences this response. Vegetation surveys have been conducted at a series of sites where long-term data sets are available in order to track the spatial and temporal changes in wetland communities over time in response to wetting and drying cycles. Long-term grazing trials have also been surveyed to measure how the vegetation responds to a range of grazing regimes from unrestricted access to no grazing. Over the coming summer a detailed analysis of vegetation response across the moisture gradient from core wetland to high floodplain will be undertaken to investigate how plant communities respond to depth and duration of inundation and to various grazing regimes.
2007 Ecological Society of Australia Conference, Perth, WA, November 2007 Vegetation response to an environmental flow in the Lower Gwydir wetlands, NSW Peter Berney, Glenn Wilson & Darren Ryder Ecosystem Management, University of New England, Armidale NSW 2351 Environmental flows are a means of ameliorating the impacts of altered flow regimes in regulated rivers by stimulating flow dependent ecological processes. The Gwydir wetlands are an inland terminal wetland system located west of Moree in northern New South Wales. Currently the impacts of environmental flows in the Gwydir wetlands are poorly understood. The aim of this study was to investigate the response of the vegetation in floodplain wetlands along the Gingham channel in the Gwydir wetlands to an environmental flow released in April
Project outputs and conference abstracts
Managing Lower Gwydir environmental flows 149
2007. The study used a multiple before-after-control-impact (MBACI) design to detect responses in the vegetation to inundation from the environmental flow. Wetlands were surveyed once before and twice after the flow. Results showed a significant increase in species richness at some of the impacted compared to control sites. While increases in percentage cover of amphibious functional groups of macrophytes were measured, they were not found to be statistically significant. Only one species, Ranunculus undosus was observed to flower. Two factors appear to have contributed to these results. The first factor was seasonal weather conditions. Shortly following the conclusion to the environmental flow cold winter conditions set in which limited the growth rate of many plant species, especially the dominant native species of grass (Paspalum distichum) which showed low tolerance to frost. The second factor was the influence of grazing by livestock. Along sampling transects there was a high incidence of pugging, indicating livestock tended to congregate in the wetted areas where they grazed on new growth but also damaged vegetation by trampling. This study indicates that a more effective vegetative response would be achieved if timing of the flow is in the warmer months of the year and if grazing pressure is reduced during and immediately after the environmental flow in order to allow germinating species sufficient time to complete their lifecycle and set seed.
The Lower Gwydir: Surface Flows and the Ecology of Streams and Wetlands. A Forum to Inform the Local Community and Guide Management. Moree, NSW, July 2008 (1) The Lower Gwydir Community Forum: Introduction and scope Glenn Wilson Ecosystem Management, University of New England, Armidale NSW 2351 Water management in the Murray-Darling Basin (MDB) is steadily rising in the Australian public’s awareness. Media stories on the basin’s water are becoming more frequent, and there is a growing expectation that water allocation and use will be managed carefully and from an appropriate knowledge base. Overarching issues of climate change and drought suggest that this public exposure will remain for some time. However, most media reports on the Murray-Darling focus almost solely on the River Murray and associated southern catchments. With few exceptions, little distinction is made between northern and southern regions of the basin, and most comments on northern catchments relate to their potential (or otherwise) to contribute to River Murray flows. Yet, northern catchments possess intrinsic features that make them and the region of great interest in their own right. The flow seasonality of northern river systems, fed predominately by summer monsoonal rainfall, differs significantly from that of catchments such as the Murray whose peak flow periods are largely driven by snow melt. Similarly, extensive terminal wetlands are a more prominent feature of northern floodplain rivers than southern catchments, increasing the complexity of planning and delivering environmental flows along the entire system. These factors underpin the need for agencies and the region’s
Project outputs and conference abstracts
Managing Lower Gwydir environmental flows 150
communities to have access to sound local scientific knowledge on which to base flow management of northern rivers. Historically, there has been far less research undertaken on northern MDB catchments than southern areas, but this imbalance is improving. The Lower Gwydir floodplain is a particular case in point, where a significant body of recent work has built upon earlier agency monitoring programs in an attempt to understand aquatic ecological responses to flow variability. Critically, there has been a parallel recognition that such river systems must be viewed as an integrated channel-wetland complex, and that addressing the flow requirements of both floodplain and in-stream ‘patches’ is necessary to ensure ecosystem functioning. The current management of environmental flows into the Lower Gwydir is through advice from the Enivonmental Contingency Allowance stakeholder advisory committee. While this body needs clear information on this ecosystem in a usable form, a broader suite of agency groups as well as the local community also need to understand the ramifications of any flow decisions. It is for this reason that the Lower Gwydir Community Forum has been established. Its primary objective is to give the Moree community, Lower Gwydir landholders and relevant managers an opportunity to learn about individual projects, how these complement each other, and ways in which the findings can contribute to management of the catchment’s rivers and wetlands. Speakers have been chosen to represent as wide a coverage of recent research as possible on this ecosystem, including a sequence from upstream down into the wetlands themselves, and a mix of short and longer-term patterns. (2) Managing environmental flows in the Lower Gwydir – invertebrates, fish and water quality Tobias O. Bickel*, G. Glenn Wilson & Julia L. Sisson Ecosystem Management, University of New England, Armidale NSW 2351; Cotton Catchment Communities Cooperative Research Centre, Narrabri NSW 2390 Profound changes to the flow regime of most rivers of the Murray-Darling Basin are partly responsible for declines in water quality and aquatic invertebrates and native fish assemblages. The timing and magnitude of floods can play a crucial role in sustaining the in-stream biota and the hydraulic integrity of the rivers. To ameliorate the negative impacts of river regulation, environmental contingency allowances (ECA) are released to mimic natural flow patterns with the aim of improving riverine ecosystems. We researched water chemistry, invertebrate and fish assemblages in the Lower Gwydir system over two years to assess the effectiveness of ECAs to improve ecological variables. We particularly hypothesised that ECA releases would improve water quality, enhance invertebrate assemblages and increase fish recruitment and diversity. However, flow events did not always improve water quality. Other factors such as season, land use and run-off patterns seem to have a considerable affect on water quality as well. Benthic invertebrate (particularly zooplankton) assemblages appeared to be mainly shaped by seasons, and there was no consistent response to ECA flow events.
Project outputs and conference abstracts
Managing Lower Gwydir environmental flows 151
There were distinct fish communities between sites and rivers, with an upstream-downstream pattern evident in each stream. Habitat quality was thought to be a major factor explaining the structure of fish assemblages. Because of the complicated hydrographs, effects of hydrology were difficult to assess. ECAs and other high flow events had no consistent effect on fishes, although links between flow rises and spawning activity was implicated in some cases. However, abundances of the dominant fish species increased after periods of increased median flow, suggesting that flows were playing a role in the recruitment of some fishes. These findings have direct implication to the management of the Lower Gwydir. Water quality issues have to be assessed on a catchment scale and need to include run-off, seasonal and land use variables. The dependence of native fishes on habitat quality indicates that the restoration of flows alone might not suffice to improve native fish populations. (3) Vegetation in the Lower Gwydir Wetlands: the relative influence of flooding and grazing Peter Berney*, Glenn Wilson & Darren Ryder Ecosystem Management, University of New England, Armidale NSW 2351; Cotton Catchment Communities Cooperative Research Centre, Narrabri NSW 2390 The University of New England established a long-term study into the effects of grazing on Lower Gwydir wetland plants in 1994. Plots comprising three treatments (full grazing pressure, grazing by native herbivores and feral animals only, and complete exclusion of all grazing animals) were set up at four sites across the Gwydir and Gingham wetlands. Subsequent monitoring of the plant communities at each plot over a range of inundation conditions has allowed a comparison of the relative effects of grazing and flooding on plant abundances and species diversity. The pattern of change in plant community composition over time indicated that inundation regime is the most important factor shaping the species composition and abundance of the extant vegetation. In contrast, grazing by domestic livestock and native herbivores had little long-term impact at most sites. Rather, grazing impacts tended to be more evident over shorter time scales, such as the dry period inbetween flood events. Following periods of inundation, a wide range of species are represented in the plant community. During the ensuing dry period, species tolerant to grazing tend to persist the longest. In late 2007, soil cores were also collected from each grazing treatment site to conduct a seed-bank germination trial. Species composition and abundance were recorded for seeds germinating from the soil samples and a comparison made with the composition of the standing vegetation at the site when the samples were collected. A species-rich seed bank existed in the soil at each site. However, there were no significant differences in abundance of germinating seeds between grazing treatments. By contrast, wetter sites had significantly more germinants than drier sites. In a comparison of species richness, plots open to grazing by native herbivores and feral animals had a significantly higher species diversity of germinating seeds than either the full grazing pressure and total grazing exclusion treatments. The response of wetland plants to grazing appears to be influenced by site productivity. At wetter sites, removal of grazing can allow more grazing-sensitive species to flourish and a

Project outputs and conference abstracts
Managing Lower Gwydir environmental flows 152
successional pattern take place resulting in a plant community dominated by tall herbaceous species. However at drier sites, removal of grazing has less impact in both the short and long term. It also indicated that an intermediate level of site disturbance promotes maximum diversity in the seed bank which is important in ensuring the wetlands retain the capacity into the future to recover from disturbances due to either hydrological pattern or grazing. (4) Prototype decision support system for environmental flows to the Gwydir Wetlands Wendy Merritt*,1, Sue Powell1 & Glenn Wilson2 1 Integrated Catchment Assessment and Management (iCAM) centre, The Fenner School of Environment and Society, the Australian National University, Acton, ACT, 0200 2 Ecosystem Management, University of New England, Armidale NSW 2351 A prototype decision support system (DSS) is being developed for the NSW Department of Environment, Climate Change and Water, to inform management of environmental flows for the Gwydir wetlands. A DSS is usually a computer-based tool that allows users to explore ‘what-if’ questions or alternate options for managing a system of interest. DSSs have three main components:
· Data Base – numeric and qualitative information that help users familiarise themselves with the study system and to explore the impacts of different management options.
· Model Base – the models used to manipulate data and generate output from user-defined actions. Data stored in the data base are input to, or created by, the model base.
· Interface – the DSS interface allows users to easily navigate through the tool, run the models and view outputs. The interface is kept separate from the model base to facilitate the use of the tool by users who are not familiar with programming and computer models.
The project will deliver a prototype DSS that will explore the ecological outcomes of a range of flow and climate scenarios. The Gwydir DSS will allow users to access a structured database of ecological water requirements of the wetlands, past events and outcomes. It will link a spatially distributed flood model to fish response and vegetation response (e.g. the depth and duration of flooding required to maintain the health of core wetlands). The prototype will include a relatively simple inundation model that will be replaced by a more detailed hydrological model of the wetlands in future versions of the DSS. Other important aspects of the ecology of the Gwydir wetlands will be included in the full DSS development.
Project outputs and conference abstracts
Managing Lower Gwydir environmental flows 153
(5) Using stable isotopes to construct aquatic food webs of the Lower Gwydir Wetlands Jeff Kelleway*1, Debashish Mazumder*2, Yoshi Kobayashi1, Lisa Knowles1, Neil Saintilan1 & Glenn Wilson3 1Rivers and Wetlands Unit, NSW Department of Environment and Climate Change, Goulburn St, Sydney 2Australian Nuclear Science and Technology Organisation, Lucas Heights NSW 2234 3Ecosystem Management, University of New England, Armidale NSW 2351 Stable isotope techniques are being used to gain an understanding of the food web structure of the Lower Gwydir Wetlands and identify the influence of environmental flows on the trophic ecology. Benthic sediment organic matter, macrocrustaceans and fish species were sampled across the Gingham, Gwydir and Mehi watercourses. Carbon and Nitrogen isotopes were analysed as they reflect the major sources of energy driving aquatic food webs, and allow for the trophic position of each species to be assessed and compared. Sampling across the three watercourses and the Baroona waterhole in March 2007 provided a snapshot of the trophic dynamics of the Lower Gwydir Wetlands in relatively dry conditions. Results of this survey include the identification of benthic sediment organic matter (SOM) as an important base resource for the food webs. Differences were also detected in the overall trophic structure and within-species feeding habits between locations. Further sampling was undertaken in May 2007 following an environmental flow release in the Gingham watercourse with an aim to compare these to pre-flow trophic structure. We observed a marked shift in the isotopic values of SOM and the carnivorous fish species spangled perch (Leiopotherapon unicolor) after the environmental flow. These changes indicate that the environmental flow caused both the trophic resource base and overall food web structure to expand considerably. This is of particular importance to higher trophic-level species such as spangled perch – which, prior to the flow was forced to compete at a lower level with species already occupying this niche. Long-term monitoring of the key ecosystem components is necessary to understand the influence of water management, including environmental flow releases on food web structure and follow-on effects to ecosystem processes. Without this, it is difficult to accurately assess the ecosystem conditions, to identify trends, or to develop and evaluate effective management strategies.
Project outputs and conference abstracts
Managing Lower Gwydir environmental flows 154
Australian Society for Fish Biology Conference. Bondi, NSW, September 2008 Environmental Flow Releases – Effects on the Lower Gwydir Fish Community Glenn G Wilson1, Tobias O Bickel2, Julia L Sisson3 1Ecosystem Management, University of New England, Armidale, NSW, Australia, [email protected] 2Ecosystem Management, University of New England, Armidale, NSW, Australia, [email protected] 3Ecosystem Management, University of New England, Armidale, NSW, Australia The profound changes to the hydro-regimes of most rivers of the Murray-Darling Basin (MDB) are partly responsible for the decline in native fish populations. The timing and magnitude of floods can play a crucial role in native fish recruitment. To ameliorate the negative impacts of river regulation, environmental contingency allowances (ECA) are released in parts of the MDB to mimic natural flow patterns with the hope of improving riverine ecosystems and ultimately to restore native fish communities. We researched the response of fish assemblages in the Lower Gwydir system over two years to assess the effectiveness of ECA’s to improve native fish recruitment. Particularly, we hypothesized that ECA releases would increase fish recruitment and diversity in the Lower Gwydir system. Spatial variables seemed to explain more of the variability in the fish assemblages than temporal ones. Furthermore, the diversity and structure of fish assemblages was closely associated with habitat quality. ECA’s and other high flow events (bank full discharge) seemed to have only minor effects on the fish assemblages. However, there was a strong increase in fish numbers in the second year, coinciding with increased median flows. This suggests that stable base flows might be more beneficial to the recruitment of some fishes than high flow events. These findings have direct implication to the management of native fish populations in the MDB. The limitation of native fishes by habitat quality shows that the restoration of flows alone might not achieve the desired outcome to improve native fish populations.
Project outputs and conference abstracts
Managing Lower Gwydir environmental flows 155
Proceedings, Conference on Ecological Response Modelling in the Murray-Darling Basin, Sydney, NSW, November 2008 (1) Responses of fish and waterbirds to flow variability in the Lower Gwydir wetlands Wilson, G.G. a*, Spencer, J.A. b & Heagney, E.C.c a Cotton Catchment Communities Cooperative Research Centre, Ecosystem Management, School of Environmental and Rural Science, University of New England, Armidale, NSW 2351, Australia. [email protected] b Rivers and Wetlands Unit, New South Wales Department of Environment and Climate Change, 59-61 Goulburn St, Sydney, NSW 2000, Australia. c School of Biological, Earth and Environmental Science, University of New South Wales, Sydney, NSW 2052, Australia. Abstract The Gwydir floodplain contains internationally significant wetlands which support threatened wetland plants, native fish and colonial waterbirds. However, development of upstream water resources for irrigated agriculture in the 1970s decreased the magnitude, frequency and duration of flooding in this lowland river ecosystem. While environmental water allocations have been used to supplement flows into the Gwydir wetlands, a greater understanding of the water requirements of native fish and colonial waterbirds is needed to predict their responses under alternative flow management scenarios. Here we review responses of fish and colonial waterbirds to flow variability in the Gwydir wetlands using a mix of historical data, contemporary field surveys and otolith-based analyses. Channels in the wetlands support a suite of fish species typical of lowland Murray-Darling river systems, with consistent compositional differences between distributary channels. Relationships between discharge and fish assemblage structure following recent environmental water releases and other flows (2006-2009) were inconsistent over time. In contrast, spatial differences in juvenile growth rate were inversely related to total discharge during the spawning/hatch and larval-juvenile periods (Australian smelt, Retropinna semoni; bony bream, Nematalosa erebi), but positively related to flow variance throughout the same period (Australian smelt). Flow regulation has also impacted the frequency of large colonial waterbird breeding events. The Gwydir wetlands were regionally-significant for at least 18 colonial waterbird species, although no significant events have been observed since 2005. Historically, the size of breeding events was positively related to cumulative discharge during summer months (October–March, 1988-2008) with discharge of at least 200,000 ML needed to trigger significant breeding in straw-necked ibis (Threskiornis spinicollis). During recent surveys (2007-2008), most of the Gwydir wetlands were dry and few colonial waterbirds were recorded. There is evidence that managed flows can be used successfully to augment smaller natural events to prolong the spawning/breeding season of fish and birds. However, natural flooding appears vital for maintaining long-term wetland health.

Project outputs and conference abstracts
Managing Lower Gwydir environmental flows 156
(2) Using isotopic techniques to assess trophic structure in northern Murray-Darling Basin wetlands Jeff Kelleway1, Debashish Mazumder2, G. Glenn Wilson3 and Tsuyoshi Kobayashi1* 1 Rivers and Wetlands Unit; Department of Environment and Climate Change NSW 2 Australian Nuclear Science and Technology Organisation 3 School of Environmental and Rural Science; University of New England, Armidale, NSW 2351 Abstract Floodplain wetlands provide habitats for diverse organisms including aquatic plant communities, nekton and waterbirds, and perform important ecosystem functions. These wetlands rely on floodwaters mobilising floodplain resources such as carbon and nutrients which are used by various organisms directly and indirectly through trophic linkages. Understanding these trophic linkages within food webs is essential for developing ecological models for sustainable management of floodplain wetlands. Stable isotope analysis has emerged as an important technique in food web research. The technique essentially involves tracing ratios of isotopes, usually carbon (13C/12C) and nitrogen (15N/14N), through an ecosystem, or food web components. This chapter outlines the utility of stable isotope techniques in food web research in the northern Murray-Darling Basin, discusses some of the challenges, and explains some of the methods that have been developed to overcome such challenges. Studies using stable isotope approaches have contributed to our understanding of Australian freshwater food webs, particularly in identifying the sources of production sustaining floodplain food webs and the trophic status of functionally significant aquatic fauna. Three case studies of research carried out in the Gwydir Wetlands and Macquarie Marshes of the northern Murray-Darling Basin are presented. These studies highlight the spatial and temporal variability of food web structure in floodplain wetlands and the importance of environmental flow allocation to ecosystem functionality.

Project outputs and conference abstracts
Managing Lower Gwydir environmental flows 157
2008 Ecological Society of Australia Conference, Sydney, NSW, December 2008 The impact of flooding and grazing on plant communities in the Gwydir wetlands Peter Berney, Glenn Wilson & Darren Ryder Ecosystem Management, University of New England, Armidale NSW 2351 The practice of livestock grazing in wetlands has been reported to cause degradation, especially in parts of the southern Murray-Darling Basin (MDB), but there has been little study on grazing impacts on the wetlands in the northern region of the catchment. This study reports on the impact of 14 years of grazing exclusion in four plant communities in the Gwydir wetlands, a major wetland system in the MDB in northern New South Wales. Three treatments were implemented, namely (1) unfenced plots, (2) plots excluding cattle while allowing access for kangaroos, feral pigs and foxes, and (3) plots excluding all mammalian herbivores and feral animals. We have found that responses to grazing varied from site to site. At sites that receive regular flooding, generally annually, grazing can reduce competition from dominant species and promote increased plant diversity. However, it can also reduce abundance of grazing-sensitive species, typically with tall growth forms and soft fleshy leaves, resulting in the dominance of more grazing-tolerant species such as Paspalum distichum and an associated reduction in diversity. At less frequently flooded sites, one year in four, removal of grazing has less pronounced impacts on plant community composition, with changes driven by other factors such as seasonal conditions. In a soil seed-bank study, germinant species diversity was significantly higher from sites with an intermediate level of disturbance under the above treatment 2 at three of the four wetland sites. This research indicates that responses to grazing in these wetlands are complex and strongly influenced by site productivity.
Project outputs and conference abstracts
Managing Lower Gwydir environmental flows 158
Proceedings, International Conference on Implementing Environmental Water Allocations, Port Elizabeth, South Africa, February 2009
A TEMPORAL COMPARISON OF THE INFLUENCE OF FLOWS AND GRAZING ON VEGETATION COMMUNITIES IN THE GWYDIR
WETLANDS, NSW, AUSTRALIA
Berney, P., Wilson, G. G, and Ryder, D
School of Rural and Environmental Science, University of New England, Armidale, NSW, Australia Abstract Floodplain plant communities in Australia’s Murray Darling Basin are dynamic in nature, showing high levels of spatial heterogeneity and temporal variability. Typical of floodplain ecosystems in many semi-arid regions, their ecology is characterized by pulses of productivity, driven by inundation patterns following river flooding. However, river regulation has significantly altered the flow regime of almost all major rivers in the Murray-Darling Basin, holding back floodwaters and consequently reducing the frequency, duration and spatial extent of floodplain inundation. While environmental flows have been introduced as a means of ameliorating the impacts of river regulation and supporting wetland ecological processes, other land use factors may potentially diminish any benefits. Grazing of domestic livestock, particularly cattle, has taken place on many of these floodplains for over 160 years. In conjunction with flooding and drought, grazing may be one of the most important agents of disturbance that shape floodplain plant communities. This study examined three wetland plant communities in the Gwydir Wetlands in New South Wales, Australia, where long-term trials have investigated whether grazing by domestic and native herbivores alter the response of vegetation to natural flooding and environmental flows. The pattern of change in plant community composition over time indicated that inundation regime is the most important factor shaping the distribution and abundance of extant vegetation. In contrast, grazing by domestic livestock and by native herbivores had a relatively minor impact. At sites where environmental water allocations resulted in wetland inundation, changes in plant community composition occurred across all grazing treatments. These changes mirrored the responses seen following major floods, dominated by pronounced increases in the cover of amphibious species and a concomitant decline in cover of terrestrial species. Significant differences between plots open and closed to grazing mostly occurred during dry periods between flood events. While grazing can influence species composition in the in the short-term, inundation from both natural flooding and environmental flows plays a far more significant role over the long-term in shaping wetland plant assemblages. INTRODUCTION The Gwydir Wetlands are an extensive series of lowland distributary channels, wetlands and floodplain woodlands located at the end of the Gwydir River in northern New South Wales, Australia (Fig.1). The wetlands are renowned as a site for bird breeding and a total of 823 ha across four private properties were listed as wetlands of international significance under the Ramsar Convention in 1999. The
Project outputs and conference abstracts
Managing Lower Gwydir environmental flows 159
wetlands have also supported a grazing industry for a period of 160 years. The Gwydir River has been regulated since 1976 through the construction of Copeton Dam, 120 km upstream of the wetlands. The resulting increased security in water supply allowed a large-scale irrigated agriculture industry to develop on the flat alluvial floodplains, growing crops such as cotton in summer and cereals in winter (Keyte 1994). Although initially 55 000ha of irrigation licences were to be issued, a total of 86 000 ha of irrigation licences were actually issued in the years following construction of Copeton Dam, allowing up to 530 000 ML year-1 to be supplied from the dam or be pumped into off-river storages from unregulated flows (Keyte 1994; Kingsford 2000). This has resulted in reduced river flows reaching the terminal wetlands and a subsequent decrease in the extent and duration of flooding. Over time, the impact of reduced wetland flooding has caused changes in floristic composition, with an increase in presence of terrestrial taxa and an increase in the presence of the invasive introduced species lippia Phyla canescens (McCosker 1994). Meanwhile, graziers have reported reduced pasture productivity and carrying capacity in many of their wetland paddocks (McCosker & Duggin 1993). Strategies to address the problems of over allocation of water to irrigated agriculture focussed on achieving a more equitable balance of water use amongst the various stakeholders through State Government brokered Water Sharing Plans and recognition of the environment as a legitimate user of water. In addition to regulations limiting the amount of pumping from unregulated flows, an environmental water allocation was created to support particular ecological objectives such as water hyacinth Eichhornia crassipes control or maintain water levels during colonial bird breeding events (NSW Dept of Sustainable Nat. Res. 2003). The value of this ecological use for water has been challenged by some stakeholders in the water debate on the grounds that intended ecological benefits are diminished because of the impact of cattle grazing in the wetlands. In 1994, a study was commenced by the University of New England to monitor how vegetation responds to inundation patterns and how various grazing strategies influence this response. This paper reports on changes to vegetation community composition using three different grazing treatments following a series of flow events including natural floods and environmental water allocations. METHODS Study sites and inundation history – Gwydir Wetlands To assess the impacts of grazing on the Gwydir wetlands, data were collected from three sites across the wetlands with differing plant communities (Fig 1). The sites chosen were as follows: Old Dromana - Bolboschoenus fluviatilis (marsh club-rush) reed bed (29° 20' 46" S, 149° 17' 38" E)
near the downstream end of the Gwydir River system;
Westholme - Paspalum distichum (water couch) open meadow (29° 15' 45" S, 149° 23' 19" E) mid-way along the Gingham watercourse; and
Crinolyn - a degraded Paspalum distichum community, partially invaded by Phyla canescens (lippia)
(29° 12' 53" S, 149° 08' 13" E) near the terminal point of the Gingham Watercourse. Old Dromana and Westholme have experienced regular inundation, typically every 1-2 years and are considered examples of productive sites in terms of annual biomass production. By contrast, Crinolyn is at the western end of the Gingham watercourse and has traditionally experienced less frequent

Project outputs and conference abstracts
Managing Lower Gwydir environmental flows 160
Figure 1. Gwydir River catchment in northern New South Wales, Australia with location of study sites indicated
by arrows. inundation. In recent decades, it has experienced a marked reduction in the frequency and duration of flooding. Productivity at this site is less than at the other two sites. The sites were originally established by May 1994, and follow a randomised complete block design. At each site, there are four replicate blocks with each of the three treatments randomly allocated one to a plot within each block (Fig. 2). The three treatments used were: OPEN - total grazing pressure, with plots to remain unfenced and unmarked;
PARTIAL - partial grazing pressure, surrounded by cattle-proof fences to only exclude cattle while allowing access by macropods and pigs; and
CLOSED - total exclusion of all mammal herbivores.
Crinolyn
Westholme
Old Dromana
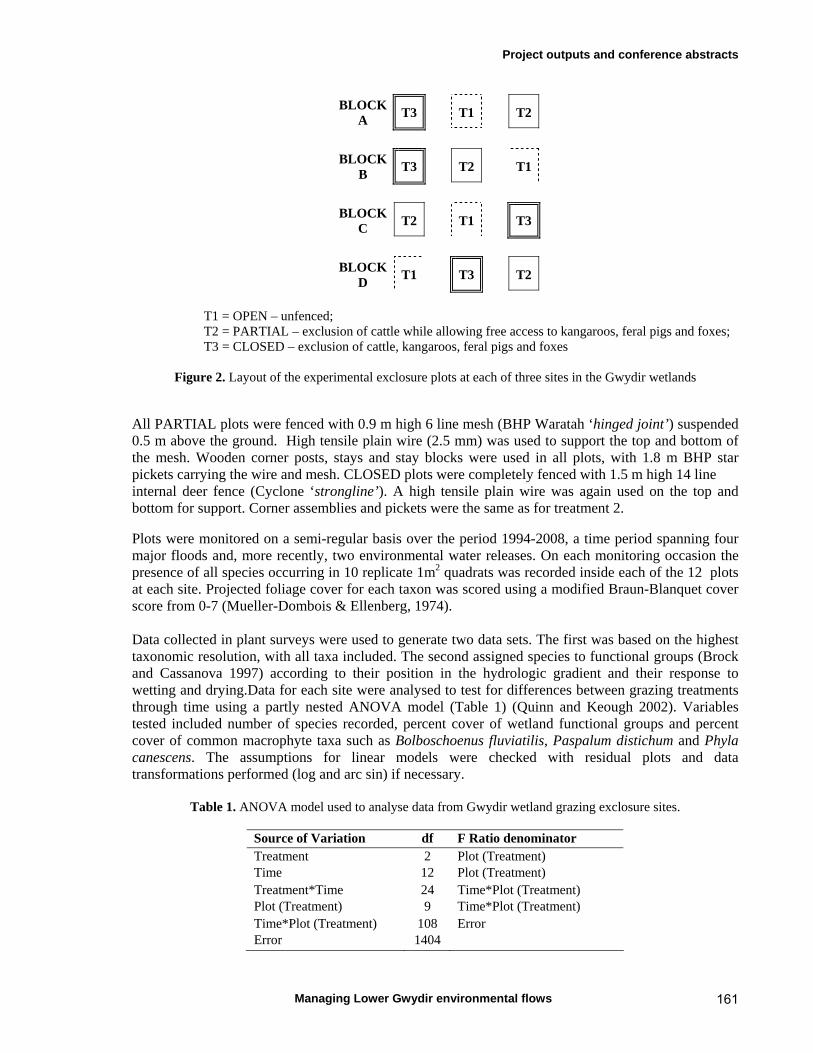
Project outputs and conference abstracts
Managing Lower Gwydir environmental flows 161
BLOCK A
T3 T1 T2
BLOCK B
T3 T2 T1
BLOCK C
T2 T1 T3
BLOCK D
T1 T3 T2
T1 = OPEN – unfenced; T2 = PARTIAL – exclusion of cattle while allowing free access to kangaroos, feral pigs and foxes; T3 = CLOSED – exclusion of cattle, kangaroos, feral pigs and foxes
Figure 2. Layout of the experimental exclosure plots at each of three sites in the Gwydir wetlands
All PARTIAL plots were fenced with 0.9 m high 6 line mesh (BHP Waratah ‘hinged joint’) suspended 0.5 m above the ground. High tensile plain wire (2.5 mm) was used to support the top and bottom of the mesh. Wooden corner posts, stays and stay blocks were used in all plots, with 1.8 m BHP star pickets carrying the wire and mesh. CLOSED plots were completely fenced with 1.5 m high 14 line internal deer fence (Cyclone ‘strongline’). A high tensile plain wire was again used on the top and bottom for support. Corner assemblies and pickets were the same as for treatment 2. Plots were monitored on a semi-regular basis over the period 1994-2008, a time period spanning four major floods and, more recently, two environmental water releases. On each monitoring occasion the presence of all species occurring in 10 replicate 1m2 quadrats was recorded inside each of the 12 plots at each site. Projected foliage cover for each taxon was scored using a modified Braun-Blanquet cover score from 0-7 (Mueller-Dombois & Ellenberg, 1974). Data collected in plant surveys were used to generate two data sets. The first was based on the highest taxonomic resolution, with all taxa included. The second assigned species to functional groups (Brock and Cassanova 1997) according to their position in the hydrologic gradient and their response to wetting and drying.Data for each site were analysed to test for differences between grazing treatments through time using a partly nested ANOVA model (Table 1) (Quinn and Keough 2002). Variables tested included number of species recorded, percent cover of wetland functional groups and percent cover of common macrophyte taxa such as Bolboschoenus fluviatilis, Paspalum distichum and Phyla canescens. The assumptions for linear models were checked with residual plots and data transformations performed (log and arc sin) if necessary.
Table 1. ANOVA model used to analyse data from Gwydir wetland grazing exclosure sites.
Source of Variation df F Ratio denominator Treatment 2 Plot (Treatment) Time 12 Plot (Treatment) Treatment*Time 24 Time*Plot (Treatment) Plot (Treatment) 9 Time*Plot (Treatment) Time*Plot (Treatment) 108 Error Error 1404
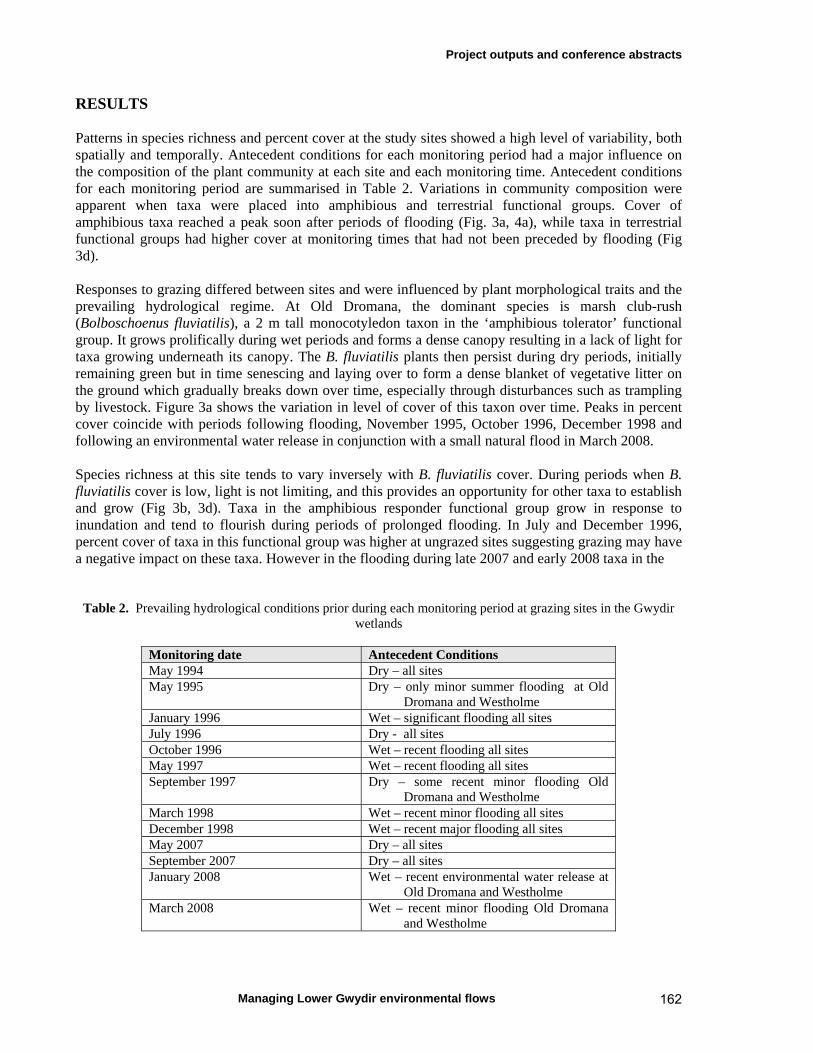
Project outputs and conference abstracts
Managing Lower Gwydir environmental flows 162
RESULTS Patterns in species richness and percent cover at the study sites showed a high level of variability, both spatially and temporally. Antecedent conditions for each monitoring period had a major influence on the composition of the plant community at each site and each monitoring time. Antecedent conditions for each monitoring period are summarised in Table 2. Variations in community composition were apparent when taxa were placed into amphibious and terrestrial functional groups. Cover of amphibious taxa reached a peak soon after periods of flooding (Fig. 3a, 4a), while taxa in terrestrial functional groups had higher cover at monitoring times that had not been preceded by flooding (Fig 3d). Responses to grazing differed between sites and were influenced by plant morphological traits and the prevailing hydrological regime. At Old Dromana, the dominant species is marsh club-rush (Bolboschoenus fluviatilis), a 2 m tall monocotyledon taxon in the ‘amphibious tolerator’ functional group. It grows prolifically during wet periods and forms a dense canopy resulting in a lack of light for taxa growing underneath its canopy. The B. fluviatilis plants then persist during dry periods, initially remaining green but in time senescing and laying over to form a dense blanket of vegetative litter on the ground which gradually breaks down over time, especially through disturbances such as trampling by livestock. Figure 3a shows the variation in level of cover of this taxon over time. Peaks in percent cover coincide with periods following flooding, November 1995, October 1996, December 1998 and following an environmental water release in conjunction with a small natural flood in March 2008. Species richness at this site tends to vary inversely with B. fluviatilis cover. During periods when B. fluviatilis cover is low, light is not limiting, and this provides an opportunity for other taxa to establish and grow (Fig 3b, 3d). Taxa in the amphibious responder functional group grow in response to inundation and tend to flourish during periods of prolonged flooding. In July and December 1996, percent cover of taxa in this functional group was higher at ungrazed sites suggesting grazing may have a negative impact on these taxa. However in the flooding during late 2007 and early 2008 taxa in the
Table 2. Prevailing hydrological conditions prior during each monitoring period at grazing sites in the Gwydir wetlands
Monitoring date Antecedent Conditions May 1994 Dry – all sites May 1995 Dry – only minor summer flooding at Old
Dromana and Westholme January 1996 Wet – significant flooding all sites July 1996 Dry - all sites October 1996 Wet – recent flooding all sites May 1997 Wet – recent flooding all sites September 1997 Dry – some recent minor flooding Old
Dromana and Westholme March 1998 Wet – recent minor flooding all sites December 1998 Wet – recent major flooding all sites May 2007 Dry – all sites September 2007 Dry – all sites January 2008 Wet – recent environmental water release at
Old Dromana and Westholme March 2008 Wet – recent minor flooding Old Dromana
and Westholme

Project outputs and conference abstracts
Managing Lower Gwydir environmental flows 163
(b)
Monitoring time
May
94
May
95
Jan
96Ju
l 96
Oct
96
May
97
Sep
97
Mar
98
Dec
98
May
07
Sep
07
Jan
08M
ar 0
8
No
. S
peci
es
0
2
4
6
8
10
12
14
16
18
20(a)
Monitoring time
May
94
May
95
Jan
96Ju
l 96
Oct
96
May
97
Sep
97
Mar
98
Dec
98
May
07
Sep
07
Jan
08M
ar 0
8
% C
ove
r B
olbo
sch
oen
us f
luvi
atili
s
0
20
40
60
80
100
120
140Time vs Grazed
Time vs Part Grazed Time vs Ungrazed
(c)
Monitoring time
May
94
May
95
Jan
96Ju
l 96
Oct
96
May
97
Sep
97
Mar
98
Dec
98
May
07
Sep
07
Jan
08M
ar 0
8
% C
ove
r A
mp
hib
ious
Re
spo
nde
rs
0
5
10
15
20
25
30 (d)
Monitoring time
May
94
May
95
Jan
96Ju
l 96
Oct
96
May
97
Sep
97
Mar
98
Dec
98
May
07
Sep
07
Jan
08M
ar 0
8
%C
ove
r T
err
est
rial D
amp
0
5
10
15
20
25
30
Figure 3. (a) Mean percent cover (+1SE) of Bolboschoenus fluviatilis, (b) number of species recorded at each monitoring time, (c) mean percent cover (+1SE) amphibious responder taxa and (d) mean percent cover (+1SE) terrestrial damp taxa at Old Dromana, recorded at monitoring times between 1994 and 2008. amphibious responder functional group had a higher percent cover at grazed sites where conditions did not limit light compared with under the litter layer at sites where grazing was excluded (Fig. 3c). Grazing has a major impact on the variability in community composition at Old Dromana. A significant difference in B. fluviatilis cover was detected in September 2007 (F24, 108 = 1.87; P<0.05), with grazed sites having a significantly lower cover but having significantly higher species richness (F24,108 = 11.11; P<0.05). Many of the taxa taking advantage of the reduced level of light competition were other native taxa from the regional species pool such as swamp buttercup Ranunculus undosus and knotweed Persicaria decipiens. Grazing also provided an opportunity for introduced species in the terrestrial damp functional group, such as thistles Cirsium vulgare and Xanthium spinosum, to establish. Percent cover of these taxa declined once flooding from the environmental water release occurred in December 2007 and January 2008 as they could not tolerate a period of extended inundation (Fig. 3d). The role of flooding in this plant community is that it promotes the growth of B. fluviatilis which then outcompetes most other taxa growing at the site until some other form of disturbance such as grazing or fire occurs and the canopy cover or litter mat of B. fluviatilis is broken down.

Project outputs and conference abstracts
Managing Lower Gwydir environmental flows 164
The Westholme site is a water couch Paspalum distichum meadow. P. distichum is a monocotyledon plant with a prostrate growth form. It is capable of tolerating extended periods of inundation. These meadows are considered to be both ecologically and agriculturally important as they provide feeding sites for breeding water birds from nearby nesting areas, while they are also valued by graziers for the high quality feed they provide to livestock. This site is located in the middle of the wetlands and experiences regular shallow flooding to a depth of 15-30cm which favours the growth of P. distichum. Cover of P. distichum has declined over time at Westholme in the closed plots (Fig 4a). Where grazing occurs, P. distichum is the dominant species and species richness is often significantly lower (F2,9 = 8.695; P< 0.01) than in closed plots (Fig 5). Removal of grazing appears to allow a range of other amphibious taxa such as Persicaria spp. and Typha domingensis to grow. These taller species end up shading P. distichum leading to a reduction in its percent cover. At this site, regular and prolonged flooding leads to a fall in the number of species recorded (Fig. 5) due to many of the taxa in the terrestrial damp functional group, which are favoured during drier times between floods, being extirpated following inundation. In the Gwydir Wetlands, the introduced species lippia Phyla canescens has become a major weed problem. It can be spread vegetatively during floods and when it establishes in P. distichum pastures, it can successfully compete with P. distichum (McCosker 1994; Mahwinney 2003; Taylor & Ganf 2005; Crawford 2008). It is unpalatable to stock and results in declines in carrying capacity of more than 50 per cent (Crawford 2008). At Westholme, P. canescens cover was approximately 20% in 1994. It declined to almost zero during a period of regular flooding between 1995 and 1998. By 2007, it had increased in cover to almost 40%, but following flooding by the environmental flow in December 2007 and January 2008, P. canescens cover declined considerably as it struggled to survive being inundated and experienced competition from native perennial species such as P. distichum. Across all times grazing treatments had no significant impact on P. canescens cover. The Crinolyn site is located near the western end of the wetland system and experiences a reduced frequency of natural flooding compared with the Westholme site, but in the past it had extensive P.distichum meadows (H.Blackburn pers. comm.). Figure 6a shows that as late as 1997 during periods of flooding, P. distichum developed a high percent cover. However, data from 1998 onwards show percent cover for this taxon has fallen from the peaks recorded in 1996 and 1997, and P. canescens has become dominant. Lippia cover has risen to between 60-80% for most experimental plots. There were no statistically significant differences in cover between any of the grazing treatments. Most water arriving at this site is now derived from rainfall. The lack of regular flooding has meant that lippia is now dominant. This taxon has been reported to have allelopathic properties (Crawford 2008), making it difficult for some native species to successfully germinate in its presence, which may further enhance the ability of lippia to maintain dominance at the site. While it is possible for environmental flows to reach Crinolyn, the depth and spatial extent of inundation is often insufficient to substantially influence plant community composition at this site. DISCUSSION The period of grazing on floodplains of the Gwydir Wetlands covers 160 years. To this point in time, the nature of the impact of grazing and its interaction with hydrological patterns has received only very limited research attention (Cassanova 2007). However, the present findings show that consistent effects at a range of spatial scales rarely exist. Instead, hydrological regime would appear to be the dominant factor driving changes in community composition in the Gwydir Wetlands.

Project outputs and conference abstracts
Managing Lower Gwydir environmental flows 165
(a)
Monitoring time
May
94
May
95
Jan
96Ju
l 96
Oct
96
May
97
Sep
97
Mar
98
Dec
98
May
07
Sep
07
Jan
08M
ar 0
8
% C
ove
r P
asp
alu
m d
istic
hu
m
0
20
40
60
80
100
Time vs Grazed Time vs Part Grazed Time vs Ungrazed
(b)
Monitoring time
May
94
May
95
Jan
96Ju
l 96
Oct
96
May
97
Sep
97
Mar
98
Dec
98
May
07
Sep
07
Jan
08M
ar 0
8
%C
ove
r L
ipp
ia
0
20
40
60
80
100
Figure 4. Percent cover for (a) water couch Paspalum distichum and (b) lippia Phyla canescens at Westholme
between 1994 and 2008.
Monitoring time
May
94
May
95
Jan
96Ju
l 96
Oct
96
May
97
Sep
97
Mar
98
Dec
98
May
07
Sep
07
Jan
08M
ar 0
8
No.
Spe
cies
0
2
4
6
8
10
12
14
16
18
20
22
Time vs Grazed Time vs Part Grazed Time vs Ungrazed
Figure 5. Number of species recorded at monitoring times between 1994-2008 in grazing study plots at Westholme.
Grazing impacts on vegetation composition differ depending on the morphological traits of the dominant taxa at a site. Tall monocotyledon taxa at frequently inundated sites tend to competitively exclude many other species. Here the disturbance by grazing animals may result in a reduction in cover of such taxa, and provide opportunities for other taxa from the regional species pool to grow. This leads to increased species richness at the local scale. In contrast, where dicotyledon taxa are dominant, such species tend to be more susceptible to grazing, due to them having their apical meristem near the stem apex. Grazing at these sites may lead to the dominance of more grazing-tolerant prostrate vegetation communities. At sites where inundation is limited, as a consequence of factors such as flow

Project outputs and conference abstracts
Managing Lower Gwydir environmental flows 166
(a)
Monitoring time
May
94
May
95
Jan
96Ju
l 96
Oct
96
May
97
Sep
97
Mar
98
Dec
98
May
07
Sep
07
Jan
08M
ar 0
8
%C
ove
r P
asp
alu
m d
istic
hu
m
0
20
40
60
80
100
Time vs Grazed Time vs Part Grazed Time vs Ungrazed
(b)
Monitoring time
May
94
May
95
Jan
96Ju
l 96
Oct
96
May
97
Sep
97
Mar
98
Dec
98
May
07
Sep
07
Jan
08M
ar 0
8
%C
ove
r L
ipp
ia
0
20
40
60
80
100
Figure 6. Percent cover for (a) water couch Paspalum distichum and (b) lippia Phyla canescens on Crinolyn between 1994 and 2008. regulation flows, consumptive uses and extended periods of below average annual rainfall, community transition to one dominated by taxa adapted to a regime of reduced moisture levels is a likely outcome. Whether a transition back to a more traditional wetland plant assemblage is possible appears to be largely governed by the likely future water regime and the persistence of key wetland taxa in the soil seed bank (Wilson et al., 2008). At all sites, flooding appeared to promote the dominance of taxa belonging to amphibious functional groups. It plays an important role in suppressing many significant weed species such as lippia and various thistles such as Cirsium vulgare and Xanthium spinosum. Environmental flows have the capacity to initiate responses in the vegetation community that mimic responses associated with natural floods. However, the spatial scale at which influence can be exerted by environmental flows in this catchment is relatively small. Backing such flows onto natural flood events appears to improve their effectiveness in achieving responses favouring the growth of taxa from amphibious functional groups through greater aerial extent and longer duration of flooding. Under current grazing management regimes the impact of livestock grazing on plant communities appears to be most evident during dry periods between flood events. The impact of ungulate livestock in wetlands following flooding may be more evident in measures of soil attributes (Robertson 1998). Flooding plays a major role in stimulating growth of many key perennial wetland taxa, while it starts a new cycle of growth for many ephemeral wetland taxa as they emerge from the soil seed bank. It is important that grazing practices are managed to allow these natural processes to continue. Current stocking rates, which are lower than traditional rates for this region, need to be maintained. A reduction or elimination of grazing at the time of flowering and seed-set is vital for reducing impact of cattle on the vegetation by grazing and trampling, thereby helping to maintain a diverse and abundant soil seed bank. To continue grazing of wetlands on the Gwydir floodplain sustainably, grazing needs to be considered as a disturbance agent, and managed in conjunction with the natural cycles in wetland plant communities that are largely driven by the prevailing hydrological conditions.

Project outputs and conference abstracts
Managing Lower Gwydir environmental flows 167
ACKNOWLEDGEMENTS This study was part of a PhD project funded by the Australian Government, with additional support provided by the Cotton Catchment Communities CRC and University of New England. We thank the following landholders in the Gwydir Wetlands for their support for this project: Bruce and Jen Southeron (Old Dromana), Sam Kirby (Westholme) and Howard Blackburn (Crinolyn). We thank Rob McCosker and John Duggin for access to past data and information about the study sites. Thanks also to Jane Humphries from the Border Rivers – Gwydir Catchment Management Authority for field assistance and Ian Telford from the Beadle Herbarium at the University of New England for assistance in plant identification. REFERENCES Brock, M. & Casanova, M. 1997. Plant life at the edge of wetlands: ecological responses to wetting
and drying patterns. Pp 182-192 In: Klomp, N. & Lunt, I. (eds) Frontiers in Ecology: Building the Links. Elsevier Science, Oxford.
Casanova. M. 2008. The effect of grazing on freshwater wetlands in Australia: A review of literature with particular emphasis on the Macquarie Marshes and Gwydir Wetlands. Charophyte Services, Victoria.
Crawford. P. 2008 Lippia management – Challenges, opportunities and strategies The National Lippia Working Group
Keyte, P. 1994. Lower Gwydir Wetland – Plan of Management 1994-1997. Report by New South Wales Department of Natural Resources for the Lower Gwydir Wetland Steering Committee, Sydney.
Kingsford, R.T. 2000. Ecological impacts of dams, water diversions and river management in floodplain wetlands in Australia. Austral Ecology 25: 109-127.
McCosker, R.O. and Duggin, J.A. 1993 Gingham Watercourse – Resource Management Issues Department of Ecosystem Management University of New England Armidale, NSW.
McCosker, R.O. 1994. The preparation of a plan of management for the Gingham watercourse. Masters Thesis, University of New England, Armidale, New South Wales.
Mahwinney, W.A. 2003 Restoring biodiversity to the Gwydir wetlands through environmental flows. Water Science and Technology 48: 73-81
Mueller-Dombois, D. & Ellenberg, H. 1974. Aims and Methods of Vegetation Ecology. John Wiley and Sons, Sydney.
NSW Dept of Sustainable Natural Resources 2003 A guide to the Water Sharing Plan for the Gwydir Regulated River Water Source. NSW Government Sydney.
Quinn, G.P. and Keough, M.J. 2002. Experimental Design and Data Analysis for Biologists. Cambridge University Press, Cambridge, UK.
Robertson, A.I. 1998. The effect of livestock on wetlands. Pp 195-201 In: Williams, W.D. (ed) Wetlands in a dry land: Understanding for management. Environment Australia, Canberra.
Taylor, B. & Ganf, G.G. 2005. Comparative ecology of two co-occurring floodplain plants: the native Sporobolus mitchelli and the exotic Phyla canescens. Marine and Freshwater Research 56: 431-440.
Wilson, G.G., Berney, P.J., Ryder, D.S. and Price, J.N. 2008 Grazing / Landuse in the Macquarie Marshes and Gwydir Wetlands – Final Report to the New South Wales Department of Environment and Climate Change. University of New England, Armidale. 71pp

Project outputs and conference abstracts
Managing Lower Gwydir environmental flows 168
Proceedings, International Conference on Implementing Environmental Water Allocations, Port Elizabeth, South Africa, February 2009
DELIVERING MULTI-OBJECTIVE ENVIRONMENTAL FLOWS INTO TERMINAL FLOODPLAIN WETLANDS, NORTHERN MURRAY-
DARLING BASIN, AUSTRALIA
G.G. Wilson and P.J. Berney
1Ecosystem Management, School of Environmental and Rural Science, and Cotton Catchment Communities
Cooperative Research Centre, University of New England, Armidale, NSW 2351, Australia; email: [email protected]
Abstract Terminal wetlands are a prominent ecological feature of floodplains across Australia’s northern Murray-Darling Basin. They are gaining increasing recognition for their ecological role at catchment and landscape scales, and associated high conservation value, and most are recognised under national or Ramsar management agreements. However, many terminal wetlands are located in or downstream of significant agricultural landscapes, and receive a significant portion of their flows through regulated water resource development schemes. While the resulting alteration of natural flooding patterns has led to legislated environmental flow provisions for these catchments, terminal wetlands are one of the most difficult points in a catchment to which to deliver managed flow releases. Managers of these systems need clear guidelines as to how various ecosystem components respond to flow variability in order to make effective environmental flow decisions. The Lower Gwydir wetland ecosystem in north-west New South Wales comprises a large (though reduced) terminal wetland with four privately-owned Ramsar sites. Environmental flow releases from Copeton Dam have been made into the wetland area for the past 13 years. This study considered a mix of ecological data and management responses to assess the effectiveness of environmental flow (or ‘Environmental Contingency Allowance’, ECA) release practices in this wetland system. Although the Lower Gwydir release program is guided by nine ecological objectives, past ECA events have primarily focused only on wetland vegetation or colonial waterbird responses, with the assumption that other ecosystem components and management objectives would also receive parallel benefits. However, the spatial and (particularly) temporal scale of response will differ significantly among ecological attributes. In dry periods, ECA release volumes were limited and managers were concerned for loss of flows into floodplain areas upstream of the core and Ramsar wetland targets. However, non-target wetland areas may represent significant species-rich patches, and ECA success should be judged at the wetland or ecosystem scale rather than on an individual patch basis. Channel capacity restrictions and the need to avoid inundation of upstream cropping suggest that ECA releases may only ever achieve moderate discharge rates in this system. It should be recognised that any one flow event is unlikely to satisfy all management objectives, and that a multi-release program over an appropriate timeframe will likely be necessary to satisfy all ecosystem components.
Project outputs and conference abstracts
Managing Lower Gwydir environmental flows 169
INTRODUCTION There is a growing recognition that lowland river ecosystems must be considered as an integration of river channels with their adjacent floodplain (Kingsford, 2000). Nevertheless, past management of such systems has often focussed on the channel and its floodplain as separate components (McPhail and Young, 1991; Kingsford, 2000; Kingsford et al., 2006), with any subsequent management decisions invariably prioritising the needs of the river channel. Yet, the ecology of these river systems depends on patterns in their connectivity between channels and their floodplain (e.g. Jenkins and Boulton, 2003), either to allow for critical ontogenetic shifts or for fluxes in prey items and other materials between the two environments. Australia’s Murray-Darling Basin is dominated by floodplain river systems in dryland low-rainfall regions (Thoms and Sheldon, 2000). Catchments in its northern region feature summer-dominant rainfall and peak flow periods, although these are also recognised as being among the most hydrologically unpredictable and variable river systems globally (Puckridge et al., 1999; Young and Kingsford, 2006). Despite the adaptation of their aquatic biota to extended periods of low or no flow (e.g. Boulton et al., 2006), flow regulation has had a considerable impact on these ecosystems (Kingsford, 2000) through reducing the incidence of downstream flooding, and decreased flow variability and increased seasonal predictability (Thoms and Parsons, 2003; Kingsford et al., 2006; Young and Kingsford, 2006). This has altered the extent of hydrological connectivity between these rivers and their floodplain, with consequences particularly for the ecological integrity of wetland areas. Environmental flow programs are beginning to address this need, yet still require a more thorough understanding of the likely ecological responses at a variety of spatial and temporal scales. One of the key features of many northern Murray-Darling Basin rivers is their termination in large wetland systems. These ‘terminal wetlands’ may either comprise large lakes or networks of small distributary channels, typically with diffuse wetland patches in-between. Critically, they are difficult points in the landscape to which to deliver environmental water. They are often located downstream of irrigation schemes which harvest significant volumes of water from the river channel or off the floodplain during high-flow periods (Kingsford, 2000). Moreover, a range of downstream agricultural land uses often construct diversion channels, small weirs and floodplain levees to alter flow paths for a variety of purposes, and these structures add to the difficulty of calculating the flow volumes necessary to inundate target wetland areas. These ecosystems are also geomorphologically complex, often with poorly-defined, low-slope channels and a multitude of break-out points whose flow characteristics can shift in response to individual or sequences of flow events and associated changes in sediment transport (e.g. Rayburg et al., 2004; Thoms et al., 2006). In spite of their complexity, the high conservation-value of these ecosystems and associated protection requirements under national or international agreements, as well as their prominence at the regional landscape scale, dictates that sound environmental flow management rules be devised for terminal wetlands. In the present study we examined a variety of aquatic ecological responses to environmental flow releases into a single terminal wetland system, the Lower Gwydir wetlands. These are recognised as being of national significance, and include privately-managed Ramsar sites. Management responses to these flow events and the subsequent ecological responses are considered and recommendations made as to how similar releases should be managed in this and other similar ecosystems.
Project outputs and conference abstracts
Managing Lower Gwydir environmental flows 170
THE LOWER GWYDIR CATCHMENT Channel structure and hydrology The Lower Gwydir wetland ecosystem in north-west New South Wales comprises a large (approximately 20,000 ha) terminal wetland system, mostly situated at the end of the Lower Gwydir River and Gingham Watercourse (Figure 1). These and two other distributary channels, Carole Creek and the Mehi River, receive regulated flows from the Gwydir River. Copeton Dam, with a total capacity of 1,360,000 ML, was completed on the Gwydir River in 1976, and regulates approximately 55% of total inflow to the river (Keyte, 1994). Smaller regulating structures at Tareelaroi, Boolooroo and Tyreel divert Gwydir River flows into the Mehi River, Carole Creek and Lower Gwydir River, respectively. All distributary channels also receive water through unregulated inflows from the Horton River and Warialda Creek into the Gwydir River below Copeton Dam. Unregulated flows peak in size over the November to February summer period. Since 1978, flows peaking at >20,000 ML per day in the downstream end of the Gwydir River have had an average return interval of 1.4 years (Figure 2A). Environmental flow management Environmental (or Environmental Contingency Allowance; hereafter ECA) flows into the Lower Gwydir channels and wetlands are currently administered through the New South Wales Department of Environment and Climate Change, with water for ECA releases held in an ‘account’ in Copeton Dam. Operating features of the account include a maximum allocation of 45 GL in any one water year, carry-over provisions if the balance is unused in the current water year, an account limit of 90 GL, and no limits on usage in any single release event (NSW Department of Environment and Climate Change, 2008). Water is accrued in the account as a percentage of inflows into Copeton Dam. Additional ‘loss account’ water is also held in Copeton Dam, and used to offset evaporative losses from the ECA account during storage and transmission losses during the delivery of an ECA release from Copeton Dam to the upstream end of the wetlands. ECA flows are tracked for compliance purposes by the dam and river operators to a point immediately upstream of the Lower Gwydir wetlands. A stakeholder operations advisory committee, with agency, scientific and agricultural industry representation, makes recommendations to senior river managers for any use of ECA water. ECA recommendations are based on one or more ecological objectives, including:
1. To support a colonially-nesting native waterbird breeding event triggered by natural flooding;
2. To inundate core wetland areas during periods of extended dry climatic conditions; 3. To inundate higher-level in-channel benches downstream of Copeton Dam; 4. To provide short-term inundation to promote germination of exotic hyacinth as part of a
wetting and drying weed management strategy; 5. To provide flows in distributary channels for environmental purposes; 6. To support native fish populations and habitat; 7. To support invertebrates and other aquatic species; 8. To support threatened species; and 9. To maintain aquatic ecosystem health.
Eight environmental flow releases have been made from Copeton Dam into the Lower Gwydir wetlands during the past 13 years (NSW Department of Environment and Climate Change, 2008; Table 1). Although the Lower Gwydir ECA release program is guided by the above nine ecological objectives, past ECA events have primarily focused only on stimulating core areas of wetland vegetation or to support colonially-nesting waterbird events, with the assumption that other ecosystem components and management objectives would receive parallel benefits.

Project outputs and conference abstracts
Managing Lower Gwydir environmental flows 171
Figure 1. Location of the Lower Gwydir catchment, northern region of the Murray-Darling Basin, Australia, (A),
and downstream terminal wetland complex (B). Reproduced from Wilson et al., in press. Monitoring of hydrological and ecological outcomes is achieved in four ways. First, an ECA Manager tracks progress of water from the upstream delivery point through the Lower Gwydir channels to the target wetland areas. Aerial photography and satellite imagery is used to map the aerial extent of wetland inundation, backed up by ground-truthing. Second, researchers and government agency ecologists have undertaken monitoring, before and following recent ECA releases, of wetland vegetation and in-channel parameters such as water chemistry, fish assemblages and phyto- and zooplankton. Last, landholder observations are particularly useful in detecting the commencement of any waterbird breeding events. CASE STUDY – 2006-2007 ENVIRONMENTAL FLOW RELEASES Two separate ECA releases were made into the Lower Gwydir wetlands in late 2006 and early 2007 (Table 1; Figure 2 B,C). For operational reasons, these flows were sent into the Lower Gwydir River and Gingham Watercourse wetlands as two separate releases rather than as a single release split between the two channels, although most other ECA releases in this system have been executed as a single flow. The primary ecological objective in each case was to provide critical inundation of the core wetland areas, particularly to stimulate aquatic/wetland plant growth. Prior to this release, significant flooding of these wetlands had not occurred for 2–3 years. We monitored the response of wetland vegetation and in-channel parameters (fish, water chemistry, phyto- and zooplankton) to the two ECA events. Vegetation monitoring sites were positioned in the core wetlands area at the end of both the Lower Gwydir River and Gingham Watercourse, and control sites were located in nearby areas of comparable elevation and plant assemblage structure but away from likely inundation. In-stream monitoring included three sites along each the two channels receiving ECA water (Lower Gwydir River, Gingham Watercourse) and the nearby Mehi River (Figure 1).
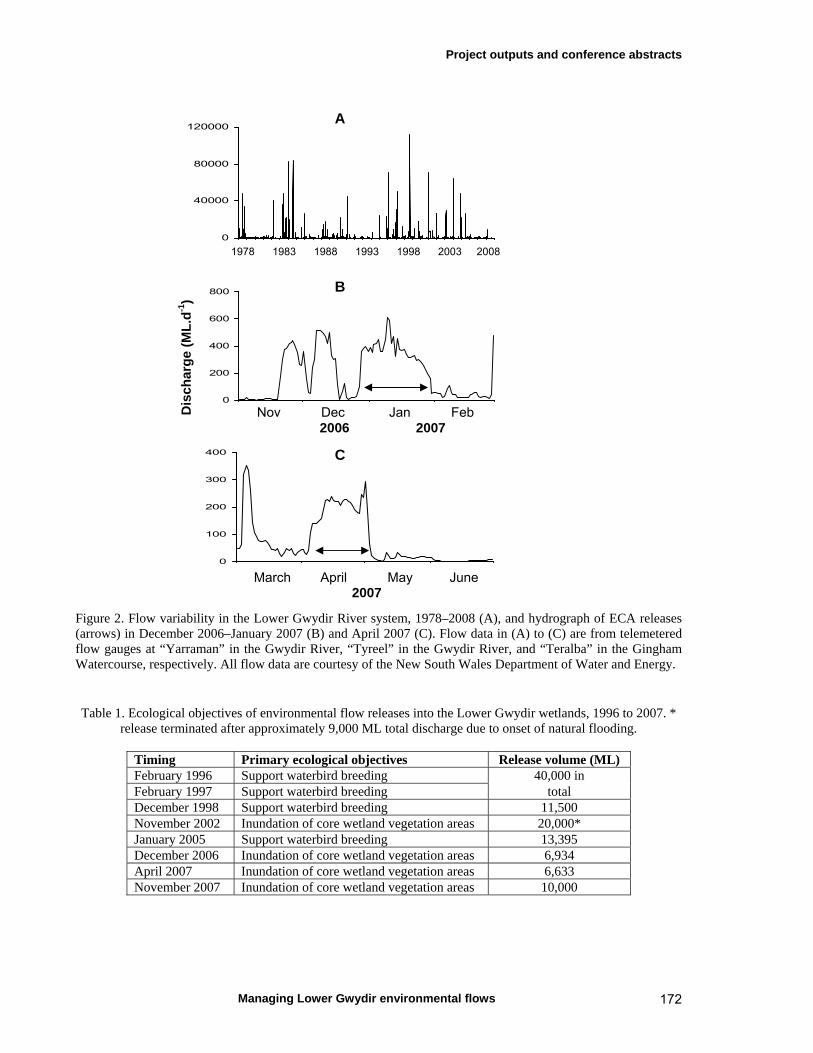
Project outputs and conference abstracts
Managing Lower Gwydir environmental flows 172
0
40000
80000
120000
0
200
400
600
800
0
100
200
300
400
Figure 2. Flow variability in the Lower Gwydir River system, 1978–2008 (A), and hydrograph of ECA releases (arrows) in December 2006–January 2007 (B) and April 2007 (C). Flow data in (A) to (C) are from telemetered flow gauges at “Yarraman” in the Gwydir River, “Tyreel” in the Gwydir River, and “Teralba” in the Gingham Watercourse, respectively. All flow data are courtesy of the New South Wales Department of Water and Energy. Table 1. Ecological objectives of environmental flow releases into the Lower Gwydir wetlands, 1996 to 2007. *
release terminated after approximately 9,000 ML total discharge due to onset of natural flooding.
Timing Primary ecological objectives Release volume (ML) February 1996 Support waterbird breeding 40,000 in February 1997 Support waterbird breeding total December 1998 Support waterbird breeding 11,500 November 2002 Inundation of core wetland vegetation areas 20,000* January 2005 Support waterbird breeding 13,395 December 2006 Inundation of core wetland vegetation areas 6,934 April 2007 Inundation of core wetland vegetation areas 6,633 November 2007 Inundation of core wetland vegetation areas 10,000
A B C
1978 1983 1988 1993 1998 2003 2008
Nov Dec Jan Feb 2006 2007
March April May June 2007
Dis
char
ge
(ML
.d-1
)

Project outputs and conference abstracts
Managing Lower Gwydir environmental flows 173
Hydrology and timing The 2006/2007 ECA releases into the Lower Gwydir wetlands were constrained in two ways. First, the total volume of water available for releases at the beginning of the water year was only approximately 34 GL. Accordingly, the final release volumes were a compromise between (a) what was considered necessary to inundate each core wetland area to a sufficient aerial extent and duration to generate a vegetation response and (b) the need to retain a significant volume in the account for contingencies later in the 2006/2007 water year and/or beginning of the 2007/2008 water year. Second, as the key objective in each release was to deliver water to the core wetland areas within the Ramsar sites, discharge rates were calculated to minimise losses onto the floodplain upstream of the targets. The ECA release into the Lower Gwydir River began on the 27th December and lasted for approximately 26 days (Figure 2 B). It flowed at a peak discharge rate of approximately 750 ML per day upstream of the wetlands and 385 ML per day at the end of the river channel. The release was preceded by two flow pulses for consumptives uses (to 443 and 519 ML per day peaks) in November and December, and followed by two brief natural flows (479 and 628 ML per day peaks) in late February and early March. The ECA release into the Gingham Watercourse (Figure 2 C) began on the 3rd April and lasted for approximately 28 days. Its peak rate of discharge at the upstream end of the wetlands was 239 ML per day, apart from a brief rise to 294 ML per day towards the end of the flow. No significant flow events followed this release, although it was preceded by a brief flow pulse to 355 ML per day in early March. Vegetation responses A ‘Before–After–Control–Impact’ sampling design was used to assess the efficacy of the April 2007 ECA release for stimulating wetland vegetation assemblages along the Gingham Watercourse. Data were obtained from five sites along the Gingham Watercourse (“Joanville”, “Westholme”, “Munwonga”, “Goddard’s Lease”, “Crinolyn”) and two control sites (“Allambie”, “Currigundi”) along the nearby Lower Gwydir River. Monitoring was undertaken in March (two weeks prior to the release) and in May and August (two and 14 weeks following the release, respectively). At each site, five fixed transects were set up, and the species present and their percentage cover was monitored using visual estimates on the three occasions. Data were analysed in terms of the overall number of species, as well as the presence of species in different functional groups. Species were arranged into four functional groups based on where they grow in a wetland and their life cycle traits in following inundation. Four functional groups were recognized in the Lower Gwydir wetlands:
Amphibious responders (AmR) – plants which change their growth form in response to flooding and drying cycles;
Amphibious tolerators (AmT) – plants which tolerate flooding patterns without changing their growth form;
Terrestrial damp plants (TDa) – plants which are terrestrial species but tend to grow close to the water margin on damp soils; and
Terrestrial dry plants (TDr) - those which are terrestrial species which don’t normally grow in wetlands but may be encroaching into the area due to prolonged drying.
The level of inundation varied among sites throughout the study period (Figure 3). “Joanville” was already wet prior to the start of the flow, due to water having spilt from the channel during prior stock and domestic releases. All other monitoring sites were dry in March. Water had also spilt into the wetland on “Munwonga” but no surface flow had reached the position of the monitoring transects. During the August monitoring, water was still covering some transects on both “Joanville” and “Crinolyn”.
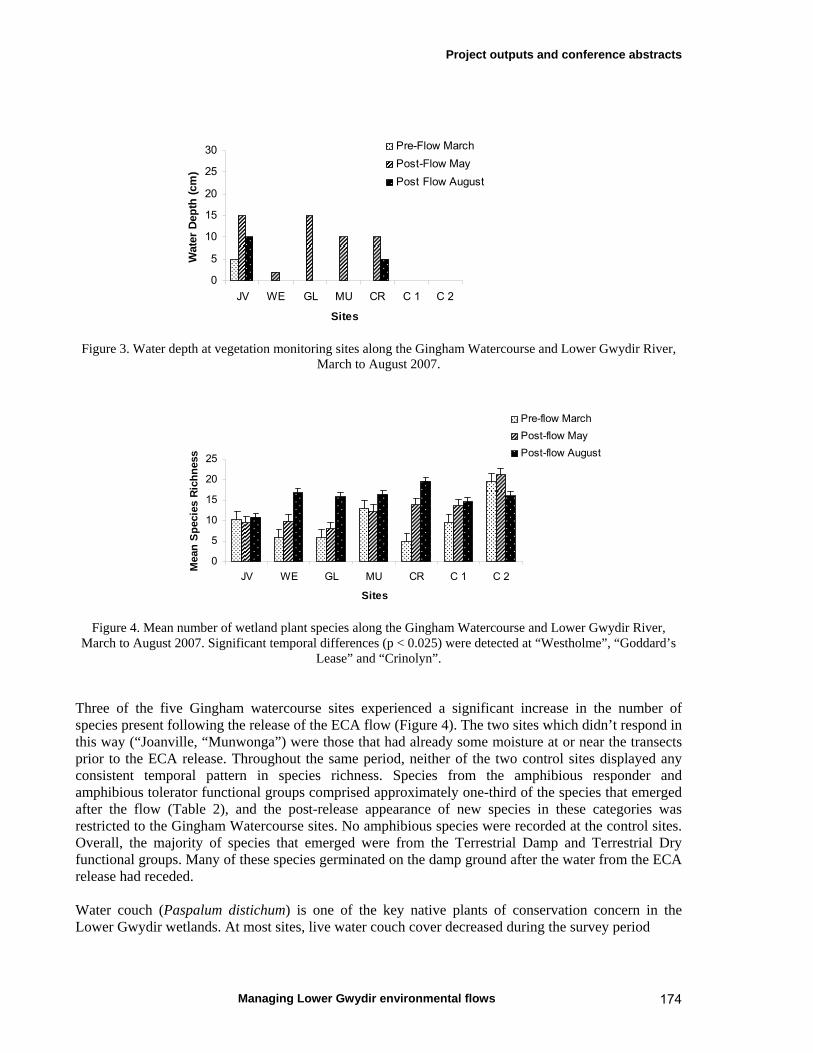
Project outputs and conference abstracts
Managing Lower Gwydir environmental flows 174
0
5
10
15
20
25
30
JV WE GL MU CR C 1 C 2
Sites
Wat
er D
epth
(cm
)
Pre-Flow March
Post-Flow May
Post Flow August
Figure 3. Water depth at vegetation monitoring sites along the Gingham Watercourse and Lower Gwydir River,
March to August 2007.
0
5
10
15
20
25
JV WE GL MU CR C 1 C 2
Sites
Mea
n S
pec
ies
Ric
hn
ess
Pre-flow March
Post-flow May
Post-flow August
Figure 4. Mean number of wetland plant species along the Gingham Watercourse and Lower Gwydir River,
March to August 2007. Significant temporal differences (p < 0.025) were detected at “Westholme”, “Goddard’s Lease” and “Crinolyn”.
Three of the five Gingham watercourse sites experienced a significant increase in the number of species present following the release of the ECA flow (Figure 4). The two sites which didn’t respond in this way (“Joanville, “Munwonga”) were those that had already some moisture at or near the transects prior to the ECA release. Throughout the same period, neither of the two control sites displayed any consistent temporal pattern in species richness. Species from the amphibious responder and amphibious tolerator functional groups comprised approximately one-third of the species that emerged after the flow (Table 2), and the post-release appearance of new species in these categories was restricted to the Gingham Watercourse sites. No amphibious species were recorded at the control sites. Overall, the majority of species that emerged were from the Terrestrial Damp and Terrestrial Dry functional groups. Many of these species germinated on the damp ground after the water from the ECA release had receded. Water couch (Paspalum distichum) is one of the key native plants of conservation concern in the Lower Gwydir wetlands. At most sites, live water couch cover decreased during the survey period
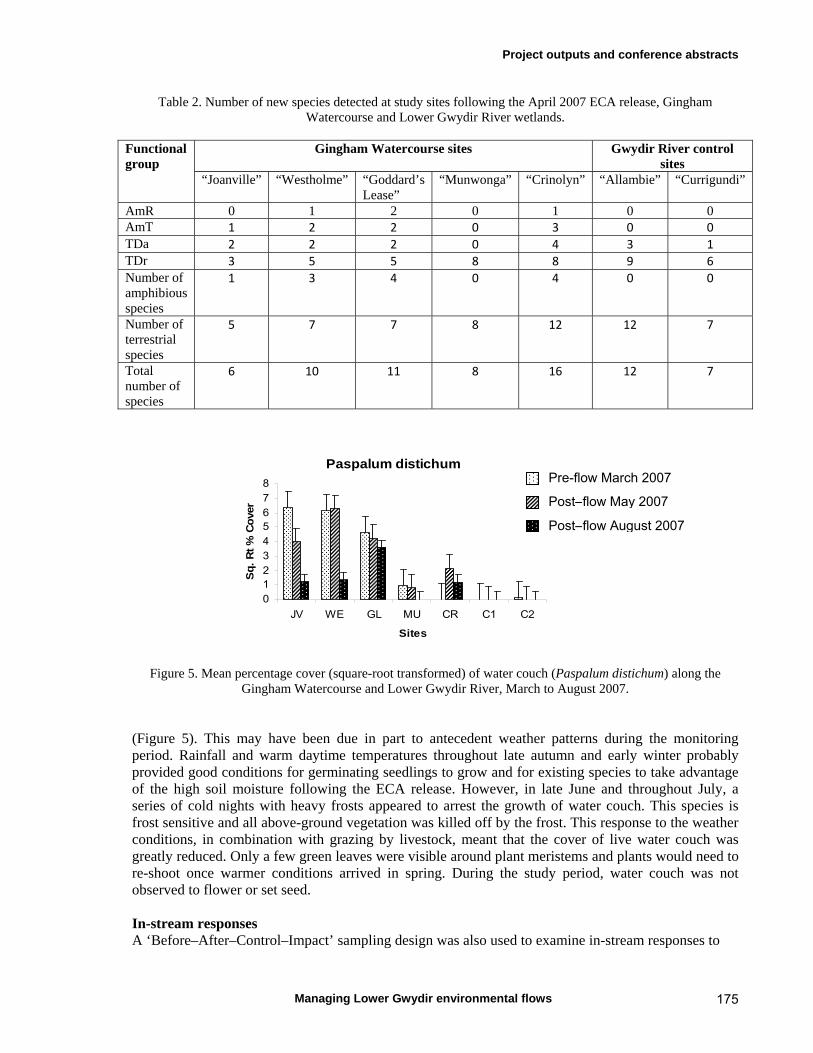
Project outputs and conference abstracts
Managing Lower Gwydir environmental flows 175
Table 2. Number of new species detected at study sites following the April 2007 ECA release, Gingham Watercourse and Lower Gwydir River wetlands.
Functional group
Gingham Watercourse sites Gwydir River control sites
“Joanville” “Westholme” “Goddard’s Lease”
“Munwonga” “Crinolyn” “Allambie” “Currigundi”
AmR 0 1 2 0 1 0 0 AmT 1 2 2 0 3 0 0 TDa 2 2 2 0 4 3 1 TDr 3 5 5 8 8 9 6 Number of amphibious species
1 3 4 0 4 0 0
Number of terrestrial species
5 7 7 8 12 12 7
Total number of species
6 10 11 8 16 12 7
Paspalum distichum
012345678
JV WE GL MU CR C1 C2
Sites
Sq
. R
t %
Co
ver
Figure 5. Mean percentage cover (square-root transformed) of water couch (Paspalum distichum) along the Gingham Watercourse and Lower Gwydir River, March to August 2007.
(Figure 5). This may have been due in part to antecedent weather patterns during the monitoring period. Rainfall and warm daytime temperatures throughout late autumn and early winter probably provided good conditions for germinating seedlings to grow and for existing species to take advantage of the high soil moisture following the ECA release. However, in late June and throughout July, a series of cold nights with heavy frosts appeared to arrest the growth of water couch. This species is frost sensitive and all above-ground vegetation was killed off by the frost. This response to the weather conditions, in combination with grazing by livestock, meant that the cover of live water couch was greatly reduced. Only a few green leaves were visible around plant meristems and plants would need to re-shoot once warmer conditions arrived in spring. During the study period, water couch was not observed to flower or set seed. In-stream responses A ‘Before–After–Control–Impact’ sampling design was also used to examine in-stream responses to
Pre-flow March 2007
Post–flow May 2007
Post–flow August 2007

Project outputs and conference abstracts
Managing Lower Gwydir environmental flows 176
the two ECA flow events. Three sites were sampled along each of the Lower Gwydir River, the Gingham Watercourse and the Mehi River. The latter does not receive ECA flows and so was used as a control to any responses observed along the two other channels. A further set of control data was obtained from three floodplain waterholes near the Gingham Watercourse which did not receive any flows into them during the study period. In-stream sites were located from 8.4 to 54 km apart, while the floodplain waterholes were 2.7 to 5.2 km apart. Sampling for the Gwydir ECA release was undertaken in December 2006 prior to the flow and then in February and March 2007, while sampling for the Gingham ECA release was undertaken in March and May 2007. We sampled fish assemblages using two sizes of fyke net: large nets of 12 mm (stretched) mesh, 1.1 m diameter body, 7 m long wings; and smaller nets of 0.3 m diameter body and 1.5 m wings. At each site, nets were set in the late afternoon and retrieved the next morning, with a large and small fyke set facing upstream and a second pair facing downstream. These have previously been found to be a useful method for sampling fishes in similar river systems (Balcombe et al., 2006). All fish and large crustacea were identified and counted, and fish lengths recorded to the nearest mm. A range of water chemistry data was also collected, including the nutrients total nitrogen, total phosphorous and soluble reactable phosphorous, chlorophyll a, dissolved organic carbon, suspended solid load, turbidity and electro-conductivity. Values were obtained from laboratory analyses. Fish sampling from October 2006 to February 2008 indicated significant differences in species dominance among the three study channels (G. Wilson, T. Bickel and J. Sisson, unpublished data): Mehi River 58% western carp gudgeon (Hypseleotris spp., Gobiidae), Lower Gwydir River 62% bony bream (Nematolosa erebi, Clupeidae), Gingham Watecourse 42% spangled perch (Leiopotherapon unicolor, Tetrapontidae). This made it difficult to compare the response of individual species to ECA events across channels as abundances were generally too low at sites where a species wasn’t dominant. A number of dryland river fishes in the Murray-Darling Basin are thought to spawn in response to flow pulses although low-flow periods also appear important to their subsequent recruitment (Koehn and O’Connor, 1990; Humphries et al., 1999, 2006; Wilson and Wright, 2005). While age data provide the best means of linking spawning activity to specific flow events in dryland river fishes (Wilson and Smith, 2002), size-structure data may also provide some indication of recent spawning and recruitment activity (e.g. Balcombe et al., 2006). In the present study, we examined temporal patterns in the size structure of two native fishes, bony bream and spangled perch. Due to the dominance of these species in the Lower Gwydir River and Gingham Watercourse, respectively, we used them to examine whether either of the ECA events was successful in triggering fish recruitment. Bony bream size-structure in both the Lower Gwydir River and the floodplain waterholes before the Gwydir ECA release was dominated by two modes at around 40–60 mm and 90–110 mm in length (Figure 6). Following the ECA event, fish in the floodplain waterholes still largely reflected the pre-release size-structure, while the appearance of new individuals became progressively clearer in the Gwydir River following the release. Fish in this latter cohort were around 20–39 and 40–79 mm in February and March, respectively. Preliminary knowledge of size-at-age relationships in this species (Heagney, 2008), suggests that these fish were largely derived from spawning during the ECA flow. Spangled perch in the Gingham Watercourse prior to the April 2007 ECA event were dominated by a broad cohort, with a peak size of 40–49 mm, and minor peaks at 100–109 and 130–139 mm (Figure 7). Following the ECA release, the previous 40–49 mm peak appeared to have shifted to the 70–79 mm size-class, while a small cohort of 20–39 mm fish was evident. Again, prior knowledge of size-at-age in this species (Wilson and Smith, 2002) suggested that these smaller fish had been derived from spawning activity during the ECA release, although their relatively low abundances suggested a weak response. Unfortunately, spangled perch were not abundant enough in either the two other rivers or the floodplain waterholes to allow similar comparisons in the absence of ECA flows.
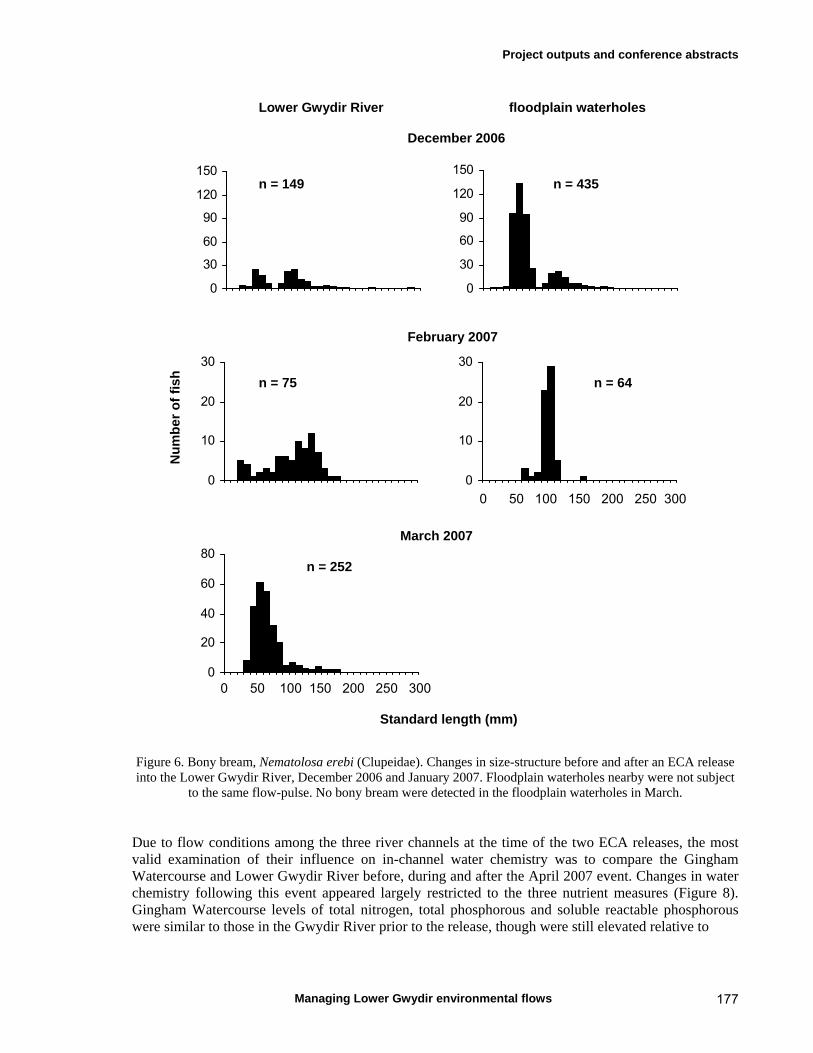
Project outputs and conference abstracts
Managing Lower Gwydir environmental flows 177
0
30
60
90
120
150
0
30
60
90
120
150
0
10
20
30
0
10
20
30
0
20
40
60
80
Figure 6. Bony bream, Nematolosa erebi (Clupeidae). Changes in size-structure before and after an ECA release into the Lower Gwydir River, December 2006 and January 2007. Floodplain waterholes nearby were not subject
to the same flow-pulse. No bony bream were detected in the floodplain waterholes in March. Due to flow conditions among the three river channels at the time of the two ECA releases, the most valid examination of their influence on in-channel water chemistry was to compare the Gingham Watercourse and Lower Gwydir River before, during and after the April 2007 event. Changes in water chemistry following this event appeared largely restricted to the three nutrient measures (Figure 8). Gingham Watercourse levels of total nitrogen, total phosphorous and soluble reactable phosphorous were similar to those in the Gwydir River prior to the release, though were still elevated relative to
Lower Gwydir River floodplain waterholes
December 2006 n = 149 n = 435
February 2007
n = 75 n = 64
March 2007
n = 252
Nu
mb
er o
f fi
sh
0 50 100 150 200 250 300
Standard length (mm)
0 50 100 150 200 250 300

Project outputs and conference abstracts
Managing Lower Gwydir environmental flows 178
0
10
20
30
40
0
10
20
30
40
Figure 7. Spangled perch, Leiopotherapon unicolor (Terapontidae). Changes in size-structure before and after an April 2007 ECA release into the Gingham
Watercourse.
0
0.2
0.4
0.6
0.8
1
0
0.05
0.1
0.15
0.2
0
100
200
300
400
0
50
100
150
0
4
8
12
0
10
20
30
Figure 8. Shifts in water chemistry in the Gingham Watercourse and Lower Gwydir River, March to May 2007. A – total nitrogen (TN), total phosphorous (TP) and soluble reactable phosphorous (SRP); B – electro-conductivity (EC), turbidity (NTU) and suspended solid load (SS); C – dissolved organic carbon; D – chlorophyll a.
TN
(m
g/L
, do
tted
lin
e)
SR
P (
mg
/L, d
ash
ed li
ne)
TP
(m
g/L
, so
lid li
ne)
A
B
C
D
March 2007 n= 118 May 2007 n= 53
Nu
mb
er o
f fi
sh
0 40 80 120 160
Standard length (mm)
Mar Apr May Mar Apr May
Gingham Gwydir
mg
/L
mg
/L
EC
(uS
/cm
, so
lid li
ne)
N
TU
(d
ash
ed li
ne)
SS
(m
g/L
, do
tted
lin
e)

Project outputs and conference abstracts
Managing Lower Gwydir environmental flows 179
those in the Gwydir River a week after the release had finished. All measures peaked in concentration during the release. By contrast, neither of the other water chemistry variables showed a clear response to this ECA event. DISCUSSION AND RECOMMENDATIONS Dryland river systems are both geomorphologically and hydrologically complex (Thoms et al., 2006; Young and Kingsford, 2006), and determining their environmental flow requirements under highly flow-regulated conditions is a challenging task (Kingsford, 2000; Kingsford et al., 2006). This complexity is further amplified in situations where restorative flows are required for both in-stream and floodplain wetland environments. This is especially the case where the wetlands are fringed by substantial areas of agricultural activity. Despite the extent of agricultural development on floodplains such as the Lower Gwydir, they should still be viewed as a mosaic of patches with significant biodiversity value (Morton et al., 2002), and ‘accidental’ spills away from the flow target during transmission of an environmental flow should not be considered a loss unless onto areas of cultivation or vegetation clearing. There are four broad recommendations to come from this work. First, expectations of what ecological responses might be achieved need to be realistic — not every release is likely to satisfy the hydrological requirements of all aquatic biota, particularly in cases like the 2006–2007 releases in the Lower Gwydir where the overriding objective was to retain as much water as possible in the channel upstream of the core wetland target. Second, carefully designed monitoring programs are essential for determining the ecological outcomes from an ECA event and to demonstrate the benefits of environmental flows to the community and relevant stakeholder groups (Downes et al., 2002). Long-term reference data sets are necessary to understand the extent to which aquatic populations fluctuate in response to seasonal and hydrological cycles and habitat factors, while shorter-term monitoring programs are necessary to delineate responses to specific releases or other flows. However, the difficulties in tracking responses to specific flow events in should not be underestimated in flow-managed rivers like the Lower Gwydir where releases are being made for a variety of consumptive purposes as well as environmental ones. Clearly, ECA managers need to prioritise which ecological parameters they should focus on, particularly in circumstances where releases are recommended for a narrow set of ecological criteria. Furthermore, such monitoring programs need to account for likely differences in temporal scale of response among biota, as not all responses will be adequately detected by a single monitoring program. For instance, while responses of wetland vegetation and some fish species were still evident 1–2 months after an ECA event in the Lower Gwydir, elevated nutrient levels were already diminishing a week after cessation of the April 2007 release. Other water chemistry variables did not show as clear a shift during and following the same release, either because their temporal scale of response differed from that of the nutrients or because the hydrology of the release was insufficient to generate a detectable response. While a multi-indicator monitoring program such as ours can provide an integrated picture of ecosystem responses to an environmental flow event, it will invariably be advisable to monitor different variables at varying temporal scales, from days to weeks or months following the onset of a flow event. Given this temporal variability in response time, it may also be necessary to design multi-release programs to satisfy as many ecological objectives as possible. For example, while we detected changes in nutrient availability within the Gingham Channel following the largely in-channel April 2007 ECA,
Project outputs and conference abstracts
Managing Lower Gwydir environmental flows 180
dissolved organic carbon and fish assemblages may have responded more to a flow that had been allowed to inundate the floodplain upstream, irrespective of flow duration. Third, the ‘boom-bust’ dynamics of biota in dryland floodplain rivers must be acknowledged in any monitoring program of ecological responses to flow variability. Again, long-term monitoring programs will be essential to ‘capture’ reference levels of population fluctuation. This will allow an appropriate understanding of the trade-offs or ecological costs of water resource developments that dampen the natural flow variability, as well as providing a reference against which to measure any gains from environmental flow programs. Similarly, it is vital to have a thorough understanding of the lifehistory of key species within the ecosystem. For instance, prior knowledge of age at size in bony bream and spangled perch allowed a preliminary match between the appearance of small fish and the timing of recent ECA flows. Last, the seasonal timing of ECA events should be matched as closely as possible to the unregulated hydrological record. While the December–January ECA along the Lower Gwydir River occurred in the natural period of peak flows, the April release was at the end of this period and was followed by cold winter conditions. In the wetland plant assemblages, this meant that most species failed to set significant quantities of seed for the season as cold conditions from June onwards appeared to kill off much of their above-ground reproductive biomass. Similarly, the relatively low abundance of spangled perch may have also reflected this aseasonality, particularly given observations of their spawning response to summer flows elsewhere in the region (Wilson and Wright, 2005). ACKNOWLEDGEMENTS This work was funded by the Australian Government, with additional support provided by the Cotton Catchment Communities CRC and University of New England. We particularly thank Julia Sisson, Jeff Kelleway, Jenny Spencer, Yoshi Kobayashi and numerous volunteers for field assistance, and gratefully acknowledge the numerous Lower Gwydir landholders for allowing us free access to their property. REFERENCES Balcombe, S.R., Arthington, A.H., Foster, N.D., Thoms, M.C., Wilson, G.G., and Bunn, S.E. (2006)
“Fish assemblages of an Australian dryland river: abundance, assemblage structure and recruitment patterns in the Warrego River, Murray-Darling Basin.” Marine and Freshwater Research, 57, 619–633.
Boulton, A.J., Sheldon, F., and Jenkins, K.M. (2006) “Natural disturbance and aquatic invertebrates in desert rivers.” Ecology of Desert Rivers, Kingsford, R.T. (ed), Cambridge University Press, Cambridge, UK, 133–153.
Downes, B.J., Barmuta, L.A., Fairweather, P.G., Faith, D.P., Keough, M.J., Lake, P.S., Mapstone, B.D., and Quinn, G.P. (2002) “Monitoring Ecological Impacts. Concepts and practice in flowing waters.” Cambridge University Press, Cambridge, U.K.
Humphries, P., Cook, R.A., Richardson, A.J., and Serafini, L.G. (2006) “Creating disturbance: manipulating slackwaters in a lowland river.” River Research and Applications, 22, 525–42.
Humphries, P., King, A.J., and Koehn, J.D. (1999) “Fish, flows and flood plains: links between freshwater fishes and their environment in the Murray-Darling river system, Australia.” Environmental Biology of Fishes, 56, 129–151.
Jenkins, K.M., and Boulton, A.J. (2003) “Ecological connectivity in a dryland river; short-term aquatic macroinvertebrate recruitment following floodplain inundation.” Ecology, 84, 2708–2723.

Project outputs and conference abstracts
Managing Lower Gwydir environmental flows 181
Keyte, P.A. (1994) “Lower Gwydir Wetland – Plan of Management 1994–1997.” Report by New South Wales Department of Water resources for the Lower Gwydir Wetland Steering committee, Sydney, Australia.
Kingsford, R.T. (2000) “Ecological impacts of dams, water diversions and river management on floodplain wetlands in Australia.” Austral Ecology, 25, 109–127.
Kingsford, R.T., Lemly, A.D., and Thompson, J.R. (2006) “Impacts of dams, river management and diversions on desert rivers.” Ecology of Desert Rivers, Kingsford, R.T. (ed), Cambridge University Press, Cambridge, UK, 203–247.
Koehn, J.D., and O’Connor, W.G.(1990) “Biological Information for Management of Native Freshwater Fish in Victoria.” Victorian Government Printing Office, Melbourne, Australia.
Morton, S., Bourne, G., Cristofani, P., Cullen, P., Possingham, H., and Young, M. (2002) “Sustaining our natural systems and biodiversity: an independent report to the Prime Minister’s Science, Engineering and Innovation Council.” CSIRO and Environment Australia, Canberra, Australia.
McPhail, I.R., and Young, E.M. (1991) “Water for the environment in the Murray-Darling Basin.” Water Allocation for the Environment , Pigram, J.P., and Hooper, B.P. (eds), The Centre for Water Policy Research, University of New England, Armidale, Australia, 191–210.
NSW Department of Environment and Climate Change. (2008) “Gwydir Environmental Contingency Allowance Annual Flow Plan 2008-2009.” New South Wales Government, Armidale, Australia.
Puckridge, J.T., Sheldon, F., Walker, K.F., and Boulton, A.J. (1998) “Flow variability and the ecology of large rivers.” Marine and Freshwater Research, 49, 55–72.
Rayburg S., Neave M., Thoms M., and Mesley E. (2004) “A preliminary investigation into the influence of changing stream network patterns on the distribution of water in the Narran Lakes Ecosystem.”, Proceedings of the 4th Australian Stream Management Conference: linking rivers to landscapes. Department of Primary Industries, Water and the Environment, Hobart, Tasmania.
Thoms, M.C., Beyer, P.J., and Rogers, K.H. (2006) “Variability, complexity and diversity: the geomorphology of river ecosystems in dryland regions.” Ecology of Desert Rivers, Kingsford, R.T. (ed), Cambridge University Press, Cambridge, UK, 47–75.
Thoms, M.C., and Parsons, M. (2003) “Identifying spatial and temporal patterns in the hydrological character of the Condamine–Balonne River, Australia, using multivariate statistics. River Research and Applications, 19, 443–457.
Thoms, M.C., and Sheldon, F. (2000) “Lowland rivers: an Australian introduction.” Regulated Rivers: Research and Management, 16, 375–383.
Wilson, G.G., and Smith, B.S. (2002) “Fish otolith microstructure as a tool for defining environmental flow requirements in freshwater ecosystems.”, Proceedings of the International Conference on Environmental Flows for River Systems, incorporating the 4th International Ecohydraulics Symposium, University of Cape Town, South Africa.
Wilson, G.G., Spencer, J., and Heagney, E. (in press) “Responses of fish and waterbirds to flow variability in the Lower Gwydir wetlands.” Ecosystem Response Modelling in the Murray-Darling Basin. CSIRO Press, Melbourne, Australia.
Wilson, G. and, Wright, A. (2005) “Fish recruitment in the Border Rivers and Moonie catchments.” Murray-Darling Freshwater Research Centre, Goondiwindi, Australia.
Young, W.J., and Kingsford, R.T. (2006) “Flow variability in large unregulated dryland rivers.” Ecology of Desert Rivers, Kingsford, R.T. (ed), Cambridge University Press, Cambridge, UK, 11–46.
Project outputs and conference abstracts
Managing Lower Gwydir environmental flows 182
Manuscript submitted to Marine and Freshwater Research, August 2009 Trophic structure of benthic resources and consumers varies across a regulated floodplain wetland Jeff KellewayA, Debashish MazumderB, G. Glenn WilsonC, Neil SaintilanA, Lisa KnowlesA, Jordan IlesA and Tsuyoshi KobayashiA,D
A NSW Department of Environment, Climate Change and Water, PO Box A290, Sydney South, NSW 1232, Australia B Institute for Environmental Research; Australian Nuclear Science and Technology Organisation, PMB 1, Menai NSW 2234, Australia C School of Environmental and Rural Science, University of New England, Armidale NSW 2351, Australia D Corresponding author. Email: [email protected] Abstract. Riverine food webs are often laterally disconnected (i.e. between watercourses) in regulated floodplain wetlands for prolonged periods. This study reports the spatial variation observed in the trophic structure between watercourses in a regulated floodplain wetland that shared the same source water but were laterally disconnected. Specifically we investigated the trophic structure of benthic resources and consumers (species of crustaceans, and native and exotic fish) of three watercourses in the Gwydir Wetlands in eastern Australia. Results showed that the crustaceans Cherax destructor (yabby), Macrobrachium australiense (freshwater prawn), the exotic fish Cyprinus carpio (European carp) and Carassius auratus (goldfish) showed significantly different δ13C values between watercourses, suggesting spatial differences in primary carbon sources. Trophic positions were estimated using δ15N values of benthic organic matter as the base of the food web in each watercourse. The estimated trophic positions and gut contents showed differences in trophic positions and feeding behaviours of consumers between watercourses, in particular for Melanotaenia fluviatilis (Murray-Darling rainbowfish) and M. australiense. Our findings suggest that the observed spatial variation in trophic structure appear to be largely related to the spatial differences in the extent and type of riparian vegetation (i.e. allochthonous carbon source) across the floodplain that most likely constituted part of the benthic resources.