managing heat in agricultural work · 3 heat-related illnesses and determining the risk of heat...
TRANSCRIPT

Managing heat in agricultural workIncreasing worker safety and productivity by controlling heat exposure
1FORESTRY WORKING
PAPER

FOOD AND AGRICULTURE ORGANIZATION OF THE UNITED NATIONSRome, 2018
Managing heat in agricultural workIncreasing worker safety and productivity by controlling heat exposure
Recommended citation: Staal Wästerlund, D. 2018. Managing heat in agricultural work: increasing worker safety and productivity by controlling heat exposure. Forestry Working Paper No. 1. Rome, FAO.
The designations employed and the presentation of material in this information product do not imply the expression of any opinion whatsoever on the part of the Food and Agriculture Organization of the United Nations (FAO) concerning the legal or development status of any country, territory, city or area or of its authorities, or concerning the delimitation of its frontiers or boundaries. The mention of specific companies or products of manufacturers, whether or not these have been patented, does not imply that these have been endorsed or recommended by FAO in preference to others of a similar nature that are not mentioned.
The views expressed in this information product are those of the author(s) and do not necessarily reflect the views or policies of FAO.
ISBN 978-92-5-130502-7
© FAO, 2018
FAO encourages the use, reproduction and dissemination of material in this information product. Except where otherwise indicated, material may be copied, downloaded and printed for private study, research and teaching purposes, or for use in non-commercial products or services, provided that appropriate acknowledgement of FAO as the source and copyright holder is given and that FAO’s endorsement of users’ views, products or services is not implied in any way.
All requests for translation and adaptation rights, and for resale and other commercial use rights should be made via www.fao.org/contact-us/licence-request or addressed to [email protected].
FAO information products are available on the FAO website (www.fao.org/publications) and can be purchased through [email protected].
This publication has been printed using selected products and processes so as to ensure minimal environmental impact and to promote sustainable forest management.
Cover photo: © FAO/Joerg Boethling

Contents
Key points ................................................................................................................... v
Acknowledgements .................................................................................................. vi
Acronyms and abbreviations ................................................................................... vii
Executive summary ................................................................................................... ix
1 Introduction ................................................................................................... 1
2 Working in a hot environment ..................................................................... 5
3 Heat-related illnesses and determining the risk of heat stress ................. 9Heat-related illnesses ................................................................................................. 9
Heat stroke ........................................................................................................................9
Heat exhaustion ..............................................................................................................10
Heat cramp ......................................................................................................................10
Circulatory hypostatic heat syncope ..............................................................................10
Heat rash ..........................................................................................................................10
Determining the risk of heat stress ........................................................................ 10Climatic conditions .......................................................................................................... 11
Metabolic heat production ............................................................................................ 11
ISO standards for evaluating the risk of heat stress ..................................................... 12
4 Lessons learned on working in a hot environment ...................................19Heat and labour productivity ................................................................................. 19
Heat and clothing .................................................................................................... 28
Heat and child labour .............................................................................................. 30
5 Managerial implications ............................................................................. 33Risk assessment strategies ....................................................................................... 33
6 Conclusions and recommendations ........................................................... 39
7 References .................................................................................................... 43
Appendix 1. Calculating time-weighted metabolic rate ............................... 49
Appendix 2. Scoring scales for evaluating thermal conditions at work ...... 52
iii

Figures1 Minimum and maximum wet-bulb globe temperature
measurements taken at 15-minute intervals in the 2010 and 2011 sugar-cane harvesting seasons, Costa Rica .................................................... 17
2 Bundles of rice harvested per hour, by wet-bulb globe temperature ......... 21
3 Effects of climatic heat and dehydration on physical work output ............ 22
4 Estimates of daily water requirements for a range of environmental conditions and energy expenditures ............................................................. 24
5 Urine colour chart ........................................................................................... 24
6 Percentage of workers in various categories of hydration, according to urine gravity analysis, before and after forest work in autumn and winter, South Africa .............................................................. 26
Tables1 Estimates of metabolic rate for basic activities ............................................ 12
2 Estimates of metabolic rate for agricultural activities ................................. 12
3 Wet-bulb globe temperature index reference values, according to ISO 7243 ..................................................................................... 14
4 Work and rest guidelines for average-sized, heat-acclimatized and hydrated soldiers wearing battle dress uniforms ................................. 22
5 Symptoms of dehydration at different body-weight losses ........................ 23
6 Time taken for a worker to attain an inner body temperature of 38.5 °C in a 37 °C environment performing moderate work, for various clothing ensembles ..................................................................... 29
7 Clothing adjustment factors .......................................................................... 30
8 Description of work zones .............................................................................. 34
9 Climate data (e.g. air temperature, humidity; see Appendix 2 for full list) ............................................................................ 34
10 Description of heat source and suggestions for prevention ........................ 34
Case studies1 Death by heat stroke in the United States of America ................................... 9
2 Heat exposure of sugar-cane workers in Costa Rica ..................................... 16
3 Workload of sugar-cane workers in Colombia .............................................. 19
4 Effect of heat exposure on the productivity of rice harvesting in India ..... 20
5 Dehydration and fluid requirements of forest workers in South Africa ..... 25
6 Forest-worker dehydration in Zimbabwe ...................................................... 26
7 Heat-related illnesses among foreign workers in the United States of America ................................................................................ 35
8 Heat-related illnesses among farm workers in the United States of America ................................................................................ 35
iv

v
1. Workers in agriculture (inclusive of fisheries and forestry) are regularly exposed to warm to hot working conditions.
2. Because of the physically demanding nature of work in the sector, workers often produce considerable excess heat, increasing their risk of heat stress in even moderately warm conditions, especially if wearing protective clothing that restricts heat dissipation.
3. Labour productivity is reduced in hot conditions. It is in the interests of both employers and employees, therefore, to limit heat exposure and prevent dehydration.
4. The adequate organization and design of workplaces, and the implementation of relatively simple measures, can minimize the risk of heat stress.
5. Representative groups should be formed at workplaces comprising employees, safety managers and work leaders to document working conditions, assess the risk of heat stress, and develop measures to minimize such risk, seeking expert assistance as required.
6. Potable fluids should be provided at workplaces and – because thirst is an insufficient indicator of the body’s requirements for fluids – employees should be educated on the need to drink frequently.
7. Extreme care should be taken in exposing children to work in hot environments because of their limited capacity to cool their bodies through sweating.
Key points

vi
Acknowledgements
This document is part of FAO’s work on its Subprogramme on Rural Areas and International Labour Standards, which is part of Output 2.2 (“Application of International Labour Standards to Rural Areas”) of Organizational Outcome 2 (“Decent Rural Employment”) under Strategic Objective 3 (“Reduce Rural Poverty”). In this subprogramme, FAO supports governments and development partners to extend the application of international labour standards to rural areas, including measures on occupational safety and health.
The topic of this document is heat stress in agriculture, with an emphasis on forestry. Its author is Dr Dianne Staal Wästerlund of the Swedish University of Agricultural Sciences, and it was peer-reviewed by Professor Lars Eliasson at the Forestry Research Institute of Sweden. Work was coordinated and supervised by Dr Jonas Cedergren, Forestry Officer (Harvesting), Forest Resource Management Team, FAO Forestry Department. Thanks to Alastair Sarre for editing and Kate Ferrucci for design and layout.
vii
Acronyms and abbreviations
°C degree(s) Celsius CAF clothing adjustment factorClo reciprocal of clothing conductivityFAO Food and Agriculture Organization of the United Nationsg gram(s)ISO International Organization for Standardizationkg kilogram(s)m metre(s)mm millimetre(s)m2 square metre(s)PHS predicted heat strainSDG Sustainable Development GoalW mechanical energyWBGT wet-bulb globe temperature

viii
Executive summary
Heat stress is a problem when the body is unable to dissipate body heat sufficiently to the surroundings. Such a situation is common among workers in the agriculture sector because most of the work is performed outdoors where the climate cannot be controlled. This report reviews the implications of heat stress in working environments in agriculture (with a focus on farming and forestry), how it affects the human body, the risks it poses to human health, how it is measured, how it affects labour productivity, and how it can be managed.
Managers often disregard heat stress as an occupational hazard, and workers therefore often have to handle this aspect of the work environment themselves. Heat stress has a negative effect on worker performance, and exposure to severe heat stress can be fatal; nevertheless, it can be greatly reduced with proper work organization and education.
The aim of Sustainable Development Goal (SDG) 8 is, among other things, to “promote … decent work for all” (United Nations General Assembly, 2015), and occupational safety and health are important aspects of this. Heat stress can be managed by putting in place relatively simple measures, but this requires awareness-raising and training among both employers and employees.
It is important that the inner temperature of the human body is maintained at 37 °C; otherwise, internal organs will not function properly. The human body transforms food into energy, only a small part of which is mechanical energy used to perform work. Most of the energy from food is transformed into heat, which is transported by the blood to the skin to be dissipated into the environment. In a warm environment, this dissipation is achieved mainly through sweating. People who are unaccustomed to a given set of climatic conditions or to the work to be performed in such conditions may need to increase their sweat production by doing light work in those conditions for 7–9 days. Females sweat significantly less than males, which may make them more vulnerable to heat stress. Children, especially young children, may be more vulnerable than adults to heat stress. Heat stress may increase the risk that pregnant females will give birth prematurely or to babies with birth defects. Warm climatic conditions also affect mood and behaviour, and unsafe behaviour becomes more common in hotter environments, increasing the risk of accidents.
Clothing has a major influence on the body’s ability to dissipate heat. The material used is the main determinant of the insulating characteristics of clothing and its capacity to transfer moisture. Many activities in agriculture and especially forestry require protective clothing, which is often designed to prevent contact with hazards in the surroundings; such preventive measures may reduce the body’s capacity to dissipate heat. Studies are ongoing on how best to include clothing in risk assessment methods for heat stress (at present, such methods assume a single layer of light cotton work clothes).
ix
Heat stroke, which can be fatal in the absence of swift, effective treatment, is the most serious health risk posed by heat stress. It develops when a person works for a sustained period in hot conditions, is unable to continue sweating, and the inner body temperature rises rapidly beyond 40 °C. Heat-stroke victims need to be cooled rapidly and require urgent medical care.
A person experiencing heat exhaustion is severely dehydrated and fatigued, often suffers from giddiness and nausea, and may have a headache. Heat-exhaustion sufferers should be moved to a cool environment for rest and water to restore their water balance; they should return to work only when fully hydrated, which may take up to 24 hours.
Heat cramps may occur when a person has consumed a large volume of water but has not replaced the salts lost through sweating. For moderately heavy work, salt obtained from food is often adequate to replace salts lost by sweating. Otherwise, supplementation with salt tablets or salted liquids (e.g. sports drinks) may be considered.
The International Organization for Standardization (ISO) has adopted assessment methods for the risk of heat stress. The most commonly used of these is the wet-bulb globe temperature (WBGT) index, which is calculated by measuring the natural wet-bulb temperature, the globe temperature and the air temperature to estimate the effects of temperature, humidity, wind speed (wind chill) and visible and infrared radiation (usually sunlight) on humans. The standard provides reference values for acclimatized and unacclimatized people with various workloads; there is a risk of heat stress if the calculated index value exceeds the reference value appropriate for the conditions. The most reliable method for assessing the risk of heat stress is to measure physiological responses, such as the inner body temperature, skin temperature, heart rate and body-mass loss, but such measurements may interfere with work activities, are invasive (and therefore may be unacceptable to workers), and should only be performed by people with medical training.
Climatic heat affects labour productivity, primarily through dehydration. Studies have shown that workers often only replace approximately half to two-thirds of the fluids lost through sweating at work when fluid is freely available. It is important, therefore, that management ensures the availability of sufficient fluids and that workers are made aware of the need to drink. Moderate dehydration amounting to a body-mass loss of 4 percent may reduce physical work output by 50 percent. Dehydration may lead to heat exhaustion and increases the risk of heat stroke. The quantity of fluids required ranges between 2 litres per day for light work in temperatures around 10 °C WBGT and in extreme cases 15 litres per day for very strenuous work in 30 °C WBGT. Fluids should be relatively cool (15–20 °C), coffee and tea should be avoided, and alcoholic beverages should not be permitted. It is best to drink small quantities of water frequently.
The ISO has developed a standard for risk assessment strategies to prevent stress and discomfort caused by workplace thermal conditions. In such strategies, representative groups of workplace employees, safety personnel and management collect information systematically and proposes preventative measures, with expert assistance as required.
Because agricultural work can involve entire families, children are often engaged in agricultural activities from an early age. Knowledge of the reaction of children to heat

x
exposure is limited, but there are indications that young children may be at a relatively high risk of heat stress. Adults should reinforce the need for children to drink water frequently in warm to hot conditions.


1
1 Introduction
An estimated 31.8 percent of the world’s working population was employed in the agriculture sector1 in 2013 (International Labour Organization, 2014). The proportion of females (33.2 percent of the female working population) was slightly higher than that of males (31.05 percent of the male working population). A characteristic of most agricultural work is that it is performed outdoors, and most agricultural workers, therefore, are exposed continually to prevailing climatic conditions. Employment in the agriculture sector is particularly high in Southeast Asia and the Pacific (40.3 percent of the total working population) and sub-Saharan Africa (61.3 percent) (International Labour Organization, 2014). These regions generally have tropical or arid climates characterized by high temperatures throughout the year.
Heat stress occurs when the body cannot sufficiently dissipate its excess heat to the surroundings. In occupational settings it has mainly been studied in industries where heat is used in the production process (e.g. the steel and brickmaking industries), where options may exist for reducing heat exposure by modifying the work environment. Such options are usually unavailable in the agriculture sector, however, because of its outdoor setting; to avoid heat stress, therefore, it is necessary to adapt the organization of work to suit the climatic conditions.
The risk of heat stress among forest workers has long been recognized (e.g. Axelsson, 1974). A large proportion of the farming population is also at risk, including males, females and children. Moreover, climate change is expected to increase the risk of exposure to heat stress (Lundgren et al., 2013).
The mechanisms of heat stress are well understood, but there are still many casualties: “There seems … to be a tendency to forget the requirement for working practices, [and] despite a satisfactory knowledge, lessons seem to have to be re-learnt” (Parsons, 2002). According to Jackson and Rosenberg (2010), agriculture, forestry, fishing and hunting are particularly exposed to heat stress. A study over the period 2003–2008 in the United States of America, for example, found that the agriculture, forest, fishing and hunting subsectors had the highest fatality rates due to heat-related illnesses (0.3 deaths per 100 000 fulltime workers, combined, compared with 0.02 for all industries) and, moreover, there was an increasing trend (Centers for Disease Control and Prevention, 2008). Typically, fatal cases often involved relatively young workers who had recently commenced their employment at work sites and were unfamiliar with or unacclimatized to the prevailing working conditions (Gubernot, Andersson and Hunting, 2015; see case study 1). Data on non-fatal cases of heat stress are very poor.
1 The FAO definition of agriculture is inclusive of forestry and fisheries. This report focuses especially on heat management in farming and forestry.
Managing heat in agricultural work2
Agriculture is one of the most dangerous sectors. It can involve exposure to numerous hazards, such as toxic pesticides and fertilizers, potentially dangerous machinery, and extreme weather, with the risk of health problems such as cancer, respiratory diseases and injury. The hazardous nature of agricultural work is exacerbated because it is usually undertaken in rural areas, with often-inadequate health infrastructure and services, a lack of information, and inadequate training and education. Another challenge is weak or non-existent enforcement of agricultural safety and health laws and standards.
The aim of Sustainable Development Goal (SDG) 8 is, among other things, to “promote … decent work for all” (United Nations General Assembly, 2015), and occupational safety and health are important aspects of this. Heat stress can be managed by putting in place relatively simple measures, but this requires awareness-raising and training among both employers and employees.
This report reviews the implications of heat stress in working environments, how it affects the human body (both physically and mentally), the risks it poses to human health, how it is measured, how it affects labour productivity, and how it can be managed. Examples of heat stress in agriculture, including forestry, are given, drawn from the literature. The report is aimed at managers in charge of agricultural operations, as well as at teachers in agricultural schools at different levels. The report is a contribution to the work of FAO in attaining SDGs 3 (good health and well-being) and 8 (decent work and economic growth). Indirectly, it supports work towards SDG 1 (no poverty) and SDG 10 (reduced inequalities), for which decent working conditions are important prerequisites. This report is part of FAO’s work in Sub-Programme on Rural Areas and International Labour Standards, which is part of Output 2.2 (“Application of International Labour Standards to Rural Areas”) of Organizational Outcome 2 (“Decent Rural Employment”) under Strategic Objective 3 (“Reduce Rural Poverty”).


© FA
O/G
. NA
POLITA
NO

5
2 Working in a hot environment
The human body produces heat when it transforms food into the energy required to perform work. It is not very efficient in using this energy for the intended activity, however, with approximately 75 percent of the energy in food transformed into heat. The heavier the work performed, the more energy is required and the more heat is produced. A small part of the heat is used to maintain the inner body temperature at 37 °C, but most of it is dissipated into the surroundings via:
• radiation;• conduction (i.e. when touching objects with lower temperatures than the skin);• convection (i.e. when wind takes hot air away from around the body); and• evaporation in the form of sweat.If heat cannot be dissipated sufficiently, it is stored in the body, thereby increasing
the inner body temperature. The conceptual heat-balance equation is:
M - W = E + R + C + K + S (1)
Where M = the metabolic rate of the body; W = the mechanical work the body is performing; E = heat transfer through evaporation (sweat); R = heat transfer through radiation; C = heat transfer through convection (wind); K = heat transfer through conduction; and S = the heat to be stored.
The inner body temperature should be maintained at 37 °C to ensure the proper functioning of organs. Excess heat produced by cells is transported away, mainly by extracellular fluids (e.g. blood). The skin has many small blood vessels in which blood flow can be regulated, depending on the inner body temperature – they open when the inner body temperature increases, thereby enabling more blood to flow close to the surface and increasing the area of skin that can exchange heat with its surroundings. The main heat exchange between the body and the environment occurs via the head, hands and feet. As more small blood vessels in the skin open, the total blood volume is distributed over an increasingly large area; therefore, there is a reduction in the volume of blood returned to the heart with each heartbeat. The heart rate increases to ensure sufficient oxygen supply to the organs.
The body (via the skin) can dissipate heat to the surroundings by radiation if the air temperature is lower than the skin temperature, which is approximately 33.7 °C (although this may vary, depending on the body part). Another way to dissipate heat is by convection if the body is exposed to wind, or by conduction if the body is in contact with objects that have a lower temperature than the skin and can transport heat. These options are often limited in warm environments, however. The most common

Managing heat in agricultural work6
way to dissipate heat from the body in a warm environment, therefore, is evaporation in the form of sweat. Sweat consists of water and salts taken from the blood, and it is excreted by sweat glands, which are distributed over the body. Sweat is evaporated into the air when air humidity is lower than 100 percent. Evaporation is the mechanism of heat exchange; sweat that drips to the ground or is swept away does not contribute to heat dissipation. A person at rest will lose approximately 400–700 g of fluid per day by sweating through the skin and 150–200 g by breathing. When working, a person can easily lose 600 g of fluid per hour in temperate conditions.
Research has shown that the rate of sweating of females is significantly lower than that of males; moreover, females often start sweating at higher inner body temperatures and therefore are at greater risk of suffering from heat disorders. There is debate about whether this disparity is due to differences in anthropometric features between females and males or differences in physical fitness, or whether females and males use different sweating mechanisms (Mehnert, Bröde and Griefahn, 2002). On average, males have a higher body mass and therefore need more energy to move the body, thereby producing more heat. Males have fewer sweat glands per unit body area compared with females but produce more sweat per gland.
Pregnant women exposed to heat may have an increased risk of pre-term birth (Carolan-Olah and Frankowska, 2014) and of giving birth to children with malformations (van Zutphen et al., 2012). There is also evidence, however, that the heat-dissipating ability of females is enhanced slightly during pregnancy (Vahaeskeli, Erkkola and Seppanen, 1991) and that maternal physiological adaptations during pregnancy are designed to protect the foetus from heat exposure when performing physical work (Clapp, 1991). Children have fewer sweat glands than adults, making them more vulnerable to heat disorders when working in hot environments (Gomes, Carneiro-Junior and Marins, 2013; Xu et al., 2012). Elderly people often have reduced cardiovascular functioning, problems with blood flow, and reduced physical fitness, all of which decrease thermoregulatory ability (Kenny et al., 2009); they also produce less sweat per sweat gland. Obese individuals, and those with diabetes, have an increased risk of heat illnesses (Kenny et al., 2009).
Regular exposure to heat, especially in combination with work, leads to physiological acclimatization. Most importantly, the human body can improve its capability for sweating and commence sweating at lower body temperatures. An acclimatized person, therefore, is able to sweat more and can also reduce the excretion of salts. For people not normally exposed to a hot environment, it may be necessary to undertake light work for a few hours per day for 7–9 days to enable their bodies to acclimatize (Parsons, 2002). People accustomed to living in a hot environment but unfamiliar with the physical demands of a particular outdoor work task must acclimatize by taking regular rest breaks in the new job for the first few days. Individuals who are normally physically active often have improved sweat production and are able, therefore, to acclimatize more quickly than individuals who are relatively physically inactive. An acclimatized individual can easily lose 1 000 g of fluid per hour in sweat in moderately warm conditions.
Thermal conditions affect the thermal sensation of comfort and can also affect a person’s psychological state – that is, their mood and behaviour. More than 2 000 years
Working in a hot environment 7
ago, Hippocrates noticed that the weather affected human health and advised further study (Parsons, 2002). Despite considerable research, however, the mechanisms by which the climate affects human mood and behaviour have not been identified, although it is known that the frequency of unsafe behaviour increases in hot environments (Ramsey et al., 1983). According to Hancock, Ross and Szalma (2007), this can be attributed mainly to the degradation of psychomotor and perceptual task performance. It is also known that riots tend to occur when the temperature is high, but the underlying reasons for this are not understood. Laboratory studies have shown that people are less sympathetic to other people’s opinions in hot conditions compared with when they are in thermally comfortable environments (Parsons, 2002).

© FA
O/S. M
AIN
A

9
3 Heat-related illnesses and determining the risk of heat stress
The physiological response of the human body to heat stress is referred to as heat strain. Heat-related illnesses – which can affect females and males of any age – occur when the body’s attempts to cool itself are insufficient and the body starts to store heat. This chapter describes typical symptoms of heat-related illnesses and the recommended first-aid actions, and it explores methods for determining the risk of heat-related illnesses.
HEAT-RELATED ILLNESSES
Heat strokeHeat stroke is the most dangerous heat-related illness; it can be fatal if not treated swiftly (case study 1). A heat stroke may occur when an individual has been working for a sustained period in hot conditions. Particularly at risk are unacclimatized individuals and those who are physically unfit or obese or who have cardiovascular problems. Alcohol intake also increases the risk. When approaching heat stroke, the body is unable to produce sweat; one of the typical symptoms, therefore, is hot, dry skin. Body temperature exceeds 40 °C and rises quickly, and the individual is often confused and may have convulsions. If not treated immediately, the individual loses consciousness. Immediate and rapid cooling is required, preferably by immersing victims in chilled water or wrapping them in wet sheets. Fanning to accelerate cooling is also recommended. Heat-stroke victims require urgent medical care. Gubernot, Andersson and Hunting (2015) found that, in the United States of America, the risk of agricultural workers dying of heat stroke was 35 times higher than the risk in the average working population.
CASE STUDY 1
Death by heat stroke in the United States of America
In Washington, United States of America, a 23-year-old forest worker – a choker-setter in a
high-lead logging operation – died of heat stroke on a hot day in July when the temperature
exceeded 30 °C. The work that day was performed on a relatively easy slope, and plenty
of drinking water was available at the landing. The victim was new to the job, however,
having worked there only five days. His colleagues carried him to a vehicle after he became
ill, and he was given water and cooled down. Emergency medical personnel were able to
revive him when he passed out on his way to hospital, but he later died.
Source: AOL, 2016.

Managing heat in agricultural work10
Heat exhaustionHeat exhaustion occurs in connection with dehydration and may develop into heat stroke. Blood volume is reduced due to sweating, putting the circulatory system under strain because the reduced blood flow needs to be distributed to the working muscles as well as to the skin to dissipate heat. Those affected by heat exhaustion are fatigued, experience giddiness and nausea, and may suffer headaches. The skin may become clammy and moist, and the complexion can be either pale or very flushed. Blood pressure is low and the pulse is high, increasing the risk of fainting. Urine volume is very small and highly concentrated. Poorly acclimatized individuals are at a higher risk of heat exhaustion. Victims should be taken to cooler surroundings for rest, preferably in the prone position, administered fluids to drink, and kept at rest until the body’s water balance is restored. Unacclimatized people should have an ample supply of suitable fluids and be reminded to drink frequently.
Heat crampIndividuals may suffer heat cramp after drinking large volumes of water when working in a hot environment with no replenishment of the salts lost through sweating. The cramps, which occur in the muscles used for work, may start during or after work. Heat cramp can be prevented by adequate intake of salt during meals, and the consumption of salted liquids can relieve the symptoms.
Circulatory hypostatic heat syncopeBlood pools in the lower parts of the body when a person stands erect and immobile for long periods. If the person is unacclimatized, this may lead to fainting in a hot environ-ment. Treatment is simple: a person suffering from circulatory hypostatic heat syncope can recover by moving to a cooler area and resting in the prone position.
Heat rashSweat glands may become blocked when a person is exposed continuously to humid heat and the skin is continually wet with unevaporated sweat. The blockage of sweat glands can lead to inflammatory reactions: the affected skin may appear to be covered with blisters, and the person may experience a pricking sensation in the area affected by the rash. Heat rash can be avoided with proper hygiene amenities. Workers should have access to cool areas where the skin can dry, and they should have facilities where they can wash off sweat.
DETERMINING THE RISK OF HEAT STRESSThe measurement of heat stress takes, as a starting point, the principal heat-balance formula (equation 1 on page 9), with the aim of limiting the heat stored in the body (S). This formula implies that two aspects must be taken into consideration:
1. the thermal conditions of the surroundings, which determine the possibilities for heat dissipation; and
2. the work being performed, which determines the amount of heat produced.
Heat-related illnesses and determining the risk of heat stress 11
Climatic conditionsThe four basic climatic parameters that determine the thermal environment of a person are:
1. air temperature;2. radiant temperature; 3. humidity; and4. air movement. Air temperature varies in the working environment, particularly outdoors. For
example, objects might provide shade at some worksites, but other worksites might be exposed to direct sun. When measuring the air temperature at a worksite, therefore, it is important to find a representative spot in the vicinity of the person. The person might also be exposed to heat in the form of radiation, for example from direct exposure to the sun, machines that radiate heat (e.g. motor vehicles), light sources, or reflections in glass or water. Humidity is determined by the amount of water vapour in the air, often expressed as the ratio of the partial vapour pressure to the saturated water vapour pressure. The quantity of water the air can contain depends on the air temperature – with the air capable of containing more water at higher temperatures.
Air movement can take hot air away from the vicinity of the body and replace it with cooler air, thus helping transfer heat from the body to the environment. Such air movement is likely to vary over the work period, as may its direction. In measuring it, therefore, it is important to determine the mean air movement in all directions over the period of exposure.
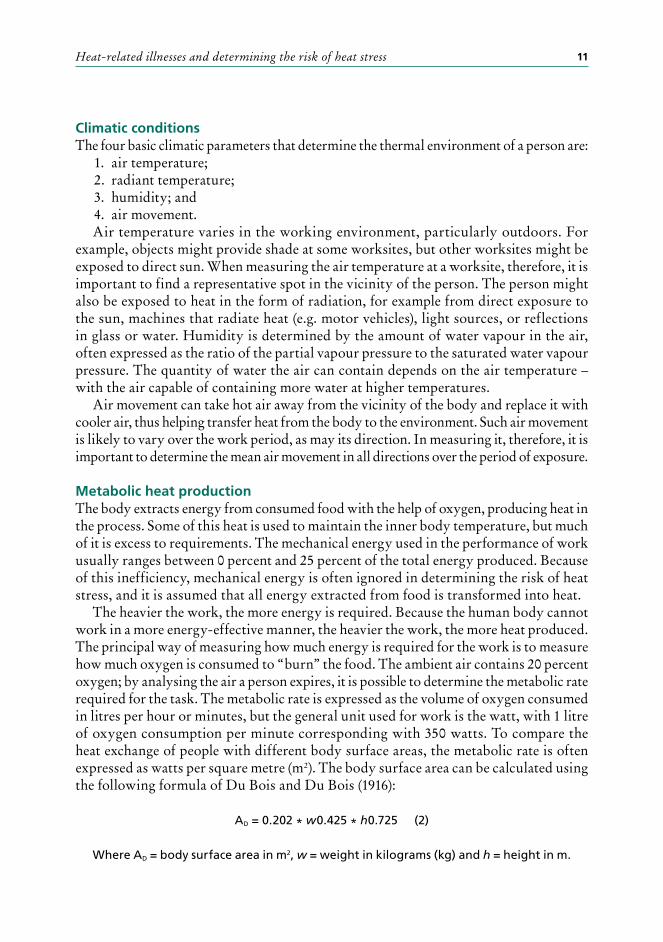
Metabolic heat productionThe body extracts energy from consumed food with the help of oxygen, producing heat in the process. Some of this heat is used to maintain the inner body temperature, but much of it is excess to requirements. The mechanical energy used in the performance of work usually ranges between 0 percent and 25 percent of the total energy produced. Because of this inefficiency, mechanical energy is often ignored in determining the risk of heat stress, and it is assumed that all energy extracted from food is transformed into heat.
The heavier the work, the more energy is required. Because the human body cannot work in a more energy-effective manner, the heavier the work, the more heat produced. The principal way of measuring how much energy is required for the work is to measure how much oxygen is consumed to “burn” the food. The ambient air contains 20 percent oxygen; by analysing the air a person expires, it is possible to determine the metabolic rate required for the task. The metabolic rate is expressed as the volume of oxygen consumed in litres per hour or minutes, but the general unit used for work is the watt, with 1 litre of oxygen consumption per minute corresponding with 350 watts. To compare the heat exchange of people with different body surface areas, the metabolic rate is often expressed as watts per square metre (m2). The body surface area can be calculated using the following formula of Du Bois and Du Bois (1916):
AD = 0.202 * w0.425 * h0.725 (2)
Where AD = body surface area in m2, w = weight in kilograms (kg) and h = height in m.

Managing heat in agricultural work12
The average body surface area commonly used in the literature is 1.8 m2 for males and 1.6 m2 for females, based on average-sized people in industrialized countries (i.e. a male with a weight of 70 kg and a height of 1.70 m, and a female with a weight of 60 kg and a height of 1.60 m); correction may be required for specific populations and individuals. Table 1 provides estimates of the metabolic rate for certain basic activities. Table 2 contains examples from agriculture.
TABLE 1Estimates of metabolic rate for basic activities
Activity Estimated metabolic rate (watts per m2)
Lying 45
Sitting 58
Walking on level, even path at 2 km/h 110
Going upstairs (0.172 m per step), 80 stairs per minute 440
Transporting a 10 kg load on level at 4 km/h 185
Source: Parsons (2002).
TABLE 2Estimates of metabolic rate for agricultural activities
Activity Estimated metabolic rate (watts per m2)
Ploughing with tractor 170
Digging with spade (24 lifts per minute) 380
Felling tree with chainsaw 235
Debarking (summer) 225
Working with axe (weight 2 kg, 33 blows per minute) 500
Source: ISO (2004b).
Measuring oxygen consumption in the field is not easy: it requires instruments that may intrude on work performance, thus giving unreliable results. Oxygen consumption, therefore, is often estimated indirectly by measuring heart rate. Under temperate climatic conditions, heart rate and oxygen consumption are closely linearly related for heart rates above 120 beats per minute, although the relationship varies by individual. Ideally, this relationship should be determined for each individual by measuring heart rate and oxygen consumption under several known workloads and using regression analysis. When the relationship between heart rate and oxygen consumption is known, heart rate can be monitored during work, average heart rate calculated and oxygen consumption estimated using the linear relationship. Heart rate is influenced by a number of factors in addition to workload, however, such as climatic conditions. Although this limitation is well known, the indirect measurement approach is often the best method available (Apud et al., 1989).
The International Organization for Standardization (ISO)’s ISO 8996 standard (ISO, 2004b) provides methods for estimating metabolic heat production. Among other things, it contains tables of values for workload by occupation and activity (see Table 3 for an

Heat-related illnesses and determining the risk of heat stress 13
example). There is, however, a high risk of error in using such tabulated values because actual working conditions may differ considerably from the conditions under which the ISO estimates were made. Tabulated values also do not consider rests taken while working. Errors can be minimized by splitting a given work task into activities with different workloads and then estimating the workloads for each activity. Tree-planting, for example, may consist of:
• walking between planting spots;• preparing the planting spot; • planting the tree in the planting spot;• tamping down the soil around the newly planted tree; and• taking a break. Dividing a task into separate activities enables the identification and minimization of
factors that may affect the workload, thereby obtaining a more accurate estimate of the workload per activity. The workload for walking between planting spots, for example, will depend on the distance, the terrain and the equipment used to carry the seedlings. The workload for preparing a planting spot will depend on the tool used for this activity and the skill of the planter. The workload involved in taking a break depends on body posture and whether the person sits or stands. To calculate the overall workload, a time study should be made to calculate the time-weighted average workload. Appendix 1 presents tables showing metabolic rates by type of work and an example of how to calculate the time-weighted average workload using tabulated values.
ISO standards for evaluating the risk of heat stressMany heat-stress indices have been developed with the purpose of establishing work conditions that reduce the risk of heat-related illnesses. Expert panels have developed ISO standards to establish accepted assessment systems. These standards are complemen-tary in the sense that a simple measurement method (e.g. the WBGT index, see below) should be used to identify potential risk areas; if a potential risk is found to exist, the initial method should be followed up with more advanced methods. Reference values provided by the standards are generally seen as conservative, but they also have clear limitations, especially in how they take into consideration the clothing worn. Revisions of the standards are ongoing (Parsons, 2013).
WBGT indexThe wet-bulb globe temperature (WBGT) index (ISO standard 7243) was developed by the United States Navy in 1957 to control heat-related illnesses in training camps. It is a screening method that combines relatively simple climatic measurements with the work to be performed (see the example in case study 2). It should not be used in work situations where the person is exposed to hot conditions for very short periods (Parsons, 2013).
The following parameters are measured to determine the WBGT index: natural wet-bulb temperature; black-globe temperature; and air temperature (when the activity is performed outdoors in the sun). The natural wet-bulb temperature, defined as an object’s lowest temperature that can be achieved through evaporative cooling by covering the

Managing heat in agricultural work14
object with a water-soaked cloth, is a measure of both air temperature and humidity. The natural wet-bulb temperature (tnw in equations 3 and 4 below) is measured using a naturally ventilated thermometer that is cylindrical in shape and covered with a wick of highly absorbent material, such as cotton, which is kept wet during the measurement period. The globe temperature (tg) is a measure of radiative heat exposure; it is obtained by measuring the temperature inside a 150 mm diameter black globe. The thermometer used to measure air temperature (ta) should be shielded from direct sunlight but the air circulation around it should not be restricted.
Instruments exist for measuring the WBGT index directly. Moreover, in the ongoing revision of the ISO standard, a new measurement method may be included for predicting the WBGT index directly from meteorological data (Parsons, 2002). To calculate the index using the current method, the following equations are used:
WBGT = 0.7tnw + 0.3tg (3)
(for inside buildings or outside without solar load)
WBGT = 0.7tnw + 0.2tg + 0.1ta (4)(for outdoors with exposure to sunshine)
Where tnw = natural wet-bulb temperature, tg = globe temperature, and ta = air temperature.
In addition to measuring thermal conditions, an estimate must be made of the metabolic rate required for the work to be performed. If the work consists of work elements with differing metabolic rate requirements, a time-weighted average must be calculated (see Appendix 1 for an example).
TABLE 3Wet-bulb globe temperature index reference values, according to ISO 7243
Metabolic rate (M) (watts per m2)
WBGT reference value
Acclimatized persons (°C) Unacclimatized persons (°C)
M ≤ 65 33 33
65 < M ≤ 130 30 30
130 < M ≤ 200 28 28
200 < M ≤ 260 No sensible air movement
25
Sensible air movement
26
No sensible air movement
22
Sensible air movement
23
M > 260 23 25 18 20
Source: ISO (1989).
The ISO standard provides reference values for acclimatized and unacclimatized persons (Table 3), which were established with the aim of ensuring that the inner body temperature of the observed person would not exceed 38 °C. The reference values assume that light clothing is worn comparable with light trousers and a t-shirt. To determine the risk of heat stress in a given situation, the calculated WBGT index value is compared with

Heat-related illnesses and determining the risk of heat stress 15
the reference value for the estimated metabolic rate of work; if the calculated value exceeds the reference value, there may be a risk of heat stress, in which case further investigation may be warranted and adjustments in the working conditions may need to be made.
The American Conference of Governmental Industrial Hygienists has proposed correction factors for protective clothing, but these are still under discussion. It has also been shown that the WBGT index does not reflect heat strain adequately in conditions of high humidity and low air movement (d’Ambrosio Alfano et al., 2014).
Predicted heat strain calculationThe ISO standard 7933 (ISO, 2004a), which calculates predicted heat strain (PHS), uses the basic heat balance formula (1) to predict the risk of heat storage above acceptable limits. This is the most advanced available method for predicting the risk of heat stress. It is based on models that predict heat exchange due to radiation, conduction, convection and evaporation in the prevailing thermal conditions2 and requires measurements of air temperature, radiant temperature, air velocity and humidity and estimates of metabolic heat production and clothing insulation.
Based on these inputs, the method calculates the required evaporation rate as well as the “required skin wettedness” (i.e. the ratio between the required evaporative heat flow and the maximum evaporative heat flow under the prevailing conditions) to keep the heat balance. These values are compared with the maximum sweat rate and the maximum skin wettedness that can be achieved under the prevailing thermal conditions. The maximum sweat rate and the maximum skin wettedness depend partly on the acclimatization of the person, and the ISO standard provides maximum values for both acclimatized and unacclimatized people. The maximum allowable inner body temperature under the ISO standard is 38 °C. The standard also specifies the maximum allowable level of dehydration at 5 percent of the body mass in circumstances in which the person has full access to fluids.
Note that, according to the standard, a maximum dehydration of 5 percent of body mass will provide protection for 95 percent of the working population. If no fluids are available at the workplace, Malchaire (2014) recommended that the maximum allowable dehydration should be set at 3 percent of body mass. If any of these values is exceeded by the calculated required evaporation rate or the required skin wettedness, the index provides maximum allowable exposure times for acclimatized and unacclimatized persons. Software programs to calculate the PHS are available on the Internet. Both the accuracy required for the measurements and the interpretation of the index values suggest that experts should perform assessments of the risk of heat stress using the PHS method.
Evaluating thermal strain using physiological measurements The WBGT index and the PHS method were both developed to determine the risk of heat stress at places where people work for extended periods in normal work clothing. Workers are also assumed to be in good health and fit to do the intended work. These indices cannot be used in work situations in which the person is required to wear
2 See Parsons (2002) and Malchaire (2014) for descriptions of the models used.

Managing heat in agricultural work16
protective clothing, the thermal conditions change rapidly, or unfit people perform the work. In such circumstances, physiological measurements may be required of some or all of inner body temperature, mean skin temperature, heart rate and body-mass loss (ISO standard 9886). Obtaining such measurements will provide very good insight into the extent of heat strain experienced by a subject, but they are invasive because the subject must wear the measurement equipment while working; such measurements, therefore, may not always be acceptable. According to Parsons (2013), direct measurements on a person should only be carried out if the person freely consents to them after being fully informed of their purpose and the potential discomfort they may cause. Measurements should only be carried out by people with proper medical training.
CASE STUDY 2
Heat exposure of sugar-cane workers in Costa Rica
According to FAOSTAT (FAO, 2017), 1 877 million tonnes of sugar cane was produced worldwide
in 2013. Sugar cane is grown in countries with hot climates, the top four producers being
Brazil, India, China and Thailand; Costa Rica produced 4.4 million tonnes of sugar cane in
2013. In general, working conditions in the sugar-cane industry can be described as harsh,
and seasonal workers – often migrants – perform a large part of the work. Men comprise
the majority of workers, but female workers and children also work in the industry, and the
migrant workforce may include entire families.
Two studies were conducted in Costa Rica to determine the heat exposure of workers in
the sugar-cane industry. One of these examined the non-harvest season (August–October
2009) (Crowe et al., 2010) and the other focused on sugar-cane harvesting in 2010 and 2011
(Crowe et al., 2013). Work observed in the non-harvest season included cutting cane for
planting, applying dry fertilizers and herbicides, and weeding. The wet-bulb globe tem-
perature (WBGT) was measured in both studies.
In the study in the non-harvest season, WBGT was measured between 09.00 and
14.00 hours, and the work was performed either from 06.00 to 15.00 hours or from 06.00
and 13.00 hours. The minimum temperature was in the range of 22.9–29.2 °C WBGT and
the maximum temperature was in the range of 28.5–32.9 °C WBGT. A comparison of these
temperature ranges with the reference values in ISO 7234 (ISO, 1989) indicates that workers
performing moderately heavy work duties are at risk when working during periods of
maximum temperature, while working in the minimum temperature range is considered a
risk factor for heat stress when heavy work is performed.
Such conditions require the consideration of work and rest schedules. Crowe et al. (2010)
estimated workloads using tables comparable with the ISO 8996 standard but did not calculate
a time-weighted average. Thus, they did not take into account, for example, the rests that
workers actually took during work periods. The workload estimates of Crowe et al. (2010)
were in the range of 107–294 watts per m2, indicating that the risk of heat stress needed to
be considered. According to the work–rest schedule presented in Table 4, light work may
continues
Heat-related illnesses and determining the risk of heat stress 17
be performed without limits until the maximum temperature is reached, but heavy tasks
should be limited to a schedule of 30 minutes of work followed by 30 minutes of rest.
Crowe et al. (2013) studied heat exposure among sugar-cane workers in the harvest sea-
sons of 2010 and 2011 over two six-day periods. The harvest season is the hottest season of
the year; according to the authors, the sugar-cane harvesters were mainly seasonal workers
and therefore might not have been acclimatized to the work conditions.
The sugar cane was harvested by hand using machetes. Work usually started between
05.00 and 06.30 hours, depending on the distance the workers needed to travel to get to
the worksite. They were paid according to production, and they decided when to stop –
usually between 10.00 and 11.00 hours. Each worker brought his or her own water supply,
consisting of two containers holding 4 litres of water each. The fields were usually burned
the night before harvesting to minimize the risk of snake bite, but this also meant that the
fields were filled with ash that collected rapidly on the skin and clothing. Each worker wore
a pair of long cotton trousers, a long-sleeved cotton shirt usually over a t-shirt, a baseball
cap or a broad-brimmed traditional farmer’s hat, and a cotton bandana to protect the neck
from direct exposure to the sun and to cover the mouth and nose against ash. Workers were
transported to worksites by bus or truck and, after they stopped work, they waited at the
roadside, where there was seldom any available shade.
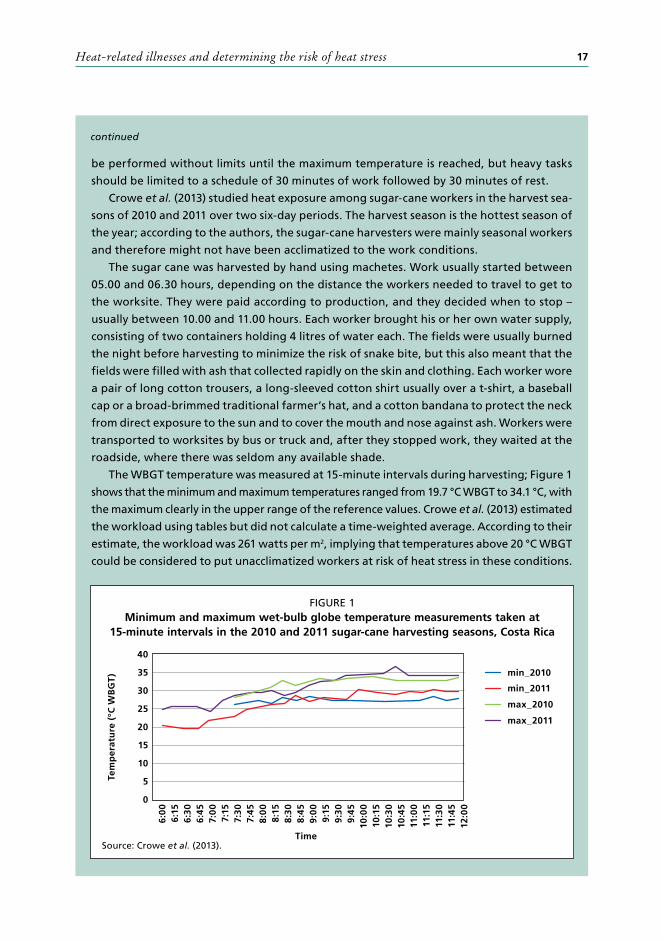
The WBGT temperature was measured at 15-minute intervals during harvesting; Figure 1
shows that the minimum and maximum temperatures ranged from 19.7 °C WBGT to 34.1 °C, with
the maximum clearly in the upper range of the reference values. Crowe et al. (2013) estimated
the workload using tables but did not calculate a time-weighted average. According to their
estimate, the workload was 261 watts per m2, implying that temperatures above 20 °C WBGT
could be considered to put unacclimatized workers at risk of heat stress in these conditions.
continued
FIGURE 1Minimum and maximum wet-bulb globe temperature measurements taken at
15-minute intervals in the 2010 and 2011 sugar-cane harvesting seasons, Costa Rica
0
40
30
35
25
20
15
10
5
min_2010
min_2011
max_2010
max_2011
Time
Tem
per
atu
re (
°C W
BG
T)
6:0
0
7:0
0
8:0
0
9:0
0
10:0
0
11:0
0
12:0
0
6:15
7:15
8:15
9:15
10:1
5
11:1
5
6:30
7:30
8:30
9:30
10:3
0
11:3
0
6:45
7:45
8:45
9:45
10:4
5
11:4
5
Source: Crowe et al. (2013).

© FA
O/G
. DIA
NA
19
4 Lessons learned on working in a hot environment
Various behavioural responses are available to help cope with heat. Relief from sun exposure can be obtained by moving into shade: providing shade at a hot workplace is a simple and usually much-appreciated measure. Another common response to heat exposure is to increase fluid intake. The body manifests its need for this by sending a signal of thirst to the brain. Even when people have unlimited access to fluids, however, they typically only replace half to two-thirds of the fluids lost (Hubbard et al., 1984). Thus, people are liable to expose themselves unknowingly to dehydration, increasing the risk of heat disorders and reducing performance. Elderly people in particular tend to intake insufficient fluids to replace those lost through sweating. Salt is also lost in sweating, at a rate of about 4 g per litre for an unacclimatized person (and less for an acclimatized person). A normal diet provides about 8–14 g of salt per day. The need for salt supplementation depends on the workload as well as the duration of exposure to hot conditions. Salt tablets can irritate the stomach; it is recommended, therefore, that, when salt supplementation is required, more salt is added to meals.
HEAT AND LABOUR PRODUCTIVITYLabour productivity is lower in hot conditions than in moderate thermal conditions. Workers need to adapt their pace of work to the body’s production of heat and its capac-ity to exchange heat with the surroundings (see case studies 3 and 4). Sport science has generated much research on these effects. Ely et al. (2007) found that elite marathon runners were approximately 2 percent slower in a race performed at 25 °C WBGT compared with a race run at 10 °C WBGT. Amateur runners in the same races were up to 10 percent slower in the warmer conditions, showing that the impact can differ considerably between individuals.
CASE STUDY 3
Workload of sugar-cane workers in Colombia
Colombia is a significant sugar-cane grower, producing 34.9 million tonnes in 2013. Spurr,
Barac-Nieto and Maksud (1975) studied 61 sugar-cane cutters in Colombia who worked from
6:30 hours to noon, with only short breaks for drinks, and, after lunch, from 13:00 hours
to 15:30 or 16:00 hours. The workers were paid piece rates. Those studied had been work-
continues
Managing heat in agricultural work20
ing for several years (and should therefore be considered acclimatized) and had very low
absenteeism due to illness. Oxygen consumption and heart rate were measured twice in the
course of five minutes of work in both the morning and the afternoon. For each individual,
the VO2max (i.e. the maximum rate of oxygen consumption, measured during incremental
exercise) was determined in the laboratory, and their average productivity was obtained
from company records. The researchers determined oxygen consumption at 1.5 litres per
minute, which is equivalent to a workload of 291 watts per m2 and around 57 percent of
the average maximum working capacity. However, by weighing the cane produced per day
and knowing the energy required to produce 1 kg of cane, the researchers recalculated
the actual workload per day at around 37 percent of working capacity in the morning and
33 percent in the afternoon, indicating that the workers adapted their work pace to the
thermal conditions. This also suggests that two five-minute measuring periods might not
be representative of the workload of a full eight-hour workday.
continued
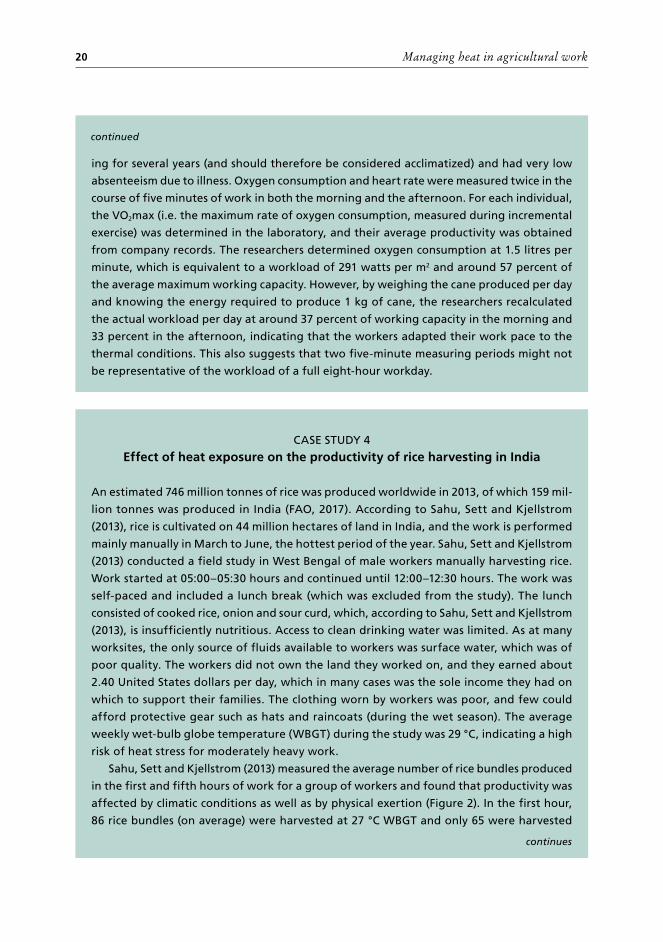
CASE STUDY 4
Effect of heat exposure on the productivity of rice harvesting in India
An estimated 746 million tonnes of rice was produced worldwide in 2013, of which 159 mil-
lion tonnes was produced in India (FAO, 2017). According to Sahu, Sett and Kjellstrom
(2013), rice is cultivated on 44 million hectares of land in India, and the work is performed
mainly manually in March to June, the hottest period of the year. Sahu, Sett and Kjellstrom
(2013) conducted a field study in West Bengal of male workers manually harvesting rice.
Work started at 05:00–05:30 hours and continued until 12:00–12:30 hours. The work was
self-paced and included a lunch break (which was excluded from the study). The lunch
consisted of cooked rice, onion and sour curd, which, according to Sahu, Sett and Kjellstrom
(2013), is insufficiently nutritious. Access to clean drinking water was limited. As at many
worksites, the only source of fluids available to workers was surface water, which was of
poor quality. The workers did not own the land they worked on, and they earned about
2.40 United States dollars per day, which in many cases was the sole income they had on
which to support their families. The clothing worn by workers was poor, and few could
afford protective gear such as hats and raincoats (during the wet season). The average
weekly wet-bulb globe temperature (WBGT) during the study was 29 °C, indicating a high
risk of heat stress for moderately heavy work.
Sahu, Sett and Kjellstrom (2013) measured the average number of rice bundles produced
in the first and fifth hours of work for a group of workers and found that productivity was
affected by climatic conditions as well as by physical exertion (Figure 2). In the first hour,
86 rice bundles (on average) were harvested at 27 °C WBGT and only 65 were harvested
continues

Lessons learned on working in a hot environment 21
at 31 °C WBGT. In the fifth hour, productivity was reduced to 79 bundles at 27 °C WBGT and
59 bundles at 31 °C WBGT.
Sahu, Sett and Kjellstrom (2013) also studied climatic trends in the area using data
gathered at a local airport between 1980 and 2011. They found that the number of days
on which maximum WBGT temperature was 29 °C or higher had increased from 120 days in
1980 to 160 days in 2011, indicating that the risk of heat stress was increasing in the area.
Dehydration is often the main cause of lost labour productivity. According to Cheuvront et al. (2010), the decrease in performance can be explained by the increased strain on the blood circulatory system and an increase in perceived exertion, which causes changes in behaviour. Figure 3 illustrates the effect of dehydration (in percent of body-weight loss) on physical work output in temperate and hot conditions (Anon., 2003). It shows that a combination of heat stress and moderate dehydration (i.e. a 3 percent loss of body weight) can reduce physical work capability by approximately 80 percent in temperate conditions, compared with the capability of a fully hydrated person, and to about 55 percent in hot conditions. Even in temperate climatic conditions, therefore, moderate dehydration can lead to a substantial reduction in labour productivity. The provision of fluids at all worksites is highly recommended.
continued
FIGURE 2Bundles of rice harvested per hour, by wet-bulb globe temperature
40
100
90
80
70
60
50
Hour 1•Hour 5♦Linear (Hour 1)
Linear (Hour 5)
Estimated WBGT (° C)
Pro
du
ctiv
ity
(bu
nd
les/
h)
25 26 27 28 29 30 31 32
Note: Each point is a group average for 10–18 workers; hour 1 is the first work hour of the day and hour 5 is the fifth work hour of the day.
Source: Sahu, Sett and Kjellstrom (2013).
♦ ♦ ♦ ♦♦♦ ♦
♦♦
♦♦♦ ♦♦♦♦ ♦♦
• ••••••••
♦♦♦♦ ♦♦♦♦
••••
•• ••
• ••••••••
y = -5.42x + 232R2 = 0.97
y = -5.14x + 218R2 = 0.96

Managing heat in agricultural work22
Schlader, Stannard and Mündel (2011) found that individuals will reduce the intensity of exercise when exposed to heat if given the opportunity to pace such exercise themselves. One cannot rely on self-pacing, however, as a sufficient means of mitigating the risk of heat stress in a work environment. Vogt et al. (1983) found that self-chosen rest periods were often too short and that heat was stored. The self-chosen work–rest cycles of employees are influenced not only by the perceived exertion but also by work organization and their own perception of work performance. This effect is illustrated in an example of a fatal heat stroke referred to by Jackson and Rosenberg (2010). A newly employed man picking tobacco was observed working slowly on a very hot day. He continued working despite instructions from his employer to rest. His co-workers noticed that he appeared to be confused, carried him to the shade, and unsuccessfully tried to give him water. He was taken to hospital by ambulance but died that evening. This serves to show that instructions cannot entirely replace work supervision.
TABLE 4Work and rest guidelines for average-sized, heat-acclimatized and hydrated soldiers wearing battle dress uniforms
WBGT index (°C) Easy work (139 watts/m2)
Moderate work (236 watts/m2)
Hard work (333 watts/m2)
Work/rest (minutes)
25.5–27.7 No limita No limit 40/20
27.7–29.4 No limit 50/10 30/30
29.4–31.1 No limit 40/20 30/30
31.1–32.2 No limit 30/30 20/40
> 32.2 50/10 20/40 10/50
a No limit implies that work can be sustained for at least four hours in the specified heat conditions.
Source: Adapted from Anon (2003).
FIGURE 3Effects of climatic heat and dehydration on physical work output
100
80
60
40
20
0
Dehydration level (% body-weight loss)
Phys
ical
wo
rk o
utp
ut
(% n
orm
al)
0 2 4 6 8 10 12
Source: Anon (2003).
Temperate
Hot
Lessons learned on working in a hot environment 23
Table 4 presents guidelines on work and rest schedules for heat-acclimatized soldiers wearing battle dress uniform, as developed by the United States Army; these could be used in other sectors, too.
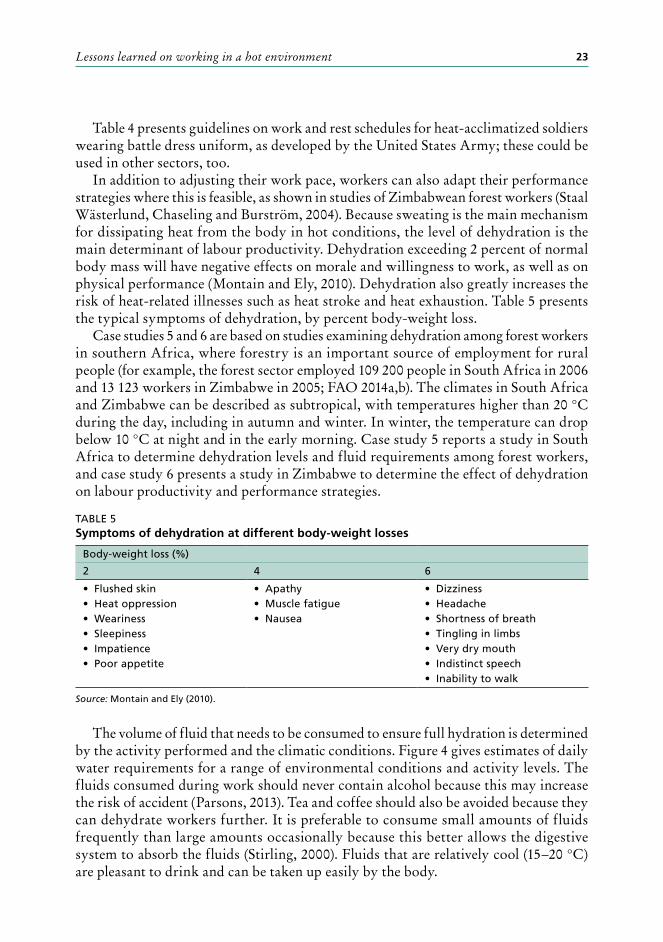
In addition to adjusting their work pace, workers can also adapt their performance strategies where this is feasible, as shown in studies of Zimbabwean forest workers (Staal Wästerlund, Chaseling and Burström, 2004). Because sweating is the main mechanism for dissipating heat from the body in hot conditions, the level of dehydration is the main determinant of labour productivity. Dehydration exceeding 2 percent of normal body mass will have negative effects on morale and willingness to work, as well as on physical performance (Montain and Ely, 2010). Dehydration also greatly increases the risk of heat-related illnesses such as heat stroke and heat exhaustion. Table 5 presents the typical symptoms of dehydration, by percent body-weight loss.
Case studies 5 and 6 are based on studies examining dehydration among forest workers in southern Africa, where forestry is an important source of employment for rural people (for example, the forest sector employed 109 200 people in South Africa in 2006 and 13 123 workers in Zimbabwe in 2005; FAO 2014a,b). The climates in South Africa and Zimbabwe can be described as subtropical, with temperatures higher than 20 °C during the day, including in autumn and winter. In winter, the temperature can drop below 10 °C at night and in the early morning. Case study 5 reports a study in South Africa to determine dehydration levels and fluid requirements among forest workers, and case study 6 presents a study in Zimbabwe to determine the effect of dehydration on labour productivity and performance strategies.
TABLE 5Symptoms of dehydration at different body-weight losses
Body-weight loss (%)
2 4 6
• Flushed skin• Heat oppression• Weariness• Sleepiness• Impatience• Poor appetite
• Apathy• Muscle fatigue• Nausea
• Dizziness• Headache• Shortness of breath• Tingling in limbs• Very dry mouth• Indistinct speech• Inability to walk
Source: Montain and Ely (2010).
The volume of fluid that needs to be consumed to ensure full hydration is determined by the activity performed and the climatic conditions. Figure 4 gives estimates of daily water requirements for a range of environmental conditions and activity levels. The fluids consumed during work should never contain alcohol because this may increase the risk of accident (Parsons, 2013). Tea and coffee should also be avoided because they can dehydrate workers further. It is preferable to consume small amounts of fluids frequently than large amounts occasionally because this better allows the digestive system to absorb the fluids (Stirling, 2000). Fluids that are relatively cool (15–20 °C) are pleasant to drink and can be taken up easily by the body.

Managing heat in agricultural work24
As Figure 4 implies (by the variations in water requirements for differing daily energy intakes), the daily water requirement differs considerably between individuals. A male weighing 91 kg will sweat approximately 30 percent more than a male weighing 59 kg walking at the same speed (Montain and Ely, 2010). Note that a person with significant dehydration (i.e. more than 4 percent of total body weight) will take more than 24 hours (performing only very light work during this period) to fully rehydrate.
Dehydration can be measured in various ways. Two common methods are as follows:• Assessment of urine gravity and urine colour. According to Stirling (2000),
this is a reliable method, but it requires the monitoring of urine production over a 24-hour period, which may be problematic. Urine gravity is measured using a hydrometer, and calibrating the instrument is essential for its reliability (Stirling, 2000). Figure 5 is a urine colour chart, which can be used as a guide.
FIGURE 5Urine colour chart
Source: Anon (2016).
1 Good
2 Good
3 Fair
4 Dehydrated
5 Dehydrated
6 Very dehydrated
7 Severe dehydration
FIGURE 4Estimates of daily water requirements for a range of environmental conditions
and energy expenditures
0
68
1012141618
24
Daily mean WBGT (º C)
Daily mean WBGT (º F)
5 500 kcal/day
4 500 kcal/day
3 500 kcal/day
2 500 kcal/day
Dai
ly w
ater
req
uir
emen
ts
(qt/
day
)
5
Note: qt = quart (equivalent to 0.95 litres); 1 kcal[kilocalorie]/h = 0.65 watts/m2.Source: Montain and Ely (2010).
20 25 30 35 40
11010090706050 80
10 15
Lessons learned on working in a hot environment 25
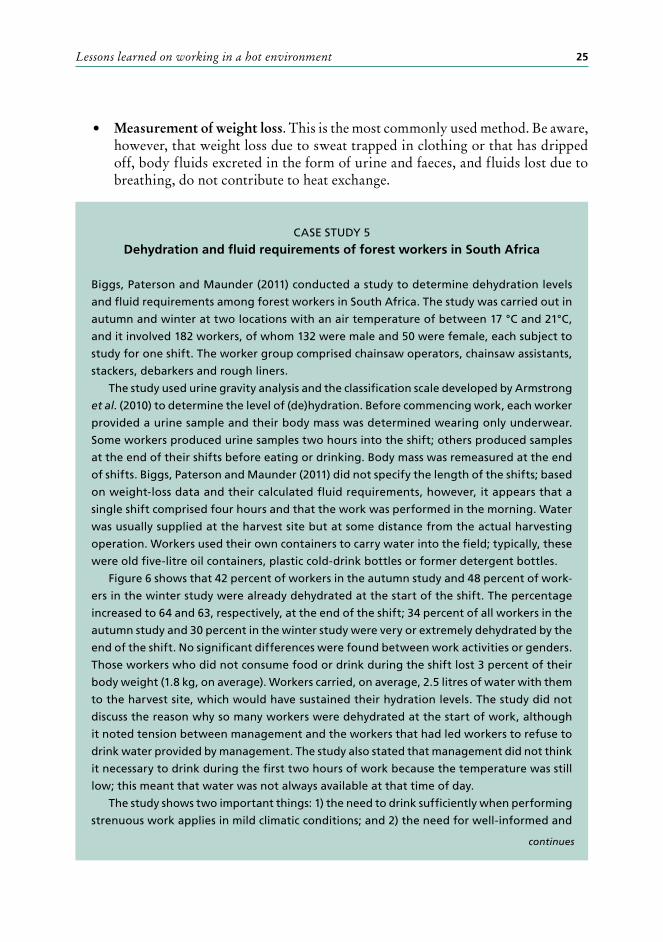
CASE STUDY 5
Dehydration and fluid requirements of forest workers in South Africa
Biggs, Paterson and Maunder (2011) conducted a study to determine dehydration levels
and fluid requirements among forest workers in South Africa. The study was carried out in
autumn and winter at two locations with an air temperature of between 17 °C and 21°C,
and it involved 182 workers, of whom 132 were male and 50 were female, each subject to
study for one shift. The worker group comprised chainsaw operators, chainsaw assistants,
stackers, debarkers and rough liners.
The study used urine gravity analysis and the classification scale developed by Armstrong
et al. (2010) to determine the level of (de)hydration. Before commencing work, each worker
provided a urine sample and their body mass was determined wearing only underwear.
Some workers produced urine samples two hours into the shift; others produced samples
at the end of their shifts before eating or drinking. Body mass was remeasured at the end
of shifts. Biggs, Paterson and Maunder (2011) did not specify the length of the shifts; based
on weight-loss data and their calculated fluid requirements, however, it appears that a
single shift comprised four hours and that the work was performed in the morning. Water
was usually supplied at the harvest site but at some distance from the actual harvesting
operation. Workers used their own containers to carry water into the field; typically, these
were old five-litre oil containers, plastic cold-drink bottles or former detergent bottles.
Figure 6 shows that 42 percent of workers in the autumn study and 48 percent of work-
ers in the winter study were already dehydrated at the start of the shift. The percentage
increased to 64 and 63, respectively, at the end of the shift; 34 percent of all workers in the
autumn study and 30 percent in the winter study were very or extremely dehydrated by the
end of the shift. No significant differences were found between work activities or genders.
Those workers who did not consume food or drink during the shift lost 3 percent of their
body weight (1.8 kg, on average). Workers carried, on average, 2.5 litres of water with them
to the harvest site, which would have sustained their hydration levels. The study did not
discuss the reason why so many workers were dehydrated at the start of work, although
it noted tension between management and the workers that had led workers to refuse to
drink water provided by management. The study also stated that management did not think
it necessary to drink during the first two hours of work because the temperature was still
low; this meant that water was not always available at that time of day.
The study shows two important things: 1) the need to drink sufficiently when performing
strenuous work applies in mild climatic conditions; and 2) the need for well-informed and
• Measurement of weight loss. This is the most commonly used method. Be aware, however, that weight loss due to sweat trapped in clothing or that has dripped off, body fluids excreted in the form of urine and faeces, and fluids lost due to breathing, do not contribute to heat exchange.
continues

Managing heat in agricultural work26
supportive management – a 3 percent loss in body weight implies a reduction in worker
productivity of 70–75 percent in temperate conditions (Figure 3), which is counter to the
interests of employers as well as to those of the workers themselves.
continued
CASE STUDY 6
Forest-worker dehydration in Zimbabwe
A study of dehydration among forest workers in Zimbabwe (Staal Wästerlund, Chaseling
and Burström, 2004; Staal Wästerlund and Chaseling, 2005) was conducted in spring, with
the temperature in the range of 8–17 °C wet-bulb globe temperature (WBGT) at the start
of the working day and 11–27 °C WBGT at the end it. It involved four male forest workers,
each of whom was studied for eight consecutive workdays. All workers were engaged in
the manual felling, delimbing, crosscutting, carrying, debarking and stacking of pulpwood.
The primary aim of the study was to determine the effects of mild dehydration on labour
productivity; the four studied workers, therefore, were given predetermined amounts of
continues
FIGURE 6Percentage of workers in various categories of hydration, according to urine gravity
analysis, before and after forest work in autumn and winter, South Africa
0 0
35 35
30 30
20 20
25 25
15 15
10 10
5 5
Perc
ent
Autumn study Winter study
Perc
ent
Extr
emel
y h
yper
pyd
rate
d
Extr
emel
y h
yper
pyd
rate
d
Slig
htl
y h
yper
hyd
rate
d
Slig
htl
y h
yper
hyd
rate
d
Wel
l hyd
rate
d
Wel
l hyd
rate
d
Euh
ydra
ted
Euh
ydra
ted
Slig
htl
y d
ehyd
rate
d
Slig
htl
y d
ehyd
rate
d
Ver
y d
ehyd
rate
d
Ver
y d
ehyd
rate
d
Extr
emel
y d
ehyd
rate
d
Extr
emel
y d
ehyd
rate
d
Source: Biggs, Paterson and Maunder (2011).
Pre-shift
End of shift
Lessons learned on working in a hot environment 27
water to compare mild dehydration with the fully hydrated condition. Each worker was
subjected to two treatments, with four repetitions of each over the eight workdays. In
treatment 1, workers were given 0.17 litres of water every half-hour; in treatment 2, workers
were given 0.6 litres of water every half-hour. Before commencing work, all workers were
given 0.5 litres of water to ensure full hydration at the start of the workday. The treatments
were distributed randomly over the eight workdays. The work task involved producing one
(1 m wide x 1 m high) stack of pulpwood of logs 2.3 m in length. The workers felled the trees
they wanted to use for the stack using handsaws and axes; delimbed the felled trees with
axes; crosscut the trees into 2.3 m logs; and carried the logs to the roadside. After collecting
sufficient logs for the stack, they debarked the trees, made side-supports for the stacks, and
stacked the debarked logs. The workers each had an area where they could choose marked
trees for their stack. The volume of each log was measured. This work strategy meant that
the logs were felled, delimbed, crosscut and carried during the relatively cool period of the
work shift, and the debarking and stacking were done in the warmer period, during which
the workers were also exposed to the sun (except when there was cloud cover). The study
was conducted in summer but, in the period of the study, the weather was cooler than usual
for the time of year. The WBGT temperature was recorded in a representative area near
the workers. The workers’ heart rates were monitored during the course of the work, and
the percentage of heart-rate reserve (i.e. the maximum heart rate minus the resting heart
rate) was used in the analysis as a measure of exertion.
Body weight was measured fully clothed before the start of the work shift, every hour
in connection with drinks breaks, and at the end of the shift. A time study was made over
the entire shift, which started at 07:00 hours and ended around noon when the stack was
completed. The workers had eaten breakfast before arriving at work and did not eat or drink
any beverages during work other than those supplied for the study. They did not take breaks
other than those determined by the study for drinking and body-weight measurement.
The initial analysis showed a significantly lower exertion rate in the high-fluid-consumption
treatment (i.e. 0.6 litres per half-hour) compared with the low-consumption treatment (0.17 litres
per half-hour), especially in the latter part of the workday during debarking and stacking (Staal
Wästerlund and Chaseling, 2005). The low-consumption treatment resulted in an average loss
of body mass of 0.7 kg, and the high-consumption treatment resulted in an average gain in
body mass of 0.7 kg. There was a clear difference in labour productivity between the two treat-
ments, with the high-consumption treatment resulting in an 11 percent reduction (25 minutes),
on average, in the time taken to complete the required stack. Given that all workers gained
weight in the high-consumption treatment and exhibited hyperhydration, a higher increase
in productivity might have been possible with a slightly lower level of fluid consumption to
maintain full hydration. The analysis also showed that there was a cumulative effect on labour
productivity. The time taken to complete a stack was significantly lower if fluid consumption
had been low on the previous day, even if fluid consumption was high on the day assessed.
continued
continues

Managing heat in agricultural work28
HEAT AND CLOTHINGClothing provides thermal resistance between the body and the environment. Its pri-mary function is to maintain an acceptable thermal body state but, in hot conditions, it may make it more difficult for the body to dissipate excess heat. Important factors to consider are the thermal insulation of the material and the potential for transferring moisture (e.g. sweat and rain) through the fabric. Clothing may also have a pumping
Differences between individual workers were sufficiently intriguing to warrant further
analysis of the data to determine whether workers were adapting their work strategies (Staal
Wästerlund, Chaseling and Burström, 2004). Their main opportunity to do so was during
felling, and this aspect of the work, therefore, was studied in detail. In principle, all workers
had similar work strategies, starting with a large tree and subsequently choosing trees of
smaller volumes. For two of the workers, the heart-rate reserve in the high-consumption
treatment was lower than for the low-consumption treatment; it appeared they achieved
this reduction by cutting smaller trees during the high-consumption treatment, and these
were closer to the road. Another worker used a different strategy: he chose larger but fewer
trees during the high-consumption treatment, which resulted in a higher exertion rate but
a significant increase in productivity during delimbing. Given the wide choice of trees at
the study site, it appears that workers adapted their performance strategies in intriguingly
different ways.
continued
© Dianne Staal Wästerlund
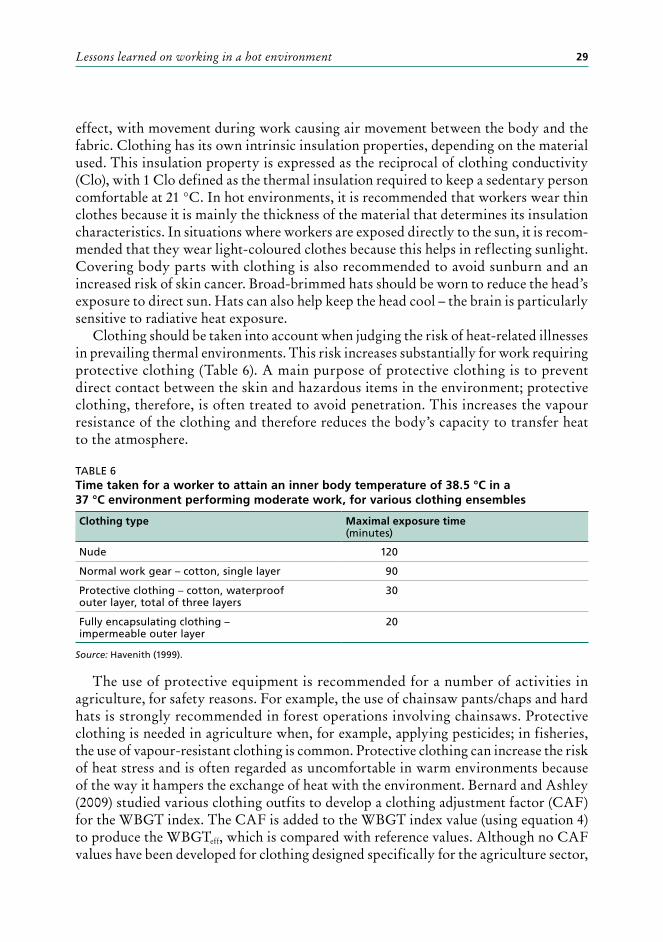
Lessons learned on working in a hot environment 29
effect, with movement during work causing air movement between the body and the fabric. Clothing has its own intrinsic insulation properties, depending on the material used. This insulation property is expressed as the reciprocal of clothing conductivity (Clo), with 1 Clo defined as the thermal insulation required to keep a sedentary person comfortable at 21 °C. In hot environments, it is recommended that workers wear thin clothes because it is mainly the thickness of the material that determines its insulation characteristics. In situations where workers are exposed directly to the sun, it is recom-mended that they wear light-coloured clothes because this helps in reflecting sunlight. Covering body parts with clothing is also recommended to avoid sunburn and an increased risk of skin cancer. Broad-brimmed hats should be worn to reduce the head’s exposure to direct sun. Hats can also help keep the head cool – the brain is particularly sensitive to radiative heat exposure.
Clothing should be taken into account when judging the risk of heat-related illnesses in prevailing thermal environments. This risk increases substantially for work requiring protective clothing (Table 6). A main purpose of protective clothing is to prevent direct contact between the skin and hazardous items in the environment; protective clothing, therefore, is often treated to avoid penetration. This increases the vapour resistance of the clothing and therefore reduces the body’s capacity to transfer heat to the atmosphere.
TABLE 6Time taken for a worker to attain an inner body temperature of 38.5 °C in a 37 °C environment performing moderate work, for various clothing ensembles
Clothing type Maximal exposure time (minutes)
Nude 120
Normal work gear – cotton, single layer 90
Protective clothing – cotton, waterproof outer layer, total of three layers
30
Fully encapsulating clothing – impermeable outer layer
20
Source: Havenith (1999).
The use of protective equipment is recommended for a number of activities in agriculture, for safety reasons. For example, the use of chainsaw pants/chaps and hard hats is strongly recommended in forest operations involving chainsaws. Protective clothing is needed in agriculture when, for example, applying pesticides; in fisheries, the use of vapour-resistant clothing is common. Protective clothing can increase the risk of heat stress and is often regarded as uncomfortable in warm environments because of the way it hampers the exchange of heat with the environment. Bernard and Ashley (2009) studied various clothing outfits to develop a clothing adjustment factor (CAF) for the WBGT index. The CAF is added to the WBGT index value (using equation 4) to produce the WBGTeff, which is compared with reference values. Although no CAF values have been developed for clothing designed specifically for the agriculture sector,

Managing heat in agricultural work30
Table 7 presents values for garments that may be similar to protective equipment used in the sector.
Hard hats and helmets are a particular issue when working in hot environments because 10–30 percent of excess metabolic heat is lost via the head, and the use of headgear can restrict this heat exchange. Trials have been conducted on the provision of extra openings or fans inside helmets to increase ventilation. Helmets with fans require reinforcement to accommodate the extra equipment needed to power the fans, making them unsuitable for use in heavy work. Holland et al. (2002) tested helmets with various ventilation designs that met safety requirements for forestry; they found that helmets with vents 288 mm2 in size in the crown resulted in the lowest temperature and humidity inside the helmet. The study found, however, that forest workers considered all ventilation designs to offer a similar level of comfort.
Tests conducted in the 1980s on chainsaw chaps showed that these protective trousers were most comfortable when the air temperature was between -11 °C and +13 °C and that heat stress for which the body could not compensate was evident at a temperature of 20 °C. New types of protective equipment have since been developed to protect the legs from accidental contact with chainsaw chains, such as chainsaw pads that cover only the front of the legs. The thermal comfort of this new type of protective equipment has not been documented adequately, however.
TABLE 7Clothing adjustment factors
Ensemble Comment Clothing adjustment factor (°C wet-bulb globe temperature)
Tyvek coveralls Tyvek® is made of polyethylene and is generally preferred when working with hazardous substances such as fertilizers, pesticides, moulds, oils and lubricants
2
Vapour-barrier apron with long sleeves and long-length over-clothing coveralls
The front configuration is designed to protect the front of the body against spills from chemical agents
4
NexGen® coveralls (single layer)
Microporous material that functions as a water barrier while permitting sweat to evaporate. Used in applying spray paints, oils, lubricants and fluid fertilizers
2.5
Full-face negative-pressure respirator
Military-style respirator that covers the full face
0.3
Source: Parsons (2002).
HEAT AND CHILD LABOURChild labour refers to work that is inappropriate for a child’s age or affects his or her education, and it encompasses work likely to harm a child’s health, safety or morals. According to the International Labour Organization, 168 million children aged 5–17 years

Lessons learned on working in a hot environment 31
are engaged in child labour (Diallo, Etienne and Mehran, 2013), most of whom live in hot climates in the Asia-Pacific and sub-Saharan regions and 60 percent of whom are engaged in agricultural work. Family-based businesses are very common in the agriculture sector, and children often participate in the work at an early age. An FAO report on children’s work in the livestock sector, for example, found that children as young as five years may be required to herd livestock (FAO, 2013), but data are lacking on the (largely informal) work-related activities of such children as well as on their exposure time. The International Labour Organization (2011) established that, in general, children’s outdoor work should be considered hazardous because of exposure to the sun and extreme weather conditions.
There is a lack of knowledge on the reaction of children to heat exposure, making it difficult to provide guidance on how best to manage such exposure in agriculture. The few available studies indicate that, compared with adults, children may be at a higher risk of heat-related illnesses in warm conditions. Gomes, Carneiro-Junior and Marins (2013) found that the ability of prepubescent children to sweat is limited because their sweat glands are immature. Morphologically, children have a higher ratio of body surface to weight (this can be calculated using equation 2 on page 15 of this report). The higher ratio makes it easier for children to dissipate heat by convection and radiation if the surrounding temperature is lower than the skin temperature; children will have severe problems in dissipating heat, however, in conditions in which the surrounding temperature is higher than skin temperature.
According to Gomes, Carneiro-Junior and Marins (2013), children have lower mechanical efficiency than adults, implying that they produce proportionally more heat when performing the same type of work. Based on the few studies available, it is recommended that extreme care is taken if children are required to work in hot conditions. They should be provided with knowledge on the risk of heat exposure and the need to wear broad-brimmed hats, take regular rests in the shade, and drink water frequently.
Children are often dependent on adults for their food and drink and may be unable to indicate their need for fluids or acquire them in the same way as adults. Fadda et al. (2012) found, for example, that children were often already mildly dehydrated when arriving at school in the morning. Adults should be aware of children’s need to learn to drink regularly, and they should ensure that children have free access to potable fluids to minimize the risk of heat stress.
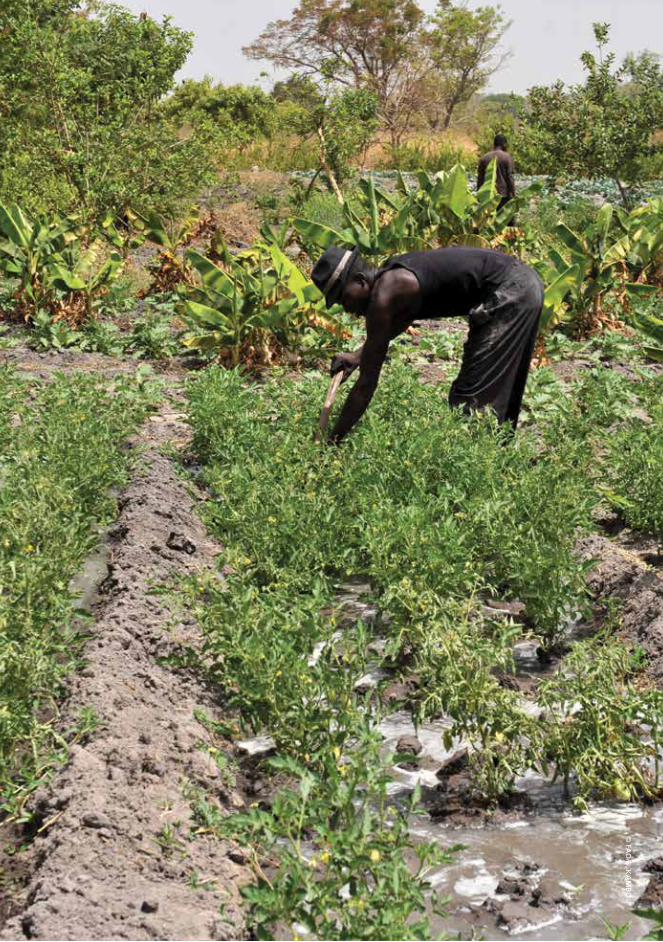
© FA
O/S. K
AM
BO
U

33
5 Managerial implications
Heat stress is very common in agriculture and therefore needs to be addressed by managers. Many managers and supervisors seem to think that workers should take care of this problem themselves but, as this review shows, such an attitude can lead to severe health problems among workers and reduce labour productivity. Both these consequences are avoidable with easily implementable measures. It is recommended that, as a start, a systematic approach is taken to risk assessment. The provision of fluids and the implementation of appropriate work–rest schedules are also recommended.
RISK ASSESSMENT STRATEGIESISO has adopted ISO standard 15265: “Ergonomics of the thermal environment: risk assessment strategy for the prevention of stress or discomfort in thermal working conditions”, based on the SOBANE (Screening, Observation, Analysis and Expertise) strategy developed by Malchaire, Gebhardt and Piette (1999). The standard has three stages: 1) screening and observation; 2) analysis; and 3) expertise. In the first stage, a group that is representative of the labour force (i.e. employees, the local safety manager and workplace leaders) collect information on work conditions. It is important that employees are included in such representative groups because they have the best insights into the existing work conditions, the affected workplaces, and the work routines it may be necessary to alter. Employee involvement at this stage also helps in enacting preventive actions: because they were involved in pointing out aspects that need improve-ment, employees will also take an interest in proposed solutions, greatly increasing the likelihood that such solutions will be implemented.
The purpose of the screening and observation stage is to identify situations in which there is a risk of heat stress, the simple measures that might be taken to prevent unnecessary exposure, and whether further analysis is required and for what purpose. Information collected at this stage relates to the work situation (e.g. its design, who performs work and for how long during risk periods, and the cause of risk); climate (e.g. temperature, humidity and wind); the physical workload; and the clothes worn by employees. Such information must be collected at a representative time of the day or season, and on several occasions. Templates (e.g. see tables 8–10) can be used to systematically collect information, suitably adapted for the particular work situation. Table 8 provides a template for collecting information at a given workplace, such as the activities performed and who is working there (e.g. females/males/children). Table 9 can be used for compiling data on climate, including scores (discussed and agreed on by the representative group) indicating the seriousness of the climatic situation in a given period; Appendix 2 contains the scoring scales developed by Malchaire, Gebhardt and Piette (1999). Table 10 is designed for documenting the heat sources at a given workplace and suggestions for preventive measures.

Managing heat in agricultural work34
TABLE 8Description of work zones
Work zone Activities performed Employees Description
TABLE 9Climate data (e.g. air temperature, humidity; see Appendix 2 for full list)
Period Work zone Score Description
TABLE 10Description of heat source and suggestions for prevention
Heat source Work zone Characteristics Prevention
The tabulated data are compiled in a report that is presented to management, with priorities for action and recommendations for further analysis, if required. In stage 2 (analysis), the representative group can be complemented by a work-organization specialist, who helps the group in developing and implementing preventive measures and in studying and measuring work situations identified for further study. Heat-stress indices such as the WBGT index and the PHS can be calculated at this stage and used to determine whether exposure limits should be implemented. The ongoing risk of heat stress after the implementation of the suggested preventive measures can also be determined, as well as the need for expertise to deal with such risk. At stage 3, the work-organization specialist works with an expert on heat stress to design additional preventive measures and calculate appropriate work–rest schedules, among other things.
An important factor to keep in mind is that workers may be of various cultural backgrounds (see case study 7). Case study 8 illustrates the importance of awareness of the risks associated with heat exposure.
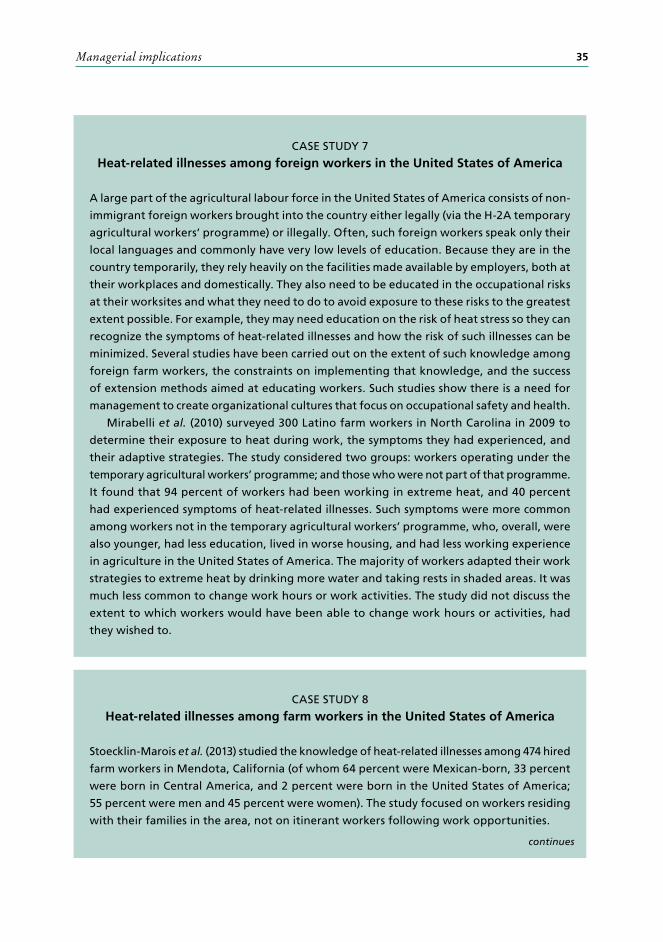
Managerial implications 35
CASE STUDY 7
Heat-related illnesses among foreign workers in the United States of America
A large part of the agricultural labour force in the United States of America consists of non-
immigrant foreign workers brought into the country either legally (via the H-2A temporary
agricultural workers’ programme) or illegally. Often, such foreign workers speak only their
local languages and commonly have very low levels of education. Because they are in the
country temporarily, they rely heavily on the facilities made available by employers, both at
their workplaces and domestically. They also need to be educated in the occupational risks
at their worksites and what they need to do to avoid exposure to these risks to the greatest
extent possible. For example, they may need education on the risk of heat stress so they can
recognize the symptoms of heat-related illnesses and how the risk of such illnesses can be
minimized. Several studies have been carried out on the extent of such knowledge among
foreign farm workers, the constraints on implementing that knowledge, and the success
of extension methods aimed at educating workers. Such studies show there is a need for
management to create organizational cultures that focus on occupational safety and health.
Mirabelli et al. (2010) surveyed 300 Latino farm workers in North Carolina in 2009 to
determine their exposure to heat during work, the symptoms they had experienced, and
their adaptive strategies. The study considered two groups: workers operating under the
temporary agricultural workers’ programme; and those who were not part of that programme.
It found that 94 percent of workers had been working in extreme heat, and 40 percent
had experienced symptoms of heat-related illnesses. Such symptoms were more common
among workers not in the temporary agricultural workers’ programme, who, overall, were
also younger, had less education, lived in worse housing, and had less working experience
in agriculture in the United States of America. The majority of workers adapted their work
strategies to extreme heat by drinking more water and taking rests in shaded areas. It was
much less common to change work hours or work activities. The study did not discuss the
extent to which workers would have been able to change work hours or activities, had
they wished to.
CASE STUDY 8
Heat-related illnesses among farm workers in the United States of America
Stoecklin-Marois et al. (2013) studied the knowledge of heat-related illnesses among 474 hired
farm workers in Mendota, California (of whom 64 percent were Mexican-born, 33 percent
were born in Central America, and 2 percent were born in the United States of America;
55 percent were men and 45 percent were women). The study focused on workers residing
with their families in the area, not on itinerant workers following work opportunities.
continues

Managing heat in agricultural work36
All surveyed workers had long experience in working in agriculture, and two-thirds
had fewer than six years of education. There was a clear gender-based segregation in the
type of work performed, with women working primarily in packing and sorting and men
working predominantly in picking, pruning and machine operation. More than 91 percent
of the surveyed workers had received training on heat-related illnesses. Women were more
concerned than men about the risk of heat illnesses; two-thirds of men but only one-quarter
of women expressed no concern about such illnesses. Of five questions posed to farm work-
ers by Stoecklin-Marois et al. (2013) to test their knowledge of heat-related illnesses, the
workers could, on average, answer four correctly. The answers of men were significantly
more correct than those of women. Nevertheless, only 24 percent of the total number knew
how much time the body needed to acclimatize to heat – 44 percent believed this could be
achieved in less than two hours. According to the workers, 88 percent of employers provided
drinks at the worksite, 90 percent permitted breaks if the workers experienced symptoms of
heat stress, and 93 percent provided shaded areas for breaks; thus, the working conditions
provided for most workers were acceptable.
Women were less comfortable than men in taking breaks to drink water. Based on the
data gathered it is not possible to explain this gender difference, but women’s reluctance to
take drinks breaks may be related to their tasks, which may have been more closely supervised
than those of men because they were restricted to a certain workplace; alternatively, the
women may not have had control of their work pace. Other studies have also found that
women might be more reluctant to drink water during work than men if the workers were
dissatisfied with the sanitary facilities provided.
Stoecklin-Marois et al. (2013) expressed concern about the low volume of water the work-
ers (both women and men) said they were consuming during the day despite the availability
of water and knowledge of the need to drink. According to Culp et al. (2011), it is important
to take into consideration the culture of the workers when providing migrant workers with
extension. The cultural identity of Latino men is to be strong and virile (Culp et al., 2011),
and men have to show dignity, self-confidence and a high degree of individuality. Latino
workers, especially young males, may be reluctant to indicate discomfort or the need for
water, even if thirsty, because they may be perceived as weak or unmanly; they may also
feel that complaining could cost them their jobs. Symptoms of heat-related illnesses might
be seen as a sign of weakness, which would be unacceptable in the eyes of many men with
Latino cultural backgrounds; the fatal heat stroke suffered by the tobacco harvester, as
described earlier (Jackson and Rosenberg, 2010; see page 26), may be a typical example of
this. Management should recognize that, in attempting to prevent heat-related illnesses,
making water and shade available to workers may, on its own, be insufficient. It is necessary
to also understand the workers’ way of thinking and to adapt leadership practices accordingly.
Workers must be made aware that management is serious about preventing heat-related
illnesses and expects workers to adapt their work practices accordingly. Arcury, Estrada and
continues
continued

Managerial implications 37
Quandt (2010) considered that the beliefs of many farmers in the United States of America is
restricting the implementation of sound practices among their workers because they believe
that many safety hazards are inherent to farming. Arcury, Estrada and Quandt (2010) also
expressed the view that most safety campaigns focus on single occupational hazards, such
as heat stress, and that a more comprehensive approach would be more fruitful.
continued

© FA
O/A
. BEN
EDE
TTI
39
6 Conclusions and recommendations
• A large proportion of people involved in agricultural activities (inclusive of fisheries and forestry) are regularly exposed to warm to hot working conditions. Although data are poor, the fatality rate among employees in agriculture due to heat-related illnesses appears to be much higher than in other sectors.
• Addressing heat-related health conditions is relevant to the 2030 Agenda, especially SDG 8, the aim of which is, among other things, to “promote ... decent work for all”.
• Because many tasks in agriculture are physical demanding, the body commonly produces considerable excess heat. This implies that there could be a risk of heat stress in moderately warm conditions, especially if workers are wearing protective clothing that restricts heat dissipation.
• Although climatic conditions may be the cause of the occupational hazard, solutions must be sought in the organization and design of workplaces and are therefore the responsibility of management. Coping mechanisms cannot be fully decentralized to employees.
• In hot conditions, the body dissipates its excess heat to the environment primarily by sweating. The extent to which a person sweats depends on the climatic conditions and the physical workload.
• In hot environments, workers should wear thin, light-coloured clothing (if the work does not require special protective clothing). It is also recommended that bare skin is covered to avoid sunburn and reduce the risk of skin cancer. Workers should wear broad-brimmed hats to protect their heads from heat exposure; the brain is especially sensitive to radiative heat exposure.
• The WBGT index can be used to screen for the risk of heat stress. To assess the level of risk, it is recommended that a representative group is formed comprising employees, safety managers and work leaders to document working conditions and develop measures for improvements. Expert assistance should be obtained if there is uncertainty on the measures to apply and to conduct further analysis, if required.
• Labour productivity is reduced in hot conditions and it is therefore in the interests of both employers and employees to limit heat exposure and prevent dehydration. The provision of potable fluids at workplaces is highly recommended. Employees should be trained to drink frequently because thirst is not a reliable indicator of the body’s requirements for fluids. Such training should be adapted to the cultures of employees.

Managing heat in agricultural work40
• The quantity of fluids required ranges between 2 litres per day for light work in temperatures around 10 °C WBGT and in extreme cases 15 litres per day for very strenuous work in 30 °C WBGT. Fluids should be relatively cool (15–20 °C), coffee and tea should be avoided, and alcoholic beverages should not be permitted. It is best to drink small quantities of water frequently.
• Although knowledge of children’s responses to heat exposure is limited, it is recommended that extreme care is taken in exposing children to work in hot environments because they cannot sweat as much as adults. Parents should teach children about the need to learn to drink frequently, and they should provide children with access to potable fluids at all times.


© FA
O/G
. NA
POLITA
NO

4343
7 References
Anon. 2003. Heat stress control and heat casualty management. US Army Research Institute of Environmental Medicine Technical Bulletin TB MED 507/AFPAM 48-152 (I). Washington, DC, US Department of the Army and Air Force.
Anon. 2016. How can I check for dehydration? The urine color chart [online]. [Cited September 2017]. https://wellnesswithlacey.org/how-can-i-check-for-dehydration-the-urine-color-chart.
AOL. 2016. Working in the heat. Associated Oregon Loggers (AOL), Inc.Apud, E., Bostrand, L., Mobbs, I.D. & Strehlke, B. 1989. Guide-lines on ergonomic study
in forestry. Geneva, Switzerland, International Labour Organization.Arcury, T.A., Estrada, J.M. & Quandt, S.A. 2010. Overcoming language and literacy
barriers in safety and health training of agricultural workers. Journal of Agromedicine, 15(3): 236–248.
Armstrong, L.E., Pumerantz, A., Fiala, K., Roti, M.W., Kavouras, S.A., Casa, D.J. & Maresh, C.M. 2010. Human hydration indices: acute and longitudinal reference values. International Journal of Sport Nutrition and Exercise Metabolism, 20(2): 145–153.
Axelsson, O. 1974. Heat stress in forestry work. Rome, Food and Agricultural Organization of the United Nations (FAO).
Bernard, T.E. & Ashley, C.D. 2009. Short-term heat stress exposure limits based on wet bulb globe temperature adjusted for clothing and metabolic rate. Journal of Occupational and Environmental Hygiene, 6(10): 632–638.
Biggs, C., Paterson, M. & Maunder, E. 2011. Hydration status of South African forestry workers harvesting trees in autumn and winter. Annals of Occupational Hygiene, 55(1): 6–15.
Carolan-Olah, M. & Frankowska, D. 2014. High environmental temperature and preterm birth: a review of the evidence. Midwifery, 30(1): 50–59.
Centers for Disease Control and Prevention. 2008. Heat-related deaths among crop workers – United States, 1992–2006. Morbidity and Mortality Weekly Report, 57(24): 649–653.
Cheuvront, S.N., Kenefick, R., Montain, S.J. & Sawka, M.N. 2010. Mechanics of aerobic performance impairment with heat stress and dehydration. Journal of Applied Physiology, 109(6): 1989–1995.
Clapp, J.F. 1991. The changing thermal response to endurance exercise during pregnancy. American Journal of Obstetrics and Gynecology, 165(6): 1684–1689.
Crowe, J., Moya-Bonilla, J.M., Roman-Solano, B. & Robles-Ramírez, A. 2010. Heat exposure in sugarcane workers in Costa Rica during the non-harvest season. Global Health Action, 3(1): 5619. DOI: 10.3402/gha.v3i0.5619.
Crowe, J., Wesseling, C., Roman Solano, B., Umana, M.P., Ramírez, A.R., Kjellstrom, T., Morales, D. & Nilsson, M. 2013. Heat exposure in sugarcane harvesters in Costa Rica. American Journal of industrial Medicine, 56(10): 1157–1164.

Managing heat in agricultural work44
Culp, K.C., Tonelli, S., Ramey, S.L., Donham, K. & Fuortes, L. 2011. Preventing heat-related illness among Hispanic farmworkers. AAOHN Journal, 59(1): 2011.
d’Ambrosio Alfano, F.R., Malchaire, J., Igor Palella, B. & Riccio, G. 2014. WBGT index revisited after 60 years of use. Annals of Occupational Hygiene, 58(8): 955–970.
Diallo, Y., Etienne, A. & Mehran, F. 2013. Global child labour trends 2008–2012. Geneva, Switzerland, International Labour Office.
Du Bois, D. & Du Bois, E.F. 1916. A formula to estimate surface area if height and weight are known. Archives of Internal Medicine, 17(6 2): 863.
Ely, M.R., Martin, D.E., Cheuvront, S.N., Roberts, W.O. & Montain, S.J. 2007. Impact of weather on marathon-running performance. Medicine and Science in Sports and Exercise, 39(3): 487–493.
Fadda, R., Rapinett, G., Grathwohl, D., Parisi, M., Fanari, R., Calo, C.M. & Schmitt, J. 2012. Effects of drinking supplementary water at school on cognitive performance in children. Appetite, 59(3): 730–737.
FAO. 2013. Children’s work in the livestock sector: herding and beyond. Rome.FAO. 2014a. Country report: South Africa. Global Forest Resources Assessment 2015. Rome.FAO. 2014b. Country report: Zimbabwe. Global Forest Resources Assessment 2015. Rome.FAO. 2017. FAOSTAT: food and agriculture data. In: FAO [online]. [Cited September 2017].
www.fao.org/faostat/enGomes, L.H.L.S., Carneiro-Junior, M.A. & Marins, J.C.B. 2013. Thermoregulatory
responses of children exercising in a hot environment. Revista Paulista de Pediatria, 31(1): 104–110.
Gubernot, D.M., Andersson, G.B., Hunting, K.L. 2015. Characterizing occupational heat-related mortality in the United States, 2000-2010. An analysis using the census of fatal occupational injuries database. American Journal of Industrial Medicine, 58(2): 203-211.
Hancock, P.A., Ross, J.M. & Szalma, J. 2007. A meta-analysis of performance response under thermal stressors. Human Factors: The Journal of the Human Factors and Ergonomics Society, 49(5): 851–877.
Havenith, G. 1999. Heat balance when wearing protective clothing. Annals of Occupational Hygiene, 43(5): 289–296.
Holland, E.J., Laing, R.M., Lemmon, T.L. & Niven, B.E. 2002. Helmet design to facilitate thermoneutrality during forest harvesting. Ergonomics, 45(10): 699–716.
Hubbard, R.W., Sandick, B.L., Matthew, W.T., Francesconi, R.P., Sampson, J.B., Durkot, M.J., Maller, O. & Engell, D.B. 1984. Voluntary dehydration and alliesthesia for water. Journal of Applied Physiology, 57(3): 868–875.
International Labour Organization. 2011. Children in hazardous work: what we know, what we need to know. Geneva, Switzerland.
International Labour Organization. 2014. Global employment trends 2014: Risk of a jobless recovery? Geneva, Switzerland.
ISO. 1989. ISO 7243: Hot environments – estimation of the heat stress on working man, based on the WBGT-index (wet bulb globe temperature). Geneva, Switzerland, International Organization for Standardization (ISO).

References 45
ISO. 2004a. Ergonomics of the thermal environment: analytical determination and interpretation of heat stress using calculation of the predicted heat strain. Geneva, Switzerland, International Organization for Standardization (ISO).
ISO. 2004b. ISO 9886: Ergonomics – determination of metabolic heat production. Geneva, Switzerland, International Organization for Standardization (ISO).
Jackson, L.L. & Rosenberg, H.R. 2010. Preventing heat-related illness among agricultural workers. Journal of Agromedicine, 15(3): 200–215.
Kenny, G.P., Yardley, J., Brown, C., Sigal, R.J. & Jay, O. 2009. Heat stress in older individuals and patients with common chronic diseases. Canadian Medical Association Journal, 182(10): 1053–1060.
Lundgren, K., Kuklane, K., Gao, C. & Holmér, I. 2013. Effects of heat stress on working populations when facing climate change. Industrial Health, 51(1): 3–15.
Malchaire, J. 2014. Ergonomics of the thermal environment – analytical determination and interpretation of heat stress using calculation of the predicted heat strain (also available at www.deparisnet.be/chaleur/Normes/Malchaire_PHS_Predicted_Heat_Strain_standard 7933_22-7-13.pdf).
Malchaire, J., Gebhardt, H.J. & Piette, A. 1999. Strategy for evaluation and prevention of risk due to work in thermal environments. Annals of Occupational Hygiene, 43(5): 367–376.
Mehnert, P., Bröde, P. & Griefahn, B. 2002. Gender-related difference in sweat loss and its impact on exposure limits to heat stress. International Journal of Industrial Ergonomics, 29(6): 343–351.
Mirabelli, M.C., Quandt, S.A., Crain, R., Grzywacz, J.G., Robinson, E.N., Vallejos, Q.M. & Arcury, T.A. 2010. Symptoms of heat illness among Latino farm workers in North Carolina. American Journal of Preventive Medicine, 39(5): 468–471.
Montain, S.J. & Ely, M. 2010. Water requirements and soldier hydration. Borden Institute Monograph Series. Borden Institute, Walter Reed Army Medical Center, US Army Medical Department Center & School.
Parsons, K.C. 2002. Human thermal environments: the effects of hot, moderate and cold environments on human health, comfort and performance. Third edition. London, Taylor & Francis.
Parsons, K.C. 2013. Occupational health impacts of climate change: current and future ISO standards for the assessment of heat stress. Industrial Health, 51(1): 86–100.
Ramsey, J.D., Burford, C.L., Beshir, M.Y. & Jensen, R.C. 1983. Effects of workplace thermal conditions on safe work behavior. Journal of Safety Research, 14(3): 104–114.
Sahu, S., Sett, M. & Kjellstrom, T. 2013. Heat exposure, cardiovascular stress and work productivity in rice harvesters in India: implications for a climate change future. Industrial Health, 51(4): 424–431.
Schlader, Z.J., Stannard, S.R. & Mündel, T. 2011. Evidence for thermoregulatory behavior during self-paced exercise. Journal of Thermal Biology, 36(7): 390–396.
Spurr, G.B., Barac-Nieto, M. & Maksud, M.G. 1975. Energy expenditure cutting sugarcane. Journal of Applied Physiology, 39(6): 990–996.

Managing heat in agricultural work46
Staal Wästerlund, D. & Chaseling, J. 2005. Physiological and labour-productive effects of fluid consumption during forestry work. In P.D. Bust & P.T. McCabe, eds. Contemporary ergonomics 2005, pp. 217–221. London, Taylor & Francis.
Staal Wästerlund, D., Chaseling, J. & Burström, L. 2004. The effect of fluid consumption on the forest workers’ performance strategy. Applied Ergonomics, 35(1): 29–36.
Stirling, M. 2000. Assessment, prevention and rehydration procedures. PhD thesis, Loughborough University.
Stoecklin-Marois, M., Hennessy-Burt, T., Mitchell, D. & Schenker, M. 2013. Heat-related illness knowledge and practices among California hired farm workers in the MICASA study. Industrial Health, 51(1): 47–55.
United Nations General Assembly. 2015. Transforming our world: the 2030 Agenda for Sustainable Development. Resolution A/Res/70/1. Adopted by the General Assembly on 25 September 2015. United Nations, New York, USA.
Vahaeskeli, K., Erkkola, R. & Seppanen, S. 1991. Is the heat dissipating ability enhanced during pregnancy. European Journal of Obstetrics Gynecology and Reproductive Biology, 39(3): 169–174.
Van Zutphen, A.R., Lin, S., Fletcher, B.A. & Hwang, S.-A. 2012. A population-based case-control study of extreme summer temperature and birth defects. Environmental Health Perspectives, 120(10): 1443–1449.
Vogt, J.J., Libert, J.P., Candas, V., Daull, F. & Mairiaux, P. 1983. Heat rate and spontaneous work-rest cycles during exposure to heat. Ergonomics, 26(2): 1173–1185.
Xu, Z., Etzel, R.A., Su, H., Huang, C., Guo, Y. & Tong, S. 2012. Impact of ambient temperature on children’s health. Environmental Research, 117: 120–131.


© FA
O/M
. LON
GA
RI

49
Appendix 1. Calculating time-weighted metabolic rate
Metabolic rate according to type of work
Type of work Metabolic rate (watts/m2)
Mean value Range
Hand work
Light 15 < 20
Average 30 20–35
Heavy 40 > 35
One-arm work
Light 35 < 45
Average 55 45–65
Heavy 75 > 65
Two-arm work
Light 65 < 75
Average 85 75–95
Heavy 105 > 95
Trunk work
Light 125 < 155
Average 190 155–230
Heavy 280 230–330
Very heavy 390 > 330

Managing heat in agricultural work50
Metabolic rate in relation to work speed
Type of work Metabolic rate related to work speed (watts/m2)/(m/second)
Walking, 2–5 km/h 110
Walking uphill, 2–5 km/h
Inclination 5° 210
Inclination 10° 360
Walking downhill, 5 km/h
Declination 5° 60
Declination 10° 50
Walking with load, 4 km/h
10 kg load 125
30 kg load 185
50 kg load 285
Walking upstairs 1 725
Walking downstairs 480
Mounting inclined ladder
Without load 1 660
10 kg load 1 870
50 kg load 3 320
Mounting vertical ladder
Without load 2 030
10 kg load 2 335
50 kg load 4 750
Source: ISO (2004).
Example of calculation of time-weighted average workload for planting trees
Activity Duration (seconds)
Distance (m)
Speed (m/second)
Metabolic rate related to work speed (watts/m2)/(m/second)
Metabolic rate (watts/m2)
Walking with plants (10 kg)
2 254 1 400 0.62 125 77.5
Digging planting spot (heavy trunk work)
934 390
Planting tree in plant spot (light two-arm work)
80 35
Tamping the soil around the plants (light trunk work)
92 125

Appendix 1. Calculating time-weighted metabolic rate 51
The time-weighted average is calculated using the formula:
M = 1Ti = 1nMiti
Where M = the time-weighted average metabolic rate, T = the total time for the observation, Mi = the metabolic rate for the ith activity, and ti = the time spend on activity i.
In the example, the total time for the observation (T) was 3 360 seconds. The time-weighted average metabolic rate, therefore, was (77.5 * 2254 + 390 * 934 + 35 * 80 + 125 * 92)/ 3360 = 165 watts/m2.

Managing heat in agricultural work52
Appendix 2. Scoring scales for evaluating thermal conditions at work
Metabolic rate according to type of work
Score Condition
Air temperature
-3 Generally freezing
-2 Generally 0–10 °C
-1 Generally 10–18 °C
0 Generally 18–25 °C
1 Generally 25–32 °C
2 Generally 32–40 °C
3 Generally > 40 °C
Humidity
-1 Dry throat/eyes after 2–3 h
0 Normal
1 Moist skin
2 Skin completely wet
Thermal radiation
-1 Cold on the face after 2–3 min
0 No radiation discernible
1 Warm on the face after 2–3 min
2 Unbearable on the face after more than 2 min
3 Immediate burning sensation
Air movement
-2 Cold strong air movement
-1 Cold light air movement
0 No air movement
1 Warm light air movement
2 Warm strong air movement
Workload
0 Office work: easy, low muscular constraints, occasional movement at normal speed
1 Moderate work with arms or legs: use of heavy machines, steady walking
2 Intense work with arms and trunk: handling of heavy objects, shovelling, woodcutting, walking rapidly or while carrying a heavy load
3 Very intense work at high speed: stairs, ladders

Appendix 2. Scoring scales for evaluating thermal conditions at work 53
Score Condition
Clothing
0 Light, flexible, not interfering with the work
1 Long, heavier, slightly interfering with the work
2 Clumsy, heavy, special for radiation, humidity or cold
3 Special overalls with gloves, hoods and shoes
Opinion of the workers
-3 Shivering, strong discomfort for the whole body
-2 Strong local discomfort, overall sensation of coolness
-1 Slight local cool discomfort
0 No discomfort
1 Slight sweating and discomfort, thirst
2 Heavy sweating, strong thirst, work pace modified
3 Excessive sweating, very tiring work, special clothing
Source: Malchaire, Gebhardt and Piette (1999).

For more information, please contact:
Jonas CedergrenForestry OfficerForestry Department, FAOViale delle Terme di Caracalla00153 Rome, ItalyEmail: [email protected] Website: www.fao.org/forestry
I9179EN/1/04.18
ISBN 978-92-5-130502-7
9 7 8 9 2 5 1 3 0 5 0 2 7