managing interest rate risk: duration gap and economic value of equity chapter 6 prof. dr. rainer...
Post on 18-Dec-2015
215 views
TRANSCRIPT

Managing Interest Rate Risk:Duration GAP and Economic Value of Equity
Chapter 6
Prof. Dr. Rainer StachuletzProf. Dr. Rainer StachuletzBanking Academy of Vietnam Banking Academy of Vietnam Based upon: Bank ManagementBased upon: Bank Management, 6th edition. 6th edition.Timothy W. Koch and S. Scott MacDonaldTimothy W. Koch and S. Scott MacDonald
Prof. Dr. Rainer Stachuletz – Banking Academy of Vietnam - Hanoi

Measuring Interest Rate Risk with Duration GAP
Economic Value of Equity Analysis Focuses on changes in stockholders’
equity given potential changes in interest rates
Duration GAP Analysis Compares the price sensitivity of a
bank’s total assets with the price sensitivity of its total liabilities to assess the impact of potential changes in interest rates on stockholders’ equity.

Recall from Chapter 4
Duration is a measure of the effective maturity of a security. Duration incorporates the timing and
size of a security’s cash flows. Duration measures how price sensitive
a security is to changes in interest rates.
The greater (shorter) the duration, the greater (lesser) the price sensitivity.
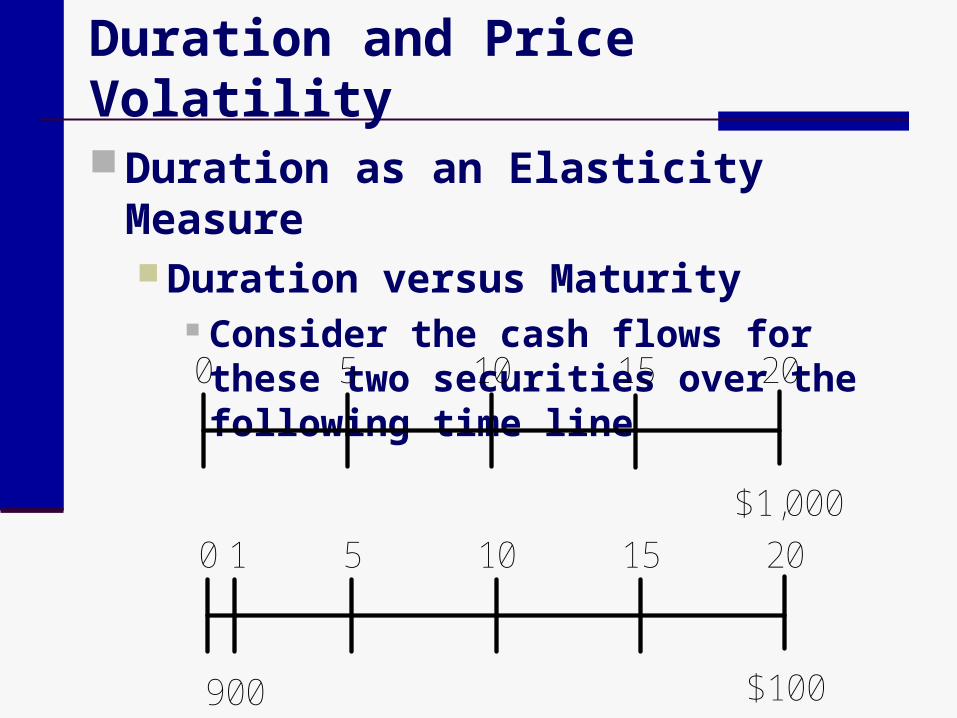
Duration and Price Volatility
Duration as an Elasticity Measure Duration versus Maturity
Consider the cash flows for these two securities over the following time line
0 5 10 15 20
$1,000
0 5
900
10 15 201
$100
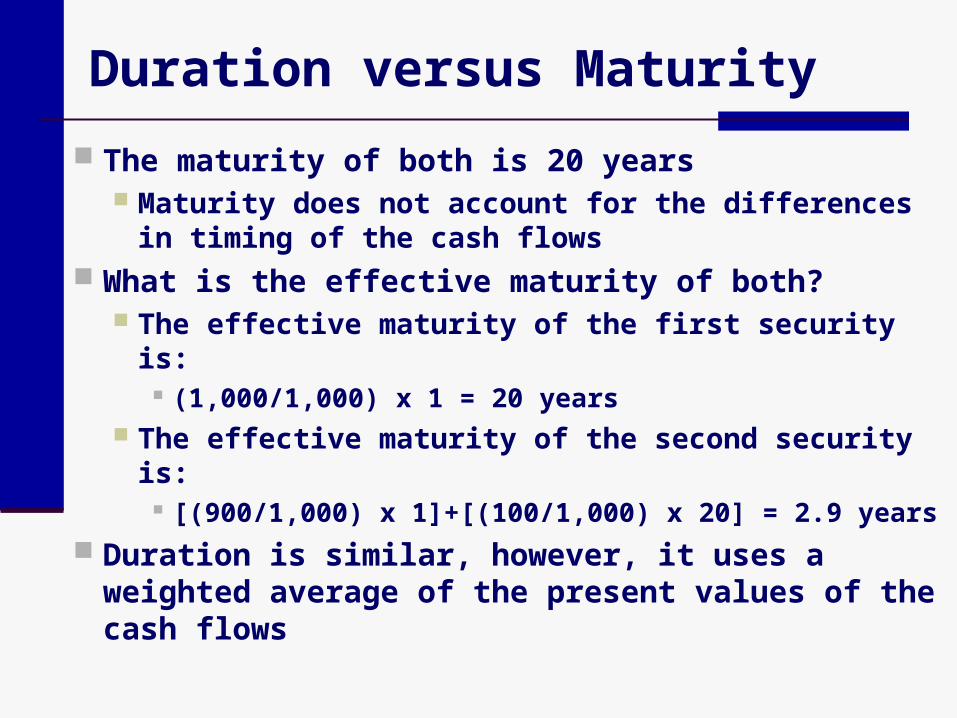
Duration versus Maturity
The maturity of both is 20 years Maturity does not account for the differences in
timing of the cash flows What is the effective maturity of both?
The effective maturity of the first security is: (1,000/1,000) x 1 = 20 years
The effective maturity of the second security is: [(900/1,000) x 1]+[(100/1,000) x 20] = 2.9 years
Duration is similar, however, it uses a weighted average of the present values of the cash flows
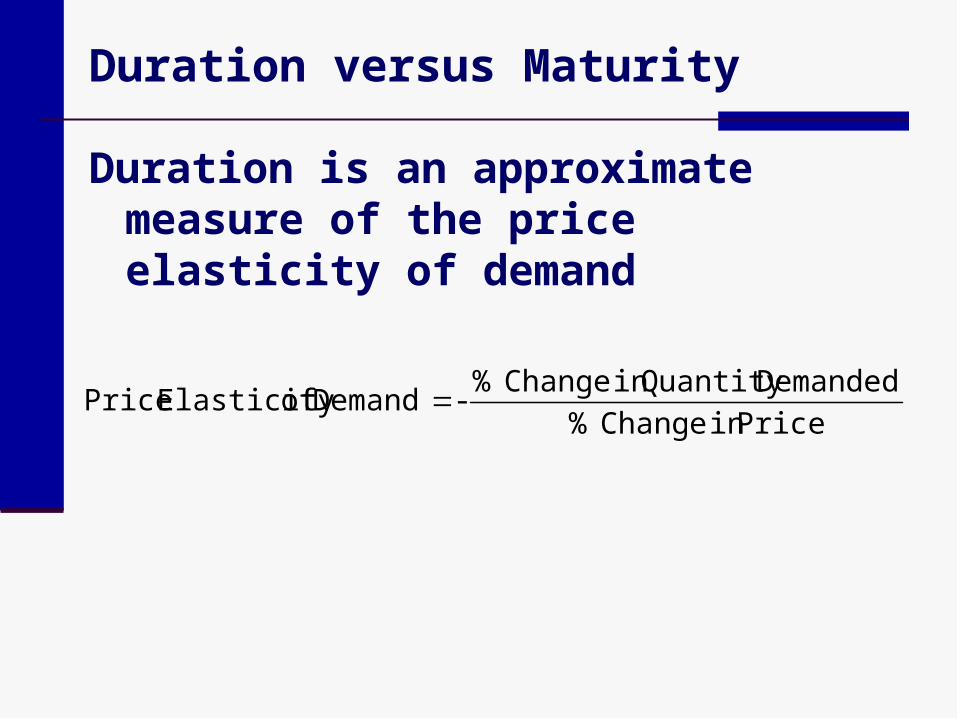
Duration versus Maturity
Duration is an approximate measure of the price elasticity of demand
Price in Change %
Demanded Quantity in Change % - Demand of Elasticity Price

Duration versus Maturity
The longer the duration, the larger the change in price for a given change in interest rates.
i)(1i
PP
- Duration
Pi)(1
iDuration - P

Measuring Duration
Duration is a weighted average of the time until the expected cash flows from a security will be received, relative to the security’s price Macaulay’s Duration
Security the of Pricer)+(1(t)CF
r)+(1CF
r)+(1(t)CF
=D
n
1=tt
t
k
1=tt
t
k
1=tt
t
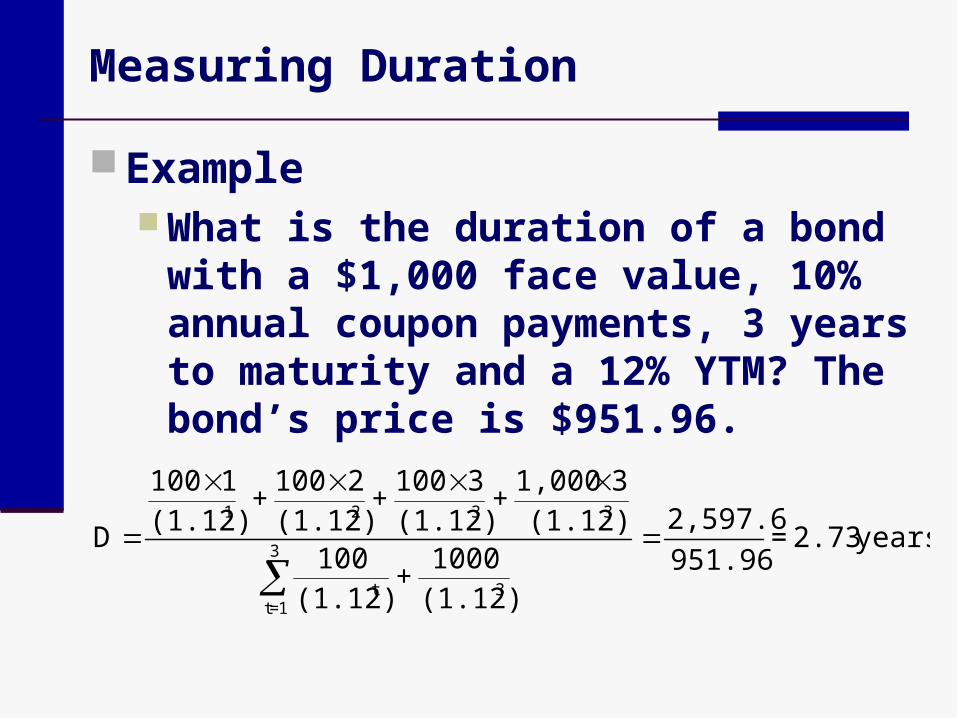
Measuring Duration
Example What is the duration of a bond with a
$1,000 face value, 10% annual coupon payments, 3 years to maturity and a 12% YTM? The bond’s price is $951.96.
years 2.73 = 951.96
2,597.6
(1.12)1000
+ (1.12)
100(1.12)
31,000 +
(1.12)3100
+ (1.12)
2100+
(1.12)1100
D3
1=t3t
332
1

Measuring Duration
Example What is the duration of a bond with a
$1,000 face value, 10% coupon, 3 years to maturity but the YTM is 5%?The bond’s price is $1,136.16.
years2.75 = 1,136.16
3,127.31
1136.16(1.05)
3*1,000 +
(1.05)3*100
+ (1.05)
2*100+
(1.05)1*100
D332
1

Measuring Duration
Example What is the duration of a bond with a
$1,000 face value, 10% coupon, 3 years to maturity but the YTM is 20%?The bond’s price is $789.35.
years2.68 = 789.35
2,131.95
789.35(1.20)
3*1,000 +
(1.20)3*100
+ (1.20)
2*100+
(1.20)1*100
D332
1

Measuring Duration
Example What is the duration of a zero coupon
bond with a $1,000 face value, 3 years to maturity but the YTM is 12%?
By definition, the duration of a zero coupon bond is equal to its maturity
years3 = 711.78
2,135.34
(1.12) 1,000
(1.12)3*1,000
D
3
3

Duration and Modified Duration
The greater the duration, the greater the price sensitivity
Modified Duration gives an estimate of price volatility:
i Duration Modified - P
P
i)(1
Duration sMacaulay' Duration Modified

Effective Duration
Effective Duration Used to estimate a security’s price
sensitivity when the security contains embedded options.
Compares a security’s estimated price in a falling and rising rate environment.

Effective Duration
Where: Pi- = Price if rates fall
Pi+ = Price if rates rise
P0 = Initial (current) price
i+ = Initial market rate plus the increase in rate
i- = Initial market rate minus the decrease in rate
)i (iP
P P Duration Effective
-0
i-i
-
-

Effective Duration
Example Consider a 3-year, 9.4 percent semi-
annual coupon bond selling for $10,000 par to yield 9.4 percent to maturity.
Macaulay’s Duration for the option-free version of this bond is 5.36 semiannual periods, or 2.68 years.
The Modified Duration of this bond is 5.12 semiannual periods or 2.56 years.

Effective Duration
Example Assume, instead, that the bond is
callable at par in the near-term . If rates fall, the price will not rise much
above the par value since it will likely be called
If rates rise, the bond is unlikely to be called and the price will fall

Effective Duration
Example If rates rise 30 basis points to 5%
semiannually, the price will fall to $9,847.72.
If rates fall 30 basis points to 4.4% semiannually, the price will remain at par
5420
.0.044) .05$10,000(
9,847.72$ $10,000 Duration Effective
-
-
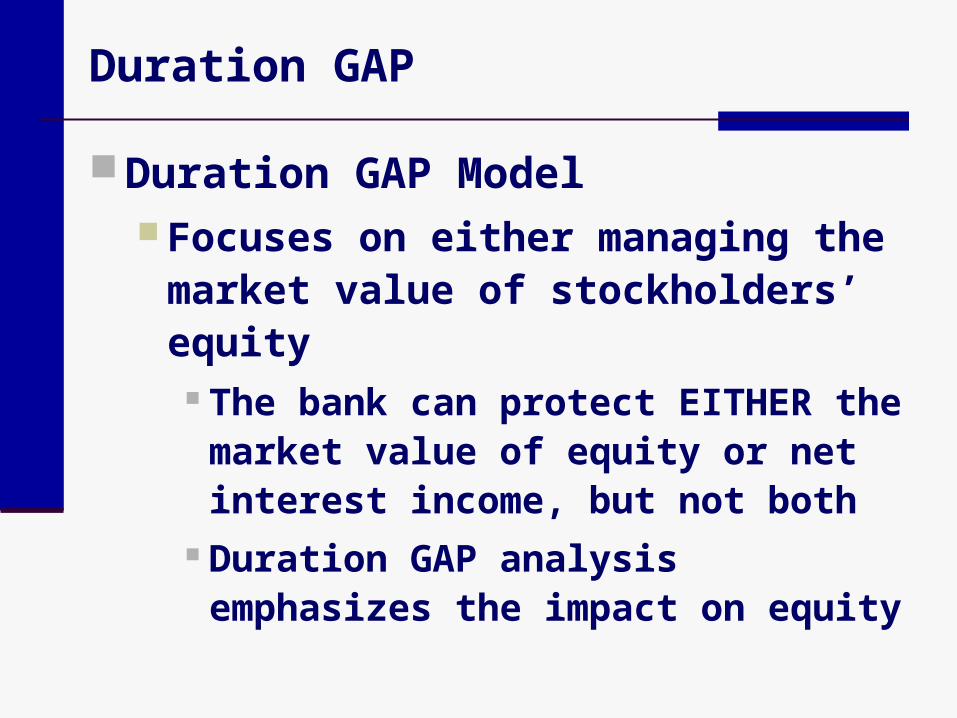
Duration GAP
Duration GAP Model Focuses on either managing the
market value of stockholders’ equity The bank can protect EITHER the
market value of equity or net interest income, but not both
Duration GAP analysis emphasizes the impact on equity
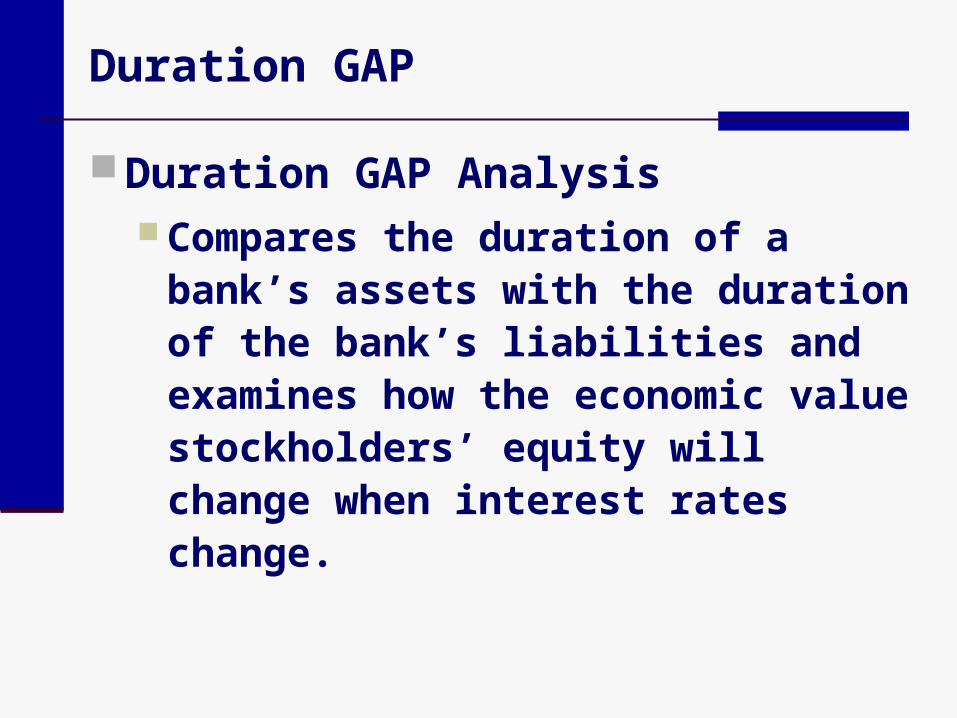
Duration GAP
Duration GAP Analysis Compares the duration of a bank’s
assets with the duration of the bank’s liabilities and examines how the economic value stockholders’ equity will change when interest rates change.

Two Types of Interest Rate Risk
Reinvestment Rate Risk Changes in interest rates will change
the bank’s cost of funds as well as the return on invested assets
Price Risk Changes in interest rates will change
the market values of the bank’s assets and liabilities

Reinvestment Rate Risk
If interest rates change, the bank will have to reinvest the cash flows from assets or refinance rolled-over liabilities at a different interest rate in the future An increase in rates increases a bank’s
return on assets but also increases the bank’s cost of funds

Price Risk
If interest rates change, the value of assets and liabilities also change. The longer the duration, the larger the
change in value for a given change in interest rates
Duration GAP considers the impact of changing rates on the market value of equity

Reinvestment Rate Risk and Price Risk
Reinvestment Rate Risk If interest rates rise (fall), the yield from
the reinvestment of the cash flows rises (falls) and the holding period return (HPR) increases (decreases).
Price risk If interest rates rise (fall), the price falls
(rises). Thus, if you sell the security prior to maturity, the HPR falls (rises).

Reinvestment Rate Risk and Price Risk
Increases in interest rates will increase the HPR from a higher reinvestment rate but reduce the HPR from capital losses if the security is sold prior to maturity.
Decreases in interest rates will decrease the HPR from a lower reinvestment rate but increase the HPR from capital gains if the security is sold prior to maturity.

Reinvestment Rate Risk and Price Risk
An immunized security or portfolio is one in which the gain from the higher reinvestment rate is just offset by the capital loss.
For an individual security, immunization occurs when an investor’s holding period equals the duration of the security.
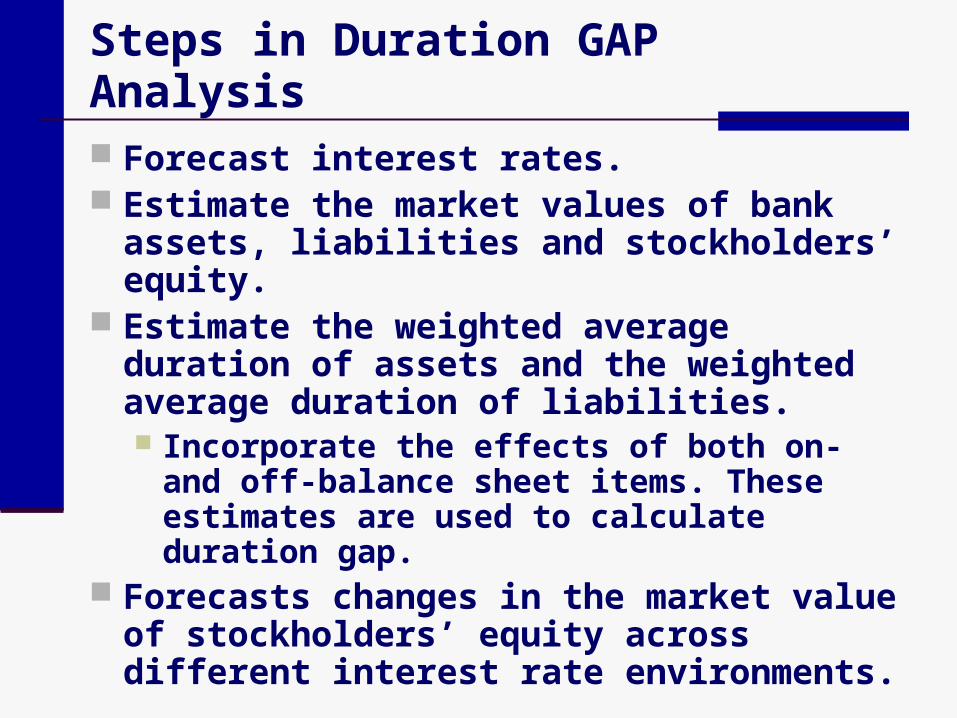
Steps in Duration GAP Analysis
Forecast interest rates. Estimate the market values of bank assets,
liabilities and stockholders’ equity. Estimate the weighted average duration of
assets and the weighted average duration of liabilities. Incorporate the effects of both on- and off-
balance sheet items. These estimates are used to calculate duration gap.
Forecasts changes in the market value of stockholders’ equity across different interest rate environments.

Weighted Average Duration of Bank Assets
Weighted Average Duration of Bank Assets (DA)
Where wi = Market value of asset i divided by
the market value of all bank assets Dai = Macaulay’s duration of asset i n = number of different bank assets
n
iiiDawDA

Weighted Average Duration of Bank Liabilities
Weighted Average Duration of Bank Liabilities (DL)
Where zj = Market value of liability j divided by
the market value of all bank liabilities Dlj= Macaulay’s duration of liability j m = number of different bank liabilities
m
jjjDlzDL
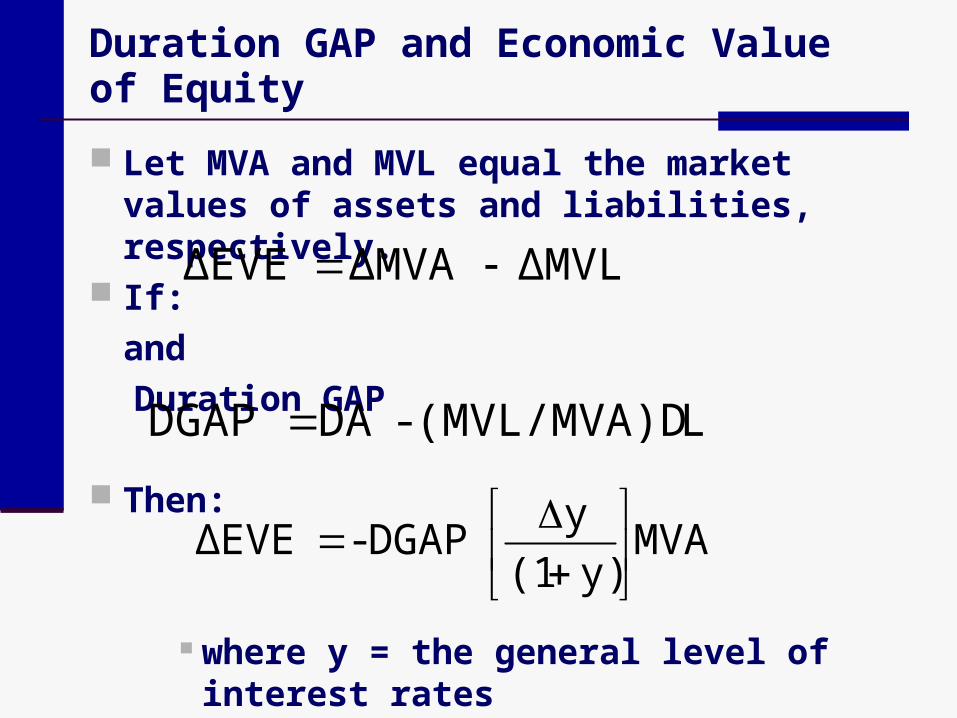
Duration GAP and Economic Value of Equity
Let MVA and MVL equal the market values of assets and liabilities, respectively.
If:
and
Duration GAP
Then:
where y = the general level of interest rates
L(MVL/MVA)D -DA DGAP
MVAy)(1
yDGAP- ΔEVE
ΔMVLΔMVAΔEVE

Duration GAP and Economic Value of Equity
To protect the economic value of equity against any change when rates change , the bank could set the duration gap to zero:
MVAy)(1
yDGAP- ΔEVE

1 Par Years Market$1,000 % Coup Mat. YTM Value Dur.
AssetsCash $100 100$ Earning assets
3-yr Commercial loan 700$ 12.00% 3 12.00% 700$ 2.696-yr Treasury bond 200$ 8.00% 6 8.00% 200$ 4.99 Total Earning Assets 900$ 11.11% 900$ Non-cash earning assets -$ -$
Total assets 1,000$ 10.00% 1,000$ 2.88
LiabilitiesInterest bearing liabs.
1-yr Time deposit 620$ 5.00% 1 5.00% 620$ 1.003-yr Certificate of deposit 300$ 7.00% 3 7.00% 300$ 2.81 Tot. Int Bearing Liabs. 920$ 5.65% 920$ Tot. non-int. bearing -$ -$ Total liabilities 920$ 5.65% 920$ 1.59
Total equity 80$ 80$ Total liabs & equity 1,000$ 1,000$
Hypothetical Bank Balance Sheet
700)12.1(3700
)12.1(384
)12.1(284
)12.1(184
3321
D

Calculating DGAP
DA ($700/$1000)*2.69 + ($200/$1000)*4.99 = 2.88
DL ($620/$920)*1.00 + ($300/$920)*2.81 = 1.59
DGAP 2.88 - (920/1000)*1.59 = 1.42 years
What does this tell us? The average duration of assets is greater than the
average duration of liabilities; thus asset values change by more than liability values.

1 Par Years Market$1,000 % Coup Mat. YTM Value Dur.
AssetsCash 100$ 100$ Earning assets
3-yr Commercial loan 700$ 12.00% 3 13.00% 683$ 2.696-yr Treasury bond 200$ 8.00% 6 9.00% 191$ 4.97 Total Earning Assets 900$ 12.13% 875$ Non-cash earning assets -$ -$
Total assets 1,000$ 10.88% 975$ 2.86
LiabilitiesInterest bearing liabs.
1-yr Time deposit 620$ 5.00% 1 6.00% 614$ 1.003-yr Certificate of deposit 300$ 7.00% 3 8.00% 292$ 2.81 Tot. Int Bearing Liabs. 920$ 6.64% 906$ Tot. non-int. bearing -$ -$ Total liabilities 920$ 6.64% 906$ 1.58
Total equity 80$ 68$ Total liabs & equity 1,000$ 975$
1 percent increase in all rates.
3
3
1t t 1.13
700
1.13
84PV
Calculating DGAP
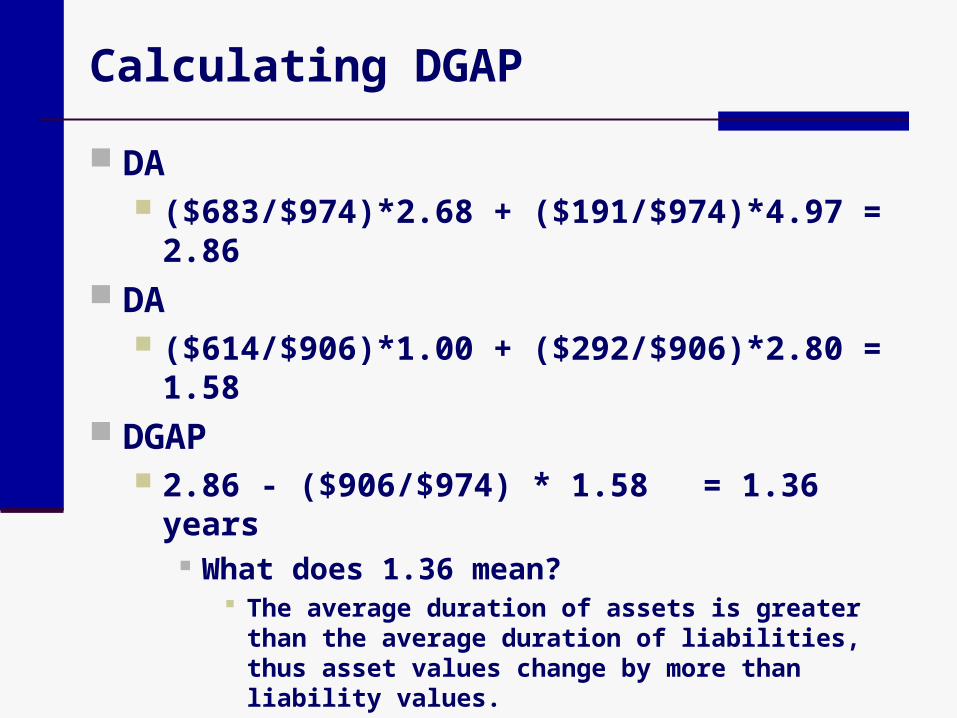
DA ($683/$974)*2.68 + ($191/$974)*4.97 = 2.86
DA ($614/$906)*1.00 + ($292/$906)*2.80 = 1.58
DGAP 2.86 - ($906/$974) * 1.58 = 1.36 years
What does 1.36 mean? The average duration of assets is greater than the
average duration of liabilities, thus asset values change by more than liability values.

Change in the Market Value of Equity
In this case:
MVA]y)(1
yDGAP[- ΔEVE
91120001101
01.$,$]
.
.1.42[- ΔEVE

Positive and Negative Duration GAPs
Positive DGAP Indicates that assets are more price sensitive
than liabilities, on average. Thus, when interest rates rise (fall), assets will
fall proportionately more (less) in value than liabilities and EVE will fall (rise) accordingly.
Negative DGAP Indicates that weighted liabilities are more
price sensitive than weighted assets. Thus, when interest rates rise (fall), assets will
fall proportionately less (more) in value that liabilities and the EVE will rise (fall).

DGAP Summary
Assets Liabilities Equity
Positive Increase Decrease > Decrease → DecreasePositive Decrease Increase > Increase → Increase
Negative Increase Decrease < Decrease → IncreaseNegative Decrease Increase < Increase → Decrease
Zero Increase Decrease = Decrease → NoneZero Decrease Increase = Increase → None
DGAP Summary
DGAPChange in
Interest Rates

An Immunized Portfolio
To immunize the EVE from rate changes in the example, the bank would need to: decrease the asset duration by 1.42
years or increase the duration of liabilities by
1.54 years DA / ( MVA/MVL)
= 1.42 / ($920 / $1,000) = 1.54 years
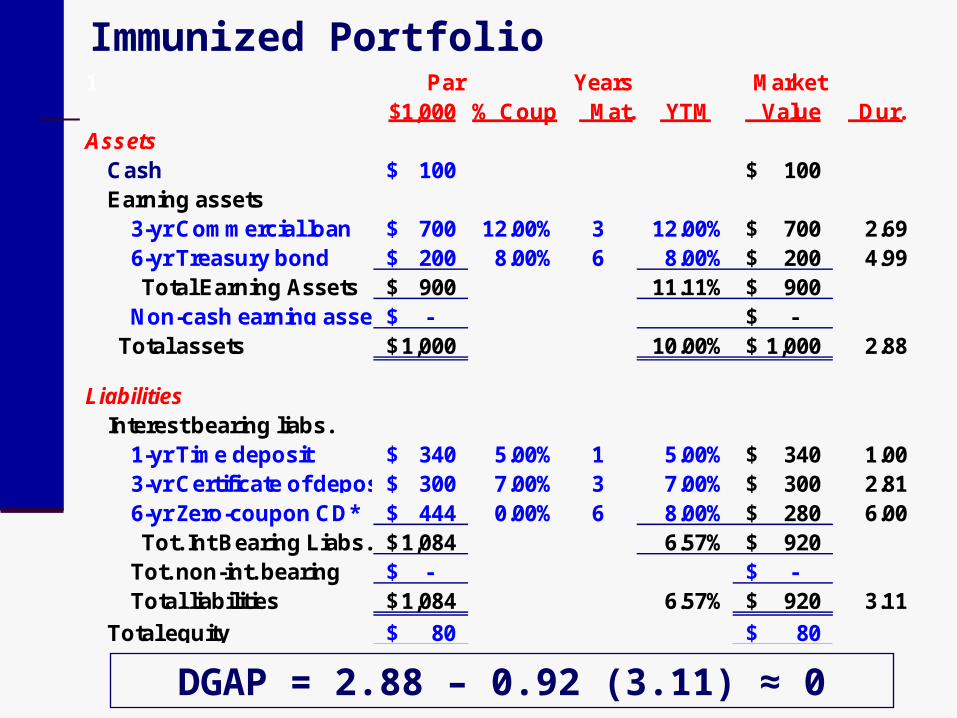
1 Par Years Market$1,000 % Coup Mat. YTM Value Dur.
AssetsCash 100$ 100$ Earning assets
3-yr Commercial loan 700$ 12.00% 3 12.00% 700$ 2.696-yr Treasury bond 200$ 8.00% 6 8.00% 200$ 4.99 Total Earning Assets 900$ 11.11% 900$ Non-cash earning assets -$ -$
Total assets 1,000$ 10.00% 1,000$ 2.88
LiabilitiesInterest bearing liabs.
1-yr Time deposit 340$ 5.00% 1 5.00% 340$ 1.003-yr Certificate of deposit 300$ 7.00% 3 7.00% 300$ 2.816-yr Zero-coupon CD* 444$ 0.00% 6 8.00% 280$ 6.00 Tot. Int Bearing Liabs. 1,084$ 6.57% 920$ Tot. non-int. bearing -$ -$ Total liabilities 1,084$ 6.57% 920$ 3.11
Total equity 80$ 80$
Immunized Portfolio
DGAP = 2.88 – 0.92 (3.11) ≈ 0

1 Par Years Market$1,000 % Coup Mat. YTM Value Dur.
AssetsCash 100.0$ 100.0$ Earning assets
3-yr Commercial loan 700.0$ 12.00% 3 13.00% 683.5$ 2.696-yr Treasury bond 200.0$ 8.00% 6 9.00% 191.0$ 4.97 Total Earning Assets 900.0$ 12.13% 874.5$ Non-cash earning assets -$ -$
Total assets 1,000.0$ 10.88% 974.5$ 2.86
LiabilitiesInterest bearing liabs.
1-yr Time deposit 340.0$ 5.00% 1 6.00% 336.8$ 1.003-yr Certificate of deposit 300.0$ 7.00% 3 8.00% 292.3$ 2.816-yr Zero-coupon CD* 444.3$ 0.00% 6 9.00% 264.9$ 6.00 Tot. Int Bearing Liabs. 1,084.3$ 7.54% 894.0$ Tot. non-int. bearing -$ -$ Total liabilities 1,084.3$ 7.54% 894.0$ 3.07
Total equity 80.0$ 80.5$
Immunized Portfolio with a 1% increase in rates

Immunized Portfolio with a 1% increase in rates
EVE changed by only $0.5 with the immunized portfolio versus $25.0 when the portfolio was not immunized.

Stabilizing the Book Value of Net Interest Income
This can be done for a 1-year time horizon, with the appropriate duration gap measure DGAP* MVRSA(1- DRSA) - MVRSL(1- DRSL)
where: MVRSA = cumulative market value of RSAs MVRSL = cumulative market value of RSLs DRSA = composite duration of RSAs for the
given time horizon Equal to the sum of the products of each asset’s
duration with the relative share of its total asset market value
DRSL = composite duration of RSLs for the given time horizon
Equal to the sum of the products of each liability’s duration with the relative share of its total liability market value.

Stabilizing the Book Value of Net Interest Income
If DGAP* is positive, the bank’s net interest income will decrease when interest rates decrease, and increase when rates increase. If DGAP* is negative, the relationship is
reversed. Only when DGAP* equals zero is interest
rate risk eliminated. Banks can use duration analysis to stabilize
a number of different variables reflecting bank performance.

Economic Value of Equity Sensitivity Analysis
Effectively involves the same steps as earnings sensitivity analysis.
In EVE analysis, however, the bank focuses on: The relative durations of assets and
liabilities How much the durations change in
different interest rate environments What happens to the economic value of
equity across different rate environments

Embedded Options
Embedded options sharply influence the estimated volatility in EVE Prepayments that exceed (fall short of)
that expected will shorten (lengthen) duration.
A bond being called will shorten duration. A deposit that is withdrawn early will
shorten duration. A deposit that is not withdrawn as
expected will lengthen duration.

Book Value Market Value Book Yield Duration*
LoansPrime Based Ln $ 100,000 $ 102,000 9.00%Equity Credit Lines $ 25,000 $ 25,500 8.75% -Fixed Rate > I yr $ 170,000 $ 170,850 7.50% 1.1Var Rate Mtg 1 Yr $ 55,000 $ 54,725 6.90% 0.530-Year Mortgage $ 250,000 $ 245,000 7.60% 6.0Consumer Ln $ 100,000 $ 100,500 8.00% 1.9Credit Card $ 25,000 $ 25,000 14.00% 1.0Total Loans $ 725,000 $ 723,575 8.03% 2.6Loan Loss Reserve $ (15,000) $ 11,250 0.00% 8.0 Net Loans $ 710,000 $ 712,325 8.03% 2.5InvestmentsEurodollars $ 80,000 $ 80,000 5.50% 0.1CMO Fix Rate $ 35,000 $ 34,825 6.25% 2.0US Treasury $ 75,000 $ 74,813 5.80% 1.8 Total Investments $ 190,000 $ 189,638 5.76% 1.1
Fed Funds Sold $ 25,000 $ 25,000 5.25% -Cash & Due From $ 15,000 $ 15,000 0.00% 6.5Non-int Rel Assets $ 60,000 $ 60,000 0.00% 8.0 Total Assets $ 100,000 $ 100,000 6.93% 2.6
First Savings Bank Economic Value of Equity Market Value/Duration Report as of 12/31/04 Most Likely Rate Scenario-Base Strategy
Ass
ets

Book Value Market Value Book Yield Duration*
DepositsMMDA $ 240,000 $ 232,800 2.25% -Retail CDs $ 400,000 $ 400,000 5.40% 1.1Savings $ 35,000 $ 33,600 4.00% 1.9NOW $ 40,000 $ 38,800 2.00% 1.9DDA Personal $ 55,000 $ 52,250 8.0Comm'l DDA $ 60,000 $ 58,200 4.8 Total Deposits $ 830,000 $ 815,650 1.6TT&L $ 25,000 $ 25,000 5.00% -L-T Notes Fixed $ 50,000 $ 50,250 8.00% 5.9Fed Funds Purch - - 5.25% -NIR Liabilities $ 30,000 $ 28,500 8.0 Total Liabilities $ 935,000 $ 919,400 2.0
Equity $ 65,000 $ 82,563 9.9 Total Liab & Equity $ 1,000,000 $ 1,001,963 2.6
Off Balance Sheet Notionallnt Rate Swaps - $ 1,250 6.00% 2.8 50,000
Adjusted Equity $ 65,000 $ 83,813 7.9
First Savings Bank Economic Value of Equity Market Value/Duration Report as of 12/31/04 Most Likely Rate Scenario-Base Strategy
Liab
ilitie
s

Duration Gap for First Savings Bank EVE
Market Value of Assets $1,001,963
Duration of Assets 2.6 years
Market Value of Liabilities $919,400
Duration of Liabilities 2.0 years
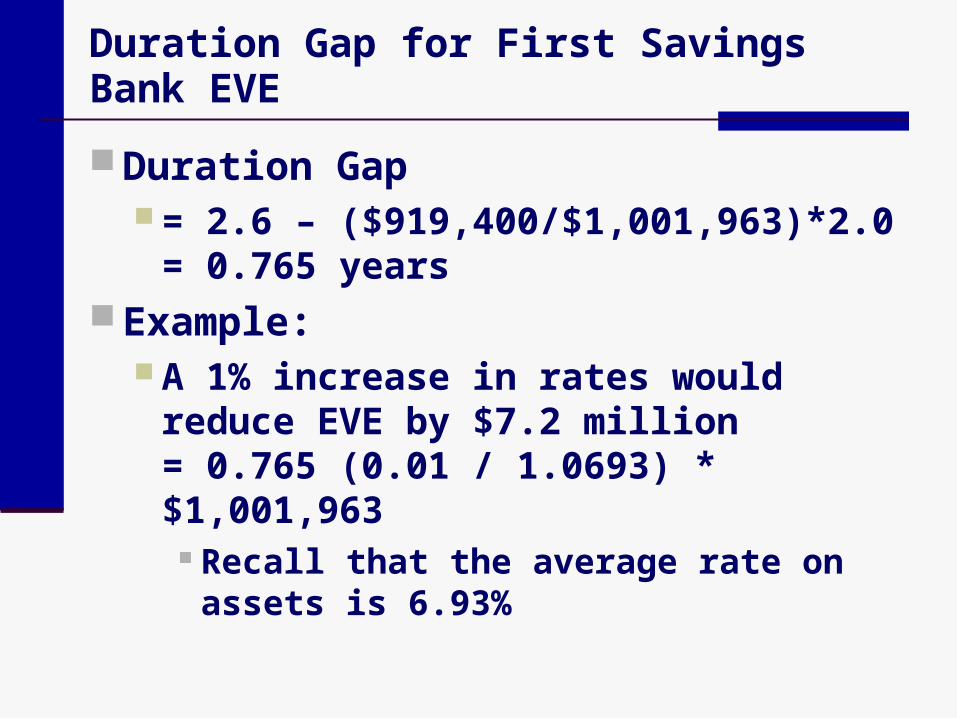
Duration Gap for First Savings Bank EVE
Duration Gap = 2.6 – ($919,400/$1,001,963)*2.0
= 0.765 years Example:
A 1% increase in rates would reduce EVE by $7.2 million= 0.765 (0.01 / 1.0693) * $1,001,963
Recall that the average rate on assets is 6.93%

Sensitivity of EVE versus Most Likely (Zero Shock) Interest Rate Scenario
2
(10.0)
20.0
10.0 8.8 8.2
(8.2)
(20.4)
(36.6)
13.6
ALCO G uide lineBoard Limit(20.0)
(30.0)
Ch
ang
e in
EV
E (
mill
ion
s o
f d
olla
rs)
(40.0)-300 -200 -100 +100 +200 +3000
Shocks to Curre nt Rates
Sensitivity of Economic Value of Equity measures the change in the economic value of the corporation’s equity under various changes in interest rates. Rate changes are instantaneous changes from current rates. The change in economic value of equity is derived from the difference between changes in the market value of assets and changes in the market value of liabilities.
Effective “Duration” of Equity
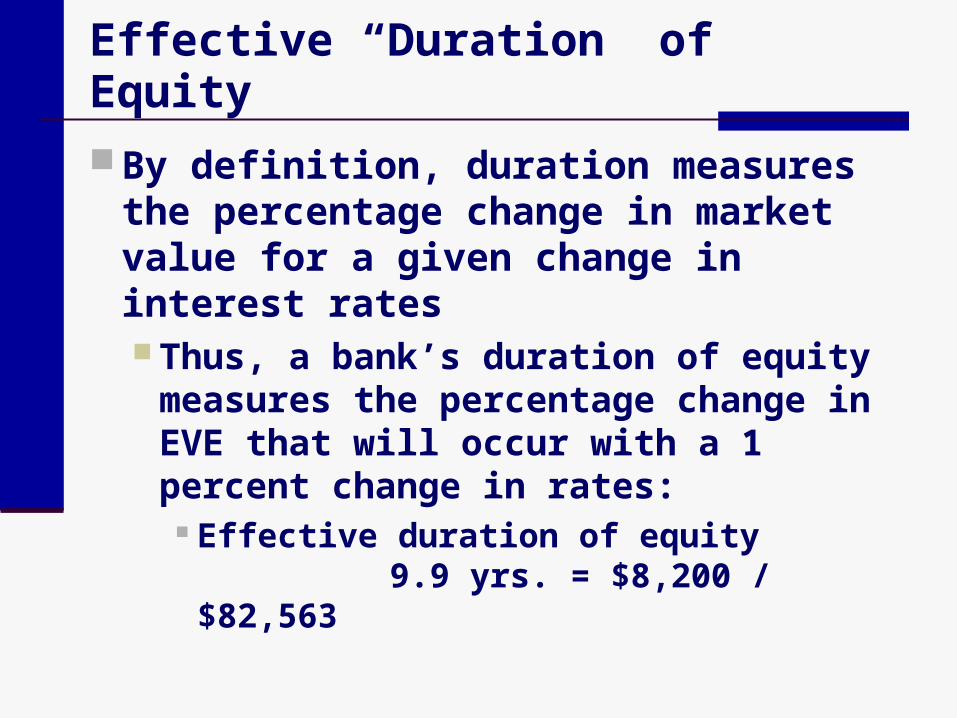
By definition, duration measures the percentage change in market value for a given change in interest rates Thus, a bank’s duration of equity
measures the percentage change in EVE that will occur with a 1 percent change in rates:
Effective duration of equity 9.9 yrs. = $8,200 / $82,563

Asset/Liability Sensitivity and DGAP
Funding GAP and Duration GAP are NOT directly comparable Funding GAP examines various “time
buckets” while Duration GAP represents the entire balance sheet.
Generally, if a bank is liability (asset) sensitive in the sense that net interest income falls (rises) when rates rise and vice versa, it will likely have a positive (negative) DGAP suggesting that assets are more price sensitive than liabilities, on average.
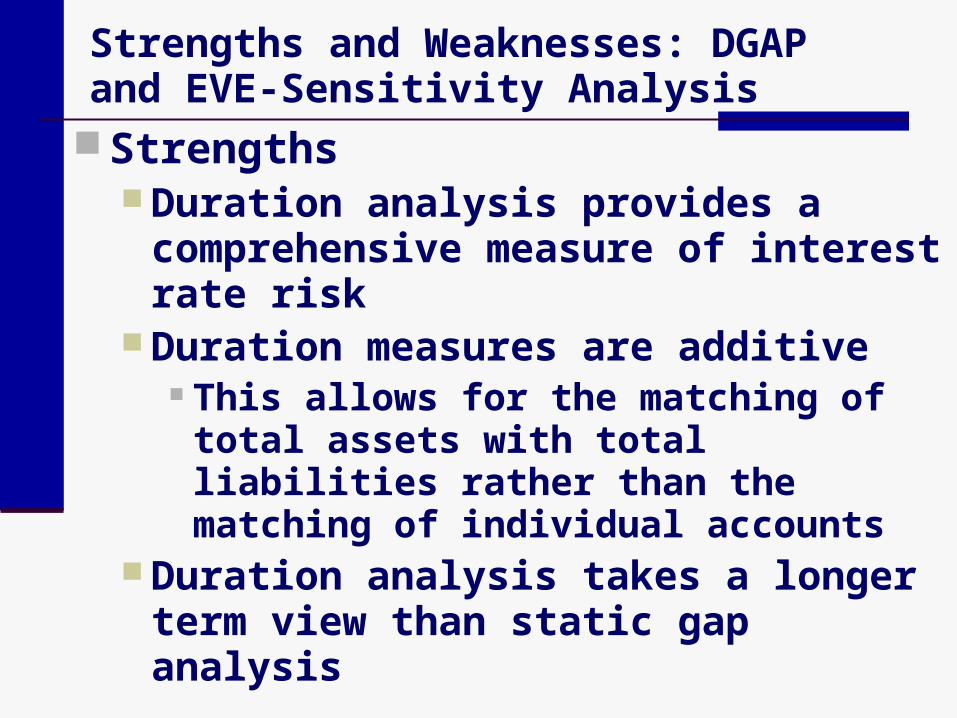
Strengths and Weaknesses: DGAP and EVE-Sensitivity Analysis
Strengths Duration analysis provides a
comprehensive measure of interest rate risk
Duration measures are additive This allows for the matching of total
assets with total liabilities rather than the matching of individual accounts
Duration analysis takes a longer term view than static gap analysis

Strengths and Weaknesses: DGAP and EVE-Sensitivity Analysis
Weaknesses It is difficult to compute duration
accurately “Correct” duration analysis requires that
each future cash flow be discounted by a distinct discount rate
A bank must continuously monitor and adjust the duration of its portfolio
It is difficult to estimate the duration on assets and liabilities that do not earn or pay interest
Duration measures are highly subjective
Speculating on Duration GAP
It is difficult to actively vary GAP or DGAP and consistently win Interest rates forecasts are frequently
wrong Even if rates change as predicted,
banks have limited flexibility in vary GAP and DGAP and must often sacrifice yield to do so

Gap and DGAP Management StrategiesExample
Cash flows from investing $1,000 either in a 2-year security yielding 6 percent or two consecutive 1-year securities, with the current 1-year yield equal to 5.5 percent. 0 1 2
$60 $60
Two-Year Security
0 1 2
$55 ?
One-Year Security & then another One-Year Security

Gap and DGAP Management StrategiesExample
It is not known today what a 1-year security will yield in one year.
For the two consecutive 1-year securities to generate the same $120 in interest, ignoring compounding, the 1-year security must yield 6.5% one year from the present.
This break-even rate is a 1-year forward rate, one year from the present:
6% + 6% = 5.5% + x so x must = 6.5%

Gap and DGAP Management StrategiesExample
By investing in the 1-year security, a depositor is betting that the 1-year interest rate in one year will be greater than 6.5%
By issuing the 2-year security, the bank is betting that the 1-year interest rate in one year will be greater than 6.5%

Yield Curve Strategy
When the U.S. economy hits its peak, the yield curve typically inverts, with short-term rates exceeding long-term rates. Only twice since WWII has a recession
not followed an inverted yield curve As the economy contracts, the Federal
Reserve typically increases the money supply, which causes the rates to fall and the yield curve to return to its “normal” shape.

Yield Curve Strategy
To take advantage of this trend, when the yield curve inverts, banks could: Buy long-term non-callable securities
Prices will rise as rates fall Make fixed-rate non-callable loans
Borrowers are locked into higher rates Price deposits on a floating-rate basis Lengthen the duration of assets
relative to the duration of liabilities
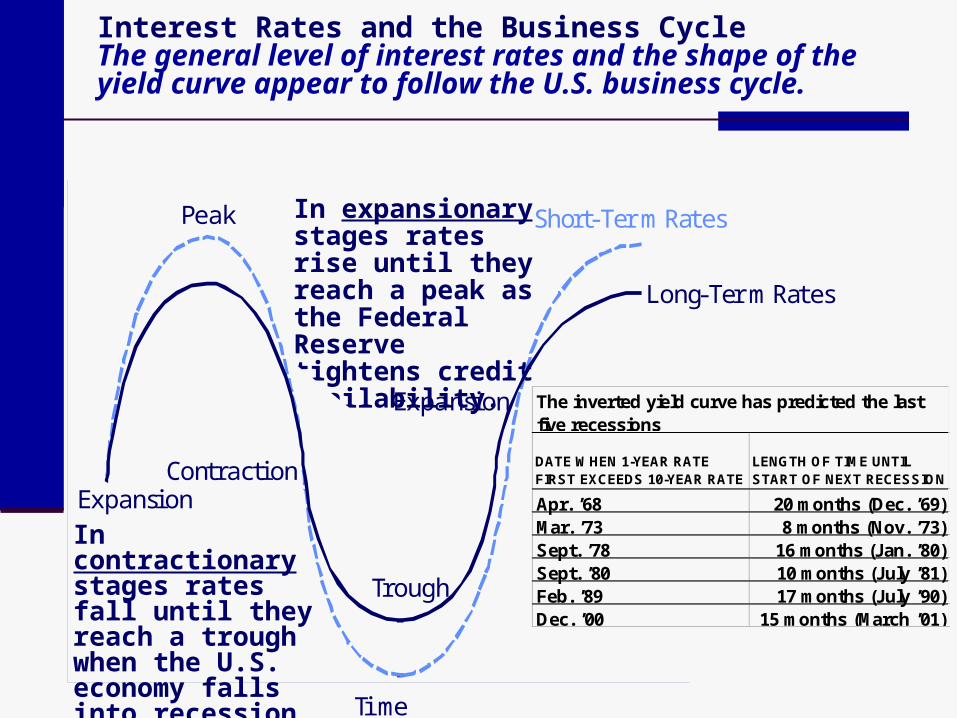
Interest Rates and the Business CycleThe general level of interest rates and the shape of the yield curve appear to follow the U.S. business cycle.
In expansionary stages rates rise until they reach a peak as the Federal Reserve tightens credit availability.
Time
ExpansionContraction
Expansion
Long-TermRates
Short-TermRatesPeak
Trough
DATE WHEN 1-YEAR RATE FIRST EXCEEDS 10-YEAR RATE
LENGTH OF TIME UNTIL START OF NEXT RECESSION
Apr. ’68 20 months (Dec. ’69)Mar. ’73 8 months (Nov. ’73)Sept. ’78 16 months (Jan. ’80)Sept. ’80 10 months (July ’81)Feb. ’89 17 months (July ’90)Dec. ’00 15 months (March ’01)
The inverted yield curve has predicted the last five recessions
In contractionary stages rates fall until they reach a trough when the U.S. economy falls into recession.

Prof. Dr. Rainer Stachuletz edited and updated the PowerPoint slides for this edition.
Managing Interest Rate Risk:Duration GAP and Economic Value of Equity
Chapter 6
Bank ManagementBank Management, 6th edition.6th edition.Timothy W. Koch and S. Scott MacDonaldTimothy W. Koch and S. Scott MacDonaldCopyright © 2006 by South-Western, a division of Thomson Learning