managing interest rate risk (i): gap and earnings sensitivity
Post on 19-Dec-2015
246 views
TRANSCRIPT
Managing Interest Rate Risk (I):GAP and Earnings Sensitivity

Interest Rate Risk Interest Rate Risk
The potential loss from unexpected changes in interest rates which can significantly alter a bank’s profitability and market value of equity.
When a bank’s assets and liabilities do not reprice at the same time, the result is a change in net interest income. The change in the value of assets and the change in the value
of liabilities will also differ, causing a change in the value of stockholder’s equity
Banks typically focus on either: Net interest income or The market value of stockholders' equity The ALCO coordinates the bank’s strategies to achieve
the optimal risk/reward trade-off. GAP Analysis
A static measure of risk that is commonly associated with net interest income (margin) targeting
Earnings Sensitivity Analysis Earnings sensitivity analysis extends GAP analysis by
focusing on changes in bank earnings due to changes in interest rates and balance sheet composition
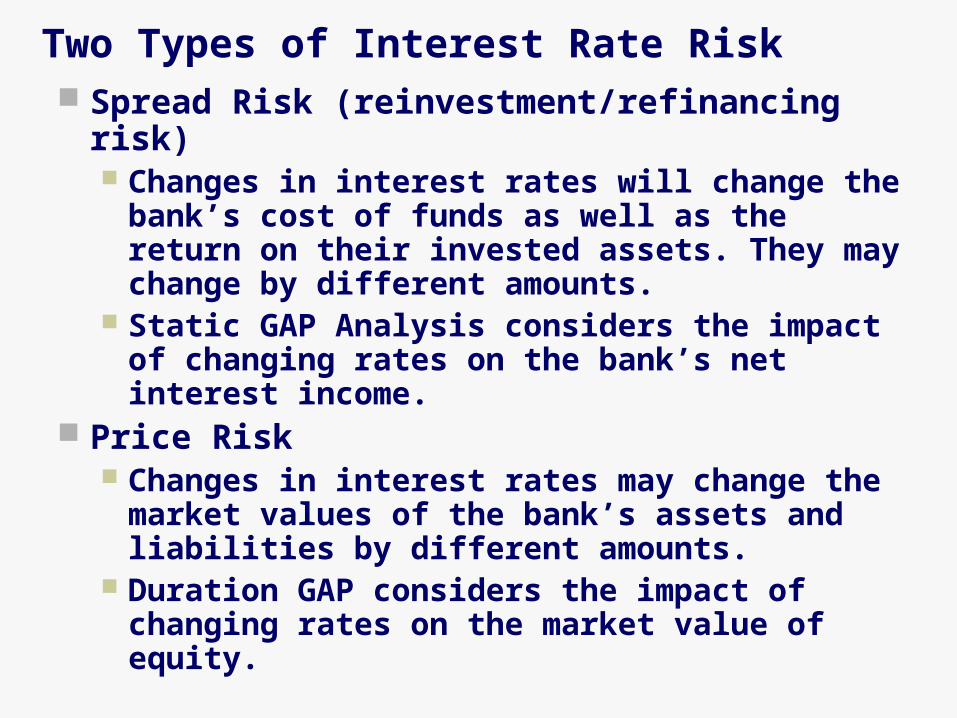
Two Types of Interest Rate Risk Spread Risk (reinvestment/refinancing risk)
Changes in interest rates will change the bank’s cost of funds as well as the return on their invested assets. They may change by different amounts.
Static GAP Analysis considers the impact of changing rates on the bank’s net interest income.
Price Risk Changes in interest rates may change the
market values of the bank’s assets and liabilities by different amounts.
Duration GAP considers the impact of changing rates on the market value of equity.
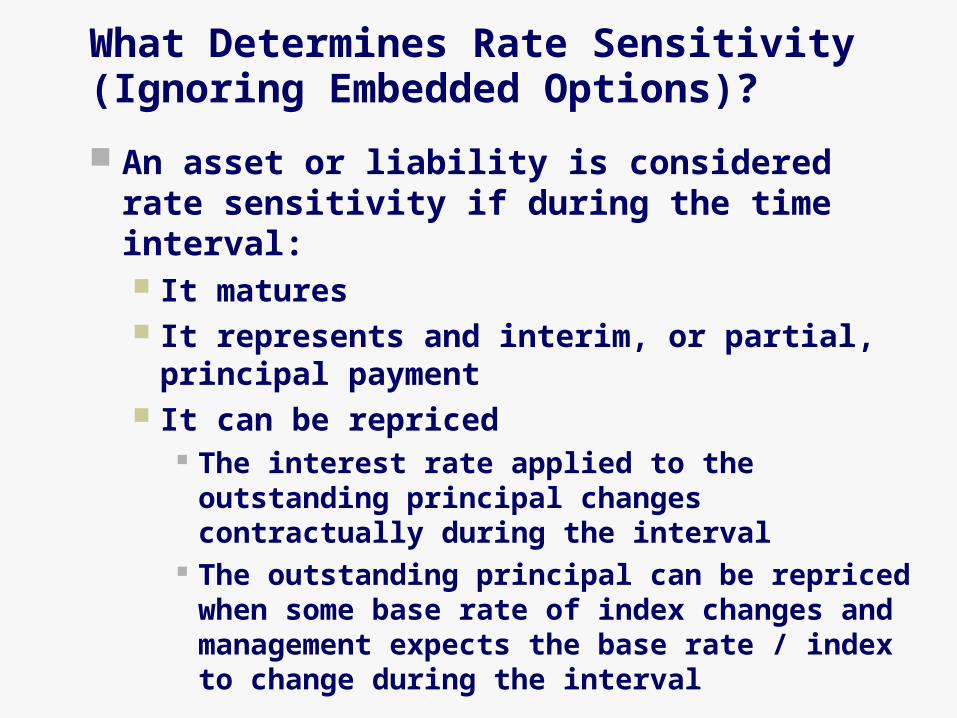
What Determines Rate Sensitivity (Ignoring Embedded Options)?
An asset or liability is considered rate sensitivity if during the time interval: It matures It represents and interim, or partial, principal
payment It can be repriced
The interest rate applied to the outstanding principal changes contractually during the interval
The outstanding principal can be repriced when some base rate of index changes and management expects the base rate / index to change during the interval
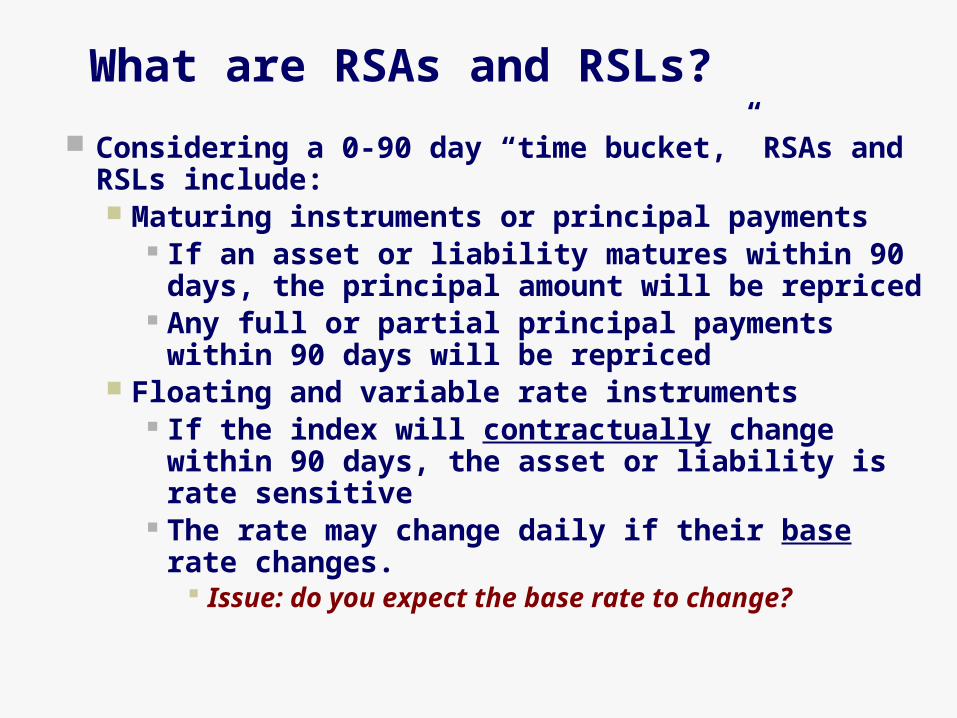
What are RSAs and RSLs?
Considering a 0-90 day “time bucket,” RSAs and RSLs include: Maturing instruments or principal payments
If an asset or liability matures within 90 days, the principal amount will be repriced
Any full or partial principal payments within 90 days will be repriced
Floating and variable rate instruments If the index will contractually change within 90
days, the asset or liability is rate sensitive The rate may change daily if their base rate
changes. Issue: do you expect the base rate to change?
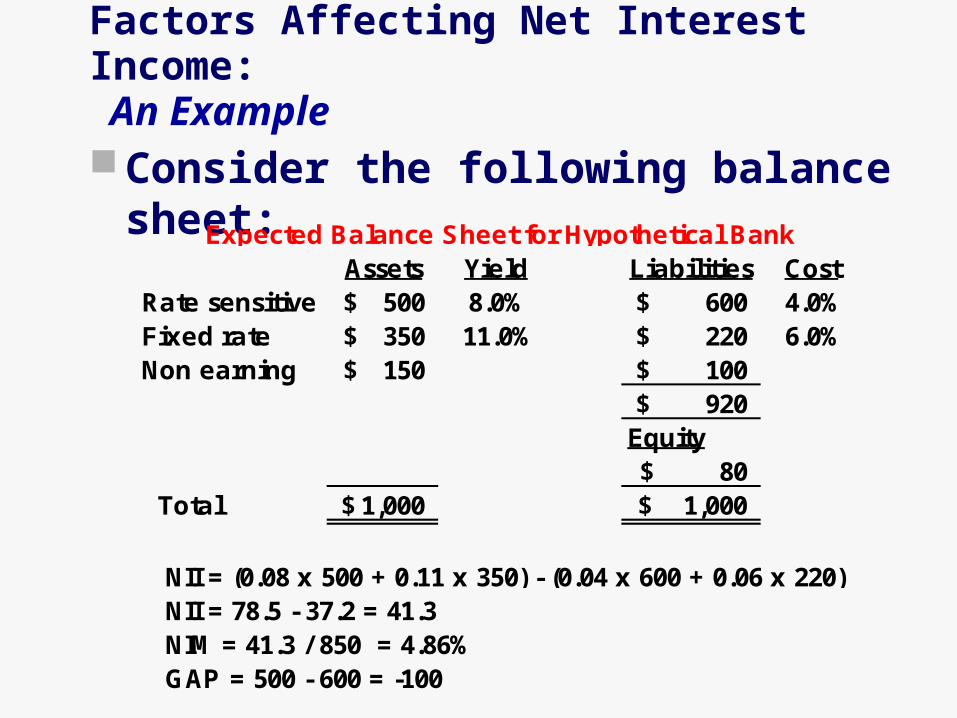
Factors Affecting Net Interest Income: An Example
Consider the following balance sheet:
Assets Yield Liabilities CostRate sensitive 500$ 8.0% 600$ 4.0%Fixed rate 350$ 11.0% 220$ 6.0%Non earning 150$ 100$
920$ Equity
80$ Total 1,000$ 1,000$
GAP = 500 - 600 = -100
NII = (0.08 x 500 + 0.11 x 350) - (0.04 x 600 + 0.06 x 220)
NIM = 41.3 / 850 = 4.86%NII = 78.5 - 37.2 = 41.3
Expected Balance Sheet for Hypothetical Bank

Examine the impact of the following changes
A 1% increase in the level of all short-term rates?
A 1% decrease in the spread between assets yields and interest costs such that the rate on RSAs increases to 8.5% and the rate on RSLs increase to 5.5%?
Changes in the relationship between short-term asset yields and liability costs
A proportionate doubling in size of the bank?
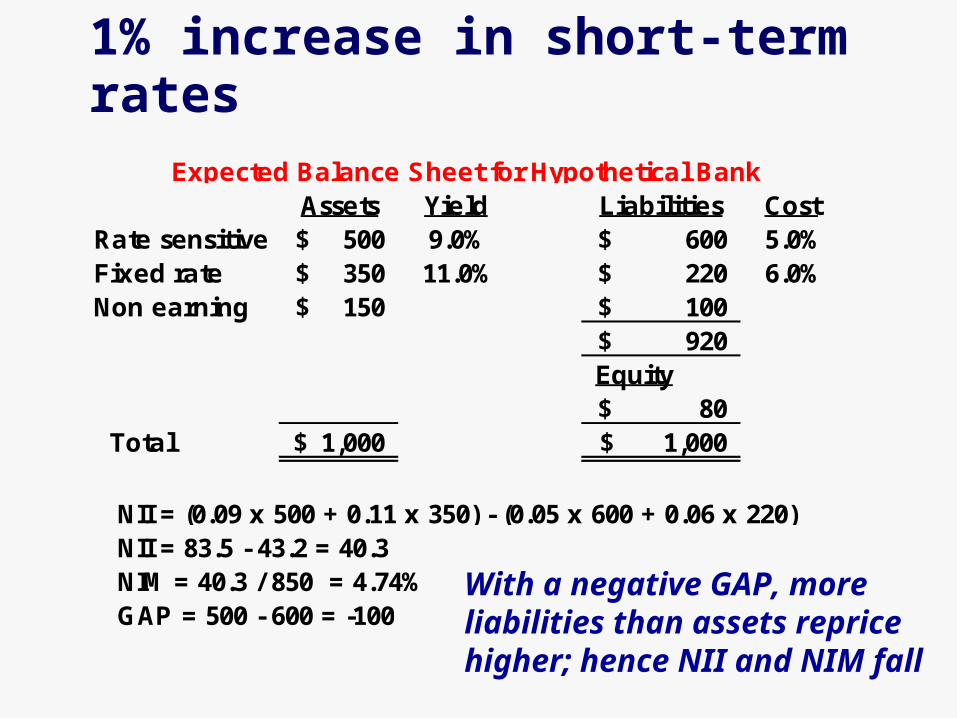
1% increase in short-term rates
Assets Yield Liabilities CostRate sensitive 500$ 9.0% 600$ 5.0%Fixed rate 350$ 11.0% 220$ 6.0%Non earning 150$ 100$
920$ Equity
80$ Total 1,000$ 1,000$
GAP = 500 - 600 = -100
NII = (0.09 x 500 + 0.11 x 350) - (0.05 x 600 + 0.06 x 220)
NIM = 40.3 / 850 = 4.74%NII = 83.5 - 43.2 = 40.3
Expected Balance Sheet for Hypothetical Bank
With a negative GAP, more liabilities than assets reprice higher; hence NII and NIM fall
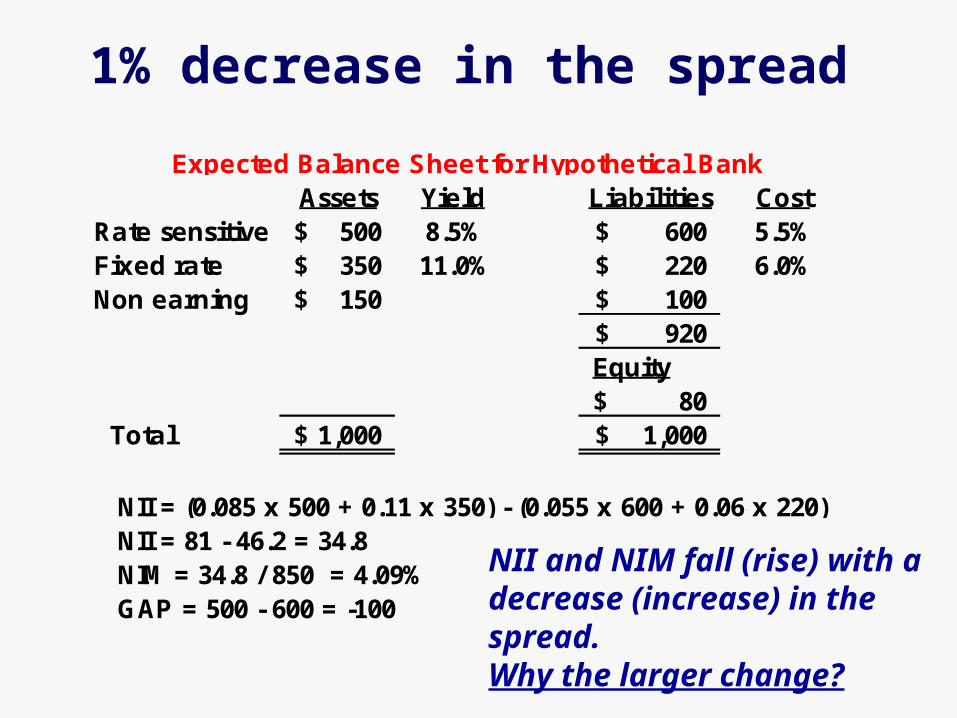
1% decrease in the spread
Assets Yield Liabilities CostRate sensitive 500$ 8.5% 600$ 5.5%Fixed rate 350$ 11.0% 220$ 6.0%Non earning 150$ 100$
920$ Equity
80$ Total 1,000$ 1,000$
GAP = 500 - 600 = -100
NII = (0.085 x 500 + 0.11 x 350) - (0.055 x 600 + 0.06 x 220)
NIM = 34.8 / 850 = 4.09%NII = 81 - 46.2 = 34.8
Expected Balance Sheet for Hypothetical Bank
NII and NIM fall (rise) with a decrease (increase) in the spread. Why the larger change?

Proportionate doubling in size
Assets Yield Liabilities CostRate sensitive 1,000$ 8.0% 1,200$ 4.0%Fixed rate 700$ 11.0% 440$ 6.0%Non earning 300$ 200$
1,840$ Equity
160$ Total 2,000$ 2,000$
GAP = 1000 - 1200 = -200
NII = (0.08 x 1000 + 0.11 x 700) - (0.04 x 1200 + 0.06 x 440)
NIM = 82.6 / 1700 = 4.86%NII = 157 - 74.4 = 82.6
Expected Balance Sheet for Hypothetical Bank
NII and GAP double, but NIM stays the same. What has happened to risk?
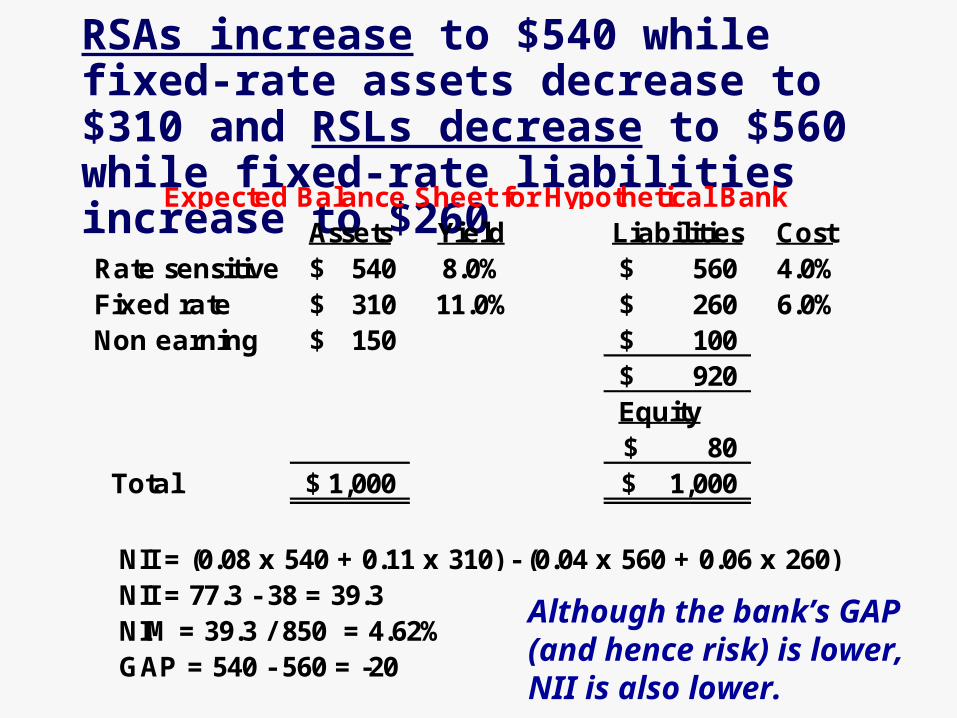
RSAs increase to $540 while fixed-rate assets decrease to $310 and RSLs decrease to $560 while fixed-rate liabilities increase to $260
Assets Yield Liabilities CostRate sensitive 540$ 8.0% 560$ 4.0%Fixed rate 310$ 11.0% 260$ 6.0%Non earning 150$ 100$
920$ Equity
80$ Total 1,000$ 1,000$
GAP = 540 - 560 = -20
NII = (0.08 x 540 + 0.11 x 310) - (0.04 x 560 + 0.06 x 260)
NIM = 39.3 / 850 = 4.62%NII = 77.3 - 38 = 39.3
Expected Balance Sheet for Hypothetical Bank
Although the bank’s GAP (and hence risk) is lower, NII is also lower.

Changes in Net Interest Income are directly proportional to the size of the GAP
If there is a parallel shift in the yield curve:
It is rare, however, when the yield curve shifts parallel If rates do not change by the same
amount and at the same time, then net interest income may change by more or less.
expexp i GAP ΔNII

Summary of GAP and the Change in NII
GAPChange in
Interest Income
Change in Interest Income
Change in Interest Expense
Change in Net Interest
IncomePositive Increase Increase > Increase IncreasePositive Decrease Decrease > Decrease Decrease
Negative Increase Increase < Increase DecreaseNegative Decrease Decrease < Decrease Increase
Zero Increase Increase = Increase NoneZero Decrease Decrease = Decrease None
GAP Summary

Rate, Volume, and Mix Analysis
Banks often publish a summary of how net interest income has changed over time. They separate changes over time to:
shifts in assets and liability composition and volume
changes associated with movements in interest rates.
The purpose is to assess what factors influence shifts in net interest income over time.
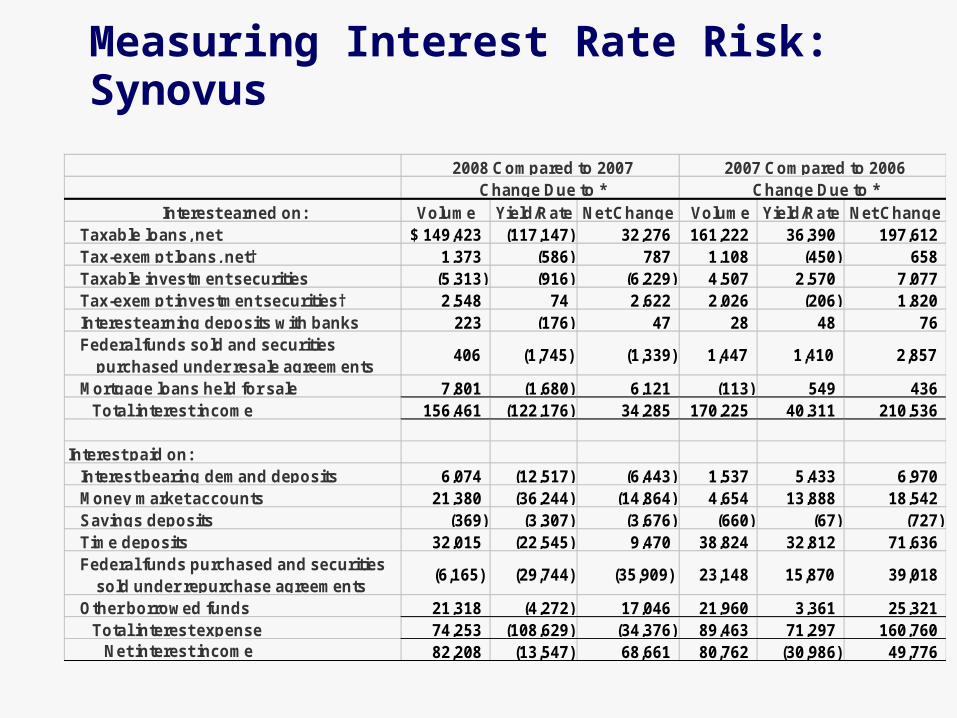
Measuring Interest Rate Risk: Synovus
Interest earned on: Volume Yield/Rate Net Change Volume Yield/Rate Net ChangeTaxable loans, net 149,423$ (117,147) 32,276 161,222 36,390 197,612 Tax-exempt loans, net† 1,373 (586) 787 1,108 (450) 658 Taxable investment securities (5,313) (916) (6,229) 4,507 2,570 7,077 Tax-exempt investment securities† 2,548 74 2,622 2,026 (206) 1,820 Interest earning deposits with banks 223 (176) 47 28 48 76 Federal funds sold and securities purchased under resale agreements
406 (1,745) (1,339) 1,447 1,410 2,857
Mortgage loans held for sale 7,801 (1,680) 6,121 (113) 549 436 Total interest income 156,461 (122,176) 34,285 170,225 40,311 210,536
Interest paid on: Interest bearing demand deposits 6,074 (12,517) (6,443) 1,537 5,433 6,970 Money market accounts 21,380 (36,244) (14,864) 4,654 13,888 18,542 Savings deposits (369) (3,307) (3,676) (660) (67) (727) Time deposits 32,015 (22,545) 9,470 38,824 32,812 71,636 Federal funds purchased and securities sold under repurchase agreements
(6,165) (29,744) (35,909) 23,148 15,870 39,018
Other borrowed funds 21,318 (4,272) 17,046 21,960 3,361 25,321 Total interest expense 74,253 (108,629) (34,376) 89,463 71,297 160,760
Net interest income 82,208 (13,547) 68,661 80,762 (30,986) 49,776
2008 Compared to 2007 2007 Compared to 2006 Change Due to * Change Due to *
Interest Rate-Sensitivity Reports Classifies a bank’s assets and liabilities into time intervals according to the minimum number of days until each instrument is expected to be repriced.
GAP values are reported a periodic and cumulative basis for each time interval. Periodic GAP
Is the Gap for each time bucket and measures the timing of potential income effects from interest rate changes
Cumulative GAP It is the sum of periodic GAP's and measures aggregate
interest rate risk over the entire period Cumulative GAP is important since it directly measures
a bank’s net interest sensitivity throughout the time interval.
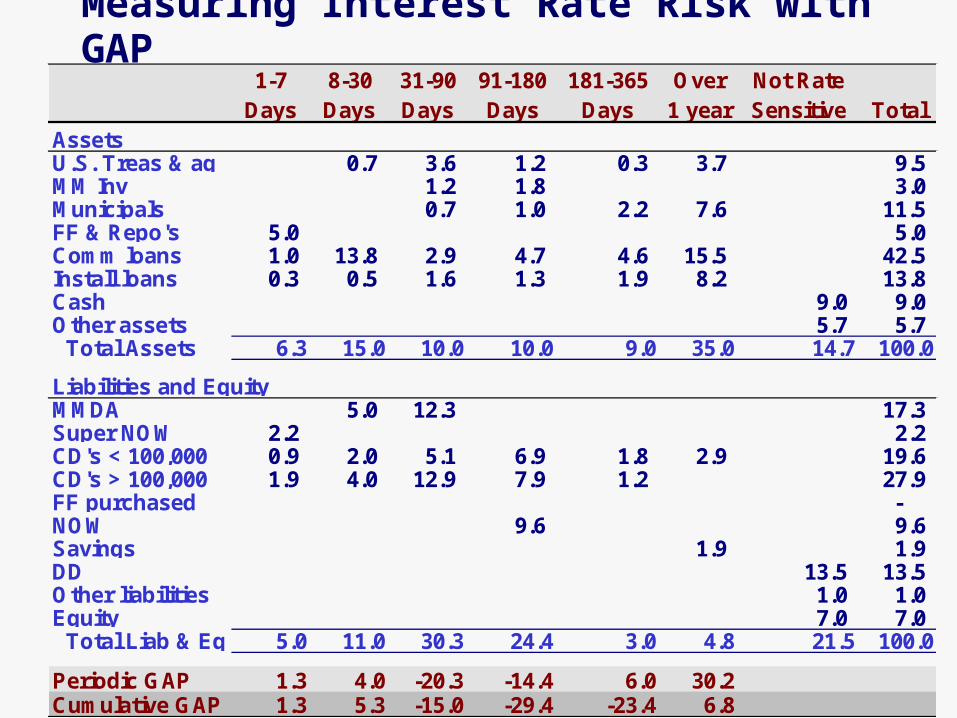
Measuring Interest Rate Risk with GAP1-7
Days8-30Days
31-90Days
91-180Days
181-365Days
Over1 year
Not RateSensitive Total
AssetsU.S. Treas & ag 0.7 3.6 1.2 0.3 3.7 9.5 MM Inv 1.2 1.8 3.0 Municipals 0.7 1.0 2.2 7.6 11.5 FF & Repo's 5.0 5.0 Comm loans 1.0 13.8 2.9 4.7 4.6 15.5 42.5 Install loans 0.3 0.5 1.6 1.3 1.9 8.2 13.8 Cash 9.0 9.0 Other assets 5.7 5.7 Total Assets 6.3 15.0 10.0 10.0 9.0 35.0 14.7 100.0
Liabilities and EquityMMDA 5.0 12.3 17.3 Super NOW 2.2 2.2 CD's < 100,000 0.9 2.0 5.1 6.9 1.8 2.9 19.6 CD's > 100,000 1.9 4.0 12.9 7.9 1.2 27.9 FF purchased - NOW 9.6 9.6 Savings 1.9 1.9 DD 13.5 13.5 Other liabilities 1.0 1.0 Equity 7.0 7.0 Total Liab & Eq. 5.0 11.0 30.3 24.4 3.0 4.8 21.5 100.0
Periodic GAP 1.3 4.0 -20.3 -14.4 6.0 30.2Cumulative GAP 1.3 5.3 -15.0 -29.4 -23.4 6.8
Advantages and Disadvantages of Static GAP Analysis
Advantages Easy to understand Works well with small changes in interest rates
Disadvantages Ex-post measurement errors Ignores the time value of money Ignores the cumulative impact of interest rate
changes Typically considers demand deposits to be
non-rate sensitive Ignores embedded options in the bank’s assets
and liabilities
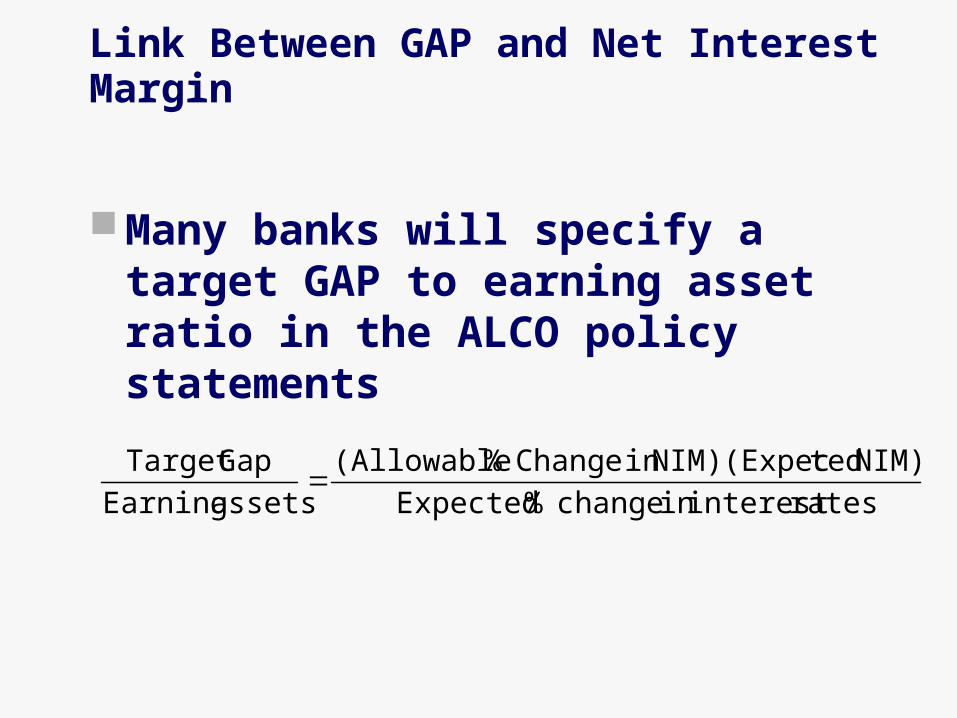
Link Between GAP and Net Interest Margin
Many banks will specify a target GAP to earning asset ratio in the ALCO policy statements
rates interest in change % Expected
NIM) tedNIM)(Expec in Change % (Allowable
assets Earning
Gap Target
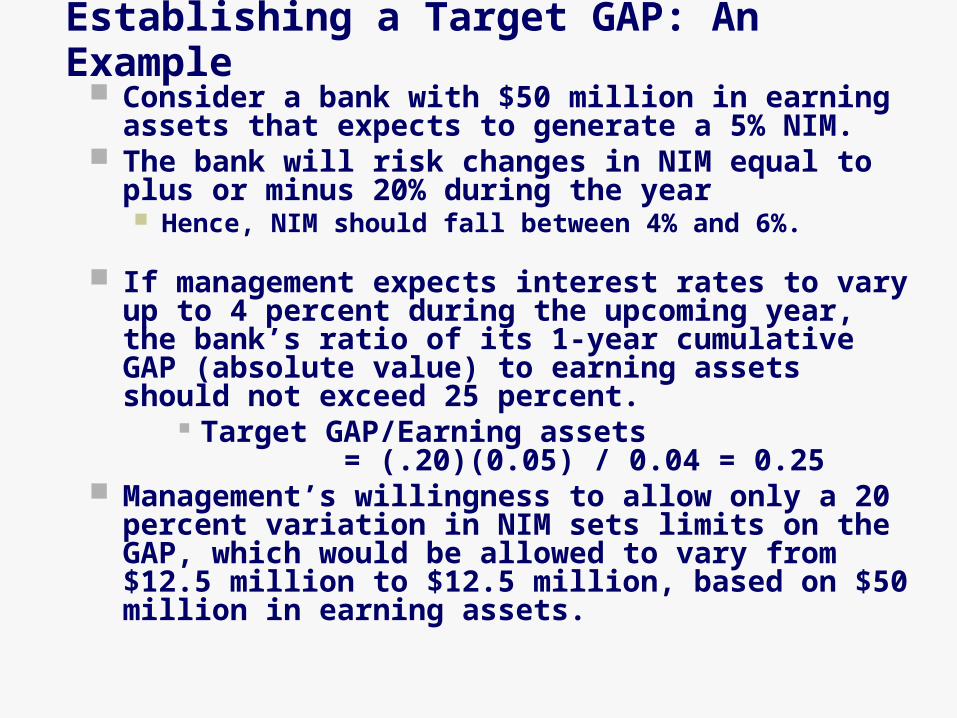
Establishing a Target GAP: An Example Consider a bank with $50 million in earning assets
that expects to generate a 5% NIM. The bank will risk changes in NIM equal to plus or
minus 20% during the year Hence, NIM should fall between 4% and 6%.
If management expects interest rates to vary up to 4 percent during the upcoming year, the bank’s ratio of its 1-year cumulative GAP (absolute value) to earning assets should not exceed 25 percent.
Target GAP/Earning assets = (.20)(0.05) / 0.04 = 0.25
Management’s willingness to allow only a 20 percent variation in NIM sets limits on the GAP, which would be allowed to vary from $12.5 million to $12.5 million, based on $50 million in earning assets.
Speculating on the GAP
Many bank managers attempt to adjust the interest rate risk exposure of a bank in anticipation of changes in interest rates.
This is speculative because it assumes that management can forecast rates better than the market.
Difficult to vary the GAP and win as this requires consistently accurate interest rate forecasts
A bank has limited flexibility in adjusting its GAP; e.g., loan and deposit terms
Earnings Sensitivity Analysis
Allows management to incorporate the impact of different spreads between asset yields and liability interest costs when rates change by different amounts.
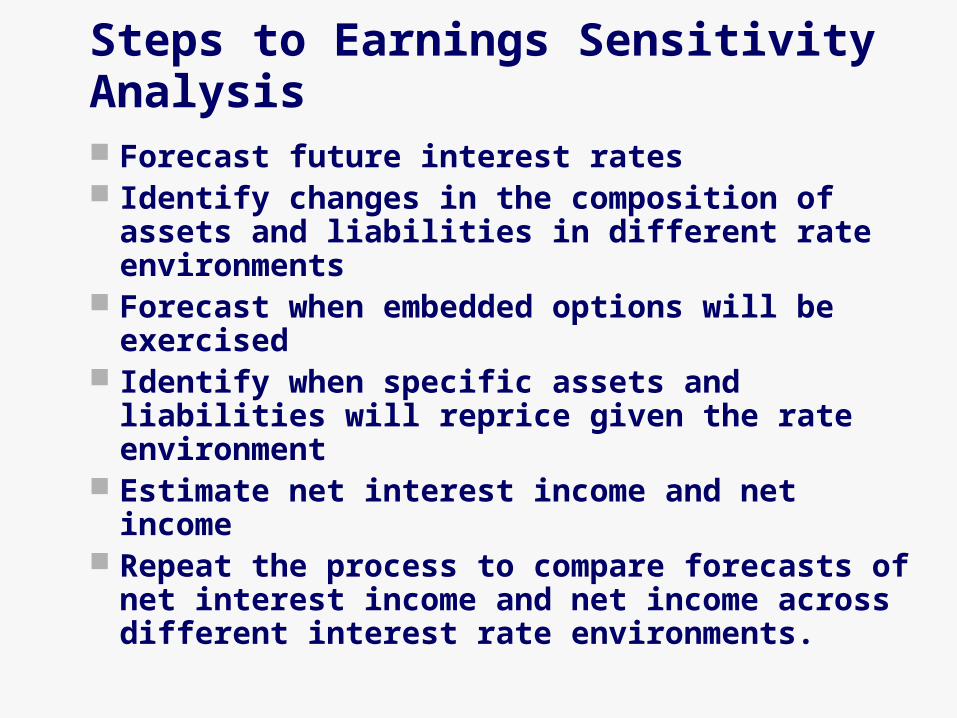
Steps to Earnings Sensitivity Analysis
Forecast future interest rates Identify changes in the composition of
assets and liabilities in different rate environments
Forecast when embedded options will be exercised
Identify when specific assets and liabilities will reprice given the rate environment
Estimate net interest income and net income Repeat the process to compare forecasts of
net interest income and net income across different interest rate environments.

Earnings Sensitivity Analysis and the Exercise of Embedded Options
Many bank assets and liabilities contain different types of options, both explicit and implicit: Option to refinance a loan Call option on a federal agency bond
the bank owns Depositors have the option to withdraw
funds prior to maturity Cap (maximum) rate on a floating-rate
loan
Earnings Sensitivity Analysis Recognizes that Different Interest Rates Change by Different Amounts at Different Times It is well recognized that banks are
quick to increase base loan rates but are slow to lower base loan rates when rates fall.
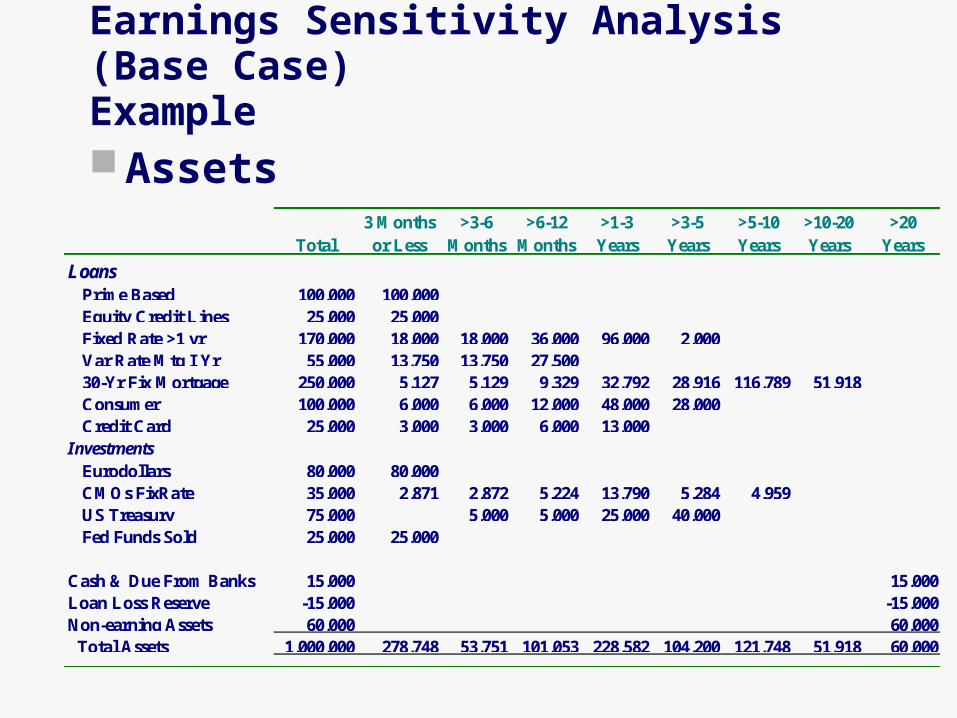
Earnings Sensitivity Analysis (Base Case)Example
Assets3 Months >3-6 >6-12 >1-3 >3-5 >5-10 >10-20 >20
Total or Less Months Months Years Years Years Years Years
LoansPrime Based 100,000 100,000Equity Credit Lines 25,000 25,000Fixed Rate >1 yr 170,000 18,000 18,000 36,000 96,000 2,000Var Rate Mtg I Yr 55,000 13,750 13,750 27,50030-Yr Fix Mortgage 250,000 5,127 5,129 9,329 32,792 28,916 116,789 51,918Consumer 100,000 6,000 6,000 12,000 48,000 28,000Credit Card 25,000 3,000 3,000 6,000 13,000
InvestmentsEurodollars 80,000 80,000CMOs FixRate 35,000 2,871 2,872 5,224 13,790 5,284 4,959US Treasury 75,000 5,000 5,000 25,000 40,000Fed Funds Sold 25,000 25,000
Cash & Due From Banks 15,000 15,000Loan Loss Reserve -15,000 -15,000Non-earning Assets 60,000 60,000 Total Assets 1,000,000 278,748 53,751 101,053 228,582 104,200 121,748 51,918 60,000
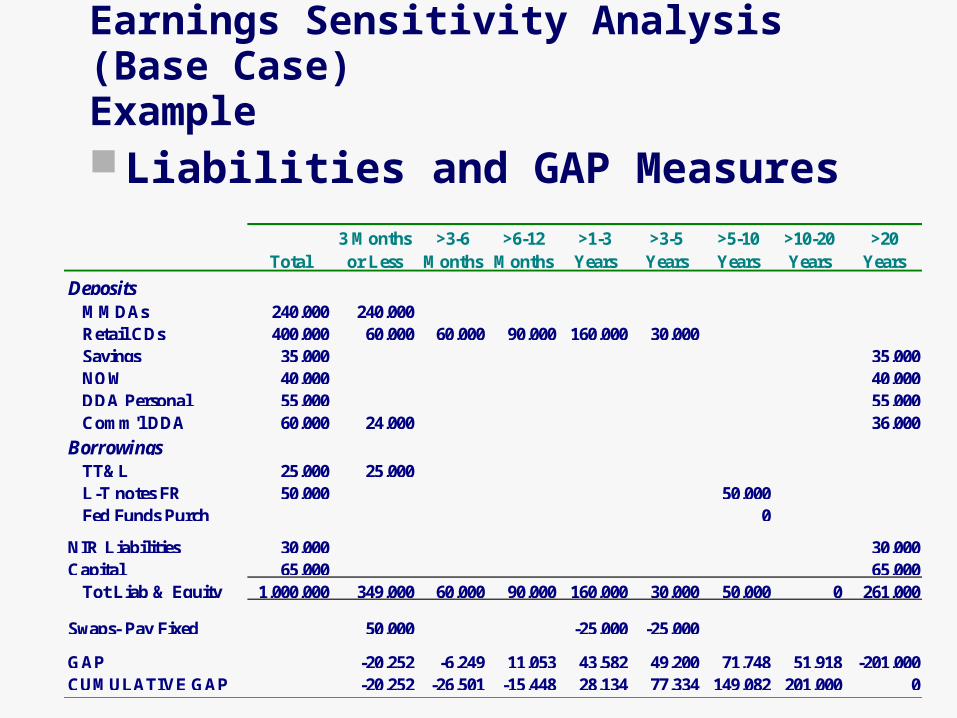
Earnings Sensitivity Analysis (Base Case)Example
Liabilities and GAP Measures3 Months >3-6 >6-12 >1-3 >3-5 >5-10 >10-20 >20
Total or Less Months Months Years Years Years Years Years
DepositsMMDAs 240,000 240,000Retail CDs 400,000 60,000 60,000 90,000 160,000 30,000Savings 35,000 35,000NOW 40,000 40,000DDA Personal 55,000 55,000Comm'l DDA 60,000 24,000 36,000
BorrowingsTT&L 25,000 25,000L-T notes FR 50,000 50,000Fed Funds Purch 0
NIR Liabilities 30,000 30,000Capital 65,000 65,000 Tot Liab & Equity 1,000,000 349,000 60,000 90,000 160,000 30,000 50,000 0 261,000
Swaps- Pay Fixed 50,000 -25,000 -25,000
GAP -20,252 -6,249 11,053 43,582 49,200 71,748 51,918 -201,000CUMULATIVE GAP -20,252 -26,501 -15,448 28,134 77,334 149,082 201,000 0

Interest Rate Forecasts
Most LikelyForecast andRate RampsDec. 20056
5
4
3
2
011 1
20063 5 7 9 11 1
20073 5 7 9 12
Fed Funds Forecast vs. Implied Forward Rates
Time (month)
4.50
4.25
4.00
3.75
3.50
3.25
3.001 3 5 7 9 11 13
Market Implied Rates
Most LikelyForecast
15 17 19 21 23
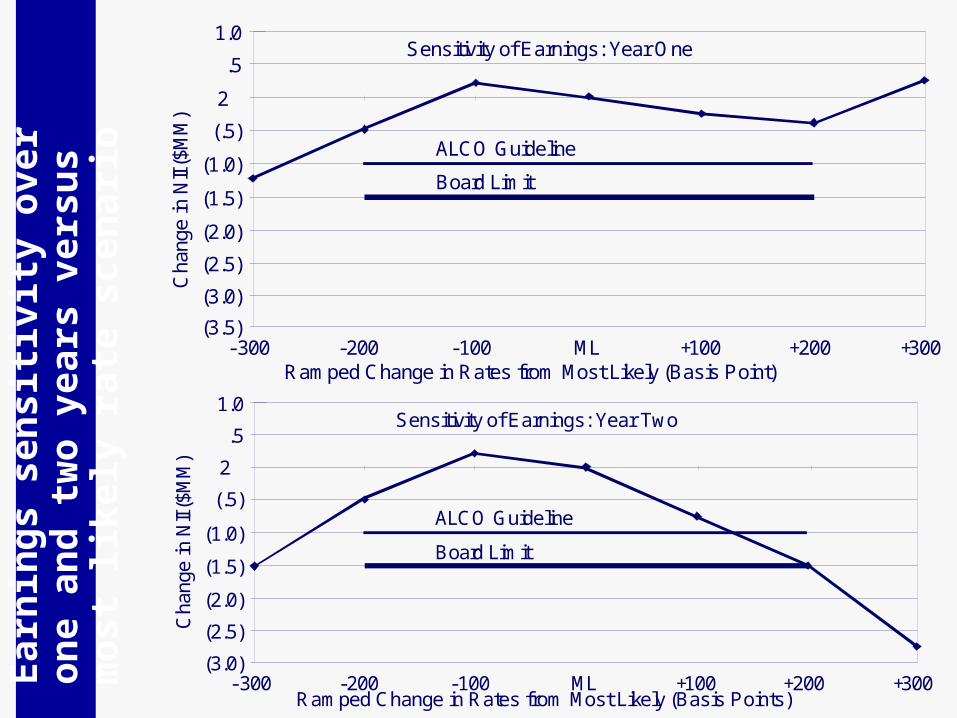
2
(.5)
1.0
.5
ALCO Guideline
Board Limit(1.0)
(1.5)
Cha
nge
inN
II($
MM
)
(2.0)
(2.5)
(3.0)- 300 -200 -100 +100 +200 +300ML
Ramped Change in Rates from Most Likely (Basis Points)
Sensitivity of Earnings: Year Two
1.0
.5
2
ALCO Guideline
Board Limit(1.0)
(.5)
(1.5)C
hang
ein
NII
($M
M)
(2.0)
(2.5)
(3.0)
(3.5)-300 -200 -100 +100 +200 +300ML
Ramped Change in Rates from Most Likely (Basis Point)
Sensitivity of Earnings: Year OneEarn
ing
s s
en
sit
ivit
y o
ver
on
e
an
d t
wo y
ears
vers
us m
ost
likely
rate
scen
ari
o

Managing the GAP and Earnings Sensitivity Risk
Steps to reduce risk Calculate periodic GAPs over short
time intervals. Fund repriceable assets with matching
repriceable liabilities so that periodic GAPs approach zero.
Fund long-term assets with matching noninterest-bearing liabilities.
Use off-balance sheet transactions to hedge.
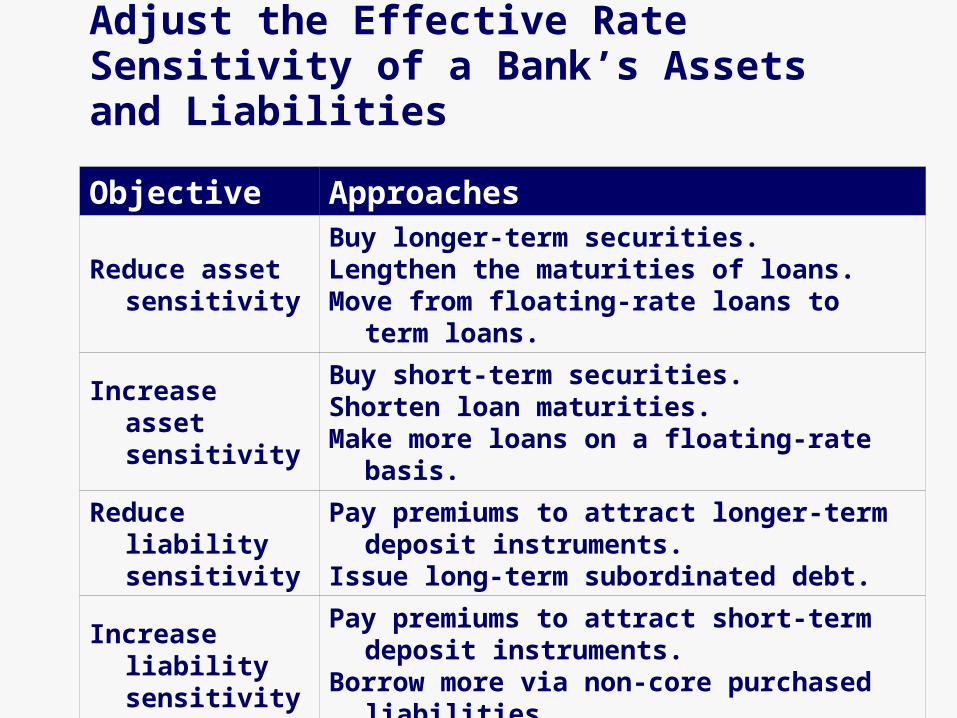
Adjust the Effective Rate Sensitivity of a Bank’s Assets and Liabilities
Objective Approaches
Reduce asset sensitivity
Buy longer-term securities.Lengthen the maturities of loans.Move from floating-rate loans to term loans.
Increase asset sensitivity
Buy short-term securities.Shorten loan maturities.Make more loans on a floating-rate basis.
Reduce liability sensitivity
Pay premiums to attract longer-term deposit instruments.
Issue long-term subordinated debt.
Increase liability sensitivity
Pay premiums to attract short-term deposit instruments.
Borrow more via non-core purchased liabilities.