managing naturally occuring radioactive material (norm) in mining … · 2018-05-28 · reference...
TRANSCRIPT

Managing naturally occurring radioactive material (NORM) inmining and mineral processing � guideline
NORM�7
BOSWELL � assessment and reporting database

ReferenceThe recommended reference for this publication is:
Department of Mines and Petroleum, 2010. Managing naturally occurring radioactive material (NORM) in
mining and mineral processing � guideline. NORM�7 BOSWELL � assessment and reporting database:
Resources Safety, Department of Mines and Petroleum, Western Australia, 107pp. <www.dmp.wa.gov.au>
Published February 2010

Guideline NORM�7 BOSWELL � assessment and reporting database
Contents
List of Figures v
List of Tables vi
1. General information 1
1.1. Purpose . . . . . . . . . . . . . . . . . . . . . . . . . . . . . . . . . . . . . . . . . . . 11.2. Scope . . . . . . . . . . . . . . . . . . . . . . . . . . . . . . . . . . . . . . . . . . . . 11.3. Relationship to other NORM guidelines . . . . . . . . . . . . . . . . . . . . . . . . . 1
2. Guidance 2
2.1. Introduction . . . . . . . . . . . . . . . . . . . . . . . . . . . . . . . . . . . . . . . . . 22.2. Conceptual overview of the Boswell system . . . . . . . . . . . . . . . . . . . . . . . 32.3. What is a database? . . . . . . . . . . . . . . . . . . . . . . . . . . . . . . . . . . . . 32.4. History . . . . . . . . . . . . . . . . . . . . . . . . . . . . . . . . . . . . . . . . . . . 32.5. Computer system . . . . . . . . . . . . . . . . . . . . . . . . . . . . . . . . . . . . . . 32.6. Microsoft Access . . . . . . . . . . . . . . . . . . . . . . . . . . . . . . . . . . . . . . 52.7. Data storage . . . . . . . . . . . . . . . . . . . . . . . . . . . . . . . . . . . . . . . . 52.8. Boswell user licence . . . . . . . . . . . . . . . . . . . . . . . . . . . . . . . . . . . . . 62.9. Boswell �les . . . . . . . . . . . . . . . . . . . . . . . . . . . . . . . . . . . . . . . . . 62.10. Boswell installation . . . . . . . . . . . . . . . . . . . . . . . . . . . . . . . . . . . . . 62.11. Screen layout . . . . . . . . . . . . . . . . . . . . . . . . . . . . . . . . . . . . . . . . 7
3. Data storage 8
3.1. Rules for entering data . . . . . . . . . . . . . . . . . . . . . . . . . . . . . . . . . . . 83.2. Order for data entry . . . . . . . . . . . . . . . . . . . . . . . . . . . . . . . . . . . . 83.3. Data entry forms . . . . . . . . . . . . . . . . . . . . . . . . . . . . . . . . . . . . . . 8
3.3.1. Entity name . . . . . . . . . . . . . . . . . . . . . . . . . . . . . . . . . . . . . 83.3.2. Conversion factor . . . . . . . . . . . . . . . . . . . . . . . . . . . . . . . . . . 103.3.3. Work category . . . . . . . . . . . . . . . . . . . . . . . . . . . . . . . . . . . 103.3.4. Radiation counter . . . . . . . . . . . . . . . . . . . . . . . . . . . . . . . . . 103.3.5. Air sampler holder . . . . . . . . . . . . . . . . . . . . . . . . . . . . . . . . . 103.3.6. Air sampler pump . . . . . . . . . . . . . . . . . . . . . . . . . . . . . . . . . 103.3.7. Area/location code . . . . . . . . . . . . . . . . . . . . . . . . . . . . . . . . . 12
3.3.7.1. Area code . . . . . . . . . . . . . . . . . . . . . . . . . . . . . . . . . 123.3.7.2. Location code . . . . . . . . . . . . . . . . . . . . . . . . . . . . . . 12
3.3.8. Respiratory protection . . . . . . . . . . . . . . . . . . . . . . . . . . . . . . . 123.3.9. Radiation calibration . . . . . . . . . . . . . . . . . . . . . . . . . . . . . . . . 123.3.10. Employees . . . . . . . . . . . . . . . . . . . . . . . . . . . . . . . . . . . . . . 15
3.3.10.1. MineHealth . . . . . . . . . . . . . . . . . . . . . . . . . . . . . . . . 153.3.11. Previous experience . . . . . . . . . . . . . . . . . . . . . . . . . . . . . . . . 163.3.12. Employee history . . . . . . . . . . . . . . . . . . . . . . . . . . . . . . . . . . 163.3.13. Badge data . . . . . . . . . . . . . . . . . . . . . . . . . . . . . . . . . . . . . 163.3.14. Employee dust . . . . . . . . . . . . . . . . . . . . . . . . . . . . . . . . . . . 193.3.15. Area dust . . . . . . . . . . . . . . . . . . . . . . . . . . . . . . . . . . . . . . 19
Resources Safety, Department of Mines and Petroleum iii

Guideline NORM�7 BOSWELL � assessment and reporting database
4. Data reporting 25
4.1. Quality assurance reports . . . . . . . . . . . . . . . . . . . . . . . . . . . . . . . . . 264.2. Personal inspirable dust reports . . . . . . . . . . . . . . . . . . . . . . . . . . . . . . 294.3. Work area dust reports . . . . . . . . . . . . . . . . . . . . . . . . . . . . . . . . . . . 454.4. Monitoring badge reports . . . . . . . . . . . . . . . . . . . . . . . . . . . . . . . . . 614.5. E�ective dose equivalent reports . . . . . . . . . . . . . . . . . . . . . . . . . . . . . 674.6. Employee work history reports . . . . . . . . . . . . . . . . . . . . . . . . . . . . . . 784.7. Individual employee dose reports . . . . . . . . . . . . . . . . . . . . . . . . . . . . . 84
A. Appendix � Annual Occupational Radiation Report 88
B. Appendix � User Instructions 89
B.1. Quick start . . . . . . . . . . . . . . . . . . . . . . . . . . . . . . . . . . . . . . . . . 89B.2. Menus . . . . . . . . . . . . . . . . . . . . . . . . . . . . . . . . . . . . . . . . . . . . 89B.3. Toolbars . . . . . . . . . . . . . . . . . . . . . . . . . . . . . . . . . . . . . . . . . . . 90
B.3.1. Main Screen . . . . . . . . . . . . . . . . . . . . . . . . . . . . . . . . . . . . . 90B.3.2. Data Entry Screens . . . . . . . . . . . . . . . . . . . . . . . . . . . . . . . . . 91B.3.3. Report Screen . . . . . . . . . . . . . . . . . . . . . . . . . . . . . . . . . . . . 93
B.4. Useful Shortcut Keys (All versions of Access) . . . . . . . . . . . . . . . . . . . . . . 94B.4.1. Fields . . . . . . . . . . . . . . . . . . . . . . . . . . . . . . . . . . . . . . . . 94B.4.2. Help . . . . . . . . . . . . . . . . . . . . . . . . . . . . . . . . . . . . . . . . . 94B.4.3. Window Operations . . . . . . . . . . . . . . . . . . . . . . . . . . . . . . . . 94B.4.4. Miscellaneous . . . . . . . . . . . . . . . . . . . . . . . . . . . . . . . . . . . . 95B.4.5. Records . . . . . . . . . . . . . . . . . . . . . . . . . . . . . . . . . . . . . . . 95B.4.6. Exploding Fields . . . . . . . . . . . . . . . . . . . . . . . . . . . . . . . . . . 95
B.5. Tip of the Day . . . . . . . . . . . . . . . . . . . . . . . . . . . . . . . . . . . . . . . 95B.6. Microsoft Access . . . . . . . . . . . . . . . . . . . . . . . . . . . . . . . . . . . . . . 96
B.6.1. Refreshing Links to boswellData.mdb . . . . . . . . . . . . . . . . . . . . . . . 96B.6.2. Compacting the Database . . . . . . . . . . . . . . . . . . . . . . . . . . . . . 97B.6.3. Backup Facility . . . . . . . . . . . . . . . . . . . . . . . . . . . . . . . . . . . 97B.6.4. Known issues . . . . . . . . . . . . . . . . . . . . . . . . . . . . . . . . . . . . 98
B.6.4.1. Windows time format . . . . . . . . . . . . . . . . . . . . . . . . . . 98
C. Appendix � DMP File Transfer Facility 100
C.1. How to use download.doir.wa.gov.au . . . . . . . . . . . . . . . . . . . . . . . . . . . 100C.1.1. Using a web browser outside the department . . . . . . . . . . . . . . . . . . 100
C.1.1.1. Downloading Files . . . . . . . . . . . . . . . . . . . . . . . . . . . . 101C.1.1.2. Uploading Files . . . . . . . . . . . . . . . . . . . . . . . . . . . . . . 101
C.1.2. Limits and Restrictions . . . . . . . . . . . . . . . . . . . . . . . . . . . . . . 102C.2. Data Con�dentiality . . . . . . . . . . . . . . . . . . . . . . . . . . . . . . . . . . . . 102C.3. How to setup a transfer facility between two users . . . . . . . . . . . . . . . . . . . . 103C.4. How to setup a transfer facility between groups of users . . . . . . . . . . . . . . . . 103C.5. Application Programming Interfaces . . . . . . . . . . . . . . . . . . . . . . . . . . . 104
C.5.1. Email Noti�cation facility . . . . . . . . . . . . . . . . . . . . . . . . . . . . . 104
Bibliography 106
Index 107
iv Managing naturally occurring radioactive material (NORM) in mining and mineral processing

Guideline NORM�7 BOSWELL � assessment and reporting database
List of Figures
1.1. Relationship to other NORM guidelines . . . . . . . . . . . . . . . . . . . . . . . . . 1
2.1. The Boswell System . . . . . . . . . . . . . . . . . . . . . . . . . . . . . . . . . . . . 42.2. Boswell Screen Layout . . . . . . . . . . . . . . . . . . . . . . . . . . . . . . . . . . . 7
3.1. MINEHEALTH web site � surveillance number search . . . . . . . . . . . . . . . . . 15
4.1. Boswell Reports Menu . . . . . . . . . . . . . . . . . . . . . . . . . . . . . . . . . . . 254.2. Report 01. QA Report � Employee Monitoring . . . . . . . . . . . . . . . . . . . . . 274.3. Report 01. QA Report � report showing badges missing Work History . . . . . . . . 284.4. Report 02. QA Report � Work Category Monitoring . . . . . . . . . . . . . . . . . . 304.5. Report 02. QA Report � report showing dust samples missing Work History . . . . . 314.6. Report 03. Personal Dust � rad/grav � by employee name . . . . . . . . . . . . . . 334.7. Report 05. Personal Dust � rad/grav � by work category . . . . . . . . . . . . . . . 354.8. Report 06. Personal Dust � rad/grav � by month & work category . . . . . . . . . . 384.9. Report 07. Personal Dust � rad/grav � 5 years & work category . . . . . . . . . . . 404.10. Report 09. Personal Dust � work category frequency histograms . . . . . . . . . . . . 444.11. Report 10. Personal Dust � work category (log)normal probability plots . . . . . . . 464.12. Report 11. Area Dust � rad/grav � by area, page 1 . . . . . . . . . . . . . . . . . . 474.13. Report 11. Area Dust � rad/grav � by area, page 2 . . . . . . . . . . . . . . . . . . 484.14. Report 11. Area Dust � rad/grav � by area, page 3 . . . . . . . . . . . . . . . . . . 494.15. Report 12. Area Dust � rad/grav � by month & area . . . . . . . . . . . . . . . . . 514.16. Report 13. Area Dust � rad/grav � areas over 5 years . . . . . . . . . . . . . . . . . 544.17. Report 14. Area Dust � rad/grav � statistics . . . . . . . . . . . . . . . . . . . . . . 564.18. Report 15. Area Dust � area frequency histograms . . . . . . . . . . . . . . . . . . . 574.19. Report 16. Area Dust � area (log)normal probability plots . . . . . . . . . . . . . . . 604.20. Report 17. External Exposure � by employee name . . . . . . . . . . . . . . . . . . . 624.21. Report 19. External Exposure � by work category . . . . . . . . . . . . . . . . . . . . 644.22. Report 20. External Exposure � work category over 5 years . . . . . . . . . . . . . . 664.23. Report 21. External Exposure � statistics . . . . . . . . . . . . . . . . . . . . . . . . 684.24. Report 22. EDE � by employee name . . . . . . . . . . . . . . . . . . . . . . . . . . . 694.25. Report 24. EDE � by work category . . . . . . . . . . . . . . . . . . . . . . . . . . . 724.26. Report 25. EDE � statistics � by personnel dose . . . . . . . . . . . . . . . . . . . . 754.27. Report 26. EDE � work category dose prediction summary . . . . . . . . . . . . . . . 764.28. Report 26. EDE � work category dose prediction summary . . . . . . . . . . . . . . . 774.29. Report 27. EDE � identify potential designated employee . . . . . . . . . . . . . . . 794.30. Report 28. EDE � identify potential designated employee . . . . . . . . . . . . . . . 804.31. Report 29. Work History � by employee name . . . . . . . . . . . . . . . . . . . . . . 814.32. Report 31. Work History � by work category . . . . . . . . . . . . . . . . . . . . . . 834.33. Report 32. Ad Hoc Employee Dose � by date range . . . . . . . . . . . . . . . . . . . 854.34. Report 33. Ad Hoc Employee Dose � over each year with company . . . . . . . . . . 864.35. Report 34. Employee Monitoring and Exposure Report . . . . . . . . . . . . . . . . . 87
Resources Safety, Department of Mines and Petroleum v

Guideline NORM�7 BOSWELL � assessment and reporting database
List of Tables
2.1. What is a database? . . . . . . . . . . . . . . . . . . . . . . . . . . . . . . . . . . . . 3
3.1. Boswell Forms . . . . . . . . . . . . . . . . . . . . . . . . . . . . . . . . . . . . . . . . 93.2. Entity Name �elds . . . . . . . . . . . . . . . . . . . . . . . . . . . . . . . . . . . . . 93.3. Conversion Factors . . . . . . . . . . . . . . . . . . . . . . . . . . . . . . . . . . . . . 113.4. Work Categories . . . . . . . . . . . . . . . . . . . . . . . . . . . . . . . . . . . . . . 113.5. Radiation Counters . . . . . . . . . . . . . . . . . . . . . . . . . . . . . . . . . . . . . 113.6. Air Sample Holders . . . . . . . . . . . . . . . . . . . . . . . . . . . . . . . . . . . . . 133.7. Air Sample Pumps . . . . . . . . . . . . . . . . . . . . . . . . . . . . . . . . . . . . . 133.8. Area/location Codes . . . . . . . . . . . . . . . . . . . . . . . . . . . . . . . . . . . . 133.9. Area Codes . . . . . . . . . . . . . . . . . . . . . . . . . . . . . . . . . . . . . . . . . 133.10. Location Codes . . . . . . . . . . . . . . . . . . . . . . . . . . . . . . . . . . . . . . . 143.11. Respiratory Protection . . . . . . . . . . . . . . . . . . . . . . . . . . . . . . . . . . . 143.12. Radiation Calibration . . . . . . . . . . . . . . . . . . . . . . . . . . . . . . . . . . . 143.13. Employees . . . . . . . . . . . . . . . . . . . . . . . . . . . . . . . . . . . . . . . . . . 173.14. Previous Radiation History . . . . . . . . . . . . . . . . . . . . . . . . . . . . . . . . 173.15. Employee Work History . . . . . . . . . . . . . . . . . . . . . . . . . . . . . . . . . . 183.16. Badge Data . . . . . . . . . . . . . . . . . . . . . . . . . . . . . . . . . . . . . . . . . 183.17. Employee Dust . . . . . . . . . . . . . . . . . . . . . . . . . . . . . . . . . . . . . . . 203.19. Employee Dust continued . . . . . . . . . . . . . . . . . . . . . . . . . . . . . . . . . 213.20. Employee Dust continued . . . . . . . . . . . . . . . . . . . . . . . . . . . . . . . . . 223.21. Area Dust . . . . . . . . . . . . . . . . . . . . . . . . . . . . . . . . . . . . . . . . . . 233.22. Area Dust continued . . . . . . . . . . . . . . . . . . . . . . . . . . . . . . . . . . . . 24
4.1. Report 01. QA Report � Employee Monitoring . . . . . . . . . . . . . . . . . . . . . 264.2. Report 02. QA Report � Work Category Monitoring . . . . . . . . . . . . . . . . . . 294.3. Report 03. Personal Dust � rad/grav � by employee name . . . . . . . . . . . . . . 324.4. Report 04. Personal Dust � rad/grav � by employee number . . . . . . . . . . . . . 344.5. Report 05. Personal Dust � rad/grav � by work category . . . . . . . . . . . . . . . 364.6. Report 06. Personal Dust � rad/grav � by month & work category . . . . . . . . . . 394.7. Report 07. Personal Dust � rad/grav � 5 years & work category . . . . . . . . . . . 414.8. Report 08. Personal Dust � rad/grav � statistics . . . . . . . . . . . . . . . . . . . . 424.9. Report 09. Personal Dust � work category frequency histograms . . . . . . . . . . . . 434.10. Report 10. Personal Dust � work category (log)normal probability plots . . . . . . . 454.11. Report 11. Area Dust � rad/grav � by area . . . . . . . . . . . . . . . . . . . . . . . 504.12. Report 12. Area Dust � rad/grav � by month & area . . . . . . . . . . . . . . . . . 524.13. Report 13. Area Dust � rad/grav � areas over 5 years . . . . . . . . . . . . . . . . . 534.14. Report 14. Area Dust � rad/grav � statistics . . . . . . . . . . . . . . . . . . . . . . 554.15. Report 15. Area Dust � area frequency histograms . . . . . . . . . . . . . . . . . . . 584.16. Report 16. Area Dust � area (log)normal probability plots . . . . . . . . . . . . . . . 594.17. Report 17. External Exposure � by employee name . . . . . . . . . . . . . . . . . . . 614.18. Report 18. External Exposure � by employee number . . . . . . . . . . . . . . . . . . 634.19. Report 19. External Exposure � by work category . . . . . . . . . . . . . . . . . . . . 654.20. Report 20. External Exposure � work category over 5 years . . . . . . . . . . . . . . 65
vi Managing naturally occurring radioactive material (NORM) in mining and mineral processing

Guideline NORM�7 BOSWELL � assessment and reporting database
4.21. Report 21. External Exposure � statistics . . . . . . . . . . . . . . . . . . . . . . . . 674.22. Report 22. EDE � by employee name . . . . . . . . . . . . . . . . . . . . . . . . . . . 704.23. Report 23. EDE � by employee number . . . . . . . . . . . . . . . . . . . . . . . . . 714.24. Report 24. EDE � by work category . . . . . . . . . . . . . . . . . . . . . . . . . . . 734.25. Report 25. EDE � statistics � by personnel dose . . . . . . . . . . . . . . . . . . . . 744.26. Report 29. Work History � by employee name . . . . . . . . . . . . . . . . . . . . . . 824.27. Report 30. Work History � by employee number . . . . . . . . . . . . . . . . . . . . 82
Resources Safety, Department of Mines and Petroleum vii

Guideline NORM�7 BOSWELL � assessment and reporting database
viii Managing naturally occurring radioactive material (NORM) in mining and mineral processing

Guideline NORM�7 BOSWELL � assessment and reporting database
1. General information
1.1. Purpose
To provide guidance in the use of the Boswell � Microsoft Access assessment and reporting database.
1.2. Scope
This guideline applies to all mining and mineral processing operations in Western Australia that useor handle naturally occurring radioactive material (NORM) and come within the scope of Part 16 ofthe Mines Safety and Inspection Regulations 1995 [1].
1.3. Relationship to other NORM guidelines
The �owchart in Figure 1.1 shows the arrangement of the Radiation Safety Guidelines.
Figure 1.1.: Relationship to other NORM guidelines
S y s t e m o f r a d i a t i o n p r o t e c t i o n i n m i n e s ( N O R M - 1 )
M o n i t o r i n gN O R M
( N O R M - 3 )
C o n t r o l l i n gN O R M
( N O R M - 4 )
D u s t c o n t r o ls t r a t e g i e s ( N O R M - 4 . 1 )
M a n a g e m e n t o f r a d i o a c t i v e w a s t e( N O R M - 4 . 2 )
T r a n s p o r t o f N O R M( N O R M - 4 . 3 )
A s s e s s i n gd o s e s
( N O R M - 5 )
D o s e a s s e s s m e n t
R e p o r t i n g a n dn o t i f y i n g ( N O R M - 6 )
R e p o r t i n g r e q u i r e m e n t s
P r e - o p e r a t i o n a lm o n i t o r i n g ( N O R M - 3 . 1 )
O p e r a t i o n a l m o n i t o r i n g ( N O R M - 3 . 2 )
A i r m o n i t o r i n g s t r a t e g i e s ( N O R M - 3 . 3 )
A i r b o r n e r a d i o a c t i v i t y s a m p l i n g ( N O R M - 3 . 4 )
M e a s u r e m e n t o f pa r t i c l e s i ze ( N O R M - 3 . 5 )
P r e p a r a t i o n o f a r a d i a t i o n m a n a g e m e n t p l a n ( N O R M - 2 )
E x p l o r a t i o n ( N O R M - 2 . 1 ) M i n i n g a n d p r o c e s s i n g ( N O R M - 2 . 2 )
B O S W E L L A s s e s s m e n t a n d r e p o r t i n g d a t a b a s e
( N O R M - 7 )
E l e c t r o n i c d a t a m a n a g e m e n t s y s t e m
Resources Safety, Department of Mines and Petroleum 1
Guideline NORM�7 BOSWELL � assessment and reporting database
2. Guidance
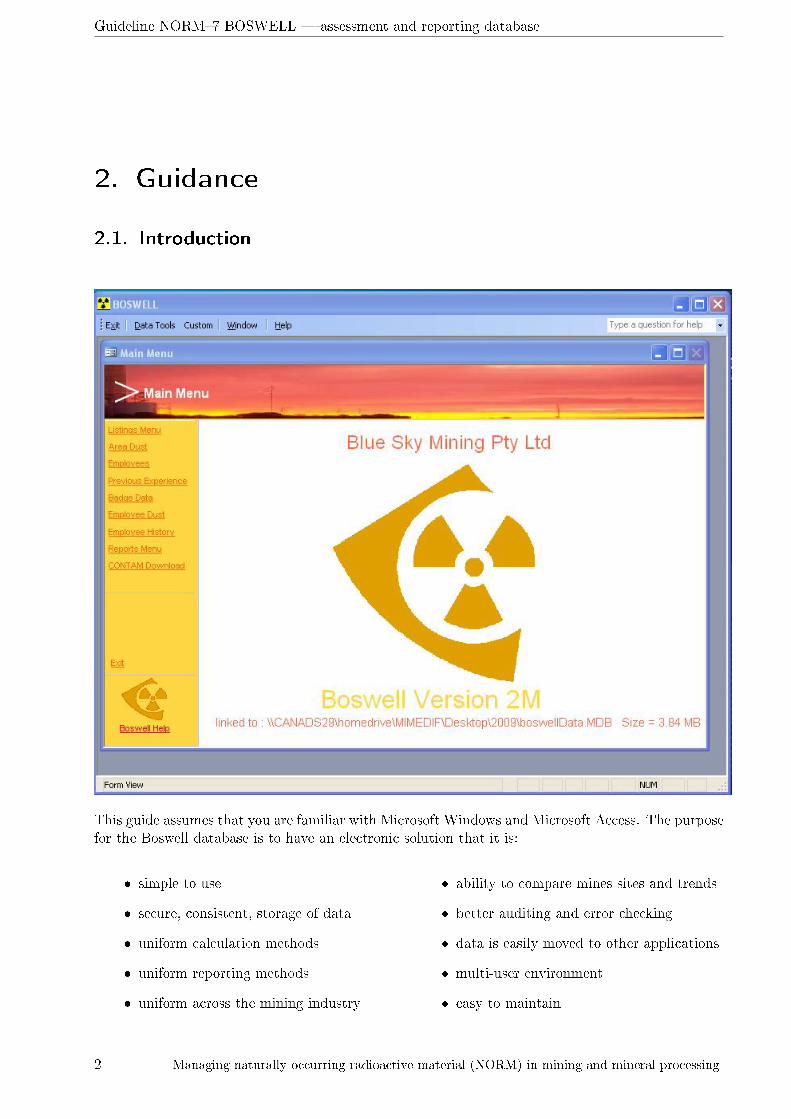
2.1. Introduction
This guide assumes that you are familiar with Microsoft Windows and Microsoft Access. The purposefor the Boswell database is to have an electronic solution that it is:
� simple to use
� secure, consistent, storage of data
� uniform calculation methods
� uniform reporting methods
� uniform across the mining industry
� ability to compare mines sites and trends
� better auditing and error checking
� data is easily moved to other applications
� multi-user environment
� easy to maintain
2 Managing naturally occurring radioactive material (NORM) in mining and mineral processing
Guideline NORM�7 BOSWELL � assessment and reporting database
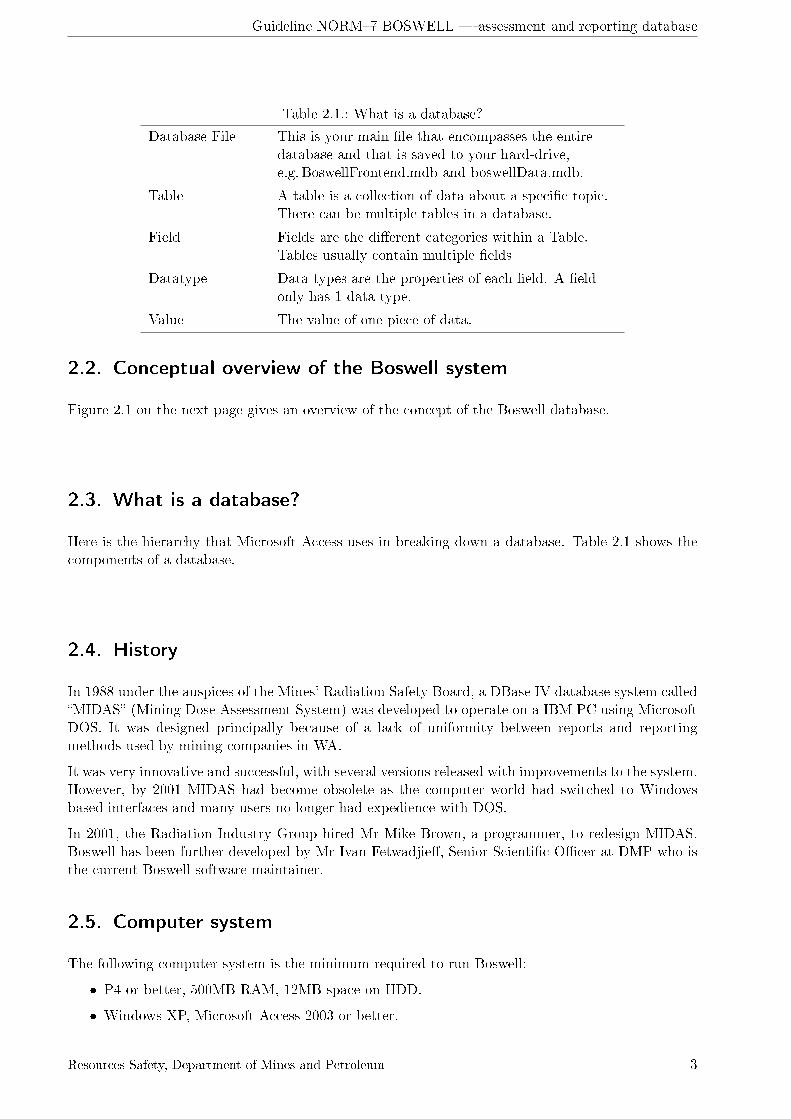
Table 2.1.: What is a database?
Database File This is your main �le that encompasses the entiredatabase and that is saved to your hard-drive,e.g. BoswellFrontend.mdb and boswellData.mdb.
Table A table is a collection of data about a speci�c topic.There can be multiple tables in a database.
Field Fields are the di�erent categories within a Table.Tables usually contain multiple �elds
Datatype Data types are the properties of each �eld. A �eldonly has 1 data type.
Value The value of one piece of data.
2.2. Conceptual overview of the Boswell system
Figure 2.1 on the next page gives an overview of the concept of the Boswell database.
2.3. What is a database?
Here is the hierarchy that Microsoft Access uses in breaking down a database. Table 2.1 shows thecomponents of a database.
2.4. History
In 1988 under the auspices of the Mines' Radiation Safety Board, a DBase IV database system called�MIDAS� (Mining Dose Assessment System) was developed to operate on a IBM PC using MicrosoftDOS. It was designed principally because of a lack of uniformity between reports and reportingmethods used by mining companies in WA.
It was very innovative and successful, with several versions released with improvements to the system.However, by 2001 MIDAS had become obsolete as the computer world had switched to Windowsbased interfaces and many users no longer had expedience with DOS.
In 2001, the Radiation Industry Group hired Mr Mike Brown, a programmer, to redesign MIDAS.Boswell has been further developed by Mr Ivan Fetwadjie�, Senior Scienti�c O�cer at DMP who isthe current Boswell software maintainer.
2.5. Computer system
The following computer system is the minimum required to run Boswell:
� P4 or better, 500MB RAM, 12MB space on HDD.
� Windows XP, Microsoft Access 2003 or better.
Resources Safety, Department of Mines and Petroleum 3

Guideline NORM�7 BOSWELL � assessment and reporting database
Figure 2.1.: The Boswell System
R e p o r t s
C a l c u l a t e a n dA s s e s s D a t a
S i t e & L o c a t i o n D a t aE m p l o y e e D a t aE q u i p m e n t D a t a
D O C E P & C O N T A M C o d e s
D u s t M e a s u r e m e n t sB a d g e R e a d i n g s
W o r k H i s t o r yC a l i b r a t i o n D a t a
W o r k C a t e g o r y D a t a
U p l o a d d a t a t o D O C E PB a c k u p
D a t a
4 Managing naturally occurring radioactive material (NORM) in mining and mineral processing

Guideline NORM�7 BOSWELL � assessment and reporting database
Desirable options are:
� Internet access
� Colour printer
� Cute PDF writer or Adobe installed (Cute PDF is Freeware and available fromwww.cutepdf.com)
� CD burner to backup data
� Network for multi-user access
2.6. Microsoft Access
To run Boswell on a computer system, Microsoft Access must be installed on that computer. MicrosoftAccess, is a relational database management system from Microsoft which combines the relationalMicrosoft Jet Database Engine with a graphical user interface and software development tools.
Skilled software developers and data architects use it to develop application software. Relativelyunskilled programmers and non-programmer `power users' can use it to build simple applications.
Microsoft Access was used as the foundation of this database as:
� Access is the most widely used desktop database system in the world;
� Access has more support and consultants available than any other desktop database system;
� Access integrates well with the other members of the Microsoft O�ce suite of products (Excel,Word, Outlook, etc.);
� Access is available with the Microsoft O�ce Professional suite of business products therefore noadditional database software is required if your company purchases computers with this suiteof products already installed; and
� Access is likely to be available and supported for years to come because Microsoft is a leadingsoftware company.
Boswell has been tested with Access 2000, Access XP, Access 2003, Access 2007 and found to operatecorrectly in those versions.
2.7. Data storage
The data Boswell stores is mainly to do with:
� Equipment � holders, pumps, counters
� Employees � the people exposed
� Employee Work Times � times in di�erent locations
� Site Work Groups � di�erent occupation groups
� Site Work Areas � di�erent monitoring points at a location
� Measurement Locations � di�erent locations in the operation
� Dust Monitoring � Area and personal dust measurements
� Exposure Badges � external employee exposures
This data is all stored in boswellData.mdb. IMPORTANT � Make sure that you regularly backupthe boswellData.mdb �le and keep copies in a safe place in another location. Note: BOSWELL isnot designed to store data for the DMP CONTAM database although it has facilities to export thedust monitoring data into a format that CONTAM will accept.
Resources Safety, Department of Mines and Petroleum 5
Guideline NORM�7 BOSWELL � assessment and reporting database
2.8. Boswell user licence
Boswell is supplied to users under the following conditions of use:
Copyright © 2001 � 2010 Department of Mines and Petroleum
All rights reserved. Redistribution and use in source and binary forms, with or withoutmodi�cation, are permitted provided that the following conditions are met:
Redistributions of source code must retain the above copyright notice, this list of condi-tions and the following disclaimer.
Redistributions in binary form must reproduce the above copyright notice, this list ofconditions and the following disclaimer in the documentation and/or other materialsprovided with the distribution.
Neither the name of the Department of Mines and Petroleum nor the names of its contri-butors may be used to endorse or promote products derived from this software withoutspeci�c prior written permission.
The software is provided by the copyright holders and contributors `as is' and any expressor implied warranties, including, but not limited to, the implied warranties of merchanta-bility and �tness for a particular purpose are disclaimed. In no event shall the copyrightowner or contributors be liable for any direct, indirect, incidental, special, exemplary, orconsequential damages (including, but not limited to, procurement of substitute goodsor services; loss of use, data, or pro�ts; or business interruption) however caused and onany theory of liability, whether in contract, strict liability, or tort (including negligenceor otherwise) arising in any way out of the use of this software, even if advised of thepossibility of such damage.
2.9. Boswell �les
In addition to Microsoft Access, Boswell consists of the following �les:
1. boswellData.mdb � Back-end data �le containing tables of data;
2. BoswellFrontend2000.mdb � Boswell Program Front-end;
3. BOSWELLHELP.HLP � Boswell Help File;
4. BoswellImage.EMF � Boswell Radiation Symbol on forms;
5. BoswellLogo.ico � Radiation Icon for desktop;
6. FactorySunset.bmp � Sunset Picture File that appears on menu;
7. TIPOFDAY.txt � Text �le containing tips on using Boswell for `Tip of the Day' feature;
8. Unzip32.dll � Library �le containing Unzip for decompressing compressed backup data �les;and
9. zip32.dll � Library �le containing Zip for compressing backup data �les.
2.10. Boswell installation
The Boswell �les listed above just need to be copied to a directory in the path of the computer itwill be used on. The boswellData.mdb �le may placed be in a di�erent directory or even anothermachine or server while the other eight �les must be located together in the same directory. If theBoswell installation is to be multi-user, all �les can be located on a fast server.
6 Managing naturally occurring radioactive material (NORM) in mining and mineral processing
Guideline NORM�7 BOSWELL � assessment and reporting database
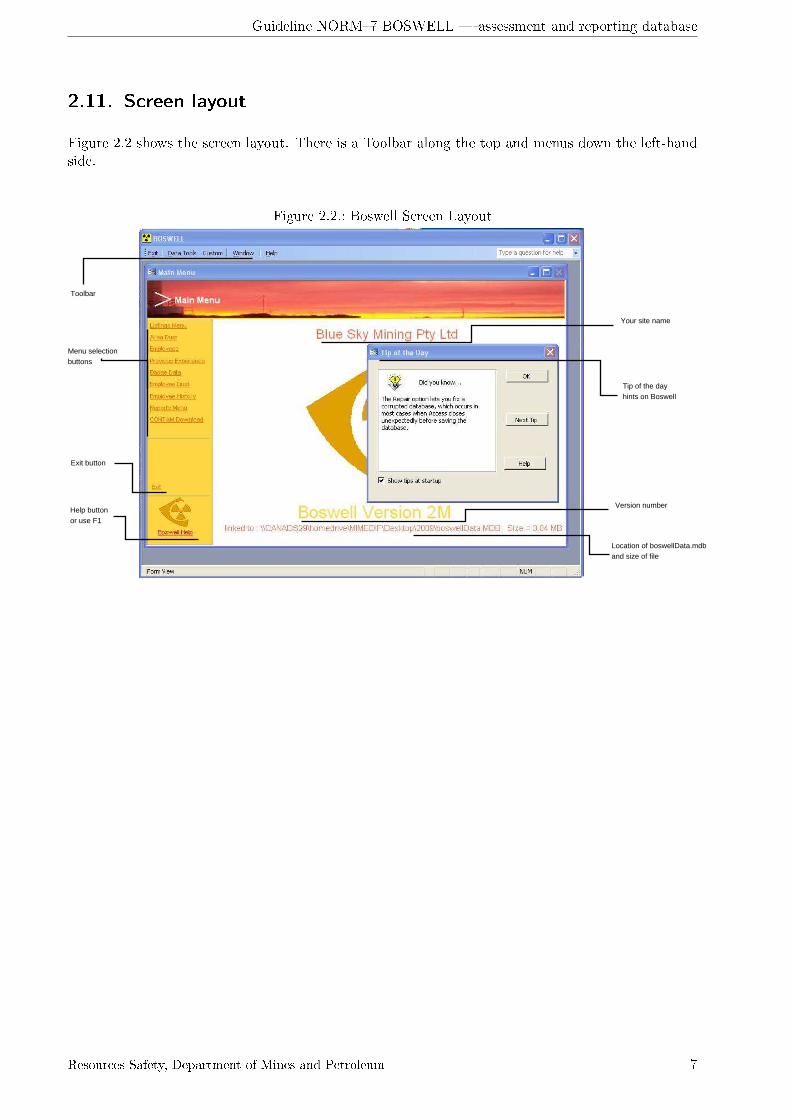
2.11. Screen layout
Figure 2.2 shows the screen layout. There is a Toolbar along the top and menus down the left-handside.
Figure 2.2.: Boswell Screen Layout
Toolbar
Menu selection buttons
Your site name
Tip of the day hints on Boswell
Exit button
Help buttonor use F1
Version number
Location of boswellData.mdband size of file
Resources Safety, Department of Mines and Petroleum 7

Guideline NORM�7 BOSWELL � assessment and reporting database
3. Data storage
3.1. Rules for entering data
1. Data must not be deleted, especially employees.
2. `Work History' must be entered fresh each year.
3. You may enter more than one `Work Category' in the Employee History for the same worktime. However, the hours must be added manually.
4. To be classi�ed as a `Monitored Person', a person must have had at least one radiation badgeor one dust sample for the time period (radiation year).
5. `Work Categories' � `Annual Reports' only include routine dust measurements.
6. For newly entered records, some �elds will have data automatically entered from the previousrecord. This can be typed over if the data is di�erent. Note that records in most tables can beentered in any order, however, it is best to enter data in order of left to right.
7. Take care not to duplicate data, e.g. there must be only one `EmpId' number per worker.
8. Select the correct options from the drop down lists.
9. Make sure the data you enter makes sense.
3.2. Order for data entry
Table 3.1 on the facing page shows the order in which data must be entered into Boswell. Datashould be entered in this order as some data is used in subsequent tables and forms. e.g. The `EntitySite Code' (code for company name) is used in most records.
3.3. Data entry forms
3.3.1. Entity name
Entity Name is used to associate all data with your mine site. The only �elds that you should changeare possibly `Selected' and `EntityName'. If your company or site has a change of name, this tablecan only be accessed by opening boswellData.mdb in Access. Open `Entity Name' in the `Tableview' and only change the name in `EntityName'. Do not change `Sitename' as this is from the DMPCONTAM database. Table 3.2 on the next page lists each �eld on this form and gives its purpose.
8 Managing naturally occurring radioactive material (NORM) in mining and mineral processing

Guideline NORM�7 BOSWELL � assessment and reporting database
Table 3.1.: Boswell Forms
Order ofuse
Data entry form Initial andoccasional use
Frequently used
Listings Menu
1 Entity Name X
2 Conversion Factors X
3 Work Categories X
4 Radiation Counters X
5 Air Sampler Holders X
6 Air Sampler Pumps X
7 Area / Location Code X
8 Respiratory Protection X
9 Radiation Calibration X
Main Menu
10 Employees X
11 Previous Experience X
12 Employee History X
13 Badge Data X
14 Employee Dust X
15 Area Dust X
Reports Menu
16 X
CONTAM Download
17
Table 3.2.: Entity Name �elds
Field Name Purpose
Selected Selects the company name record from the list � do not change.
EntityName This is the company name used by Boswell to place on the screen and printin reports � you may change this.
CompanyCode CONTAM code � do not change.
SiteCode CONTAM code � do not change.
Sitename CONTAM code � do not change.
Resources Safety, Department of Mines and Petroleum 9
Guideline NORM�7 BOSWELL � assessment and reporting database
3.3.2. Conversion factor
The form lists the `Dose Conversion Factor' used in the calculation of `Internal EDE' for your site.The dose conversion factors can be found in the tables of NORM�5 Radiation dose assessment.
The `Internal EDE' equation that Boswell uses is as follows:
(Total Hours*Dose Conversion Factor*1.2*(Average Of Alpha Activity/1000))+(Dose ConversionFactor*1.2*(Sum of hours by Activity/1000)).
Table 3.3 on the facing page lists each �eld on this form and gives its purpose.
3.3.3. Work category
This form lists all the work categories used on your site and whether they are active or not. A uniquevalue is used to represent each `Work Category', e.g `00' is always `Terminated'. Do not delete any
work categories as it will a�ect old records that have used it in the past. Table 3.4 on the next pagelists each �eld on this form and gives its purpose.
3.3.4. Radiation counter
This form lists all the Radiation Counters used on your site and whether they are active or not. If acounter is withdrawn from service for any reason, uncheck it's status. Do not delete a counter from
the database as this will a�ect old records. Table 3.5 on the facing page lists each �eld on this formand gives its purpose.
3.3.5. Air sampler holder
This form lists all the air sampler holders commonly used in industry and their CONTAM codes. Donot delete any air sampler holders from the database as this will a�ect old records. This form shouldnever need to be changed unless a new holder is introduced to the industry. Table 3.6 on page 13lists each �eld on this form and gives its purpose.
3.3.6. Air sampler pump
This form lists all the air sampler pumps on your site. Do not delete any air sampler pumps from
the database as this will a�ect old records. This form should never need to be changed unless a newholder is introduced to the industry. Table 3.7 on page 13 lists each �eld on this form and gives itspurpose.
10 Managing naturally occurring radioactive material (NORM) in mining and mineral processing

Guideline NORM�7 BOSWELL � assessment and reporting database
Table 3.3.: Conversion Factors
Field Name Purpose
DCFi Dose conversion factor from NORM�5 Radiation dose assessment.
AMAD (µm) Particle size calculated from NORM�3.5 Measurement of particle size,typically 5 µm or 10 µm.
Entity Code from `Entity Name' table.
Table 3.4.: Work Categories
Field Name Purpose
Work Category Unique code for each Work category. Some sites use di�erent codes.
Work CategoryDescription
Unique name for each Work category. Some sites use di�erent names.
Status Determines if this work category is listed.
Hours/Day Usually 8 or 12 hours worked per day.
DaysOn Default value 5 days on for working week.
Dayso� Default value 2 days o� for weekend.
Holidays/Year Default value 4 weeks per year.
PublicHolidays/Year
Default value 10 days.
Nominal HoursWorked
Usually around 2,000 hours.
DCFi AMAD size and Radionuclides determine this. See `Conversion Factors'.
Annual Limit(mSv)
Default value is 20 mSv per year.
Occupation Code Information on the CONTAM Occupation Codes is available from COMTAMdocumentation located on the DMP web site. To save space, the drop downlist has only the common codes. Others can be added on request.
Entity Code from `Entity Name' table.
Table 3.5.: Radiation Counters
Field Name Purpose
Equipment Code Unique code for each counter such as` Canb01', `Ten01'.
CounterDescription
Name of Counter such as `Canberra 7401', `Tennelec TC257'.
RadiationCounter Status
Check box if counter is being used, uncheck if no longer being used.
Entity Code from `Entity Name' table.
Resources Safety, Department of Mines and Petroleum 11

Guideline NORM�7 BOSWELL � assessment and reporting database
3.3.7. Area/location code
Mines sites, treatment plants and o�ces are usually grouped in radiation monitoring program intoareas in which the likely radiation levels (dust and or gamma) are relatively constant. It would beunusual, and probably wrong, to group an o�ce area together with the product handlers. If youdid this, people working in the o�ces would be assigned the same radiation measurements as peopleworking in handling products. Do not delete any area or location codes from the database as this will
a�ect old records. Uncheck their status.
Table 3.8 on the next page lists each �eld on this form and gives its purpose.
The Area/Locations form links up to two other forms, Area Codes and Location Codes.
3.3.7.1. Area code
This is the code for the area that the sample is taken at. Table 3.9 on the facing page lists each �eldon this form and gives its purpose.
3.3.7.2. Location code
In some radiation monitoring programs, personal monitoring is supplemented by area monitoring.Under these circumstances, it is often desirable to identify the exact location of the area sampler.An area may contain many di�erent location codes, but remember that Boswell treats any sampletaken at a location within a radiation area as part of a set of data relating to the area.
Table 3.10 on page 14 lists each �eld on this form and gives its purpose.
3.3.8. Respiratory protection
This form lists the Respiratory Protection commonly used in industry and their CONTAM codes.Do not delete any respiratory codes from the database as this will a�ect old records. This form shouldnever need to be changed unless there is a change in CONTAM. Table 3.11 on page 14 lists each �eldon this form and gives its purpose. The default value is always `No Protection'.
3.3.9. Radiation calibration
This form lists the `Radiation Calibrations' undertaken on the `Radiation Counters'. The informa-tion of how to calibrate the counters can be found in Guideline NORM�3.4 Airborne radioactivitysampling. Do not delete any calibrations from the database as this will a�ect old records. Table 3.12on page 14 lists each �eld on this form and gives its purpose. The default value is always `NoProtection'.
12 Managing naturally occurring radioactive material (NORM) in mining and mineral processing

Guideline NORM�7 BOSWELL � assessment and reporting database
Table 3.6.: Air Sample Holders
Field Name Purpose
Holder Code Unique code for each holder such as 0,1,2,3,4...
HolderDescription
Name of Holder Type such as `Closed Face 7 hole 25mm'.
SamplingEquipment Code
CONTAM Code for Holder Type such as `7H'.
Entity Code from `Entity Name' table.
Table 3.7.: Air Sample Pumps
Field Name Purpose
Pump Code Unique code for each pump such as P1, P2, P3, P4...
PumpDescription
Make/Model of pump
Pump serialNumber
Serial numbers should be added to comply with Australian Standards
Pump Flow Rate(l/min)
Default �ow rate, typically 2.00 l/min
Pump Status Check box if pump is being used, uncheck if no longer being used.
Entity Code from `Entity Name' table.
Table 3.8.: Area/location Codes
Field Name Purpose
Area Code Unique code from Area Code form
Location Code Unique code from Location Code form
LocationDescription
Description for Location Code from Location Code form
Location Status Check box if location is being used, uncheck if no longer being used.
Entity Code from `Entity Name' table.
Table 3.9.: Area Codes
Field Name Purpose
Area Code Unique code for area such as `PL1'.
ACDescription Description of area such as `Dry Separation Plant 1'.
Area Code Active Check box if area is being used, uncheck if no longer being used.
Entity Code from `Entity Name' table.
Resources Safety, Department of Mines and Petroleum 13

Guideline NORM�7 BOSWELL � assessment and reporting database
Table 3.10.: Location Codes
Field Name Purpose
Location Code Unique code for each location such as `11A'.
LocationDescription
Description of location such as `11A Zircon b/ween AT205 & 207'
Entity Code from `Entity Name' table.
Table 3.11.: Respiratory Protection
Field Name Purpose
RespiratoryProtection Code
Unique code for each code such as 0,1,2,3,4...
RespiratoryProtectionDescription
Description from CONTAM such as `No Protection'.
Entity Code from `Entity Name' table.
Table 3.12.: Radiation Calibration
Field Name Purpose
Equipment Code Unique code for each Radiation Counter used in the Radiation Countersform. See Section 3.3.4 on page 10.
Calibration Date Date the calibration was made.
E�ciency From Excel Spreadsheet in Guideline NORM�3.4 Airborne radioactivitysampling.
BackgroundCounts
Counts from the Radiation Counter
BackgroundCount Time(min)
Overnight or 900 minutes.
Default SampleCount Time(min)
Usually 60 minutes.
Entity Code from `Entity Name' table.
14 Managing naturally occurring radioactive material (NORM) in mining and mineral processing
Guideline NORM�7 BOSWELL � assessment and reporting database
3.3.10. Employees
This form lists all the employees who are exposed to radiation on your site and whether they areactive or not. A unique value is used to represent each employee. Do not delete any employees as it
will a�ect old records. Table 3.13 on page 17 lists each �eld on this form and gives its purpose.
There are several methods of utilising operational procedures to optimise radiation protection in themining industry. One of these methods is with the recognition of those work conditions in whichsome individuals could be expected to receive a relatively higher radiation exposure than most otherwork conditions within that operation. If as a result of those work conditions there is potential foran individual to receive a dose in excess of 5 mSv per year, then that individual is to be classi�ed asa designated employee according to the MSIR [1]. The number of designated employees should bekept to a minimum.
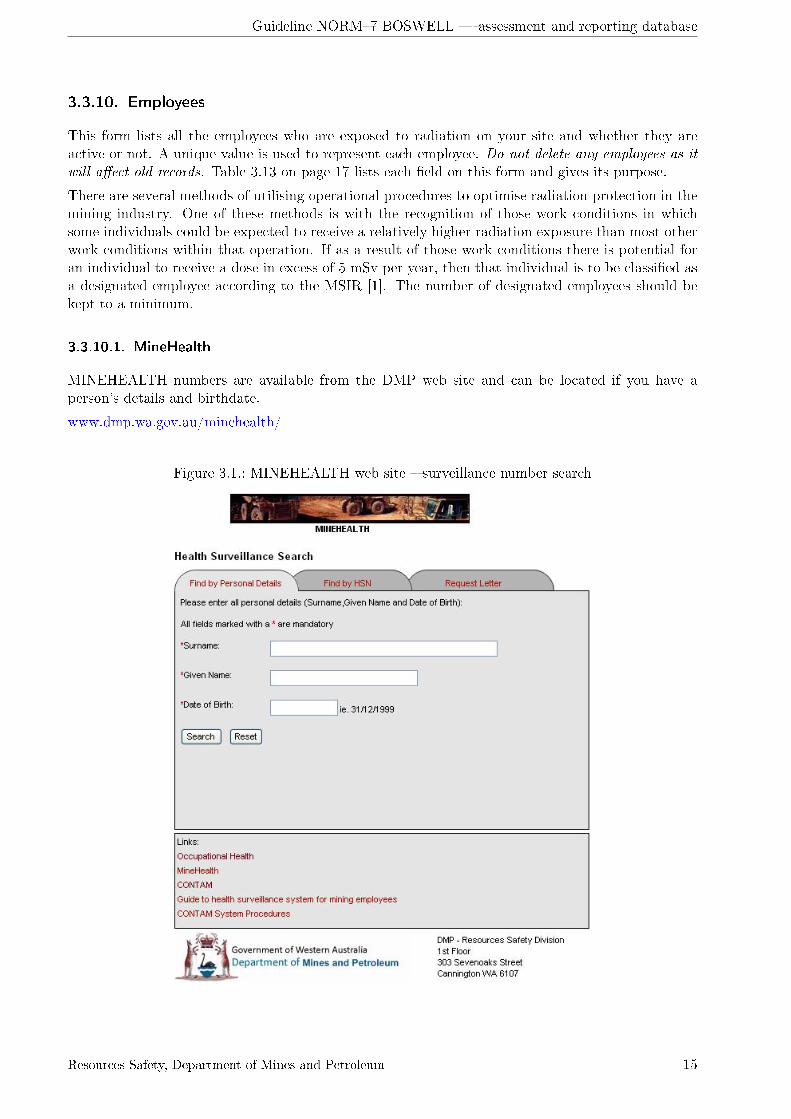
3.3.10.1. MineHealth
MINEHEALTH numbers are available from the DMP web site and can be located if you have aperson's details and birthdate.
www.dmp.wa.gov.au/minehealth/
Figure 3.1.: MINEHEALTH web site � surveillance number search
Resources Safety, Department of Mines and Petroleum 15
Guideline NORM�7 BOSWELL � assessment and reporting database
The `Health Surveillance Program for Mine Employees' (MINEHEALTH) replaced the `Mines Wor-kers Health Certi�cate System', with the introduction of the Mines Safety and Inspection Act (1994)and Regulations (1995).
MINEHEALTH is focused primarily on monitoring respiratory symptoms. Audiometric testing isalso undertaken as mine employees are typically exposed to very high noise levels.
3.3.11. Previous experience
The `Previous Radiation History' holds information on the previous employment of individuals inpositions where they were subject to radiation exposure.
Previous employers are required by law to prepare a dose report for employees that can be forwardedto their new employer. Table 3.14 on the facing page lists each �eld on this form and gives itspurpose.
3.3.12. Employee history
This form shows the movements of employees between work categories and it is absolutely imperativethat this is maintained accurately if the dose calculations are to be correct. They should be updatedat the very minimum once every `Radiation Year'. These records are used to allocate work categoriesto the radiation badges.
Important points to remember:
1. Any one employee can have numerous entries.
2. The dates must not overlap and, if required, you may manually split work times if an employeeworks in two work categories at the one time. You must calculate and adjust the hours manually.
3. Any gaps outside date ranges are assumed to be time-o�.
4. For the current work category for that employee, the record should show a start date andno end date. If you add the end date, the system will automatically mark that employee as`Terminated' in the employees screen.
5. Boswell will remove the `Terminated' once you open up a new record with an open ended `DateStarted'.
6. If this form contains erroneous data, you will get erroneous dose reports.
Table 3.15 on page 18 lists each �eld on this form and gives its purpose.
3.3.13. Badge data
The badge data form contains data on samples taken from individuals wearing radiation badges.Table 3.16 on page 18 lists each �eld on this form and gives its purpose.
16 Managing naturally occurring radioactive material (NORM) in mining and mineral processing

Guideline NORM�7 BOSWELL � assessment and reporting database
Table 3.13.: Employees
Field Name Purpose
EmpId Unique number for each Employee. Employees must not have duplicateEmpId numbers.
Surname Surname � can be changed if surname changes because EmpId is unchanged.
Firstname Determines if this work category is listed.
Initial To di�erentiate between those people with the same Surnames.
DOB Date of Birth � required for MINEHEALTH
Sex M/F
Payroll Number Number for company use � sometimes useful for tracking hours worked
MWHSH MineHealth Surveillance number � see below.
Designated Designated Status is manually placed by the RSO to indicate the employeeshould be monitored more closely. Employees with their designated statusticked will appear in reports speci�cally written for designated employees.
EmploymentCeased
When an employee leaves the company, the date should be added here.
Entity Code from `Entity Name' table.
Table 3.14.: Previous Radiation History
Field Name Purpose
Employee Drop down list from Employees form
Company Previous employer
Country Country
State State
Radiation Id Previous ID number
Inclusive DateFrom
Start date with previous employer
Inclusive date To End date with previous employer
Previous HistoryCited
Check box if exposure data is being used, unchecked if not being used.
Entity Code from `Entity Name' table.
Resources Safety, Department of Mines and Petroleum 17

Guideline NORM�7 BOSWELL � assessment and reporting database
Table 3.15.: Employee Work History
Field Name Purpose
Employee Name Names from the Employee form, Section 3.3.10 on page 15
WorkCategory Work Category drop down list from the Work Category form, Section 3.3.3on page 10.
DateFrom Start date � pop up calendar.
DateTo End date � pop up calendar.
Hours† Hours are calculated using work hours recorded in the Work Categories form.
Employee# EmpId from Employee form.
Entity Code from `Entity Name' table.†The number of hours worked in a work category over the period indicated. The hours will becalculated automatically once the two dates are entered, but this can then be overridden by the user.The hours will be based on the nominal hours per year �gure from the Work Categories table in thelisting section. This will be broken up pro rata for the number of days actually worked. This is animportant mandatory �eld and there are traps in place so that you can't exit this �eld until a validentry is made. To cancel an entire line you are working on or revert back to the values as they werewhen you started editing the record, press the `Esc' key.Data Filtering � the data is �ltered by default to show the only last two years of data. There is abutton on the toolbar to turn o� �ltering to show all data.
Table 3.16.: Badge Data
Field Name Purpose
Batch A batch number supplied by the badge supplier
BadgeNumber A badge number supplied by the badge supplier
EmpId EmpId from the Employee form, Section 3.3.10 on page 15
IssuedDate Start date of use � pop up calendar.
ReurnedDate End date of use � pop up calendar.
µSv Exposure recorded on badge.
Comments A place to note unusual events � sometimes an estimate must be enteredinto µSv if the badge was lost and it is noted here.
Entity Code from `Entity Name' table.
18 Managing naturally occurring radioactive material (NORM) in mining and mineral processing
Guideline NORM�7 BOSWELL � assessment and reporting database
3.3.14. Employee dust
You should enter your `Radiation Calibration' data prior to entering the associated dust data!
Some �elds are calculated by an `update query' that looks up the radiation calibration table for thelast calibration date and uses that data.
`Data �ltering' � the data is �ltered by default to show the last two years data. There is a button onthe toolbar to turn o� �ltering and show all data. Table 3.17 on the following page lists each �eldon this form and gives its purpose.
3.3.15. Area dust
You should enter your `Radiation Calibration' data prior to entering the associated area dust data!
Some �elds are calculated by an `Update Query' that looks up the radiation calibration table for thelast calibration date and uses that data.
`Data Filtering' � the data is �ltered by default to show the last two years data. There is a buttonon the toolbar to turn o� �ltering and show all data. Table 3.21 on page 23 lists each �eld on thisform and gives its purpose.
Resources Safety, Department of Mines and Petroleum 19

Guideline NORM�7 BOSWELL � assessment and reporting database
Table 3.17.: Employee Dust
Field Name Purpose
Id A text identi�er that goes with the �lter number touniquely identify that sample.
Filter No. A number that goes with the �lter id to uniquely identify asample.
Pre-wt (mg) Weight of clean �lter paper when it is loaded.
Final wt (mg) The weight of �lter after sample has been taken, i.e.with the dust on the paper.
Sample wt (mg) Net weight of contaminants on the �lter. This isautomatically calculated once the initial and �nal weightshave been entered.
Employee EmpId from the Employee form, Section 3.3.10 on page 15
Work Category This refers to the Work Category the employee wasworking in when the sampling took place.
Location Code Location Code as required in downloads for the DMP'sCONTAM database. This �eld must be �lled in if yoursubmissions to the CONTAM database are to be processedsuccessfully.
Con�ned Space Was the sample collected in a con�ned space? As requiredin downloads for the DMP's CONTAM database. This �eldmust be �lled in if your submissions to the COMTAMdatabase are to be processed successfully.
Respiratory Protection The default value is `N' as there is no guarantee thatrespiratory protected is correctly used or �tted.
ASH Code Defaults to 2 � Closed Face 7 hole 25mm which is used bythe mining industry.
Pump Code This identi�es the actual pump being used to take thesample. The values in the list come from the Air SamplerPumps form.
Pump Flow Rate (l/min) The default value is automatically entered, however thereal value can be manually entered in its place.
Pump Start Date/Time Date and time pump was started.
Pump End Date/Time Date and time pump was stopped.
Pump Sampling Time (min) Net time in minutes the pump ran for. This isautomatically calculated once the Start Date and End Date�elds have been entered.
Pump Sample Vol (m3) Volume of air passing through the pump in cubic metres(cm3). This is automatically calculated once the pumpcode is selected and the start and end date are entered.The pump code will have an associated �ow rate that willbe multiplied by the sample time.
20 Managing naturally occurring radioactive material (NORM) in mining and mineral processing

Guideline NORM�7 BOSWELL � assessment and reporting database
Table 3.19.: Employee Dust continued
Field Name Purpose
Analysis Date Date sample was counted. This will be di�erent to thesampling date as six or seven days are allowed for decayproducts to decay o� the �lter paper. It is the date used inreturning the counting equipment calibration �gures for aparticular sample.
RC Code Drop down list of unique codes for each Radiation Counterused in the Radiation Counters form. See Section 3.3.4 onpage 10.
E�ciency This is the counter e�ciency �gure stored in the RadiationCalibration table in the Listings section. This isautomatically returned once Count Date RC Code havebeen selected.Note: This is not entered as a % value.
Sample Counts The number of counts returned by the counting equipmentfor that sample.
Sample Count Time (min) Time in minutes the sample was counted � usually 60minutes.
Background Counts The number of background sample counts present for thatcounter for the calibration current at that time. This isautomatically returned once the RC Code and the CountDate have been selected. The calibration values are storedin the Radiation Calibration form in the Listing section.
Background Count Time (min) Usually over night or as long as possible.
Dust Conc (mg/m3) This �eld is calculated automatically once the weights,dates and pump have been selected. Values over the limitare in `red'.([FinalWeight]-[InnitialWeight])/(DateDi�('n',[InnitialDate],[FinalDate])*([�owrate]/1000))
Alpha Activity (mBq/m3) Alpha Activity is calculated using the following equation:(Sample Counts/50-BackgroundCounts/50)*(1/60/Counter E�ciency/Sample time*Pump�ow)
MDL (mBq/m3) Minimum Detectable Level measured in mBq/m³ Thisvalue is substituted in the calculations if the counts are toolow.This value is calculated using the following equation:(3 + (3.29 x (SQR((BC x SCT) x (1+(SCT/BCT)))))) /(E� x SCT)Square Root = SQR , Background Counts = BC , SampleCount Time = SCT , Background Count Time = BCT ,Counter e�ciency = E� [1]
Speci�c Activity (Bq/g) This is calculated using the following equation:((Sample counts/50-(BackgroundCounts)/50)*(1/60/(Counter E�ciency)/((sampletime)*(Pump �ow]/1000))))*1000/(SampleWeight*1000/(Sample Time*Pump �owrate))
Resources Safety, Department of Mines and Petroleum 21
Guideline NORM�7 BOSWELL � assessment and reporting database
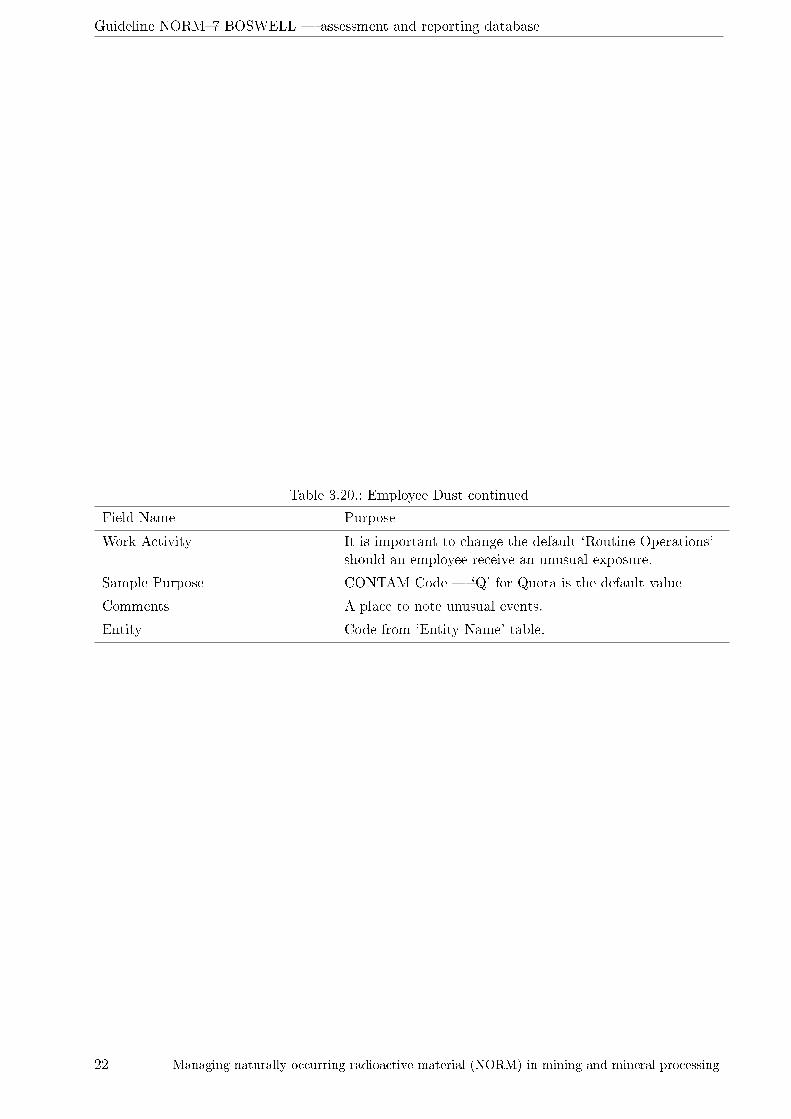
Table 3.20.: Employee Dust continued
Field Name Purpose
Work Activity It is important to change the default `Routine Operations'should an employee receive an unusual exposure.
Sample Purpose CONTAM Code � `Q' for Quota is the default value
Comments A place to note unusual events.
Entity Code from `Entity Name' table.
22 Managing naturally occurring radioactive material (NORM) in mining and mineral processing
Guideline NORM�7 BOSWELL � assessment and reporting database
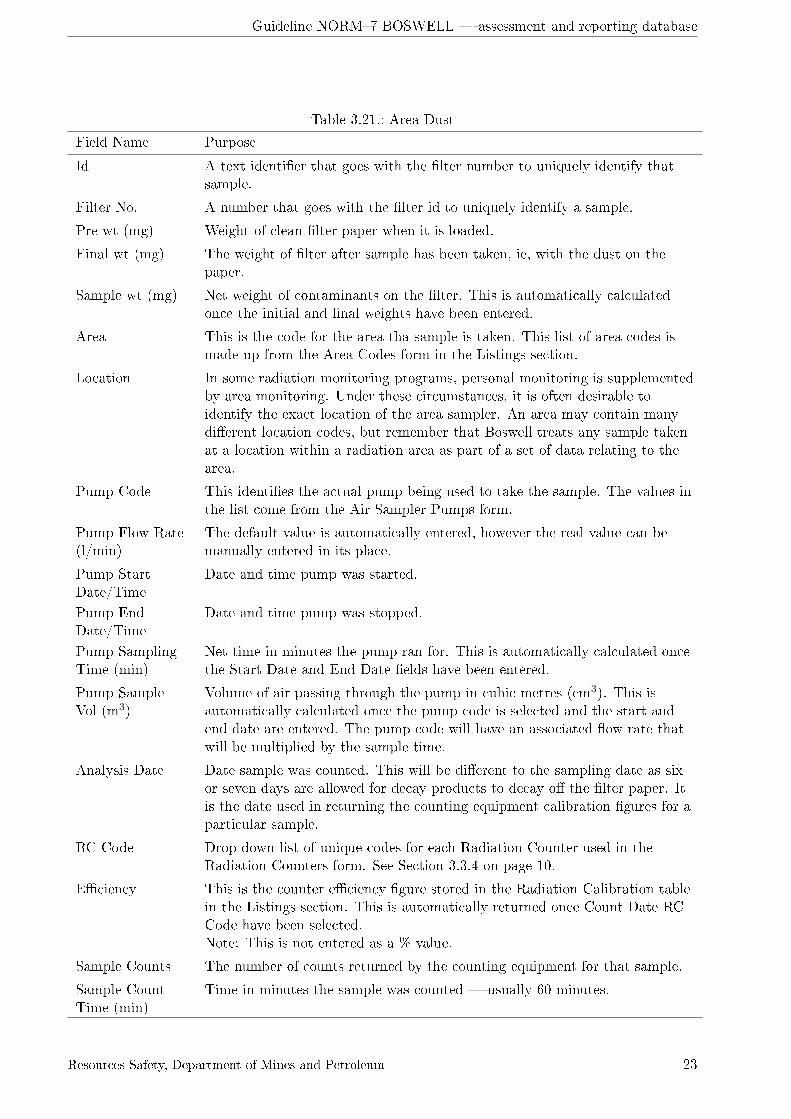
Table 3.21.: Area Dust
Field Name Purpose
Id A text identi�er that goes with the �lter number to uniquely identify thatsample.
Filter No. A number that goes with the �lter id to uniquely identify a sample.
Pre-wt (mg) Weight of clean �lter paper when it is loaded.
Final wt (mg) The weight of �lter after sample has been taken, ie, with the dust on thepaper.
Sample wt (mg) Net weight of contaminants on the �lter. This is automatically calculatedonce the initial and �nal weights have been entered.
Area This is the code for the area tha sample is taken. This list of area codes ismade up from the Area Codes form in the Listings section.
Location In some radiation monitoring programs, personal monitoring is supplementedby area monitoring. Under these circumstances, it is often desirable toidentify the exact location of the area sampler. An area may contain manydi�erent location codes, but remember that Boswell treats any sample takenat a location within a radiation area as part of a set of data relating to thearea.
Pump Code This identi�es the actual pump being used to take the sample. The values inthe list come from the Air Sampler Pumps form.
Pump Flow Rate(l/min)
The default value is automatically entered, however the real value can bemanually entered in its place.
Pump StartDate/Time
Date and time pump was started.
Pump EndDate/Time
Date and time pump was stopped.
Pump SamplingTime (min)
Net time in minutes the pump ran for. This is automatically calculated oncethe Start Date and End Date �elds have been entered.
Pump SampleVol (m3)
Volume of air passing through the pump in cubic metres (cm3). This isautomatically calculated once the pump code is selected and the start andend date are entered. The pump code will have an associated �ow rate thatwill be multiplied by the sample time.
Analysis Date Date sample was counted. This will be di�erent to the sampling date as sixor seven days are allowed for decay products to decay o� the �lter paper. Itis the date used in returning the counting equipment calibration �gures for aparticular sample.
RC Code Drop down list of unique codes for each Radiation Counter used in theRadiation Counters form. See Section 3.3.4 on page 10.
E�ciency This is the counter e�ciency �gure stored in the Radiation Calibration tablein the Listings section. This is automatically returned once Count Date RCCode have been selected.Note: This is not entered as a % value.
Sample Counts The number of counts returned by the counting equipment for that sample.
Sample CountTime (min)
Time in minutes the sample was counted � usually 60 minutes.
Resources Safety, Department of Mines and Petroleum 23

Guideline NORM�7 BOSWELL � assessment and reporting database
Table 3.22.: Area Dust continued
Field Name Purpose
BackgroundCounts
The number of background sample counts present for that counter for thecalibration current at that time. This is automatically returned once the RCCode and the Count Date have been selected. The calibration values arestored in the Radiation Calibration form in the Listing section.
BackgroundCount Time(min)
Usually over night or as long as possible.
Dust Conc(mg/m3)
This �eld is calculated automatically once the weights, dates and pump havebeen selected. Values over the limit are in `red'.([FinalWeight]-[InnitialWeight])/(DateDi�('n',[InnitialDate],[FinalDate])*([�owrate]/1000))
Alpha Activity(mBq/m3)
Alpha Activity is calculated using the following equation:(Sample Counts/50-Background Counts/50)*(1/60/CounterE�ciency/Sample time*Pump �ow)
MDL (mBq/m3) Minimum Detectable Level measured in mBq/m³ This value is substituted inthe calculations if the counts are too low.This value is calculated using the following equation:(3 + (3.29 x (SQR((BC x SCT) x (1+(SCT/BCT)))))) / (E� x SCT)Square Root = SQR , Background Counts = BC , Sample Count Time =SCT , Background Count Time = BCT , Counter e�ciency = E� [1]
Speci�c Activity(Bq/g)
This is calculated using the following equation:((Sample counts/50-(Background Counts)/50)*(1/60/(CounterE�ciency)/((sample time)*(Pump �ow]/1000))))*1000/(SampleWeight*1000/(Sample Time*Pump �owrate))
Comments A place to note unusual events.
Entity Code from `Entity Name' table.
24 Managing naturally occurring radioactive material (NORM) in mining and mineral processing
Guideline NORM�7 BOSWELL � assessment and reporting database
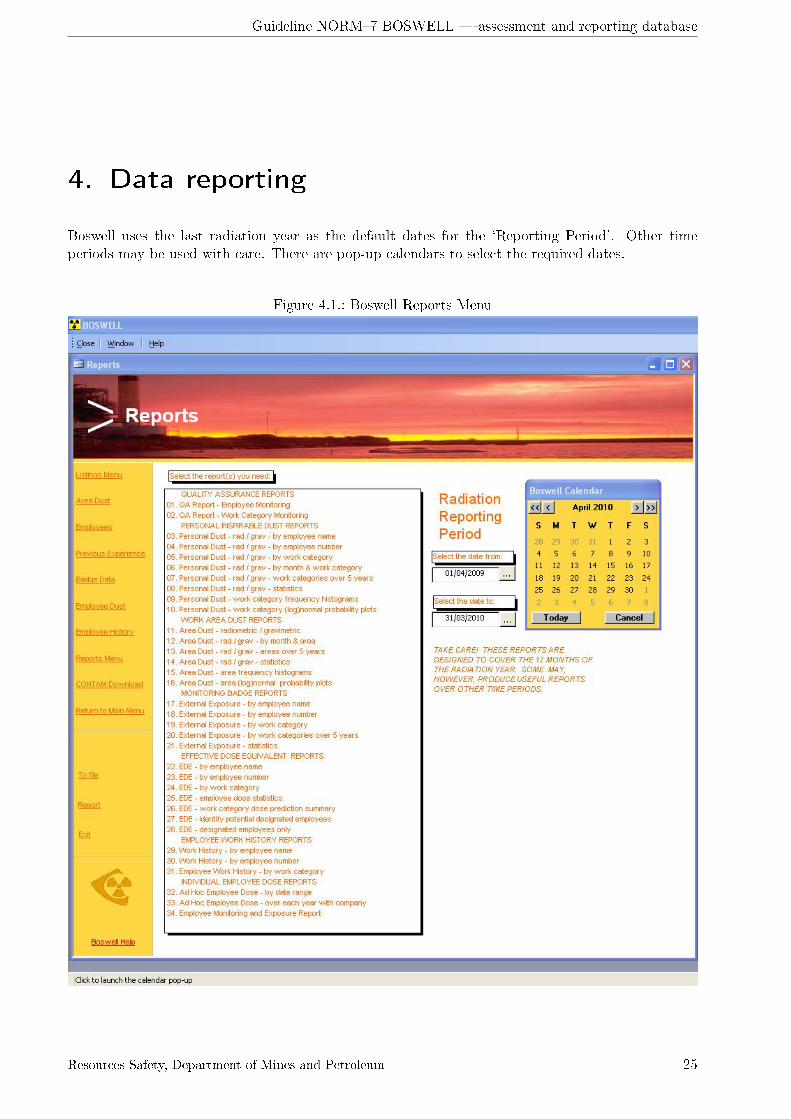
4. Data reporting
Boswell uses the last radiation year as the default dates for the `Reporting Period'. Other timeperiods may be used with care. There are pop-up calendars to select the required dates.
Figure 4.1.: Boswell Reports Menu
Resources Safety, Department of Mines and Petroleum 25
Guideline NORM�7 BOSWELL � assessment and reporting database
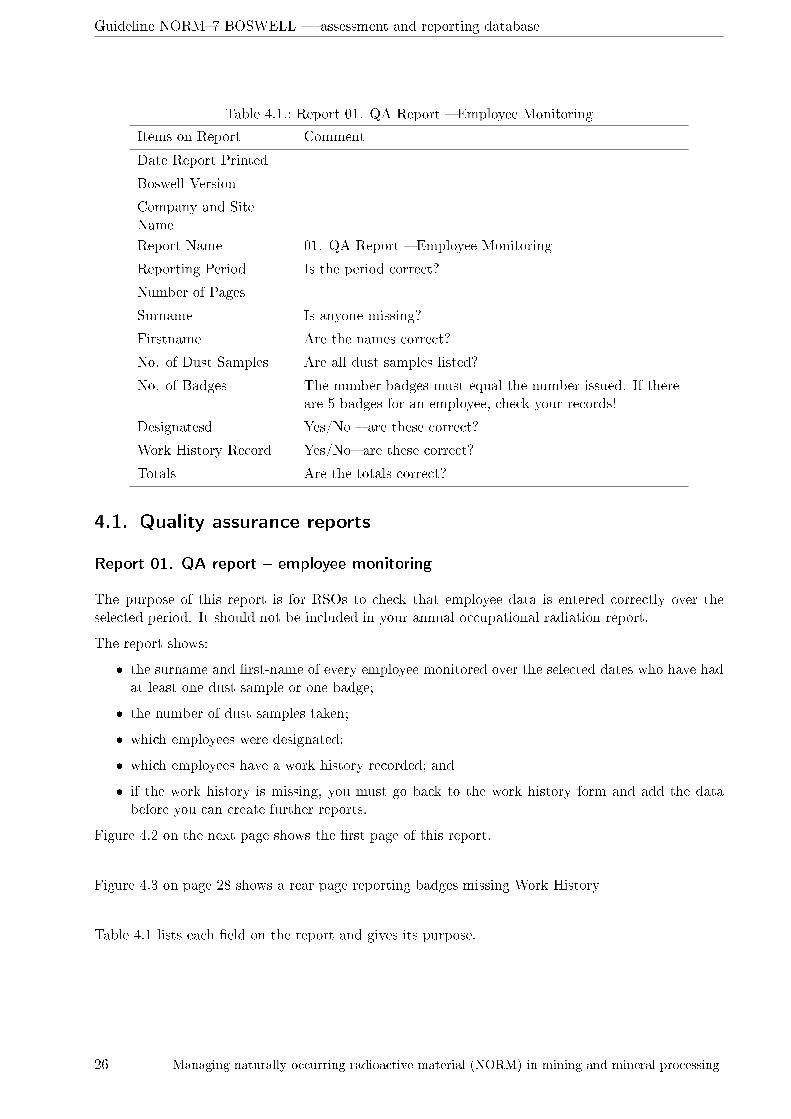
Table 4.1.: Report 01. QA Report � Employee Monitoring
Items on Report Comment
Date Report Printed
Boswell Version
Company and SiteName
Report Name 01. QA Report � Employee Monitoring
Reporting Period Is the period correct?
Number of Pages
Surname Is anyone missing?
Firstname Are the names correct?
No. of Dust Samples Are all dust samples listed?
No. of Badges The number badges must equal the number issued. If thereare 5 badges for an employee, check your records!
Designatesd Yes/No � are these correct?
Work History Record Yes/No� are these correct?
Totals Are the totals correct?
4.1. Quality assurance reports
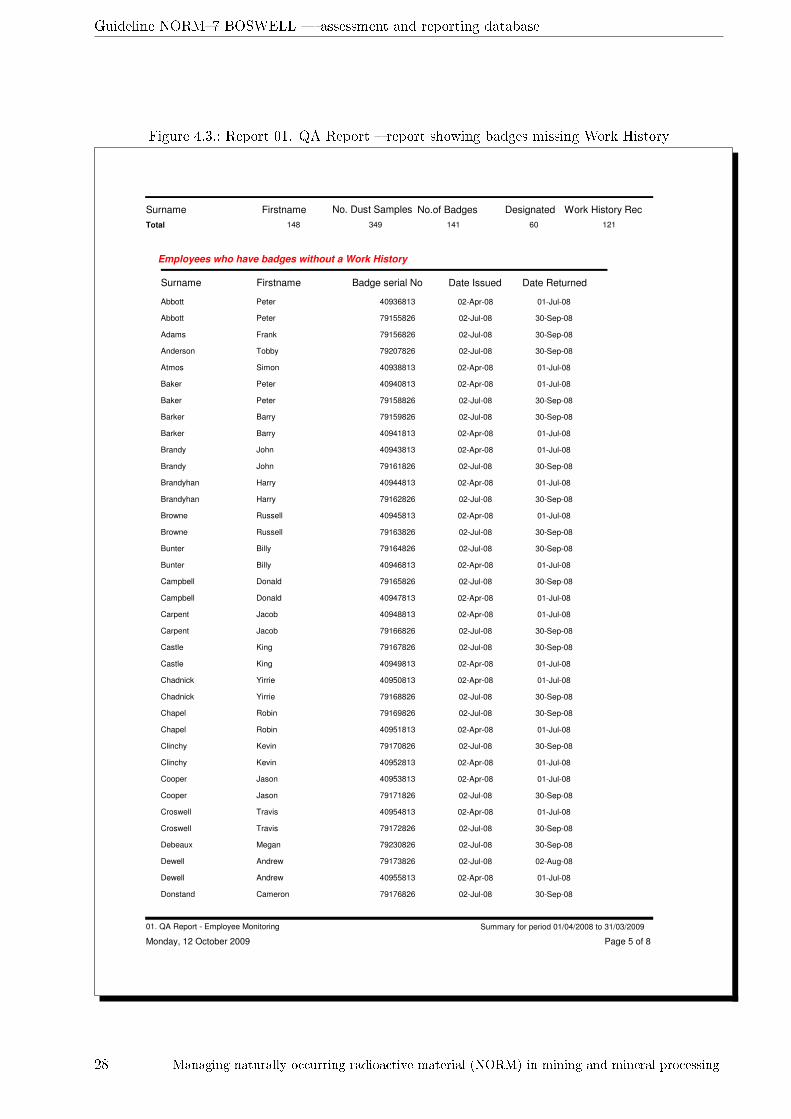
Report 01. QA report � employee monitoring
The purpose of this report is for RSOs to check that employee data is entered correctly over theselected period. It should not be included in your annual occupational radiation report.
The report shows:
� the surname and �rst-name of every employee monitored over the selected dates who have hadat least one dust sample or one badge;
� the number of dust samples taken;
� which employees were designated;
� which employees have a work history recorded; and
� if the work history is missing, you must go back to the work history form and add the databefore you can create further reports.
Figure 4.2 on the next page shows the �rst page of this report.
Figure 4.3 on page 28 shows a rear page reporting badges missing Work History
Table 4.1 lists each �eld on the report and gives its purpose.
26 Managing naturally occurring radioactive material (NORM) in mining and mineral processing

Guideline NORM�7 BOSWELL � assessment and reporting database
Figure 4.2.: Report 01. QA Report � Employee Monitoring
Summary for period 01/04/2006 to 31/03/2007
Wednesday, 23 September 2009 Page 1 of 4
Blue Sky Mining Pty Ltd
Boswell Version 2M
01. QA Report - Employee Monitoring
Surname Firstname No. Dust Samples No.of Badges Designated Work History Rec
Abbott Peter 8 4 Yes Yes
Adams Fred 3 4 Yes Yes
Allans Mary 3 No No
Anderson Tobby 4 Yes Yes
Ashcraft Ian 3 3 No Yes
Backshall Ford 2 2 No Yes
Backsnail Mort 3 3 No Yes
Baker Peter 12 4 Yes Yes
Balourd Ryan 1 No No
Banks Cody 3 4 No Yes
Barker Barry 7 4 Yes Yes
Barker Mervin 4 No Yes
Baron Red 1 No No
Bickill Barbie 1 No No
Bollard Tina 2 No Yes
Bood Dale 5 4 No Yes
Boucherd Frenchy 1 No No
Boysly Ian 8 4 No Yes
Brandy John 3 4 Yes Yes
Brandyhan Harry 1 4 Yes Yes
Brendan Nick 1 No No
Browne Russell 4 Yes Yes
Buggy Brian 2 4 No Yes
Bunter Billy 2 Yes Yes
Campbell Donald 4 4 No No
Carpent Jacob 3 Yes Yes
Castle King 3 4 Yes Yes
Chadnick Yirrie 3 4 Yes Yes
Chapel Robin 10 2 Yes Yes
Ciddle Peta 1 No No
Ciddle Steve 1 No No
Clinchy Kevin 8 4 Yes Yes
Collar Whitey 3 No No
Collett Tony 1 No No
Comb Ruth 2 No No
Cookie Mon 1 No No
Cooper Jason 3 Yes Yes
Copper Mike 4 No Yes
Craighorn Mickie 2 No No
Croswell Travis 4 4 Yes Yes
Cullens Craig 1 No No
Davis Peter 2 No No
Dewell Andrew 4 4 No Yes
Donstand Cameron 1 4 Yes Yes
Down Brendan 4 Yes Yes
Dunddie Mike 1 1 No Yes
Resources Safety, Department of Mines and Petroleum 27
Guideline NORM�7 BOSWELL � assessment and reporting database
Figure 4.3.: Report 01. QA Report � report showing badges missing Work History
Surname Firstname No. Dust Samples No.of Badges Designated Work History Rec
349Total 141148 60 121
Surname Firstname Badge serial No Date Issued Date Returned
Employees who have badges without a Work History
Abbott Peter 40936813 02-Apr-08 01-Jul-08
Abbott Peter 79155826 02-Jul-08 30-Sep-08
Adams Frank 79156826 02-Jul-08 30-Sep-08
Anderson Tobby 79207826 02-Jul-08 30-Sep-08
Atmos Simon 40938813 02-Apr-08 01-Jul-08
Baker Peter 40940813 02-Apr-08 01-Jul-08
Baker Peter 79158826 02-Jul-08 30-Sep-08
Barker Barry 79159826 02-Jul-08 30-Sep-08
Barker Barry 40941813 02-Apr-08 01-Jul-08
Brandy John 40943813 02-Apr-08 01-Jul-08
Brandy John 79161826 02-Jul-08 30-Sep-08
Brandyhan Harry 40944813 02-Apr-08 01-Jul-08
Brandyhan Harry 79162826 02-Jul-08 30-Sep-08
Browne Russell 40945813 02-Apr-08 01-Jul-08
Browne Russell 79163826 02-Jul-08 30-Sep-08
Bunter Billy 79164826 02-Jul-08 30-Sep-08
Bunter Billy 40946813 02-Apr-08 01-Jul-08
Campbell Donald 79165826 02-Jul-08 30-Sep-08
Campbell Donald 40947813 02-Apr-08 01-Jul-08
Carpent Jacob 40948813 02-Apr-08 01-Jul-08
Carpent Jacob 79166826 02-Jul-08 30-Sep-08
Castle King 79167826 02-Jul-08 30-Sep-08
Castle King 40949813 02-Apr-08 01-Jul-08
Chadnick Yirrie 40950813 02-Apr-08 01-Jul-08
Chadnick Yirrie 79168826 02-Jul-08 30-Sep-08
Chapel Robin 79169826 02-Jul-08 30-Sep-08
Chapel Robin 40951813 02-Apr-08 01-Jul-08
Clinchy Kevin 79170826 02-Jul-08 30-Sep-08
Clinchy Kevin 40952813 02-Apr-08 01-Jul-08
Cooper Jason 40953813 02-Apr-08 01-Jul-08
Cooper Jason 79171826 02-Jul-08 30-Sep-08
Croswell Travis 40954813 02-Apr-08 01-Jul-08
Croswell Travis 79172826 02-Jul-08 30-Sep-08
Debeaux Megan 79230826 02-Jul-08 30-Sep-08
Dewell Andrew 79173826 02-Jul-08 02-Aug-08
Dewell Andrew 40955813 02-Apr-08 01-Jul-08
Donstand Cameron 79176826 02-Jul-08 30-Sep-08
Monday, 12 October 2009 Page 5 of 8
Summary for period 01/04/2008 to 31/03/200901. QA Report - Employee Monitoring
28 Managing naturally occurring radioactive material (NORM) in mining and mineral processing
Guideline NORM�7 BOSWELL � assessment and reporting database
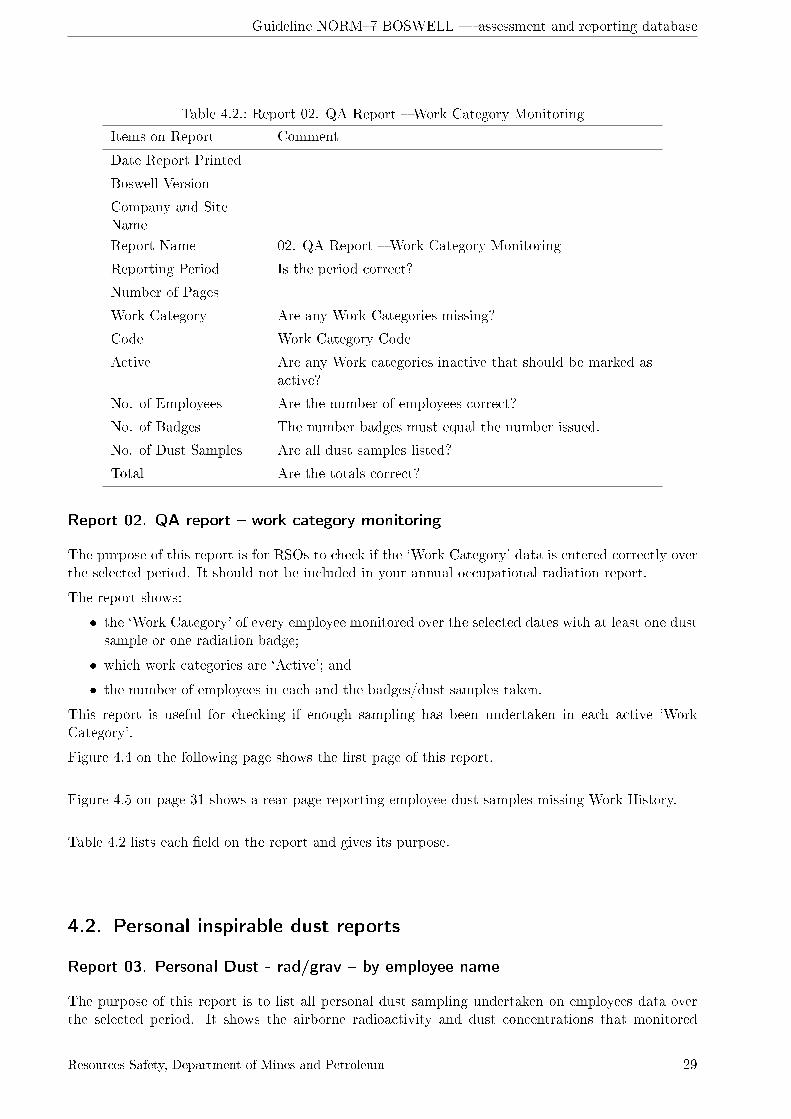
Table 4.2.: Report 02. QA Report � Work Category Monitoring
Items on Report Comment
Date Report Printed
Boswell Version
Company and SiteName
Report Name 02. QA Report � Work Category Monitoring
Reporting Period Is the period correct?
Number of Pages
Work Category Are any Work Categories missing?
Code Work Category Code
Active Are any Work categories inactive that should be marked asactive?
No. of Employees Are the number of employees correct?
No. of Badges The number badges must equal the number issued.
No. of Dust Samples Are all dust samples listed?
Total Are the totals correct?
Report 02. QA report � work category monitoring
The purpose of this report is for RSOs to check if the `Work Category' data is entered correctly overthe selected period. It should not be included in your annual occupational radiation report.
The report shows:
� the `Work Category' of every employee monitored over the selected dates with at least one dustsample or one radiation badge;
� which work categories are `Active'; and
� the number of employees in each and the badges/dust samples taken.
This report is useful for checking if enough sampling has been undertaken in each active `WorkCategory'.
Figure 4.4 on the following page shows the �rst page of this report.
Figure 4.5 on page 31 shows a rear page reporting employee dust samples missing Work History.
Table 4.2 lists each �eld on the report and gives its purpose.
4.2. Personal inspirable dust reports
Report 03. Personal Dust - rad/grav � by employee name
The purpose of this report is to list all personal dust sampling undertaken on employees data overthe selected period. It shows the airborne radioactivity and dust concentrations that monitored
Resources Safety, Department of Mines and Petroleum 29

Guideline NORM�7 BOSWELL � assessment and reporting database
Figure 4.4.: Report 02. QA Report � Work Category Monitoring
Work Category: Engineering Maintenance - Dry Plant Code: 4 Yes No. of Badges:No. Dust Samples:Active:
43Adams Frank
40Anderson Tobby
43Banks Cody
01Baron Red
42Buggy Brian
20Bunter Billy
30Carpent Jacob
30Cooper Jason
40Copper Mike
44Dewell Andrew
40Down Brendan
42Edwards Brad
40Flynn Ronald
02Foster Adam
20Gibson Ben
42Greenlees Jim
42Hankin Bruce (Gary)
40Kerley Dennis
41Kimptin Joel
10Lloyd Damian
02Matthews Howard
10McKenzie R
42Morrison Noel
41Nears Mick
30Newman Richard
01Nuska Ibrahim
03O'Neill B
33Panaia Vince
41Penny Mohommad
41Perks G
42Reynolds Nathan
41Taylor Philip
31Trotter Peter
43Tuffley Rob
42Watts Steve
21Williams P
02Williams peter
30Wilson P
41Windsor Peter
40Yurisich Barry
118Work Category Total 4940
Monday, 12 October 2009 Page 4 of 14
Summary for period 01/04/2006 to 31/03/200702. QA Report - Work Category Monitoring
30 Managing naturally occurring radioactive material (NORM) in mining and mineral processing

Guideline NORM�7 BOSWELL � assessment and reporting database
Figure 4.5.: Report 02. QA Report � report showing dust samples missing Work History
8 307 * 441
Grand Total:
* note : if employees work in more than one Work Category at one time, their badges may be counted in those categories.
No. of Employees:No. of Work Categories
790 *
No. of Dust Samples: No. of Badges:
Surname Firstname Work Category Sample Date Filter Number
Dust Samples without a Work History for this Work Category
Allans Mara 8A 20/12/06 NM 4917
Allans Mara 8A 06/02/07 NM 5064
Allans Mara 8A 04/05/06 NM 4667
Balourd Ryan 7A 21/02/07 NM 5123
Baron Red 4 12/07/06 NM 4816
Bickill Barbie 8A 15/03/07 NM 5226
Boucherd Frenchy 2 29/12/06 NM 4935
Boysly Ian 8A 16/01/07 NM 5004
Boysly Ian 8A 17/07/06 NM 4826
Brendans Nick 2 14/06/06 NM 4765
Campbell Donald 7D 30/11/06 NM 4849
Campbell Donald 7D 01/06/06 NM 4710
Campbell Donald 7D 08/01/07 NM 4961
Campbell Donald 7D 04/04/06 NM 4593
Ciddle Steve 8A 12/12/06 NM 4890
Ciddle Peta 8A 13/03/07 NM 5206
Collar Whitey 2 09/08/06 NM 4827
Collar Whitey 2 10/08/06 NM 4828
Collar Whitey 2 08/08/06 NM 4830
Collett Tony 2 09/01/07 NM 4968
Comb Ruth 8A 03/01/07 NM 4947
Comb Ruth 8A 12/02/07 NM 5089
Cookie Mon 2 16/05/06 NM 4697
Craighorn Mickie 2 09/01/07 NM 4967
Craighorn Mickie 2 02/02/07 NM 5051
Cullens Craig 8A 10/01/07 NM 4977
Davis Peter 2 19/12/06 NM 4910
Davis Peter 2 06/02/07 NM 5063
Dutton Jason 2 09/05/06 NM 4683
Findlay Glyn 7C 01/03/07 NM 5146
Findlay Glyn 7C 09/03/07 NM 5180
Monday, 12 October 2009 Page 11 of 14
Summary for period 01/04/2006 to 31/03/200702. QA Report - Work Category Monitoring
Resources Safety, Department of Mines and Petroleum 31
Guideline NORM�7 BOSWELL � assessment and reporting database
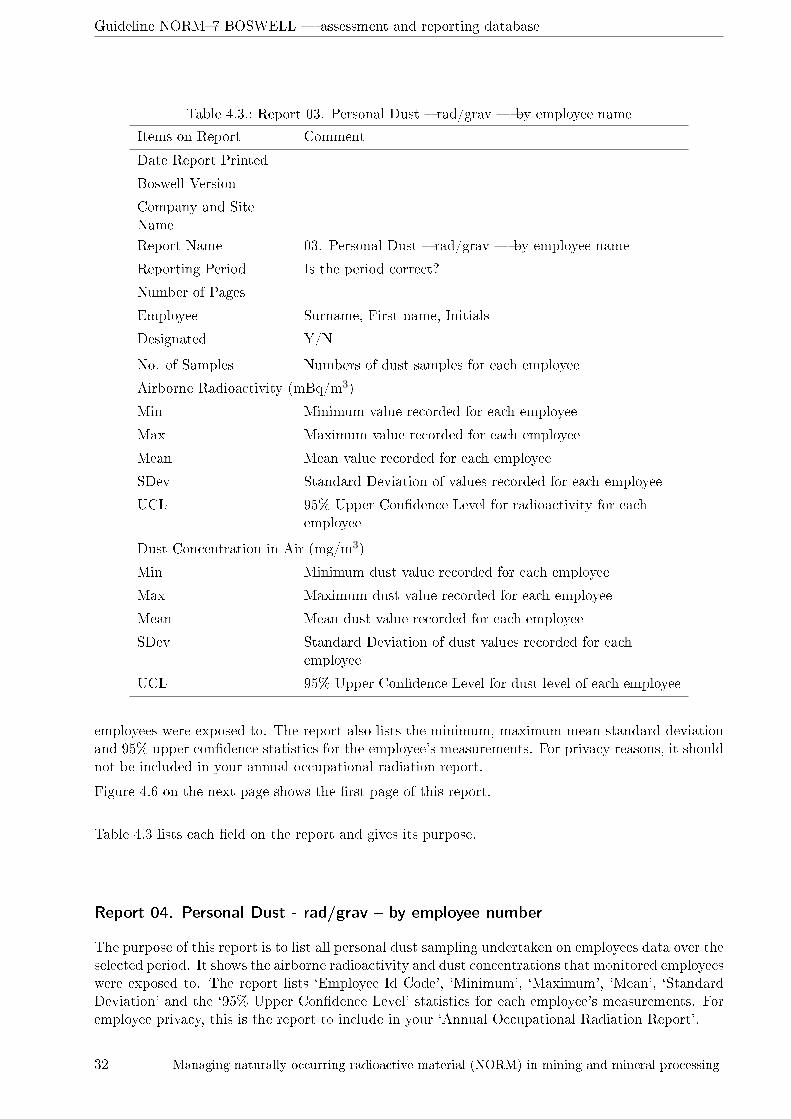
Table 4.3.: Report 03. Personal Dust � rad/grav � by employee name
Items on Report Comment
Date Report Printed
Boswell Version
Company and SiteName
Report Name 03. Personal Dust � rad/grav � by employee name
Reporting Period Is the period correct?
Number of Pages
Employee Surname, First-name, Initials
Designated Y/N
No. of Samples Numbers of dust samples for each employee
Airborne Radioactivity (mBq/m3)
Min Minimum value recorded for each employee
Max Maximum value recorded for each employee
Mean Mean value recorded for each employee
SDev Standard Deviation of values recorded for each employee
UCL 95% Upper Con�dence Level for radioactivity for eachemployee
Dust Concentration in Air (mg/m3)
Min Minimum dust value recorded for each employee
Max Maximum dust value recorded for each employee
Mean Mean dust value recorded for each employee
SDev Standard Deviation of dust values recorded for eachemployee
UCL 95% Upper Con�dence Level for dust level of each employee
employees were exposed to. The report also lists the minimum, maximum mean standard deviationand 95% upper con�dence statistics for the employee's measurements. For privacy reasons, it shouldnot be included in your annual occupational radiation report.
Figure 4.6 on the next page shows the �rst page of this report.
Table 4.3 lists each �eld on the report and gives its purpose.
Report 04. Personal Dust - rad/grav � by employee number
The purpose of this report is to list all personal dust sampling undertaken on employees data over theselected period. It shows the airborne radioactivity and dust concentrations that monitored employeeswere exposed to. The report lists `Employee Id Code', `Minimum', `Maximum', `Mean', `StandardDeviation' and the `95% Upper Con�dence Level' statistics for each employee's measurements. Foremployee privacy, this is the report to include in your `Annual Occupational Radiation Report'.
32 Managing naturally occurring radioactive material (NORM) in mining and mineral processing

Guideline NORM�7 BOSWELL � assessment and reporting database
Figure 4.6.: Report 03. Personal Dust � rad/grav � by employee name
Summary for period 01/04/2006 to 31/03/2007
Wednesday, 23 September 2009 Page 1 of 4
Blue Sky Mining Pty Ltd
Boswell Version 2M
03. Personal Dust - rad / grav - by employee name
Employee
No. of Samples Min Max Mean SDev UCL
Airborne Radioactivity (mBq/m³)
Min Max Mean SDev UCL
Dust Concentration in Air (mg/m³)
Ds.
Abbott, Peter R 8 27 1245 409 361 651 0.3 11.3 3.8 3.3 6.0D
Adams, Fred 3 42 459 218 216 583 0.5 4.4 2.1 2.0 5.5D
Allans, Mary 3 12 15 14 2 16 0.5 1.2 0.9 0.4 1.6
Ashcraft, Ian 3 32 133 67 57 164 0.1 2.2 0.9 1.2 2.9
Backshall, Ford J 2 367 712 540 244 2.2 10.6 6.4 5.9
Backsnail, Mort R 3 29 384 167 190 488 0.6 4.4 2.1 2.1 5.5
Baker, Peter 12 81 705 279 187 376 1.1 7.0 2.9 2.0 3.9D
Balourd, Ryan 1 144 144 144 1.0 1.0 1.0
Banks, Cody 3 13 112 66 50 151 1.0 1.5 1.3 0.3 1.9
Barker, Barry C 7 40 336 175 96 245 0.3 4.1 1.8 1.2 2.7D
Baron, Red 1 763 763 763 6.0 6.0 6.0
Bickill, Barbie 1 13 13 13 1.0 1.0 1.0
Bood, Dale D 5 44 1216 299 514 789 0.9 12.2 4.2 4.8 8.7
Boucherd, Frenchy E 1 14 14 14 0.3 0.3 0.3
Boysly, Ian 8 12 755 319 325 536 0.2 9.3 3.7 3.6 6.1
Brandy, John 3 13 486 174 270 629 0.3 8.2 3.0 4.6 10.6D
Brandyhan, Harry W 1 363 363 363 6.0 6.0 6.0D
Brendan, Nick L 1 16 16 16 0.3 0.3 0.3
Buggy, Brian 2 140 1143 641 709 3.5 3.8 3.7 0.2
Campbell, Donald L 4 12 60 25 23 53 0.2 0.6 0.4 0.1 0.5D
Castle, King 3 94 146 117 27 162 1.0 1.9 1.5 0.4 2.2D
Chadnick, Yirrie A 3 12 536 327 278 795 0.6 5.4 3.0 2.4 7.0D
Chapel, Robin 10 55 711 374 220 502 0.4 7.5 3.2 2.6 4.7D
Ciddle, Steve F 1 11 11 11 0.3 0.3 0.3
Ciddle, Peta 1 13 13 13 0.3 0.3 0.3
Clinchy, Kevin D 8 67 834 467 314 678 1.0 11.7 5.0 3.2 7.2D
Collar, Whitey 3 13 16 14 2 17 5.2 7.5 6.4 1.1 8.3
Collett, Tony P 1 11 11 11 0.4 0.4 0.4
Comb, Ruth 2 29 40 34 8 0.4 2.6 1.5 1.6
Cookie, Mon B 1 15 15 15 1.3 1.3 1.3
Craighorn, Mickie 2 16 20 18 3 0.7 4.5 2.6 2.7
Croswell, Travis A 4 12 232 69 108 197 0.1 2.0 0.8 0.8 1.7D
Cullens, Craig 1 12 12 12 1.2 1.2 1.2
Davis, Peter M 2 13 19 16 4 0.5 0.8 0.7 0.2
Dewell, Andrew J 4 13 134 53 55 118 0.3 2.5 0.9 1.0 2.1
Donstand, Cameron B 1 318 318 318 4.0 4.0 4.0D
Dunddie, Mike 1 434 434 434 4.3 4.3 4.3
Dutton, Jason 1 15 15 15 0.4 0.4 0.4
Edwards, Brad 2 17 2058 1037 1443 0.7 3.8 2.2 2.2D
Findlay, Glyn 2 49 182 115 94 1.5 2.0 1.8 0.4
Foster, Adam 2 22 31 27 6 0.5 0.6 0.5 0.1D
Freeman, Tony T 12 13 499 166 152 244 0.1 4.7 1.8 1.5 2.5
George, John 5 128 644 354 238 580 1.2 6.1 3.3 2.2 5.4
Gibson, Bernard K 2 231 403 317 122 4.1 6.4 5.2 1.6
Giles, Michael J 4 12 13 12 1 13 0.1 0.9 0.5 0.4 0.9
Resources Safety, Department of Mines and Petroleum 33
Guideline NORM�7 BOSWELL � assessment and reporting database
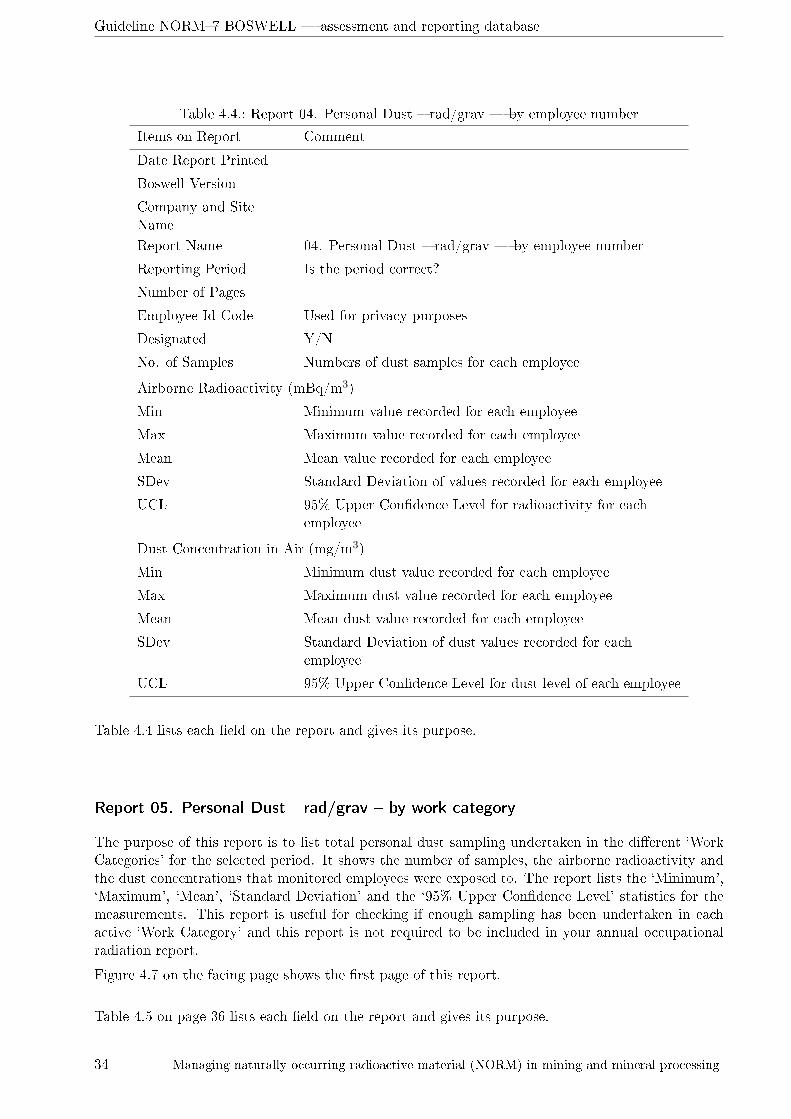
Table 4.4.: Report 04. Personal Dust � rad/grav � by employee number
Items on Report Comment
Date Report Printed
Boswell Version
Company and SiteName
Report Name 04. Personal Dust � rad/grav � by employee number
Reporting Period Is the period correct?
Number of Pages
Employee Id Code Used for privacy purposes
Designated Y/N
No. of Samples Numbers of dust samples for each employee
Airborne Radioactivity (mBq/m3)
Min Minimum value recorded for each employee
Max Maximum value recorded for each employee
Mean Mean value recorded for each employee
SDev Standard Deviation of values recorded for each employee
UCL 95% Upper Con�dence Level for radioactivity for eachemployee
Dust Concentration in Air (mg/m3)
Min Minimum dust value recorded for each employee
Max Maximum dust value recorded for each employee
Mean Mean dust value recorded for each employee
SDev Standard Deviation of dust values recorded for eachemployee
UCL 95% Upper Con�dence Level for dust level of each employee
Table 4.4 lists each �eld on the report and gives its purpose.
Report 05. Personal Dust - rad/grav � by work category
The purpose of this report is to list total personal dust sampling undertaken in the di�erent `WorkCategories' for the selected period. It shows the number of samples, the airborne radioactivity andthe dust concentrations that monitored employees were exposed to. The report lists the `Minimum',`Maximum', `Mean', `Standard Deviation' and the `95% Upper Con�dence Level' statistics for themeasurements. This report is useful for checking if enough sampling has been undertaken in eachactive `Work Category' and this report is not required to be included in your annual occupationalradiation report.
Figure 4.7 on the facing page shows the �rst page of this report.
Table 4.5 on page 36 lists each �eld on the report and gives its purpose.
34 Managing naturally occurring radioactive material (NORM) in mining and mineral processing

Guideline NORM�7 BOSWELL � assessment and reporting database
Figure 4.7.: Report 05. Personal Dust � rad/grav � by work category
Summary for period 01/04/2006 to 31/03/2007
Wednesday, 23 September 2009 Page 1 of 2
Blue Sky Mining Pty Ltd
Boswell Version 2M
No. of Samples Min Max Mean SDev UCL
Airborne Radioactivity (mBq/m³)
Min Max Mean SDev UCL
Dust Concentration in Air (mg/m³)
Work Category
05. Personal Dust - rad / grav - by work category
68 10 80 16 9 18 0.1 17.8 1.5 2.6 2.1Synthetic Rutile Plant2
49 12 2058 272 482 387 0.1 6.0 1.8 1.8 2.2Engineering Maintenance - Dry Plant
4
188 13 3084 389 333 429 0.1 23.2 4.1 3.4 4.5Dry Plant Operator7A
36 12 510 59 97 86 0.1 5.4 0.6 1.0 0.9Shift Coordinator7B
28 14 384 104 80 130 0.1 7.0 1.8 1.6 2.3Shift Services Operator7C
25 12 834 90 182 152 0.1 2.9 0.7 0.8 1.0Wet Plant Operator7D
47 11 40 15 5 16 0.1 9.4 1.6 2.3 2.2Laboratory8A
Airborne Radioactivity (mBq/m³)
0 500 1000 1500 2000 2500 3000 3500
8A Laboratory
7D Wet Plant Operator
7C Shift Services
Operator
7B Shift Coordinator
7A Dry Plant Operator
4 Engineering
Maintenance - Dry Plant
2 Synthetic Rutile Plant
Work Category
mBq/m³
Minimum Maximum Average
Total 7 441
Resources Safety, Department of Mines and Petroleum 35

Guideline NORM�7 BOSWELL � assessment and reporting database
Table 4.5.: Report 05. Personal Dust � rad/grav � by work category
Items on Report Comment
Date Report Printed
Boswell Version
Company and SiteName
Report Name 05. Personal Dust � rad/grav � by work category
Reporting Period Is the period correct?
Number of Pages
Work Category Code Code
Work CategoryDescription
Description
No. of Samples Numbers of dust samples for each work category
Airborne Radioactivity (mBq/m3)
Min Minimum value recorded for each work category
Max Maximum value recorded for each work category
Mean Mean value recorded for each work category
SDev Standard Deviation of values recorded for each workcategory
UCL 95% Upper Con�dence Level for radioactivity for each workcategory
Dust Concentration in Air (mg/m3)
Min Minimum dust value recorded for each work category
Max Maximum dust value recorded for each work category
Mean Mean dust value recorded for each work category
SDev Standard Deviation of dust values recorded for each workcategory
UCL 95% Upper Con�dence Level for dust level of each workcategory
36 Managing naturally occurring radioactive material (NORM) in mining and mineral processing

Guideline NORM�7 BOSWELL � assessment and reporting database
Report 06. Personal Dust - rad/grav � by month & work category
The purpose of this report is to list all personal dust sampling undertaken in the di�erent `WorkCategories' for each month of the selected period. It shows the number of samples taken each month,the airborne radioactivity and the dust concentrations that monitored employees were exposed to.The report lists the `Minimum', `Maximum', `Mean', `Standard Deviation' and the `95% UpperCon�dence Level' statistics for each month's measurements. These statistics are also plotted on thereport. This report should be included in your annual occupational radiation report.
Figure 4.9 on page 40 shows the two types of plots associated with this report.
Table 4.6 on page 39 lists each �eld on the report and gives its purpose.
Report 07. Personal Dust - rad/grav � 5 years & work category
The purpose of this report is to list all personal dust sampling undertaken in the di�erent `WorkCategories' for the last �ve years in relation to the selected period. It shows the number of samplestaken each year, the airborne radioactivity and the dust concentrations that monitored employeeswere exposed to. The report lists the `Minimum', `Maximum', `Mean', `Standard Deviation' andthe `95% Upper Con�dence Level' statistics for each year's measurements. These statistics are alsoplotted on the report. This report should be included in your annual occupational radiation report.
Figure 4.9 on page 40 shows the two types of plots associated with this report.
Table 4.7 on page 41 lists each �eld on the report and gives its purpose.
Report 08. Personal Dust - rad/grav � statistics
The purpose of this report is to list the total personal dust sampling undertaken over the selectedperiod. It shows the number of samples taken, the number of samples excluded such as `SpecialExposures', the airborne radioactivity and the dust concentrations that monitored employees thatwere exposed to. The report lists the `Minimum', `Maximum', `Mean', `Standard Deviation', the`95% Upper Con�dence Level' statistics and average minimum detectable level. This report shouldbe included in your `Annual Occupational Radiation Report'.
Table 4.8 on page 42 lists each �eld on the report and gives its purpose.
Resources Safety, Department of Mines and Petroleum 37
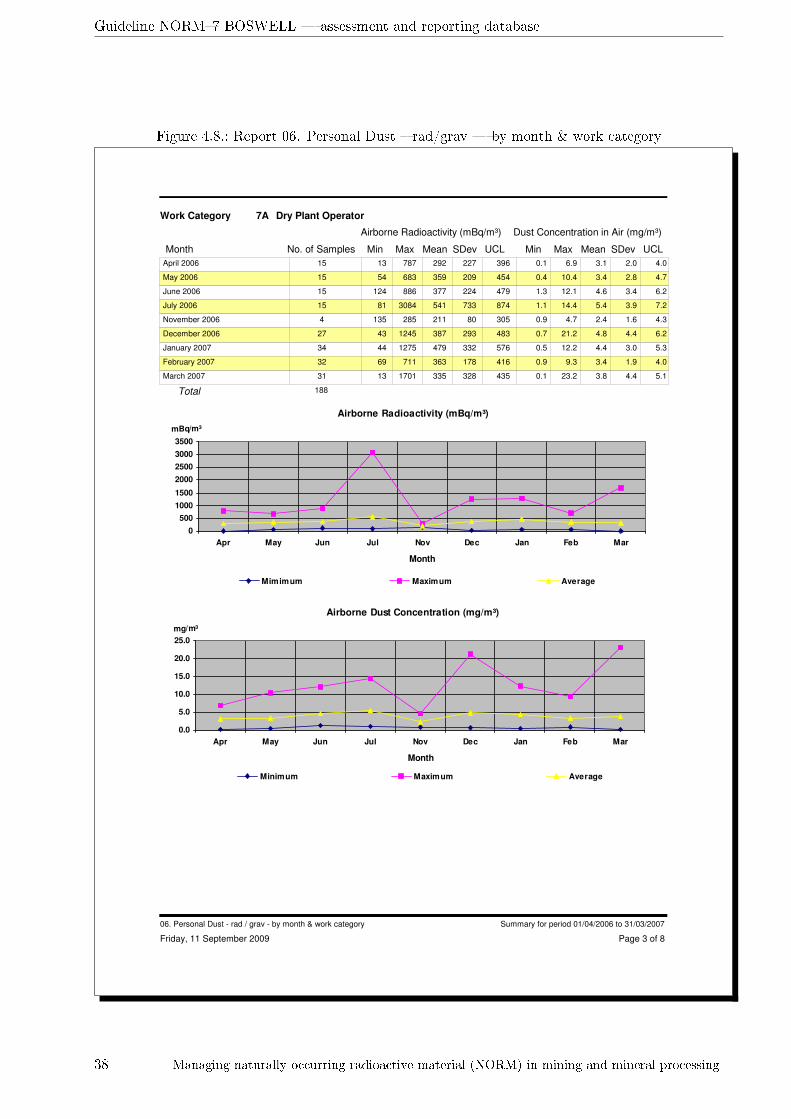
Guideline NORM�7 BOSWELL � assessment and reporting database
Figure 4.8.: Report 06. Personal Dust � rad/grav � by month & work category
Dry Plant Operator
No. of Samples Min Max Mean SDev UCL
Airborne Radioactivity (mBq/m³)
Min Max Mean SDev UCL
Dust Concentration in Air (mg/m³)
7AWork Category
Month
April 2006 15 13 787 292 227 396 0.1 6.9 3.1 2.0 4.0
May 2006 15 54 683 359 209 454 0.4 10.4 3.4 2.8 4.7
June 2006 15 124 886 377 224 479 1.3 12.1 4.6 3.4 6.2
July 2006 15 81 3084 541 733 874 1.1 14.4 5.4 3.9 7.2
November 2006 4 135 285 211 80 305 0.9 4.7 2.4 1.6 4.3
December 2006 27 43 1245 387 293 483 0.7 21.2 4.8 4.4 6.2
January 2007 34 44 1275 479 332 576 0.5 12.2 4.4 3.0 5.3
February 2007 32 69 711 363 178 416 0.9 9.3 3.4 1.9 4.0
March 2007 31 13 1701 335 328 435 0.1 23.2 3.8 4.4 5.1
Airborne Radioactivity (mBq/m³)
0
500
1000
1500
2000
2500
3000
3500
Apr May Jun Jul Nov Dec Jan Feb Mar
Month
mBq/m³
Mimimum Maximum Average
Airborne Dust Concentration (mg/m³)
0.0
5.0
10.0
15.0
20.0
25.0
Apr May Jun Jul Nov Dec Jan Feb Mar
Month
mg/m³
Minimum Maximum Average
Total 188
Friday, 11 September 2009 Page 3 of 8
Summary for period 01/04/2006 to 31/03/200706. Personal Dust - rad / grav - by month & work category
38 Managing naturally occurring radioactive material (NORM) in mining and mineral processing

Guideline NORM�7 BOSWELL � assessment and reporting database
Table 4.6.: Report 06. Personal Dust � rad/grav � by month & work category
Items on Report Comment
Date Report Printed
Boswell Version
Company and SiteName
Report Name 06. Personal Dust � rad/grav � by month & work category
Reporting Period Is the period correct?
Number of Pages
Work Category One page per category
Month Month where samples were collected
No. of Samples Numbers of dust samples for each employee during eachmonth
Airborne Radioactivity (mBq/m3)
Min Minimum value recorded for each work category
Max Maximum value recorded for each work category
Mean Mean value recorded for each work category
SDev Standard Deviation of values recorded for each workcategory
UCL 95% Upper Con�dence Level for radioactivity for each workcategory
Dust Concentration in Air (mg/m3)
Min Minimum dust value recorded for each work category
Max Maximum dust value recorded for each work category
Mean Mean dust value recorded for each work category
SDev Standard Deviation of dust values recorded for each workcategory
UCL 95% Upper Con�dence Level for dust level of each workcategory
Resources Safety, Department of Mines and Petroleum 39

Guideline NORM�7 BOSWELL � assessment and reporting database
Figure 4.9.: Report 07. Personal Dust � rad/grav � 5 years & work category
Dry Plant Operator
No. of Samples Min Max Mean SDev UCL
Airborne Radioactivity (mBq/m³)
Min Max Mean SDev UCL
Dust Concentration in Air (mg/m³)
7AWork Category
Period
2002 / 2003 145 10 3391 580 503 649 0.1 35.7 3.7 3.9 4.3
2003 / 2004 178 12 2139 419 348 462 0.1 19.4 3.1 2.8 3.4
2004 / 2005 193 10 1368 324 245 353 0.2 19.6 3.3 2.8 3.6
2005 / 2006 190 10 2021 353 302 389 0.1 27.5 4.2 4.2 4.7
2006 / 2007 188 13 3084 389 333 429 0.1 23.2 4.1 3.4 4.5
Airborne Radioactivity (mBq/m³)
0
500
1000
1500
2000
2500
3000
3500
4000
2002 / 2003 2003 / 2004 2004 / 2005 2005 / 2006 2006 / 2007
Minimum Maximum Average
Airborne Dust Concentration (mBq/m³)
0.0
5.0
10.0
15.0
20.0
25.0
30.0
35.0
40.0
2002 / 2003 2003 / 2004 2004 / 2005 2005 / 2006 2006 / 2007
Minimum Maximum Average
Friday, 11 September 2009 Page 3 of 7
Summary for period 01/04/2006 to 31/03/200707. Personal Dust - rad / grav - work categories over 5 years
40 Managing naturally occurring radioactive material (NORM) in mining and mineral processing
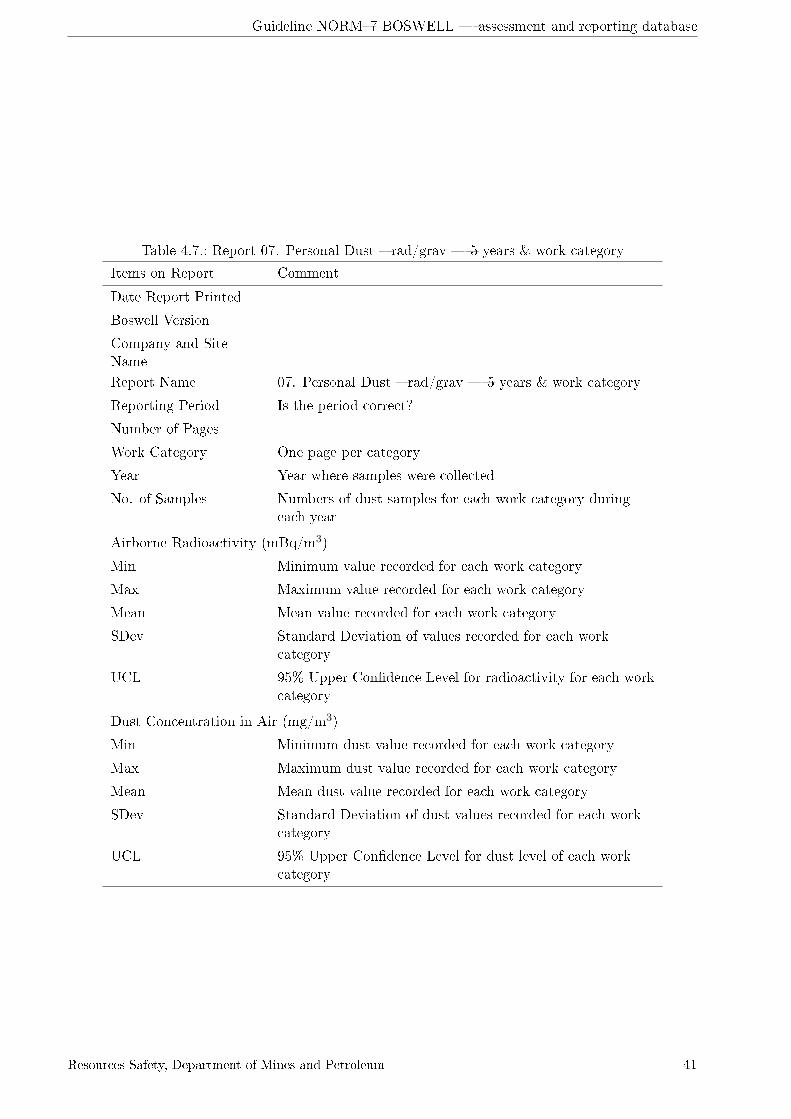
Guideline NORM�7 BOSWELL � assessment and reporting database
Table 4.7.: Report 07. Personal Dust � rad/grav � 5 years & work category
Items on Report Comment
Date Report Printed
Boswell Version
Company and SiteName
Report Name 07. Personal Dust � rad/grav � 5 years & work category
Reporting Period Is the period correct?
Number of Pages
Work Category One page per category
Year Year where samples were collected
No. of Samples Numbers of dust samples for each work category duringeach year
Airborne Radioactivity (mBq/m3)
Min Minimum value recorded for each work category
Max Maximum value recorded for each work category
Mean Mean value recorded for each work category
SDev Standard Deviation of values recorded for each workcategory
UCL 95% Upper Con�dence Level for radioactivity for each workcategory
Dust Concentration in Air (mg/m3)
Min Minimum dust value recorded for each work category
Max Maximum dust value recorded for each work category
Mean Mean dust value recorded for each work category
SDev Standard Deviation of dust values recorded for each workcategory
UCL 95% Upper Con�dence Level for dust level of each workcategory
Resources Safety, Department of Mines and Petroleum 41

Guideline NORM�7 BOSWELL � assessment and reporting database
Table 4.8.: Report 08. Personal Dust � rad/grav � statistics
Items on Report Comment
Date Report Printed
Boswell Version
Company and SiteName
Report Name 08. Personal Dust � rad/grav � statistics
Reporting Period Is the period correct?
Number of Pages
Number of SpecialExposures
Number of exposures excluded from the statistics
Number of otheractivity samples
Number of other exposures excluded from the statistics
No. of Samples Number of dust samples during selected period
Airborne Radioactivity (mBq/m3) and Dust Concentration in Air (mg/m3)
Minimum concentration Minimum value recorded for each sample
Maximumconcentration
Maximum value recorded for each sample
Mean concentration Mean value recorded for each sample
Standard deviation Standard Deviation of values recorded for each sample
Upper con�dence level 95% Upper Con�dence Level for radioactivity for eachsample
Average minimumdetectable level
42 Managing naturally occurring radioactive material (NORM) in mining and mineral processing
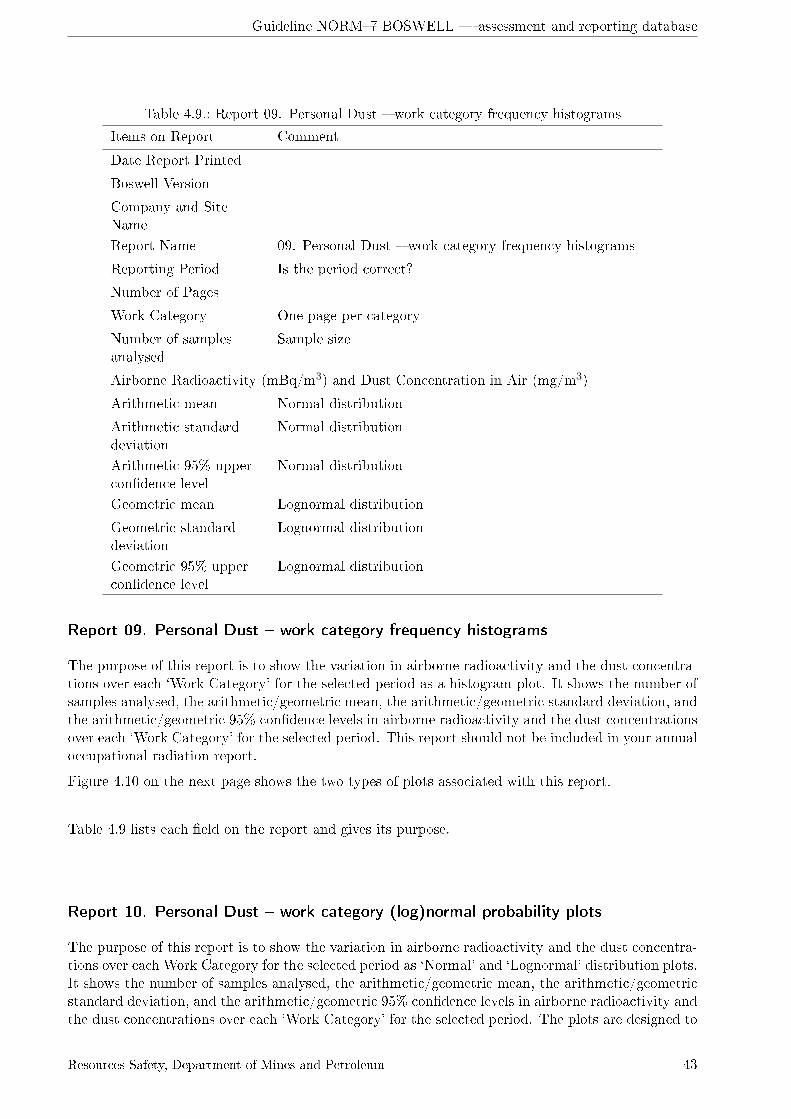
Guideline NORM�7 BOSWELL � assessment and reporting database
Table 4.9.: Report 09. Personal Dust � work category frequency histograms
Items on Report Comment
Date Report Printed
Boswell Version
Company and SiteName
Report Name 09. Personal Dust � work category frequency histograms
Reporting Period Is the period correct?
Number of Pages
Work Category One page per category
Number of samplesanalysed
Sample size
Airborne Radioactivity (mBq/m3) and Dust Concentration in Air (mg/m3)
Arithmetic mean Normal distribution
Arithmetic standarddeviation
Normal distribution
Arithmetic 95% uppercon�dence level
Normal distribution
Geometric mean Lognormal distribution
Geometric standarddeviation
Lognormal distribution
Geometric 95% uppercon�dence level
Lognormal distribution
Report 09. Personal Dust � work category frequency histograms
The purpose of this report is to show the variation in airborne radioactivity and the dust concentra-tions over each `Work Category' for the selected period as a histogram plot. It shows the number ofsamples analysed, the arithmetic/geometric mean, the arithmetic/geometric standard deviation, andthe arithmetic/geometric 95% con�dence levels in airborne radioactivity and the dust concentrationsover each `Work Category' for the selected period. This report should not be included in your annualoccupational radiation report.
Figure 4.10 on the next page shows the two types of plots associated with this report.
Table 4.9 lists each �eld on the report and gives its purpose.
Report 10. Personal Dust � work category (log)normal probability plots
The purpose of this report is to show the variation in airborne radioactivity and the dust concentra-tions over each Work Category for the selected period as `Normal' and `Lognormal' distribution plots.It shows the number of samples analysed, the arithmetic/geometric mean, the arithmetic/geometricstandard deviation, and the arithmetic/geometric 95% con�dence levels in airborne radioactivity andthe dust concentrations over each `Work Category' for the selected period. The plots are designed to
Resources Safety, Department of Mines and Petroleum 43
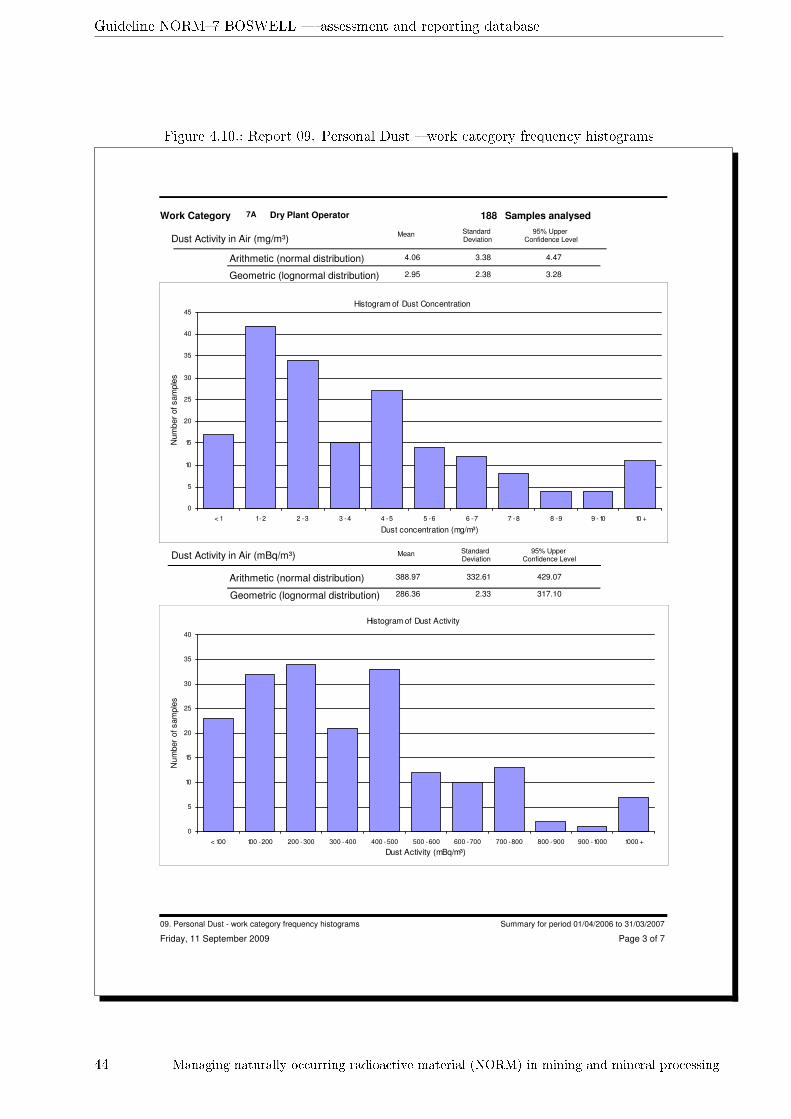
Guideline NORM�7 BOSWELL � assessment and reporting database
Figure 4.10.: Report 09. Personal Dust � work category frequency histograms
Dry Plant OperatorWork Category 7A 188 Samples analysed
Histogram of Dust Activity
0
5
10
15
20
25
30
35
40
< 100 100 - 200 200 - 300 300 - 400 400 - 500 500 - 600 600 - 700 700 - 800 800 - 900 900 - 1000 1000 +
Dust Activity (mBq/m³)
Num
ber
of sam
ple
s
Histogram of Dust Concentration
0
5
10
15
20
25
30
35
40
45
< 1 1 - 2 2 - 3 3 - 4 4 - 5 5 - 6 6 - 7 7 - 8 8 - 9 9 - 10 10 +
Dust concentration (mg/m³)
Num
ber
of sam
ple
s
Dust Activity in Air (mg/m³)Mean Standard
Deviation95% Upper
Confidence Level
4.06 3.38 4.47
2.95 2.38 3.28
Arithmetic (normal distribution)
Geometric (lognormal distribution)
Dust Activity in Air (mBq/m³) Mean Standard Deviation
95% Upper Confidence Level
388.97 332.61 429.07
286.36 2.33 317.10
Arithmetic (normal distribution)
Geometric (lognormal distribution)
Friday, 11 September 2009 Page 3 of 7
Summary for period 01/04/2006 to 31/03/200709. Personal Dust - work category frequency histograms
44 Managing naturally occurring radioactive material (NORM) in mining and mineral processing
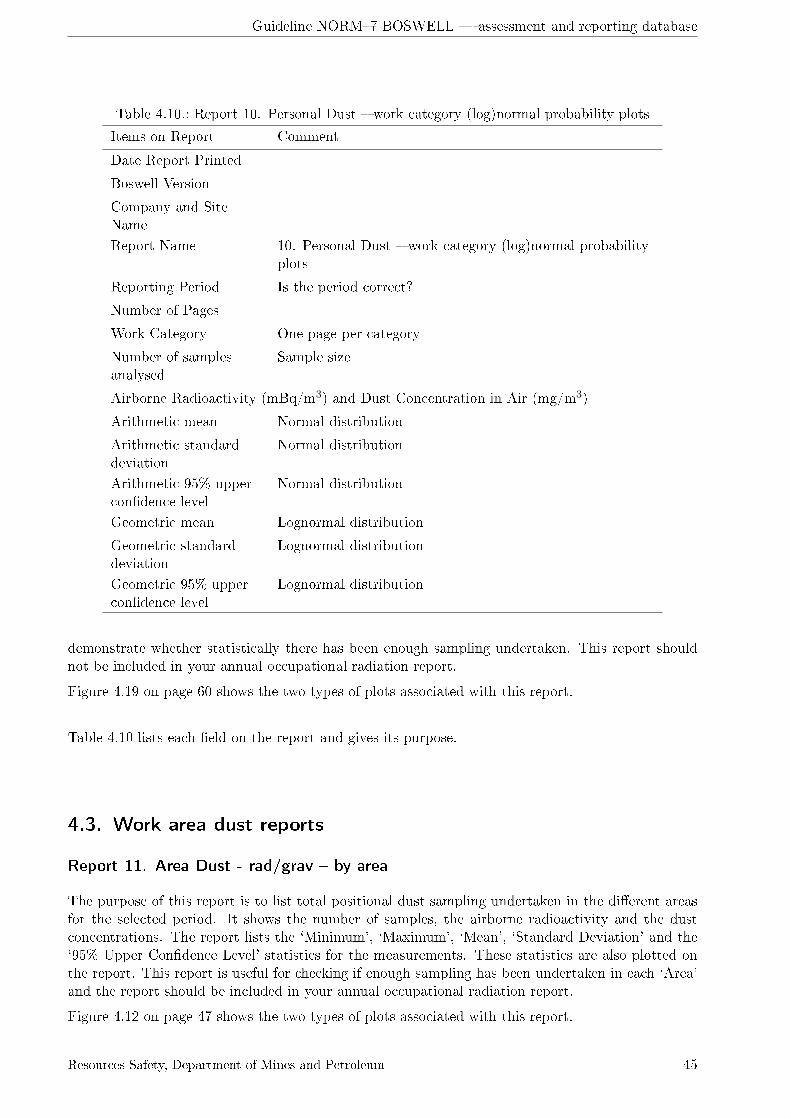
Guideline NORM�7 BOSWELL � assessment and reporting database
Table 4.10.: Report 10. Personal Dust � work category (log)normal probability plots
Items on Report Comment
Date Report Printed
Boswell Version
Company and SiteName
Report Name 10. Personal Dust � work category (log)normal probabilityplots
Reporting Period Is the period correct?
Number of Pages
Work Category One page per category
Number of samplesanalysed
Sample size
Airborne Radioactivity (mBq/m3) and Dust Concentration in Air (mg/m3)
Arithmetic mean Normal distribution
Arithmetic standarddeviation
Normal distribution
Arithmetic 95% uppercon�dence level
Normal distribution
Geometric mean Lognormal distribution
Geometric standarddeviation
Lognormal distribution
Geometric 95% uppercon�dence level
Lognormal distribution
demonstrate whether statistically there has been enough sampling undertaken. This report shouldnot be included in your annual occupational radiation report.
Figure 4.19 on page 60 shows the two types of plots associated with this report.
Table 4.10 lists each �eld on the report and gives its purpose.
4.3. Work area dust reports
Report 11. Area Dust - rad/grav � by area
The purpose of this report is to list total positional dust sampling undertaken in the di�erent areasfor the selected period. It shows the number of samples, the airborne radioactivity and the dustconcentrations. The report lists the `Minimum', `Maximum', `Mean', `Standard Deviation' and the`95% Upper Con�dence Level' statistics for the measurements. These statistics are also plotted onthe report. This report is useful for checking if enough sampling has been undertaken in each `Area'and the report should be included in your annual occupational radiation report.
Figure 4.12 on page 47 shows the two types of plots associated with this report.
Resources Safety, Department of Mines and Petroleum 45

Guideline NORM�7 BOSWELL � assessment and reporting database
Figure 4.11.: Report 10. Personal Dust � work category (log)normal probability plots
Dry Plant OperatorWork Category 7A 188 Samples analysed
Dust in Air (mg/m³)Mean Standard
Deviation95% Upper
Confidence Level
4.06 3.38 4.47
2.95 2.38 3.28
Arithmetic (normal distribution)
Geometric (lognormal distribution)
Dust Activity in Air (mBq/m³) Mean Standard Deviation
95% Upper Confidence Level
388.97 332.61 429.07
286.36 2.33 317.10
Arithmetic (normal distribution)
Geometric (lognormal distribution)
Number of MDL Substitutes used
0
Linear Probability Plot and Least-Squares Best-Fit
Line
10
75
50
2516
521
9998959084
0 5 10 15 20
Dust in Air (mg/m³)
Cum
ula
tive F
requency %
Linear Probability Plot and Least-Squares Best-Fit
Line
10
75
50
2516
521
9998959084
0 200 400 600 800 1000 1200
Dust Activity in Air (mBq/m³)
Cum
ula
tive F
requency %
Logprobability Plot and Least-Squares Best-Fit Line
75
50
25161052
84
99989590
0 1 10 100 1000 10000
Dust Activity in Air (mBq/m³)
Cum
ula
tive F
requency %
Logprobability Plot and Least-Squares Best-Fit Line
75
50
25161052
84
99989590
0 1 10 100
Dust in Air (mBq/m³)
Cum
ula
tive F
requency %
Friday, 11 September 2009 Page 3 of 7
Summary for period 01/04/2006 to 31/03/200710. Personal Dust - work category (log)normal probability plots
46 Managing naturally occurring radioactive material (NORM) in mining and mineral processing

Guideline NORM�7 BOSWELL � assessment and reporting database
Figure 4.12.: Report 11. Area Dust � rad/grav � by area, page 1
Summary for period 01/04/2006 to 31/03/2007
Tuesday, 15 September 2009 Page 1 of 3
Blue Sky Mining Pty Ltd
Boswell Version 2M
No. of Samples Min Max Mean SDev UCL
Airborne Radioactivity (mBq/m³)
Min Max Mean SDev UCL
Dust Concentration in Air (mg/m³)
Area
11. Area Dust - radiometric / gravimetric
57 13 994 318 251 374 0.1 6.9 2.2 1.8 2.6Dry Separation plant 1
47 56 1065 209 167 250 0.6 10.2 3.5 2.2 4.0Dry separation plant 2
24 11 157 37 35 49 0.1 2.3 0.4 0.5 0.6Other locations
41 12 690 291 162 334 0.7 13.2 4.3 3.3 5.1Plant 1 - RDR Section
27 10 17 13 2 14 0.1 13.9 1.2 2.6 2.0Synthetic Rutile Plant
Resources Safety, Department of Mines and Petroleum 47

Guideline NORM�7 BOSWELL � assessment and reporting database
Figure 4.13.: Report 11. Area Dust � rad/grav � by area, page 2
Airborne Radioactivity (mBq/m³)
0 200 400 600 800 1000 1200
Dry Separation plant 1
Dry separation plant 2
Other locations
Plant 1 - RDR Section
Synthetic Rutile Plant
Area
mBq/m³
Minimum Maximum Average
Tuesday, 15 September 2009 Page 2 of 3
Summary for period 01/04/2006 to 31/03/200711. Area Dust - radiometric / gravimetric
48 Managing naturally occurring radioactive material (NORM) in mining and mineral processing
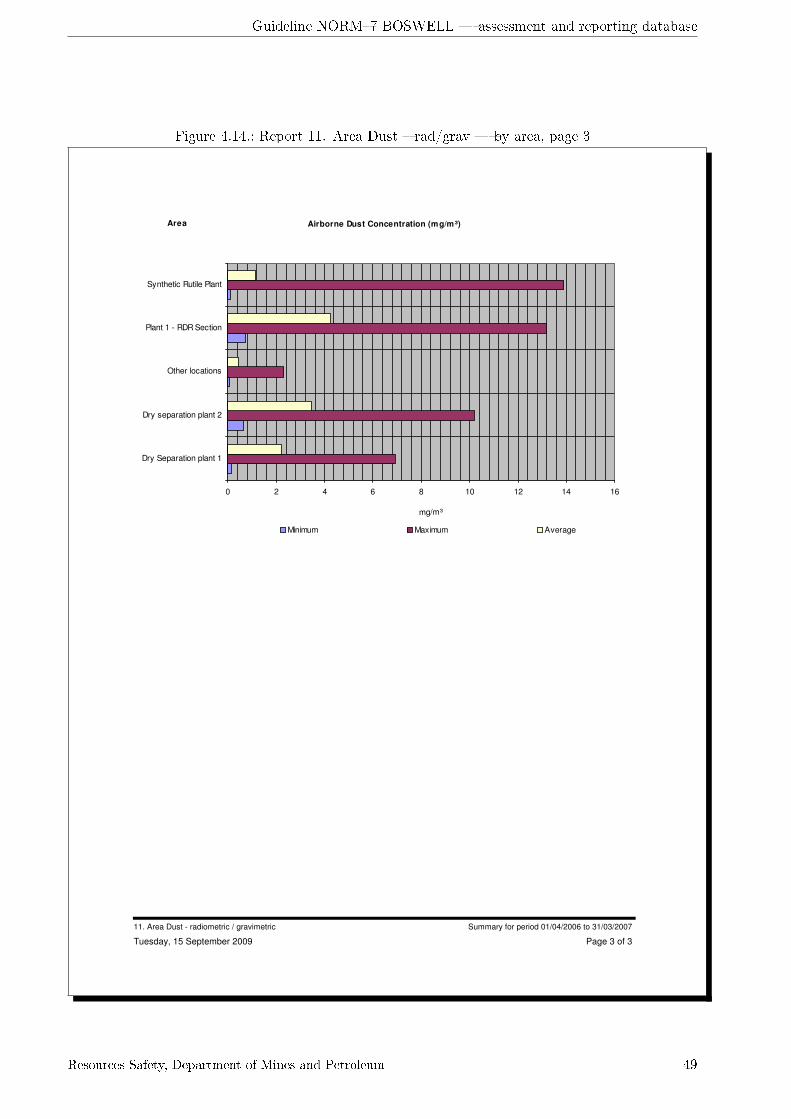
Guideline NORM�7 BOSWELL � assessment and reporting database
Figure 4.14.: Report 11. Area Dust � rad/grav � by area, page 3
Airborne Dust Concentration (mg/m³)
0 2 4 6 8 10 12 14 16
Dry Separation plant 1
Dry separation plant 2
Other locations
Plant 1 - RDR Section
Synthetic Rutile Plant
Area
mg/m³
Minimum Maximum Average
Tuesday, 15 September 2009 Page 3 of 3
Summary for period 01/04/2006 to 31/03/200711. Area Dust - radiometric / gravimetric
Resources Safety, Department of Mines and Petroleum 49

Guideline NORM�7 BOSWELL � assessment and reporting database
Table 4.11.: Report 11. Area Dust � rad/grav � by area
Items on Report Comment
Date Report Printed
Boswell Version
Company and SiteName
Report Name 11. Area Dust � rad/grav � by area
Reporting Period Is the period correct?
Number of Pages
Area Location of positional sample
No. of Samples Numbers of dust samples for each area
Airborne Radioactivity (mBq/m3)
Min Minimum value recorded for each area
Max Maximum value recorded for each area
Mean Mean value recorded for each area
SDev Standard Deviation of values recorded for each area
UCL 95% Upper Con�dence Level for radioactivity for each area
Dust Concentration in Air (mg/m3)
Min Minimum dust value recorded for each area
Max Maximum dust value recorded for each area
Mean Mean dust value recorded for each area
SDev Standard Deviation of dust values recorded for each area
UCL 95% Upper Con�dence Level for dust level of each area
This report plots bar graphs of the maximum, minimum and average values for the dust concentrationand dust activity of each area.
Table 4.11 lists each �eld on the report and gives its purpose.
Report 12. Area Dust - rad/grav � by month & area
The purpose of this report is to list all personal dust sampling undertaken in Areas for each month ofthe selected period. It shows the number of samples taken each month, the airborne radioactivity andthe dust concentrations in the `Area'. The report lists the `Minimum', `Maximum', `Mean', `StandardDeviation' and the `95% Upper Con�dence Level' statistics for each month's measurements. Thesestatistics are also plotted on the report. This report should be included in your `Annual OccupationalRadiation Report'.
Figure 4.15 on the next page shows the two types of plots associated with this report.
Table 4.12 on page 52 lists each �eld on the report and gives its purpose.
50 Managing naturally occurring radioactive material (NORM) in mining and mineral processing

Guideline NORM�7 BOSWELL � assessment and reporting database
Figure 4.15.: Report 12. Area Dust � rad/grav � by month & area
Dry Separation plant 1
No. of Samples Min Max Mean SDev UCL
Airborne Radioactivity (mBq/m³)
Min Max Mean SDev UCL
Dust Concentration in Air (mg/m³)
PL.Area
Month
April 2006 7 101 875 369 274 570 1.0 5.5 2.3 1.6 3.5
May 2006 7 64 892 421 276 623 0.6 4.5 2.0 1.3 2.9
June 2006 7 243 908 431 227 597 1.7 4.9 3.3 1.1 4.1
July 2006 8 16 481 215 158 321 0.2 6.7 3.1 2.7 4.9
November 2006 5 73 294 200 89 285 0.2 1.0 0.6 0.3 0.9
December 2006 2 128 200 164 51 1.9 2.3 2.1 0.3
January 2007 7 161 994 462 357 725 0.1 6.9 2.9 2.6 4.8
February 2007 7 119 592 217 167 340 0.8 3.1 1.3 0.8 1.9
March 2007 7 13 906 259 297 477 0.2 3.1 1.6 1.0 2.3
Airborne Radioactivity (mBq/m³)
0
200
400
600
800
1000
1200
Apr May Jun Jul Nov Dec Jan Feb Mar
Month
mBq/m³
Mimimum Maximum Average
Airborne Dust Concentration (mg/m³)
0.0
1.0
2.0
3.0
4.0
5.0
6.0
7.0
8.0
Apr May Jun Jul Nov Dec Jan Feb Mar
Month
mg/m³
Minimum Maximum Average
Friday, 11 September 2009 Page 3 of 5
Summary for period 01/04/2006 to 31/03/200712. Area Dust - rad / grav - by month & area
Resources Safety, Department of Mines and Petroleum 51

Guideline NORM�7 BOSWELL � assessment and reporting database
Table 4.12.: Report 12. Area Dust � rad/grav � by month & area
Items on Report Comment
Date Report Printed
Boswell Version
Company and SiteName
Report Name 12. Area Dust � rad/grav � by month & area
Reporting Period Is the period correct?
Number of Pages
Area One page per area
Month Month where samples were collected
No. of Samples Numbers of dust samples for each area during each month
Airborne Radioactivity (mBq/m3)
Min Minimum value recorded for each area
Max Maximum value recorded for each area
Mean Mean value recorded for each area
SDev Standard Deviation of values recorded for each area
UCL 95% Upper Con�dence Level for radioactivity for each area
Dust Concentration in Air (mg/m3)
Min Minimum dust value recorded for each area
Max Maximum dust value recorded for each area
Mean Mean dust value recorded for each area
SDev Standard Deviation of dust values recorded for each area
UCL 95% Upper Con�dence Level for dust level of each area
52 Managing naturally occurring radioactive material (NORM) in mining and mineral processing
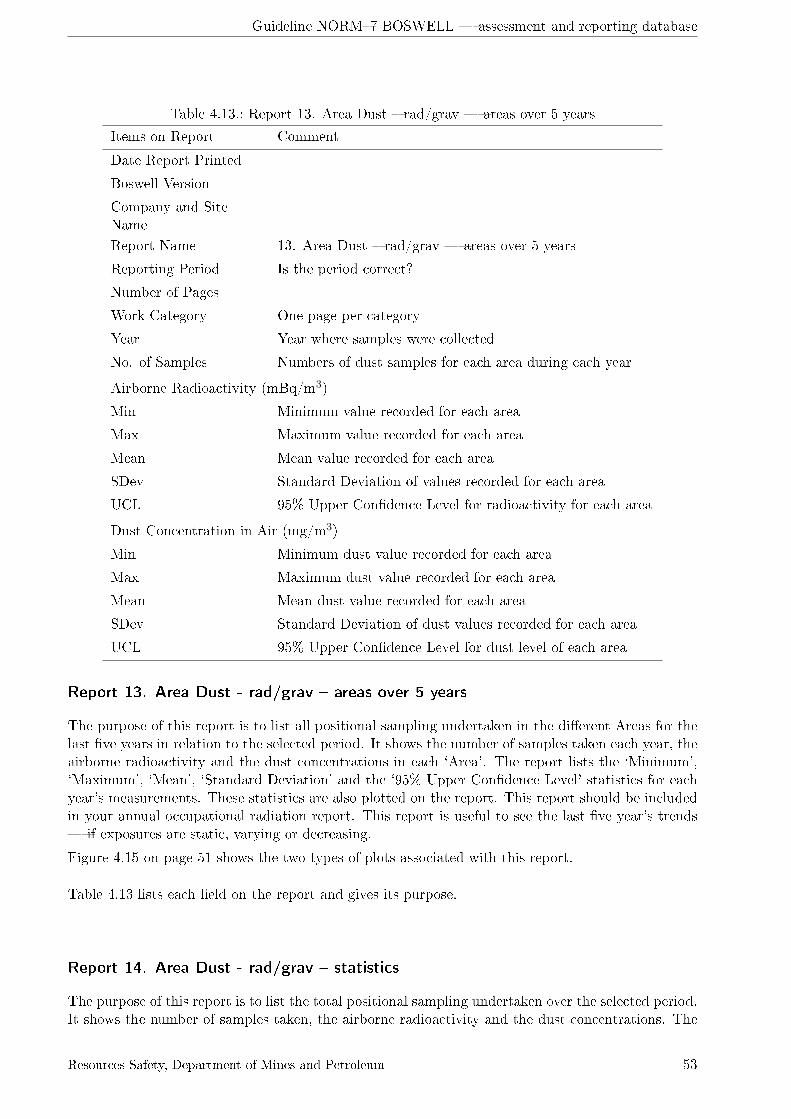
Guideline NORM�7 BOSWELL � assessment and reporting database
Table 4.13.: Report 13. Area Dust � rad/grav � areas over 5 years
Items on Report Comment
Date Report Printed
Boswell Version
Company and SiteName
Report Name 13. Area Dust � rad/grav � areas over 5 years
Reporting Period Is the period correct?
Number of Pages
Work Category One page per category
Year Year where samples were collected
No. of Samples Numbers of dust samples for each area during each year
Airborne Radioactivity (mBq/m3)
Min Minimum value recorded for each area
Max Maximum value recorded for each area
Mean Mean value recorded for each area
SDev Standard Deviation of values recorded for each area
UCL 95% Upper Con�dence Level for radioactivity for each area
Dust Concentration in Air (mg/m3)
Min Minimum dust value recorded for each area
Max Maximum dust value recorded for each area
Mean Mean dust value recorded for each area
SDev Standard Deviation of dust values recorded for each area
UCL 95% Upper Con�dence Level for dust level of each area
Report 13. Area Dust - rad/grav � areas over 5 years
The purpose of this report is to list all positional sampling undertaken in the di�erent Areas for thelast �ve years in relation to the selected period. It shows the number of samples taken each year, theairborne radioactivity and the dust concentrations in each `Area'. The report lists the `Minimum',`Maximum', `Mean', `Standard Deviation' and the `95% Upper Con�dence Level' statistics for eachyear's measurements. These statistics are also plotted on the report. This report should be includedin your annual occupational radiation report. This report is useful to see the last �ve year's trends� if exposures are static, varying or decreasing.
Figure 4.15 on page 51 shows the two types of plots associated with this report.
Table 4.13 lists each �eld on the report and gives its purpose.
Report 14. Area Dust - rad/grav � statistics
The purpose of this report is to list the total positional sampling undertaken over the selected period.It shows the number of samples taken, the airborne radioactivity and the dust concentrations. The
Resources Safety, Department of Mines and Petroleum 53

Guideline NORM�7 BOSWELL � assessment and reporting database
Figure 4.16.: Report 13. Area Dust � rad/grav � areas over 5 years
Dry separation plant 2
No. of Samples Min Max Mean SDev UCL
Airborne Radioactivity (mBq/m³)
Min Max Mean SDev UCL
Dust Concentration in Air (mg/m³)
PL.Area
Period
2006 / 2007 47 56 1065 209 167 250 0.6 10.2 3.5 2.2 4.0
2005 / 2006 129 10 719 170 123 188 0.1 16.3 3.1 3.1 3.6
2004 / 2005 123 13 1247 235 194 264 0.5 19.9 3.4 3.4 4.0
2003 / 2004 56 40 421 176 97 198 0.5 4.0 1.5 0.7 1.6
2002 / 2003 24 174 628 351 145 401 0.5 5.4 2.3 1.4 2.8
Airborne Radioactivity (mBq/m³)
0
200
400
600
800
1000
1200
1400
2002 / 2003 2003 / 2004 2004 / 2005 2005 / 2006 2006 / 2007
Minimum Maximum Average
Airborne Dust Concentration (mg/m³)
0.0
5.0
10.0
15.0
20.0
25.0
2002 / 2003 2003 / 2004 2004 / 2005 2005 / 2006 2006 / 2007
Minimum Maximum Average
Friday, 11 September 2009 Page 2 of 7
Summary for period 01/04/2006 to 31/03/200713. Area Dust - rad / grav - areas over 5 years
54 Managing naturally occurring radioactive material (NORM) in mining and mineral processing

Guideline NORM�7 BOSWELL � assessment and reporting database
Table 4.14.: Report 14. Area Dust � rad/grav � statistics
Items on Report Comment
Date Report Printed
Boswell Version
Company and SiteName
Report Name 14. Area Dust � rad/grav � statistics
Reporting Period Is the period correct?
Number of Pages
No. of Samples Number of dust samples during selected period
Airborne Radioactivity (mBq/m3) and Dust Concentration in Air (mg/m3)
Minimum concentration Minimum value recorded for each sample
Maximumconcentration
Maximum value recorded for each sample
Mean concentration Mean value recorded for each sample
Standard deviation Standard Deviation of values recorded for each sample
Upper con�dence level 95% Upper Con�dence Level for radioactivity for eachsample
Average minimumdetectable level
report lists the `Minimum', `Maximum', `Mean', `Standard Deviation', the `95% Upper Con�denceLevel' statistics and average minimum detectable level. This report should be included in your`Annual Occupational Radiation Report'.
Figure 4.17 on the next page shows a typical statistical report.
Table 4.14 lists each �eld on the report and gives its purpose.
Report 15. Area Dust � area frequency histograms
The purpose of this report is to show the variation in airborne radioactivity and the dust concentra-tions over each Area for the selected period as a histogram plot. It shows the number of samples ana-lysed, the arithmetic/geometric mean, the arithmetic/geometric standard deviation, and the arith-metic/geometric 95% con�dence levels in airborne radioactivity and the dust concentrations overeach Area for the selected period. This report should not be included in your annual occupationalradiation report.
Figure 4.18 on page 57 shows the two types of plots associated with this report.
This report plots histograms of the dust concentration and dust activity.
Table 4.15 on page 58 lists each �eld on the report and gives its purpose.
Resources Safety, Department of Mines and Petroleum 55

Guideline NORM�7 BOSWELL � assessment and reporting database
Figure 4.17.: Report 14. Area Dust � rad/grav � statistics
Summary for period 01/04/2006 to 31/03/2007
Monday, 12 October 2009 Page 1 of 1
Blue Sky Mining Pty Ltd
Boswell Version 2M
14. Area Dust - rad / grav - statistics
Airborne Radioactivity
(mBq/m³)
Dust Concentration in
Air (mg/m³)
Number of Samples: 196
Minimum concentration: 10
Maximum concentration: 1065
Mean concentration: 210
Standard deviation: 210
Upper confidence level 235
0.1
13.9
2.6
2.6
2.9
Average minimum detectable level: 14
196
13.9
56 Managing naturally occurring radioactive material (NORM) in mining and mineral processing

Guideline NORM�7 BOSWELL � assessment and reporting database
Figure 4.18.: Report 15. Area Dust � area frequency histograms
Dry separation plant 2Area PL.2 47 Samples analysed
Histogram of Dust Activity
0
5
10
15
20
25
< 100 100 - 200 200 - 300 300 - 400 400 - 500 500 - 600 600 - 700 700 - 800 800 - 900 900 - 1000 1000 +
Dust Activity (mBq/m³)
Num
ber
of sam
ple
s
Histogram of Dust Concentration
0
2
4
6
8
10
12
< 1 1 - 2 2 - 3 3 - 4 4 - 5 5 - 6 6 - 7 7 - 8 8 - 9 9 - 10 10 +
Dust concentration (mg/m³)
Num
ber
of sam
ple
s
Dust Activity in Air (mg/m³)Mean Standard
Deviation95% Upper
Confidence Level
3.46 2.21 4.01
2.82 1.95 3.32
Arithmetic (normal distribution)
Geometric (lognormal distribution)
Dust Activity in Air (mBq/m³) Mean Standard Deviation
95% Upper Confidence Level
208.96 166.60 249.75
174.24 1.76 200.04
Arithmetic (normal distribution)
Geometric (lognormal distribution)
Friday, 11 September 2009 Page 4 of 5
Summary for period 01/04/2006 to 31/03/200715. Area Dust - area frequency histograms
Resources Safety, Department of Mines and Petroleum 57

Guideline NORM�7 BOSWELL � assessment and reporting database
Table 4.15.: Report 15. Area Dust � area frequency histograms
Items on Report Comment
Date Report Printed
Boswell Version
Company and SiteName
Report Name 15. Area Dust � area frequency histograms
Reporting Period Is the period correct?
Number of Pages
Area One page per area
Number of samplesanalysed
Sample size
Airborne Radioactivity (mBq/m3) and Dust Concentration in Air (mg/m3)
Arithmetic mean Normal distribution
Arithmetic standarddeviation
Normal distribution
Arithmetic 95% uppercon�dence level
Normal distribution
Geometric mean Lognormal distribution
Geometric standarddeviation
Lognormal distribution
Geometric 95% uppercon�dence level
Lognormal distribution
58 Managing naturally occurring radioactive material (NORM) in mining and mineral processing
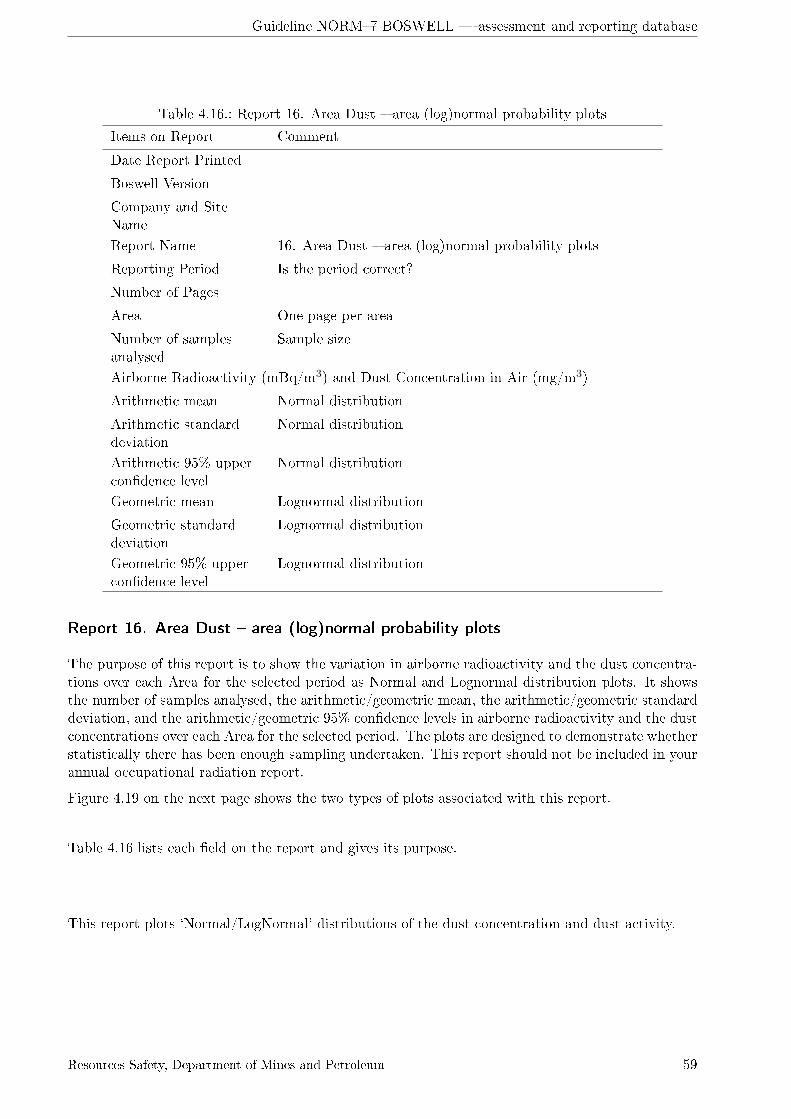
Guideline NORM�7 BOSWELL � assessment and reporting database
Table 4.16.: Report 16. Area Dust � area (log)normal probability plots
Items on Report Comment
Date Report Printed
Boswell Version
Company and SiteName
Report Name 16. Area Dust � area (log)normal probability plots
Reporting Period Is the period correct?
Number of Pages
Area One page per area
Number of samplesanalysed
Sample size
Airborne Radioactivity (mBq/m3) and Dust Concentration in Air (mg/m3)
Arithmetic mean Normal distribution
Arithmetic standarddeviation
Normal distribution
Arithmetic 95% uppercon�dence level
Normal distribution
Geometric mean Lognormal distribution
Geometric standarddeviation
Lognormal distribution
Geometric 95% uppercon�dence level
Lognormal distribution
Report 16. Area Dust � area (log)normal probability plots
The purpose of this report is to show the variation in airborne radioactivity and the dust concentra-tions over each Area for the selected period as Normal and Lognormal distribution plots. It showsthe number of samples analysed, the arithmetic/geometric mean, the arithmetic/geometric standarddeviation, and the arithmetic/geometric 95% con�dence levels in airborne radioactivity and the dustconcentrations over each Area for the selected period. The plots are designed to demonstrate whetherstatistically there has been enough sampling undertaken. This report should not be included in yourannual occupational radiation report.
Figure 4.19 on the next page shows the two types of plots associated with this report.
Table 4.16 lists each �eld on the report and gives its purpose.
This report plots `Normal/LogNormal' distributions of the dust concentration and dust activity.
Resources Safety, Department of Mines and Petroleum 59

Guideline NORM�7 BOSWELL � assessment and reporting database
Figure 4.19.: Report 16. Area Dust � area (log)normal probability plots
Dry separation plant 2Area PL.2 47 Samples analysed
Dust Activity in Air (mg/m³)Mean Standard
Deviation95% Upper
Confidence Level
3.46 2.21 4.01
2.82 1.95 3.32
Arithmetic (normal distribution)
Geometric (lognormal distribution)
Dust Activity in Air (mBq/m³) Mean Standard Deviation
95% Upper Confidence Level
208.96 166.60 249.75
174.24 1.76 200.04
Arithmetic (normal distribution)
Geometric (lognormal distribution)
Number of MDL Substitutes used
0
Linear Probability Plot and Least-Squares Best-Fit
Line
10
75
50
2516
521
9998959084
0 5 10 15 20
Dust in Air (mg/m³)
Cum
ula
tive F
requency %
Logprobability Plot and Least-Squares Best-Fit Line
75
50
25161052
84
99989590
0 1 10 100
Dust in Air (mBq/m³)
Cum
ula
tive F
requency %
Linear Probability Plot and Least-Squares Best-Fit
Line
10
75
50
2516
521
9998959084
0 200 400 600 800 1000 1200
Dust Activity in Air (mBq/m³)
Cum
ula
tive F
requency %
Logprobability Plot and Least-Squares Best-Fit Line
75
50
25161052
84
99989590
0 1 10 100 1000 10000
Dust Activity in Air (mBq/m³)
Cum
ula
tive F
requency %
Friday, 11 September 2009 Page 4 of 5
Summary for period 01/04/2006 to 31/03/200716. Area Dust - area (log)normal probability plots
60 Managing naturally occurring radioactive material (NORM) in mining and mineral processing

Guideline NORM�7 BOSWELL � assessment and reporting database
Table 4.17.: Report 17. External Exposure � by employee name
Items on Report Comment
Date Report Printed
Boswell Version
Company and SiteName
Report Name 17. External Exposure � by employee name
Reporting Period Is the period correct?
Number of Pages
Employee Name Are there any incorrect spellings, duplicates or missingnames?
No. of Badges Number of badges
Min Minimum badge dose in µSv
Max Maximum badge dose in µSv
Mean Mean badge dose in µSv
SDev Standard Deviation of badge dose in µSv
UCL 95% Upper Con�dence Level of badge dose in µSv
Total Total badge dose for period in µSv
4.4. Monitoring badge reports
Report 17. External Exposure � by employee name
The purpose of this report is to list all employee external radiation badge exposures undertakenover the selected period. It shows the employee's name, number of badges, `Minimum', `Maximum',`Mean', `Standard Deviation' and `95% Upper Con�dence Level' statistics for the employee's radiationbadge. For privacy reasons, it should not be included in your `Annual Occupational RadiationReport'.
Figure 4.20 on the next page shows a summary of employee external exposures (badges).
Table 4.17 lists each �eld on this form and gives its purpose.
Report 18. External Exposure � by employee number
The purpose of this report is to list all employee external radiation badge exposures undertaken overthe selected period. It shows the employee's Id Code, number of badges, `Minimum', `Maximum',`Mean', `Standard Deviation' and `95% Upper Con�dence Level' statistics for the employee's radiationbadge. For employee privacy, this is the report to include in your `Annual Occupational RadiationReport'.
Table 4.18 on page 63 lists each �eld on this form and gives its purpose.
Resources Safety, Department of Mines and Petroleum 61

Guideline NORM�7 BOSWELL � assessment and reporting database
Figure 4.20.: Report 17. External Exposure � by employee name
Summary for period 01/04/2006 to 31/03/2007
Thursday, 15 October 2009 Page 1 of 3
Blue Sky Mining Pty Ltd
Boswell Version 2M
17. External Exposure - by employee name
Employee No. of Badges Min Max Mean SDev UCL
External Radiation (µSv)
Total
Abbott, Peter R 4 280 650 465 133 622 1860
Adams, Frank 4 40 760 463 267 776 1850
Anderson, Tobby 4 330 640 488 119 628 1950
Ashcraft, Ivan 3 30 690 403 284 883 1210
Backshall, Ford J 2 380 790 585 214 1170
Backsnail, Mort R 3 10 650 390 291 881 1170
Baker, Peter 4 370 730 573 135 732 2290
Banks, Cody 4 430 650 558 93 668 2230
Barker, Barry C 4 330 660 495 148 669 1980
Barker, Mervin L 4 430 650 558 93 668 2230
Bollard, Tina 2 800 880 840 43 1680
Bood, Dale D 4 500 790 680 110 810 2720
Boysly, Ian 4 350 800 563 203 801 2250
Brandy, John 4 440 650 535 85 635 2140
Brandyhan, Harry W 4 470 650 558 64 633 2230
Browne, Russell 4 210 820 485 228 753 1940
Buggy, Brian 4 10 350 130 142 297 520
Bunter, Billy D 2 10 1070 540 567 1080
Carpent, Jacob 3 460 810 683 163 958 2050
Castle, King 4 10 830 493 304 850 1970
Chadnick, Yirrie A 4 200 760 510 202 748 2040
Chapel, Robin 2 530 650 590 69 1180
Clinchy, Kevin D 4 310 1100 680 293 1025 2720
Cooper, Jason 3 10 510 317 226 697 950
Copper, Mike 4 430 650 558 93 668 2230
Croswell, Travis A 4 610 820 733 78 825 2930
Dewell, Andrew J 4 70 600 353 213 603 1410
Donstand, Cameron B 4 270 640 470 161 660 1880
Down, Brendan 4 510 780 610 113 743 2440
Dunddie, Mike 1 440 440 440 440
Edwards, Brad 4 430 650 558 93 668 2230
Flynn, Ronald 4 560 940 710 145 881 2840
Free, Ted T 4 530 840 720 123 864 2880
George, Boy 4 480 930 655 170 855 2620
Gibson, Ben 2 80 990 535 486 1070
Gibson, Mel K 4 290 1070 503 331 892 2010
Greenlees, Jim 4 10 520 328 209 574 1310
Hall, Ben A 4 510 1000 753 182 966 3010
Hankin, Brian 4 130 530 345 153 525 1380
Hay, Make 1 430 430 430 0 430
Hearne, Paul F 4 500 970 668 193 895 2670
Hellboy, Sam 4 480 770 623 104 745 2490
Hollinham, Daemon J 4 580 800 700 98 816 2800
Holtfritter, Adolf 1 430 430 430 0 430
Hudderson, Russell W 4 480 900 668 154 849 2670
62 Managing naturally occurring radioactive material (NORM) in mining and mineral processing

Guideline NORM�7 BOSWELL � assessment and reporting database
Table 4.18.: Report 18. External Exposure � by employee number
Items on Report Comment
Date Report Printed
Boswell Version
Company and SiteName
Report Name 18. External Exposure � by employee number
Reporting Period Is the period correct?
Number of Pages
Employee Id Code Used for privacy purposes
No. of Badges Number of badges
Min Minimum badge dose in µSv
Max Maximum badge dose in µSv
Mean Mean badge dose in µSv
SDev Standard Deviation of badge dose in µSv
UCL 95% Upper Con�dence Level of badge dose in µSv
Total Total badge dose for period in µSv
Report 19. External Exposure � by work category
The purpose of this report is to list total external exposure monitoring undertaken in the di�erentWork Categories for the selected period. It shows the number of badges, `Minimum', `Maximum',`Mean', `Standard Deviation' and the `95% Upper Con�dence Level' statistics for the dose results.This report is useful for checking if enough monitoring has been undertaken in each active `WorkCategory'. Report 19 is required to be included in your `Annual Occupational Radiation Report'.
Figure 4.21 on the following page shows the two types of plots associated with this report.
Table 4.19 on page 65 lists each �eld on the report and gives its purpose.
Report 20. External Exposure � work category over 5 years
The purpose of this report is to list all badge monitoring undertaken in the di�erent Areas for thelast �ve years in relation to the selected period. It shows the number of badges used each year andthe doses in µSv/month recorded in each Area. The report lists the `Minimum', `Maximum', `Mean',`Standard Deviation' and the `95% Upper Con�dence Level' statistics of the dose (in µSv/month)for each year's measurements. These statistics are also plotted on the report. This report should beincluded in your `Annual Occupational Radiation Report'. This report is useful to see the last �veyear's trends � if exposures are static, varying or decreasing.
Figure 4.22 on page 66 shows the two types of plots associated with this report.
Table 4.20 on page 65 lists each �eld on the report and gives its purpose.
Resources Safety, Department of Mines and Petroleum 63
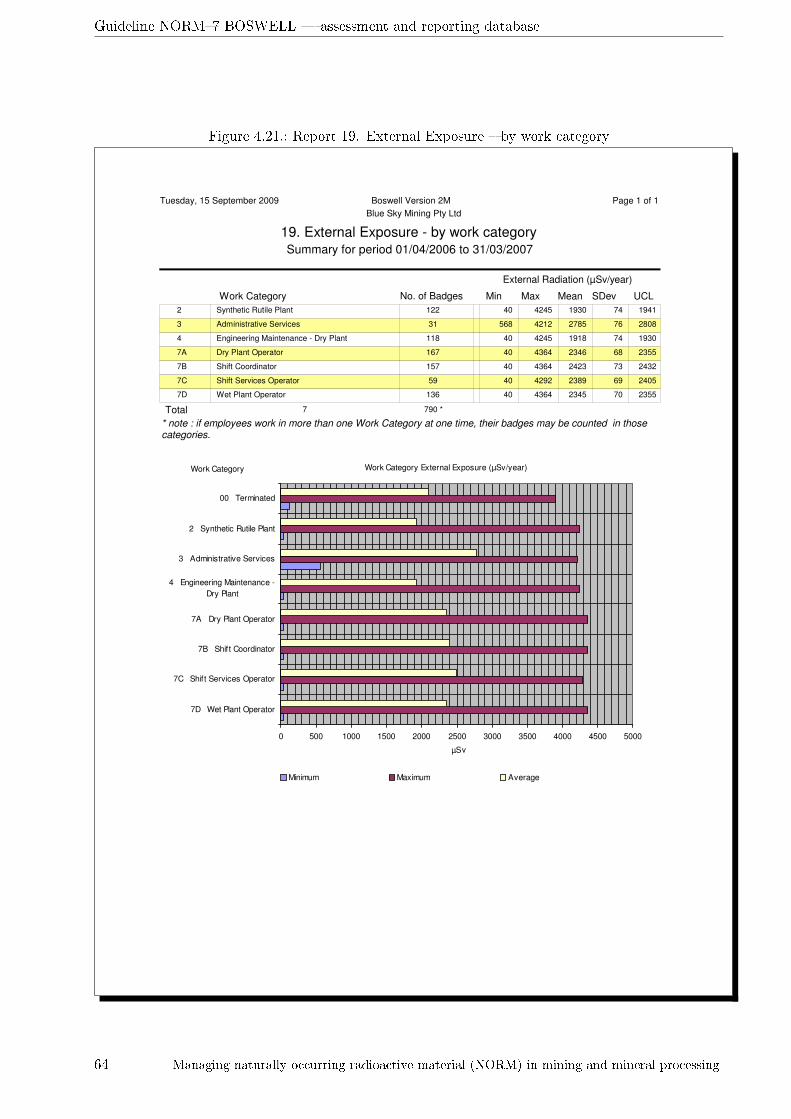
Guideline NORM�7 BOSWELL � assessment and reporting database
Figure 4.21.: Report 19. External Exposure � by work category
Summary for period 01/04/2006 to 31/03/2007
Tuesday, 15 September 2009 Page 1 of 1
Blue Sky Mining Pty Ltd
Boswell Version 2M
19. External Exposure - by work category
No. of Badges Min Max Mean SDev UCL
External Radiation (µSv/year)
Work Category
122 40 4245 1930 74 1941Synthetic Rutile Plant2
31 568 4212 2785 76 2808Administrative Services3
118 40 4245 1918 74 1930Engineering Maintenance - Dry Plant4
167 40 4364 2346 68 2355Dry Plant Operator7A
157 40 4364 2423 73 2432Shift Coordinator7B
59 40 4292 2389 69 2405Shift Services Operator7C
136 40 4364 2345 70 2355Wet Plant Operator7D
Work Category External Exposure (µSv/year)
0 500 1000 1500 2000 2500 3000 3500 4000 4500 5000
7D Wet Plant Operator
7C Shift Services Operator
7B Shift Coordinator
7A Dry Plant Operator
4 Engineering Maintenance -
Dry Plant
3 Administrative Services
2 Synthetic Rutile Plant
00 Terminated
Work Category
µSv
Minimum Maximum Average
Total 790 *
* note : if employees work in more than one Work Category at one time, their badges may be counted in those categories.
7
64 Managing naturally occurring radioactive material (NORM) in mining and mineral processing
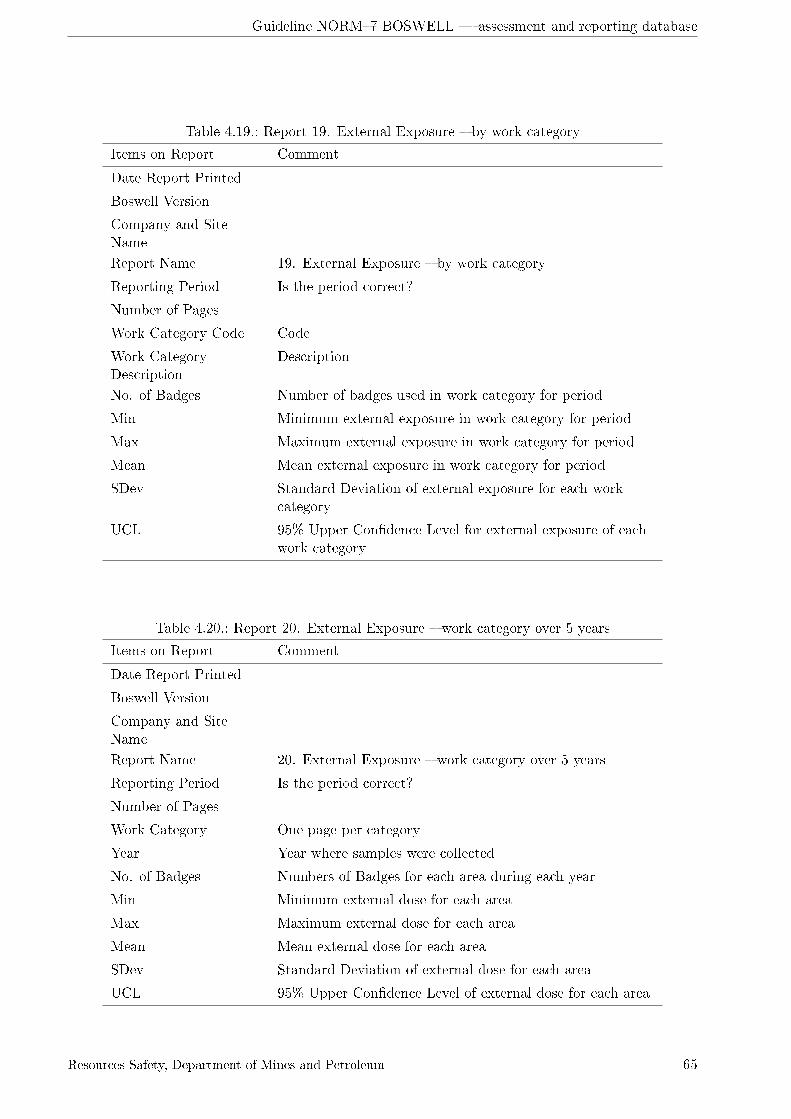
Guideline NORM�7 BOSWELL � assessment and reporting database
Table 4.19.: Report 19. External Exposure � by work category
Items on Report Comment
Date Report Printed
Boswell Version
Company and SiteName
Report Name 19. External Exposure � by work category
Reporting Period Is the period correct?
Number of Pages
Work Category Code Code
Work CategoryDescription
Description
No. of Badges Number of badges used in work category for period
Min Minimum external exposure in work category for period
Max Maximum external exposure in work category for period
Mean Mean external exposure in work category for period
SDev Standard Deviation of external exposure for each workcategory
UCL 95% Upper Con�dence Level for external exposure of eachwork category
Table 4.20.: Report 20. External Exposure � work category over 5 years
Items on Report Comment
Date Report Printed
Boswell Version
Company and SiteName
Report Name 20. External Exposure � work category over 5 years
Reporting Period Is the period correct?
Number of Pages
Work Category One page per category
Year Year where samples were collected
No. of Badges Numbers of Badges for each area during each year
Min Minimum external dose for each area
Max Maximum external dose for each area
Mean Mean external dose for each area
SDev Standard Deviation of external dose for each area
UCL 95% Upper Con�dence Level of external dose for each area
Resources Safety, Department of Mines and Petroleum 65
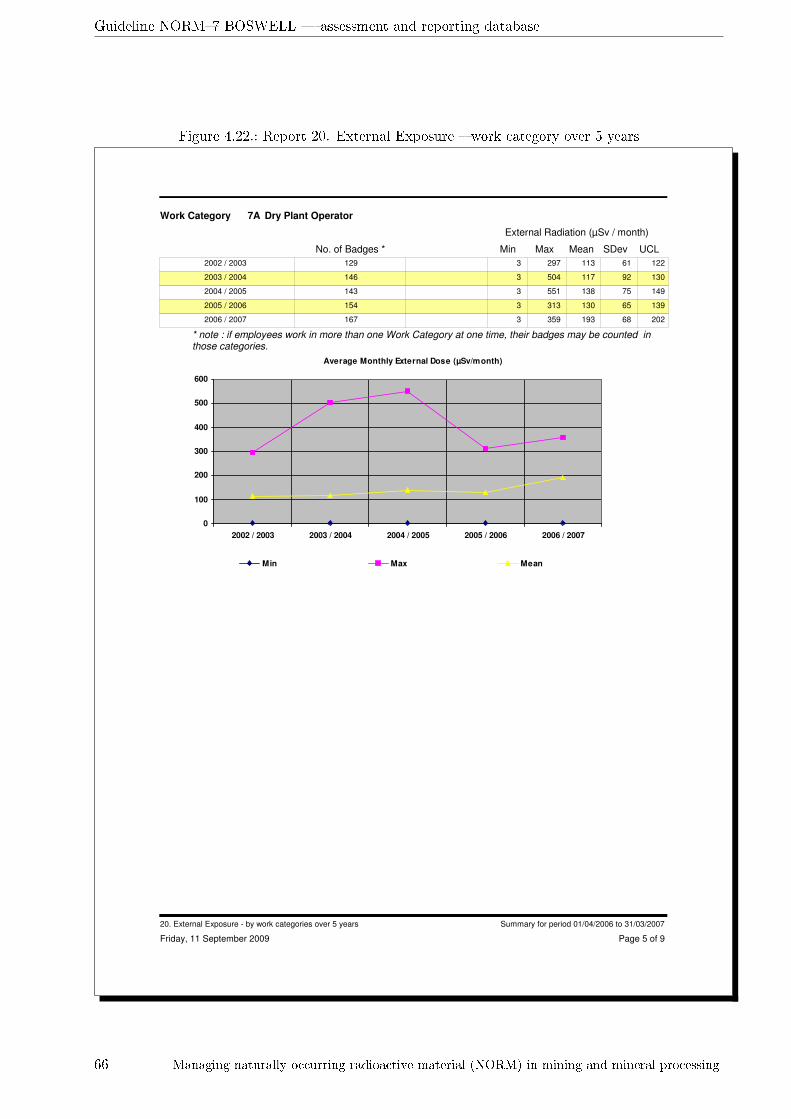
Guideline NORM�7 BOSWELL � assessment and reporting database
Figure 4.22.: Report 20. External Exposure � work category over 5 years
Dry Plant Operator7A
No. of Badges * Min Max Mean SDev UCL
External Radiation (µSv / month)
Work Category
2002 / 2003 129 3 297 113 61 122
2003 / 2004 146 3 504 117 92 130
2004 / 2005 143 3 551 138 75 149
2005 / 2006 154 3 313 130 65 139
2006 / 2007 167 3 359 193 68 202
Average Monthly External Dose (µSv/month)
0
100
200
300
400
500
600
2002 / 2003 2003 / 2004 2004 / 2005 2005 / 2006 2006 / 2007
Min Max Mean
* note : if employees work in more than one Work Category at one time, their badges may be counted in those categories.
Friday, 11 September 2009 Page 5 of 9
Summary for period 01/04/2006 to 31/03/200720. External Exposure - by work categories over 5 years
66 Managing naturally occurring radioactive material (NORM) in mining and mineral processing
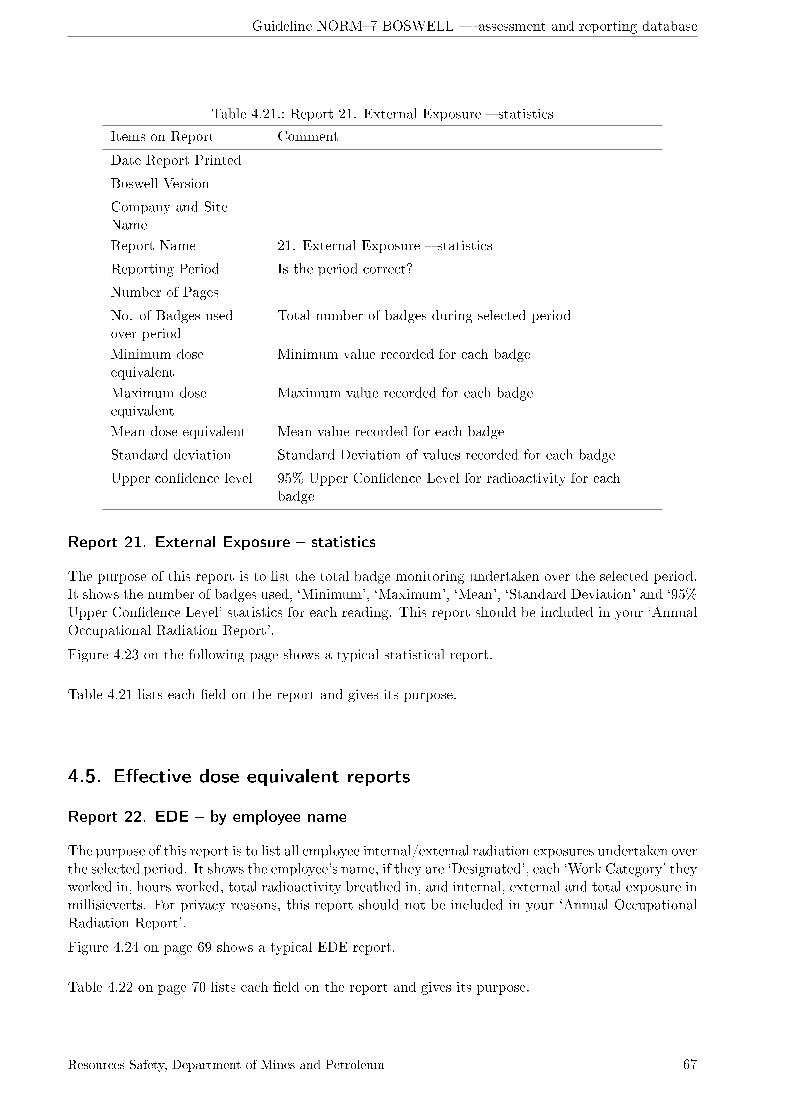
Guideline NORM�7 BOSWELL � assessment and reporting database
Table 4.21.: Report 21. External Exposure � statistics
Items on Report Comment
Date Report Printed
Boswell Version
Company and SiteName
Report Name 21. External Exposure � statistics
Reporting Period Is the period correct?
Number of Pages
No. of Badges usedover period
Total number of badges during selected period
Minimum doseequivalent
Minimum value recorded for each badge
Maximum doseequivalent
Maximum value recorded for each badge
Mean dose equivalent Mean value recorded for each badge
Standard deviation Standard Deviation of values recorded for each badge
Upper con�dence level 95% Upper Con�dence Level for radioactivity for eachbadge
Report 21. External Exposure � statistics
The purpose of this report is to list the total badge monitoring undertaken over the selected period.It shows the number of badges used, `Minimum', `Maximum', `Mean', `Standard Deviation' and `95%Upper Con�dence Level' statistics for each reading. This report should be included in your `AnnualOccupational Radiation Report'.
Figure 4.23 on the following page shows a typical statistical report.
Table 4.21 lists each �eld on the report and gives its purpose.
4.5. E�ective dose equivalent reports
Report 22. EDE � by employee name
The purpose of this report is to list all employee internal/external radiation exposures undertaken overthe selected period. It shows the employee's name, if they are `Designated', each `Work Category' theyworked in, hours worked, total radioactivity breathed in, and internal, external and total exposure inmillisieverts. For privacy reasons, this report should not be included in your `Annual OccupationalRadiation Report'.
Figure 4.24 on page 69 shows a typical EDE report.
Table 4.22 on page 70 lists each �eld on the report and gives its purpose.
Resources Safety, Department of Mines and Petroleum 67
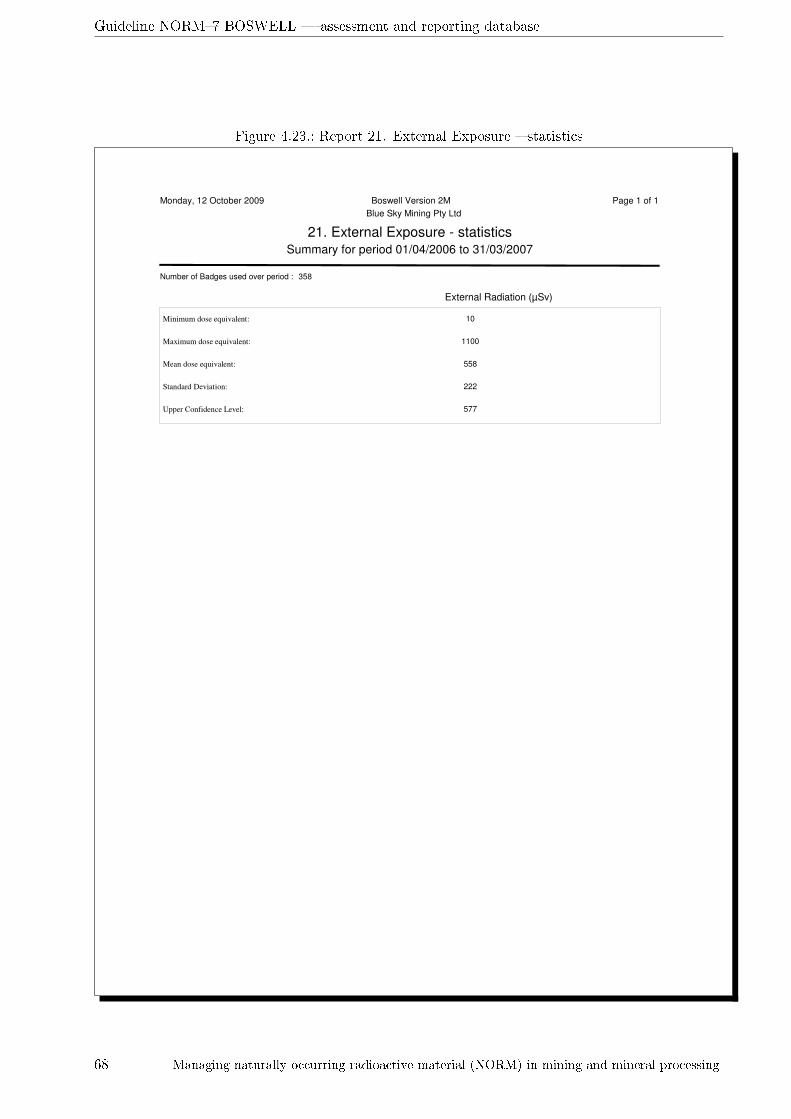
Guideline NORM�7 BOSWELL � assessment and reporting database
Figure 4.23.: Report 21. External Exposure � statistics
Summary for period 01/04/2006 to 31/03/2007
Monday, 12 October 2009 Page 1 of 1
Blue Sky Mining Pty Ltd
Boswell Version 2M
21. External Exposure - statistics
External Radiation (µSv)
Number of Badges used over period : 358
Minimum dose equivalent: 10
Maximum dose equivalent: 1100
Mean dose equivalent: 558
Standard Deviation: 222
Upper Confidence Level: 577
68 Managing naturally occurring radioactive material (NORM) in mining and mineral processing
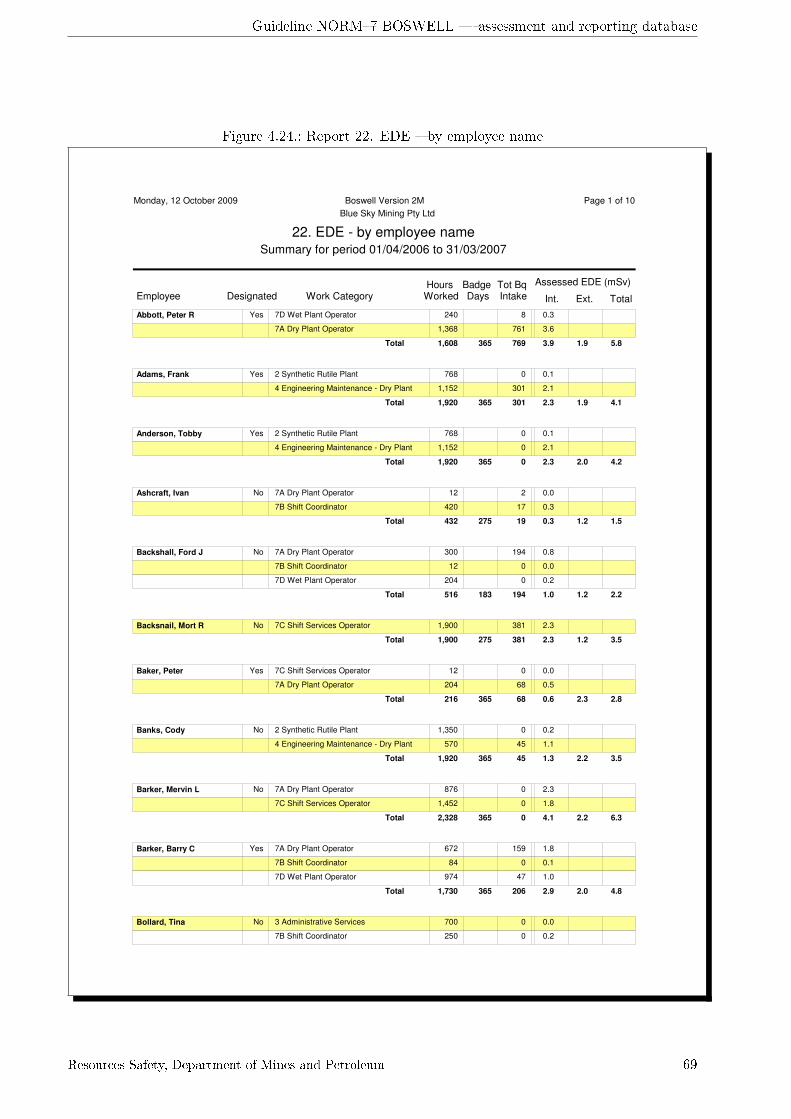
Guideline NORM�7 BOSWELL � assessment and reporting database
Figure 4.24.: Report 22. EDE � by employee name
Summary for period 01/04/2006 to 31/03/2007
Monday, 12 October 2009 Page 1 of 10
Blue Sky Mining Pty Ltd
Boswell Version 2M
22. EDE - by employee name
Employee Work CategoryHours
WorkedBadge Days
Tot Bq Intake
Assessed EDE (mSv)
Int. Ext. TotalDesignated
Abbott, Peter R 7D Wet Plant Operator 240 8 0.3Yes
7A Dry Plant Operator 1,368 761 3.6
1,608 365 3.9 1.9 5.8Total 769
Adams, Frank 2 Synthetic Rutile Plant 768 0 0.1Yes
4 Engineering Maintenance - Dry Plant 1,152 301 2.1
1,920 365 2.3 1.9 4.1Total 301
Anderson, Tobby 2 Synthetic Rutile Plant 768 0 0.1Yes
4 Engineering Maintenance - Dry Plant 1,152 0 2.1
1,920 365 2.3 2.0 4.2Total 0
Ashcraft, Ivan 7A Dry Plant Operator 12 2 0.0No
7B Shift Coordinator 420 17 0.3
432 275 0.3 1.2 1.5Total 19
Backshall, Ford J 7A Dry Plant Operator 300 194 0.8No
7B Shift Coordinator 12 0 0.0
7D Wet Plant Operator 204 0 0.2
516 183 1.0 1.2 2.2Total 194
Backsnail, Mort R 7C Shift Services Operator 1,900 381 2.3No
1,900 275 2.3 1.2 3.5Total 381
Baker, Peter 7C Shift Services Operator 12 0 0.0Yes
7A Dry Plant Operator 204 68 0.5
216 365 0.6 2.3 2.8Total 68
Banks, Cody 2 Synthetic Rutile Plant 1,350 0 0.2No
4 Engineering Maintenance - Dry Plant 570 45 1.1
1,920 365 1.3 2.2 3.5Total 45
Barker, Mervin L 7A Dry Plant Operator 876 0 2.3No
7C Shift Services Operator 1,452 0 1.8
2,328 365 4.1 2.2 6.3Total 0
Barker, Barry C 7A Dry Plant Operator 672 159 1.8Yes
7B Shift Coordinator 84 0 0.1
7D Wet Plant Operator 974 47 1.0
1,730 365 2.9 2.0 4.8Total 206
Bollard, Tina 3 Administrative Services 700 0 0.0No
7B Shift Coordinator 250 0 0.2
Resources Safety, Department of Mines and Petroleum 69

Guideline NORM�7 BOSWELL � assessment and reporting database
Table 4.22.: Report 22. EDE � by employee name
Items on Report Comment
Date Report Printed
Boswell Version
Company and SiteName
Report Name 22. EDE � by employee name
Reporting Period Is the period correct?
Number of Pages
Employee Name Are there any incorrect spellings, duplicates or missingnames?
Designated Yes or No
Work Category Lists each Work Category the employee was assigned toduring period
Hours Worked ‡ Hours worked in each Work Category
Badge Days ‡ Not available for each Work Category
Tot Bq Intake ‡ Total calculated activity of dust breathed in for each WorkCategory
Int Assessed EDE‡ Calculated internal dose for each Work Category
Ext Assessed EDE‡ Not available for each Work Category
Total Assessed EDE‡ Not available for each Work Category
Total Totals for all items marked ‡
70 Managing naturally occurring radioactive material (NORM) in mining and mineral processing

Guideline NORM�7 BOSWELL � assessment and reporting database
Table 4.23.: Report 23. EDE � by employee number
Items on Report Comment
Date Report Printed
Boswell Version
Company and SiteName
Report Name 23. EDE � by employee number
Reporting Period Is the period correct?
Number of Pages
Employee Id Code Used for privacy purposes
Designated Yes or No
Work Category Lists each Work Category the employee was assigned toduring period
Hours Worked ‡ Hours worked in each Work Category
Badge Days ‡ Not available for each Work Category
Tot Bq Intake ‡ Total calculated activity of dust breathed in for each WorkCategory
Int Assessed EDE‡ Calculated internal dose for each Work Category
Ext Assessed EDE‡ Not available for each Work Category
Total Assessed EDE‡ Not available for each Work Category
Total Totals for all items marked ‡
Report 23. EDE � by employee number
The purpose of this report is to list all employee internal/external radiation exposures undertakenover the selected period. It shows the employee's `Id Code', if they are `Designated', each `WorkCategory' they worked in, hours worked, total radioactivity breathed in, and internal, external andtotal exposure in millisieverts. For privacy reasons, this report this is the report to include in your`Annual Occupational Radiation Report'.
Table 4.23 lists each �eld on the report and gives its purpose.
Report 24. EDE � by work category
The purpose of this report is to list all employee internal/external radiation exposures in the di�erent`Work Categories' for the selected period. It shows for the period, the work category details, theaverage hours worked, number of dust samples, number of badges used, total radioactivity breathedin, and internal, external and total exposure in millisieverts. This report is useful for comparingdoses received in each active `Work Category'. Report 24 is required to be included in your `AnnualOccupational Radiation Report'.
Figure 4.25 on the next page shows the two types of plots associated with this report.
Table 4.24 on page 73 lists each �eld on the report and gives its purpose.
Resources Safety, Department of Mines and Petroleum 71

Guideline NORM�7 BOSWELL � assessment and reporting database
Figure 4.25.: Report 24. EDE � by work category
Summary for period 01/04/2006 to 31/03/2007
Tuesday, 15 September 2009 Page 1 of 1
Blue Sky Mining Pty Ltd
Boswell Version 2M
24. EDE - by work category
Work Category Avg Hours Worked
No. of Badges
Avg Bq Intake
Assessed EDE (mSv)
Int. Ext. TotalNo of Dust
Samples
Synthetic Rutile Plant 837 122 16 0.2 0.5 0.6682
Administrative Services 994 31 0 0.0 0.6 0.603
Engineering Maintenance - Dry Plant 857 118 272 1.6 0.5 2.1494
Dry Plant Operator 614 167 389 1.6 0.6 2.21887A
Shift Coordinator 655 157 59 0.4 0.6 1.0367B
Shift Services Operator 774 59 104 0.9 0.6 1.5287C
Wet Plant Operator 479 136 90 0.5 0.6 1.1257D
Assessed EDE (mSv)
0 0.5 1 1.5 2 2.5
7D Wet Plant Operator
7C Shift Services Operator
7B Shift Coordinator
7A Dry Plant Operator
4 Engineering Maintenance - Dry Plant
3 Administrative Services
2 Synthetic Rutile Plant
Work Category
mSv
External Dose Internal Dose
7 394 790 *Total:
* note : if employees work in more than one Work Category at one time, their badges may be counted in those categories.
72 Managing naturally occurring radioactive material (NORM) in mining and mineral processing

Guideline NORM�7 BOSWELL � assessment and reporting database
Table 4.24.: Report 24. EDE � by work category
Items on Report Comment
Date Report Printed
Boswell Version
Company and SiteName
Report Name 24. EDE � by work category
Reporting Period Is the period correct?
Number of Pages
Work Category Code Code
Work CategoryDescription
Description
Avg hours Worked Number of badges used in work category for period
No of Dust Samples Minimum external exposure in work category for period
No of Badges Estimated number of badges used for each work category
Avg Bq Intake Estimated dust activity for an average person in each workcategory
Int Assessed EDE Estimated internal dose for an average person in each workcategory
Ext Assessed EDE Estimated external dose for an average person in each workcategory
Total Assessed EDE Total estimated dose for an average person in each workcategory
Resources Safety, Department of Mines and Petroleum 73

Guideline NORM�7 BOSWELL � assessment and reporting database
Table 4.25.: Report 25. EDE � statistics � by personnel dose
Items on Report Comment
Date Report Printed
Boswell Version
Company and SiteName
Report Name 25. EDE � statistics � by personnel dose
Reporting Period Is the period correct?
Number of Pages
Total Number of Employees and Total Number of Designated Employees
0 to 50+ Number of employees within 12 dose ranges
Average Internal Dose Dose for all Employees/ Designated Employees
Maximum InternalDose
Dose for all Employees/ Designated Employees
Average External Dose Dose for all Employees/ Designated Employees
Maximum ExternalDose
Dose for all Employees/ Designated Employees
Report 25. EDE � statistics � by personnel dose
The purpose of this report is to rank the combined internal/external radiation exposures for theselected period and compare employees in general with the Designated employees. It shows for theperiod, the total number of employees and designated employees. The doses between 0 and 50+millisivert are grouped and the `Average Internal/External' and `Maximum Internal/External' canbe compared between groups. Report 25 is required to be included in your `Annual OccupationalRadiation Report'.
Figure 4.26 on the next page shows the summary and layout of this report.
Table 4.25 lists each �eld on the report and gives its purpose.
Report 26. EDE � work category dose prediction summary
The purpose of this report is for the RSO to be able to compare the average hours worked in each`Work Category', the `Average EDE', how close that is the the annual limit and the number of hoursit would take working to reach the annual limit. Report 26 is not required to be included in your`Annual Occupational Radiation Report'.
Figure 4.28 on page 77 shows the summary and layout of this report.
Figure 4.28 on page 77 shows the two types of plots associated with this report.
74 Managing naturally occurring radioactive material (NORM) in mining and mineral processing

Guideline NORM�7 BOSWELL � assessment and reporting database
Figure 4.26.: Report 25. EDE � statistics � by personnel dose
Summary for period 01/04/2006 to 31/03/2007
Monday, 12 October 2009 Page 1 of 1
Blue Sky Mining Pty Ltd
Boswell Version 2M
25. EDE - employee dose statistics
Average Internal Dose: 0.9
Maximum Internal Dose: 5.2
Average External Dose: 2.0
Maximum External Dose: 3.5
Total Number of Employees:
Number of Employees in Dose Range:
(total effective dose)
0 to < 1 mSv:
1 to < 5 mSv:
5 to < 10 mSv:
104
4
81
19
10 to < 15 mSv:
15 to < 20 mSv:
20 to < 25 mSv:
0
0
0
25 to < 30 mSv:
30 to < 35 mSv:
35 to < 40 mSv:
0
0
0
40 to < 45 mSv:
45 to < 50 mSv:
50 + mSv:
0
0
0
Total Number of Designated Employees: 68
Average Internal Dose: 0.8
Maximum Internal Dose: 5.2
Average External Dose: 2.1
Maximum External Dose: 3.2
Number of Designated Employees in Dose Range:
(total effective dose)
0 to < 1 mSv:
1 to < 5 mSv:
5 to < 10 mSv:
1
45
11
10 to < 15 mSv:
15 to < 20 mSv:
20 to < 25 mSv:
0
0
0
25 to < 30 mSv:
30 to < 35 mSv:
35 to < 40 mSv:
0
0
0
40 to < 45 mSv:
45 to < 50 mSv:
50 + mSv:
0
0
0
Resources Safety, Department of Mines and Petroleum 75

Guideline NORM�7 BOSWELL � assessment and reporting database
Figure 4.27.: Report 26. EDE � work category dose prediction summary
Summary for period 01/04/2006 to 31/03/2007
Tuesday, 15 September 2009 Page 1 of 1
Blue Sky Mining Pty Ltd
Boswell Version 2M
26. EDE - work category dose prediction summary
Work Category Avg Hours Worked
% Annual Limit
Required Hours to reach annual Limit
Assessed EDE (mSv)
0.6Administrative Services 994 3 30,8183
2.2Dry Plant Operator 614 11 4,9567A
2.1Engineering Maintenance - Dry Plant 857 10 7,3574
1.0Shift Coordinator 655 5 11,9567B
1.5Shift Services Operator 774 8 9,4647C
0.6Synthetic Rutile Plant 837 3 24,9802
1.1Wet Plant Operator 479 5 8,3767D
76 Managing naturally occurring radioactive material (NORM) in mining and mineral processing

Guideline NORM�7 BOSWELL � assessment and reporting database
Figure 4.28.: Report 26. EDE � work category dose prediction summary
Summary for period 01/04/2006 to 31/03/2007
Tuesday, 15 September 2009 Page 1 of 1
Blue Sky Mining Pty Ltd
Boswell Version 2M
26. EDE - work category dose prediction summary
Work Category Avg Hours Worked
% Annual Limit
Required Hours to reach annual Limit
Assessed EDE (mSv)
0.6Administrative Services 994 3 30,8183
2.2Dry Plant Operator 614 11 4,9567A
2.1Engineering Maintenance - Dry Plant 857 10 7,3574
1.0Shift Coordinator 655 5 11,9567B
1.5Shift Services Operator 774 8 9,4647C
0.6Synthetic Rutile Plant 837 3 24,9802
1.1Wet Plant Operator 479 5 8,3767D
Resources Safety, Department of Mines and Petroleum 77
Guideline NORM�7 BOSWELL � assessment and reporting database
Report 27. EDE � identify potential designated employee
The purpose of this report is for the RSO to be able to identify employees who should be `DesignatedEmployees'. Report 27 is not required to be included in your annual occupational radiation report.
This report is the same as `22. EDE � by employee name' except the data is sorted from the highestto the lowest doses with a cut-o� point of 1mSv. it shows currently designated and non-designatedemployees.
Figure 4.29 on the next page shows the layout of this report.
Report 28. EDE � designated employees
The purpose of this report is for the RSO to be able to compare doses of `Designated Employees'.Report 28 is not required to be included in your annual occupational radiation report.
This report is the same as `22. EDE � by employee name' except it only lists doses for currentlydesignated employees. It also shows additional work category information.
Figure 4.30 on page 80 shows the layout of this report.
4.6. Employee work history reports
Report 29. Work History � by employee name
The purpose of this report is for the RSO to be able to check employee work histories/ work hoursare entered correctly. It lists `Employee Name', `Work Category Code/Description', hours workedin each category and total hours worked. Report 29 is not required to be included in your `AnnualOccupational Radiation Report'.
Figure 4.31 on page 81 shows the layout of this report.
Table 4.26 on page 82 lists each �eld on the report and gives its purpose.
Report 30. Work History � by employee number
The purpose of this report is for the RSO to be able to check employee work histories/ work hoursare entered correctly. It lists employee ID Code, Work Category Code/Description, hours workedin each category and total hours worked. Report 30 is not required to be included in your annualoccupational radiation report. This report is used when employee names need to be kept private.
Table 4.27 on page 82 lists each �eld on the report and gives its purpose.
Report 31. Work History � by work category
The purpose of this report is for the RSO to be able to check the number of employees Boswell hasplaced in each Work Category and the average hours they work. Report 31 is not required to beincluded in your annual occupational radiation report.
Figure 4.32 on page 83 shows the information listed in this report.
78 Managing naturally occurring radioactive material (NORM) in mining and mineral processing

Guideline NORM�7 BOSWELL � assessment and reporting database
Figure 4.29.: Report 27. EDE � identify potential designated employee
Summary for period 01/04/2006 to 31/03/2007
Monday, 12 October 2009 Page 1 of 11
Blue Sky Mining Pty Ltd
Boswell Version 2M
27. EDE - identify potential designated employees
Employee Work CategoryHours Worked
Badge Days
Tot Bq Intake
Assessed EDE (mSv)
Int. Ext. TotalCurrently Designated
Nasher, Ivan K 7A Dry Plant Operator 1,944 1,381 5.2Yes
7C Shift Services Operator 204 0 0.2Yes
7D Wet Plant Operator 36 0 0.0Yes
2,184 365 5.5 3.2 8.7Total
Hollinham, Daemon J 7A Dry Plant Operator 1,836 753 4.9No
7D Wet Plant Operator 48 0 0.1No
1,884 365 4.9 2.8 7.7Total
Free, Ted T 7A Dry Plant Operator 1,572 368 4.2No
7C Shift Services Operator 72 2 0.1No
7D Wet Plant Operator 396 8 0.4No
2,040 365 4.7 2.9 7.6Total
Bood, Dale D 7A Dry Plant Operator 1,428 513 3.8No
7D Wet Plant Operator 432 0 0.5No
1,860 365 4.3 2.7 7.0Total
Woods, Steve W 7A Dry Plant Operator 1,404 728 3.7Yes
7D Wet Plant Operator 480 9 0.5Yes
1,884 365 4.2 2.6 6.8Total
Barker, Mervin L 7A Dry Plant Operator 876 0 2.3No
7C Shift Services Operator 1,452 0 1.8No
2,328 365 4.1 2.2 6.3Total
Thomas, Raymond P 7A Dry Plant Operator 1,092 967 2.9No
7C Shift Services Operator 1,080 147 1.3No
2,172 274 4.2 2.0 6.2Total
Tomlinson, Rodney G 7A Dry Plant Operator 1,128 571 3.0Yes
7B Shift Coordinator 96 0 0.1Yes
7C Shift Services Operator 24 0 0.0Yes
7D Wet Plant Operator 540 14 0.6Yes
1,788 365 3.7 2.6 6.2Total
Middler, Bett R 7A Dry Plant Operator 1,212 514 3.2Yes
7B Shift Coordinator 288 0 0.2Yes
7D Wet Plant Operator 264 0 0.3Yes
1,764 365 3.7 2.4 6.1Total
Resources Safety, Department of Mines and Petroleum 79
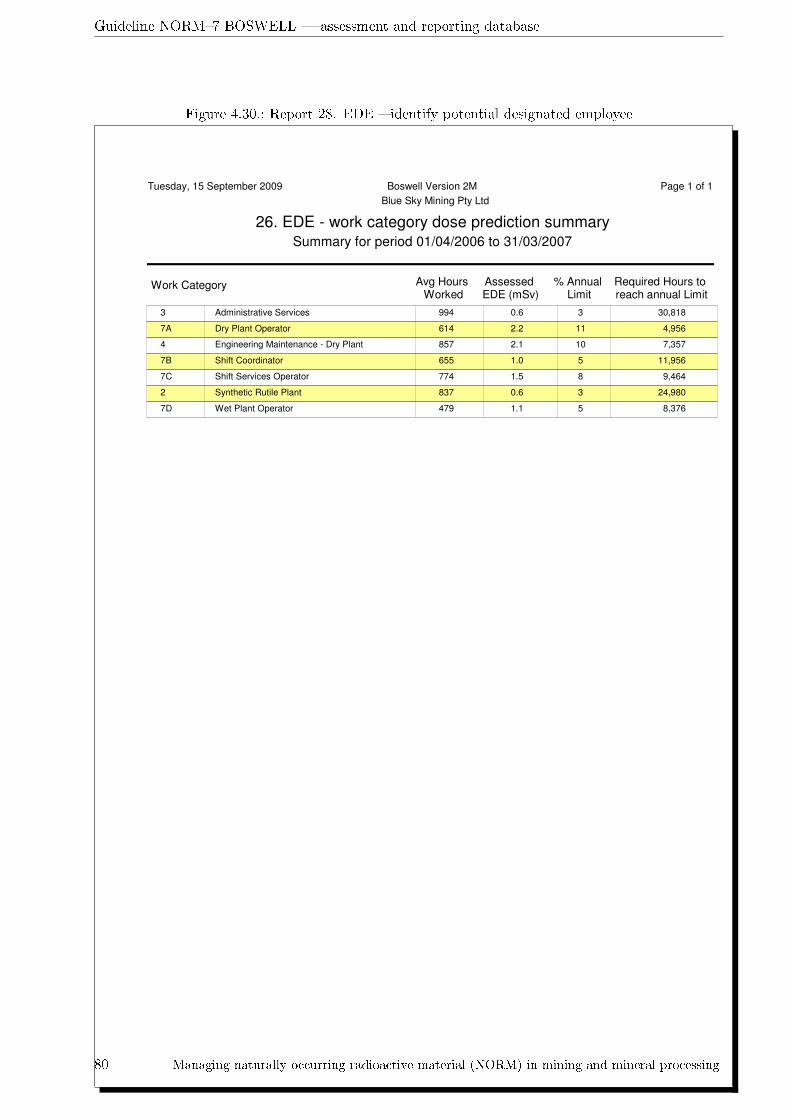
Guideline NORM�7 BOSWELL � assessment and reporting database
Figure 4.30.: Report 28. EDE � identify potential designated employee
Summary for period 01/04/2006 to 31/03/2007
Tuesday, 15 September 2009 Page 1 of 1
Blue Sky Mining Pty Ltd
Boswell Version 2M
26. EDE - work category dose prediction summary
Work Category Avg Hours Worked
% Annual Limit
Required Hours to reach annual Limit
Assessed EDE (mSv)
0.6Administrative Services 994 3 30,8183
2.2Dry Plant Operator 614 11 4,9567A
2.1Engineering Maintenance - Dry Plant 857 10 7,3574
1.0Shift Coordinator 655 5 11,9567B
1.5Shift Services Operator 774 8 9,4647C
0.6Synthetic Rutile Plant 837 3 24,9802
1.1Wet Plant Operator 479 5 8,3767D
80 Managing naturally occurring radioactive material (NORM) in mining and mineral processing

Guideline NORM�7 BOSWELL � assessment and reporting database
Figure 4.31.: Report 29. Work History � by employee name
Summary for period 01/04/2006 to 31/03/2007
Monday, 12 October 2009 Page 1 of 11
Blue Sky Mining Pty Ltd
Boswell Version 2M
29. Work History - by employee name
Employee Work Category Hours Worked
Total Hours
Abbott, Peter R 1,368Dry Plant Operator7A
240Wet Plant Operator7D
1,6087D Wet Plant Operator01-Apr-06 31-Mar-07
7A Dry Plant Operator01-Apr-06 31-Mar-07
Adams, Frank 768Synthetic Rutile Plant2
1,152Engineering Maintenance - Dry Plant4
1,9204 Engineering Maintenance - Dry Plant01-Apr-06 31-Mar-07
2 Synthetic Rutile Plant01-Apr-06 31-Mar-07
Anderson, Tobby 768Synthetic Rutile Plant2
1,152Engineering Maintenance - Dry Plant4
1,9204 Engineering Maintenance - Dry Plant01-Apr-06 31-Mar-07
2 Synthetic Rutile Plant01-Apr-06 31-Mar-07
Ashcraft, Ivan 12Dry Plant Operator7A
420Shift Coordinator7B
4327B Shift Coordinator01-Apr-06 31-Mar-07
7A Dry Plant Operator01-Apr-06 31-Mar-07
00 Terminated01-Apr-06 31-Mar-07
Backshall, Ford J 300Dry Plant Operator7A
12Shift Coordinator7B
204Wet Plant Operator7D
5167D Wet Plant Operator01-Apr-06 31-Mar-07
7B Shift Coordinator01-Apr-06 31-Mar-07
7A Dry Plant Operator01-Apr-06 31-Mar-07
Backsnail, Mort R 1,900Shift Services Operator7C
1,9007C Shift Services Operator01-Apr-06 31-Mar-07
Baker, Peter 204Dry Plant Operator7A
12Shift Services Operator7C
2167C Shift Services Operator01-Apr-06 31-Mar-07
7A Dry Plant Operator01-Apr-06 31-Mar-07
Banks, Cody 1,350Synthetic Rutile Plant2
570Engineering Maintenance - Dry Plant4
1,9204 Engineering Maintenance - Dry Plant01-Apr-06 31-Mar-07
2 Synthetic Rutile Plant01-Apr-06 31-Mar-07
Barker, Mervin L 876Dry Plant Operator7A
1,452Shift Services Operator7C
2,3287C Shift Services Operator01-Apr-06 31-Mar-07
7A Dry Plant Operator01-Apr-06 31-Mar-07
Resources Safety, Department of Mines and Petroleum 81
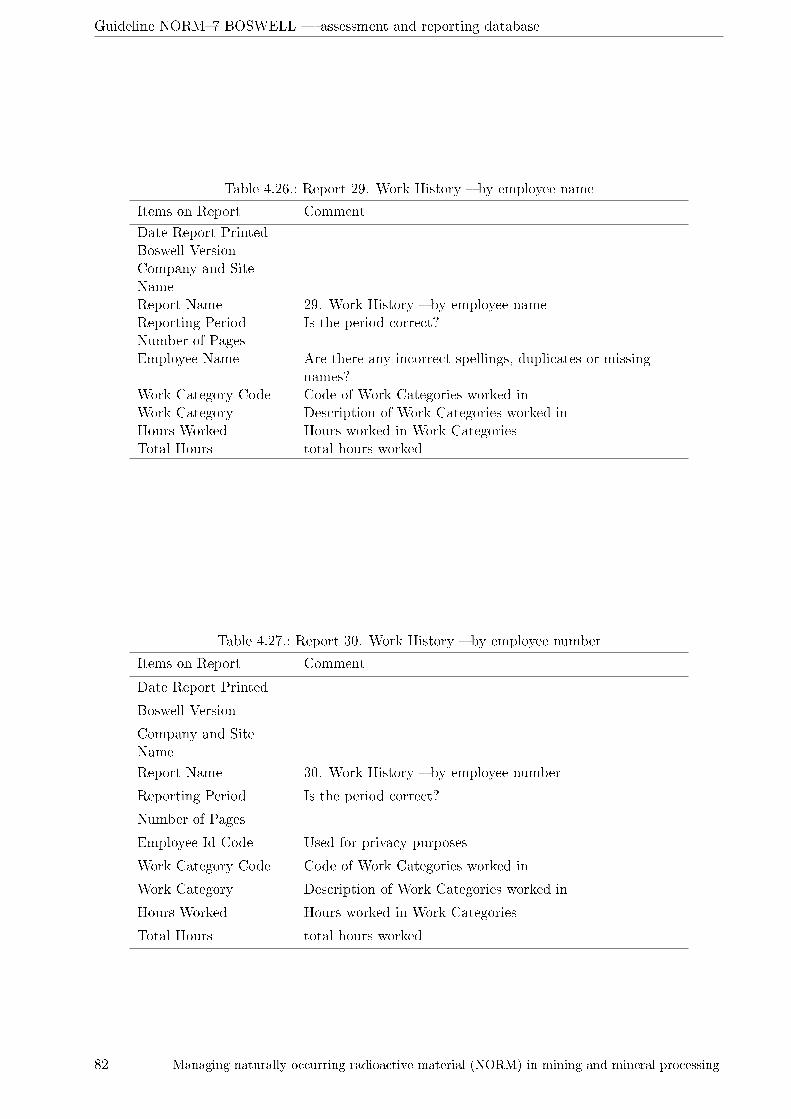
Guideline NORM�7 BOSWELL � assessment and reporting database
Table 4.26.: Report 29. Work History � by employee name
Items on Report Comment
Date Report PrintedBoswell VersionCompany and SiteNameReport Name 29. Work History � by employee nameReporting Period Is the period correct?Number of PagesEmployee Name Are there any incorrect spellings, duplicates or missing
names?Work Category Code Code of Work Categories worked inWork Category Description of Work Categories worked inHours Worked Hours worked in Work CategoriesTotal Hours total hours worked
Table 4.27.: Report 30. Work History � by employee number
Items on Report Comment
Date Report Printed
Boswell Version
Company and SiteName
Report Name 30. Work History � by employee number
Reporting Period Is the period correct?
Number of Pages
Employee Id Code Used for privacy purposes
Work Category Code Code of Work Categories worked in
Work Category Description of Work Categories worked in
Hours Worked Hours worked in Work Categories
Total Hours total hours worked
82 Managing naturally occurring radioactive material (NORM) in mining and mineral processing

Guideline NORM�7 BOSWELL � assessment and reporting database
Figure 4.32.: Report 31. Work History � by work category
Summary for period 01/04/2006 to 31/03/2007
Tuesday, 15 September 2009 Page 1 of 1
Blue Sky Mining Pty Ltd
Boswell Version 2M
31. Employee Work History - by work category
Work Category Avg Hours Worked
No of Employees Work Category
Synthetic Rutile Plant 837 362
Administrative Services 994 113
Engineering Maintenance - Dry Plant 857 354
Dry Plant Operator 614 487A
Shift Coordinator 655 447B
Shift Services Operator 774 187C
Wet Plant Operator 479 367D
228
Resources Safety, Department of Mines and Petroleum 83

Guideline NORM�7 BOSWELL � assessment and reporting database
4.7. Individual employee dose reports
Report 32. Ad Hoc Employee Dose � by date range
The purpose of this report is for the RSO to be able to give an employee on request his dust andradiation exposures for the selected period. Report 32 is not required to be included in your annualoccupational radiation report.
Figure 4.33 on the next page shows the layout of this report.
Report 33. Ad Hoc Employee Dose � over each year with company
The purpose of this report is for the RSO to be able to give an employee on request his dust andradiation exposures for their term with the company. Report 33 is not required to be included inyour annual occupational radiation report.
Figure 4.34 on page 86 shows the layout of this report.
Report 34. Employee Monitoring and Exposure Report
The purpose of this report is for the RSO to be able to print out as a batch, the annual exposurereports for all employees detailing their dust and radiation exposures for the year. A copy of therelevant page should be forwarded to employees annually.
Figure 4.35 on page 87 shows the layout of this report.
84 Managing naturally occurring radioactive material (NORM) in mining and mineral processing
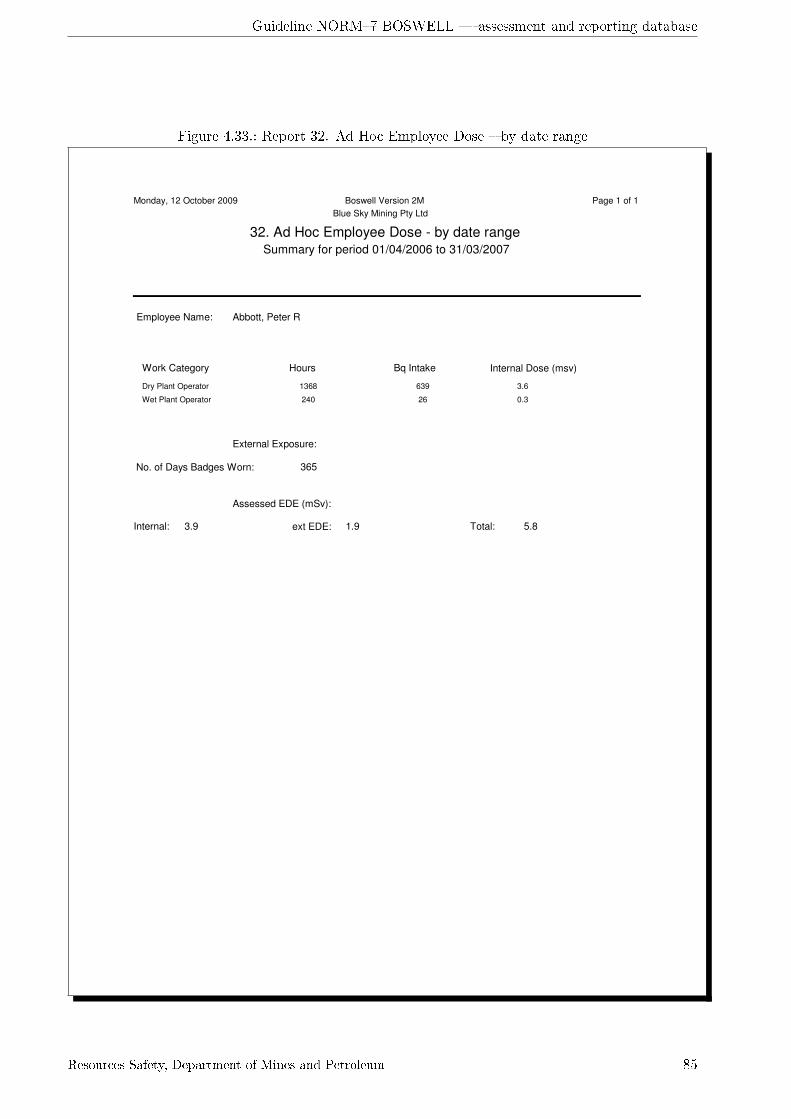
Guideline NORM�7 BOSWELL � assessment and reporting database
Figure 4.33.: Report 32. Ad Hoc Employee Dose � by date range
Summary for period 01/04/2006 to 31/03/2007
Monday, 12 October 2009 Page 1 of 1
Blue Sky Mining Pty Ltd
Boswell Version 2M
32. Ad Hoc Employee Dose - by date range
Employee Name: Abbott, Peter R
No. of Days Badges Worn: 365
Internal: 3.9
External Exposure:
Assessed EDE (mSv):
ext EDE: 1.9 Total: 5.8
Work Category Hours Bq Intake Internal Dose (msv)
Dry Plant Operator 1368 639 3.6
Wet Plant Operator 240 26 0.3
Resources Safety, Department of Mines and Petroleum 85
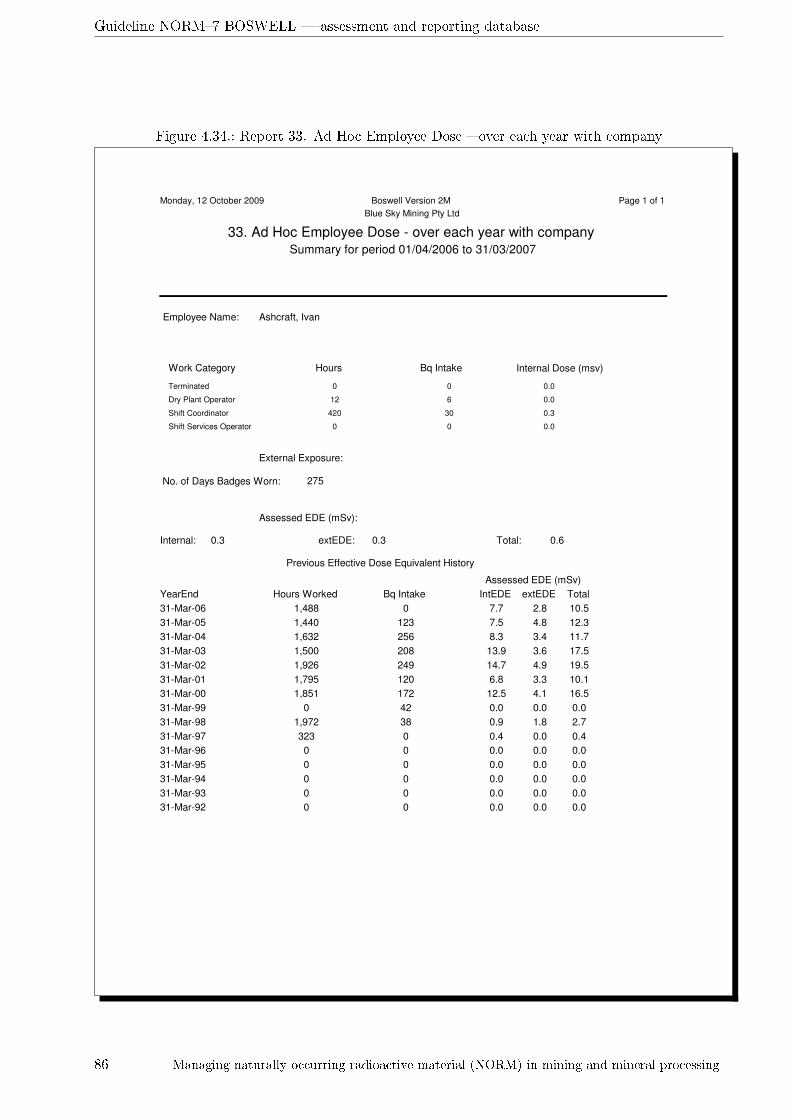
Guideline NORM�7 BOSWELL � assessment and reporting database
Figure 4.34.: Report 33. Ad Hoc Employee Dose � over each year with company
Summary for period 01/04/2006 to 31/03/2007
Monday, 12 October 2009 Page 1 of 1
Blue Sky Mining Pty Ltd
Boswell Version 2M
33. Ad Hoc Employee Dose - over each year with company
Employee Name: Ashcraft, Ivan
No. of Days Badges Worn: 275
Internal: 0.3
External Exposure:
Assessed EDE (mSv):
extEDE: 0.3 Total: 0.6
Work Category Hours Bq Intake Internal Dose (msv)
Terminated 0 0 0.0
Dry Plant Operator 12 6 0.0
Shift Coordinator 420 30 0.3
Shift Services Operator 0 0 0.0
YearEnd Hours Worked Bq Intake IntEDE extEDE Total
Assessed EDE (mSv)
Previous Effective Dose Equivalent History
31-Mar-06 1,488 0 7.7 2.8 10.5
31-Mar-05 1,440 123 7.5 4.8 12.3
31-Mar-04 1,632 256 8.3 3.4 11.7
31-Mar-03 1,500 208 13.9 3.6 17.5
31-Mar-02 1,926 249 14.7 4.9 19.5
31-Mar-01 1,795 120 6.8 3.3 10.1
31-Mar-00 1,851 172 12.5 4.1 16.5
31-Mar-99 0 42 0.0 0.0 0.0
31-Mar-98 1,972 38 0.9 1.8 2.7
31-Mar-97 323 0 0.4 0.0 0.4
31-Mar-96 0 0 0.0 0.0 0.0
31-Mar-95 0 0 0.0 0.0 0.0
31-Mar-94 0 0 0.0 0.0 0.0
31-Mar-93 0 0 0.0 0.0 0.0
31-Mar-92 0 0 0.0 0.0 0.0
86 Managing naturally occurring radioactive material (NORM) in mining and mineral processing

Guideline NORM�7 BOSWELL � assessment and reporting database
Figure 4.35.: Report 34. Employee Monitoring and Exposure Report
Radiation Exposure Results for Peter Abbott
Summary for period 01/04/2006 to 31/03/2007
Tuesday, 15 September 2009 Page 1 of 182
Blue Sky Mining Pty Ltd
Boswell Version 2M
34. Employee Monitoring and Exposure Report
Badge Date Issued Date Returned µSv Comments
Radiation Badge Results
613-83505 01-Apr-06 30-Jun-06 280
626-30455 01-Jul-06 30-Sep-06 450
639-68840 01-Oct-06 31-Dec-06 650
652-9980 01-Jan-07 31-Mar-07 480
For comparison, over the same monitoring period, site employee's badge results ranged from 10 µSv to 1100 µSv and averaged 558 µSv. Any
unusually high results are investigated and reported to DMP.
Filter Start Date End Date mg/m³ mBq/m³ MDL CommentsWC
Dust Sampling Results
NM-4779 05-Jul-06 05-Jul-06 4.44 279.12 16.40 7A
NM-4888 12-Dec-06 12-Dec-06 11.33 1,245.31 12.65 7A investigated - Loss Control card
EMW77795
NM-4909 19-Dec-06 19-Dec-06 2.53 278.51 12.60 7A
NM-4920 27-Dec-06 27-Dec-06 1.96 274.25 13.79 7A
NM-5037 29-Jan-07 29-Jan-07 2.45 313.75 16.65 7A
NM-5056 05-Feb-07 05-Feb-07 3.40 370.20 16.77 7A
NM-5093 13-Feb-07 13-Feb-07 4.02 485.38 12.37 7A
NM-5142 01-Mar-07 01-Mar-07 0.28 26.84 16.93 7D
For comparison, over the same monitoring period, site employee's dust readings ranged from 0 mg/m³ to 23 mg/m³ and averaged 3 mg/m³. Dust
radioactivity ranged from 10 mBq/m³ to 3084 mBq/m³ and averaged 217 mBq/m³. Dust readings of 10 mg/m³ or more and dust radioactivity above
800 mBq/m³ are investigated and reported to DMP.
Designated Employee
Hours
Worked
Badge
Days
Tot Bq
Intake
Assessed EDE (mSv)
Int. Ext. TotalWork Category
Estimated Radiation Exposure
7D Wet Plant Operator 240 8 0.3Yes
7A Dry Plant Operator 1,368 761 3.6
1,608 365 3.9 1.9 5.8Total 769
For comparison, over the same monitoring period, site employee's internal radiation exposures reached a maximum of 5.2 mSv and averaged 0.9 mSv.
Site employee's external radiation exposures reached a maximum of 3.5 mSv and averaged 2.0 mSv. Any unusually high results are investigated and
reported to DMP and the Radiological Council.
Resources Safety, Department of Mines and Petroleum 87

Guideline NORM�7 BOSWELL � assessment and reporting database
A. Appendix � Annual Occupational Radiation
Report
Printouts of the following Boswell Reports and a copy of boswellData.mdb on CD should be includedin the annual occupational radiation report:
04. Personal Dust - rad/grav � by employee number06. Personal Dust - rad/grav � by month & work category07. Personal Dust - rad/grav � 5 years & work category08. Personal Dust - rad/grav � statistics11. Area Dust - rad/grav � by area12. Area Dust - rad/grav � by month & area13. Area Dust - rad/grav � areas over 5 years14. Area Dust - rad/grav � statistics18. External Exposure � by employee number19. External Exposure � by work category20. External Exposure � work category over 5 years21. External Exposure � statistics23. EDE � by employee number24. EDE � by work category25. EDE � statistics � by personnel dose
For more information on annual occupational reporting, please refer to the Guideline NORM�6Reporting and notifying.
88 Managing naturally occurring radioactive material (NORM) in mining and mineral processing

Guideline NORM�7 BOSWELL � assessment and reporting database
B. Appendix � User Instructions
B.1. Quick start
If you are familiar with the old MIDAS program, then you should have a fair idea how to use Boswell.
Boswell is very user friendly and provided you have an understanding of your radiation monitoringprogram, you should have no di�culty using it.
The important part is to ensure you are entering the correct data and enter it is the correct sequence.If you examine your old MIDAS data in Boswell, as you look through it you are bound to see theodd data entry errors, wrong dates, duplicated records, misspelled names � they are much easier tospot.
To get started,
1. Enter the data in the correct order
2. Make sure the items in the Listings Menu are up to date
3. Complete the Area Dust
4. Complete the Employee Dust
5. Complete Exposure BadgeResults
6. Before running reports, ensure the Employee History is up to date
If the your Reports look strange, check the data. If you have any questions on forms or �elds, pressF1 for help on the topic.
B.2. Menus
The menus are organised so that each form is listed in the order it should be used
� Listings Menu
� Entity Name
� Air Sampler Holders
� Sampling Equipment Codes
� Air Sampler Pumps
� Conversion Factors
� Area Locations
� Area Codes
� Location Codes
� Work Categories
� Respiratory Protection
Resources Safety, Department of Mines and Petroleum 89
Guideline NORM�7 BOSWELL � assessment and reporting database
� Radiation Counters
� Radiation Calibration
� Main Menu
� Area Dust
� Employee
� Previous Experience
� Badge Data
� Employee Dust
� Employee History
� Reports
� CONTAM Download
B.3. Toolbars
There are three main types of tool bars used in Boswell forms.
B.3.1. Main Screen
Allows access to tools located on the:
1. Data Tools menu
90 Managing naturally occurring radioactive material (NORM) in mining and mineral processing

Guideline NORM�7 BOSWELL � assessment and reporting database
� These tools are used to interact with the backend data�le boswellData.mdb
� Refresh or connect to the data tables
� Compact the data - remove any deleted data andrecover space
� Zip or backup the mdb �le to a safe location or a CD
� Unzip the backup data
� Run the WinZip program (you must install thisyourself)
� Upload Data to DMP with the web upload facility
2. Windows menu
Allows viewing of other already opened windows
3. Help Menu
Tip of the day settings
B.3.2. Data Entry Screens
This tool bar contains the most number of tools which includes:-
Resources Safety, Department of Mines and Petroleum 91

Guideline NORM�7 BOSWELL � assessment and reporting database
1. Use data
� Close
� File and Printing Tools
� Edit, Cut, Copy, Paste, Delete, Select, Search
� Freeze
� Unfreeze columns
� Filter on/o�
� Change �lters
2. Move and paste data
Cut/Copy/Paste/Undo
3. Change the sorting order
Sorting A-Z, Z-A
4. Quick Filters
Create special �lters to sort data
5. Search
Search for or replace speci�c data
6. Windows
Change to other opened window views
92 Managing naturally occurring radioactive material (NORM) in mining and mineral processing
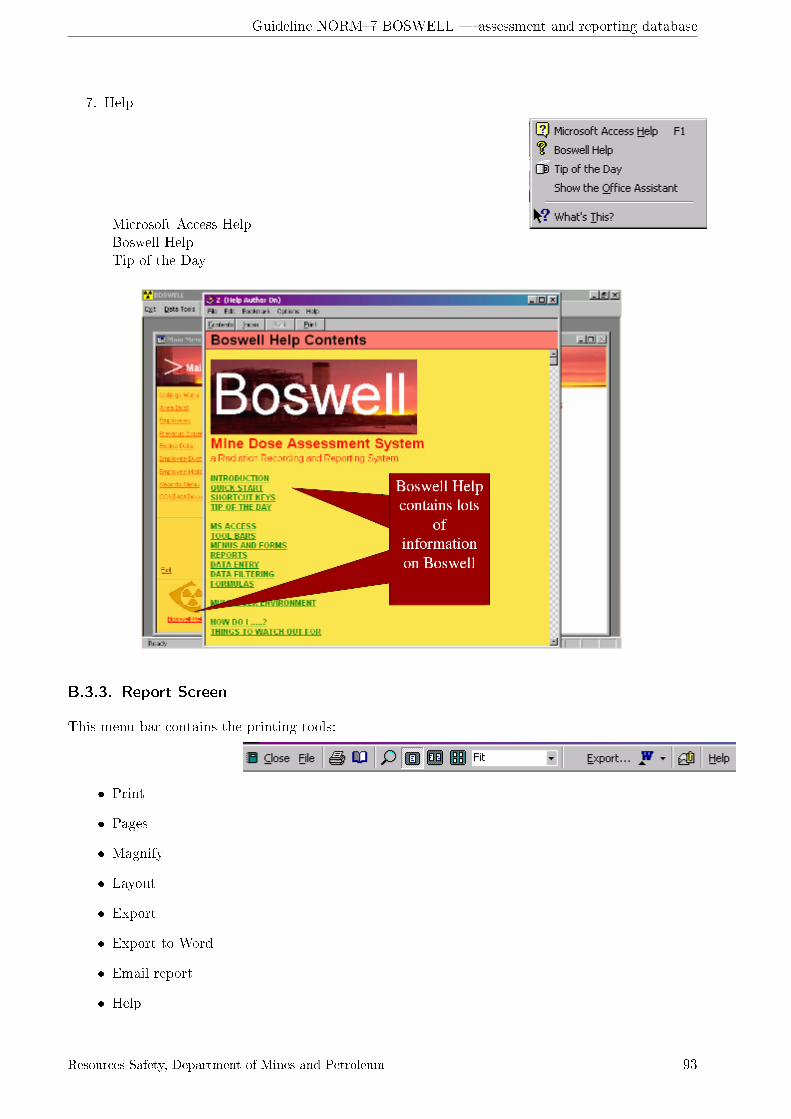
Guideline NORM�7 BOSWELL � assessment and reporting database
7. Help
Microsoft Access HelpBoswell HelpTip of the Day
B.3.3. Report Screen
This menu bar contains the printing tools:-
� Pages
� Magnify
� Layout
� Export
� Export to Word
� Email report
� Help
Resources Safety, Department of Mines and Petroleum 93

Guideline NORM�7 BOSWELL � assessment and reporting database
B.4. Useful Shortcut Keys (All versions of Access)
Note: Plus signs indicate `and', to press two keys together. You do not want to actually press the+ sign on your keyboard. For example, CTRL+P indicates to press the CTRL key and with it stillheld down, press the P.
B.4.1. Fields
CTRL+ ; � Insert today's date
CTRL+ : � Insert the current time
CTRL+ Enter � Insert a carriage return in a memo or text �eld
CTRL+ ' � Insert the data from the same �eld in the previous record
ESC � Undo the changes you have made to the current �eld
ESC ESC (press ESC twice) � Undo the changes you have made to the current record
CTRL+F � Find and replace
CTRL+C � Copy
CTRL+P � Paste
CTRL+Z � Undo
CTRL+S � Save
CTRL+P � Print
B.4.2. Help
F1- To display the O�ce Assistant and Microsoft Access Help
SHIFT+F1 � To display ScreenTips;
Find and Replace
CTRL+H � To open the Replace tab in the Find and Replace dialogue box
SHIFT+F4 � To �nd the next occurrence of the text speci�ed in the Find and Replace dialogue box
B.4.3. Window Operations
F11 or ALT+F1 � To bring the Database window to the front
CTRL+F6 � To cycle between open windows
ENTER � To restore the selected minimised window when all windows are minimised
CTRL+F8 � To turn on Re-size mode for the active window when its not maximised; press the arrowkeys to re-size the window
ALT+SPACEBAR � To display the Control menu
SHIFT+F10 � To display the shortcut menu
CTRL+W or CTRL+F4 � To close the active window
94 Managing naturally occurring radioactive material (NORM) in mining and mineral processing
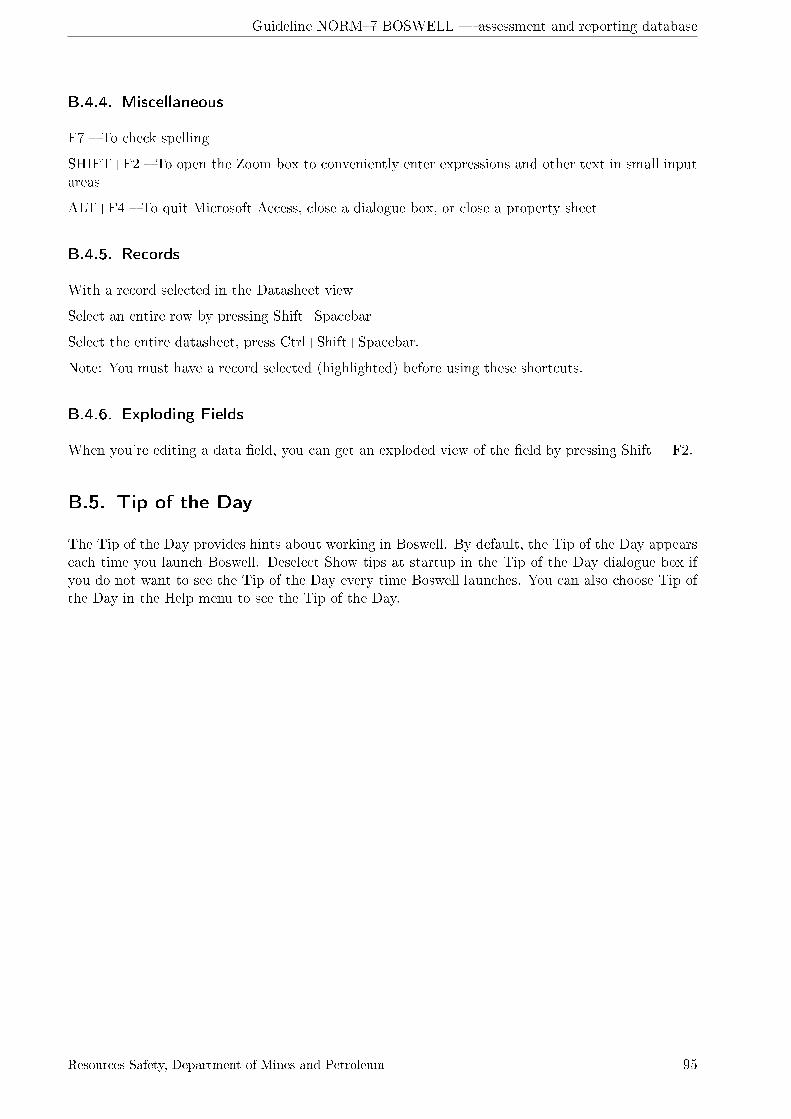
Guideline NORM�7 BOSWELL � assessment and reporting database
B.4.4. Miscellaneous
F7 � To check spelling
SHIFT+F2 � To open the Zoom box to conveniently enter expressions and other text in small inputareas
ALT+F4 � To quit Microsoft Access, close a dialogue box, or close a property sheet
B.4.5. Records
With a record selected in the Datasheet view
Select an entire row by pressing Shift+Spacebar
Select the entire datasheet, press Ctrl+Shift+Spacebar.
Note: You must have a record selected (highlighted) before using these shortcuts.
B.4.6. Exploding Fields
When you're editing a data �eld, you can get an exploded view of the �eld by pressing Shift + F2.
B.5. Tip of the Day
The Tip of the Day provides hints about working in Boswell. By default, the Tip of the Day appearseach time you launch Boswell. Deselect Show tips at startup in the Tip of the Day dialogue box ifyou do not want to see the Tip of the Day every time Boswell launches. You can also choose Tip ofthe Day in the Help menu to see the Tip of the Day.
Resources Safety, Department of Mines and Petroleum 95

Guideline NORM�7 BOSWELL � assessment and reporting database
B.6. Microsoft Access
B.6.1. Refreshing Links to boswellData.mdb
If the tables are not linked automatically for some reason, you must perform this operation manually.
There is a button on the Tool Bar that you canpress to run the Link Macro.
Possible Problem Sometimes you may need to refresh each table individually due to somethinggoing wrong with the process. There are twenty-one linked tables, so you need to patient and besure no tables are missed.
96 Managing naturally occurring radioactive material (NORM) in mining and mineral processing

Guideline NORM�7 BOSWELL � assessment and reporting database
B.6.2. Compacting the Database
From time to time, the `Backend' (Boswell data�le) will need to be compacted when the �legets very large, over 10 MB for example. Thisis due to deleted �les and the operations ofAccess taking up and wasting space. The �lecan be tidied and the size reduced.The `Frontend' (Boswell program �le) isautomatically compacted on closure.
A check of the backend �le size before and after will con�rm compaction has been accomplished.
Important!
Backup boswellData.mdb before proceeding with the backup facility in the Tools Menu.
B.6.3. Backup Facility
Boswell has inbuilt tools to compress or uncompress the boswellData.mdb �le using �Zip� for backuppurposes or for e-mailing the �le to DMP.
There is a choice for �Zipping� the �le or not. Usually, it is best to compress the �le to save storagespace.
The location for storing the �le is selected,
Resources Safety, Department of Mines and Petroleum 97

Guideline NORM�7 BOSWELL � assessment and reporting database
It is just a matter of following the prompts and the �le are named automatically using the date forversioning
and the �le is created in the location selected.
B.6.4. Known issues
B.6.4.1. Windows time format
Boswell stores the date and the time for the dust sampling pumps in date/time �elds. If yourWindows �time format� setting in Control Panel is di�erent from that shown below, it impossibleto enter the correct sampling time in Access. The date/time format cannot be remedied in Access,rather the settings must be changed in Windows.
98 Managing naturally occurring radioactive material (NORM) in mining and mineral processing

Guideline NORM�7 BOSWELL � assessment and reporting database
Resources Safety, Department of Mines and Petroleum 99

Guideline NORM�7 BOSWELL � assessment and reporting database
C. Appendix � DMP File Transfer Facility
C.1. How to use download.doir.wa.gov.au
C.1.1. Using a web browser outside the department
1. Using a web browser, browse to: https://download.doir.wa.gov.au/thinclient.
2.
At the login panel, user either an internal user account, or an external user account.
After login, the web client should be presented as below.
3. Using the navigation and upload/download buttons, users can transfer �les and out of theirMFT home folder. Note that users can only navigate downwards in the folder structure, intoshared folders and folders that they create � they cannot navigate upwards from their home
100 Managing naturally occurring radioactive material (NORM) in mining and mineral processing
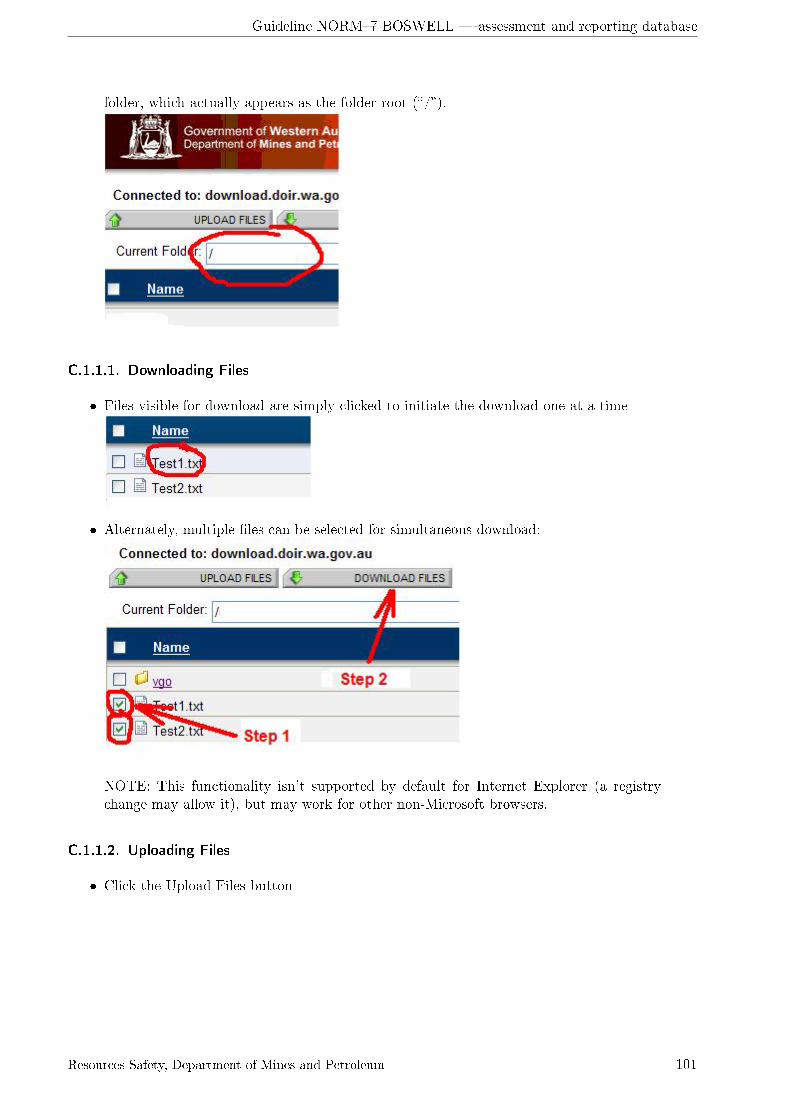
Guideline NORM�7 BOSWELL � assessment and reporting database
folder, which actually appears as the folder root (�/�).
C.1.1.1. Downloading Files
� Files visible for download are simply clicked to initiate the download one at a time
� Alternately, multiple �les can be selected for simultaneous download:
NOTE: This functionality isn't supported by default for Internet Explorer (a registrychange may allow it), but may work for other non-Microsoft browsers.
C.1.1.2. Uploading Files
� Click the Upload Files button
Resources Safety, Department of Mines and Petroleum 101
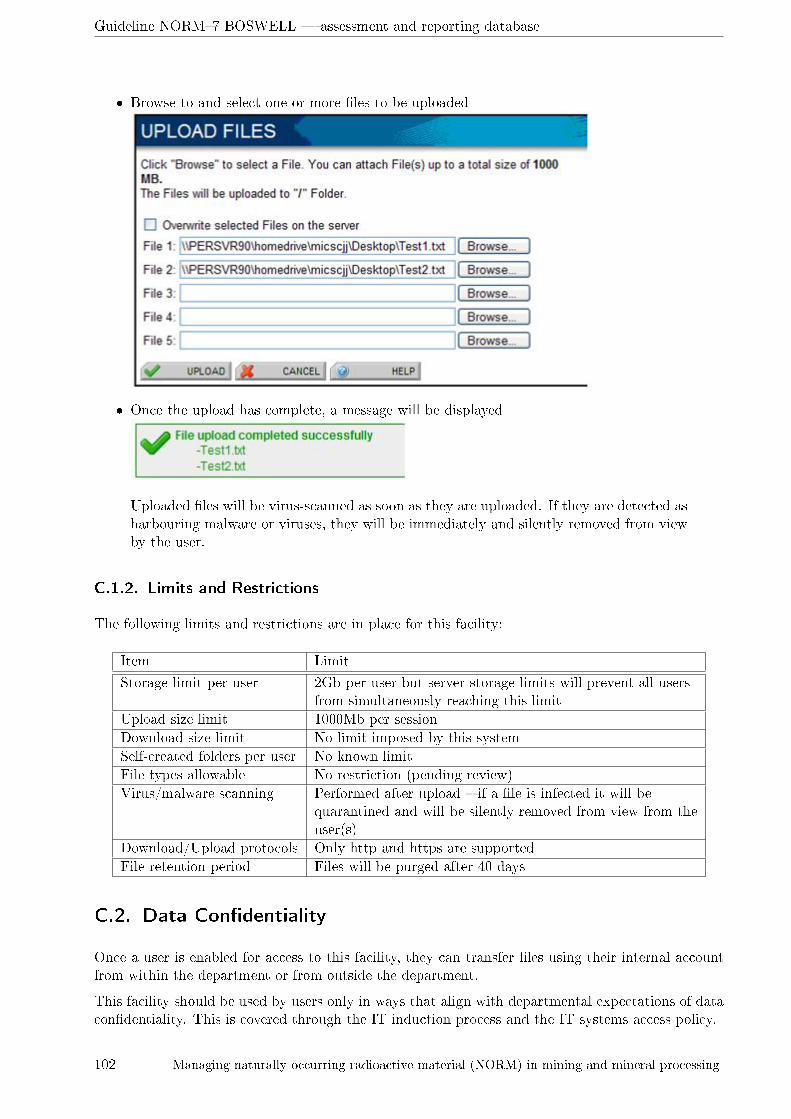
Guideline NORM�7 BOSWELL � assessment and reporting database
� Browse to and select one or more �les to be uploaded
� Once the upload has complete, a message will be displayed
Uploaded �les will be virus-scanned as soon as they are uploaded. If they are detected asharbouring malware or viruses, they will be immediately and silently removed from viewby the user.
C.1.2. Limits and Restrictions
The following limits and restrictions are in place for this facility:
Item Limit
Storage limit per user 2Gb per user but server storage limits will prevent all usersfrom simultaneously reaching this limit
Upload size limit 1000Mb per session
Download size limit No limit imposed by this system
Self-created folders per user No known limit
File types allowable No restriction (pending review)
Virus/malware scanning Performed after upload � if a �le is infected it will bequarantined and will be silently removed from view from theuser(s)
Download/Upload protocols Only http and https are supported
File retention period Files will be purged after 40 days
C.2. Data Con�dentiality
Once a user is enabled for access to this facility, they can transfer �les using their internal accountfrom within the department or from outside the department.
This facility should be used by users only in ways that align with departmental expectations of datacon�dentiality. This is covered through the IT induction process and the IT systems access policy.
102 Managing naturally occurring radioactive material (NORM) in mining and mineral processing

Guideline NORM�7 BOSWELL � assessment and reporting database
The availability of this facility does not remove the obligation on sta� to ensure that documentcon�dentiality is maintained.
C.3. How to setup a transfer facility between two users
By default, a user has access to their home folder only. To allow transfer of �les with another user,a shared folder must be established between them.
The transfer should be between an internal user and an external user � it would not be expected toestablish a transfer area for two external users or two internal users.
A shared folder appears as a sub-folder in each of the two users home folders
The process to establish a shared folder includes both Service Desk tasks and Systems Administratortasks and is outlined below:
Step Task Done by
1 Identify the internal user account (MIxxxyy) Service Desk
2 Identify the external user account (EXxxxx)This will likely be advised or identi�ed by the internal usersince they would be the expected instigator of thisrequirement
Service Desk
3 Create SR with the user details and assign to�_ADMINISTRATORS, SYSTEM�
Service Desk
4 Perform the procedure:Inframation → Applications → MFT → OperationalProcedures → Create Two-User Shared area
System Admin
5 Return the SR to �_DESK, SERVICE� advising the nameof the shared folder
System Admin
6 Advise the internal user that the facility is in place and thatthe shared folder will be visible in each of the two users'home folders when using the web client.The internal user would be expected to liaise with theexternal user accordingly on �les to transfer.
Service Desk
Note that the above con�guration will allow both the internal user and the external userto both have update access to the shared folder, although other variations are possible(e.g. internal user having update access and the external user having read-only access).
C.4. How to setup a transfer facility between groups of users
A common scenario would be to allow regular transfer of �les from an internal user or users, tomultiple external users.
The process to establish a shared folder includes both Service Desk tasks and Systems Administratortasks:
Step Task Done by
1 Identify the purpose or function of this folder andpropose a name for it, eg �VGO� (for �les to betransferred to the Valuer General's O�ce)Ensure that the name is appropriate for visibility toexternal clients
Service Desk
Resources Safety, Department of Mines and Petroleum 103

Guideline NORM�7 BOSWELL � assessment and reporting database
2 Identify the internal user accounts(MIxxxy1, MIxxxy2, etc)
Service Desk
3 Create a new File Share security group in UMCnamed in the format below:MFT_<name>Where <name> is the negotiated folder name abovee.g. MFT_VGOIf more complex requirements are identi�ed, such asthe external users being only able to download onlyand not upload, then multiple groups may beneeded. Create these as necessary using the specialrequirement as a su�x on the group name:e.g. MFT_VGO_DownloadPopulate these groups wiut
Service Desk
4 Identify the external user accounts(EXxxxx2, EXxxxx2, etc)These will likely be advised or identi�ed by aninternal user since they would be the expectedinstigator of this requirementAdd the external users to the appropriate securitygroup(s) created in the previous step.
Service Desk
5 Create SR with the group details and assign to�_ADMINISTRATORS, SYSTEM�
Service Desk
6 Perform the procedure:Inframation →Applications →MFT →OperationalProcedures →Create Group Shared area TBA
System Admin
7 Return the SR to �_DESK, SERVICE� advising thatthe group folder has been provisioned and secured.
System Admin
8 Advise the internal user that the facility is in placeand that the shared group folder will be visible ineach of the users' home folders when using the webclient.The internal user would be expected to liaise withthe external users accordingly on �les to transfer.
Service Desk
C.5. Application Programming Interfaces
The following programming interfaces are de�ned for the MFT for use by internally-developed ap-plications leveraging the MFT.
C.5.1. Email Noti�cation facility
Emails can be generated by placing a control �le into the download folder. A scheduled task willdetect the control �le and generate a noti�cation email accordingly.
The control �le has to be called notify.dat and contain content with the following format:
104 Managing naturally occurring radioactive material (NORM) in mining and mineral processing

Guideline NORM�7 BOSWELL � assessment and reporting database
[MFTEMAIL]
Subject = DMP Managed File Transfer.
Owners = [email protected]
Recipients = [email protected],[email protected]
From = [email protected]
Key = vgokey
Property Comment
Subject Will appear as the email's �subject�.
Owners Internal users who'll be emailed the same messages as therecipients and also any admin related messages. Commadelimited
Recipients External users who the email will be sent to. Commadelimited.
From Will appear in the email's �from� �eld.
Key E�ectively a password that will be used to provide somevery basic security to the process.
Any new folders set up will require a new �key� that will need to be requested from the system adminteam.
The detail for the email is a combination of:
� Information provided in notify.dat
� Information from the server based con�guration �le.
� A listing of the �les in the download folder.
Example. Extract from server based con�guration �le.
[BODY]
The following �les are now ready to be downloaded:
[FOOTER]
Managed File Transfer
Department of Mines & Petroleum/Department of State Development
100 Plain Street, East Perth, WA 6004
Sample email:
Resources Safety, Department of Mines and Petroleum 105

Guideline NORM�7 BOSWELL � assessment and reporting database
Bibliography
[1] Part 16 � Radiation Safety, Mines Safety & Inspection Regulations, 1995.
[2] Mines Safety & Inspection Act, 1994
[3] STROM, D.J.; Stansbury, P. S. Minimum detectable activity when background is counted longerthan the sample. Health Physics. 63:360-361, 1992.
[4] Grantham, David. Simpli�ed Monitoring Strategies. Australian Institute of Occupational Hygie-nists Inc, 2001.
106 Managing naturally occurring radioactive material (NORM) in mining and mineral processing
Index
Access, 2, 5Access 2000, 5Access 2003, 5Access 2007, 5Access XP, 5air sampler holder, 10air sampler pump, 10annual report, 8area (log)normal probability plot, 59area code, 12area dust, 19area frequency histograms, 55
backing up data, 91, 97Boswell help, 93Boswell user licence, 6boswellData.mdb, 6, 91, 97BoswellFrontend2000.mdb, 6BOSWELLHELP.HLP, 6BoswellImage.EMF, 6BoswellLogo.ico, 6
calibration, 12compacting data, 91, 97CONTAM, 5, 10, 12copyright notice, 6Cute PDF, 5
data rules, 8database �les, 3datatypes, 3DBase IV, 3designated employee, 15DMP, 3, 15, 91dose conversion factor, 10dust concentration, 39, 52dust monitoring, 5
EntityName, 8exposure badge, 5
FactorySunset.bmp, 6�elds, 3�ltering data, 92freezing columns, 92
IBM PC, 3Ivan Fetwadjie�, 3
listings menu, 89location code, 12
main screen, 90Microsoft DOS, 3Microsoft Windows, 2MIDAS, 3, 89MINEHEALTH, 15, 16monitored person, 8
QA report, 26quick data �lters, 92quick start, 89
rad/grav � statistics, 53radiation badge, 8, 16radiation calibration, 19radiation counter, 10, 12radiation history, 16Radiation Industry Group, 3radiation monitoring program, 12, 89radiation year, 8, 16refreshing data �le links, 96respiratory protection, 12
searching data, 92shortcut keys, 94software maintainer, 3
tables, 3Tip of the Day, 6, 93, 95toolbars, 90
unfreezing columns, 92Unzip32.dll, 6using Unzip, 91using Zip, 91
values, 3
work category, 10work history, 78
zip32.dll, 6
107