managing operating expenses non-interest income and income ... · pdf filenon-interest income...
TRANSCRIPT

Non-Interest Income
and Expense
Brian Smith-Vandergriff
CUNA CFO Council Conference
May 19, 2014
Managing Operating Expenses and Income Ratios

Objectives
• Review Current Environment
• Discuss Delinquencies and Charge-offs
• Explore ALLL Methodology Changes
• Outline Real World Management Strategies

Philosophical Arguments
• Negative ROAs are Not Evil, nor are they a Sustainable Business Strategy
• Non-Controllable Expenses are Real
• Fees are Not Inherently Bad, but they Should not be a Profit Center

Current Environment • Corporate Credit Unions
– Ongoing Assessments
– Recapitalization???
• NCUSIF Losses at Troubled Credit Unions
• Fees and Other Income Supplement NIM
• Delinquencies and Charge-offs “elevated”
• Audit & Examination Burdens are Excessive

Current Environment
• Credit CARD Act of 2009 – Overdraft Fees Require Opt-In – “Pay to Pay” Fees Abolished – Late Fees Capped ($25-$35) – Inactivity Fees Eliminated
• Troubled Debt Restructuring (TDR) – Introduced in FAS 15 (1977) – Recent Guidance - “Market” Rate Comparison – Application Requires Interpretation
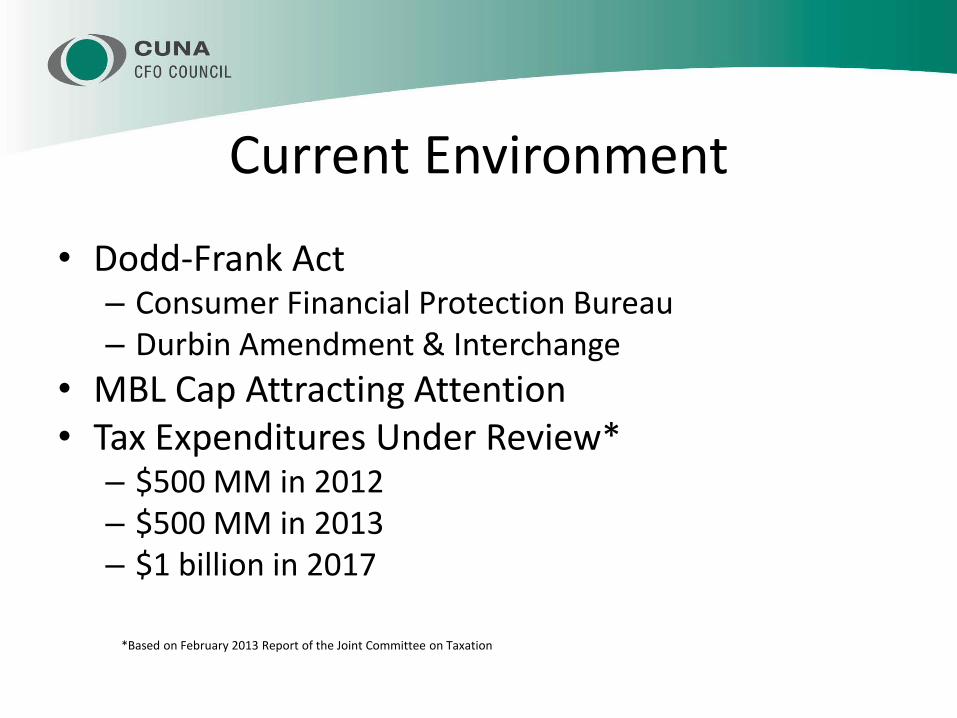
Current Environment
• Dodd-Frank Act – Consumer Financial Protection Bureau – Durbin Amendment & Interchange
• MBL Cap Attracting Attention • Tax Expenditures Under Review*
– $500 MM in 2012 – $500 MM in 2013 – $1 billion in 2017
*Based on February 2013 Report of the Joint Committee on Taxation

Asset Yields vs. Liability Costs
0.00%
2.00%
4.00%
6.00%
8.00%
10.00%
12.00%
19
89
19
90
19
91
19
92
19
93
19
94
19
95
19
96
19
97
19
98
19
99
20
00
20
01
20
02
20
03
20
04
20
05
20
06
20
07
20
08
20
09
20
10
20
11
20
12
20
13
Yield On Assets Liability Expense

Operating Surplus Contribution
0.00%
1.00%
2.00%
3.00%
4.00%
5.00%
6.00%
19
89
19
90
19
91
19
92
19
93
19
94
19
95
19
96
19
97
19
98
19
99
20
00
20
01
20
02
20
03
20
04
20
05
20
06
20
07
20
08
20
09
20
10
20
11
20
12
20
13
Net Interest Margin Non-Interest Income Operating Surplus (NIM + Fees)

Net Operating Spread
0.00%
1.00%
2.00%
3.00%
4.00%
5.00%
6.00%
19
89
19
90
19
91
19
92
19
93
19
94
19
95
19
96
19
97
19
98
19
99
20
00
20
01
20
02
20
03
20
04
20
05
20
06
20
07
20
08
20
09
20
10
20
11
20
12
20
13
Net Spread Operating Surplus (NIM + Fees) Operating Expenses

Loan Losses Impact Net Income
0.00%
0.20%
0.40%
0.60%
0.80%
1.00%
1.20%
1.40%
1.60%
1.80%
2.00%
19
89
19
90
19
91
19
92
19
93
19
94
19
95
19
96
19
97
19
98
19
99
20
00
20
01
20
02
20
03
20
04
20
05
20
06
20
07
20
08
20
09
20
10
20
11
20
12
20
13
Net Income Loan Loss Provision Net Spread
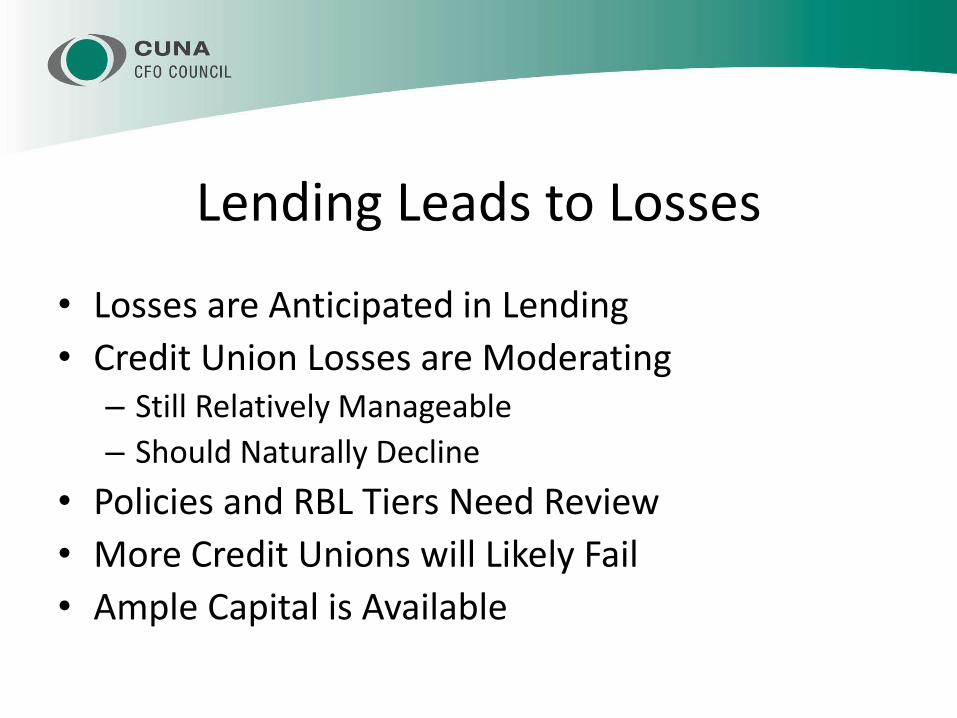
Lending Leads to Losses
• Losses are Anticipated in Lending
• Credit Union Losses are Moderating – Still Relatively Manageable
– Should Naturally Decline
• Policies and RBL Tiers Need Review
• More Credit Unions will Likely Fail
• Ample Capital is Available

“Easy” Expense Reductions • Conference and Travel
• Staff and Board Training
• Marketing
• Salary Adjustments
• Mergers (Economies of Scale)
• Layoffs
POTENTIALLY ERODING THE LONG TERM VALUE OF THE CREDIT UNION FOR SHORT TERM GAINS

Other Despicable Habits
• “Peer” Comparisons Driving Decisions
• Cutting Member Services
• Adopting “Delay and Pray” Accounting
• Death by a Thousand Fees

Broad Real World Responses
• CEO Solicited Input from All Stakeholders
• Metrics and Timeframes Defined Success
• Capital Plans Were Adjusted
• Mortgages Were Originated and Sold
• Realistic Budgets Projected Losses
• 1% ROA Target Removed from CAMEL

Specific Real World Responses
• Credit Union “A” – Started Providing Fee Services to CUs (2009) – Data Processing Cost Tied to Assets (2011)
• Credit Union “B” – Closed 2 Branches (2008) – Transferred 2 Branches to Another CU (2008) – Consolidated Headquarters (2009) – Revised Board Dashboard (2009,2013) – Renegotiated Major Contracts (2011)

Allowance Project
• In Early 2009, Regulators and Auditors Became Fixated on Credit Losses
• Battles Ensued – 3-year vs. 1-year Rolling Historical Averages – Projecting Losses for Underwater Collateral
• Designed New Model and Metrics – Capital at Risk (# of Average Loans) – Time to Capital Depletion – Multiplier to Shock Estimates

The Model We Developed CU Industry as of 12/31/13
Loss Multiplier 1
0.50%
0.80% Target Net Worth Equity Dollars Losses Required # of Average Loans % of Loans
10% 101,032,807,147.32$ 10,155,322,338.68$ 786,962 1.57%
645,222,781,460$ 9% 90,413,348,207.42$ 20,774,781,278.58$ 1,609,892 3.22%
8% 79,793,889,267.52$ 31,394,240,218.48$ 2,432,822 4.87%
50,000,000 7% 69,174,430,327.62$ 42,013,699,158.38$ 3,255,751 6.51%
6% 58,554,971,387.72$ 52,633,158,098.28$ 4,078,681 8.16%
12,904.46$ 5% 47,935,512,447.82$ 63,252,617,038.18$ 4,901,611 9.80%
4% 37,316,053,507.92$ 73,872,075,978.08$ 5,724,540 11.45%
5,161,782,252$ 3% 26,696,594,568.02$ 84,491,534,917.98$ 6,547,470 13.09%
2% 16,077,135,628.12$ 95,110,993,857.88$ 7,370,400 14.74%
111,188,129,486$ 1% 5,457,676,688.22$ 105,730,452,797.78$ 8,193,329 16.39%
0% (5,161,782,251.68)$ 116,349,911,737.68$ 9,016,259 18.03%
10.47%
Net Worth at End of Year Adjusted Net Worth Ratio
1,061,945,893,990$ 1 9.97%
2 9.47%
3 8.97%
4 8.47%
5 7.97%
6 7.47%
7 6.97%
8 6.47%
9 5.97%
10 5.47%
Total Assets
Average Loan Balance
Estimated Net Worth
Most Recent Monthly ALLL
Rolling ALLL
Loan Balance
Estimated Losses
Total Equity
Number of Loans

Shocked Losses
Loss Multiplier 3
0.50%
0.80% Target Net Worth Equity Dollars Losses Required # of Average Loans % of Loans
10% 90,709,242,643.96$ 20,478,886,842.04$ 1,586,962 3.17%
645,222,781,460$ 9% 80,089,783,704.06$ 31,098,345,781.94$ 2,409,892 4.82%
8% 69,470,324,764.16$ 41,717,804,721.84$ 3,232,822 6.47%
50,000,000 7% 58,850,865,824.26$ 52,337,263,661.74$ 4,055,751 8.11%
6% 48,231,406,884.36$ 62,956,722,601.64$ 4,878,681 9.76%
12,904.46$ 5% 37,611,947,944.46$ 73,576,181,541.54$ 5,701,611 11.40%
4% 26,992,489,004.56$ 84,195,640,481.44$ 6,524,540 13.05%
15,485,346,755$ 3% 16,373,030,064.66$ 94,815,099,421.34$ 7,347,470 14.69%
2% 5,753,571,124.76$ 105,434,558,361.24$ 8,170,400 16.34%
111,188,129,486$ 1% (4,865,887,815.14)$ 116,054,017,301.14$ 8,993,329 17.99%
0% (15,485,346,755.04)$ 126,673,476,241.04$ 9,816,259 19.63%
10.47%
Net Worth at End of Year Adjusted Net Worth Ratio
1,061,945,893,990$ 1 8.97%
2 7.47%
3 5.97%
4 4.47%
5 2.97%
6 1.47%
7 -0.03%
8 -1.53%
9 -3.03%
10 -4.53%
Total Assets
Average Loan Balance
Estimated Net Worth
Most Recent Monthly ALLL
Rolling ALLL
Loan Balance
Estimated Losses
Total Equity
Number of Loans

Strategic Planning
Loss Multiplier 0.50
0.50%
0.80% Target Net Worth Equity Dollars Losses Required # of Average Loans % of Loans
10% 103,613,698,273.16$ 7,574,431,212.84$ 586,962 1.17%
645,222,781,460$ 9% 92,994,239,333.26$ 18,193,890,152.74$ 1,409,892 2.82%
8% 82,374,780,393.36$ 28,813,349,092.64$ 2,232,822 4.47%
50,000,000 7% 71,755,321,453.46$ 39,432,808,032.54$ 3,055,751 6.11%
6% 61,135,862,513.56$ 50,052,266,972.44$ 3,878,681 7.76%
12,904.46$ 5% 50,516,403,573.66$ 60,671,725,912.34$ 4,701,611 9.40%
4% 39,896,944,633.76$ 71,291,184,852.24$ 5,524,540 11.05%
2,580,891,126$ 3% 29,277,485,693.86$ 81,910,643,792.14$ 6,347,470 12.69%
2% 18,658,026,753.96$ 92,530,102,732.04$ 7,170,400 14.34%
111,188,129,486$ 1% 8,038,567,814.06$ 103,149,561,671.94$ 7,993,329 15.99%
0% (2,580,891,125.84)$ 113,769,020,611.84$ 8,816,259 17.63%
10.47%
Net Worth at End of Year Adjusted Net Worth Ratio
1,061,945,893,990$ 1 10.22%
2 9.97%
3 9.72%
4 9.47%
5 9.22%
6 8.97%
7 8.72%
8 8.47%
9 8.22%
10 7.97%
Total Assets
Average Loan Balance
Estimated Net Worth
Most Recent Monthly ALLL
Rolling ALLL
Loan Balance
Estimated Losses
Total Equity
Number of Loans

Summary • Past Decisions Led Us Here
– “Bad” Loans to Members and Businesses
– Inappropriate Investments by Corporate CUs
– Lax Regulatory Oversight
• Industry Risk Management Overhaul – Concentration Risk
– RBNW Proposal

Summary • Fees Should be Reviewed
• Focus on Non-Interest Expenses
• Revisit Strategy
– Number of Branches
– Staff Size
• Study Utilization of Member Services

For More Information
Brian Smith-Vandergriff
Senior Managing Director
CNBS, LLC
Toll free: 800-222-0978 Direct: 913-402-2615
Email: [email protected]